Unwavering Focus on Sustainable Value Creation reports/2018/ocbc_ar2018_english.pdf ·...
312
Annual Report 2018 Unwavering Focus on Sustainable Value Creation Supported by future-smart talent development and digital transformation
Transcript of Unwavering Focus on Sustainable Value Creation reports/2018/ocbc_ar2018_english.pdf ·...
Oversea-C
hinese Banking Co
rpo
ration Limited A
nnual Repo
rt 2018
Annual Report 2018
Unwavering Focus on Sustainable Value Creation Supported by future-smart talent development and digital transformation

Contents Our Purpose We help individuals and businesses across communities achieve their aspirations by providing innovative financial services that meet their needs.
Our Values Customers We listen to our customers and understand their needs. We build enduring relationships with them by delivering superior products and quality service.
People We treat each other fairly and with respect. We support our colleagues and invest in their development to help them realise their full potential. We recognise and reward outstanding performance.
Teamwork We, as team members, actively support each other across the organisation as we work towards our common purpose. As individuals, we expect total responsibility from ourselves.
Integrity Fair dealing is the basis of our business. We assume everything we do is in full public view.
Prudent Risk Taking We are prudent risk takers because our customers rely on us for safety and soundness.
Effectiveness We actively invest in infrastructure, process improvement and skills to lower our delivery costs. We do the right things right the first time, on time, every time.
Our Purpose & Our Values Inside Front Cover
OCBC’s Brand Promise – Simply Spot On 1
Group Overview Message from Chairman and CEO 4Financial Highlights 14Our Well-Diversified Business 16Capturing Growth in China’s Greater Bay Area 18 Redefining Customer Engagement through Digital Transformation 20Board of Directors 24Management Committee 28
Our Year in ReviewAn Unwavering Focus on Sustainable Value Creation 30 With our Individual Customers Every Step along their Life Journeys 32Supporting Businesses through Every Milestone 36Developing Future-Smart Talent 40 Creating Investor Value 42Caring for our Community and the Environment 44Strengthening Community Ties through Cycling Fiestas 50
Sustainability Report 2018 Creating Sustainable Value and Inspiring a Better Future 52
Governance Corporate Governance 82 Additional Information Required under the SGX-ST Listing Manual 100Capital Management 101 Risk Management 103 Pillar 3 Disclosures 114
Financials Financial Report 119 Management Discussion and Analysis Financial Statements Group’s Major Properties Shareholding Statistics 284 Five-Year Ordinary Share Capital History 286
Additional Information GRI Standards Content Index 287Further Information on Management Committee 292International Network 296Financial Calendar 298Notice of Annual General Meeting 299Proxy Form 307
Corporate Profile and Corporate Information Inside Back Cover
On front cover 1. OCBC Centre 2. Great Eastern Centre 3. Bank of Singapore Centre 4. OCBC Centre East
3
4
2
1
OCBC’s Brand Promise — To be Simply Spot On for our customers
On 29 October 2018, we launched our Brand Promise to be Simply Spot On for our customers.
The Brand Promise – Simply Spot On – is not a marketing campaign or an advertising tagline. It is a pledge to
our customers that we make it a point to truly understand their needs and to come up with the best solutions for them
through every stage of their lives.
Being Simply Spot On is the focus of our entire organisation and is a cornerstone in our unwavering focus on long-term,
sustainable value creation for all our stakeholders.
The smaller circle of the Brand Promise icon means that everything we do – even the smallest thing – is important
in delivering the Simply Spot On experience to our customers. By getting everything right, it will all come together to form
the bigger circle which represents OCBC and what customers expect of us.

Our Brand Promise Campaign in Numbers
“The Brand Promise tagline is easy to remember, but not easy to live up to. It is simple and clear in what we are promising
our customers, but it also means that we have set ourselves a very high bar to meet. And that is why everyone at OCBC is committed to
living the Brand Promise every day so that we can deliver the Simply Spot On experience to our customers consistently.”
Mr Samuel Tsien Group Chief Executive Officer
More than
15m views of our Simply Spot On campaign online within the first six weeks of the campaign launch
Enhanced the perception of OCBC for
76% of those who saw the Simply Spot On campaign
200 customer touchpoints identified across the Bank to assess our readiness to live up to the Brand Promise
8,000 tumblers given to staff to encourage #noplastics use, in line with our efforts to be Simply Spot On for the environment
16 taglines tested, with Simply Spot On coming out tops by a wide margin
Tapped into the subconscious minds of
2,400 research participants to assess our taglines in an implicit association test

Be Reliable Be Smart and Knowledgeable
Take a Long-Term View
Act in customers’ best interests
Execute well and on time
Listen to what customers want
Anticipate needs
Develop right solutions and deliver right advice
No misleading, no misguiding, no misselling
Protect customers’ interests
Support customers’ growth journeys
Value total relationship
• Be a partner that customers can always rely on to protect their interests
• Take ownership and accountability, and actively support each other to help customers
• Do what we promise fully and on time – small things matter too
• Provide the best solution to solve customers’ problems; if not, offer alternatives
• Listen to customers, understand and anticipate their needs
• Provide appropriate advisory and solutions meeting customers’ needs
• Develop processes and invest in infrastructure and training to equip employees with relevant knowledge
• Provide easy-to-use tools and processes to help our customers consider, buy and use our products and services
• Be fair and transparent in our dealings with customers
• Build customer relationships that last – through their life stages and business growth cycles
• When tough business calls have to be made, be empathetic in execution and customer communications
From left
Mr Samuel N. Tsien Group Chief Executive Officer
Mr Ooi Sang Kuang Chairman
4 OCBC Annual Report 2018
Message from Chairman and CEO
Dear Shareholders
OCBC is committed to creating sustainable value for all its stakeholders. In 2018, we continued to deepen and broaden our relationships with our stakeholders. For our customers, we expanded our suite of services to help them advance their goals. We strengthened our digital capabilities and created integrated digital ecosystems to offer customers a seamless banking experience and a broader range of innovative solutions. OCBC also elevated its stewardship in driving sustainable and socially responsible business practices, and stepped up our investments to upskill our talented workforce. The successful execution of our corporate strategy, effective employment of our capital and people, together with the proactive engagement with all stakeholders, contributed to strong business growth and high customer satisfaction scores, and delivered record earnings in 2018.
Performance Review
The strong global growth momentum and upbeat market conditions in the early part of 2018 were not sustained into the year. As the year progressed, market sentiments turned bearish and economic expansion moderated. The global economy was weighed down by the escalating trade dispute between the United States and China, the moderation of growth in the major economies, the uncertainties of Brexit and the political jitters in Europe. These developments, together with tighter monetary conditions as the U.S. Federal Reserve raised interest rates, undermined consumer confidence and negatively impacted business activity which led to
a slowdown of international trade, cross-border real investments and capital flows during the year. The confluence of these factors contributed to sharp declines in major international stock indices and heightened risks for financial markets globally.
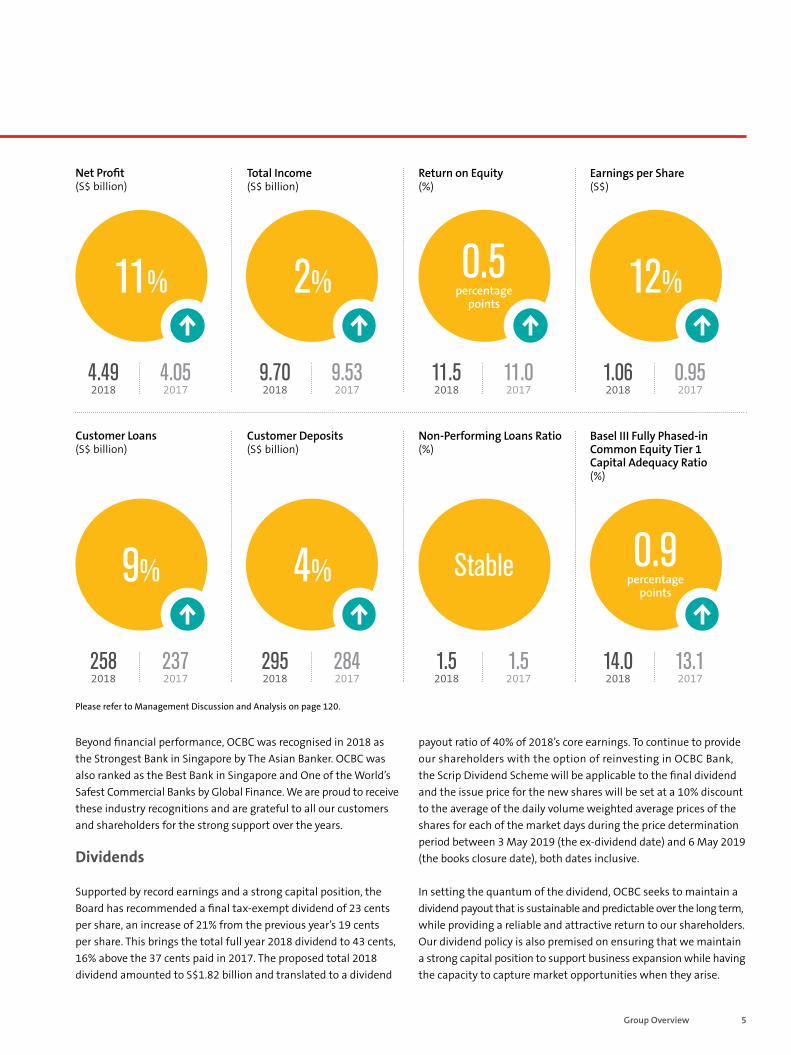
As the year progressed, we elevated our vigilance and continued to invest in our established franchise and seek new opportunities for growth. We enhanced our risk management processes, including stress testing our portfolios, closely monitoring weak credits and strengthening our cyber resilience capabilities by adopting a “defence-in-depth” approach. The prudent management of our businesses in our key markets has underpinned the soundness and sustainability of our diversified strategy, and we are pleased to report that OCBC ended the year with a record net profit of S$4.49 billion, a commendable 11% increase from S$4.05 billion a year ago. We further strengthened our capital position and stayed firmly focused on OCBC’s corporate strategy of developing and investing in our core banking, wealth management and insurance franchise across Asia. We lifted our return on equity to 11.5% in 2018 from 11.0% a year ago, and strengthened our Common Equity Tier 1 capital adequacy ratio to 14.0% from 13.1% a year ago. Our results demonstrated the resilience and strength of our diversified business franchise, disciplined cost control, prudent risk management practices and upskilling of our human talent. Our balance sheet strength is also reflected in our credit ratings, which are among the highest in the world at AA-/Aa1/AA- as rated by S&P, Moody’s and Fitch respectively.
5Group Overview
11% 2% 0.5 percentage
points 12%
9% 4% 0.9 percentage
points
Stable
Please refer to Management Discussion and Analysis on page 120.
Net Profit (S$ billion)
Total Income (S$ billion)
Return on Equity (%)
Earnings per Share (S$)
Customer Loans (S$ billion)
Customer Deposits (S$ billion)
Non-Performing Loans Ratio (%)
Basel III Fully Phased-in Common Equity Tier 1 Capital Adequacy Ratio (%)
4.49 2018
4.05 2017
9.70 2018
9.53 2017
11.5 2018
11.0 2017
1.06 2018
0.952017
258 2018
237 2017
295 2018
284 2017
1.5 2018
1.5 2017
14.0 2018
13.1 2017
Beyond financial performance, OCBC was recognised in 2018 as the Strongest Bank in Singapore by The Asian Banker. OCBC was also ranked as the Best Bank in Singapore and One of the World’s Safest Commercial Banks by Global Finance. We are proud to receive these industry recognitions and are grateful to all our customers and shareholders for the strong support over the years.
Dividends
Supported by record earnings and a strong capital position, the Board has recommended a final tax-exempt dividend of 23 cents per share, an increase of 21% from the previous year’s 19 cents per share. This brings the total full year 2018 dividend to 43 cents, 16% above the 37 cents paid in 2017. The proposed total 2018 dividend amounted to S$1.82 billion and translated to a dividend
payout ratio of 40% of 2018’s core earnings. To continue to provide our shareholders with the option of reinvesting in OCBC Bank, the Scrip Dividend Scheme will be applicable to the final dividend and the issue price for the new shares will be set at a 10% discount to the average of the daily volume weighted average prices of the shares for each of the market days during the price determination period between 3 May 2019 (the ex-dividend date) and 6 May 2019 (the books closure date), both dates inclusive.
In setting the quantum of the dividend, OCBC seeks to maintain a dividend payout that is sustainable and predictable over the long term, while providing a reliable and attractive return to our shareholders. Our dividend policy is also premised on ensuring that we maintain a strong capital position to support business expansion while having the capacity to capture market opportunities when they arise.
6 OCBC Annual Report 2018
Message from Chairman and CEO
Commitment to Integrity and Honesty
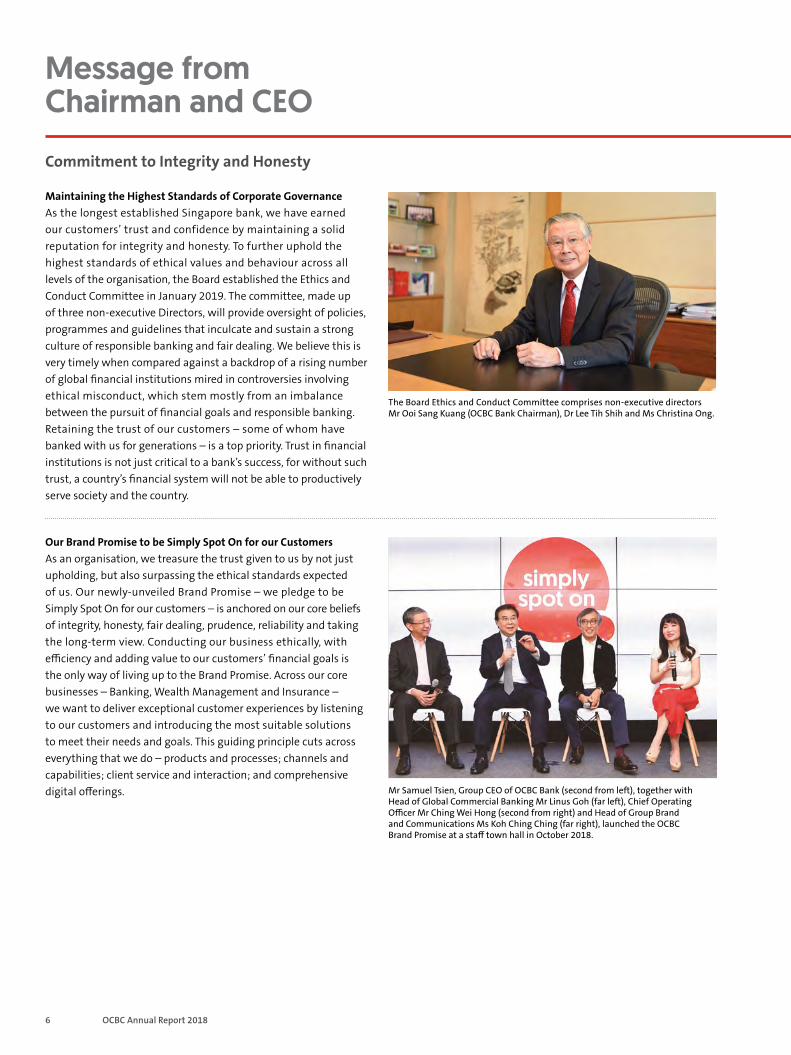
Maintaining the Highest Standards of Corporate Governance As the longest established Singapore bank, we have earned our customers’ trust and confidence by maintaining a solid reputation for integrity and honesty. To further uphold the highest standards of ethical values and behaviour across all levels of the organisation, the Board established the Ethics and Conduct Committee in January 2019. The committee, made up of three non-executive Directors, will provide oversight of policies, programmes and guidelines that inculcate and sustain a strong culture of responsible banking and fair dealing. We believe this is very timely when compared against a backdrop of a rising number of global financial institutions mired in controversies involving ethical misconduct, which stem mostly from an imbalance between the pursuit of financial goals and responsible banking. Retaining the trust of our customers – some of whom have banked with us for generations – is a top priority. Trust in financial institutions is not just critical to a bank’s success, for without such trust, a country’s financial system will not be able to productively serve society and the country.
Our Brand Promise to be Simply Spot On for our Customers As an organisation, we treasure the trust given to us by not just upholding, but also surpassing the ethical standards expected of us. Our newly-unveiled Brand Promise – we pledge to be Simply Spot On for our customers – is anchored on our core beliefs of integrity, honesty, fair dealing, prudence, reliability and taking the long-term view. Conducting our business ethically, with efficiency and adding value to our customers’ financial goals is the only way of living up to the Brand Promise. Across our core businesses – Banking, Wealth Management and Insurance – we want to deliver exceptional customer experiences by listening to our customers and introducing the most suitable solutions to meet their needs and goals. This guiding principle cuts across everything that we do – products and processes; channels and capabilities; client service and interaction; and comprehensive digital offerings.
The Board Ethics and Conduct Committee comprises non-executive directors Mr Ooi Sang Kuang (OCBC Bank Chairman), Dr Lee Tih Shih and Ms Christina Ong.
Mr Samuel Tsien, Group CEO of OCBC Bank (second from left), together with Head of Global Commercial Banking Mr Linus Goh (far left), Chief Operating Officer Mr Ching Wei Hong (second from right) and Head of Group Brand and Communications Ms Koh Ching Ching (far right), launched the OCBC Brand Promise at a staff town hall in October 2018.
7Group Overview
Redefining our Business through Digital Transformation
It is our privilege to serve more than 9 million customers across the OCBC Group. We achieve consistently high levels of customer satisfaction and continue to build deeper relationships as customer needs and preferences evolve. Central to this is how we as an organisation have embraced digitalisation while reinforcing our core values – we have comprehensively redefined customer engagement, transformed the way we conduct business, delivered cost efficiencies and achieved our transformation goals through the deployment of internal resources and expanded collaboration with our digital ecosystem partners: API partners, fintechs and e-commerce platforms.
Please refer to Redefining Customer Engagement through Digital Transformation on page 20.
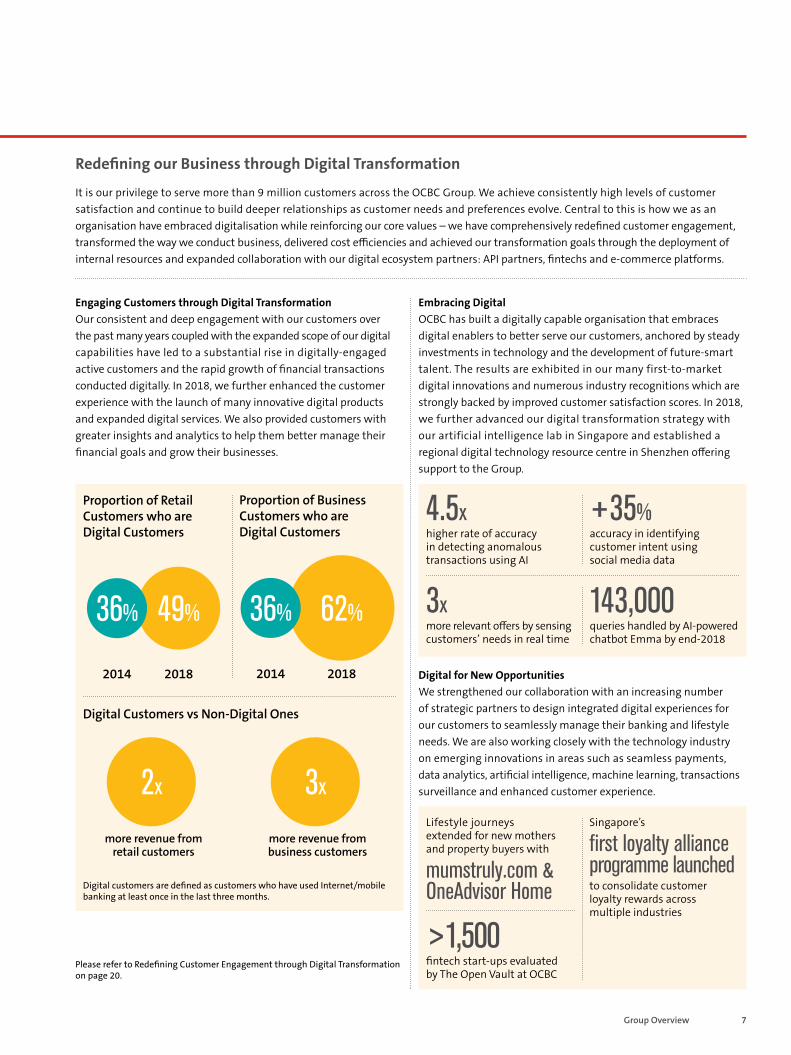
Engaging Customers through Digital Transformation Our consistent and deep engagement with our customers over the past many years coupled with the expanded scope of our digital capabilities have led to a substantial rise in digitally-engaged active customers and the rapid growth of financial transactions conducted digitally. In 2018, we further enhanced the customer experience with the launch of many innovative digital products and expanded digital services. We also provided customers with greater insights and analytics to help them better manage their financial goals and grow their businesses.
Digital customers are defined as customers who have used Internet/mobile banking at least once in the last three months.
Embracing Digital OCBC has built a digitally capable organisation that embraces digital enablers to better serve our customers, anchored by steady investments in technology and the development of future-smart talent. The results are exhibited in our many first-to-market digital innovations and numerous industry recognitions which are strongly backed by improved customer satisfaction scores. In 2018, we further advanced our digital transformation strategy with our artificial intelligence lab in Singapore and established a regional digital technology resource centre in Shenzhen offering support to the Group.
4.5x higher rate of accuracy in detecting anomalous transactions using AI
+35% accuracy in identifying customer intent using social media data
Digital for New Opportunities We strengthened our collaboration with an increasing number of strategic partners to design integrated digital experiences for our customers to seamlessly manage their banking and lifestyle needs. We are also working closely with the technology industry on emerging innovations in areas such as seamless payments, data analytics, artificial intelligence, machine learning, transactions surveillance and enhanced customer experience.
3x more relevant offers by sensing customers’ needs in real time
143,000 queries handled by AI-powered chatbot Emma by end-2018
Singapore’s
first loyalty alliance programme launched to consolidate customer loyalty rewards across multiple industries
>1,500 fintech start-ups evaluated by The Open Vault at OCBC
Lifestyle journeys extended for new mothers and property buyers with
mumstruly.com & OneAdvisor Home
Proportion of Business Customers who are Digital Customers
2014 2018
62% 36%
Proportion of Retail Customers who are Digital Customers
20182014
36% 49%
2x
more revenue from retail customers
3x
more revenue from business customers
Digital Customers vs Non-Digital Ones
8 OCBC Annual Report 2018
Message from Chairman and CEO
Business Growth and Developments
Supporting our Customers with our Strong Interconnected Network
Please refer to Our Well-Diversified Business on page 16.
Please refer to With Our Individual Customers Every Step along their Life Journeys on page 32.
We derive strong synergies from the Group’s closely interconnected network, and are well-placed to connect our customers to opportunities within the Asian region and globally. In Greater China, we deepened our presence in and made further inroads into the Greater Bay Area (GBA). With a strong presence in Hong Kong, Macau and in five of the nine cities in the Pearl River Delta that make up the GBA, we are well-placed to capture the trade, capital and investment flows between the GBA and Southeast Asia. In Indonesia, the Group is set to expand its insurance footprint following Great Eastern Holdings’ announcement to acquire general insurance provider
PT QBE General Insurance Indonesia. In our pursuit of broadening the growth of our base in wealth management, we opened new OCBC Premier Banking centres in Malaysia, while Bank of Singapore established a regional Ultra-High Net Worth (UHNW) Advisory Solutions Platform to provide highly sophisticated, bespoke analysis and investment advice to UHNW clients. Bank of Singapore also opened a wealth management subsidiary in Luxembourg – a first for a Singapore private bank. Our Luxembourg presence will allow us to better support our wealth management customers in Europe, particularly against the uncertainties associated with Brexit.
Serving
8 in 10 families in Singapore with a Child Development Account
1 in 2 seniors aged 55 and above in Singapore bank with OCBC
Excellence in Customer Centricity Retail Banker International Asia Trail Blazer Awards
Highest number of winners across the financial industry for four consecutive years The Association of Banks in Singapore (ABS) Excellent Service Awards
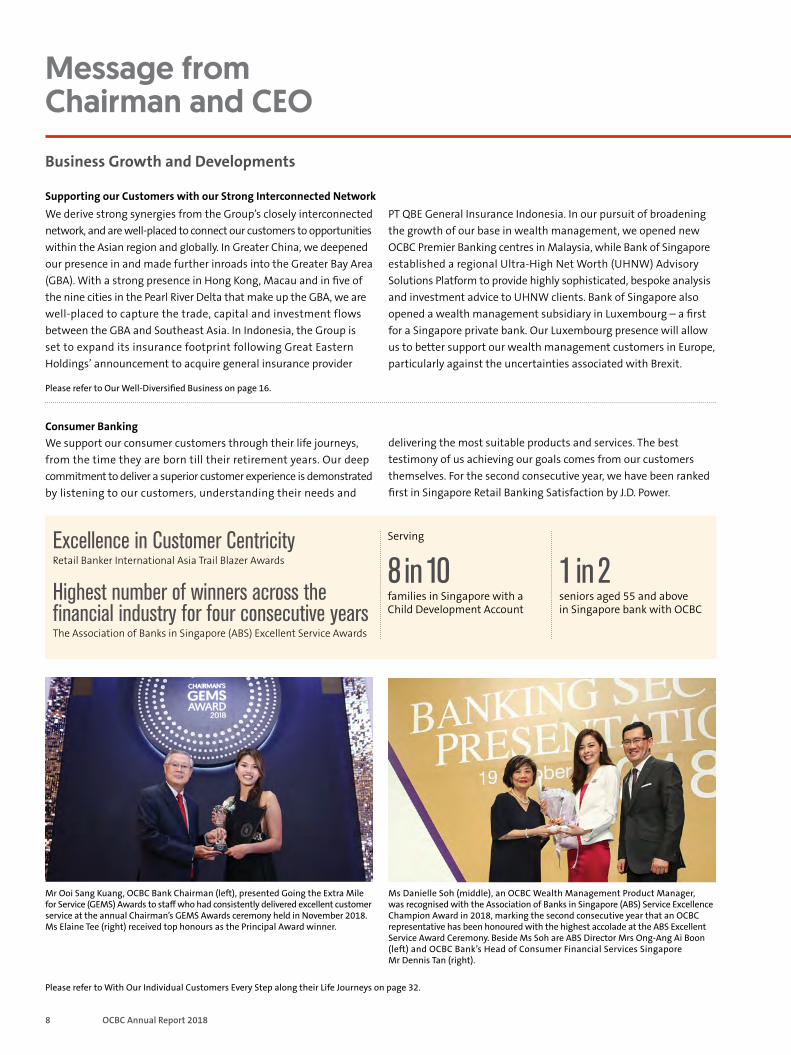
Mr Ooi Sang Kuang, OCBC Bank Chairman (left), presented Going the Extra Mile for Service (GEMS) Awards to staff who had consistently delivered excellent customer service at the annual Chairman’s GEMS Awards ceremony held in November 2018. Ms Elaine Tee (right) received top honours as the Principal Award winner.
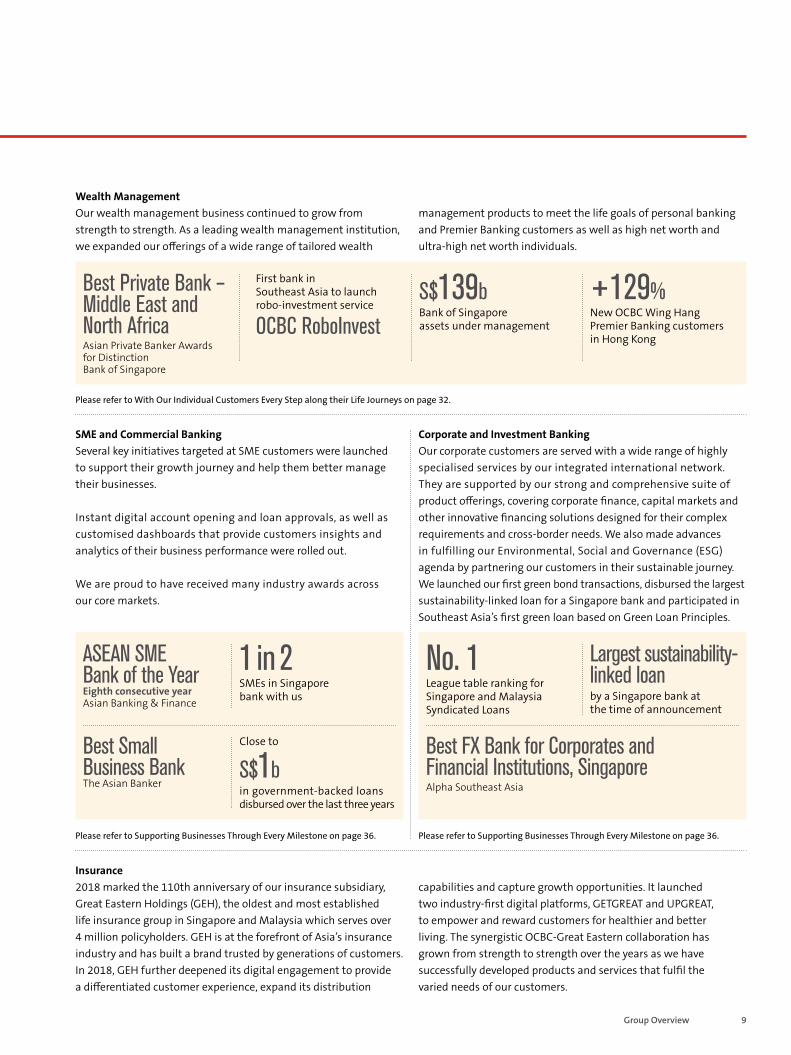
Ms Danielle Soh (middle), an OCBC Wealth Management Product Manager, was recognised with the Association of Banks in Singapore (ABS) Service Excellence Champion Award in 2018, marking the second consecutive year that an OCBC representative has been honoured with the highest accolade at the ABS Excellent Service Award Ceremony. Beside Ms Soh are ABS Director Mrs Ong-Ang Ai Boon (left) and OCBC Bank’s Head of Consumer Financial Services Singapore Mr Dennis Tan (right).
Consumer Banking We support our consumer customers through their life journeys, from the time they are born till their retirement years. Our deep commitment to deliver a superior customer experience is demonstrated by listening to our customers, understanding their needs and
delivering the most suitable products and services. The best testimony of us achieving our goals comes from our customers themselves. For the second consecutive year, we have been ranked first in Singapore Retail Banking Satisfaction by J.D. Power.
9Group Overview
Wealth Management Our wealth management business continued to grow from strength to strength. As a leading wealth management institution, we expanded our offerings of a wide range of tailored wealth
First bank in Southeast Asia to launch robo-investment service
OCBC RoboInvest
Best Private Bank – Middle East and North Africa Asian Private Banker Awards for Distinction Bank of Singapore
S$139b Bank of Singapore assets under management
+129% New OCBC Wing Hang Premier Banking customers in Hong Kong
management products to meet the life goals of personal banking and Premier Banking customers as well as high net worth and ultra-high net worth individuals.
SME and Commercial Banking Several key initiatives targeted at SME customers were launched to support their growth journey and help them better manage their businesses.
Instant digital account opening and loan approvals, as well as customised dashboards that provide customers insights and analytics of their business performance were rolled out.
We are proud to have received many industry awards across our core markets.
Please refer to With Our Individual Customers Every Step along their Life Journeys on page 32.
Corporate and Investment Banking Our corporate customers are served with a wide range of highly specialised services by our integrated international network. They are supported by our strong and comprehensive suite of product offerings, covering corporate finance, capital markets and other innovative financing solutions designed for their complex requirements and cross-border needs. We also made advances in fulfilling our Environmental, Social and Governance (ESG) agenda by partnering our customers in their sustainable journey. We launched our first green bond transactions, disbursed the largest sustainability-linked loan for a Singapore bank and participated in Southeast Asia’s first green loan based on Green Loan Principles.
Please refer to Supporting Businesses Through Every Milestone on page 36.
ASEAN SME Bank of the Year Eighth consecutive year Asian Banking & Finance
Best Small Business Bank The Asian Banker
1 in 2 SMEs in Singapore bank with us
Close to
S$1b in government-backed loans disbursed over the last three years
No. 1 League table ranking for Singapore and Malaysia Syndicated Loans
Best FX Bank for Corporates and Financial Institutions, Singapore Alpha Southeast Asia
Please refer to Supporting Businesses Through Every Milestone on page 36.
Largest sustainability- linked loan by a Singapore bank at the time of announcement
Insurance 2018 marked the 110th anniversary of our insurance subsidiary, Great Eastern Holdings (GEH), the oldest and most established life insurance group in Singapore and Malaysia which serves over 4 million policyholders. GEH is at the forefront of Asia’s insurance industry and has built a brand trusted by generations of customers. In 2018, GEH further deepened its digital engagement to provide a differentiated customer experience, expand its distribution
capabilities and capture growth opportunities. It launched two industry-first digital platforms, GETGREAT and UPGREAT, to empower and reward customers for healthier and better living. The synergistic OCBC-Great Eastern collaboration has grown from strength to strength over the years as we have successfully developed products and services that fulfil the varied needs of our customers.
10 OCBC Annual Report 2018
Message from Chairman and CEO
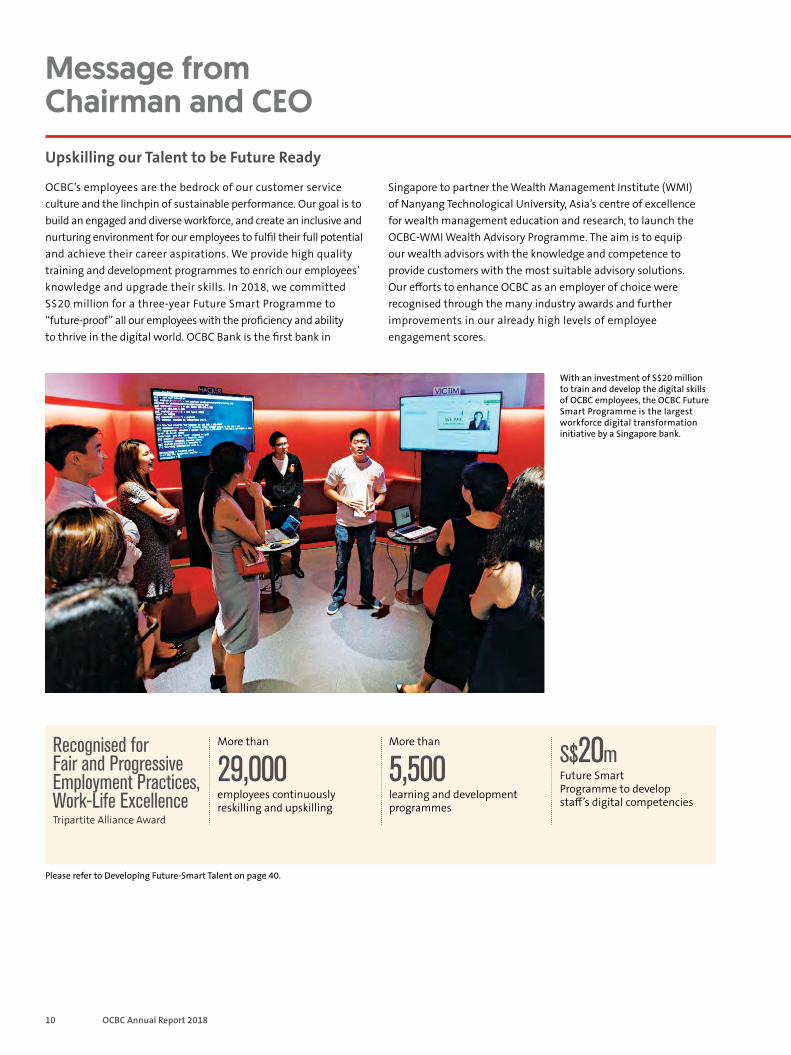
Upskilling our Talent to be Future Ready
Please refer to Developing Future-Smart Talent on page 40.
Recognised for Fair and Progressive Employment Practices, Work-Life Excellence Tripartite Alliance Award
More than
29,000 employees continuously reskilling and upskilling
More than
5,500 learning and development programmes
S$20m Future Smart Programme to develop staff’s digital competencies
With an investment of S$20 million to train and develop the digital skills of OCBC employees, the OCBC Future Smart Programme is the largest workforce digital transformation initiative by a Singapore bank.
OCBC’s employees are the bedrock of our customer service culture and the linchpin of sustainable performance. Our goal is to build an engaged and diverse workforce, and create an inclusive and nurturing environment for our employees to fulfil their full potential and achieve their career aspirations. We provide high quality training and development programmes to enrich our employees’ knowledge and upgrade their skills. In 2018, we committed S$20 million for a three-year Future Smart Programme to “future-proof” all our employees with the proficiency and ability to thrive in the digital world. OCBC Bank is the first bank in
Singapore to partner the Wealth Management Institute (WMI) of Nanyang Technological University, Asia’s centre of excellence for wealth management education and research, to launch the OCBC-WMI Wealth Advisory Programme. The aim is to equip our wealth advisors with the knowledge and competence to provide customers with the most suitable advisory solutions. Our efforts to enhance OCBC as an employer of choice were recognised through the many industry awards and further improvements in our already high levels of employee engagement scores.
11Group Overview
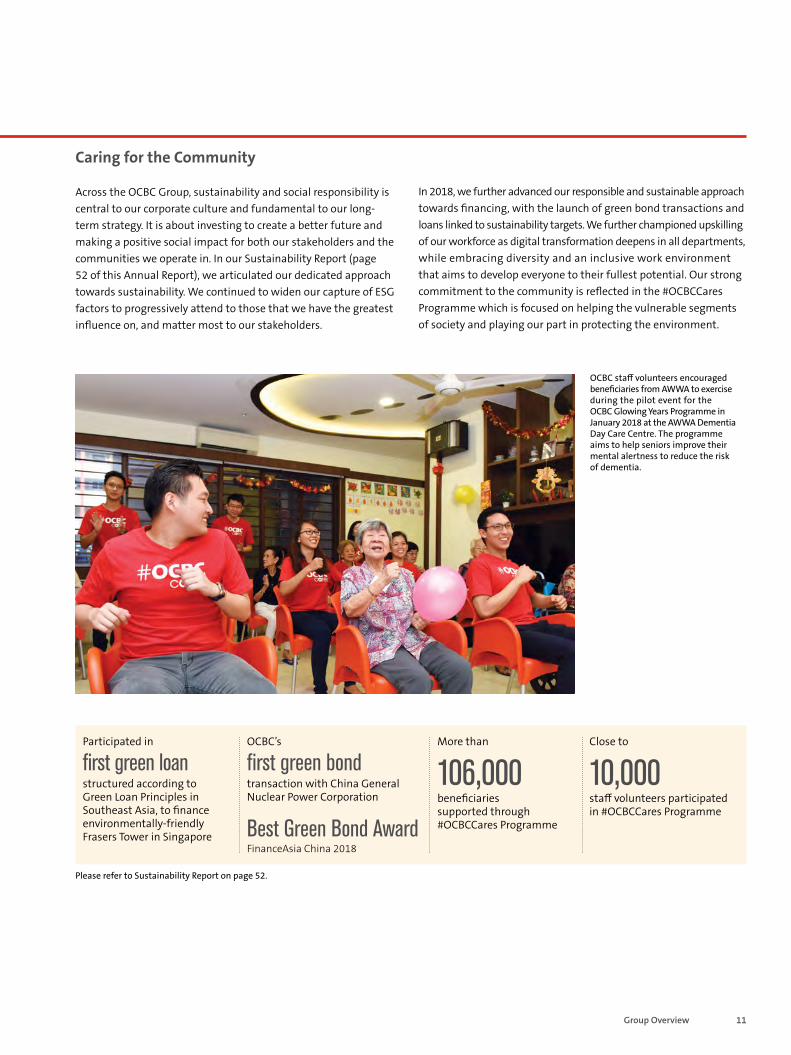
Across the OCBC Group, sustainability and social responsibility is central to our corporate culture and fundamental to our long-term strategy. It is about investing to create a better future and making a positive social impact for both our stakeholders and the communities we operate in. In our Sustainability Report (page 52 of this Annual Report), we articulated our dedicated approach towards sustainability. We continued to widen our capture of ESG factors to progressively attend to those that we have the greatest influence on, and matter most to our stakeholders.
Please refer to Sustainability Report on page 52.
Caring for the Community
Best Green Bond Award FinanceAsia China 2018
OCBC’s
first green bond transaction with China General Nuclear Power Corporation
More than
106,000 beneficiaries supported through #OCBCCares Programme
Close to
10,000 staff volunteers participated in #OCBCCares Programme
Participated in
first green loan structured according to Green Loan Principles in Southeast Asia, to finance environmentally-friendly Frasers Tower in Singapore
In 2018, we further advanced our responsible and sustainable approach towards financing, with the launch of green bond transactions and loans linked to sustainability targets. We further championed upskilling of our workforce as digital transformation deepens in all departments, while embracing diversity and an inclusive work environment that aims to develop everyone to their fullest potential. Our strong commitment to the community is reflected in the #OCBCCares Programme which is focused on helping the vulnerable segments of society and playing our part in protecting the environment.
OCBC staff volunteers encouraged beneficiaries from AWWA to exercise during the pilot event for the OCBC Glowing Years Programme in January 2018 at the AWWA Dementia Day Care Centre. The programme aims to help seniors improve their mental alertness to reduce the risk of dementia.

12 OCBC Annual Report 2018
Message from Chairman and CEO
Outlook
Global economic outlook for 2019 has turned more challenging as growth momentum has softened. The slowdown of the world’s economy and in the major industrial countries is further clouded by the uncertainties surrounding the outcome of the United States-China trade conflict, the possibility of a disorderly withdrawal of the United Kingdom from the European Union and the stance of monetary tightening in the United States. Global geo-political rivalry and the diminishing support for globalisation following the rise of populism, are expected to exert further pressure to re-order the established international norms and multi-lateral arrangements. These developments have undermined the conduct of world trade and finance, and greatly dampened business and consumer confidence.
There however, remains hope that out of the intense negotiations, a trade deal between the United States and China could be reached. Geo-political tensions between the world’s two largest economic powers and stronger economic headwinds require us to be extra vigilant to the possible emerging risks. Being highly trade-oriented,
the underlying growth drivers of the Asian countries are expected to be negatively impacted by the global economic slowdown and the disruptions in trade and capital flows.
The Asian region is however expected to benefit from the rearrangement out of China’s global supply chain, as manufacturing and services activities are realigned to other countries for cost competitiveness and country of origin. The fundamentals supporting Asia’s growth remain sound. Asian regional integration efforts have accelerated over the past years and this positive development is expected to be further supported by the collective commitments to conclude the Regional Comprehensive Economic Partnership (RCEP). On balance, Asia as a region can continue to outperform the rest of the world.
The operating environment within our core markets in 2019 requires us to be alert to the risks and be proactive to seek growth opportunities. We will be resourceful in running our business while we take comfort that the OCBC Group enters 2019 on

13Group Overview
22 February 2019
Ooi Sang Kuang Chairman
Samuel N. Tsien Group Chief Executive Officer
Acknowledgements
On behalf of the Board, our sincere gratitude goes to each of our 29,000 dedicated colleagues for their invaluable contributions. We wish to acknowledge our fellow Board members for their wise counsel and support. Our deep appreciation also goes to our customers and shareholders for their unwavering loyalty and confidence in us. Thank you for making 2018 a year of achievements we can be justly proud of.
a sound and solid footing. We have built an integrated franchise and are now embarking on a transformation journey to embrace digital technology across the Group. We however remain focused on our strategy of deepening and growing the Group’s well-established franchise in key business segments and markets across our strengthened regional and international network. Our business strategy is well-supported by a strong balance sheet, ample capital and diversified sources of funding, while our established track record of cost discipline, as well as our prudent risk practices and sound credit management will enable us to continue to manage and grow our business despite an increasingly uncertain and volatile environment.
We will continue to invest in our brand, people, systems and technology. Collectively, we now have in place the reinforcing synergies of our multi-faceted assets to create long-term sustainable growth, support our customers and fulfil our obligations to our stakeholders.
14 OCBC Annual Report 2018
Financial Highlights
2018 2017 (1) 2016 2015 2014
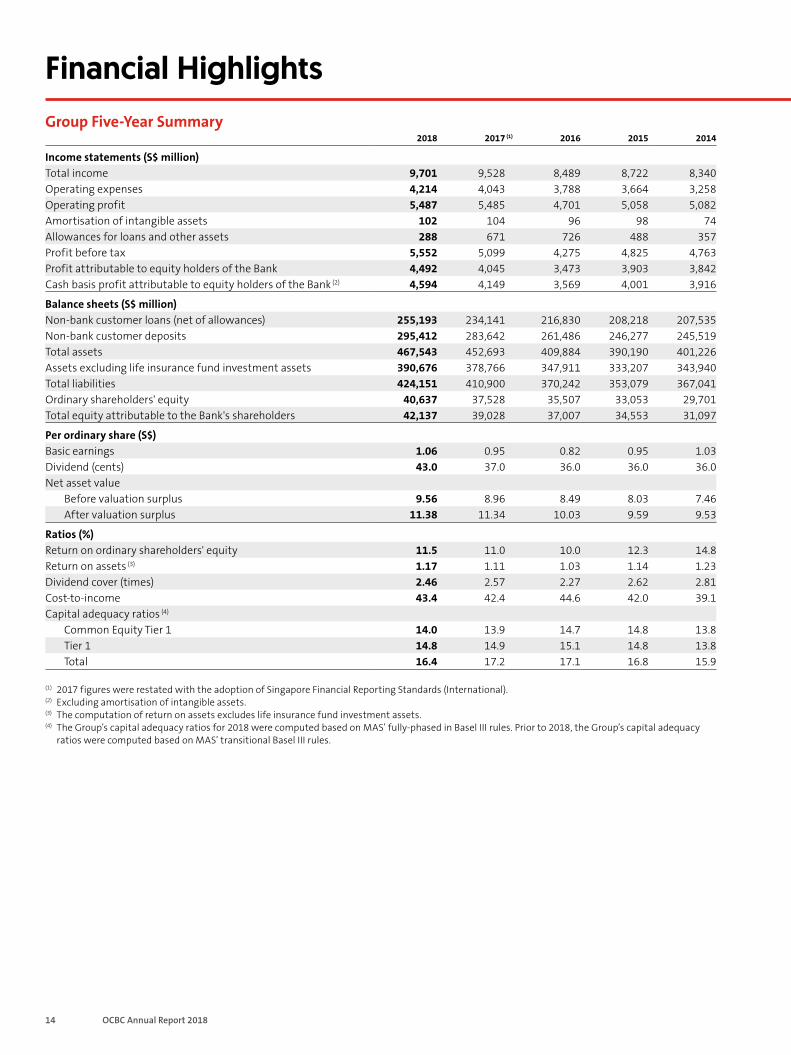
Income statements (S$ million) Total income 9,701 9,528 8,489 8,722 8,340 Operating expenses 4,214 4,043 3,788 3,664 3,258 Operating profit 5,487 5,485 4,701 5,058 5,082 Amortisation of intangible assets 102 104 96 98 74 Allowances for loans and other assets 288 671 726 488 357 Profit before tax 5,552 5,099 4,275 4,825 4,763 Profit attributable to equity holders of the Bank 4,492 4,045 3,473 3,903 3,842 Cash basis profit attributable to equity holders of the Bank (2) 4,594 4,149 3,569 4,001 3,916
Balance sheets (S$ million) Non-bank customer loans (net of allowances) 255,193 234,141 216,830 208,218 207,535 Non-bank customer deposits 295,412 283,642 261,486 246,277 245,519 Total assets 467,543 452,693 409,884 390,190 401,226 Assets excluding life insurance fund investment assets 390,676 378,766 347,911 333,207 343,940 Total liabilities 424,151 410,900 370,242 353,079 367,041 Ordinary shareholders' equity 40,637 37,528 35,507 33,053 29,701 Total equity attributable to the Bank's shareholders 42,137 39,028 37,007 34,553 31,097
Per ordinary share (S$) Basic earnings 1.06 0.95 0.82 0.95 1.03 Dividend (cents) 43.0 37.0 36.0 36.0 36.0 Net asset value
Before valuation surplus 9.56 8.96 8.49 8.03 7.46 After valuation surplus 11.38 11.34 10.03 9.59 9.53
Ratios (%) Return on ordinary shareholders' equity 11.5 11.0 10.0 12.3 14.8 Return on assets (3) 1.17 1.11 1.03 1.14 1.23 Dividend cover (times) 2.46 2.57 2.27 2.62 2.81 Cost-to-income 43.4 42.4 44.6 42.0 39.1 Capital adequacy ratios (4)
Common Equity Tier 1 14.0 13.9 14.7 14.8 13.8 Tier 1 14.8 14.9 15.1 14.8 13.8 Total 16.4 17.2 17.1 16.8 15.9
(1) 2017 figures were restated with the adoption of Singapore Financial Reporting Standards (International). (2) Excluding amortisation of intangible assets. (3) The computation of return on assets excludes life insurance fund investment assets. (4) The Group’s capital adequacy ratios for 2018 were computed based on MAS’ fully-phased in Basel III rules. Prior to 2018, the Group’s capital adequacy
ratios were computed based on MAS’ transitional Basel III rules.
Group Five-Year Summary
15Group Overview
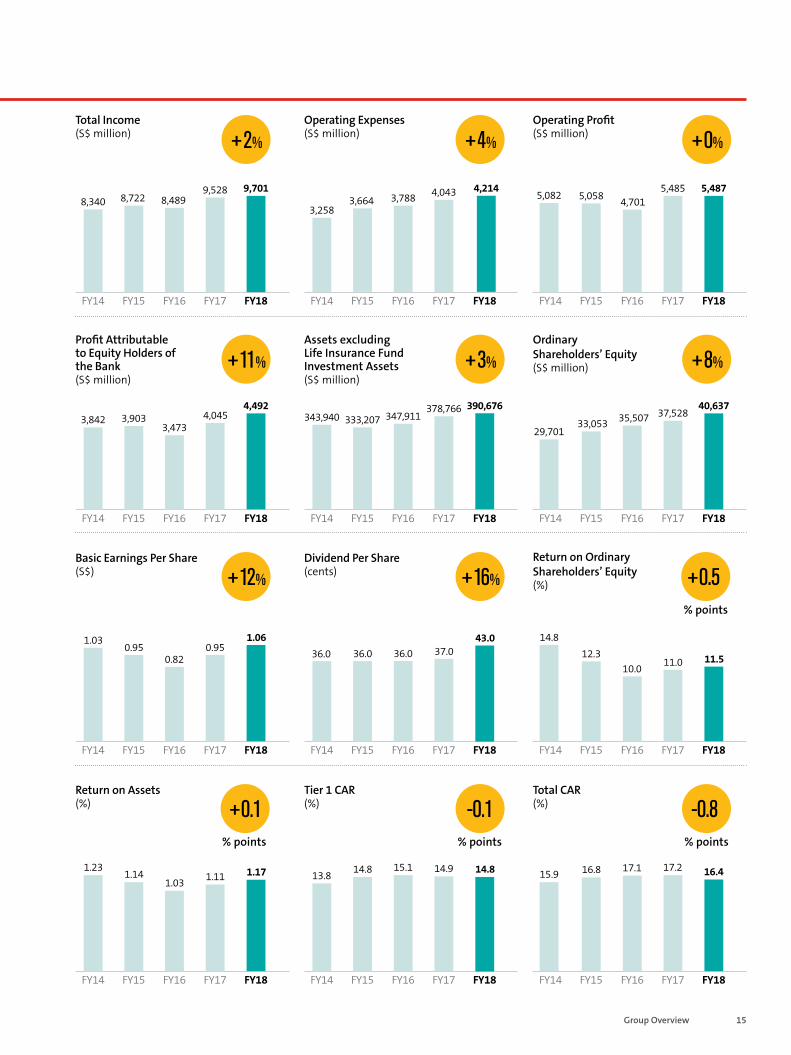
Total Income (S$ million)
Operating Expenses (S$ million)
Operating Profit (S$ million)
Profit Attributable to Equity Holders of the Bank (S$ million)
Assets excluding Life Insurance Fund Investment Assets (S$ million)
Ordinary Shareholders’ Equity (S$ million)
Basic Earnings Per Share (S$)
Dividend Per Share (cents)
Return on Ordinary Shareholders’ Equity (%)
Return on Assets (%)
Tier 1 CAR (%)
Total CAR (%)
FY14
FY14
FY14
FY18
FY18
FY18
FY16
FY16
FY16
FY15
FY15
FY15
FY14
FY14
FY14
FY17
FY17
FY17
FY18
FY18
FY18
FY16
FY16
FY16
FY15
FY15
FY15
37,528 40,637
35,507 33,053 29,701
FY14
11.0 11.5 10.0
12.3 14.8
FY14
17.2 16.417.1 16.8 15.9
FY14
FY17
FY17
FY17
FY18
FY18
FY18
FY16
FY16
FY16
3,842 4,045 4,492
3,473 3,903
FY15
1.03 0.95
1.06
0.82 0.95
FY15
1.23 1.11 1.17
1.03 1.14
FY15
43.0 36.0 36.0 36.0 37.0
FY17
14.8 15.1 14.8 13.8 14.9
FY17
390,676 347,911 333,207 343,940
378,766
FY17
FY18FY16 FY15FY14 FY17 FY18FY16 FY15
5,485 5,487 4,701 5,058 5,082
FY14 FY17 FY18FY16
8,340 9,528 9,701
8,489 8,722
FY15FY14
4,214 3,788 3,664
3,258
4,043
FY17
+2% +4% +0%
+11% +3% +8%
+12% +16%
% points
+0.5
% points
-0.8
% points
-0.1 +0.1
% points
16 OCBC Annual Report 2018
Rising Asian Wealth
Dominance of China
Growing Silver and Gig Economy
Digital Prominence and Threats
Economic Blocs and
De-Globalisation
Focus on Sustainability
Well-Positioned to Ride on Key Global Megatrends Shaping Asia’s Growth
Putting Customers First
Acting with Integrity
Valuing Our People
Engaging Communities
Being Environmentally
Responsible
Core Environment, Social and Governance Pillars
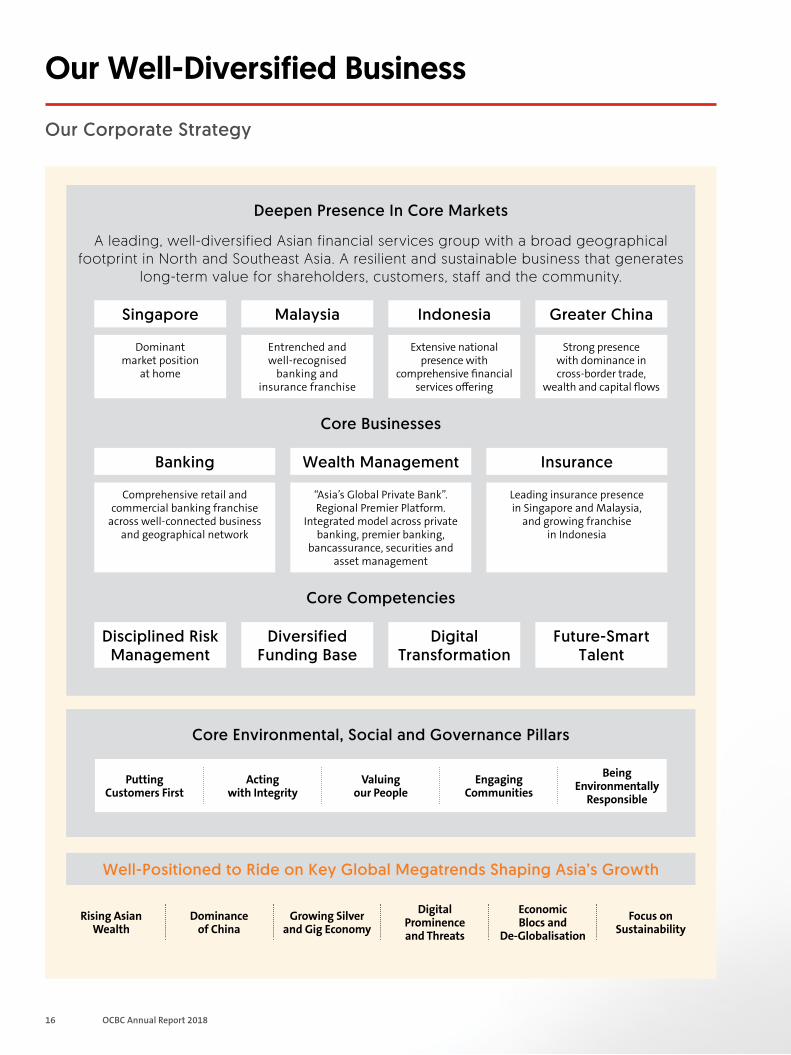
Our Well-Diversified Business
Our Corporate Strategy
A leading, well-diversified Asian financial services group with a broad geographical footprint in North and Southeast Asia. A resilient and sustainable business that generates
long-term value for shareholders, customers, staff and the community.
Deepen Presence In Core Markets
Core Businesses
Core Competencies
Singapore
Disciplined Risk Management
Banking Wealth Management Insurance
Malaysia
Diversified Funding Base
Indonesia
Digital Transformation
Greater China
Future-Smart Talent
Dominant market position
at home
Comprehensive retail and commercial banking franchise
across well-connected business and geographical network
“Asia’s Global Private Bank”. Regional Premier Platform.
Integrated model across private banking, premier banking,
bancassurance, securities and asset management
Leading insurance presence in Singapore and Malaysia,
and growing franchise in Indonesia
Entrenched and well-recognised
banking and insurance franchise
Extensive national presence with
comprehensive financial services offering
Strong presence with dominance in cross-border trade,
wealth and capital flows
Well-Positioned to Ride on Key Global Megatrends Shaping Asia’s Growth
Putting Customers First
Acting with Integrity
Valuing our People
Engaging Communities
Being Environmentally
Responsible
Core Environmental, Social and Governance Pillars
17Group Overview
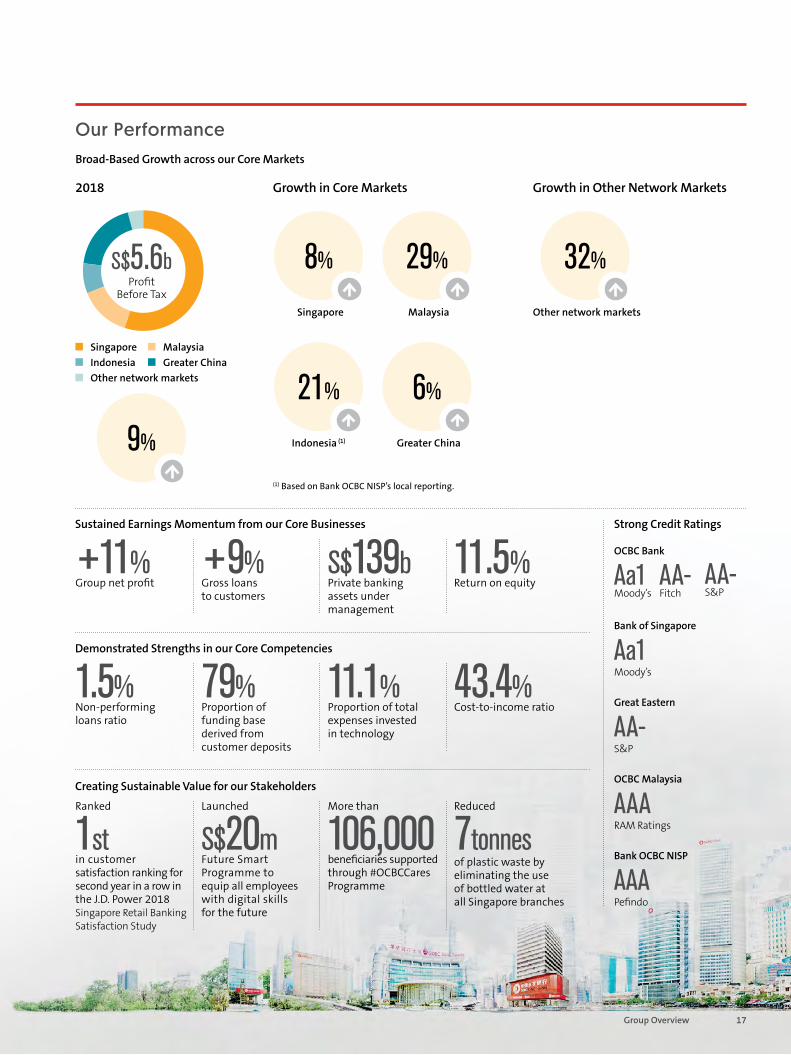
Our Performance Broad-Based Growth across our Core Markets
2018
S$5.6b Profit
Before Tax
Singapore Malaysia Indonesia Greater China Other network markets
Creating Sustainable Value for our Stakeholders
Demonstrated Strengths in our Core Competencies
Sustained Earnings Momentum from our Core Businesses
Ranked
1st in customer satisfaction ranking for second year in a row in the J.D. Power 2018 Singapore Retail Banking Satisfaction Study
+11% Group net profit
1.5% Non-performing loans ratio
+9% Gross loans to customers
79% Proportion of funding base derived from customer deposits
Launched
S$20mFuture Smart Programme to equip all employees with digital skills for the future
S$139b Private banking assets under management
11.1% Proportion of total expenses invested in technology
More than
106,000 beneficiaries supported through #OCBCCares Programme
11.5% Return on equity
43.4% Cost-to-income ratio
Reduced
7tonnes of plastic waste by eliminating the use of bottled water at all Singapore branches
Growth in Core Markets
Singapore Malaysia
Indonesia (1) Greater China
Growth in Other Network Markets
Other network markets
Strong Credit Ratings
Bank of Singapore
Aa1 Moody’s
Great Eastern
AA- S&P
OCBC Malaysia
AAA RAM Ratings
Bank OCBC NISP
AAA Pefindo
Aa1 Moody’s
AA- Fitch
AA- S&P
OCBC Bank
(1) Based on Bank OCBC NISP’s local reporting.
32%
9%
8% 29%
21% 6%
18 OCBC Annual Report 2018
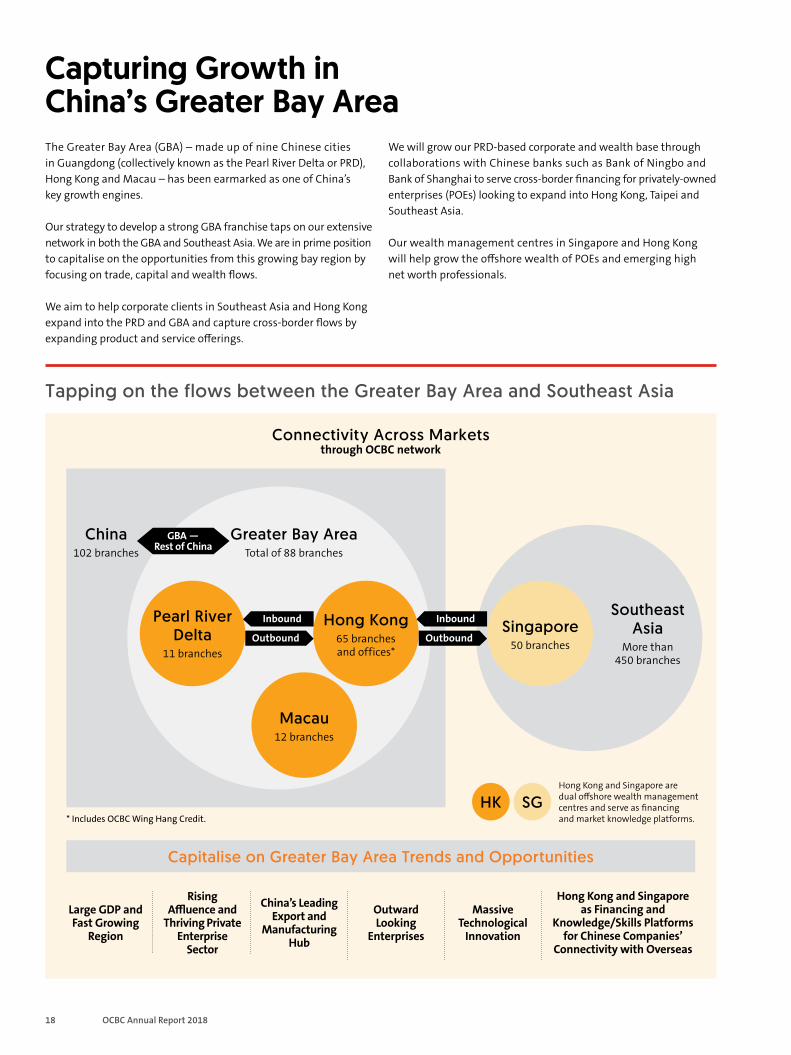
Capturing Growth in China’s Greater Bay Area
Tapping on the flows between the Greater Bay Area and Southeast Asia
The Greater Bay Area (GBA) – made up of nine Chinese cities in Guangdong (collectively known as the Pearl River Delta or PRD), Hong Kong and Macau – has been earmarked as one of China’s key growth engines.
Our strategy to develop a strong GBA franchise taps on our extensive network in both the GBA and Southeast Asia. We are in prime position to capitalise on the opportunities from this growing bay region by focusing on trade, capital and wealth flows.
We aim to help corporate clients in Southeast Asia and Hong Kong expand into the PRD and GBA and capture cross-border flows by expanding product and service offerings.
Large GDP and Fast Growing
Region
Rising Affluence and
Thriving Private Enterprise
Sector
China’s Leading Export and
Manufacturing Hub
Outward Looking
Enterprises
Massive Technological
Innovation
Capitalise on Greater Bay Area Trends and Opportunities
Hong Kong and Singapore as Financing and
Knowledge/Skills Platforms for Chinese Companies’
Connectivity with Overseas
Connectivity Across Markets through OCBC network
We will grow our PRD-based corporate and wealth base through collaborations with Chinese banks such as Bank of Ningbo and Bank of Shanghai to serve cross-border financing for privately-owned enterprises (POEs) looking to expand into Hong Kong, Taipei and Southeast Asia.
Our wealth management centres in Singapore and Hong Kong will help grow the offshore wealth of POEs and emerging high net worth professionals.
Hong Kong 65 branches and offices*
Southeast Asia
More than 450 branches
Pearl River Delta
11 branches Outbound
Inbound
Outbound
Inbound
Greater Bay Area Total of 88 branches
China 102 branches
GBA — Rest of China
Macau 12 branches
Singapore 50 branches
* Includes OCBC Wing Hang Credit.
Hong Kong and Singapore are dual offshore wealth management centres and serve as financing and market knowledge platforms.
SG HK
19Group Overview
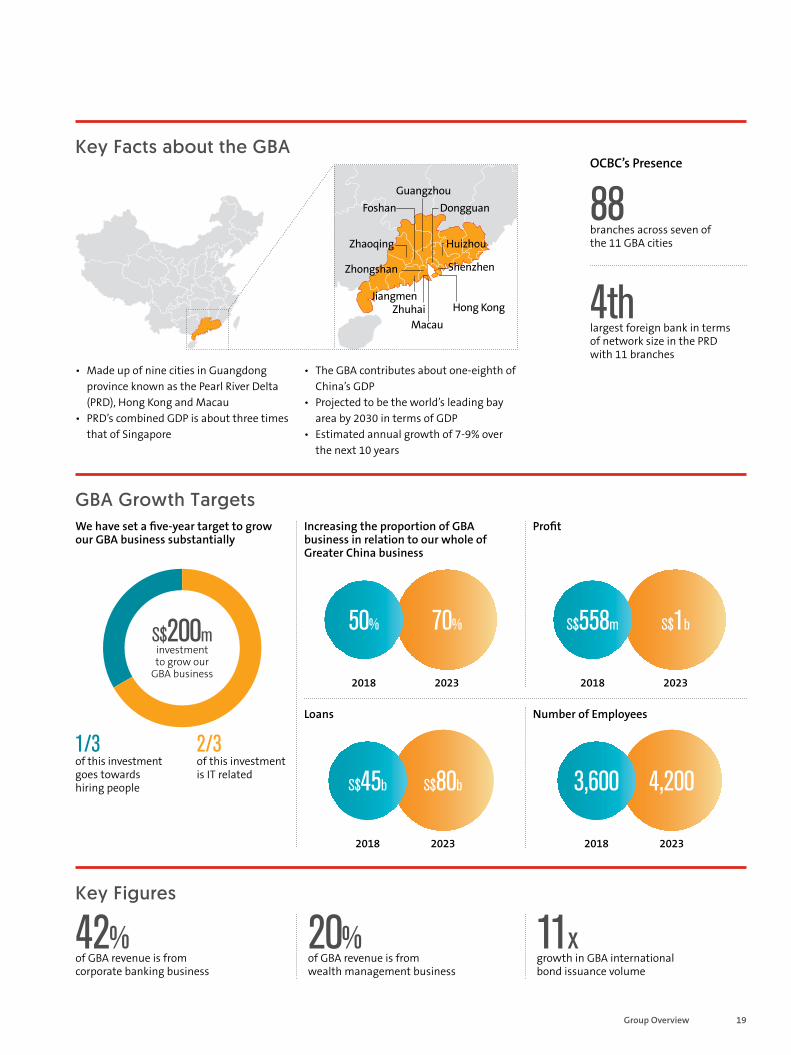
70% S$1b
S$80b 4,200
GBA Growth Targets
• Made up of nine cities in Guangdong province known as the Pearl River Delta (PRD), Hong Kong and Macau
• PRD’s combined GDP is about three times that of Singapore
Key Facts about the GBA
• The GBA contributes about one-eighth of China’s GDP
• Projected to be the world’s leading bay area by 2030 in terms of GDP
• Estimated annual growth of 7-9% over the next 10 years
OCBC’s Presence
88 branches across seven of the 11 GBA cities
4th largest foreign bank in terms of network size in the PRD with 11 branches
DongguanGuangzhou
Foshan
Zhaoqing
Zhongshan
ZhuhaiJiangmen
Huizhou
Shenzhen
Hong KongMacau
Increasing the proportion of GBA business in relation to our whole of Greater China business
Profit
Loans Number of Employees
We have set a five-year target to grow our GBA business substantially
42% of GBA revenue is from corporate banking business
20% of GBA revenue is from wealth management business
11x growth in GBA international bond issuance volume
Key Figures
2023 2018 20232018
2023 2018 2023 2018
2/3 of this investment is IT related
1/3 of this investment goes towards hiring people
S$200m investment to grow our
GBA business
50% S$558m
S$45b 3,600
20 OCBC Annual Report 2018
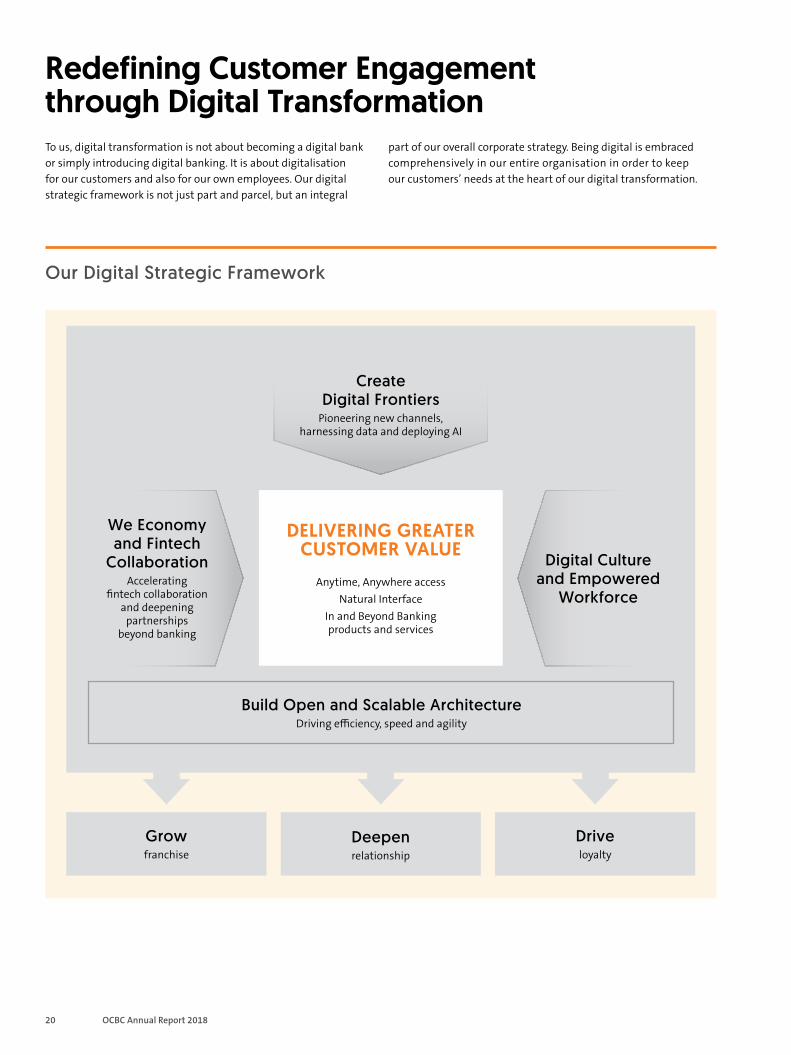
Redefining Customer Engagement through Digital Transformation
Our Digital Strategic Framework
DELIVERING GREATER CUSTOMER VALUE
Anytime, Anywhere access Natural Interface
In and Beyond Banking products and services
Grow franchise
Deepen relationship
Drive loyalty
Digital Culture and Empowered
Workforce
We Economy and Fintech
Collaboration Accelerating
fintech collaboration and deepening
partnerships beyond banking
Create Digital Frontiers
Pioneering new channels, harnessing data and deploying AI
Build Open and Scalable Architecture Driving efficiency, speed and agility
To us, digital transformation is not about becoming a digital bank or simply introducing digital banking. It is about digitalisation for our customers and also for our own employees. Our digital strategic framework is not just part and parcel, but an integral
part of our overall corporate strategy. Being digital is embraced comprehensively in our entire organisation in order to keep our customers’ needs at the heart of our digital transformation.
21Group Overview
2x 1.6x
3x
49%
62%
36%
70%
60%
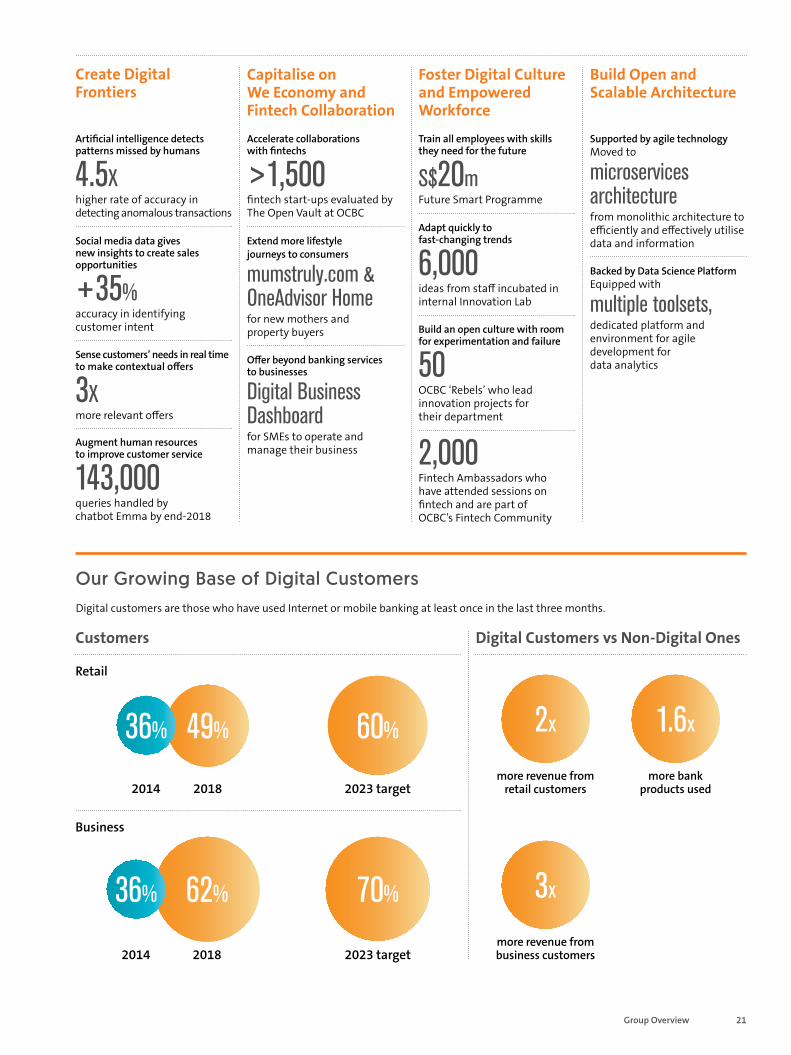
Create Digital Frontiers
Capitalise on We Economy and Fintech Collaboration
Foster Digital Culture and Empowered Workforce
Build Open and Scalable Architecture
Our Growing Base of Digital Customers Digital customers are those who have used Internet or mobile banking at least once in the last three months.
Artificial intelligence detects patterns missed by humans
4.5X higher rate of accuracy in detecting anomalous transactions
Accelerate collaborations with fintechs
>1,500 fintech start-ups evaluated by The Open Vault at OCBC
Supported by agile technology Moved to
microservices architecture from monolithic architecture to efficiently and effectively utilise data and information
Train all employees with skills they need for the future
S$20m Future Smart Programme
Backed by Data Science Platform Equipped with
multiple toolsets, dedicated platform and environment for agile development for data analytics
Social media data gives new insights to create sales opportunities
+35% accuracy in identifying customer intent
Sense customers’ needs in real time to make contextual offers
3X more relevant offers
Augment human resources to improve customer service
143,000 queries handled by chatbot Emma by end-2018
Extend more lifestyle journeys to consumers
mumstruly.com & OneAdvisor Home for new mothers and property buyers
Offer beyond banking services to businesses
Digital Business Dashboard for SMEs to operate and manage their business
Adapt quickly to fast-changing trends
6,000 ideas from staff incubated in internal Innovation Lab
Build an open culture with room for experimentation and failure
50 OCBC ‘Rebels’ who lead innovation projects for their department
2,000 Fintech Ambassadors who have attended sessions on fintech and are part of OCBC’s Fintech Community
Customers Digital Customers vs Non-Digital Ones
Retail
Business
2018
2018
2023 target
2023 target
2014
2014
more revenue from retail customers
more bank products used
more revenue from business customers
36%
22 OCBC Annual Report 2018
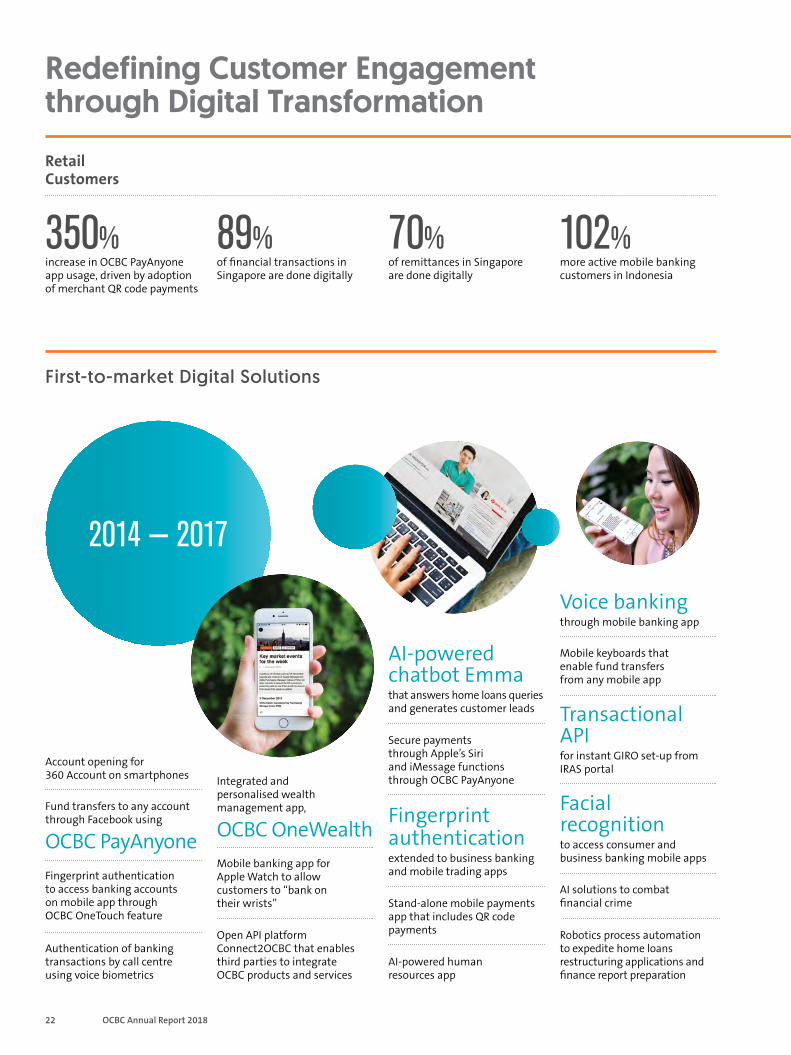
Redefining Customer Engagement through Digital Transformation
Retail Customers
350% increase in OCBC PayAnyone app usage, driven by adoption of merchant QR code payments
89% of financial transactions in Singapore are done digitally
70% of remittances in Singapore are done digitally
102% more active mobile banking customers in Indonesia
First-to-market Digital Solutions
Fund transfers to any account through Facebook using
OCBC PayAnyone Fingerprint authentication to access banking accounts on mobile app through OCBC OneTouch feature
Account opening for 360 Account on smartphones
Authentication of banking transactions by call centre using voice biometrics
Integrated and personalised wealth management app,
OCBC OneWealth Mobile banking app for Apple Watch to allow customers to “bank on their wrists”
Open API platform Connect2OCBC that enables third parties to integrate OCBC products and services
Mobile keyboards that enable fund transfers from any mobile app
Transactional API for instant GIRO set-up from IRAS portal
Voice banking through mobile banking app
AI solutions to combat financial crime
Facial recognition to access consumer and business banking mobile apps
Robotics process automation to expedite home loans restructuring applications and finance report preparation
AI-powered chatbot Emma that answers home loans queries and generates customer leads
Secure payments through Apple’s Siri and iMessage functions through OCBC PayAnyone
Stand-alone mobile payments app that includes QR code payments
AI-powered human resources app
Fingerprint authentication extended to business banking and mobile trading apps
2014 — 2017
23Group Overview
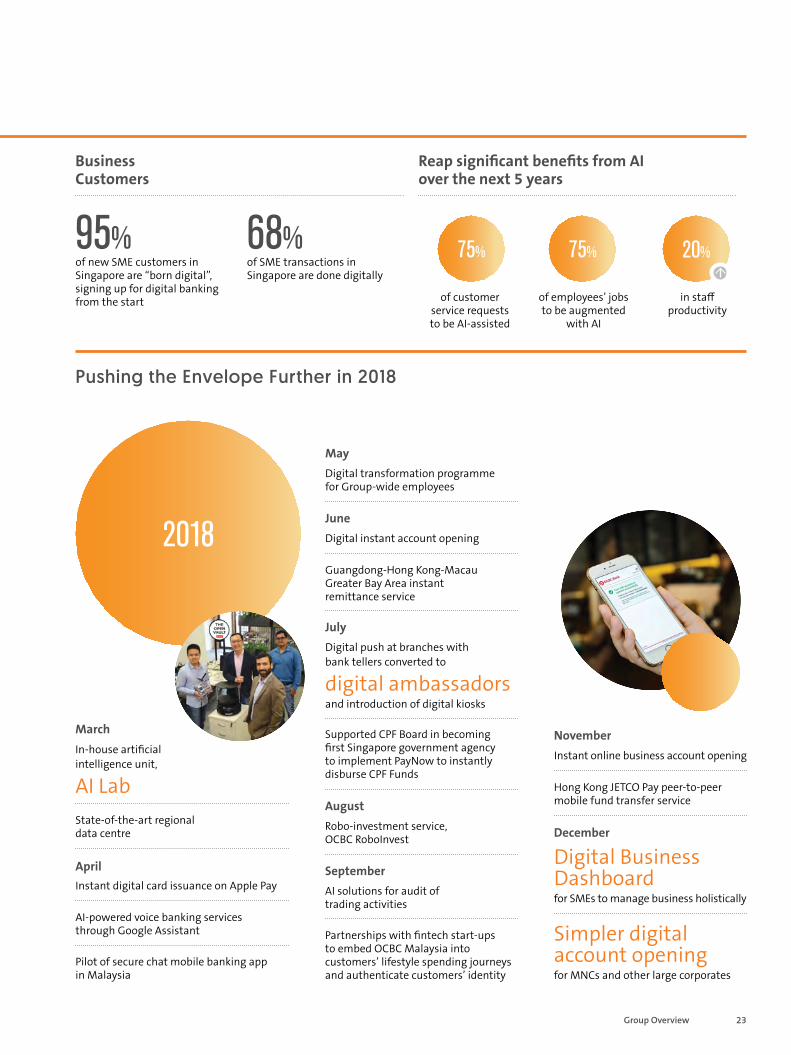
20% 75% 75%
2018
Business Customers
Reap significant benefits from AI over the next 5 years
of customer service requests to be AI-assisted
of employees’ jobs to be augmented
with AI
in staff productivity
95% of new SME customers in Singapore are “born digital”, signing up for digital banking from the start
68% of SME transactions in Singapore are done digitally
Pushing the Envelope Further in 2018
April
In-house artificial intelligence unit,
AI Lab
Instant digital card issuance on Apple Pay
AI-powered voice banking services through Google Assistant
Pilot of secure chat mobile banking app in Malaysia
State-of-the-art regional data centre
March
Digital transformation programme for Group-wide employees
May
Digital push at branches with bank tellers converted to
digital ambassadors and introduction of digital kiosks
Supported CPF Board in becoming first Singapore government agency to implement PayNow to instantly disburse CPF Funds
July
Robo-investment service, OCBC RoboInvest
AI solutions for audit of trading activities
Partnerships with fintech start-ups to embed OCBC Malaysia into customers’ lifestyle spending journeys and authenticate customers’ identity
August
September
Guangdong-Hong Kong-Macau Greater Bay Area instant remittance service
June
Instant online business account opening
November
Hong Kong JETCO Pay peer-to-peer mobile fund transfer service
Digital Business Dashboard for SMEs to manage business holistically
December
Simpler digital account opening for MNCs and other large corporates
Digital instant account opening

24 OCBC Annual Report 2018
Board of Directors
Mr Ooi Sang Kuang Chairman Non-executive and independent director
Mr Ooi was first appointed to the Board on 21 February 2012 and last re-elected as a Director on 30 April 2018. He assumed the role of Chairman on 1 September 2014. He was Special Advisor in Bank Negara Malaysia until he retired on 31 December 2011. Prior to this, he was Deputy Governor and Member of the Board of Directors of Bank Negara Malaysia, from 2002 to 2010. Age 71.
Other Directorships and Principal Commitments/Appointments OCBC Management Services Pte Ltd, Board Director • OCBC Wing Hang Bank Ltd, Board Director • Xeraya Capital Labuan Ltd, Board Chairman • Xeraya Capital Sendirian Berhad, Board Chairman • Target Value Fund, Director
Directorships and Principal Commitments/Appointments for the Past Five Years OCBC Bank (Malaysia) Berhad, Board Chairman • OCBC Al-Amin Bank Berhad, Board Chairman • Cagamas Berhad, Board Chairman • Cagamas Holdings Berhad, Board Chairman • Cagamas MBS Berhad, Board Chairman • Cagamas MGP Berhad, Board Chairman • Cagamas SRP Berhad, Board Chairman • Malaysian Electronic Clearing Corporation Sendirian Berhad, Board Chairman • Financial Services Talent Council, Council Member
Academic and Professional Qualifications Bachelor of Economics (Honours), University of Malaya Master of Arts (Development Finance), Boston University, USA Fellow Member of the Asian Institute of Chartered Bankers
OCBC Board Committees Served OnChairman, Ethics and Conduct Committee Chairman, Executive Committee Member, Nominating Committee Member, Remuneration Committee Member, Risk Management Committee
Length of Service as a Director 7 years 1 month
Country of Principal Residence Singapore
Mr Chua Kim Chiu Non-executive and independent director
Mr Chua was appointed to the Board on 20 September 2017 and elected as a Director on 30 April 2018. He is a chartered accountant and currently holds the position of Professor (Practice) in Accounting, National University of Singapore (NUS) Business School. He had a long and distinguished career in PricewaterhouseCoopers (PwC) Singapore where he served as a partner from 1990, headed the banking and capital markets group as well as the China desk, and was appointed a member of the firm’s leadership team in 2005. He retired in 2012, but was retained as senior advisor for PwC Hong Kong until June 2016 when he left to join NUS. Age 64.
Other Directorships and Principal Commitments/Appointments Department of Accounting | NUS Business School | National University of Singapore, Employee; Executive Committee, Chairman; Practice/Education Faculty Search Committee, Chairman • Greenland (Singapore) Trust Management Pte. Ltd. (formerly Star Green Holding Pte. Ltd.), Board Director • National University Health System Pte Ltd | Audit and Risk Committee, Member • NUS Business School | Executive Education Advisory Board, Member
Directorships and Principal Commitments/Appointments for the Past Five Years Institute of Singapore Chartered Accountants | Financial Reporting Committee, Chairman • Jurong Health Services Pte Ltd, Board Director • Accounting Standards Council, Singapore, Council Member • MOH Holdings Pte Ltd | Audit and Risk Committee, Member
Academic and Professional Qualifications Bachelor of Commerce and Administration with Honours, Victoria University of Wellington, New Zealand Bachelor of Commerce, Nanyang Technological University (formerly Nanyang University), Singapore Fellow Chartered Accountant of Singapore Member of Chartered Accountants Australia and New Zealand Fellow Chartered Certified Accountant, United Kingdom
OCBC Board Committees Served OnChairman, Audit Committee Member, Risk Management Committee
Length of Service as a Director 1 year 7 months
Country of Principal Residence Singapore
Mr Lai Teck Poh Non-executive and independent director
Mr Lai was first appointed to the Board on 1 June 2010 and last re-elected as a Director on 30 April 2018. He served more than 20 years in OCBC Bank in several senior capacities, including Head of Corporate Banking, Head of Information Technology & Central Operations and Head of Risk Management. He was Head, Group Audit prior to retiring in April 2010. Before joining OCBC Bank, he was Managing Director of Citicorp Investment Bank Singapore Ltd and had served stints with Citibank N.A. in Jakarta, New York and London. Age 74.
Other Directorships and Principal Commitments/Appointments AV Jennings Ltd*, Board Director • OCBC Bank (Malaysia) Berhad, Board Director • PT Bank OCBC NISP Tbk*, Board Commissioner * Listed companies
Directorships and Principal Commitments/Appointments for the Past Five Years WBL Corporation Ltd, Board Director • OCBC Al-Amin Bank Berhad, Board Director
Academic and Professional Qualifications Bachelor of Arts (Honours), University of Singapore
OCBC Board Committees Served OnChairman, Risk Management Committee Member, Audit Committee Member, Nominating Committee
Length of Service as a Director 8 years 10 months
Country of Principal Residence Singapore

25Group Overview
Dr Lee Tih Shih Non-executive and non-independent director
Dr Lee was first appointed to the Board on 4 April 2003 and last re-elected as a Director on 28 April 2017. He is presently an Associate Professor at the Duke-NUS Medical School in Singapore. He has previously served in senior positions at both OCBC Bank from 1993 to 1998 and the Monetary Authority of Singapore from 1998 to 2000. Age 55.
Other Directorships and Principal Commitments/Appointments Lee Foundation, Singapore, Board Director • Selat (Pte) Ltd, Board Director • Singapore Investments (Pte) Ltd, Board Director • Duke-NUS Medical School (Singapore), Employee
Directorships and Principal Commitments/Appointments for the Past Five Years Nil
Academic and Professional Qualifications MBA with Distinction, Imperial College, London MD and PhD, Yale University, New Haven Fellow, Royal College of Physicians of Edinburgh
OCBC Board Committees Served OnMember, Ethics and Conduct Committee Member, Executive Committee Member, Nominating Committee
Length of Service as a Director 16 years
Country of Principal Residence Singapore
Ms Christina Ong Non-executive and independent director
Ms Ong was appointed to the Board on 15 February 2016 and elected as a Director on 22 April 2016. She is presently the Co-Chairman and Senior Partner of Allen & Gledhill LLP as well as the Co-Head of its Financial Services Department. Ms Ong is a lawyer and has been in Allen & Gledhill LLP since 1987. She provides corporate and corporate regulatory and compliance advice, particularly to listed companies. Her areas of practice include banking and securities. Age 67.
Ms Ong will be seeking re-election at the Bank’s 2019 Annual General Meeting. Please refer to the footnote at the end of this section for additional information required under Rule 720(6) of the Listing Manual.
Other Directorships and Principal Commitments/Appointments Allen & Gledhill LLP, Co-Chairman and Senior Partner • Allen & Gledhill Regulatory & Compliance Pte Ltd, Board Director • Eastern Development Pte Ltd, Board Director • Eastern Development Holdings Pte Ltd, Board Director • Epimetheus Ltd, Board Director • Hongkong Land Holdings Ltd*, Board Director • SIA Engineering Company Ltd*, Board Director • Singapore Telecommunications Ltd*, Board Director • Trailblazer Foundation Ltd, Board Director • ABF Singapore Bond Index Fund | Supervisory Committee, Member • Catalist Advisory Panel, Member • MAS Corporate Governance Advisory Committee, Member • The Stephen A Schwarzman Scholars Trust, Trustee * Listed companies
Directorships and Principal Commitments/Appointments for the Past Five Years Singapore Tourism Board, Board Member
Academic and Professional Qualifications Bachelor of Laws (Second Upper Class Honours), University of Singapore Member, Law Society of Singapore Member, International Bar Association
OCBC Board Committees Served OnMember, Audit Committee Member, Ethics and Conduct Committee Member, Remuneration Committee
Length of Service as a Director 3 years 2 months
Country of Principal Residence Singapore
The Board’s Comments on the Re-election Ms Ong is a well-qualified and experienced lawyer whose knowledge and experience will continue to complement the competencies of board members.
Mr Quah Wee Ghee Non-executive and independent director
Mr Quah was first appointed to the Board on 9 January 2012 and last re-elected as a Director on 28 April 2017. He began his career at IBM and in 1987, joined the Government of Singapore Investment Corporation (GIC), where he last held the position of President of Public Markets. He also served as a Director of GIC and was the Managing Director and President of GIC Asset Management Pte Ltd from 2007 to 2011. Age 58.
Mr Quah will be seeking re-election at the Bank’s 2019 Annual General Meeting. Please refer to the footnote at the end of this section for additional information required under Rule 720(6) of the Listing Manual.
Other Directorships and Principal Commitments/Appointments Avanda LLP Singapore, Partner/Managing Member • Avanda Investment Management Pte Ltd, Executive Director • Bank of Singapore Ltd, Board Director • Cypress Holdings Pte Ltd, Board Director • Grand Alpine Enterprise Ltd, Board Director • The Great Eastern Life Assurance Co Ltd, Board Director • Great Eastern General Insurance Ltd, Board Director • Wah Hin & Company (Pte) Ltd | Investment Committee, Advisor
Directorships and Principal Commitments/Appointments for the Past Five Years MOH Holdings Pte Ltd | Investment and Evaluation Committee, Chairman • EDBI Pte Ltd, Board Director • Singapore Exchange Ltd, Board Director • Singapore Labour Foundation, Board Director • SLF Strategic Advisers Pte Ltd, Board Director • Singapore University of Technology and Design | Board of Trustee, Member
Academic and Professional Qualifications Bachelor of Engineering (Civil), National University of Singapore Chartered Financial Analyst Alumni Member of the Stanford Graduate Business School
OCBC Board Committees Served OnMember, Executive Committee Member, Remuneration Committee
Length of Service as a Director 7 years 3 months
Country of Principal Residence Singapore
The Board’s Comments on the Re-election Mr Quah’s wide experience in the financial industry coupled with his knowledge of markets will continue to be of value to the Board.

26 OCBC Annual Report 2018
Board of Directors
Mr Pramukti Surjaudaja Non-executive and non-independent director
Mr Pramukti was first appointed to the Board on 1 June 2005 and last re-elected as a Director on 30 April 2018. He has been with PT Bank OCBC NISP Tbk for 31 years, holding key positions, including President Director, and is presently President Commissioner of the bank. Age 56.
Other Directorships and Principal Commitments/Appointments PT Bank OCBC NISP Tbk*, Board President Commissioner • PT Bio Laborindo Makmur Sejahtera, Board Commissioner • Indonesian Overseas Alumni | Board of Supervisors, Deputy Chairman • Insead | Southeast Asia, Council Member • Karya Salemba Empat Foundation | Board of Trustees, Member • Parahyangan Catholic University | Board of Advisors, Member * Listed company
Directorships and Principal Commitments/Appointments for the Past Five Years SBR Capital Ltd, Board Director • President University | Board of Trustees, Member
Academic and Professional Qualifications Bachelor of Science (Finance & Banking), San Francisco State University Master of Business Administration (Banking), Golden Gate University, San Francisco Participant in Special Programs in International Relations, International University of Japan
OCBC Board Committee Served On Member, Risk Management Committee
Length of Service as a Director 13 years 10 months
Country of Principal Residence Indonesia
Mr Tan Ngiap Joo Non-executive and independent director
Mr Tan was first appointed to the Board on 2 September 2013 and last re-elected as a Director on 22 April 2016. He had a long career of 37 years as a banker. He spent 20 years in Citibank NA serving in various capacities, including Senior Risk Manager of Citibank Australia and postings overseas prior to joining the OCBC Group in August 1990, where he held senior positions over the years, including Chief Executive of OCBC’s Australian operations, and Head, Group Business Banking and was appointed Deputy President in December 2001. He retired in December 2007. Age 73.
Mr Tan will be seeking re-election at the Bank’s 2019 Annual General Meeting. Please refer to the footnote at the end of this section for additional information required under Rule 720(6) of the Listing Manual.
Other Directorships and Principal Commitments/Appointments OCBC Al-Amin Bank Berhad, Board Chairman • OCBC Bank (Malaysia) Berhad, Board Chairman • China Fishery Group Ltd*, Board Director • Gemstone Asset Holdings Pte Ltd, Board Director • Mapletree India China Fund Ltd | Investment Committee, Chairman * Listed company
Directorships and Principal Commitments/Appointments for the Past Five Years Banking Computer Services Pte Ltd, Board Chairman • United Engineers Ltd, Board Chairman • BCS Information Systems Pte Ltd, Board Director • Mapletree Logistics Trust Management Ltd, Board Director • Tan Chong International Ltd, Board Director • Breast Cancer Foundation | Executive Committee, Member
Academic and Professional Qualifications Bachelor of Arts, University of Western Australia
OCBC Board Committees Served OnChairman, Nominating Committee Member, Audit Committee Member, Executive Committee Member, Remuneration Committee
Length of Service as a Director 5 years 7 months
Country of Principal Residence Singapore
The Board’s Comments on the Re-election Mr Tan who has wide industry experience, especially in banking, will be able to continue to contribute to the Group’s strategy and operations.

27Group Overview
Mr Samuel N. Tsien Group Chief Executive Officer Executive and non-independent director
Mr Tsien was first appointed to the Board on 13 February 2014 and last re-elected as a Director on 28 April 2017. He was appointed Group Chief Executive Officer on 15 April 2012. He joined OCBC Bank in July 2007 as Senior Executive Vice President, managing the Group’s corporate and commercial banking business. In 2008, he assumed the position as Global Head of Global Corporate Bank with added responsibilities of overseeing the financial institution and transaction banking businesses. He has 41 years of banking experience. Prior to joining OCBC Bank, he was the President and Chief Executive Officer of China Construction Bank (Asia) when China Construction Bank acquired Bank of America (Asia). From 1995 to 2006, he was President and Chief Executive Officer of Bank of America (Asia), and Asia Consumer and Commercial Banking Group Executive of Bank of America Corporation. Age 64.
Mr Tsien will be seeking re-election at the Bank’s 2019 Annual General Meeting. Please refer to the footnote at the end of this section for additional information required under Rule 720(6) of the Listing Manual.
Other Directorships and Principal Commitments/Appointments OCBC Wing Hang Bank (China) Ltd, Board Chairman • PT Bank OCBC NISP Tbk*, Board Commissioner • Bank of Singapore Ltd, Board Director • Dr Goh Keng Swee Scholarship Fund, Board Director • Great Eastern Holdings Ltd*, Board Director • International Monetary Conference, Board Director • Mapletree Investments Pte Ltd, Board Director • OCBC Bank (Malaysia) Berhad, Board Director • OCBC Overseas Investments Pte Ltd, Board Director • OCBC Wing Hang Bank Ltd, Board Director • Association of Banks in Singapore, Vice Chairman • Institute of Banking & Finance Singapore, Vice Chairman, and Chairman of Standards Committee • Advisory Board of the Asian Financial Leaders Programme, Member • Financial Sector Tripartite Committee, Member • MAS Financial Centre Advisory Panel, Member • MAS Payments Council, Member * Listed companies
Directorships and Principal Commitments/Appointments for the Past Five Years Asean Finance Corporation Ltd, Board Director • OCBC Al-Amin Bank Berhad, Board Director • Mapletree Commercial Trust Management Ltd, Board Director • ABS Benchmarks Administration Co Pte Ltd | Oversight Committee, Member • Advisory Council on Community Relations in Defence (ACCORD) (Employer & Business), Member • Malaysia-Singapore Business Council, Member • Singapore Business Federation | Finance & Investment Committee, Council Member
Academic and Professional Qualifications Bachelor of Arts with Honours in Economics, University of California, Los Angeles
OCBC Board Committees Served OnMember, Executive Committee Member, Risk Management Committee
Length of Service as a Director 5 years 2 months
Country of Principal Residence Singapore
The Board’s Comments on the Re-election As Chief Executive Officer of OCBC Bank, Mr Tsien’s continuing membership of the Board will facilitate governance and decision making.
Mr Wee Joo Yeow Non-executive and independent director
Mr Wee was first appointed to the Board on 2 January 2014 and last re-elected as a Director on 28 April 2017. He has more than 39 years of corporate banking experience. He was Managing Director & Head of Corporate Banking Singapore with United Overseas Bank Ltd until his retirement in June 2013. Prior to that, he was Executive Vice President & Head of Corporate Banking with Overseas Union Bank Ltd, and Head Credit & Marketing with First National Bank of Chicago (Singapore). Age 71.
Other Directorships and Principal Commitments/Appointments Frasers Property Ltd*, Board Director • Great Eastern Holdings Ltd*, Board Director • Mapletree Industrial Trust Management Ltd, Board Director • OCBC Management Services Pte Ltd, Board Director • PACC Offshore Services Holdings Ltd*, Board Director • WJY Holdings Pte Ltd, Board Director • WTT Investments Pte Ltd, Board Director * Listed companies
Directorships and Principal Commitments/Appointments for the Past Five Years Nil
Academic and Professional Qualifications Bachelor of Business Administration (Honours), University of Singapore Master of Business Administration, New York University, USA
OCBC Board Committees Served OnChairman, Remuneration Committee Member, Executive Committee Member, Nominating Committee Member, Risk Management Committee
Length of Service as a Director 5 years 3 months
Country of Principal Residence Singapore
The Directors seeking re-election at the 82nd Annual General Meeting, namely, Ms Christina Hon Kwee Fong (Christina Ong), Mr Quah Wee Ghee, Mr Samuel N. Tsien and Mr Tan Ngiap Joo, have each: • Provided an undertaking in the format set out in Appendix 7.7 under Rule 720(1) of the Listing Manual of Singapore Exchange Securities Trading Limited (Listing Manual). • Confirmed that he/she has no relationship (including immediate family relationships) with an existing director, existing executive officer, the Bank and/or any substantial
shareholder of the Bank or of any of its principal subsidiaries. • Confirmed that he/she has no conflict of interest (including any competing business). • Confirmed that there is no change to his/her responses previously disclosed under items (a) to (k) of Appendix 7.4.1 of the Listing Manual*, which were all “No”, save that
Ms Christina Hon Kwee Fong (Christina Ong) responded “Yes” to item (k) of Appendix 7.4.1, and disclosed “An enquiry by the Law Society of Singapore in 1986/1987 of a complaint which was dismissed by the Law Society of Singapore.”.
* The Appendix 7.4.1 information was announced on 15 February 2016 (Ms Christina Hon Kwee Fong (Christina Ong)), 9 January 2012 (Mr Quah Wee Ghee), 13 February 2014 (Mr Samuel N. Tsien) and 2 September 2013 (Mr Tan Ngiap Joo), when these Directors were first appointed as Directors of the Bank.
The shareholding interest in the Bank and its subsidiaries (if any) of each of these Directors are disclosed in the “Directors’ Statement” on pages 134 to 139.
28 OCBC Annual Report 2018
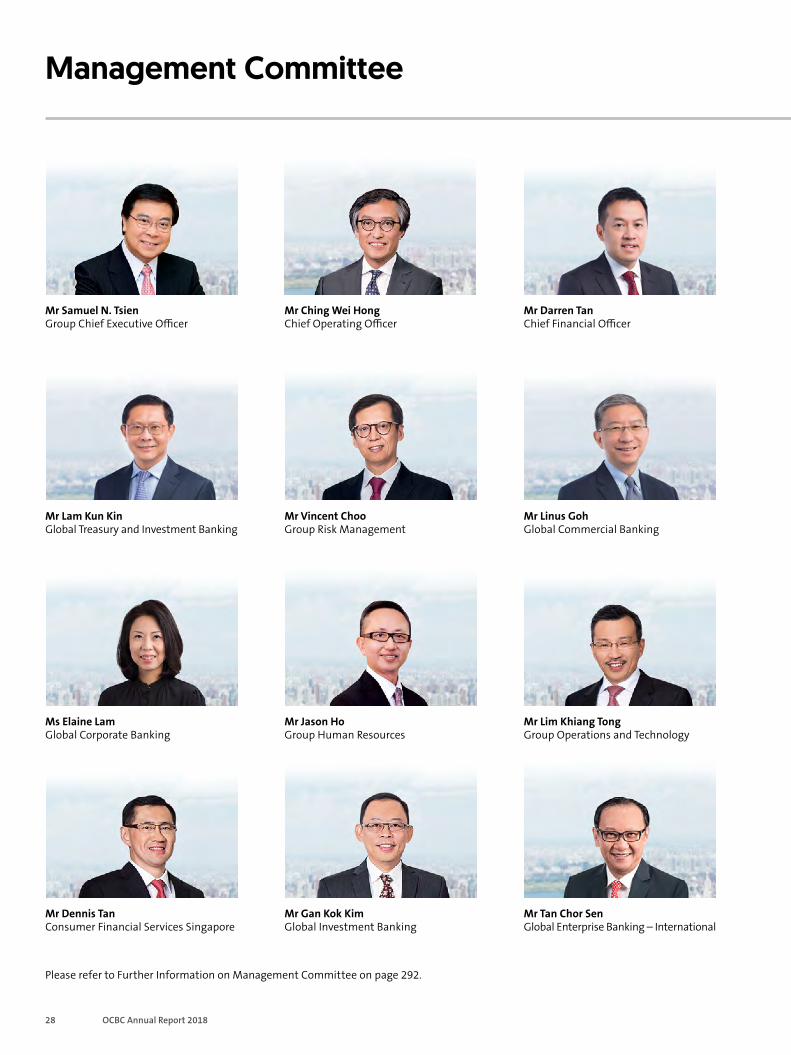
Management Committee
Please refer to Further Information on Management Committee on page 292.
Mr Ching Wei Hong Chief Operating Officer
Mr Samuel N. Tsien Group Chief Executive Officer
Mr Darren Tan Chief Financial Officer
Mr Jason Ho Group Human Resources
Ms Elaine Lam Global Corporate Banking
Mr Lim Khiang Tong Group Operations and Technology
Mr Gan Kok Kim Global Investment Banking
Mr Dennis Tan Consumer Financial Services Singapore
Mr Tan Chor Sen Global Enterprise Banking – International
Mr Vincent Choo Group Risk Management
Mr Lam Kun Kin Global Treasury and Investment Banking
Mr Linus Goh Global Commercial Banking

29Group Overview
Mr Ong Eng Bin CEO, OCBC Bank Malaysia
Ms Parwati Surjaudaja President Director and CEO, Bank OCBC NISP
Mr Bahren Shaari CEO, Bank of Singapore
Ms Loretta Yuen Group Legal and Regulatory Compliance
Ms Goh Chin Yee Group Audit
Mr Melvyn Low Global Transaction Banking
Mr Peter Yeoh Group Secretariat
Mr Vincent Soh Group Property Management
Ms Koh Ching Ching Group Brand and Communications
Ms Kng Hwee Tin CEO, OCBC Wing Hang Bank (China)
Mr Na Wu Beng CEO, OCBC Wing Hang Bank
Mr Tan Wing Ming Regional General Manager for North East Asia
30 OCBC Annual Report 2018
Integrity
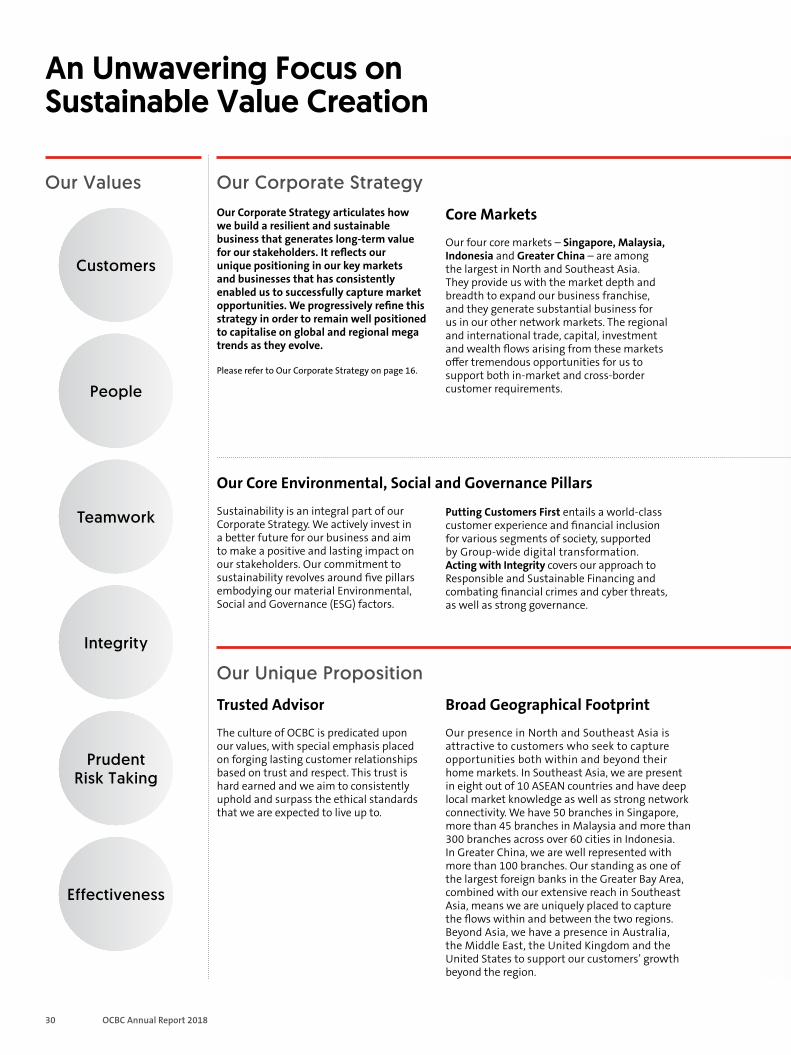
An Unwavering Focus on Sustainable Value Creation
Our Corporate Strategy articulates how we build a resilient and sustainable business that generates long-term value for our stakeholders. It reflects our unique positioning in our key markets and businesses that has consistently enabled us to successfully capture market opportunities. We progressively refine this strategy in order to remain well positioned to capitalise on global and regional mega trends as they evolve.
Please refer to Our Corporate Strategy on page 16.
Sustainability is an integral part of our Corporate Strategy. We actively invest in a better future for our business and aim to make a positive and lasting impact on our stakeholders. Our commitment to sustainability revolves around five pillars embodying our material Environmental, Social and Governance (ESG) factors.
Our Unique Proposition
Trusted Advisor
The culture of OCBC is predicated upon our values, with special emphasis placed on forging lasting customer relationships based on trust and respect. This trust is hard earned and we aim to consistently uphold and surpass the ethical standards that we are expected to live up to.
Our Values Our Corporate Strategy
Putting Customers First entails a world-class customer experience and financial inclusion for various segments of society, supported by Group-wide digital transformation. Acting with Integrity covers our approach to Responsible and Sustainable Financing and combating financial crimes and cyber threats, as well as strong governance.
Core Markets
Our four core markets – Singapore, Malaysia, Indonesia and Greater China – are among the largest in North and Southeast Asia. They provide us with the market depth and breadth to expand our business franchise, and they generate substantial business for us in our other network markets. The regional and international trade, capital, investment and wealth flows arising from these markets offer tremendous opportunities for us to support both in-market and cross-border customer requirements.
Broad Geographical Footprint
Our presence in North and Southeast Asia is attractive to customers who seek to capture opportunities both within and beyond their home markets. In Southeast Asia, we are present in eight out of 10 ASEAN countries and have deep local market knowledge as well as strong network connectivity. We have 50 branches in Singapore, more than 45 branches in Malaysia and more than 300 branches across over 60 cities in Indonesia. In Greater China, we are well represented with more than 100 branches. Our standing as one of the largest foreign banks in the Greater Bay Area, combined with our extensive reach in Southeast Asia, means we are uniquely placed to capture the flows within and between the two regions. Beyond Asia, we have a presence in Australia, the Middle East, the United Kingdom and the United States to support our customers’ growth beyond the region.
Customers
People
Teamwork
Effectiveness
Our Core Environmental, Social and Governance Pillars
Prudent Risk Taking
31Our Year in Review
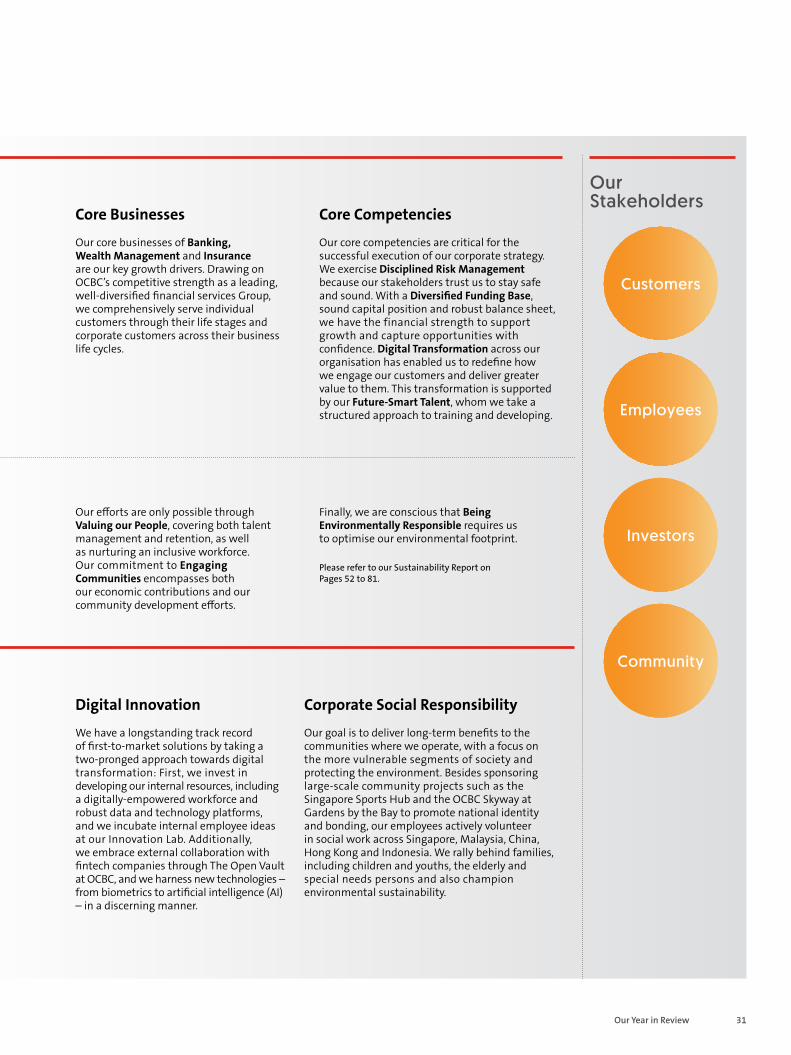
Customers
Community
Investors
Employees
Our efforts are only possible through Valuing our People, covering both talent management and retention, as well as nurturing an inclusive workforce. Our commitment to Engaging Communities encompasses both our economic contributions and our community development efforts.
Our Unique Proposition
Digital Innovation
We have a longstanding track record of first-to-market solutions by taking a two-pronged approach towards digital transformation: First, we invest in developing our internal resources, including a digitally-empowered workforce and robust data and technology platforms, and we incubate internal employee ideas at our Innovation Lab. Additionally, we embrace external collaboration with fintech companies through The Open Vault at OCBC, and we harness new technologies – from biometrics to artificial intelligence (AI) – in a discerning manner.
Our Corporate Strategy Our Stakeholders
Finally, we are conscious that Being Environmentally Responsible requires us to optimise our environmental footprint.
Please refer to our Sustainability Report on Pages 52 to 81.
Core Businesses
Our core businesses of Banking, Wealth Management and Insurance are our key growth drivers. Drawing on OCBC’s competitive strength as a leading, well-diversified financial services Group, we comprehensively serve individual customers through their life stages and corporate customers across their business life cycles.
Core Competencies
Our core competencies are critical for the successful execution of our corporate strategy. We exercise Disciplined Risk Management because our stakeholders trust us to stay safe and sound. With a Diversified Funding Base, sound capital position and robust balance sheet, we have the financial strength to support growth and capture opportunities with confidence. Digital Transformation across our organisation has enabled us to redefine how we engage our customers and deliver greater value to them. This transformation is supported by our Future-Smart Talent, whom we take a structured approach to training and developing.
Corporate Social Responsibility
Our goal is to deliver long-term benefits to the communities where we operate, with a focus on the more vulnerable segments of society and protecting the environment. Besides sponsoring large-scale community projects such as the Singapore Sports Hub and the OCBC Skyway at Gardens by the Bay to promote national identity and bonding, our employees actively volunteer in social work across Singapore, Malaysia, China, Hong Kong and Indonesia. We rally behind families, including children and youths, the elderly and special needs persons and also champion environmental sustainability.

32 OCBC Annual Report 2018
Youth New Families
We provide for consumer customers through every life stage – from the time they are born to their retirement years.
With our Individual Customers Every Step along their Life Journeys
No.1 market share for study loans in Singapore
6 in 10 young professionals aged 23–29 in Singapore bank with OCBC
New to Workforce
Catering to Diverse Customer Needs OCBC Malaysia introduced
OCBC Education Loan reinforcing its position as a market leader in Malaysia for study loans among commercial banks
Upgraded
artificial intelligence- powered chatbot Emma to handle queries on study loans, insurance, investments and OCBC Life Goals financial planning
Launched
mumstruly.com the first holistic website in Singapore offering curated goods and services for pregnant women and young mothers
Serving
8 in 10 families in Singapore with a Child Development Account
Launched Singapore’s
first loyalty alliance programme to consolidate customers loyalty rewards across multiple industries
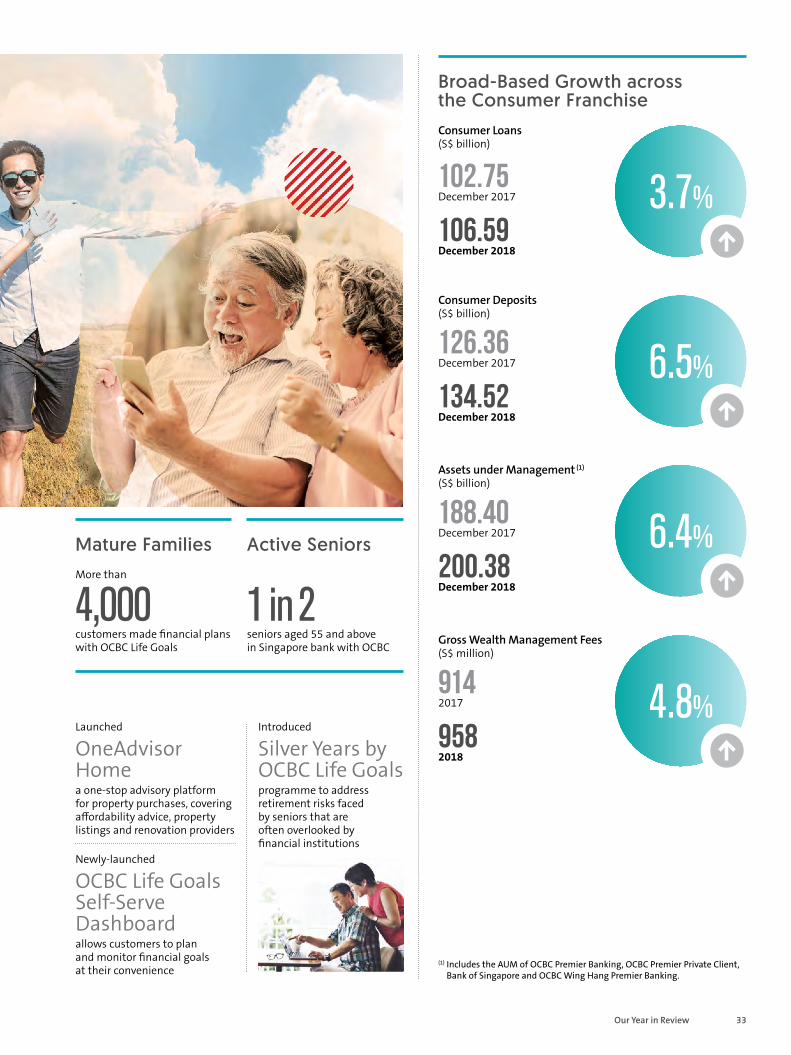
33Our Year in Review
(1) Includes the AUM of OCBC Premier Banking, OCBC Premier Private Client, Bank of Singapore and OCBC Wing Hang Premier Banking.
Consumer Loans (S$ billion)
102.75 December 2017
106.59 December 2018
Consumer Deposits (S$ billion)
126.36 December 2017
134.52 December 2018
Gross Wealth Management Fees (S$ million)
914 2017
958 2018
Broad-Based Growth across the Consumer Franchise
Mature Families Active Seniors
Assets under Management (1) (S$ billion)
188.40 December 2017
200.38 December 2018
More than
4,000 customers made financial plans with OCBC Life Goals
1 in 2 seniors aged 55 and above in Singapore bank with OCBC
Introduced
Silver Years by OCBC Life Goals programme to address retirement risks faced by seniors that are often overlooked by financial institutions
Launched
OneAdvisor Home a one-stop advisory platform for property purchases, covering affordability advice, property listings and renovation providers
Newly-launched
OCBC Life Goals Self-Serve Dashboard allows customers to plan and monitor financial goals at their convenience
3.7%
6.5%
4.8%
6.4%
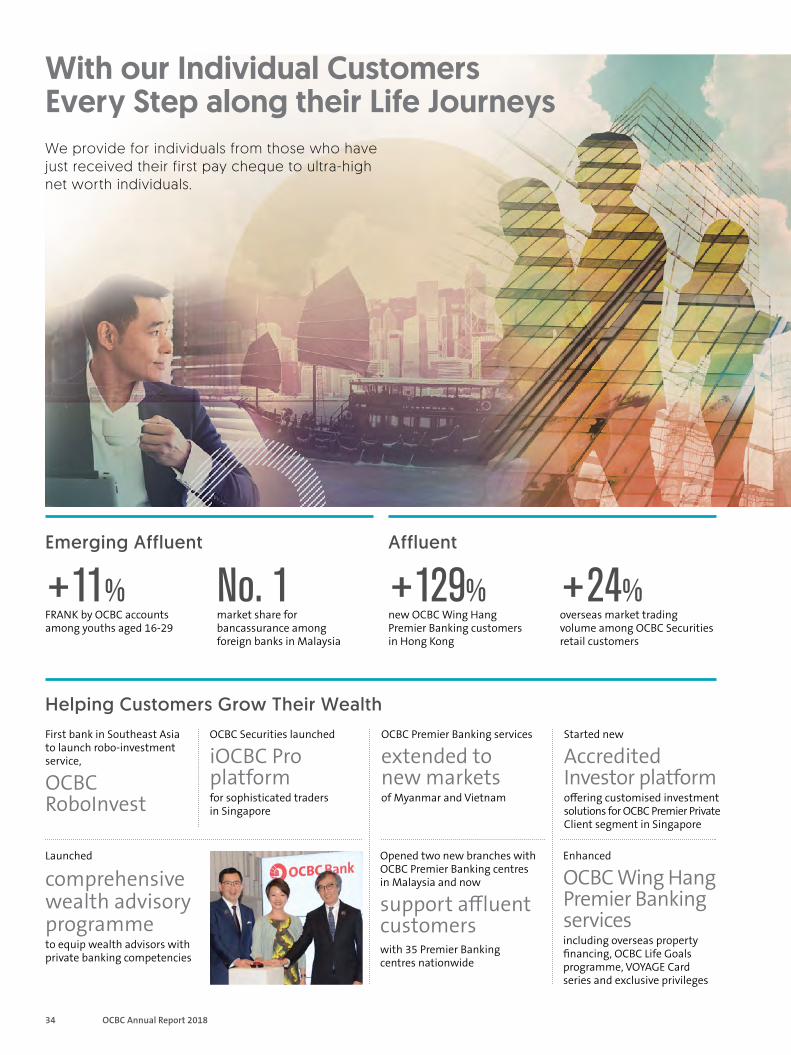
34 OCBC Annual Report 2018
We provide for individuals from those who have just received their first pay cheque to ultra-high net worth individuals.
With our Individual Customers Every Step along their Life Journeys
Emerging Affluent Affluent
+129% new OCBC Wing Hang Premier Banking customers in Hong Kong
+24% overseas market trading volume among OCBC Securities retail customers
First bank in Southeast Asia to launch robo-investment service,
OCBC RoboInvest
OCBC Securities launched
iOCBC Pro platform for sophisticated traders in Singapore
Opened two new branches with OCBC Premier Banking centres in Malaysia and now
support affluent customers with 35 Premier Banking centres nationwide
OCBC Premier Banking services
extended to new markets of Myanmar and Vietnam
Enhanced
OCBC Wing Hang Premier Banking services including overseas property financing, OCBC Life Goals programme, VOYAGE Card series and exclusive privileges
Started new
Accredited Investor platform offering customised investment solutions for OCBC Premier Private Client segment in Singapore
+11% FRANK by OCBC accounts among youths aged 16-29
Helping Customers Grow Their Wealth
Launched
comprehensive wealth advisory programme to equip wealth advisors with private banking competencies
No. 1 market share for bancassurance among foreign banks in Malaysia

35Our Year in Review
High and Ultra High Net Worth
+5% Bank of Singapore assets managed under discretionary portfolio management
S$139b Bank of Singapore assets under management
Challenges We Face
Our Hard Work Recognised
Highest in Retail Banking Customer Satisfaction J.D. Power 2018 Singapore Retail Banking Satisfaction Study OCBC Bank
Excellence in Customer Centricity Retail Banker International Asia Trail Blazer Awards OCBC Bank
Best Private Bank – Middle East and North Africa Asian Private Banker Awards for Distinction Bank of Singapore
International Retail Bank of the Year in Indonesia Asian Banking & Finance Bank OCBC NISP
Ms Danielle Soh (in white), Wealth Management
Product Manager, recognised as Service Excellence Champion
— Second consecutive year an OCBC representative
has been recognised The Association of Banks
in Singapore (ABS) Excellent Service Awards
OCBC Bank
Highest Number of Winners across the
Financial Industry for Four Consecutive Years
The Association of Banks in Singapore (ABS)
Excellent Service Awards OCBC Bank
Market volatility due to trade tensions and geopolitical risks 1 Intensifying price
competition affecting loan and deposit margins 4
Property cooling measures softening property demand 3
Dampened investors sentiment due to moderating economic growth 2 Mounting
investments for regulatory compliance 5
Bank of Singapore signed Memorandum of Understanding to offer investment
opportunities to SMBC Trust Bank clients
Hosted former US President
Barack Obama at moderated forum with 1,000 Bank of Singapore clients
Bank of Singapore set up new
wealth subsidiary in Luxembourg to tap on European market
Bank of the Year — Indonesia The Banker Bank OCBC NISP
Best Bank in Macau Global Finance OCBC Wing Hang
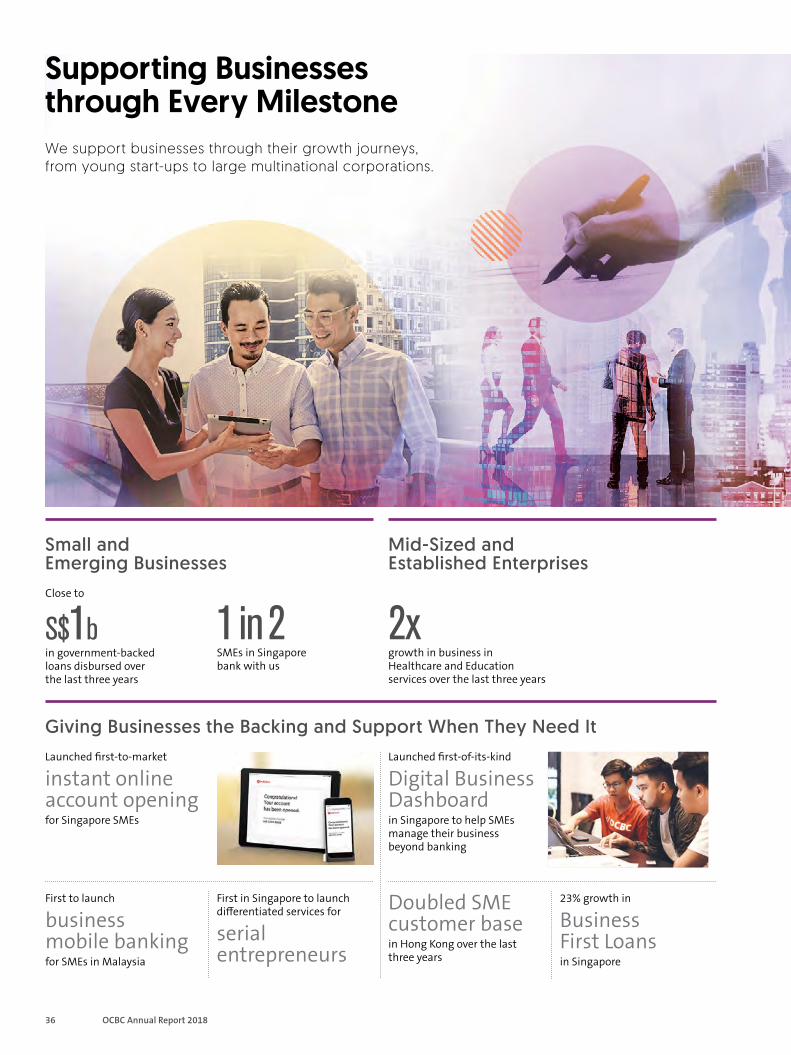
36 OCBC Annual Report 2018
Launched first-of-its-kind
Digital Business Dashboard in Singapore to help SMEs manage their business beyond banking
We support businesses through their growth journeys, from young start-ups to large multinational corporations.
Supporting Businesses through Every Milestone
Small and Emerging Businesses
Mid-Sized and Established Enterprises
2x growth in business in Healthcare and Education services over the last three years
Close to
S$1b in government-backed loans disbursed over the last three years
1 in 2 SMEs in Singapore bank with us
Launched first-to-market
instant online account opening for Singapore SMEs
First in Singapore to launch differentiated services for
serial entrepreneurs
First to launch
business mobile banking for SMEs in Malaysia
Giving Businesses the Backing and Support When They Need It
23% growth in
Business First Loans in Singapore
Doubled SME customer base in Hong Kong over the last three years
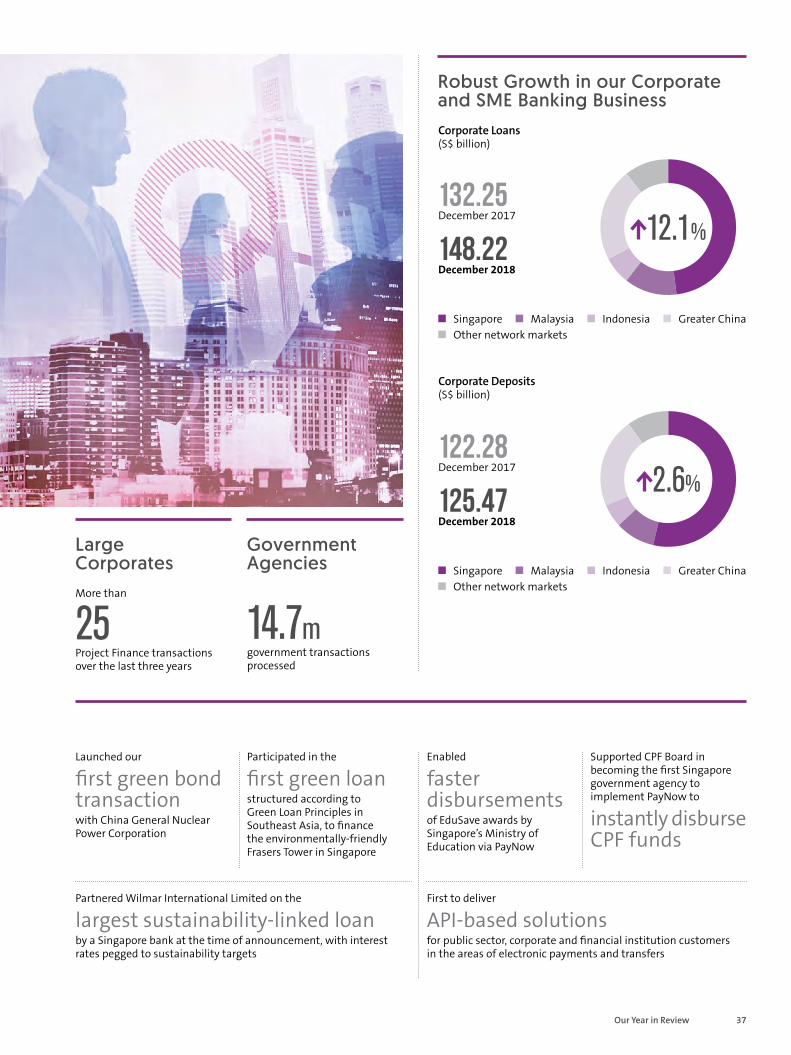
37Our Year in Review
Robust Growth in our Corporate and SME Banking Business Corporate Loans (S$ billion)
Large Corporates
Government Agencies
More than
25 Project Finance transactions over the last three years
14.7m government transactions processed
Launched our
first green bond transaction with China General Nuclear Power Corporation
Participated in the
first green loan structured according to Green Loan Principles in Southeast Asia, to finance the environmentally-friendly Frasers Tower in Singapore
Enabled
faster disbursements of EduSave awards by Singapore’s Ministry of Education via PayNow
Supported CPF Board in becoming the first Singapore government agency to implement PayNow to
instantly disburse CPF funds
Partnered Wilmar International Limited on the
largest sustainability-linked loan by a Singapore bank at the time of announcement, with interest rates pegged to sustainability targets
First to deliver
API-based solutions for public sector, corporate and financial institution customers in the areas of electronic payments and transfers
132.25 December 2017
148.22 December 2018
12.1%
Singapore Malaysia Indonesia Greater China Other network markets
Corporate Deposits (S$ billion)
Singapore Malaysia Indonesia Greater China Other network markets
122.28 December 2017
125.47 December 2018
2.6%
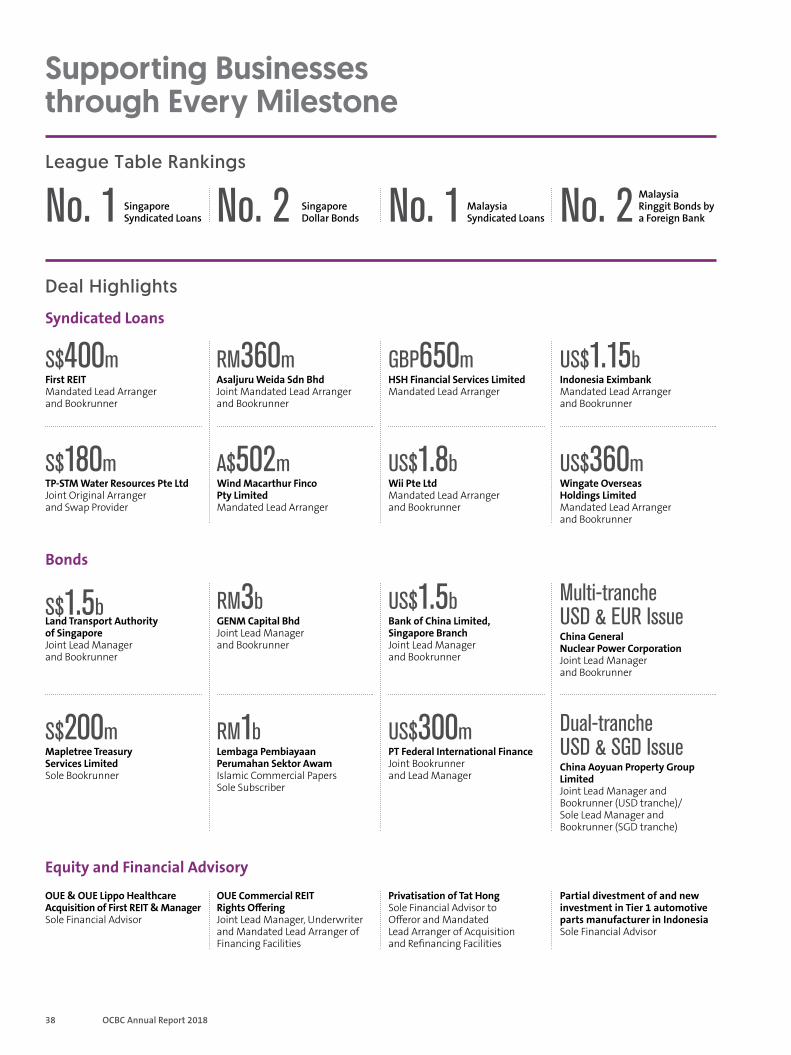
38 OCBC Annual Report 2018
Supporting Businesses through Every Milestone
League Table Rankings
Deal Highlights
S$400m First REIT Mandated Lead Arranger and Bookrunner
Syndicated Loans
S$180m TP-STM Water Resources Pte Ltd Joint Original Arranger and Swap Provider
A$502m Wind Macarthur Finco Pty Limited Mandated Lead Arranger
GBP650m HSH Financial Services Limited Mandated Lead Arranger
US$1.8b Wii Pte Ltd Mandated Lead Arranger and Bookrunner
US$1.15b Indonesia Eximbank Mandated Lead Arranger and Bookrunner
US$360m Wingate Overseas Holdings Limited Mandated Lead Arranger and Bookrunner
RM360m Asaljuru Weida Sdn Bhd Joint Mandated Lead Arranger and Bookrunner
Equity and Financial Advisory
OUE & OUE Lippo Healthcare Acquisition of First REIT & Manager Sole Financial Advisor
Partial divestment of and new investment in Tier 1 automotive parts manufacturer in Indonesia Sole Financial Advisor
OUE Commercial REIT Rights Offering Joint Lead Manager, Underwriter and Mandated Lead Arranger of Financing Facilities
Privatisation of Tat Hong Sole Financial Advisor to Offeror and Mandated Lead Arranger of Acquisition and Refinancing Facilities
Bonds
S$1.5b Land Transport Authority of Singapore Joint Lead Manager and Bookrunner
S$200m Mapletree Treasury Services Limited Sole Bookrunner
RM3b GENM Capital Bhd Joint Lead Manager and Bookrunner
RM1b Lembaga Pembiayaan Perumahan Sektor Awam Islamic Commercial Papers Sole Subscriber
US$1.5b Bank of China Limited, Singapore Branch Joint Lead Manager and Bookrunner
Dual-tranche USD & SGD Issue China Aoyuan Property Group Limited Joint Lead Manager and Bookrunner (USD tranche)/ Sole Lead Manager and Bookrunner (SGD tranche)
Multi-tranche USD & EUR Issue China General Nuclear Power Corporation Joint Lead Manager and Bookrunner
US$300m PT Federal International Finance Joint Bookrunner and Lead Manager
Singapore Dollar Bonds No. 2 Malaysia
Ringgit Bonds by a Foreign Bank No. 2 Singapore
Syndicated Loans No. 1 Malaysia Syndicated Loans No. 1
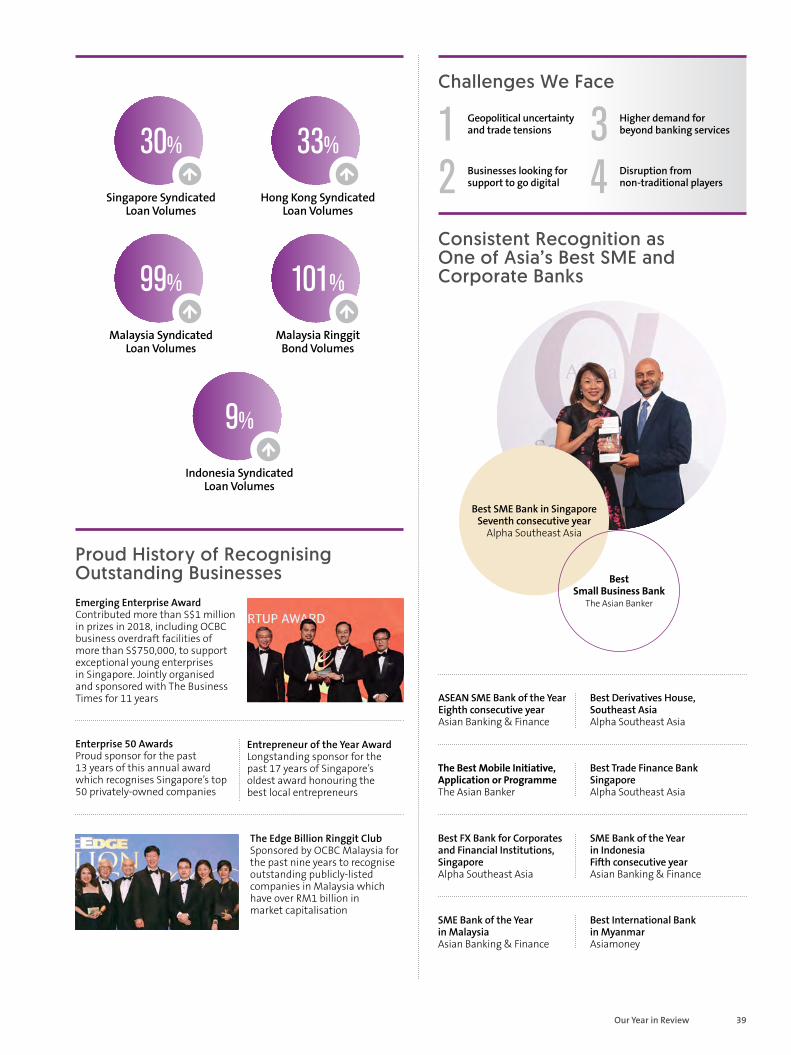
39Our Year in Review
Consistent Recognition as One of Asia’s Best SME and Corporate Banks
Challenges We Face
Proud History of Recognising Outstanding Businesses
Best Trade Finance Bank Singapore Alpha Southeast Asia
Best Derivatives House, Southeast Asia Alpha Southeast Asia
SME Bank of the Year in Indonesia Fifth consecutive year Asian Banking & Finance
ASEAN SME Bank of the Year Eighth consecutive year Asian Banking & Finance
SME Bank of the Year in Malaysia Asian Banking & Finance
The Best Mobile Initiative, Application or Programme The Asian Banker
Best International Bank in Myanmar Asiamoney
Geopolitical uncertainty and trade tensions 1 Higher demand for
beyond banking services 3Businesses looking for support to go digital 2 Disruption from
non-traditional players 4
Emerging Enterprise Award Contributed more than S$1 million in prizes in 2018, including OCBC business overdraft facilities of more than S$750,000, to support exceptional young enterprises in Singapore. Jointly organised and sponsored with The Business Times for 11 years
Enterprise 50 Awards Proud sponsor for the past 13 years of this annual award which recognises Singapore’s top 50 privately-owned companies
Entrepreneur of the Year Award Longstanding sponsor for the past 17 years of Singapore’s oldest award honouring the best local entrepreneurs
The Edge Billion Ringgit Club Sponsored by OCBC Malaysia for the past nine years to recognise outstanding publicly-listed companies in Malaysia which have over RM1 billion in market capitalisation
Best FX Bank for Corporates and Financial Institutions, Singapore Alpha Southeast Asia
Singapore Syndicated Loan Volumes
Malaysia Syndicated Loan Volumes
Hong Kong Syndicated Loan Volumes
Malaysia Ringgit Bond Volumes
30%
99%
33%
101%
Indonesia Syndicated Loan Volumes
9%
Best SME Bank in Singapore Seventh consecutive year
Alpha Southeast Asia
Best Small Business Bank
The Asian Banker

40 OCBC Annual Report 2018
We believe the best investment we can make is in our employees, developing and training them to not just do their jobs better, but prepare them for the jobs of the future.
Developing Future-Smart Talent
Nurturing more than
29,000 employees worldwide
More than
5,500 learning and development programmes
Average
6.3 days of learning for each employee
About
1 in 8jobs filled internally
Bringing the Best out of our PeopleMore than
3,300 employees participated in activities at innovation pods
More than
15,000 challenges completed via the Future Smart app
More than
1,200 employees enrolled for workshops and talks
MentorMe programme arranges for mid-career women to be mentored by senior bank leaders
More than 2,000 OCBC Malaysia employees took part in
Learning Week attending programmes in disruptive technologies, artificial intelligence, big data, fintech and augmented reality
About 400 employees in Indonesia attended digital training programmes as part of Bank OCBC NISP’s
Learning Festival
Key Figures
Launched S$20 million
Future Smart Programme to equip all employees with digital skills for the future

41Our Year in Review
Our Hard Work Recognised
More than
11,000 employees completed digital and fintech skills learning programmes
More than
4,300 attendees at Singapore’s Institute of Banking and Finance-accredited programmes
Bringing the Best out of our People
OCBC Executive Development Programme which grooms promising individuals for leadership roles, included an immersion programme in China for the first time for 33 employees
Held week-long
leadership programme for 73 Graduate Talent Programme participants from Singapore, Malaysia, Indonesia and Hong Kong
CEO Quality Award recognises staff who have made exemplary contributions, such as a team from OCBC Wing Hang that redesigned the process of setting up accounts for customers, resulting in turnaround time falling by more than half and contributing to two-fold increase in new-to-bank customers
Renovated Little Skool-House@OCBC Centre and opened a new centre at Tampines Plaza
to improve learning environment and experience of employees’ children
Recognising the importance of family, employees got to
bring their families to workon one day so their loved ones could see where they work
Key Figures Kaplan Professional Award for Best Training, Learning and DevelopmentHRM Awards
Gold – Best Graduate Recruitment Programme Silver – Best Staff Referral Programme In-house Recruitment Team of the YearBest Recruitment Programme for Non-Degree HoldersHuman Resources Asia Recruitment Awards
Gold – Leadership Development, Corporate WellnessHuman Resources magazine HR Excellence AwardsBank of Singapore
Best HR Application (HR in Your Pocket App)The Asian Banker
Recognised for Fair and Progressive Employment Practices, Work-Life ExcellenceTripartite Alliance Award
Gold – Women Empowerment Strategy
Silver – Learning and Development
Bronze – HR Innovation Human Resources magazine
HR Excellence Awards
Ms Elouise Chin recognised as Young HR Talent of the Year
Human Resources magazine HR Excellence Awards
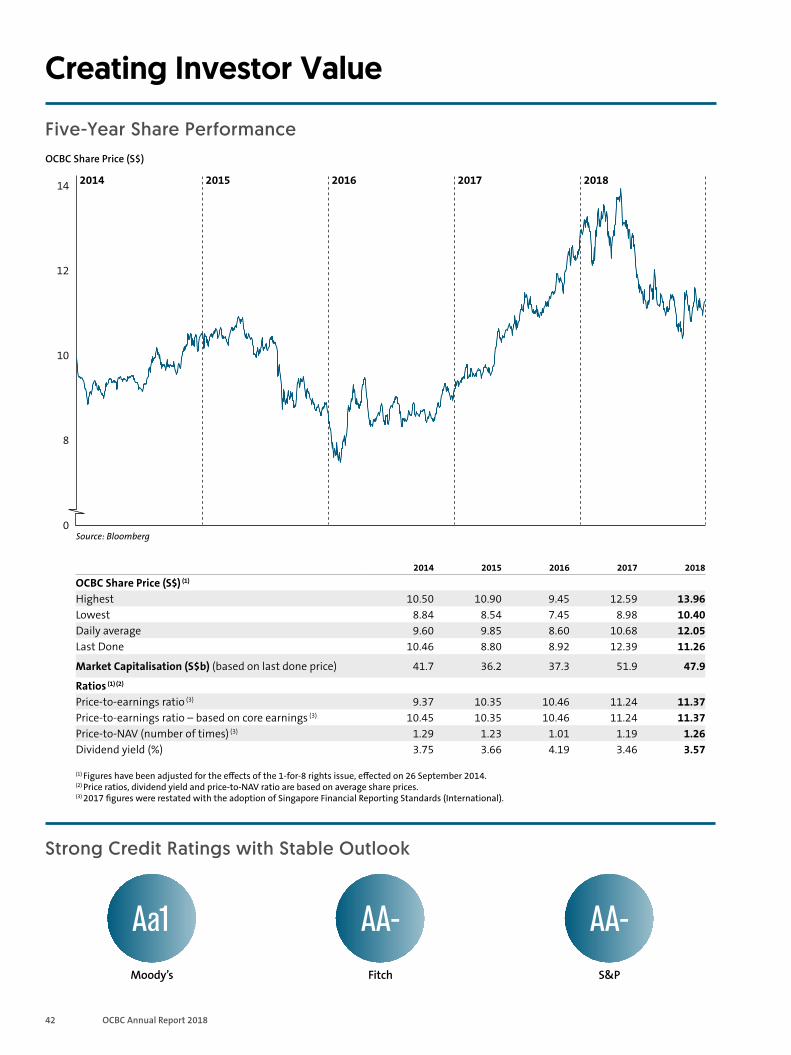
42 OCBC Annual Report 2018
2014 2015 2016 2017 2018
OCBC Share Price (S$) (1)
Highest 10.50 10.90 9.45 12.59 13.96Lowest 8.84 8.54 7.45 8.98 10.40Daily average 9.60 9.85 8.60 10.68 12.05Last Done 10.46 8.80 8.92 12.39 11.26
Market Capitalisation (S$b) (based on last done price) 41.7 36.2 37.3 51.9 47.9
Ratios (1) (2)
Price-to-earnings ratio (3) 9.37 10.35 10.46 11.24 11.37Price-to-earnings ratio – based on core earnings (3) 10.45 10.35 10.46 11.24 11.37Price-to-NAV (number of times) (3) 1.29 1.23 1.01 1.19 1.26Dividend yield (%) 3.75 3.66 4.19 3.46 3.57
(1) Figures have been adjusted for the effects of the 1-for-8 rights issue, effected on 26 September 2014. (2) Price ratios, dividend yield and price-to-NAV ratio are based on average share prices. (3) 2017 figures were restated with the adoption of Singapore Financial Reporting Standards (International).
Creating Investor Value
OCBC Share Price (S$)
Strong Credit Ratings with Stable Outlook
Source: Bloomberg
14
12
10
8
0
Five-Year Share Performance
2018 2017 2016 2015 2014
Moody’s
Aa1
Fitch
AA- S&P
AA-
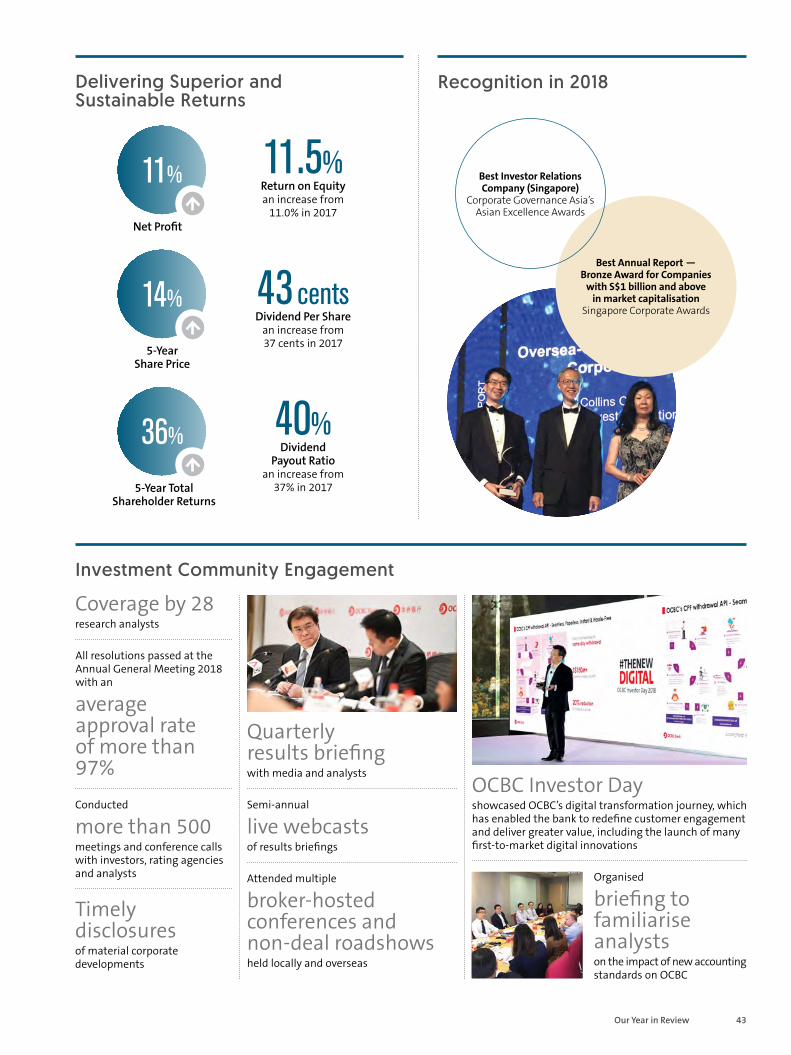
43Our Year in Review
Recognition in 2018 Delivering Superior and Sustainable Returns
Investment Community Engagement
Coverage by 28 research analysts
All resolutions passed at the Annual General Meeting 2018 with an
average approval rate of more than 97%
Best Annual Report — Bronze Award for Companies
with S$1 billion and above in market capitalisation
Singapore Corporate Awards
Best Investor Relations Company (Singapore)
Corporate Governance Asia’s Asian Excellence Awards
11%
Net Profit
36%
5-Year Total Shareholder Returns
14%
5-Year Share Price
Return on Equity an increase from
11.0% in 2017
11.5%
Dividend Payout Ratio
an increase from 37% in 2017
40%
43 cents Dividend Per Share
an increase from 37 cents in 2017
Conducted
more than 500 meetings and conference calls with investors, rating agencies and analysts
Quarterly results briefing with media and analysts
Attended multiple
broker-hosted conferences and non-deal roadshows held locally and overseas
Semi-annual
live webcasts of results briefings
Organised
briefing to familiarise analysts on the impact of new accounting standards on OCBC
OCBC Investor Day showcased OCBC’s digital transformation journey, which has enabled the bank to redefine customer engagement and deliver greater value, including the launch of many first-to-market digital innovations
Timely disclosures of material corporate developments

44 OCBC Annual Report 2018
Caring for our Community and the Environment Our #OCBCCares Programme focuses on helping the more vulnerable in society and doing our part to protect Mother Earth.
Donations
More than
S$1.82m donated in 2018
We invested in programmes that delivered sustainable and long-term benefits by supporting the unserved and under-served segments of the community and expanded efforts to protect the environment 9,910
staff volunteers dedicated
43,248 hours building relationships with communities
We committed talent, time and service to sustainably improve lives through strategic programmes
Volunteers Caring for the Environment
S$87,000 given to six ground-up projects to enhance Singapore’s environmental landscape
We supported ground-up projects which achieved positive outcomes on the environment, ranging from enhanced biodiversity, responsible waste disposal and discouraging single-use plastics to protecting wildlife
1 in 3 gave back to the community
Planted
213 critically-endangered trees and shrubs at Coney Island Park which can approximately offset one year of household carbon emissions for almost 88 persons in Singapore
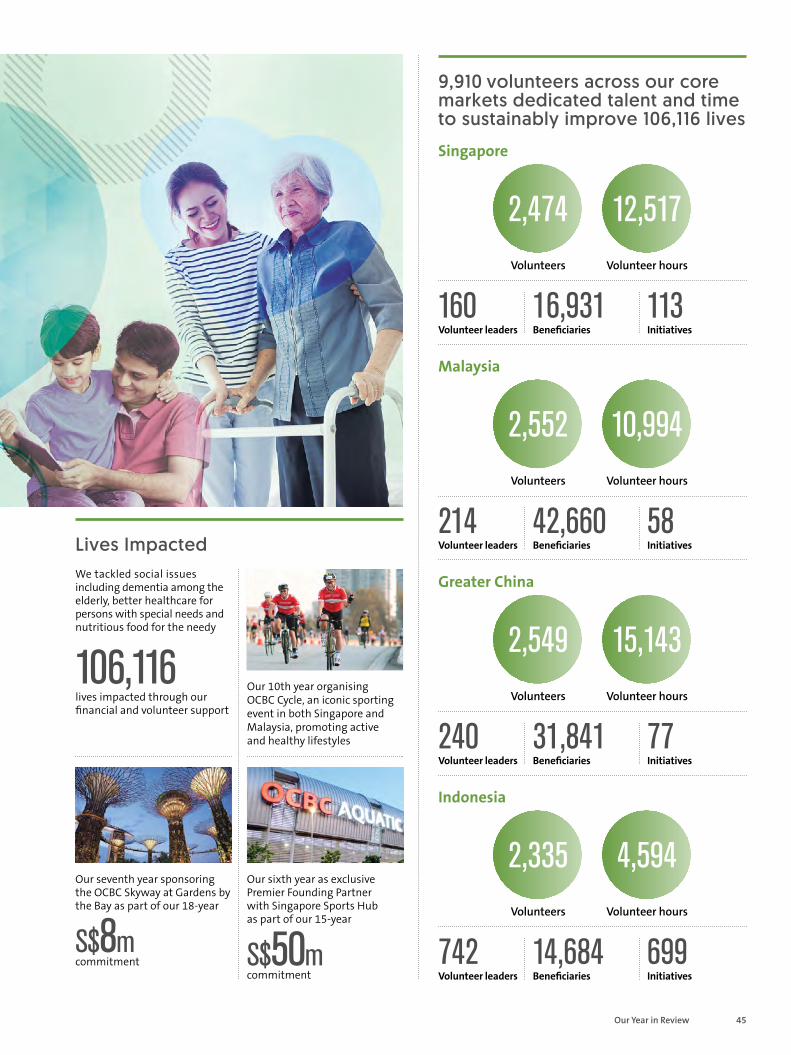
45Our Year in Review
9,910 volunteers across our core markets dedicated talent and time to sustainably improve 106,116 lives
Singapore
Volunteers
2,474 Volunteer hours
12,517
160 Volunteer leaders
16,931 Beneficiaries
113 Initiatives
Malaysia
214 Volunteer leaders
42,660 Beneficiaries
58 Initiatives
Volunteers
2,552 Volunteer hours
10,994
Greater China
240 Volunteer leaders
31,841 Beneficiaries
77 Initiatives
Volunteers
2,549 Volunteer hours
15,143
Indonesia
742 Volunteer leaders
14,684 Beneficiaries
699 Initiatives
Volunteers
2,335 Volunteer hours
4,594
Lives Impacted We tackled social issues including dementia among the elderly, better healthcare for persons with special needs and nutritious food for the needy
106,116 lives impacted through our financial and volunteer support
Our sixth year as exclusive Premier Founding Partner with Singapore Sports Hub as part of our 15-year
S$50m commitment
Our seventh year sponsoring the OCBC Skyway at Gardens by the Bay as part of our 18-year
S$8m commitment
Our 10th year organising OCBC Cycle, an iconic sporting event in both Singapore and Malaysia, promoting active and healthy lifestyles

46 OCBC Annual Report 2018
Caring for our Community and the Environment
Singapore
Caring for the Needy in Society Through our #OCBCCares Programme, we support the unserved and under-served in our communities so that no one falls through the cracks. A total of 947 activities were organised across our core markets to help the elderly, persons with special needs, families, as well as at-risk children and youths.
Mr Ooi Sang Kuang, Chairman, OCBC Bank (far left) and Dr Koh Poh Koon, Senior Minister of State, Ministry of Trade and Industry; and Member of Parliament, Ang Mo Kio GRC (second from left) joined 110 seniors from AWWA and 80 OCBC volunteers at the launch of the OCBC Glowing Years Programme on 4 August 2018.
Combining a fun exercise regime with a compelling incentive scheme, the programme helps vulnerable seniors
improve their motor and cognitive skills to reduce risk of dementia or slow down deterioration
President Halimah Yacob (fourth from left), OCBC Group CEO, Mr Samuel Tsien (second from left) and Patron of the Movement for the Intellectually Disabled of Singapore, Dr Cheong Choong Kong (far right) officially opened the MINDS Developmental Disabilities Medical Clinic on 21 March 2018.
This clinic, which we helped set up, provides early and comprehensive assessments to
help identify health problems and introduce appropriate intervention and treatment
60 volunteers
prepared dinner for 100 seniors from the AWWA Home in Ang Mo Kio
Adding a nostalgic touch, they prepared favourite dishes such as the Ramlee burger and cheng tng dessert
Our LunchTime GiveBack programme was introduced to make it
easier for staff to volunteer during their lunch hour. Since March 2018, more than 800 volunteers have participated in this monthly programme, reaching out to 560 beneficiaries

47Our Year in Review
Malaysia
208 volunteers partnered the Federation of Malaysian Manufacturers in Penang to organise a walk to
raise funds for 4,075 children across 24 charity organisations
34 volunteers visited the Rumah Kasih Hospital in Kuala Lumpur
to bring cheer to homeless and terminally-ill patients who were abandoned by their families
15 volunteers refurbished the facilities at the Sekolah Kebangsaan at Shah Alam to provide a more
conducive learning environment for 97 students with special needs
Mr Pramukti Surjaudaja, President Commissioner of Bank OCBC NISP (fourth from right), greeting needy individuals heading back to their hometowns for the Hari Raya festivities. Bank OCBC NISP provided transportation for those who could not afford the bus fare, and
distributed 6,760 food packages to the disadvantaged in six cities
140 volunteers conducted
money management classes in seven cities, reaching out to close to 3,000 participants, including students and housewives
Hong Kong
52 volunteers from China and Singapore, including CEO of OCBC Wing Hang China, Ms Kng Hwee Tin, reached out to 210 children in Shanghai. Through activity-based lessons, we taught them to look beyond their circumstances
to lead purposeful lives
90 volunteers helped prepare meals at Food Angel, a non-profit soup kitchen and provided
hot meals for 8,400 needy seniors
Indonesia
China
More than 10 volunteers visited the Shanghai Yangjiaoyuan Experimental Primary School regularly over one month to help students improve their
English literacy skills
26 volunteers donated
360 books to Shanghai Yigang Primary School
In a joint community project in Hong Kong, OCBC volunteers from Hong Kong and Singapore
taught students practical tips on money management

48 OCBC Annual Report 2018
Caring for our Community and the Environment Playing our Part in Protecting the Environment When it comes to combating a global concern such as climate change, any single organisation’s efforts alone is not enough. Collective effort and every little bit counts. That’s why we partner government bodies, advocates and citizen groups to promote environmental sustainability efforts that make a real impact.
Singapore
Responsible binning Collected
800kg of plastic bottles and 880kg of fruit peels over three mass sporting events, including OCBC Cycle 2018
Plastic bottles were recycled while fruit peels were distributed to the gardening community to be used as compost
#OCBCCares Fund for the Environment • First private sector-led initiative to provide full financial
support for ground-up projects that help enhance Singapore’s environmental landscape
• S$100,000 committed annually
• Received 28 applications for funding. Applicants’ ages ranged from 20 to 69
• Funded six projects amounting to S$87,000
Enhancing biodiversity Planted
300 trees and shrubs at Sarimbun Scout Camp
Eight months on — Spotted 10 new butterfly species, the rare changeable hawk and white-bellied sea eagle nests
Reducing single-use plastics 10,000 National University of Singapore students across 13 halls and residences now
use reusable containers for daily meals
Protecting wildlife Trained 40 individuals on how
to lead long-tailed macaques back to their natural habitat Conducted
63 outreach programmes for 10,000 people to promote human-wildlife coexistence
Keeping waters clean 80 volunteers on wheels organised 11 trips around the Punggol Waterways
to promote responsible upkeep of the waters

49Our Year in Review
39 volunteers from our Kota Kinabalu branch partnered the Junior Chamber International to rally more than 1,000 individuals to participate in the inaugural charity Shark Runner 2018 event
We also donated RM20,000 to support long-term efforts to protect this declining breed and to discourage shark fin consumption
Malaysia
Habitat enhancement programme at Coney Island Park in Singapore OCBC Group CEO Mr Samuel Tsien (far right), OCBC Head of Group Operations and Technology, Mr Lim Khiang Tong (third from right), Chairman of the Garden City Fund, Professor Leo Tan (second from left) and NParks Assistant CEO, Parks Management and Lifestyle Cluster, Mr Kong Yit San helped plant 213 critically-endangered trees and shrubs on Coney Island
OCBC goes #NoPlastics Doing our part to reduce single-use plastics, we gave more than 6,000 employees in Singapore specially-designed flasks. This can help us
reduce the use of plastic bottles These flasks will also be progressively distributed to all employees in our core markets
18 volunteers
collected more than 180kg of trash along Bagan Lalang beach, Selangor, with more than 100kg being plastics. Effective Microorganisms (EM) mud balls were then thrown into the sea to stop algae growth, break down sludge, suppress pathogens and control ammonia levels in the waters
24 volunteers from our branches in Qingdao and Zhuhai walked along the coastline of Huichang Community beach and Yeli Island
to help clear trash left behind by visitors and passing vessels. They were accompanied by their family members and children, who learnt the significant impact of irresponsible littering on the environment
China
Hong Kong
Chief Executive of Bank of Singapore Hong Kong branch Mr Derrick Tan, (last row, far left), OCBC Group CEO, Mr Samuel Tsien (second from left), CEO of OCBC Wing Hang Mr Na Wu Beng (third from left) and OCBC Bank Regional General Manager for North East Asia Mr Tan Wing Ming (second from right) helped students of Asbury Methodist Primary School
build an aquaponics system
Indonesia Volunteers from Bank OCBC NISP and Great Eastern Life Indonesia, including Ms Mirah Wiryoatmodjo, Director of Bank OCBC NISP (right), joined hands to
install electricity and energy-saving light bulbs in 100 homes and a school in Dusun Cilele, Karawang Region, West Java

50 OCBC Annual Report 2018
Strengthening Community Ties through Cycling Fiestas
OCBC Cycle Singapore
OCBC Cycle in Numbers
More than
6,500 participants, including
764 OCBC Bank employees
S$15,000 raised for charity
The nation’s largest community cycling festival attracted more than 6,500 cycling enthusiasts over 5 and 6 May 2018. They were spoilt for choice between breezing along closed roads on scenic 23-kilometre and 40.8-kilometre routes, heart-pumping competitive races or fun-filled family bonding sessions in the
OCBC Mighty Savers® Kids and Family Ride
Teach a Child to Cycle initiative was extended to 48 youths with special needs, including eight from Hong Kong. After being taught to cycle by volunteers, the youths (pictured here with Emeritus Senior Minister Goh Chok Tong, the patron of Mediacorp Enable Fund, and OCBC Chairman, Mr Ooi Sang Kuang) rode in a special segment at the Singapore Sports Hub
Eight cyclists participated in
Project Training Wheels a programme that provides free cycling lessons to adults who do not know how to cycle, culminating in their successful completion of the 23-kilometre The Straits Times Ride
Companies did their part for the less fortunate through
The Business Times Cycle of Hope About 130 employees from seven companies took part in the race, with over half of the registration fees donated to four meaningful causes A first-of-its-kind collaboration
with a bicycle-sharing platform saw one in five participants utilise on-site bicycles rent-free

51Our Year in Review
OCBC Cycle Singapore OCBC Cycle Kuala Lumpur
OCBC Cycle in Numbers
More than
2,000 participants
including over
300 OCBC Bank employees
More than 2,000 cyclists from
all walks of life converged in the heart of Kuala Lumpur, Malaysia, on 11 November 2018 for the fourth edition of OCBC Cycle Kuala Lumpur
The event celebrated its
Cycle Together theme with a new category for increasingly popular fat bikes, alongside the usual ones for road bikes, mountain bikes and foldies
A total of 23 teams from 18 companies vied for the coveted Champions’ Jersey in a new category,
the OCBC Cycle Corporate Chase The unique format saw each team of four cyclists complete the 40.8-kilometre The Sportive Ride route, with Singapore Civil Defence Force (SCDF) Team B powering to victory
The fourth edition of the OCBC Cycle Speedway
Southeast Asia Championship featured plenty of drama and suspense, with Myanmar emerging victorious from a talented line-up of seven other countries
The 42-kilometre route took cyclists past some of the capital’s most
iconic landmarks including the Petronas Twin Towers, Sultan Abdul Samad Building and the National Mosque
In the OCBC Cycle Speedway
Club Championship 15 teams representing 12 prestigious clubs in Singapore fought for top honours, and Specialized Roval Mavericks Team 1 reclaimed their throne as the top cycling team in Singapore
OCBC Cycle Singapore features a competitive element for national and amateur cyclists alike in the form of
OCBC Cycle Speedway Championships

52 OCBC Annual Report 2018
Creating Sustainable Value and Inspiring a Better Future
Sustainability Report 2018
About This Report
Approach to Reporting At OCBC, reporting is an important mechanism that demonstrates transparency and accountability to our stakeholders. Through our report, we hope to be responsive to stakeholders’ interests and concerns, in order to build mutual understanding, trust and respect. Furthermore, the reporting process is part of our management approach to sustainability, supporting our efforts to drive continuous improvement across our business.
Scope of the Report This is our second annual Sustainability Report. It covers the operations of the OCBC Group globally except for Great Eastern Holdings, a separately-listed subsidiary that publishes its independent sustainability report in accordance with the requirements of SGX-ST Listing Rules. The contents of this report focus on the activities carried out within the financial year ending 31 December 2018. Where applicable, data from previous financial years have been included for comparison and to show our performance over time. While we value consistency, we also strive to improve our approach to reporting year on year. As such, in 2018, we updated our material Environmental, Social and Governance (ESG) factors, described on page 55, to better communicate our management of the sustainability agenda.
Reporting Framework We have adopted the Global Reporting Initiative (GRI) Standards as our reporting framework. This report has been prepared in accordance with GRI Standards: Core option and GRI G4 Financial Services Sector Disclosures. This includes adhering to the GRI principles for defining report content:
• Sustainability context • Stakeholder inclusiveness
• Materiality • Completeness
We have also referenced the primary components detailed in the Singapore Exchange (SGX) Listing Rules guide for sustainability reporting.
Data and External Assurance While the data included in this report has undergone a rigorous review as part of our internal processes, we have not sought external assurance for this reporting period.
53Sustainability Report 2018
About This Report
Contents
Board Statement
Our Approach to Sustainability • Our Sustainability Framework • The Sustainable Development Goals (SDGs) • Our Sustainability Governance Structure • Our Materiality Assessment Process • Stakeholder Engagement
Putting Customers First • Customer Experience • Financial Inclusion • Digitalisation
Acting with Integrity • Strong Governance • Fair Dealing • Responsible and Sustainable Financing • Combating Financial Crimes and Cyber Threats
Valuing our People • Inclusive Workforce • Talent Management and Retention
Engaging Communities • Economic Contributions • Community Development
Being Environmentally Responsible • Environmental Footprint
GRI Standards Content Index
54
55 55 56 58 59 60
62 62 63 64
66 66 67 68 70
72 72 76
78 78 79
80 80
287
Contact We welcome your feedback and suggestions at [email protected].

54 OCBC Annual Report 2018
Board Statement Sustainability Report 2018
Welcome to our second annual Sustainability Report. As a sustainable and responsible organisation, we seek to provide stakeholders with a better understanding of our business and our approach to creating long-term value. Our report provides a clear presentation of OCBC’s sustainability strategy and of its Environmental, Social and Governance (ESG) performance.
The Board considers sustainability to be an integral part of OCBC’s long-term strategy formulation and is responsible for overseeing the integration of sustainable practices across the business. We evaluate potential ESG factors to determine which are material and relevant against the backdrop of a changing business landscape and our key business developments. Accordingly, 12 material ESG factors have been identified as relevant to our business operations and stakeholders.
In 2018, we developed a Sustainability Framework, which provides a clear vision of what sustainability means to us at OCBC, reinforcing it within our culture and entrenching it within our corporate DNA. We believe that adopting the framework and using it to improve our business practices will create long-term value for our investors and shareholders.
The Sustainability Framework builds on our past efforts by articulating our ambitions through five pillars:
• Putting customers first • Acting with integrity • Valuing our people
• Engaging communities • Being environmentally
responsible
Using this framework as a blueprint, we want to create a healthy society for future generations and are committed to supporting the United Nations Sustainable Development Goals (SDGs). In this regard, we recognise the unique role we play in helping to achieve the SDGs and in promoting sustainable development. We have identified five SDGs that are most consistent with our ESG factors and business. These five SDGs, we believe, will enable the Bank to create a long-term, positive impact for our customers, employees, investors and society. Fundamental to this is the financing of energy solutions that enable the necessary transition to a low-carbon economy. Our goal is to reduce new financing of coal-fired power plants, while increasing the percentage of clean and renewable energy in our portfolio. This, again, is aligned to our Purpose and corporate values.
In this year’s report, we are particularly proud of the milestones reached in 2018. These include further enhancing our responsible and sustainable approach to finance, recent successes in our digital transformation across all departments, our award-winning schemes to train and equip our employees for the future, and our achievements in supporting the community and the environment through the #OCBCCares Programme.
We hope that this report provides a clear and realistic account of our approach to managing sustainability and our performance. Together with the Board, our Management remains committed to enhancing our practices over time.
Sustainability at OCBC is not just about doing good. It is about investing in a better future for our business and making a positive and lasting impact on society, driven by our Purpose and our six corporate values. This has guided the way we do business for the past 86 years and enabled us to adapt effectively to an ever-evolving operating environment.
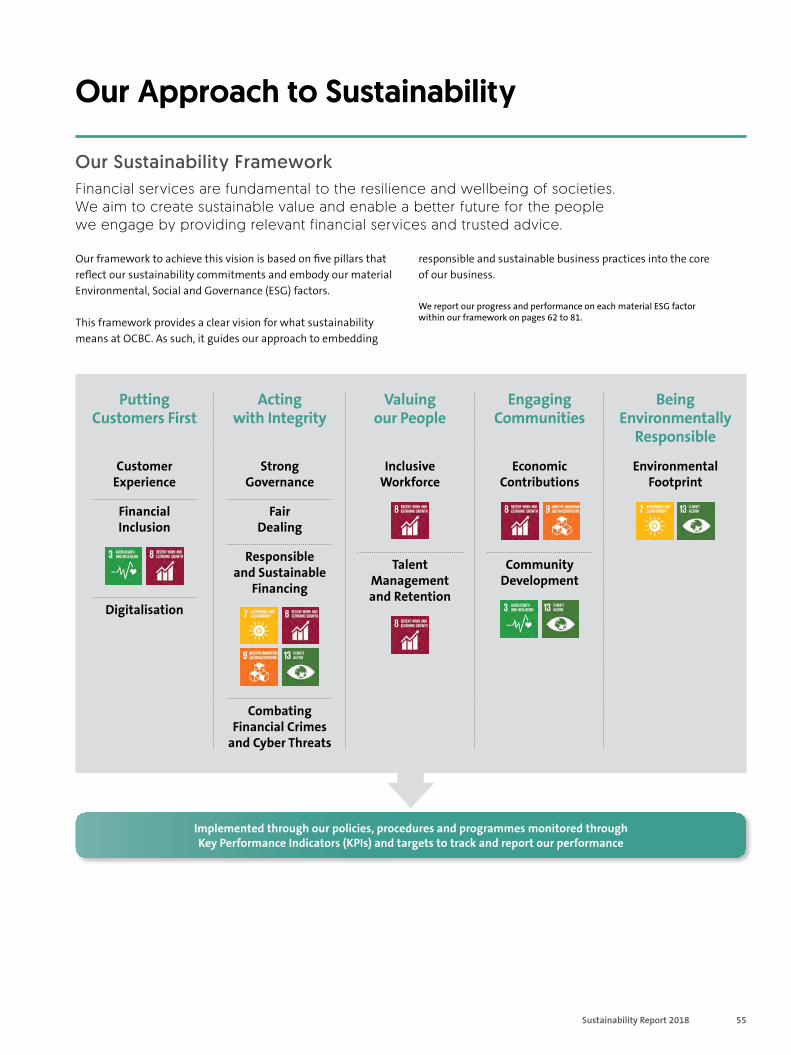
55Sustainability Report 2018
Our Approach to Sustainability
Our Sustainability Framework Financial services are fundamental to the resilience and wellbeing of societies. We aim to create sustainable value and enable a better future for the people we engage by providing relevant financial services and trusted advice.
Our framework to achieve this vision is based on five pillars that reflect our sustainability commitments and embody our material Environmental, Social and Governance (ESG) factors.
This framework provides a clear vision for what sustainability means at OCBC. As such, it guides our approach to embedding
responsible and sustainable business practices into the core of our business.
We report our progress and performance on each material ESG factor within our framework on pages 62 to 81.
Putting Customers First
Customer Experience
Financial Inclusion
Digitalisation
Acting with Integrity
Strong Governance
Fair Dealing
Responsible and Sustainable
Financing
Combating Financial Crimes
and Cyber Threats
Valuing our People
Inclusive Workforce
Talent Management and Retention
Engaging Communities
Economic Contributions
Community Development
Being Environmentally
Responsible
Environmental Footprint
Implemented through our policies, procedures and programmes monitored through Key Performance Indicators (KPIs) and targets to track and report our performance
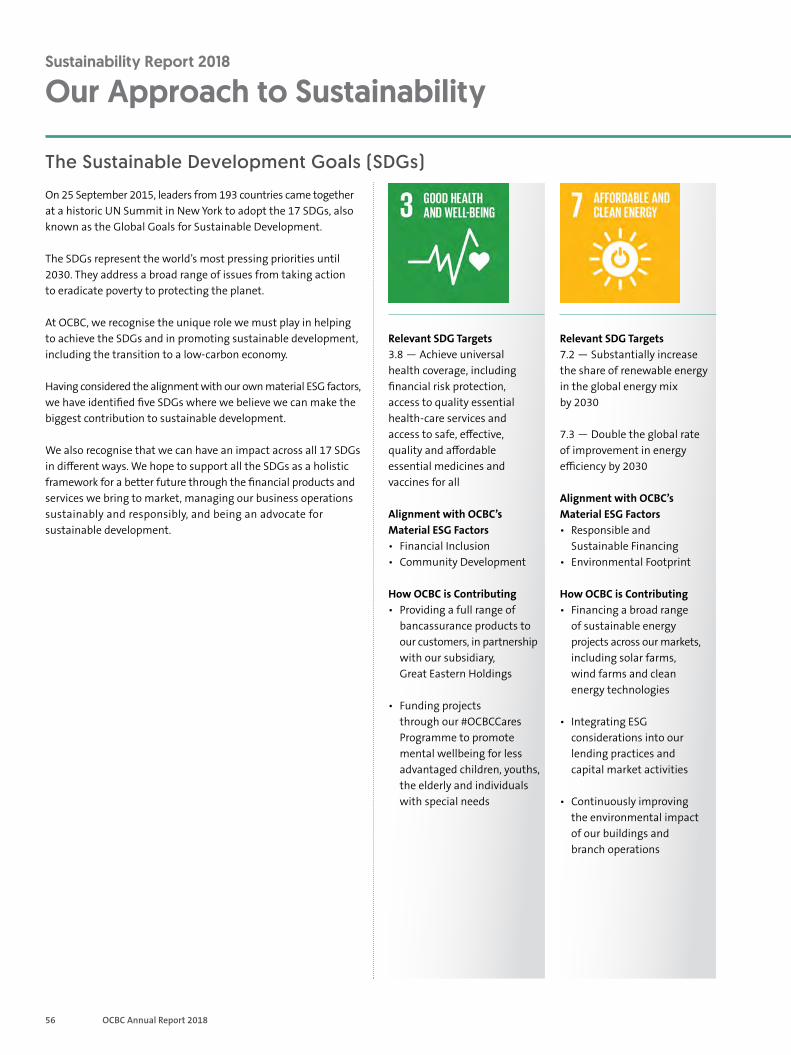
56 OCBC Annual Report 2018
Sustainability Report 2018
Our Approach to Sustainability
The Sustainable Development Goals (SDGs)
On 25 September 2015, leaders from 193 countries came together at a historic UN Summit in New York to adopt the 17 SDGs, also known as the Global Goals for Sustainable Development.
The SDGs represent the world’s most pressing priorities until 2030. They address a broad range of issues from taking action to eradicate poverty to protecting the planet.
At OCBC, we recognise the unique role we must play in helping to achieve the SDGs and in promoting sustainable development, including the transition to a low-carbon economy.
Having considered the alignment with our own material ESG factors, we have identified five SDGs where we believe we can make the biggest contribution to sustainable development.
We also recognise that we can have an impact across all 17 SDGs in different ways. We hope to support all the SDGs as a holistic framework for a better future through the financial products and services we bring to market, managing our business operations sustainably and responsibly, and being an advocate for sustainable development.
Relevant SDG Targets 7.2 — Substantially increase the share of renewable energy in the global energy mix by 2030
7.3 — Double the global rate of improvement in energy efficiency by 2030
Alignment with OCBC’s Material ESG Factors • Responsible and
Sustainable Financing • Environmental Footprint
How OCBC is Contributing • Financing a broad range
of sustainable energy projects across our markets, including solar farms, wind farms and clean energy technologies
• Integrating ESG considerations into our lending practices and capital market activities
• Continuously improving the environmental impact of our buildings and branch operations
Relevant SDG Targets 3.8 — Achieve universal health coverage, including financial risk protection, access to quality essential health-care services and access to safe, effective, quality and affordable essential medicines and vaccines for all
Alignment with OCBC’s Material ESG Factors • Financial Inclusion • Community Development
How OCBC is Contributing • Providing a full range of
bancassurance products to our customers, in partnership with our subsidiary, Great Eastern Holdings
• Funding projects through our #OCBCCares Programme to promote mental wellbeing for less advantaged children, youths, the elderly and individuals with special needs
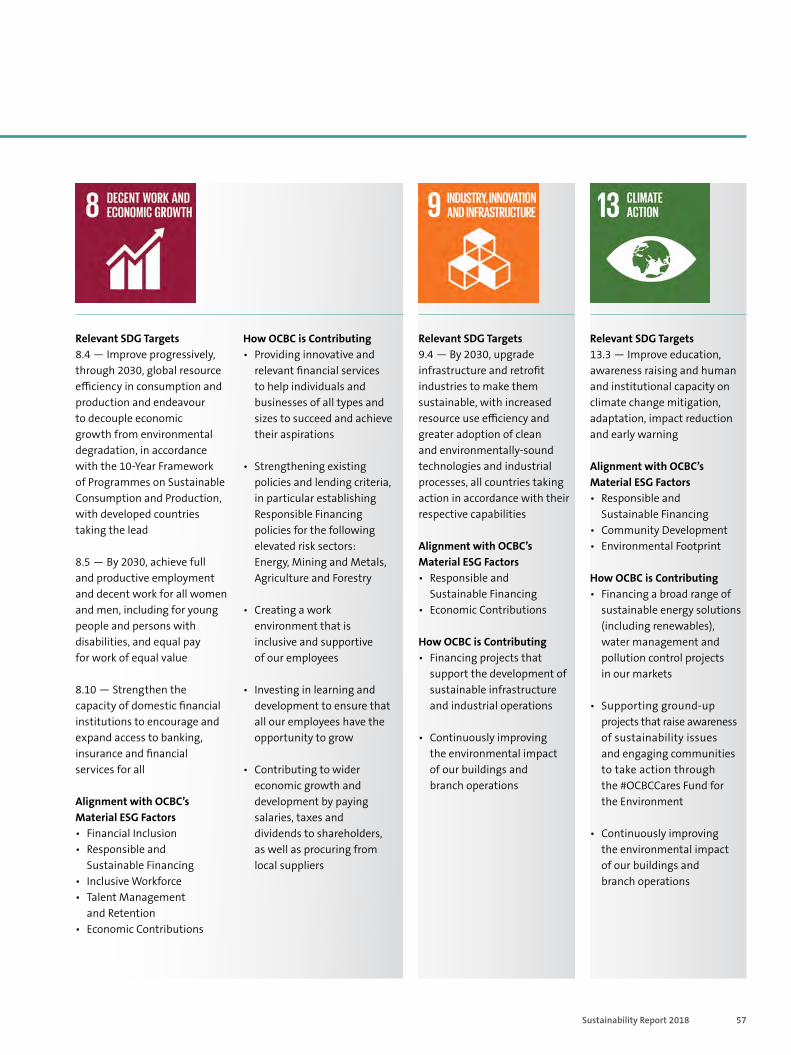
57Sustainability Report 2018
The Sustainable Development Goals (SDGs)
Relevant SDG Targets 8.4 — Improve progressively, through 2030, global resource efficiency in consumption and production and endeavour to decouple economic growth from environmental degradation, in accordance with the 10-Year Framework of Programmes on Sustainable Consumption and Production, with developed countries taking the lead
8.5 — By 2030, achieve full and productive employment and decent work for all women and men, including for young people and persons with disabilities, and equal pay for work of equal value
8.10 — Strengthen the capacity of domestic financial institutions to encourage and expand access to banking, insurance and financial services for all
Alignment with OCBC’s Material ESG Factors • Financial Inclusion • Responsible and
Sustainable Financing • Inclusive Workforce • Talent Management
and Retention • Economic Contributions
How OCBC is Contributing • Providing innovative and
relevant financial services to help individuals and businesses of all types and sizes to succeed and achieve their aspirations
• Strengthening existing policies and lending criteria, in particular establishing Responsible Financing policies for the following elevated risk sectors: Energy, Mining and Metals, Agriculture and Forestry
• Creating a work environment that is inclusive and supportive of our employees
• Investing in learning and development to ensure that all our employees have the opportunity to grow
• Contributing to wider economic growth and development by paying salaries, taxes and dividends to shareholders, as well as procuring from local suppliers
Relevant SDG Targets 9.4 — By 2030, upgrade infrastructure and retrofit industries to make them sustainable, with increased resource use efficiency and greater adoption of clean and environmentally-sound technologies and industrial processes, all countries taking action in accordance with their respective capabilities
Alignment with OCBC’s Material ESG Factors • Responsible and
Sustainable Financing • Economic Contributions
How OCBC is Contributing • Financing projects that
support the development of sustainable infrastructure and industrial operations
• Continuously improving the environmental impact of our buildings and branch operations
Relevant SDG Targets 13.3 — Improve education, awareness raising and human and institutional capacity on climate change mitigation, adaptation, impact reduction and early warning
Alignment with OCBC’s Material ESG Factors • Responsible and
Sustainable Financing • Community Development • Environmental Footprint
How OCBC is Contributing • Financing a broad range of
sustainable energy solutions (including renewables), water management and pollution control projects in our markets
• Supporting ground-up projects that raise awareness of sustainability issues and engaging communities to take action through the #OCBCCares Fund for the Environment
• Continuously improving the environmental impact of our buildings and branch operations
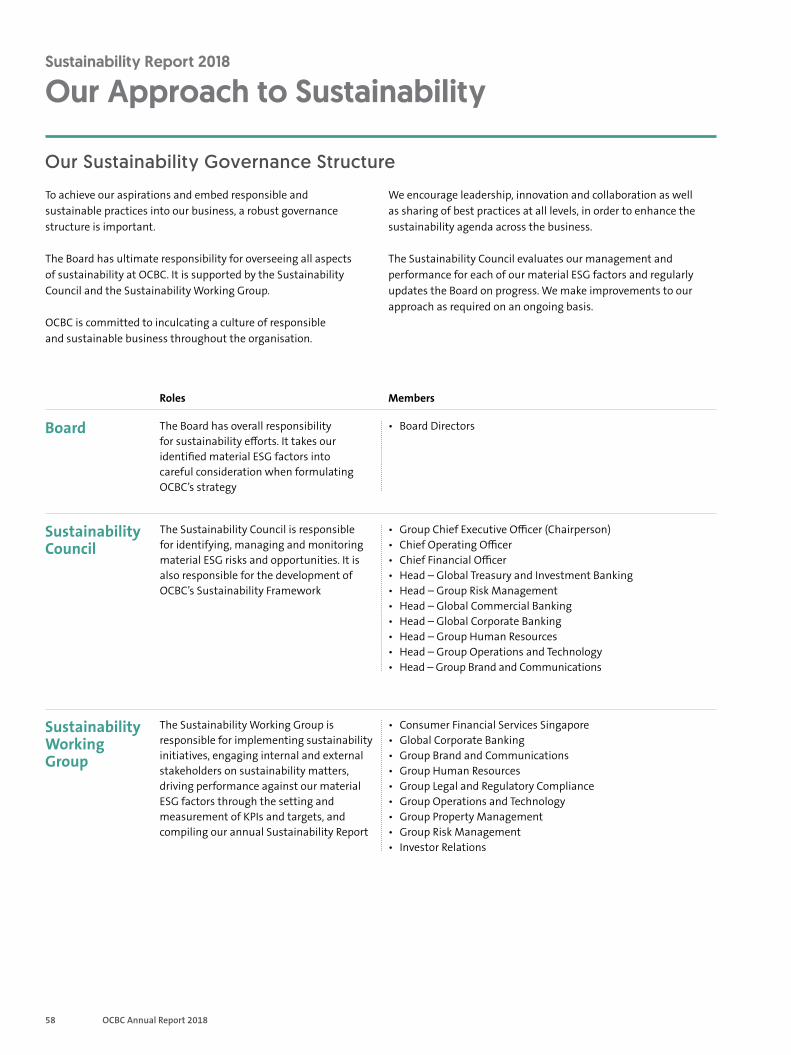
58 OCBC Annual Report 2018
Sustainability Report 2018
Our Approach to Sustainability
Our Sustainability Governance Structure
To achieve our aspirations and embed responsible and sustainable practices into our business, a robust governance structure is important.
The Board has ultimate responsibility for overseeing all aspects of sustainability at OCBC. It is supported by the Sustainability Council and the Sustainability Working Group.
OCBC is committed to inculcating a culture of responsible and sustainable business throughout the organisation.
We encourage leadership, innovation and collaboration as well as sharing of best practices at all levels, in order to enhance the sustainability agenda across the business.
The Sustainability Council evaluates our management and performance for each of our material ESG factors and regularly updates the Board on progress. We make improvements to our approach as required on an ongoing basis.
The Board has overall responsibility for sustainability efforts. It takes our identified material ESG factors into careful consideration when formulating OCBC’s strategy
• Board Directors
The Sustainability Council is responsible for identifying, managing and monitoring material ESG risks and opportunities. It is also responsible for the development of OCBC’s Sustainability Framework
• Group Chief Executive Officer (Chairperson) • Chief Operating Officer • Chief Financial Officer • Head – Global Treasury and Investment Banking • Head – Group Risk Management • Head – Global Commercial Banking • Head – Global Corporate Banking • Head – Group Human Resources • Head – Group Operations and Technology • Head – Group Brand and Communications
The Sustainability Working Group is responsible for implementing sustainability initiatives, engaging internal and external stakeholders on sustainability matters, driving performance against our material ESG factors through the setting and measurement of KPIs and targets, and compiling our annual Sustainability Report
• Consumer Financial Services Singapore • Global Corporate Banking • Group Brand and Communications • Group Human Resources • Group Legal and Regulatory Compliance • Group Operations and Technology • Group Property Management • Group Risk Management • Investor Relations
Members Roles
Board
Sustainability Council
Sustainability Working Group
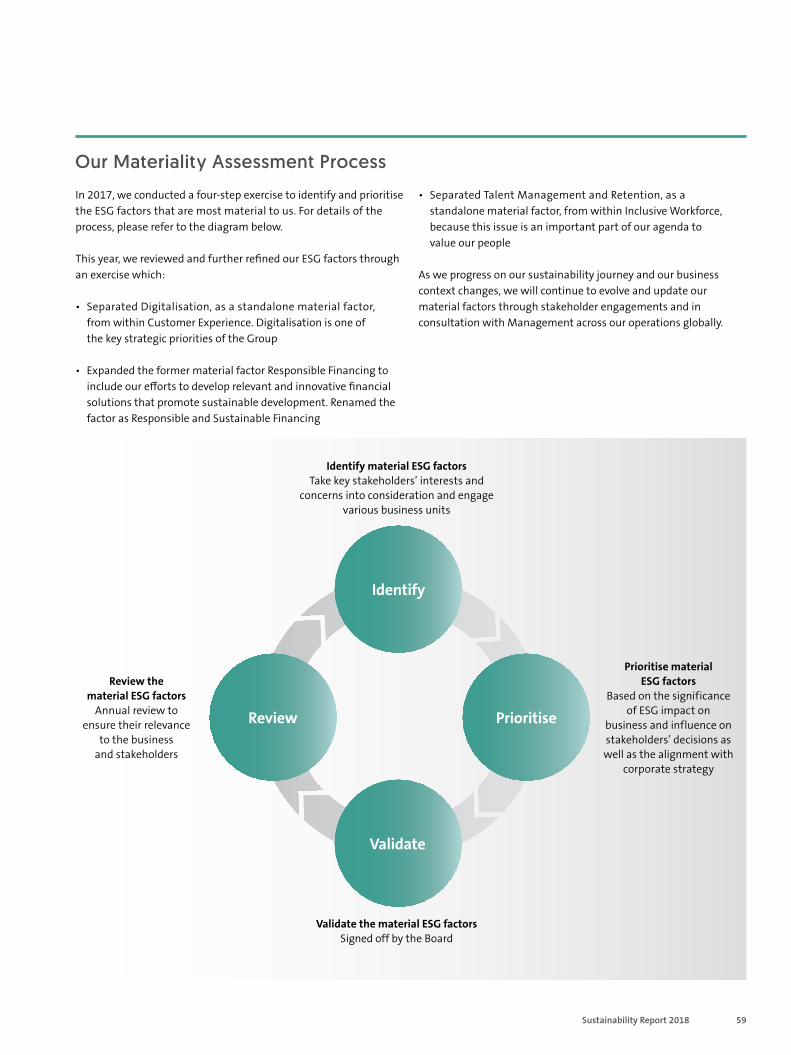
59Sustainability Report 2018
Our Materiality Assessment Process
In 2017, we conducted a four-step exercise to identify and prioritise the ESG factors that are most material to us. For details of the process, please refer to the diagram below.
This year, we reviewed and further refined our ESG factors through an exercise which:
• Separated Digitalisation, as a standalone material factor, from within Customer Experience. Digitalisation is one of the key strategic priorities of the Group
• Expanded the former material factor Responsible Financing to include our efforts to develop relevant and innovative financial solutions that promote sustainable development. Renamed the factor as Responsible and Sustainable Financing
• Separated Talent Management and Retention, as a standalone material factor, from within Inclusive Workforce, because this issue is an important part of our agenda to value our people
As we progress on our sustainability journey and our business context changes, we will continue to evolve and update our material factors through stakeholder engagements and in consultation with Management across our operations globally.
Identify material ESG factors Take key stakeholders’ interests and
concerns into consideration and engage various business units
Validate the material ESG factors Signed off by the Board
Review
Identify
Validate
Prioritise
Prioritise material ESG factors
Based on the significance of ESG impact on
business and influence on stakeholders’ decisions as well as the alignment with
corporate strategy
Review the material ESG factors
Annual review to ensure their relevance
to the business and stakeholders
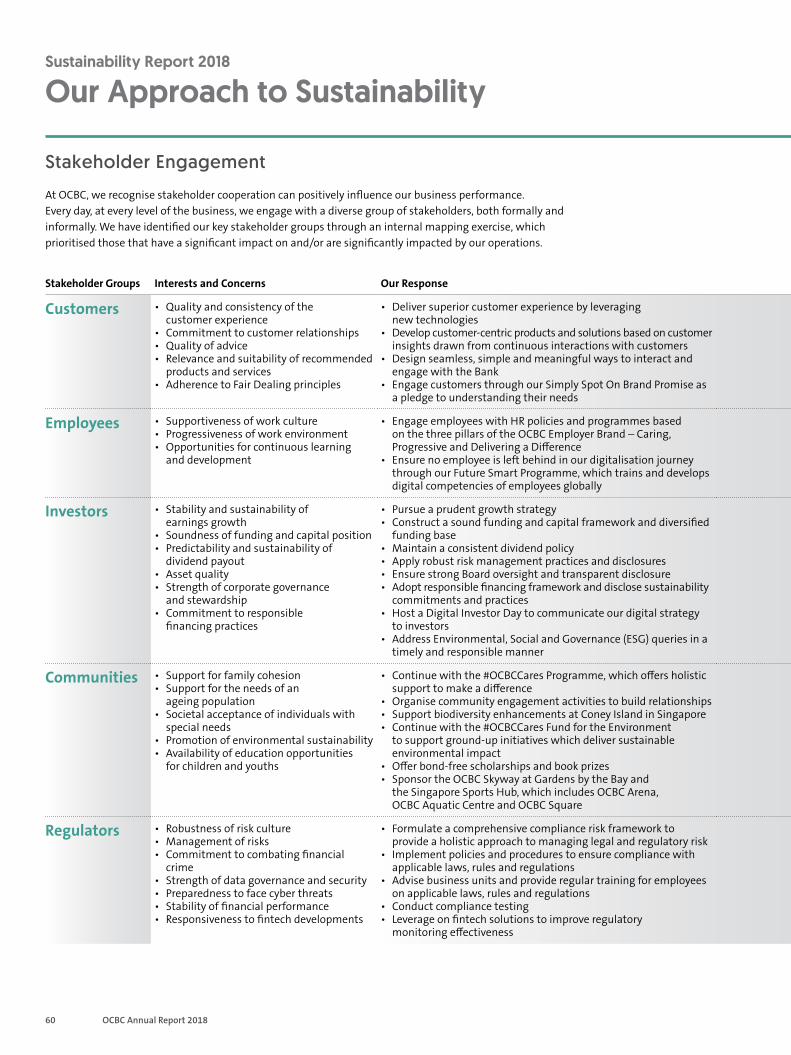
60 OCBC Annual Report 2018
Sustainability Report 2018
Our Approach to Sustainability
Stakeholder Engagement
At OCBC, we recognise stakeholder cooperation can positively influence our business performance. Every day, at every level of the business, we engage with a diverse group of stakeholders, both formally and informally. We have identified our key stakeholder groups through an internal mapping exercise, which prioritised those that have a significant impact on and/or are significantly impacted by our operations.
Stakeholder Groups Interests and Concerns Our Response Engagement Method Frequency
Customers • Quality and consistency of the customer experience
• Commitment to customer relationships• Quality of advice• Relevance and suitability of recommended
products and services• Adherence to Fair Dealing principles
• Deliver superior customer experience by leveraging new technologies
• Develop customer-centric products and solutions based on customer insights drawn from continuous interactions with customers
• Design seamless, simple and meaningful ways to interact and engage with the Bank
• Engage customers through our Simply Spot On Brand Promise as a pledge to understanding their needs
• Surveys, interviews and workshops to better understand our customers and benchmark against competitors
• Customer complaint tracking and problem resolution process/governance • Cross functional projects with focus on the improvement of the
experience and the delivery of our Brand Promise • Active senior engagement in customer experience projects• Employee training programme on human-centered design techniques to
ensure our customers are the focus of the product development process
• Regular interactions with customers through qualitative and quantitative research methods
• Monthly tracking of service level performance across various channels and customer complaints
• Monthly reporting to senior management on customer service excellence
• Annual benchmarking against competitors
Employees • Supportiveness of work culture • Progressiveness of work environment • Opportunities for continuous learning
and development
• Engage employees with HR policies and programmes based on the three pillars of the OCBC Employer Brand – Caring, Progressive and Delivering a Difference
• Ensure no employee is left behind in our digitalisation journey through our Future Smart Programme, which trains and develops digital competencies of employees globally
• Employee Engagement Survey • Quarterly e-mails from Group CEO on OCBC’s accomplishments
and objectives • Divisional town halls • Internal newsletter — OCBC Teller • Focus groups and skip-level sessions to obtain continuous feedback
• Biennial Employee Engagement Survey • Ongoing engagement at division and
department levels
Investors • Stability and sustainability of earnings growth
• Soundness of funding and capital position • Predictability and sustainability of
dividend payout • Asset quality • Strength of corporate governance
and stewardship • Commitment to responsible
financing practices
• Pursue a prudent growth strategy • Construct a sound funding and capital framework and diversified
funding base • Maintain a consistent dividend policy • Apply robust risk management practices and disclosures • Ensure strong Board oversight and transparent disclosure • Adopt responsible financing framework and disclose sustainability
commitments and practices • Host a Digital Investor Day to communicate our digital strategy
to investors • Address Environmental, Social and Governance (ESG) queries in a
timely and responsible manner
• Financial reports and disclosures • Annual Report • Announcements on OCBC Bank’s website • Announcements via SGXNet • Results briefings and webcasts • Annual General Meeting with shareholders • Meetings, conferences and roadshows • Corporate Day
• Quarterly briefing for earnings announcements • Annual Report • Annual General Meeting • Regular meetings with investors
Communities • Support for family cohesion • Support for the needs of an
ageing population • Societal acceptance of individuals with
special needs • Promotion of environmental sustainability • Availability of education opportunities
for children and youths
• Continue with the #OCBCCares Programme, which offers holistic support to make a difference
• Organise community engagement activities to build relationships • Support biodiversity enhancements at Coney Island in Singapore • Continue with the #OCBCCares Fund for the Environment
to support ground-up initiatives which deliver sustainable environmental impact
• Offer bond-free scholarships and book prizes • Sponsor the OCBC Skyway at Gardens by the Bay and
the Singapore Sports Hub, which includes OCBC Arena, OCBC Aquatic Centre and OCBC Square
• Volunteer activities that have strategic long-term impact on beneficiaries and support the environment
• Events that engage the community at large • Collaboration with partner organisations • Evaluation and disbursement of donations and funds to beneficiary
groups and ground-up efforts • Training workshops to help community members apply for funds from
OCBC for ground-up environmental efforts
• Regular disbursement of donations and funds to charity partners and educational institutions
• Regular volunteer activities throughout the year • Annual signature events, including OCBC Cycle and
OCBC Community Day in Singapore, OCBC Cycle in Malaysia and OCBC Wing Hang Little Debate in China
Regulators • Robustness of risk culture • Management of risks • Commitment to combating financial
crime • Strength of data governance and security • Preparedness to face cyber threats • Stability of financial performance • Responsiveness to fintech developments
• Formulate a comprehensive compliance risk framework to provide a holistic approach to managing legal and regulatory risk
• Implement policies and procedures to ensure compliance with applicable laws, rules and regulations
• Advise business units and provide regular training for employees on applicable laws, rules and regulations
• Conduct compliance testing • Leverage on fintech solutions to improve regulatory
monitoring effectiveness
• Regular meetings and consultations with regulators • Representation at industry forums • Regulatory reports • Audit reports
• Ad hoc and regular engagement, as appropriate to circumstances
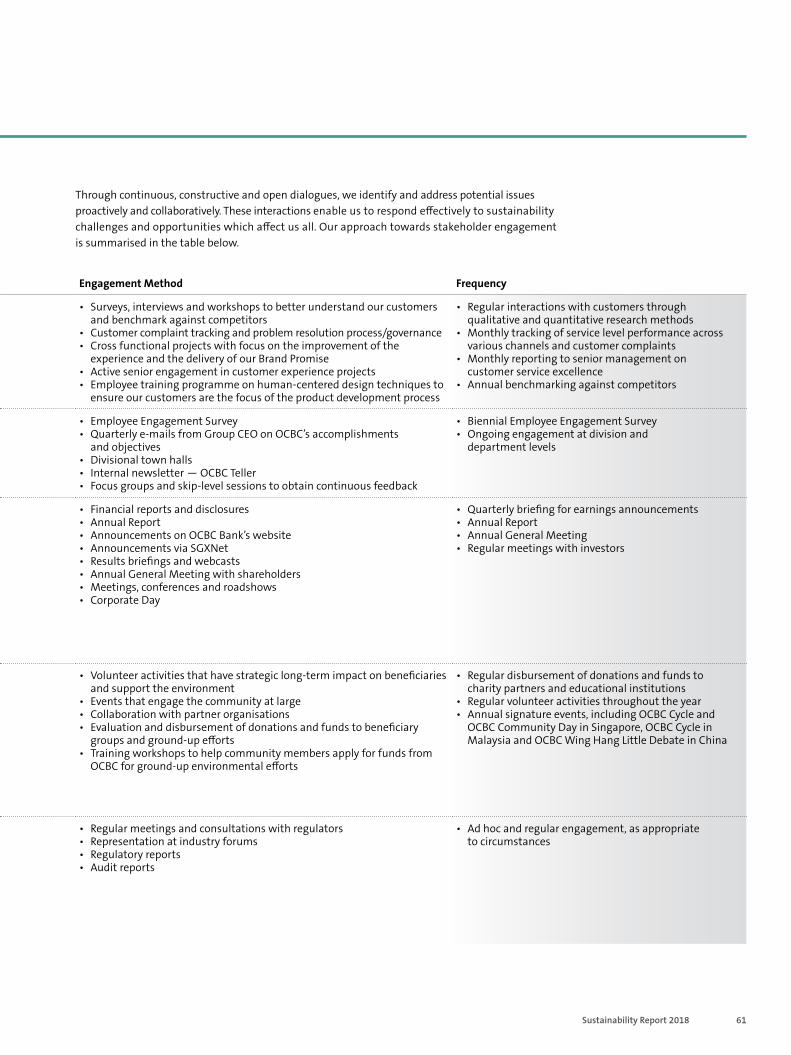
61Sustainability Report 2018
Stakeholder Engagement
Stakeholder Groups Interests and Concerns Our Response Engagement Method Frequency
Customers • Quality and consistency of the customer experience
• Commitment to customer relationships• Quality of advice• Relevance and suitability of recommended
products and services• Adherence to Fair Dealing principles
• Deliver superior customer experience by leveraging new technologies
• Develop customer-centric products and solutions based on customer insights drawn from continuous interactions with customers
• Design seamless, simple and meaningful ways to interact and engage with the Bank
• Engage customers through our Simply Spot On Brand Promise as a pledge to understanding their needs
• Surveys, interviews and workshops to better understand our customers and benchmark against competitors
• Customer complaint tracking and problem resolution process/governance • Cross functional projects with focus on the improvement of the
experience and the delivery of our Brand Promise • Active senior engagement in customer experience projects• Employee training programme on human-centered design techniques to
ensure our customers are the focus of the product development process
• Regular interactions with customers through qualitative and quantitative research methods
• Monthly tracking of service level performance across various channels and customer complaints
• Monthly reporting to senior management on customer service excellence
• Annual benchmarking against competitors
Employees • Supportiveness of work culture • Progressiveness of work environment • Opportunities for continuous learning
and development
• Engage employees with HR policies and programmes based on the three pillars of the OCBC Employer Brand – Caring, Progressive and Delivering a Difference
• Ensure no employee is left behind in our digitalisation journey through our Future Smart Programme, which trains and develops digital competencies of employees globally
• Employee Engagement Survey • Quarterly e-mails from Group CEO on OCBC’s accomplishments
and objectives • Divisional town halls • Internal newsletter — OCBC Teller • Focus groups and skip-level sessions to obtain continuous feedback
• Biennial Employee Engagement Survey • Ongoing engagement at division and
department levels
Investors • Stability and sustainability of earnings growth
• Soundness of funding and capital position • Predictability and sustainability of
dividend payout • Asset quality • Strength of corporate governance
and stewardship • Commitment to responsible
financing practices
• Pursue a prudent growth strategy • Construct a sound funding and capital framework and diversified
funding base • Maintain a consistent dividend policy • Apply robust risk management practices and disclosures • Ensure strong Board oversight and transparent disclosure • Adopt responsible financing framework and disclose sustainability
commitments and practices • Host a Digital Investor Day to communicate our digital strategy
to investors • Address Environmental, Social and Governance (ESG) queries in a
timely and responsible manner
• Financial reports and disclosures • Annual Report • Announcements on OCBC Bank’s website • Announcements via SGXNet • Results briefings and webcasts • Annual General Meeting with shareholders • Meetings, conferences and roadshows • Corporate Day
• Quarterly briefing for earnings announcements • Annual Report • Annual General Meeting • Regular meetings with investors
Communities • Support for family cohesion • Support for the needs of an
ageing population • Societal acceptance of individuals with
special needs • Promotion of environmental sustainability • Availability of education opportunities
for children and youths
• Continue with the #OCBCCares Programme, which offers holistic support to make a difference
• Organise community engagement activities to build relationships • Support biodiversity enhancements at Coney Island in Singapore • Continue with the #OCBCCares Fund for the Environment
to support ground-up initiatives which deliver sustainable environmental impact
• Offer bond-free scholarships and book prizes • Sponsor the OCBC Skyway at Gardens by the Bay and
the Singapore Sports Hub, which includes OCBC Arena, OCBC Aquatic Centre and OCBC Square
• Volunteer activities that have strategic long-term impact on beneficiaries and support the environment
• Events that engage the community at large • Collaboration with partner organisations • Evaluation and disbursement of donations and funds to beneficiary
groups and ground-up efforts • Training workshops to help community members apply for funds from
OCBC for ground-up environmental efforts
• Regular disbursement of donations and funds to charity partners and educational institutions
• Regular volunteer activities throughout the year • Annual signature events, including OCBC Cycle and
OCBC Community Day in Singapore, OCBC Cycle in Malaysia and OCBC Wing Hang Little Debate in China
Regulators • Robustness of risk culture • Management of risks • Commitment to combating financial
crime • Strength of data governance and security • Preparedness to face cyber threats • Stability of financial performance • Responsiveness to fintech developments
• Formulate a comprehensive compliance risk framework to provide a holistic approach to managing legal and regulatory risk
• Implement policies and procedures to ensure compliance with applicable laws, rules and regulations
• Advise business units and provide regular training for employees on applicable laws, rules and regulations
• Conduct compliance testing • Leverage on fintech solutions to improve regulatory
monitoring effectiveness
• Regular meetings and consultations with regulators • Representation at industry forums • Regulatory reports • Audit reports
• Ad hoc and regular engagement, as appropriate to circumstances
Through continuous, constructive and open dialogues, we identify and address potential issues proactively and collaboratively. These interactions enable us to respond effectively to sustainability challenges and opportunities which affect us all. Our approach towards stakeholder engagement is summarised in the table below.
62 OCBC Annual Report 2018
Sustainability Report 2018
Why this is Material to Us Our customers are at the heart of our business. By listening to our customers, understanding their needs and delivering the best products and services, we aim to deliver a superior customer experience. This is fundamental to deepening our engagement and forging enduring relationships with them.
Our Management Approach Being a customer-centric bank and putting customers first is our fundamental philosophy and drives what we do at all levels.
We aim to make banking with OCBC as simple and seamless as possible across all our channels and touchpoints. This starts with a relentless focus on improving our customers’ journey with us.
Improving customers’ journey We employ a variety of techniques to better understand our customers: their needs, behaviours, pain points and use of our products and services. From there, we extract insights that guide the design of the events that customers are exposed to, in order to bank with us in a meaningful and effective way. The same insights are the basis for the development of products and services that address concrete customer needs.
The experience we deliver is closely monitored at both the strategic and operational level. Our Service Excellence Council (SEC) has oversight of our metrics for tracking customer experience and responsibility for setting the high-level strategy. The SEC, chaired by our Group CEO, includes representatives from our business divisions and reports directly to the Board.
Our Performance
Ranked
1st in customer satisfaction ranking for the second year in a row in J.D. Power 2018 Singapore Retail Banking Satisfaction Study
Customer Experience
4 customer compliments received for every customer complaint (OCBC Group)
100% of customer complaints tracked until successful closure; 88% resolved within three working days of receiving the complaint (Singapore)
Our Targets To achieve internal E-B score of 68% for our Singapore Retail Banking in 2019
Awards Highest number of winners across all financial institutions for the fourth consecutive year The Association of Banks in Singapore (ABS) Excellent Service Award (EXSA) OCBC Bank
100% of the 45 personal data-related complaints closed successfully; all eight valid complaints filed with the PDPC resolved satisfactorily without incurring any penalty (Singapore)
Excellence in Customer Centricity Retail Banker International Asia Trail Blazer Awards 2018 OCBC Bank
Selected Policies, Procedures and Programmes
Launching Simply Spot On • A new Brand Promise was launched in 2018 that reflects our commitment to listening to
our customers and understanding their specific needs, to best provide solutions for them
Driving continuous improvement through tracking and understanding customer satisfaction • The Net Promoter Score (NPS) is tracked on a monthly basis and measures the overall customer
engagement at product, segment and overall company levels, based on how likely customers are to recommend OCBC to their peers
• Our internal Exceed expectation-Below expectation (E-B) Score is tracked with higher frequency and measures the level of satisfaction across the various touchpoints and interactions customers have with our staff and the Bank
Scaling customer centricity across the organisation – The Great Experience Design bootcamp • A tailored Human-Centred Design programme for employees across divisions was launched in
2018 to teach ways to be more customer-centric in everything we do
Putting Customers First
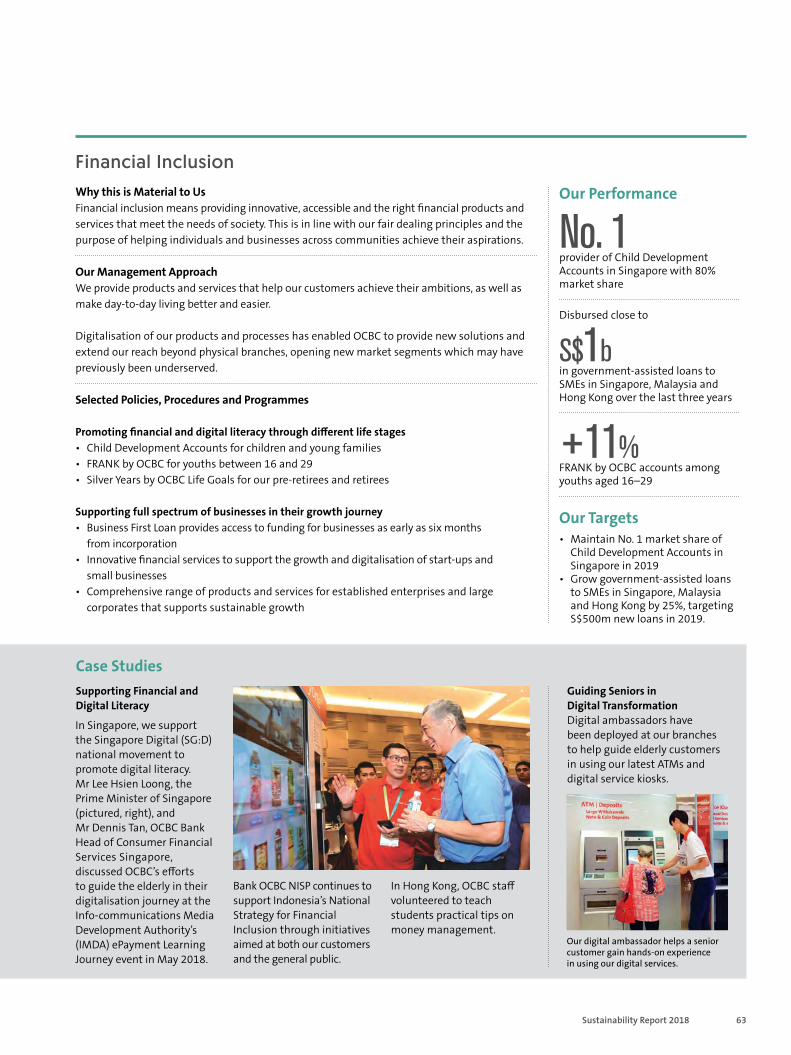
63Sustainability Report 2018
Why this is Material to Us Financial inclusion means providing innovative, accessible and the right financial products and services that meet the needs of society. This is in line with our fair dealing principles and the purpose of helping individuals and businesses across communities achieve their aspirations.
Our Management Approach We provide products and services that help our customers achieve their ambitions, as well as make day-to-day living better and easier.
Digitalisation of our products and processes has enabled OCBC to provide new solutions and extend our reach beyond physical branches, opening new market segments which may have previously been underserved.
Our Performance
No. 1 provider of Child Development Accounts in Singapore with 80% market share
Disbursed close to
S$1b in government-assisted loans to SMEs in Singapore, Malaysia and Hong Kong over the last three years
Financial Inclusion
Selected Policies, Procedures and Programmes
Promoting financial and digital literacy through different life stages • Child Development Accounts for children and young families • FRANK by OCBC for youths between 16 and 29 • Silver Years by OCBC Life Goals for our pre-retirees and retirees
Supporting full spectrum of businesses in their growth journey • Business First Loan provides access to funding for businesses as early as six months
from incorporation • Innovative financial services to support the growth and digitalisation of start-ups and
small businesses • Comprehensive range of products and services for established enterprises and large
corporates that supports sustainable growth
+11% FRANK by OCBC accounts among youths aged 16–29
Our Targets • Maintain No. 1 market share of
Child Development Accounts in Singapore in 2019
• Grow government-assisted loans to SMEs in Singapore, Malaysia and Hong Kong by 25%, targeting S$500m new loans in 2019.
Our digital ambassador helps a senior customer gain hands-on experience in using our digital services.
Case Studies
In Singapore, we support the Singapore Digital (SG:D) national movement to promote digital literacy. Mr Lee Hsien Loong, the Prime Minister of Singapore (pictured, right), and Mr Dennis Tan, OCBC Bank Head of Consumer Financial Services Singapore, discussed OCBC’s efforts to guide the elderly in their digitalisation journey at the Info-communications Media Development Authority’s (IMDA) ePayment Learning Journey event in May 2018.
Guiding Seniors in Digital Transformation Digital ambassadors have been deployed at our branches to help guide elderly customers in using our latest ATMs and digital service kiosks.
Supporting Financial and Digital Literacy
Bank OCBC NISP continues to support Indonesia’s National Strategy for Financial Inclusion through initiatives aimed at both our customers and the general public.
In Hong Kong, OCBC staff volunteered to teach students practical tips on money management.
64 OCBC Annual Report 2018
Sustainability Report 2018
Digitalisation Why this is Material to Us Technology is now a central part of our everyday lives. Customer behaviours, needs and expectations have changed. Digital-enabled business operations are creating new opportunities. As such, digitalisation is mission-critical for OCBC. We aim to provide innovative and seamless solutions that meet customer needs across all stages of their digitalisation journey as part of our Brand Promise.
Our Management Approach Digital transformation has been a longstanding approach at OCBC. We are focused on transforming ourselves and creating the Bank of the Future.
Our digital strategy cuts across every aspect of the Bank. We are focused on innovation and collaboration as key tenets of our approach.
Carpe Diem OCBC in-house Innovation Lab, Carpe Diem in Tampines Centre One, is a dedicated space for employees to build and test prototypes and develop unconventional solutions for the Bank by applying new technologies.
Since its launch in 2013, more than 6,000 ideas have been incubated with several of them eventually transformed into successes. These include the HR In Your Pocket app and an Application Programming Interface (API) platform which enabled transactional APIs and built partnerships with government agencies such as the Central Provident Fund (CPF) and Ministry of Education (MOE) in Singapore.
The Open Vault at OCBC The Open Vault at OCBC (TOV) was launched in 2016 with the aim of opening the Bank to external innovative ideas and to co-create solutions with ecosystem participants from outside the Bank. Since then, TOV has evaluated over 1,500 fintechs globally and partnered more than 25 fintech start-ups to pilot new solutions in wealth management, virtual customer assistance, transaction monitoring, business banking, consumer marketing and life insurance.
In 2018, a dedicated Artificial Intelligence (AI) unit called AI Lab, was set up to strategically develop in-house AI capabilities with an initial investment of S$10 million over three years.
Selected Policies, Procedures and Programmes
Deepening customer intimacy to drive loyalty • Our mobile and digital solutions provide greater access to products
and services that create a seamless customer experience • Leverage on data analytics and AI to provide an unparalleled level of customer
intimacy through creating highly-personalised interactions to drive loyalty
New engines of growth • Unlocking core market segments
OCBC is the first bank in Southeast Asia to launch a robo-investment service. It is an automated, algorithm-based digital investment platform that helps customers to manage their investments without having to interact with a human financial consultant. Targeted at young and tech-savvy retail investors, OCBC RoboInvest makes investing simple in today’s digitised world
• Generating partner-led growth OCBC OneAdvisor Home brings together all home expertise onto one digital platform by integrating property search, affordability assessment and home-related advisory to help customers make holistic decisions. The ecosystem of partnerships includes property listings portals, interior designers, property agents and home insurance
Scalability • Efficient Frontier
Stay at the efficient frontier enabled by new technologies such as AI, that enables the Bank to provide excellent service to a wide base of customers
• Scalable and modular platforms Ensure our digital products, services and processes are scalable and shareable across platforms and customer channels, to provide a consistent customer experience
Digital inclusiveness• All-encompassing approach
Create an open, agile and innovative culture to ensure that no one is left behind in our transformation journey
• Customer engagement Please visit Customer Experience section on page 62
• Staff empowerment Please visit Talent Management and Retention section on page 76
New frontiers of risk management enabled by AI and big data• Improve risk management through the use of fintech solutions. OCBC is one
of the first Singapore banks to tap on AI and machine learning to enhance the detection of suspicious transactions
Our approach to digitalisation is led by our Group CEO, who is supported by the dedicated digital teams in Singapore as well as our core markets. Each business unit is responsible for the execution of its part in the strategy.
For more information, please visit Redefining Customer Engagement through Digital Transformation on page 20.
Putting Customers First
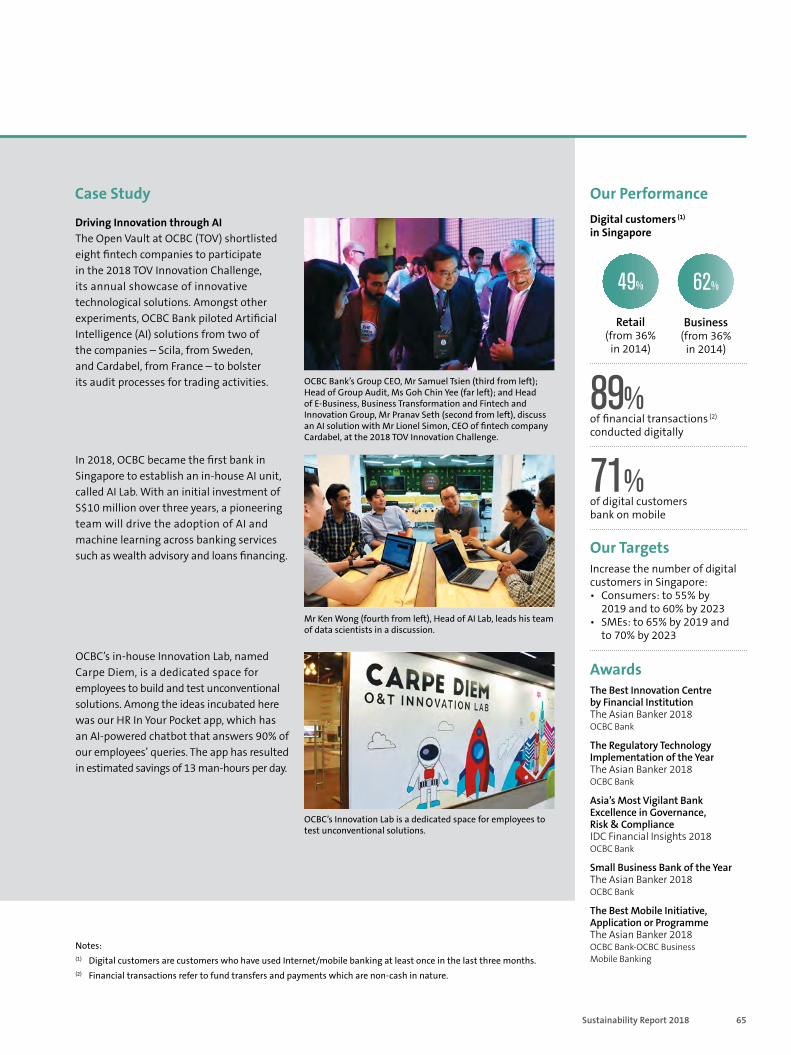
65Sustainability Report 2018
Digitalisation
Our Performance Case Study
Driving Innovation through AI The Open Vault at OCBC (TOV) shortlisted eight fintech companies to participate in the 2018 TOV Innovation Challenge, its annual showcase of innovative technological solutions. Amongst other experiments, OCBC Bank piloted Artificial Intelligence (AI) solutions from two of the companies – Scila, from Sweden, and Cardabel, from France – to bolster its audit processes for trading activities. 89%
of financial transactions (2) conducted digitally
71% of digital customers bank on mobile
Digital customers (1) in Singapore
Notes: (1) Digital customers are customers who have used Internet/mobile banking at least once in the last three months. (2) Financial transactions refer to fund transfers and payments which are non-cash in nature.
Our Targets Increase the number of digital customers in Singapore: • Consumers: to 55% by
2019 and to 60% by 2023 • SMEs: to 65% by 2019 and
to 70% by 2023
Retail (from 36%
in 2014)
Business (from 36%
in 2014)
49% 62%
Awards The Best Innovation Centre by Financial Institution The Asian Banker 2018 OCBC Bank
The Regulatory Technology Implementation of the Year The Asian Banker 2018 OCBC Bank
Asia’s Most Vigilant Bank Excellence in Governance, Risk & Compliance IDC Financial Insights 2018 OCBC Bank
Small Business Bank of the Year The Asian Banker 2018OCBC Bank
The Best Mobile Initiative, Application or ProgrammeThe Asian Banker 2018OCBC Bank-OCBC Business Mobile Banking
OCBC Bank’s Group CEO, Mr Samuel Tsien (third from left); Head of Group Audit, Ms Goh Chin Yee (far left); and Head of E-Business, Business Transformation and Fintech and Innovation Group, Mr Pranav Seth (second from left), discuss an AI solution with Mr Lionel Simon, CEO of fintech company Cardabel, at the 2018 TOV Innovation Challenge.
In 2018, OCBC became the first bank in Singapore to establish an in-house AI unit, called AI Lab. With an initial investment of S$10 million over three years, a pioneering team will drive the adoption of AI and machine learning across banking services such as wealth advisory and loans financing.
Mr Ken Wong (fourth from left), Head of AI Lab, leads his team of data scientists in a discussion.
OCBC’s in-house Innovation Lab, named Carpe Diem, is a dedicated space for employees to build and test unconventional solutions. Among the ideas incubated here was our HR In Your Pocket app, which has an AI-powered chatbot that answers 90% of our employees’ queries. The app has resulted in estimated savings of 13 man-hours per day.
OCBC’s Innovation Lab is a dedicated space for employees to test unconventional solutions.
66 OCBC Annual Report 2018
Strong Governance
Our Performance Why this is Material to Us Strong governance is essential to building and safeguarding the trust that our stakeholders place in us. It is also critical for effective decision making and oversight to ensure our long-term success. 100%
completion of mandatory staff training (fraud awareness, whistle-blowing, anti-bribery, anti-corruption) (1)
Employee Conduct Triggers (ECT) reveals
98% of employees in Singapore exhibit the right behaviours in accordance with the indicators tracked
Our Targets • Maintain 100% completion
rates for mandatory staff training in 2019
• Roll out Employee Conduct Triggers model to subsidiaries in 2019
Sustainability Report 2018
Acting with Integrity
Note: (1) The training performance includes
employees in Singapore, China and other international branches.
Rated
A by Morgan Stanley Capital International (MSCI) ESG Research according to our performance on ESG risks and opportunities relative to industry peers
Board Ethics and Conduct Committee Established by the Board of Directors, the committee provides oversight of policies, programmes and guidelines that inculcate and sustain a strong culture of responsible banking and fair dealing. That culture, which anchors the purpose, values and reputation of OCBC Bank, especially the emphasis on forging lasting relationships with customers and other stakeholders, is founded on trust that is established over time. OCBC Bank makes it a top priority to live up to and, indeed, surpass the ethical standards it is expected to meet.
Risk Culture Framework Embeds and reinforces a systematic approach to managing risk at all levels of the Group to ensure awareness, competency and accountability of practices. The framework is underpinned by a rigorous approach to assessment and monitoring
Management Control Oversight Rating (MCOR)Measures risk awareness and control consciousness of Management in discharging risks and controls supervisory/oversight responsibilities. The MCOR is derived based on the score of a set of factors including awareness, aptitude and attitude
Employee Conduct Triggers (ECT) Supports the Group Risk Culture Programme. It comprises a set of indicators that monitor employee conduct which was developed as an integral supplement to the existing suite of human resource management tools. In 2018, we introduced the ECT model for the first time and assessed all employees in Singapore against it. Moving forward, the Group will progressively extend the programme to subsidiaries and continue to include more bank-wide and business-specific indicators
Material Risk Takers (MRT) Framework Employees identified as having a material influence on the long-term performance of the Group have appropriate incentives set within the remuneration policy to ensure prudent behaviour
Positive Reinforcement Employees are recognised for their effort in preventing fraud and helping customers avoid scams, and exhibiting the right behaviours that exemplifies the Bank’s Purpose and values
Whistleblowing Programme Provides a transparent channel for employees and the public to raise concerns. The channels for reporting include: Website: www.ocbcgroup.ethicspoint.com Hotline: 800-110-1967
Selected Policies, Procedures and Programmes
OCBC adopts a zero-tolerance policy to fraud. Staff are informed that the Bank will investigate and report all internal fraud to the appropriate authorities. In 2013, an employee was suspected of conducting unauthorised transactions which led the Bank to promptly conduct an internal investigation, and thereafter report and cooperate with the authorities. The employee was convicted of the crime in December 2018.
We regularly review the effectiveness of our policies and practices, ensuring that they are relevant and implemented successfully across our business, with new ones added where warranted.
For further information on our approach to strong governance, please visit Corporate Governance on page 82.
Our Management Approach We are committed to the highest standards of corporate governance and ethical conduct. This means complying with all applicable laws and regulations and also establishing best practices consistently across the OCBC Group.
The expected standards of behaviour for all employees are set out in the OCBC Code of Conduct and our Group policies. These are implemented through a rigorous approach to regular staff communication, engagement, training and assessment.
OCBC has a zero tolerance approach to any form of bribery and corruption, which is stated in our Code of Conduct. Our anti-bribery and anti-corruption policies have been communicated globally to all our employees.
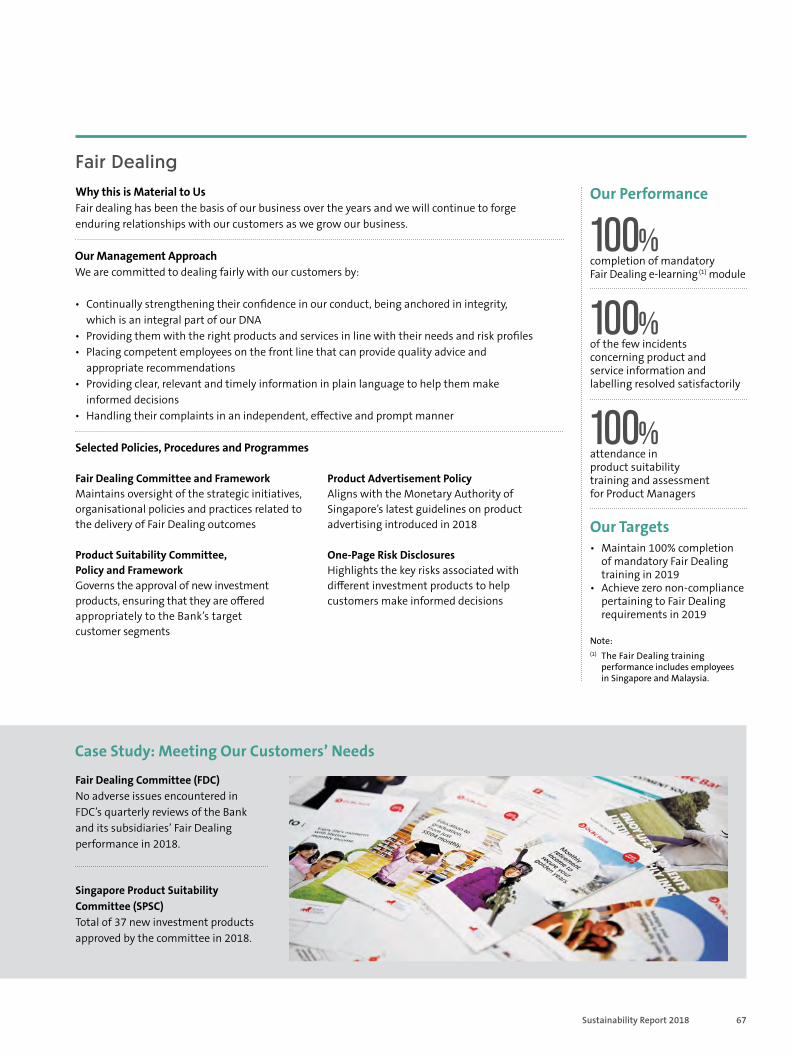
67Sustainability Report 2018
Fair Dealing Why this is Material to Us Fair dealing has been the basis of our business over the years and we will continue to forge enduring relationships with our customers as we grow our business.
Our Management Approach We are committed to dealing fairly with our customers by:
• Continually strengthening their confidence in our conduct, being anchored in integrity, which is an integral part of our DNA
• Providing them with the right products and services in line with their needs and risk profiles • Placing competent employees on the front line that can provide quality advice and
appropriate recommendations • Providing clear, relevant and timely information in plain language to help them make
informed decisions • Handling their complaints in an independent, effective and prompt manner
Our Performance
Case Study: Meeting Our Customers’ Needs
Fair Dealing Committee (FDC) No adverse issues encountered in FDC’s quarterly reviews of the Bank and its subsidiaries’ Fair Dealing performance in 2018.
100% completion of mandatory Fair Dealing e-learning (1) module
100% of the few incidents concerning product and service information and labelling resolved satisfactorily
Our Targets • Maintain 100% completion
of mandatory Fair Dealing training in 2019
• Achieve zero non-compliance pertaining to Fair Dealing requirements in 2019
100% attendance in product suitability training and assessment for Product Managers
Singapore Product Suitability Committee (SPSC) Total of 37 new investment products approved by the committee in 2018.
Selected Policies, Procedures and Programmes
Fair Dealing Committee and Framework Maintains oversight of the strategic initiatives, organisational policies and practices related to the delivery of Fair Dealing outcomes
Product Suitability Committee, Policy and Framework Governs the approval of new investment products, ensuring that they are offered appropriately to the Bank’s target customer segments
Product Advertisement Policy Aligns with the Monetary Authority of Singapore’s latest guidelines on product advertising introduced in 2018
One-Page Risk Disclosures Highlights the key risks associated with different investment products to help customers make informed decisions
Note: (1) The Fair Dealing training
performance includes employees in Singapore and Malaysia.
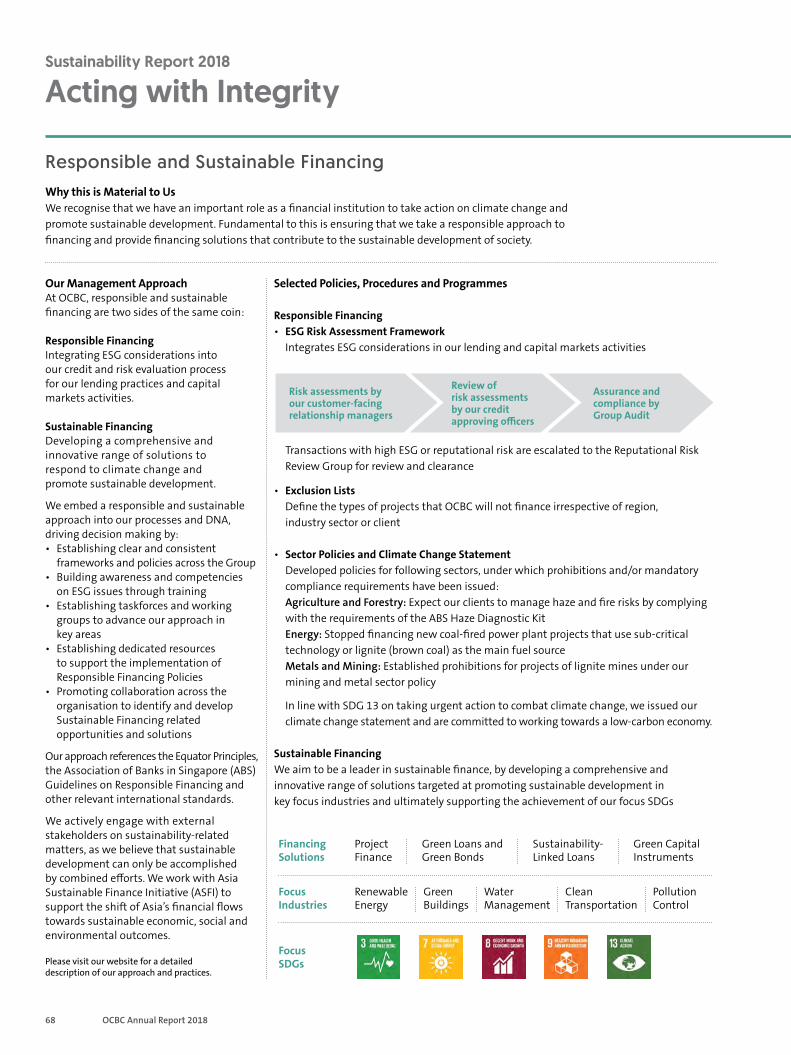
68 OCBC Annual Report 2018
Responsible and Sustainable Financing Why this is Material to Us We recognise that we have an important role as a financial institution to take action on climate change and promote sustainable development. Fundamental to this is ensuring that we take a responsible approach to financing and provide financing solutions that contribute to the sustainable development of society.
Our Management Approach At OCBC, responsible and sustainable financing are two sides of the same coin:
Responsible Financing Integrating ESG considerations into our credit and risk evaluation process for our lending practices and capital markets activities.
Sustainable Financing Developing a comprehensive and innovative range of solutions to respond to climate change and promote sustainable development.
We embed a responsible and sustainable approach into our processes and DNA, driving decision making by: • Establishing clear and consistent
frameworks and policies across the Group • Building awareness and competencies
on ESG issues through training • Establishing taskforces and working
groups to advance our approach in key areas
• Establishing dedicated resources to support the implementation of Responsible Financing Policies
• Promoting collaboration across the organisation to identify and develop Sustainable Financing related opportunities and solutions
Our approach references the Equator Principles, the Association of Banks in Singapore (ABS) Guidelines on Responsible Financing and other relevant international standards.
We actively engage with external stakeholders on sustainability-related matters, as we believe that sustainable development can only be accomplished by combined efforts. We work with Asia Sustainable Finance Initiative (ASFI) to support the shift of Asia’s financial flows towards sustainable economic, social and environmental outcomes.
Please visit our website for a detailed description of our approach and practices.
Selected Policies, Procedures and Programmes
Responsible Financing • ESG Risk Assessment Framework Integrates ESG considerations in our lending and capital markets activities
Transactions with high ESG or reputational risk are escalated to the Reputational Risk Review Group for review and clearance
• Exclusion Lists Define the types of projects that OCBC will not finance irrespective of region,
industry sector or client
• Sector Policies and Climate Change Statement Developed policies for following sectors, under which prohibitions and/or mandatory
compliance requirements have been issued: Agriculture and Forestry: Expect our clients to manage haze and fire risks by complying with the requirements of the ABS Haze Diagnostic Kit Energy: Stopped financing new coal-fired power plant projects that use sub-critical technology or lignite (brown coal) as the main fuel source Metals and Mining: Established prohibitions for projects of lignite mines under our mining and metal sector policy
In line with SDG 13 on taking urgent action to combat climate change, we issued our climate change statement and are committed to working towards a low-carbon economy.
Sustainable Financing We aim to be a leader in sustainable finance, by developing a comprehensive and innovative range of solutions targeted at promoting sustainable development in key focus industries and ultimately supporting the achievement of our focus SDGs
Financing Solutions
Focus Industries
Focus SDGs
Project Finance
Renewable Energy
Green Loans and Green Bonds
Green Buildings
Sustainability-Linked Loans
Water Management
Green Capital Instruments
Clean Transportation
Pollution Control
Sustainability Report 2018
Acting with Integrity
Risk assessments by our customer-facing relationship managers
Review of risk assessments by our credit approving officers
Assurance and compliance by Group Audit
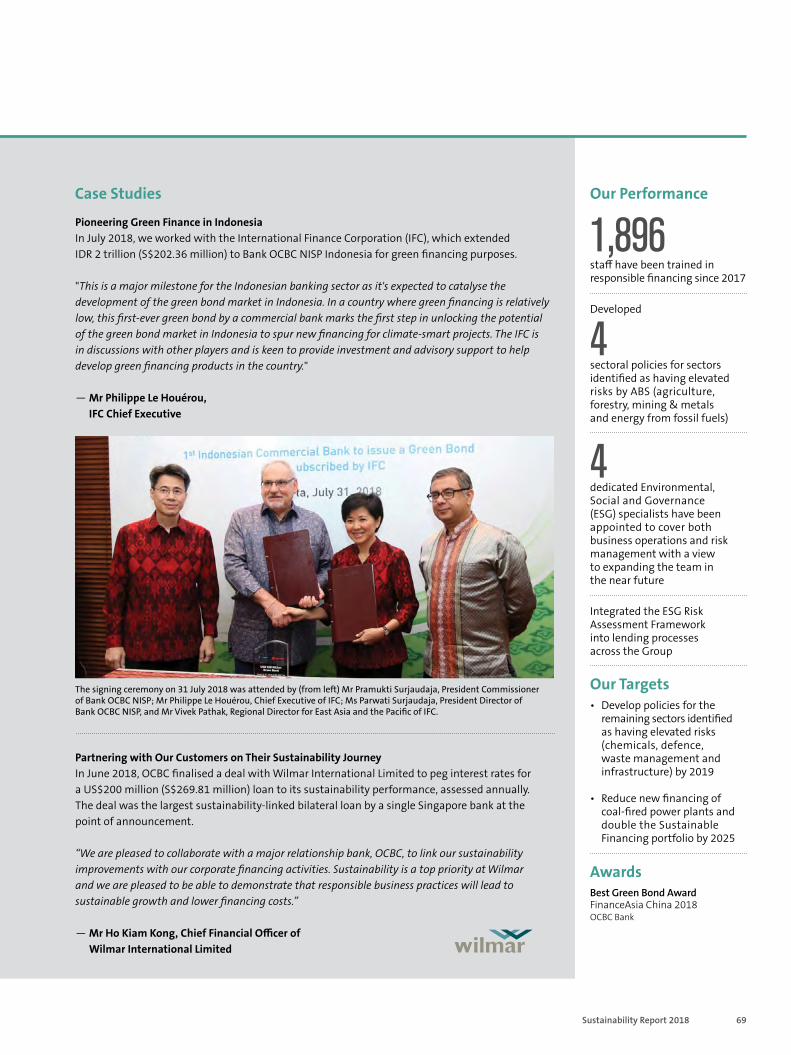
69Sustainability Report 2018
Responsible and Sustainable Financing
Our Performance
1,896 staff have been trained in responsible financing since 2017
Case Studies
Developed
4 sectoral policies for sectors identified as having elevated risks by ABS (agriculture, forestry, mining & metals and energy from fossil fuels)
4 dedicated Environmental, Social and Governance (ESG) specialists have been appointed to cover both business operations and risk management with a view to expanding the team in the near future
Integrated the ESG Risk Assessment Framework into lending processes across the Group
Our Targets • Develop policies for the
remaining sectors identified as having elevated risks (chemicals, defence, waste management and infrastructure) by 2019
• Reduce new financing of coal-fired power plants and double the Sustainable Financing portfolio by 2025
Awards Best Green Bond Award FinanceAsia China 2018 OCBC Bank
Pioneering Green Finance in Indonesia In July 2018, we worked with the International Finance Corporation (IFC), which extended IDR 2 trillion (S$202.36 million) to Bank OCBC NISP Indonesia for green financing purposes.
"This is a major milestone for the Indonesian banking sector as it's expected to catalyse the development of the green bond market in Indonesia. In a country where green financing is relatively low, this first-ever green bond by a commercial bank marks the first step in unlocking the potential of the green bond market in Indonesia to spur new financing for climate-smart projects. The IFC is in discussions with other players and is keen to provide investment and advisory support to help develop green financing products in the country."
— Mr Philippe Le Houérou, IFC Chief Executive
The signing ceremony on 31 July 2018 was attended by (from left) Mr Pramukti Surjaudaja, President Commissioner of Bank OCBC NISP; Mr Philippe Le Houérou, Chief Executive of IFC; Ms Parwati Surjaudaja, President Director of Bank OCBC NISP, and Mr Vivek Pathak, Regional Director for East Asia and the Pacific of IFC.
Partnering with Our Customers on Their Sustainability Journey In June 2018, OCBC finalised a deal with Wilmar International Limited to peg interest rates for a US$200 million (S$269.81 million) loan to its sustainability performance, assessed annually. The deal was the largest sustainability-linked bilateral loan by a single Singapore bank at the point of announcement.
“We are pleased to collaborate with a major relationship bank, OCBC, to link our sustainability improvements with our corporate financing activities. Sustainability is a top priority at Wilmar and we are pleased to be able to demonstrate that responsible business practices will lead to sustainable growth and lower financing costs.”
— Mr Ho Kiam Kong, Chief Financial Officer of Wilmar International Limited
70 OCBC Annual Report 2018
Sustainability Report 2018
Acting with Integrity
Combating Financial Crimes and Cyber Threats Why this is Material to Us The prevention of fraud, money laundering and the financing of terrorism is of critical importance across all the markets in which we operate. Cyber threats, and their link to cyber fraud and other crimes, have risen in volume and intensity globally, alongside data protection and data privacy concerns. This has the potential to severely disrupt banking services and result in large financial losses. Ensuring the security and resiliency of our systems is crucial to upholding trust and our licence to operate.
Our Management Approach Protecting our customers has always been our priority. We adopt a holistic approach to risk management through ensuring all our products and services have security built in by design to protect customers’ information and money, while still providing a frictionless banking experience.
We manage the risks relating to fraud, money laundering and financing of terrorism, cybersecurity and data protection across three key areas: physical assets, people and information.
We have in place a comprehensive framework of policies and practices, realised through active corporate risk governance and an extensive programme focusing on cyber defence capabilities, awareness and testing, incident response and crisis management, as well as insurance protection.
Senior management is involved in decision making on strategies to prevent, detect and respond to the evolving cyber threat landscape.
To further enhance our cyber resilience through external collaborations, we also actively engage in cyber threat information sharing with industry players via the Association of Banks in Singapore Standing Committee on Cyber Security (ABS SCCS) and the Financial Services Information Sharing and Analysis Centre (FS-ISAC), comprising members such as peer banks and the regulator.
For further information on our approach to Risk Management, please see page 103.
Selected Policies, Procedures and Programmes
Fraud • Deployed a robust set of security and authentication measures across our Internet and
mobile banking platforms to prevent fraud• Provided education and advice to our customers and the community through our branch
network, social media, radio and print media • Invested S$12 million over the last three years to enhance detection and monitoring
systems, and improved fraud recovery procedures and staff awareness of fraud and scams
Anti-Money Laundering (AML) and Countering the Financing of Terrorism (CFT) • Member of the Anti-Money Laundering/Countering the Financing of Terrorism Industry
Partnership (ACIP) • One of the first Singapore banks to tap on artificial intelligence (AI) and machine
learning to enhance the detection of suspicious activity • Collaborated with fintech start-up companies to explore AI in the detection of
anti-money laundering patterns missed by humans
Cyber Resilience • Adopt a “defence-in-depth” approach in instituting multi-layered controls and processes • Conduct regular risk assessments, security reviews and audits to validate the
effectiveness of safeguards established, with significant issues promptly remediated • Manage and monitor our networks for cyber threats through a 24-hour Cybersecurity
Operations Centre
• Our strategy comprises: Cyber Risk & Resilience Policy Incorporates regulatory requirements and aligns with international industry guidance on cyber risk and resilience. Roles and responsibilities across the three independent lines of defence are clearly defined
Cyber Defence Programme Capabilities to sustain and enhance defences, and new ones continuously developed and deployed to address evolving and advanced threats. Incident response of people and processes are tested and improved to be more effective against cyber attacks
Cyber Risk Awareness & Social Engineering Testing Programme Educates and tests all staff on cyber threats to continuously improve staff vigilance and cyber hygiene within the organisation. Educates customers through online channels, and outsourced services providers through cyber risk awareness sessions
Business Continuity & Crisis Management Programme Ensures minimal disruption of essential banking services during times of crisis, including cyber attacks. Exercises are conducted regularly to improve responses to disruptions due to cyber attacks
Cyber & Network Security Insurance Protects the Group using relevant insurance to cover damages due to a variety of cyber-attack situations
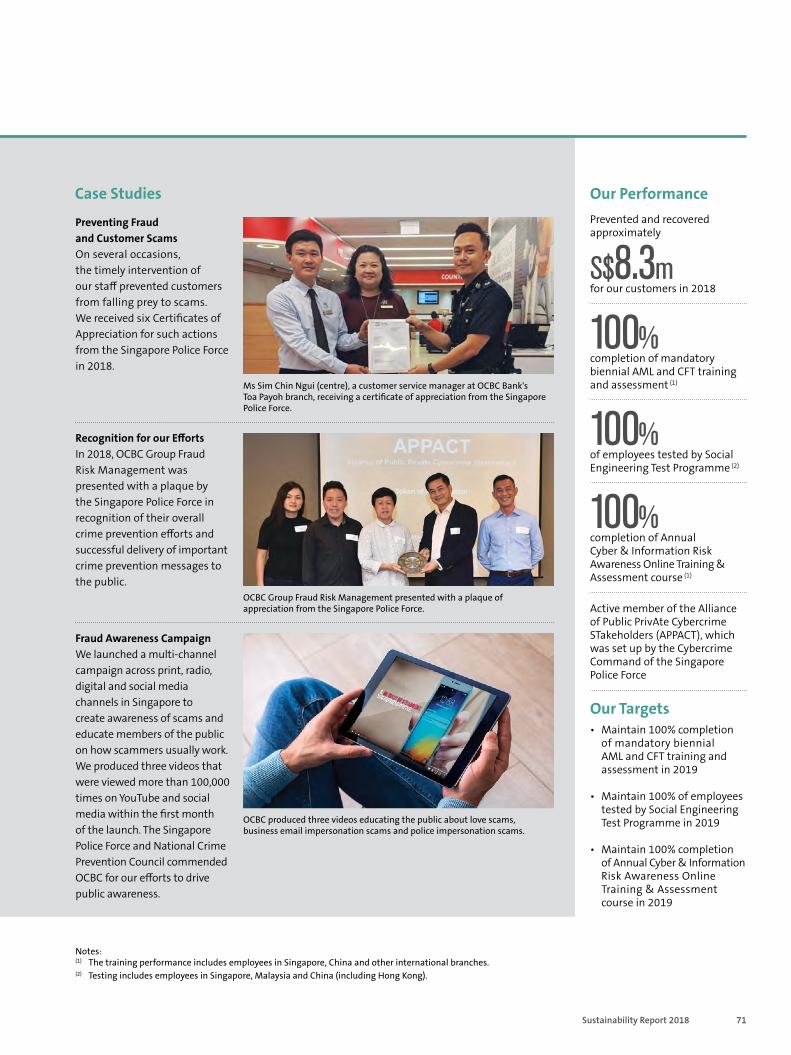
71Sustainability Report 2018
Combating Financial Crimes and Cyber Threats
Preventing Fraud and Customer Scams On several occasions, the timely intervention of our staff prevented customers from falling prey to scams. We received six Certificates of Appreciation for such actions from the Singapore Police Force in 2018.
Ms Sim Chin Ngui (centre), a customer service manager at OCBC Bank's Toa Payoh branch, receiving a certificate of appreciation from the Singapore Police Force.
Notes: (1) The training performance includes employees in Singapore, China and other international branches. (2) Testing includes employees in Singapore, Malaysia and China (including Hong Kong).
Our Performance
Our Targets • Maintain 100% completion
of mandatory biennial AML and CFT training and assessment in 2019
• Maintain 100% of employees tested by Social Engineering Test Programme in 2019
• Maintain 100% completion of Annual Cyber & Information Risk Awareness Online Training & Assessment course in 2019
Prevented and recovered approximately
S$8.3m for our customers in 2018
100% completion of mandatory biennial AML and CFT training and assessment (1)
100% of employees tested by Social Engineering Test Programme (2)
100% completion of Annual Cyber & Information Risk Awareness Online Training & Assessment course (1)
Active member of the Alliance of Public PrivAte Cybercrime STakeholders (APPACT), which was set up by the Cybercrime Command of the Singapore Police Force
Case Studies
Recognition for our Efforts In 2018, OCBC Group Fraud Risk Management was presented with a plaque by the Singapore Police Force in recognition of their overall crime prevention efforts and successful delivery of important crime prevention messages to the public.
OCBC Group Fraud Risk Management presented with a plaque of appreciation from the Singapore Police Force.
Fraud Awareness Campaign We launched a multi-channel campaign across print, radio, digital and social media channels in Singapore to create awareness of scams and educate members of the public on how scammers usually work. We produced three videos that were viewed more than 100,000 times on YouTube and social media within the first month of the launch. The Singapore Police Force and National Crime Prevention Council commended OCBC for our efforts to drive public awareness.
OCBC produced three videos educating the public about love scams, business email impersonation scams and police impersonation scams.
72 OCBC Annual Report 2018
Sustainability Report 2018
Valuing our People
Inclusive Workforce Why this is Material to Us Having an inclusive workforce which represents our diverse customer groups provides the organisation with different perspectives, skills and talents. We aim to cultivate a culture where all employees are treated fairly with respect and where they can bring their whole selves to work. We believe that by creating an inclusive culture, employees will be engaged and inspired to contribute fully. This facilitates growth for our people and for the business.
Our Management Approach We are committed to creating a work environment that is inclusive, embraces differences and recognises the value and contributions of individuals. We believe in having a diverse workforce at all levels of management.
As always, we tolerate no harassment of any kind. Our Code of Conduct has guidelines for our employees concerning anti-bullying and harassment. We have a robust grievance procedure in place for employees to share their concerns without any fear of retaliation.
Furthermore, it is crucial for us to instil a culture that welcomes different views. We believe this is a central ingredient to enhancing productivity and creativity, which will lead to greater employee performance. The OCBC Employer Brand articulates our programmes and policies, which are anchored on three Employer Brand pillars – Caring, Progressive and Delivering a Difference.
We maintain our commitment to be supportive of working parents, who often have to juggle demands both at home and at work. For example, our employees are given opportunities to adopt flexible work arrangements that allow them to balance time with family while continuing a career with OCBC. We provide childcare centres with full facilities at two of our sites with a third at One Marina Boulevard in Singapore.
Our approach to creating an inclusive workplace is reviewed on a regular basis and we will continue to enhance our policies and programmes to attract, engage, develop and retain a diverse employee group.
Inclusive Workforce
Our Targets • Develop a diverse, inclusive and
positive working environment for all employees regardless of gender, age, ethnicity or background so that employees can have meaningful careers and continue to be engaged with the Bank
• Maintain a balanced gender mix in terms of headcount in 2019
• Grow the pool of women in leadership positions from 38% to 42% by 2025
Awards Fair and Progressive Employment Practices Tripartite Alliance Awards 2018 OCBC Bank
Work-Life Excellence Tripartite Alliance Awards 2018 OCBC Bank
Excellence in Women Empowerment Strategy (SG) – Gold Award HR Excellence Awards 2018 OCBC Bank
Excellence in HR Innovation - Bronze AwardHR Excellence Awards 2018OCBC Bank
OCBC Future Smart Programme
• Our largest-scale and most ambitious digital transformation initiative: A S$20 million investment in our employees
• Promotes learning agility, as well as global and sustainability perspectives
• Anticipates future business needs that will impact our people
LifeRefresh@OCBC Programme
• Since 2016, over 300 employees have participated in this lifelong learning programme
• In 2018, the programme helped older employees be digitally-savvy and try out creating websites, participating in marketplaces and going cashless via e-payments
Selected Policies, Procedures and Programmes In today’s constantly evolving work environment, we recognise that it is essential for organisations and employees to adapt in order to stay relevant. It is vital to be a learning organisation that encourages employees to step up and share.
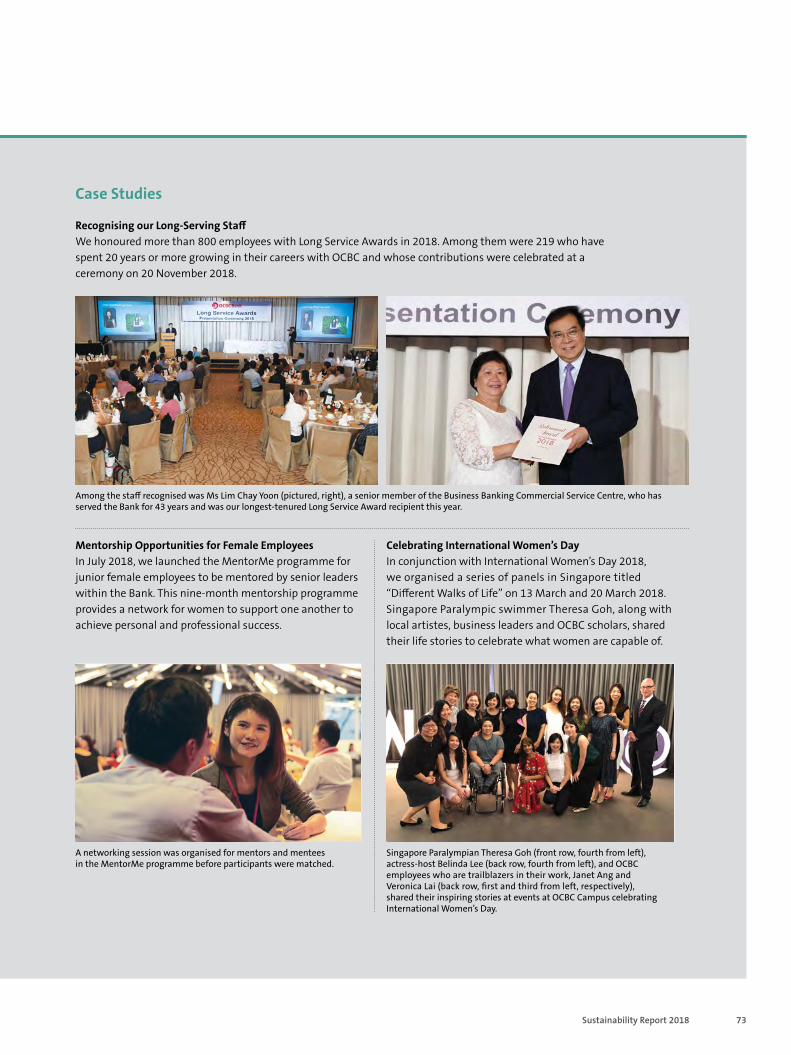
73Sustainability Report 2018
Inclusive Workforce Inclusive Workforce
Case Studies
Recognising our Long-Serving Staff We honoured more than 800 employees with Long Service Awards in 2018. Among them were 219 who have spent 20 years or more growing in their careers with OCBC and whose contributions were celebrated at a ceremony on 20 November 2018.
Among the staff recognised was Ms Lim Chay Yoon (pictured, right), a senior member of the Business Banking Commercial Service Centre, who has served the Bank for 43 years and was our longest-tenured Long Service Award recipient this year.
Singapore Paralympian Theresa Goh (front row, fourth from left), actress-host Belinda Lee (back row, fourth from left), and OCBC employees who are trailblazers in their work, Janet Ang and Veronica Lai (back row, first and third from left, respectively), shared their inspiring stories at events at OCBC Campus celebrating International Women’s Day.
Mentorship Opportunities for Female Employees In July 2018, we launched the MentorMe programme for junior female employees to be mentored by senior leaders within the Bank. This nine-month mentorship programme provides a network for women to support one another to achieve personal and professional success.
Celebrating International Women’s Day In conjunction with International Women’s Day 2018, we organised a series of panels in Singapore titled “Different Walks of Life” on 13 March and 20 March 2018. Singapore Paralympic swimmer Theresa Goh, along with local artistes, business leaders and OCBC scholars, shared their life stories to celebrate what women are capable of.
A networking session was organised for mentors and mentees in the MentorMe programme before participants were matched.
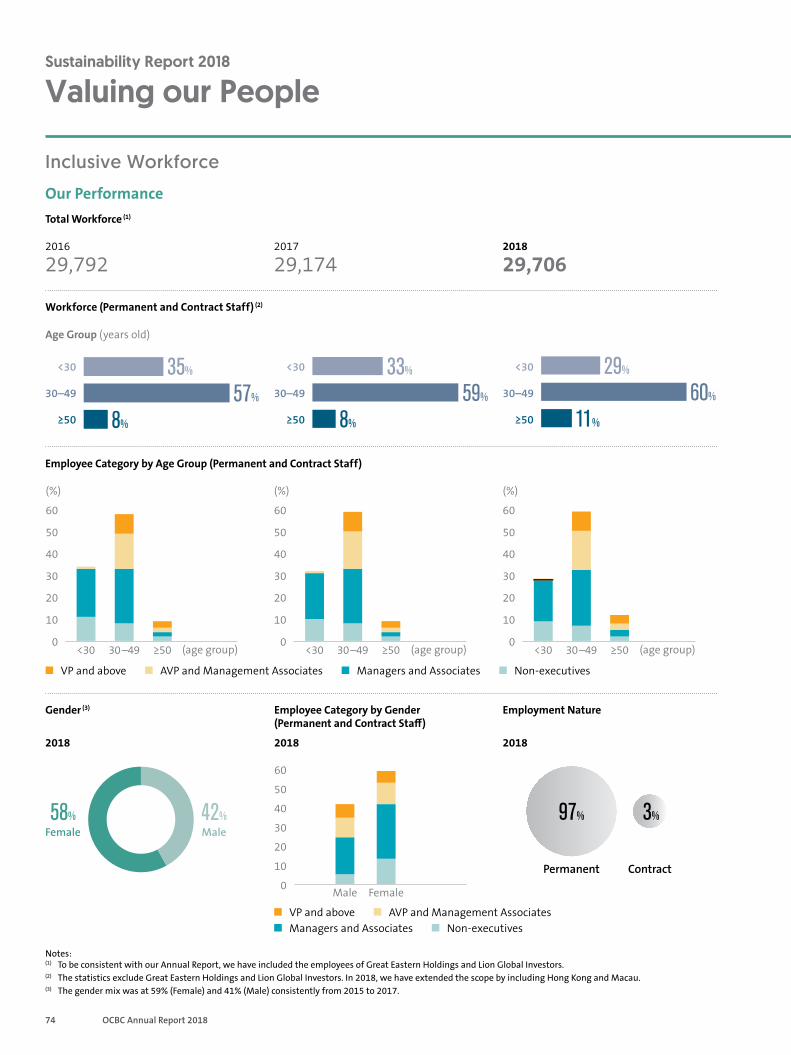
74 OCBC Annual Report 2018
Sustainability Report 2018
Valuing our People
Inclusive Workforce
Our Performance Total Workforce (1)
2016
29,792 2017
29,174 2018
29,706
Age Group (years old)
35%
57%
8%
33%
59%
8%
VP and above AVP and Management Associates Managers and Associates Non-executives
Workforce (Permanent and Contract Staff) (2)
29%
60%
11%
Employee Category by Age Group (Permanent and Contract Staff)
<30 30 –49 ≥50
60
50
40
30
20
10
0
(%)
(age group) <30 30 –49 ≥50
60
50
40
30
20
10
0
(%)
(age group)
60
50
40
30
20
10
0
(%)
(age group) ≥50 <30 30 –49
Employee Category by Gender (Permanent and Contract Staff)
Gender (3)
Notes: (1) To be consistent with our Annual Report, we have included the employees of Great Eastern Holdings and Lion Global Investors. (2) The statistics exclude Great Eastern Holdings and Lion Global Investors. In 2018, we have extended the scope by including Hong Kong and Macau. (3) The gender mix was at 59% (Female) and 41% (Male) consistently from 2015 to 2017.
Employment Nature
2018 2018 2018
Contract
3%
Permanent
97%
Female
60
50
40
30
20
10
0 Male
VP and above AVP and Management Associates Managers and Associates Non-executives
58% Female
42% Male
30–49
≥50
<30
30–49
≥50
<30
30–49
≥50
<30
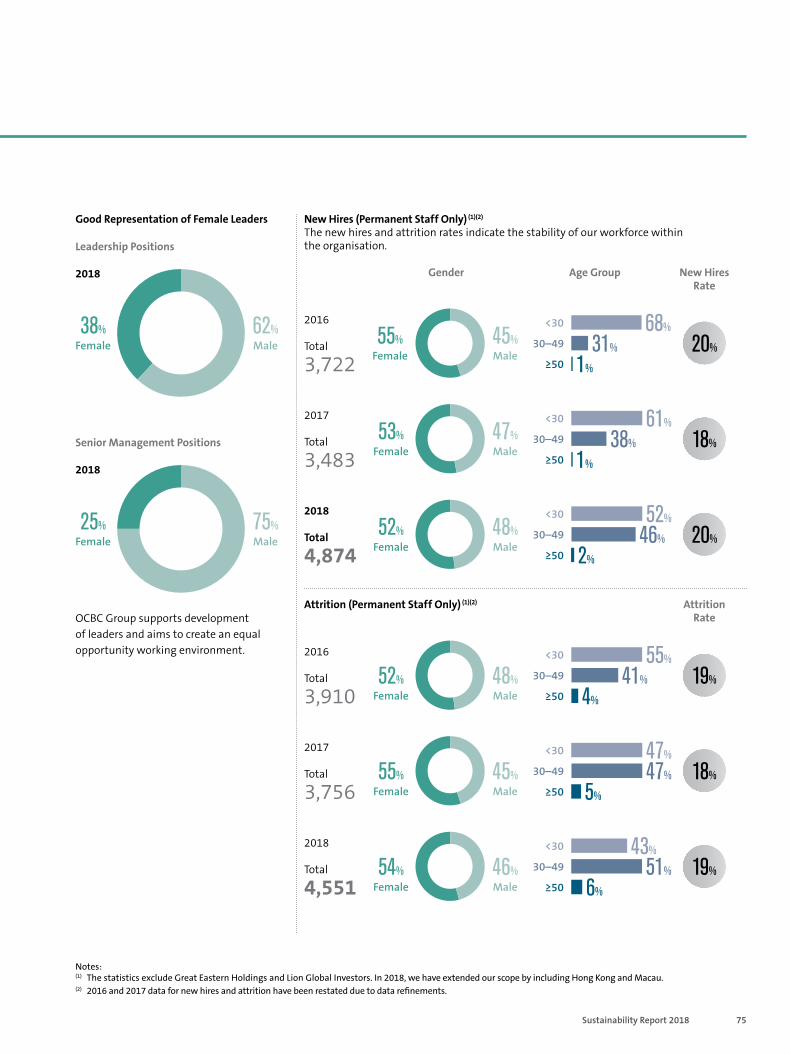
75Sustainability Report 2018
Inclusive Workforce
Good Representation of Female Leaders
Leadership Positions
2018
New Hires (Permanent Staff Only) (1)(2)
The new hires and attrition rates indicate the stability of our workforce within the organisation.
Senior Management Positions
2018
OCBC Group supports development of leaders and aims to create an equal opportunity working environment.
Notes: (1) The statistics exclude Great Eastern Holdings and Lion Global Investors. In 2018, we have extended our scope by including Hong Kong and Macau. (2) 2016 and 2017 data for new hires and attrition have been restated due to data refinements.
Gender Age Group New Hires Rate
38% Female
62% Male
25% Female
75% Male
2016
Total
3,722 20% 55%
Female 45% Male
68%
1%
<30
≥50
30–49 31%
2017
Total
3,483 18% 53%
Female 47% Male
61%
1%
38%
<30
≥50
30–49
2018
Total
4,874 20% 52%
Female 48% Male
52% <30
2% ≥50 46% 30–49
Attrition (Permanent Staff Only) (1)(2) Attrition Rate
2016
Total
3,910 19%
55% <30
4% ≥50 41% 30–49
2017
Total
3,756 18%
47% <30
5% ≥50 47% 30–49
2018
Total
4,551 19%
43% <30
6% ≥50 51% 30–49
52% Female
55% Female
54% Female
48% Male
45% Male
46% Male
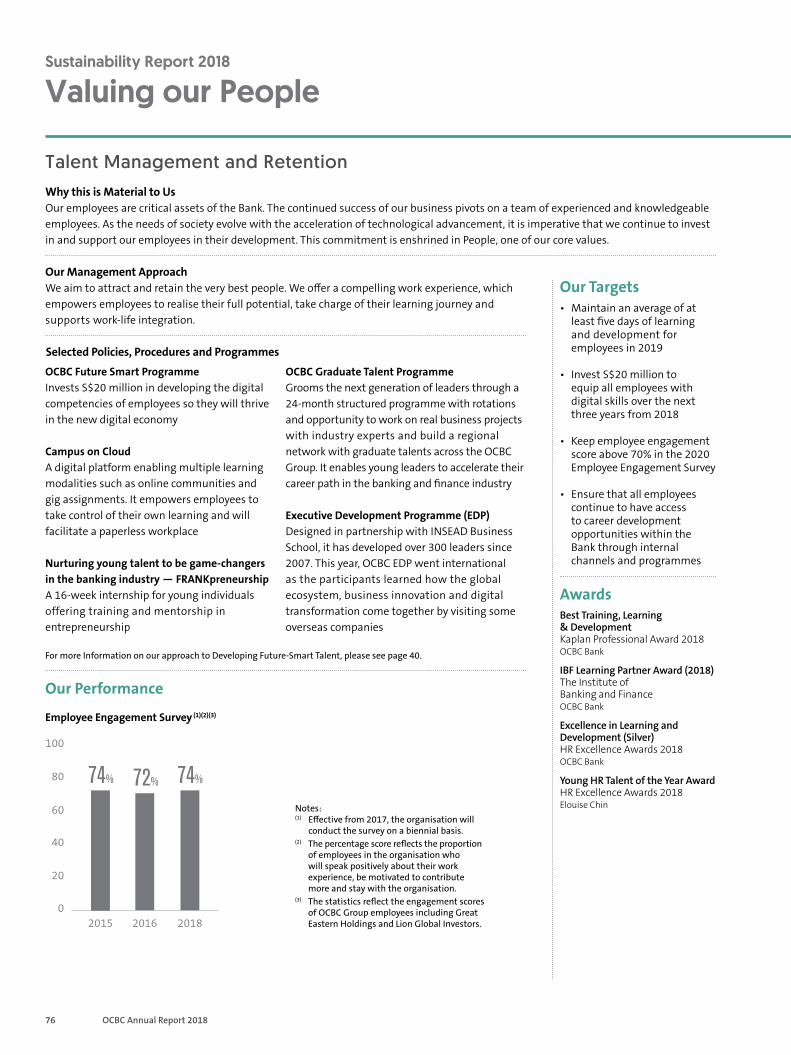
76 OCBC Annual Report 2018
Sustainability Report 2018
Valuing our People
Talent Management and Retention Why this is Material to Us Our employees are critical assets of the Bank. The continued success of our business pivots on a team of experienced and knowledgeable employees. As the needs of society evolve with the acceleration of technological advancement, it is imperative that we continue to invest in and support our employees in their development. This commitment is enshrined in People, one of our core values.
Our Management Approach We aim to attract and retain the very best people. We offer a compelling work experience, which empowers employees to realise their full potential, take charge of their learning journey and supports work-life integration.
Our Targets • Maintain an average of at
least five days of learning and development for employees in 2019
• Invest S$20 million to equip all employees with digital skills over the next three years from 2018
• Keep employee engagement
score above 70% in the 2020 Employee Engagement Survey
• Ensure that all employees continue to have access to career development opportunities within the Bank through internal channels and programmes
OCBC Future Smart Programme Invests S$20 million in developing the digital competencies of employees so they will thrive in the new digital economy
Campus on Cloud A digital platform enabling multiple learning modalities such as online communities and gig assignments. It empowers employees to take control of their own learning and will facilitate a paperless workplace
Nurturing young talent to be game-changers in the banking industry — FRANKpreneurship A 16-week internship for young individuals offering training and mentorship in entrepreneurship
OCBC Graduate Talent Programme Grooms the next generation of leaders through a 24-month structured programme with rotations and opportunity to work on real business projects with industry experts and build a regional network with graduate talents across the OCBC Group. It enables young leaders to accelerate their career path in the banking and finance industry
Executive Development Programme (EDP) Designed in partnership with INSEAD Business School, it has developed over 300 leaders since 2007. This year, OCBC EDP went international as the participants learned how the global ecosystem, business innovation and digital transformation come together by visiting some overseas companies
Selected Policies, Procedures and Programmes
Best Training, Learning & Development Kaplan Professional Award 2018 OCBC Bank
Awards
IBF Learning Partner Award (2018) The Institute of Banking and Finance OCBC Bank
Excellence in Learning and Development (Silver)HR Excellence Awards 2018OCBC Bank
Young HR Talent of the Year AwardHR Excellence Awards 2018Elouise Chin
For more Information on our approach to Developing Future-Smart Talent, please see page 40.
Our Performance
Notes: (1) Effective from 2017, the organisation will
conduct the survey on a biennial basis. (2) The percentage score reflects the proportion
of employees in the organisation who will speak positively about their work experience, be motivated to contribute more and stay with the organisation.
(3) The statistics reflect the engagement scores of OCBC Group employees including Great Eastern Holdings and Lion Global Investors.
Employee Engagement Survey (1)(2)(3)
100
80
60
40
20
0 2018
74%
2016
72%
2015
74%
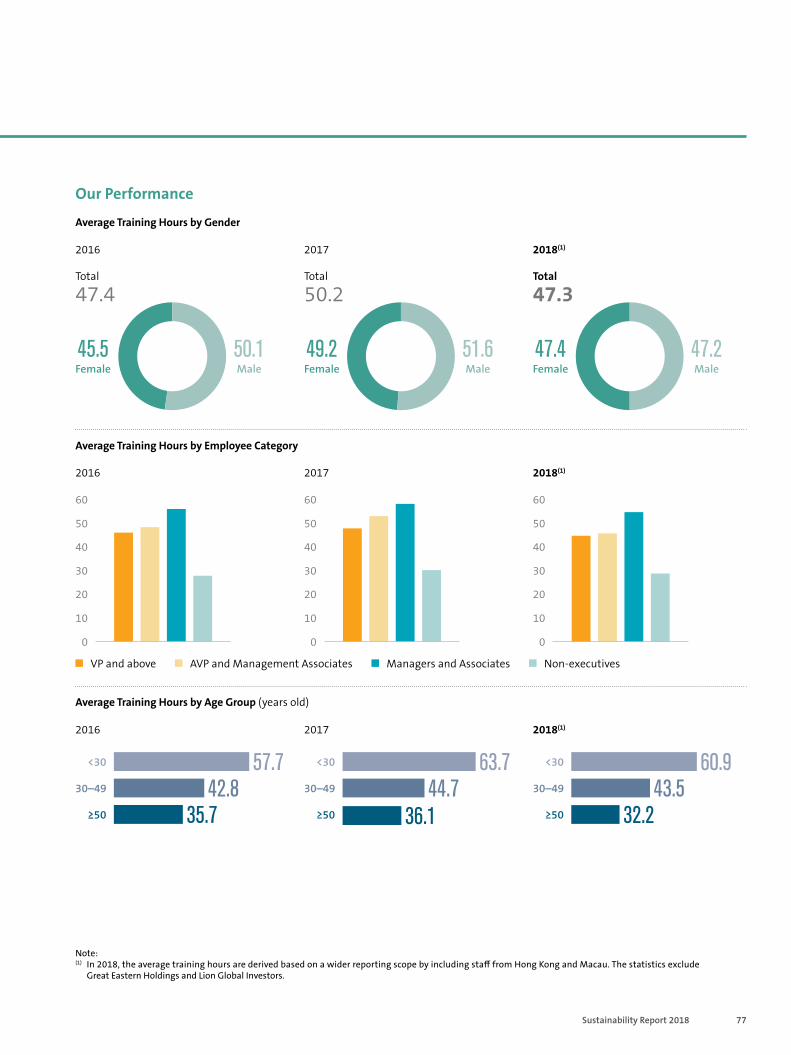
77Sustainability Report 2018
Talent Management and Retention
Our Performance
2016
Total
47.4
Average Training Hours by Gender
2017
Total
50.2
2018(1)
Total
47.3
Average Training Hours by Employee Category
60
50
40
30
20
10
0
2016 2017 2018(1)
60
50
40
30
20
10
0
60
50
40
30
20
10
0
Average Training Hours by Age Group (years old)
2016 2017 2018(1)
Note: (1) In 2018, the average training hours are derived based on a wider reporting scope by including staff from Hong Kong and Macau. The statistics exclude
Great Eastern Holdings and Lion Global Investors.
57.7 42.8
35.7
63.7 44.7
36.1
60.9 43.5
32.2
VP and above AVP and Management Associates Managers and Associates Non-executives
45.5Female
50.1Male
49.2Female
51.6 Male
47.2 Male
47.4Female
30–49
≥50
<30
30–49
≥50
<30
30–49
≥50
<30
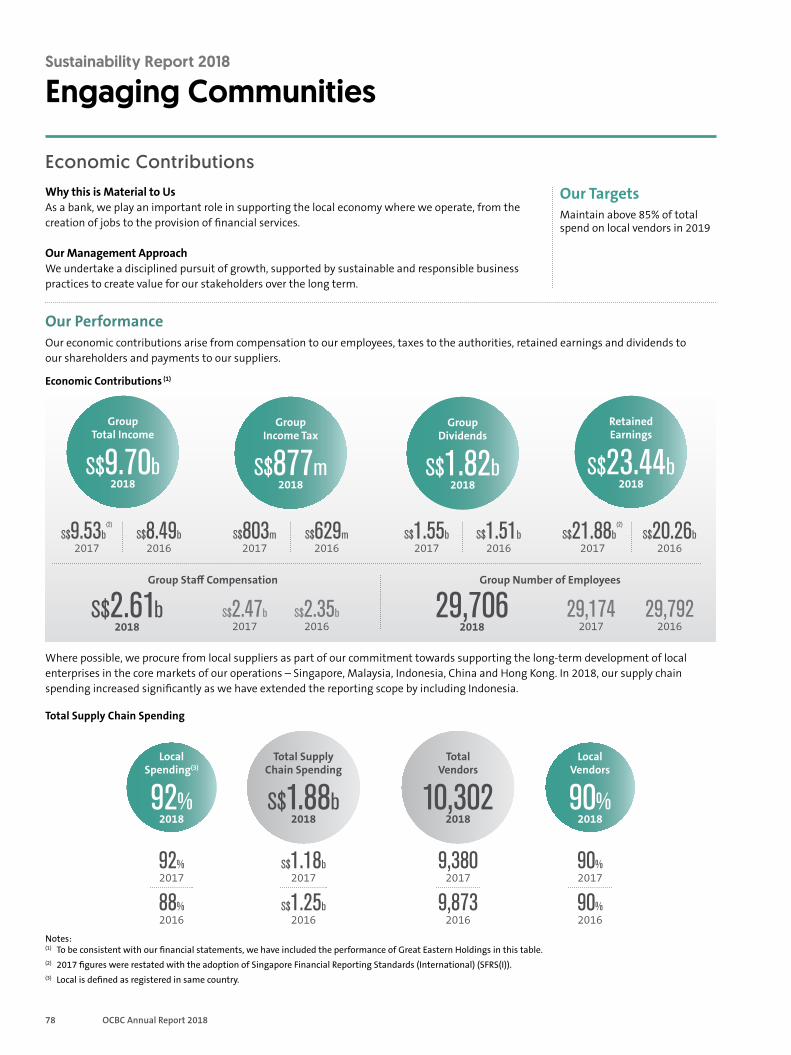
78 OCBC Annual Report 2018
Sustainability Report 2018
Engaging Communities
Economic Contributions Why this is Material to Us As a bank, we play an important role in supporting the local economy where we operate, from the creation of jobs to the provision of financial services.
Our Management ApproachWe undertake a disciplined pursuit of growth, supported by sustainable and responsible business practices to create value for our stakeholders over the long term.
Our Targets Maintain above 85% of total spend on local vendors in 2019
Our Performance
S$2.47b 2017
S$2.35b 2016
S$2.61b 2018
29,174 2017
29,792 2016
29,706 2018
Group Number of EmployeesGroup Staff Compensation
S$1.55b 2017
S$1.51b 2016
S$9.53b(2)
2017 S$8.49b
2016
Group Dividends
S$1.82b 2018
S$21.88b(2)
2017
S$20.26b 2016
Retained Earnings
S$23.44b 2018
Group Total Income
S$9.70b 2018
S$803m 2017
S$629m 2016
Group Income Tax
S$877m 2018
Where possible, we procure from local suppliers as part of our commitment towards supporting the long-term development of local enterprises in the core markets of our operations – Singapore, Malaysia, Indonesia, China and Hong Kong. In 2018, our supply chain spending increased significantly as we have extended the reporting scope by including Indonesia.
Total Supply Chain Spending
Notes: (1) To be consistent with our financial statements, we have included the performance of Great Eastern Holdings in this table. (2) 2017 figures were restated with the adoption of Singapore Financial Reporting Standards (International) (SFRS(I)). (3) Local is defined as registered in same country.
92% 2017
88% 2016
90% 2017
90% 2016
S$1.18b 2017
S$1.25b2016
9,3802017
9,873 2016
Total Vendors
10,302 2018
Total Supply Chain Spending
S$1.88b 2018
Local Spending(3)
92% 2018
Local Vendors
90% 2018
Our economic contributions arise from compensation to our employees, taxes to the authorities, retained earnings and dividends to our shareholders and payments to our suppliers.
Economic Contributions (1)
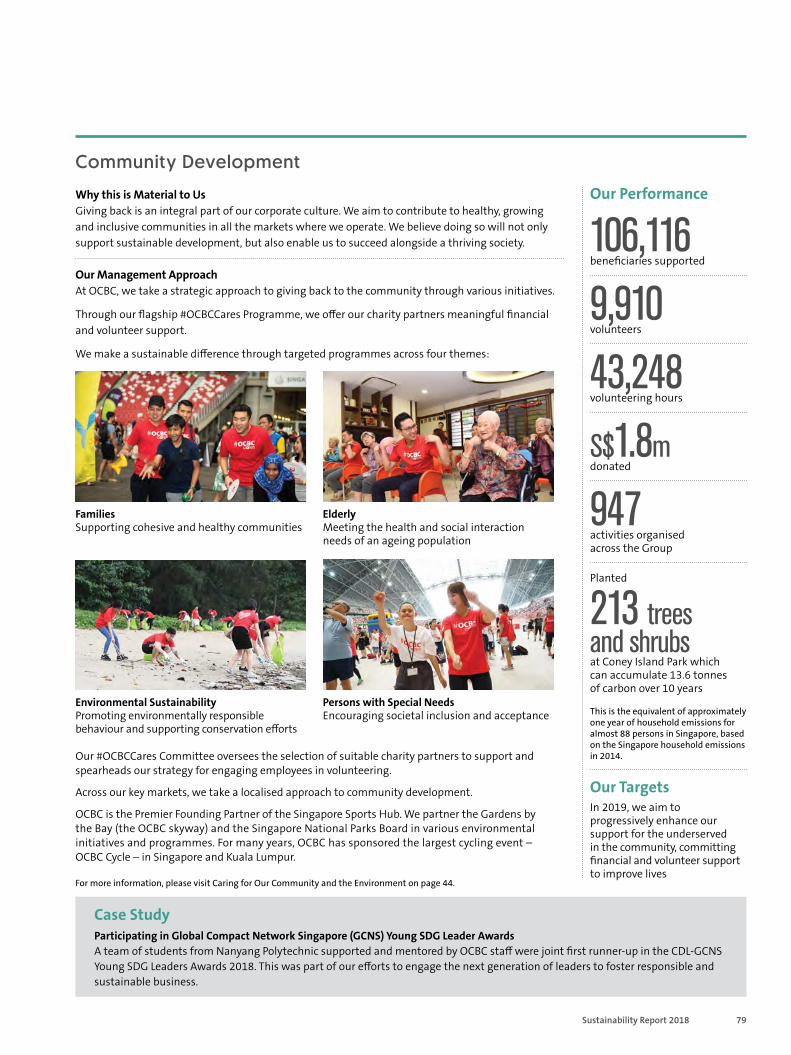
79Sustainability Report 2018
Community Development
Why this is Material to Us Giving back is an integral part of our corporate culture. We aim to contribute to healthy, growing and inclusive communities in all the markets where we operate. We believe doing so will not only support sustainable development, but also enable us to succeed alongside a thriving society.
Our Performance
106,116 beneficiaries supported
9,910 volunteers
43,248 volunteering hours
S$1.8m donated
947 activities organised across the Group
Planted
213 trees and shrubs at Coney Island Park which can accumulate 13.6 tonnes of carbon over 10 years
This is the equivalent of approximately one year of household emissions for almost 88 persons in Singapore, based on the Singapore household emissions in 2014.
Our Targets In 2019, we aim to progressively enhance our support for the underserved in the community, committing financial and volunteer support to improve lives
Our Management Approach At OCBC, we take a strategic approach to giving back to the community through various initiatives.
Through our flagship #OCBCCares Programme, we offer our charity partners meaningful financial and volunteer support.
We make a sustainable difference through targeted programmes across four themes:
Families Supporting cohesive and healthy communities
Elderly Meeting the health and social interaction needs of an ageing population
Environmental Sustainability Promoting environmentally responsible behaviour and supporting conservation efforts
Persons with Special Needs Encouraging societal inclusion and acceptance
Participating in Global Compact Network Singapore (GCNS) Young SDG Leader Awards A team of students from Nanyang Polytechnic supported and mentored by OCBC staff were joint first runner-up in the CDL-GCNS Young SDG Leaders Awards 2018. This was part of our efforts to engage the next generation of leaders to foster responsible and sustainable business.
Case Study
Our #OCBCCares Committee oversees the selection of suitable charity partners to support and spearheads our strategy for engaging employees in volunteering.
Across our key markets, we take a localised approach to community development.
OCBC is the Premier Founding Partner of the Singapore Sports Hub. We partner the Gardens by the Bay (the OCBC skyway) and the Singapore National Parks Board in various environmental initiatives and programmes. For many years, OCBC has sponsored the largest cycling event – OCBC Cycle – in Singapore and Kuala Lumpur.
For more information, please visit Caring for Our Community and the Environment on page 44.
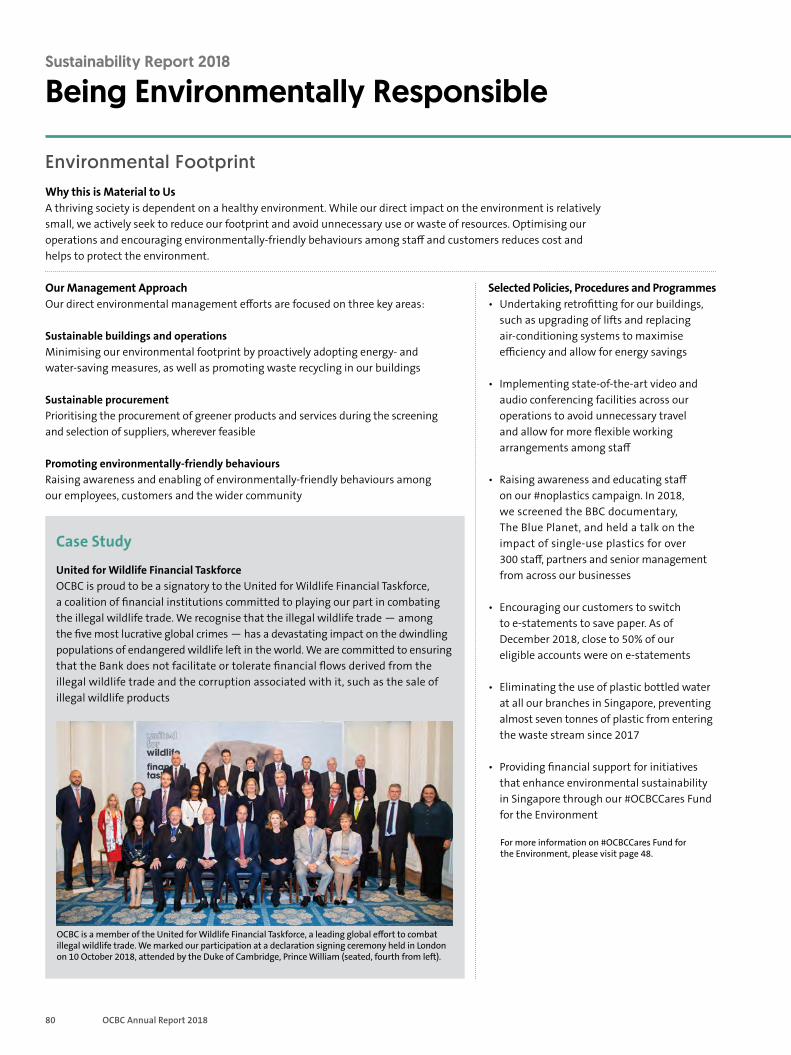
80 OCBC Annual Report 2018
Sustainability Report 2018
Being Environmentally Responsible
Environmental Footprint Why this is Material to Us A thriving society is dependent on a healthy environment. While our direct impact on the environment is relatively small, we actively seek to reduce our footprint and avoid unnecessary use or waste of resources. Optimising our operations and encouraging environmentally-friendly behaviours among staff and customers reduces cost and helps to protect the environment.
Our Management Approach Our direct environmental management efforts are focused on three key areas:
Sustainable buildings and operations Minimising our environmental footprint by proactively adopting energy- and water-saving measures, as well as promoting waste recycling in our buildings
Sustainable procurement Prioritising the procurement of greener products and services during the screening and selection of suppliers, wherever feasible
Promoting environmentally-friendly behaviours Raising awareness and enabling of environmentally-friendly behaviours among our employees, customers and the wider community
Selected Policies, Procedures and Programmes • Undertaking retrofitting for our buildings,
such as upgrading of lifts and replacing air-conditioning systems to maximise efficiency and allow for energy savings
• Implementing state-of-the-art video and audio conferencing facilities across our operations to avoid unnecessary travel and allow for more flexible working arrangements among staff
• Raising awareness and educating staff on our #noplastics campaign. In 2018, we screened the BBC documentary, The Blue Planet, and held a talk on the impact of single-use plastics for over 300 staff, partners and senior management from across our businesses
• Encouraging our customers to switch to e-statements to save paper. As of December 2018, close to 50% of our eligible accounts were on e-statements
• Eliminating the use of plastic bottled water at all our branches in Singapore, preventing almost seven tonnes of plastic from entering the waste stream since 2017
• Providing financial support for initiatives that enhance environmental sustainability in Singapore through our #OCBCCares Fund for the Environment
For more information on #OCBCCares Fund for the Environment, please visit page 48.
OCBC is a member of the United for Wildlife Financial Taskforce, a leading global effort to combat illegal wildlife trade. We marked our participation at a declaration signing ceremony held in London on 10 October 2018, attended by the Duke of Cambridge, Prince William (seated, fourth from left).
United for Wildlife Financial Taskforce OCBC is proud to be a signatory to the United for Wildlife Financial Taskforce, a coalition of financial institutions committed to playing our part in combating the illegal wildlife trade. We recognise that the illegal wildlife trade — among the five most lucrative global crimes — has a devastating impact on the dwindling populations of endangered wildlife left in the world. We are committed to ensuring that the Bank does not facilitate or tolerate financial flows derived from the illegal wildlife trade and the corruption associated with it, such as the sale of illegal wildlife products
Case Study
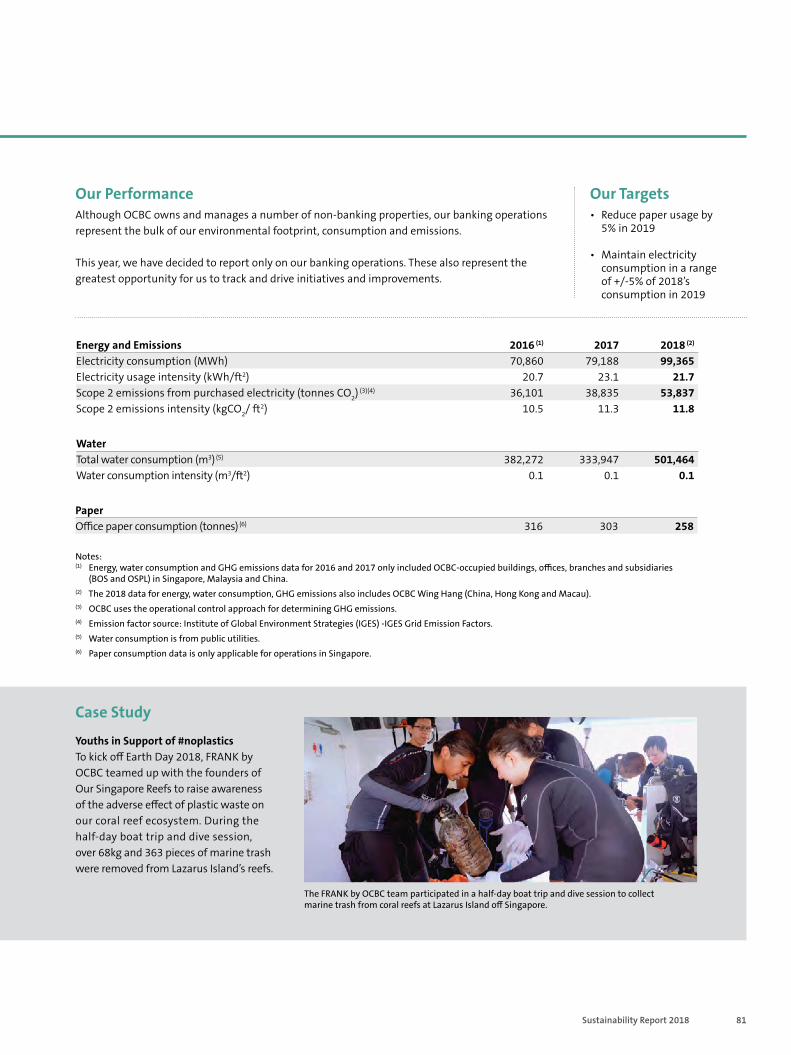
81Sustainability Report 2018
Environmental Footprint
Our Performance Our Targets Although OCBC owns and manages a number of non-banking properties, our banking operations represent the bulk of our environmental footprint, consumption and emissions.
This year, we have decided to report only on our banking operations. These also represent the greatest opportunity for us to track and drive initiatives and improvements.
• Reduce paper usage by 5% in 2019
• Maintain electricity consumption in a range of +/-5% of 2018’s consumption in 2019
Case Study
The FRANK by OCBC team participated in a half-day boat trip and dive session to collect marine trash from coral reefs at Lazarus Island off Singapore.
Youths in Support of #noplastics To kick off Earth Day 2018, FRANK by OCBC teamed up with the founders of Our Singapore Reefs to raise awareness of the adverse effect of plastic waste on our coral reef ecosystem. During the half-day boat trip and dive session, over 68kg and 363 pieces of marine trash were removed from Lazarus Island’s reefs.
Energy and Emissions 2016 (1) 2017 2018 (2)
Electricity consumption (MWh) 70,860 79,188 99,365 Electricity usage intensity (kWh/ft2) 20.7 23.1 21.7 Scope 2 emissions from purchased electricity (tonnes CO2) (3)(4) 36,101 38,835 53,837 Scope 2 emissions intensity (kgCO2/ ft2) 10.5 11.3 11.8
Water Total water consumption (m3) (5) 382,272 333,947 501,464 Water consumption intensity (m3/ft2) 0.1 0.1 0.1
Paper Office paper consumption (tonnes) (6) 316 303 258
Notes: (1) Energy, water consumption and GHG emissions data for 2016 and 2017 only included OCBC-occupied buildings, offices, branches and subsidiaries
(BOS and OSPL) in Singapore, Malaysia and China. (2) The 2018 data for energy, water consumption, GHG emissions also includes OCBC Wing Hang (China, Hong Kong and Macau). (3) OCBC uses the operational control approach for determining GHG emissions. (4) Emission factor source: Institute of Global Environment Strategies (IGES) -IGES Grid Emission Factors. (5) Water consumption is from public utilities. (6) Paper consumption data is only applicable for operations in Singapore.
82 OCBC Annual Report 2018
OCBC Bank is fully committed to integrity and fair dealing in all its activities, and upholds the highest standards of corporate governance. The Bank complies with the Banking (Corporate Governance) Regulations 2005 and the supplementary principles and guidelines prescribed under MAS Guidelines on Corporate Governance for Financial Holding Companies, Banks, Direct Insurers, Reinsurers and Captive Insurers Incorporated in Singapore issued on 3 April 2013 and has early adopted all material aspects of the Code of Corporate Governance 2018 (the Code).
Corporate Governance
A summary of the disclosures made pursuant to the Bank’s corporate governance arrangements are provided on pages 98 to 99 of this Annual Report.
Board Matters
Principle 1: The Board’s Conduct of Affairs The Board is elected by the shareholders to supervise the management of the business and affairs of the Bank. The prime stewardship responsibility of the Board is to ensure the viability of the Bank and to ensure that it is managed in the best interests of the Bank as a whole while taking into account the interests of shareholders and other stakeholders. The Bank has a board charter approved by the Board.
Broadly, the responsibilities of the Board include the following: • reviewing and approving overall
business strategy as well as organisation structure, as developed and recommended by management;
• ensuring that decisions and investments are consistent with long-term strategic goals;
• ensuring that the Bank operates in such a way as to preserve its financial integrity and in accordance with policies approved by the Board;
• overseeing, through the Audit Committee, the quality and integrity of the accounting and financial reporting systems, disclosure controls and procedures and internal controls; and, through the Risk Management Committee, the quality of the risk management processes and systems;
• providing oversight in ensuring that the Bank’s risk appetite and activities are
consistent with its strategic intent, the operating environment and effective internal controls, as well as capital sufficiency and regulatory standards;
• overseeing, through the Risk Management Committee, the establishment and operation of an independent risk management system for managing risks on an enterprise-wide basis, the adequacy of the risk management function (including ensuring that it is sufficiently resourced to monitor risk by the various risk categories and that it has appropriate independent reporting lines), and the quality of the risk management processes and systems;
• reviewing any transaction for the acquisition or disposal of assets that is material to the Bank;
• ensuring that the necessary human resources are in place for the Bank to meet its objectives;
• reviewing management performance and ensuring that management formulates policies and processes to promote fair practices and high standards of business conduct by staff;
• establishing corporate values and standards, emphasising integrity, honesty and proper conduct at all times with respect to internal dealings and external transactions, including situations where there are potential conflicts of interest;
• overseeing, through the Nominating Committee, the appointments, re-election and resignation of Directors of the Bank as well as the appointment, dismissal and resignation of senior management, ensuring that principles of transparency and meritocracy are observed;
• overseeing, through the Remuneration Committee, the design and operation of an appropriate remuneration framework, and ensuring that remuneration practices are aligned to and in accord with the remuneration framework;
• providing a balanced and understandable assessment of the Bank’s performance, position and prospects, including interim and other price-sensitive public reports as well as reports to regulators;
• ensuring that obligations to shareholders and others are understood and met;
• maintaining records of all meetings of the Board and Board Committees, particularly records of discussion on key deliberations and decisions taken;
• identifying the key stakeholder groups, recognising that perceptions affect the Bank’s reputation; and
• considering sustainability issues, e.g. environmental and social factors, as part of strategy formulation.
Directors with conflicts of interests are required under the Bank’s Constitution to recuse themselves from meetings and decisions involving issues of conflicts.
Board ApprovalThe Bank has documented internal guidelines for matters that require Board approval. These guidelines are communicated to management in writing. Matters which are specifically reserved for Board approval, amongst others, are: • material acquisition and disposal
of assets; • corporate or financial restructuring; and • share issuance, dividends and other
returns to shareholders.
83Governance
The Board approves transactions exceeding certain threshold limits, while delegating authority for transactions below those limits to the Board Committees and management to optimise operational efficiency.
Board Access to InformationAs a general rule, Directors are provided with complete information related to agenda items about seven days before each meeting to allow adequate time for review. Directors are also equipped with electronic tablets that allow secure access to Board and Board Committee meeting materials. Information provided includes background information on matters to be addressed by the Board, copies of disclosure documents, monthly internal financial statements, risk management reports, operating plans, forecasts, and reports of variances from operating plans and forecasts.
The Board and its committees have unfettered access to information which the Bank is in possession of and to the Bank’s senior management and Company Secretary. The Directors, individually or as a group, can also take independent professional advice from legal firms at the Bank’s expense. The role of the Company Secretary is defined. The Company Secretary attends all board meetings and ensures that board procedures and applicable regulations are complied with. Under the direction of the Chairman, the Company Secretary ensures good information flows within the Board and its committees and between senior management and non-executive Directors, and facilitates the orientation of new Directors and professional development of Directors, as required. The appointment and removal of the Company Secretary is considered to be a matter for the Board as a whole.
Board CommitteesWhile the Board has ultimate responsibility for the affairs of the Bank, various Board Committees have been established to assist the Board in discharging its duties more effectively. The Board Committees have clearly-defined terms of reference and changes to the terms require Board approval. The Board and its committees
maintain records of all meetings setting out in detail key deliberations and decisions taken. The minutes of each committee meeting are also circulated to members of the Board who are not members of that particular committee. The composition and summary terms of reference of each of these committees are as follows.
• Executive Committee The Executive Committee comprises Mr Ooi Sang Kuang (Chairman), Dr Lee Tih Shih, Mr Quah Wee Ghee, Mr Tan Ngiap Joo, Mr Samuel N. Tsien and Mr Wee Joo Yeow. A majority of the Committee, i.e. Mr Ooi Sang Kuang, Mr Quah Wee Ghee, Mr Tan Ngiap Joo and Mr Wee Joo Yeow, are independent Directors.
The Committee has written terms of reference that describe the responsibilities of its members.
The Executive Committee oversees – within the parameters delegated by the Board – the management of the business and affairs of the Bank and the Group. It reviews the Bank’s policies, principles, strategies, values, objectives and performance targets. These include investment and divestment policies. It also endorses such other matters and initiates such special reviews and actions as are appropriate for the prudent management of the Bank.
• Nominating Committee The Nominating Committee comprises Mr Tan Ngiap Joo (Chairman), Mr Ooi Sang Kuang, Mr Lai Teck Poh, Dr Lee Tih Shih and Mr Wee Joo Yeow. A majority of the Committee, i.e. Mr Tan Ngiap Joo, Mr Ooi Sang Kuang, Mr Lai Teck Poh and Mr Wee Joo Yeow, are independent Directors.
The Committee has written terms of reference that describe the responsibilities of its members.
The Nominating Committee plays a vital role in reinforcing the principles of
transparency and meritocracy at the Bank. It plans for board succession and ensures that only the most competent individuals capable of contributing to the success of the organisation are appointed. This includes reviewing all nominations for the appointment, election or re-election – as well as resignations – of Directors of the Bank and members of the Executive Committee, Remuneration Committee, Audit Committee, Risk Management Committee and Ethics and Conduct Committee. The Nominating Committee is also charged with determining annually whether or not a Director is independent, capable of carrying out the relevant duties and qualified to remain in office. In addition, it reviews nominations for and dismissals or resignations of senior management positions in the Bank, including the Chief Executive Officer (CEO), Chief Operating Officer, Chief Financial Officer, Chief Risk Officer and Chief Information Officer (Head, Group Operations and Technology). It makes recommendations to the Board on all such appointments, including the compensation package for offer of employment, promotion and cessation of employment. The Nominating Committee reviews obligations arising in the event of the termination of the contracts of service of executive Directors and senior management, to ensure such contracts contain fair and reasonable termination clauses.
• Audit Committee The Audit Committee comprises Mr Chua Kim Chiu (Chairman), Mr Lai Teck Poh, Ms Christina Ong and Mr Tan Ngiap Joo. All the Committee members are independent Directors. Three members, including the Chairman, have recent and relevant accounting or related financial management expertise or experience. The members have not been partners or directors of KPMG LLP, the external auditor, and none of them hold any financial interest in KPMG LLP.
The Audit Committee performs the functions specified in the Companies Act, the Code, the Singapore Exchange
84 OCBC Annual Report 2018
Corporate Governance Securities Trading Limited (SGX-ST) Listing
Manual, and the corporate governance regulations and guidelines issued by the Monetary Authority of Singapore (MAS).
The Committee has written terms of reference that describe the responsibilities of its members. The Board approves the terms of reference of the Audit Committee. The Committee may meet at any time and no fewer than four times a year. It has full access to and co-operation from management, and has the discretion to invite any Director and executive officer to attend its meetings. It has explicit authority to investigate any matter within its terms of reference.
Further information on the Audit Committee is provided under Principle 10 on pages 93 to 96.
• Remuneration Committee The Remuneration Committee comprises Mr Wee Joo Yeow (Chairman), Mr Ooi Sang Kuang, Ms Christina Ong, Mr Quah Wee Ghee and Mr Tan Ngiap Joo. All are independent Directors well versed in executive compensation matters, given their extensive experience in senior corporate positions and major appointments.
The Committee has written terms of reference that describe the responsibilities of its members.
The Remuneration Committee recommends to the Board a framework for determining the remuneration of executive officers, and reviews the remuneration practices to ensure that they are aligned with the approved framework. It is empowered to review the human resource management policies and the policies governing the
compensation of executive officers of the Bank and its subsidiaries, as well as the remuneration of senior executives and Directors. In addition, the Remuneration Committee administers the various employee share ownership schemes. In its deliberations, the Remuneration Committee takes into account remuneration principles, practices and standards that may be specified by MAS from time to time.
• Risk Management Committee The Risk Management Committee, which supports the Board in performing its risk oversight responsibilities, comprises Mr Lai Teck Poh (Chairman), Mr Ooi Sang Kuang, Mr Chua Kim Chiu, Mr Pramukti Surjaudaja, Mr Samuel N. Tsien and Mr Wee Joo Yeow. All the Committee members, except Mr Samuel N. Tsien, are non-executive Directors. Members of the Committee have relevant technical financial understanding in risk disciplines or business experience. Mr Lai Teck Poh and Mr Chua Kim Chiu also serve on the Audit Committee. The common membership helps to facilitate communication and foster the sharing of information and knowledge between the two committees.
The Committee has written terms of reference that describe the responsibilities of its members.
The Committee sets the overall risk management philosophy, approves risk management frameworks and major policies, as well as reviews the risk profile, risk tolerance level and risk strategy of the Bank for effective risk management. The Committee reviews the scope, effectiveness and objectivity of Group Risk Management and the risk reports that monitor and control risk exposures. It also oversees the establishment and operation
of an independent risk management system for identifying, measuring, monitoring, controlling and reporting risks on an enterprise-wide basis, including ensuring the adequacy of risk management practices for material risks. The Chief Risk Officer has a direct reporting line to the Committee as well as to the CEO.
Activities performed by the Risk Management Committee are also described under the section on Risk Management on pages 103 to 113.
• Ethics and Conduct Committee The Ethics and Conduct Committee was established in January 2019 to support the Board in overseeing ethics and conduct within the Bank. The Committee comprises Mr Ooi Sang Kuang (Chairman), Dr Lee Tih Shih and Ms Christina Ong. All the Committee members are non-executive Directors.
The Committee has written terms of reference that describe the responsibilities of its members.
The Committee reviews and assesses the state and implementation of ethics and conduct programmes and initiatives, including matters relating to fair dealing with customers, to ensure proper behaviour within the Bank in respect of ethics and conduct. It also reviews policies and guidelines pertaining to ethics and conduct to ensure they are relevant and up to date, and reviews communications to stakeholders on ethics and conduct and their effectiveness with regard to the reputation of the Bank. The Committee supports a strong and responsible organisation culture firmly founded on the Bank’s core values.
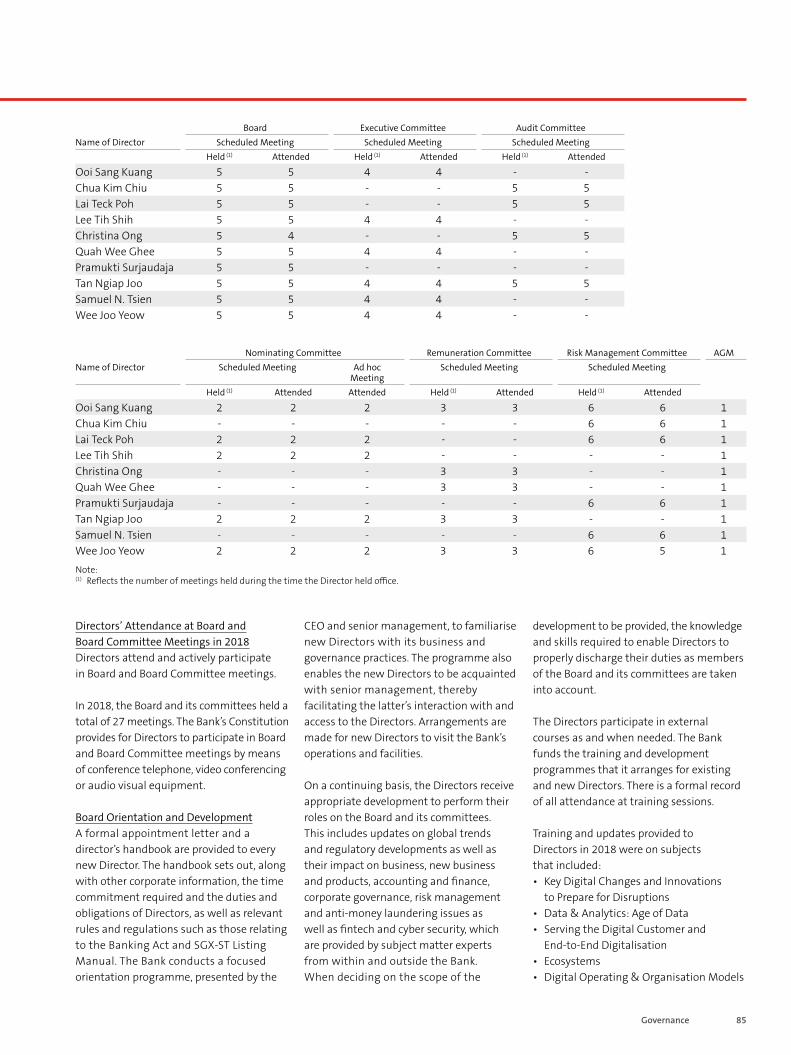
85Governance
Directors’ Attendance at Board and Board Committee Meetings in 2018Directors attend and actively participate in Board and Board Committee meetings.
In 2018, the Board and its committees held a total of 27 meetings. The Bank’s Constitution provides for Directors to participate in Board and Board Committee meetings by means of conference telephone, video conferencing or audio visual equipment.
Board Orientation and DevelopmentA formal appointment letter and a director’s handbook are provided to every new Director. The handbook sets out, along with other corporate information, the time commitment required and the duties and obligations of Directors, as well as relevant rules and regulations such as those relating to the Banking Act and SGX-ST Listing Manual. The Bank conducts a focused orientation programme, presented by the
CEO and senior management, to familiarise new Directors with its business and governance practices. The programme also enables the new Directors to be acquainted with senior management, thereby facilitating the latter’s interaction with and access to the Directors. Arrangements are made for new Directors to visit the Bank’s operations and facilities.
On a continuing basis, the Directors receive appropriate development to perform their roles on the Board and its committees. This includes updates on global trends and regulatory developments as well as their impact on business, new business and products, accounting and finance, corporate governance, risk management and anti-money laundering issues as well as fintech and cyber security, which are provided by subject matter experts from within and outside the Bank. When deciding on the scope of the
development to be provided, the knowledge and skills required to enable Directors to properly discharge their duties as members of the Board and its committees are taken into account.
The Directors participate in external courses as and when needed. The Bank funds the training and development programmes that it arranges for existing and new Directors. There is a formal record of all attendance at training sessions.
Training and updates provided to Directors in 2018 were on subjects that included: • Key Digital Changes and Innovations
to Prepare for Disruptions • Data & Analytics: Age of Data • Serving the Digital Customer and
End-to-End Digitalisation • Ecosystems • Digital Operating & Organisation Models
Board Executive Committee Audit Committee Name of Director Scheduled Meeting Scheduled Meeting Scheduled Meeting
Held (1) Attended Held (1) Attended Held (1) Attended
Ooi Sang Kuang 5 5 4 4 - -Chua Kim Chiu 5 5 - - 5 5Lai Teck Poh 5 5 - - 5 5Lee Tih Shih 5 5 4 4 - -Christina Ong 5 4 - - 5 5Quah Wee Ghee 5 5 4 4 - -Pramukti Surjaudaja 5 5 - - - -Tan Ngiap Joo 5 5 4 4 5 5Samuel N. Tsien 5 5 4 4 - -Wee Joo Yeow 5 5 4 4 - -
Nominating Committee Remuneration Committee Risk Management Committee AGM Name of Director Scheduled Meeting Ad hoc
Meeting Scheduled Meeting Scheduled Meeting
Held (1) Attended Attended Held (1) Attended Held (1) Attended
Ooi Sang Kuang 2 2 2 3 3 6 6 1 Chua Kim Chiu - - - - - 6 6 1 Lai Teck Poh 2 2 2 - - 6 6 1 Lee Tih Shih 2 2 2 - - - - 1 Christina Ong - - - 3 3 - - 1 Quah Wee Ghee - - - 3 3 - - 1 Pramukti Surjaudaja - - - - - 6 6 1 Tan Ngiap Joo 2 2 2 3 3 - - 1 Samuel N. Tsien - - - - - 6 6 1 Wee Joo Yeow 2 2 2 3 3 6 5 1 Note: (1) Reflects the number of meetings held during the time the Director held office.

86 OCBC Annual Report 2018
Corporate Governance • Technology Risk Updates • Implications of MAS Notice on
Cyber Hygiene • Anti-Money Laundering/Countering
the Financing of Terrorism
Principle 2: Board Composition and Guidance The Bank has majority representation of independent Directors on its Board.
An independent Director in OCBC Bank is one who is independent of any management, substantial shareholder, business relationship with the Bank, and who has not served for more than nine years on the Board. The Board at present comprises ten Directors of whom seven, a majority, are independent Directors. They are Mr Ooi Sang Kuang, Mr Chua Kim Chiu, Mr Lai Teck Poh, Ms Christina Ong, Mr Quah Wee Ghee, Mr Tan Ngiap Joo and Mr Wee Joo Yeow.
Ms Christina Ong is senior partner and co-chairman of Allen & Gledhill LLP (A&G), one of several law firms which provides legal services to and receives fees from the Bank. Her interest in A&G is however less than 5% and the fees paid by the Group does not form a significant portion of A&G’s revenue. She is also an independent director of Singapore Telecommunications Limited which provides telecommunication services to and receives payments from the Bank, not unlike many organisations in Singapore. The Nominating Committee is of the view that these business relationships do not affect her disposition to act independently.
Dr Lee Tih Shih is not independent of a substantial shareholder. Mr Samuel N. Tsien and Mr Pramukti Surjaudaja are not independent of management. Mr Samuel N. Tsien is executive Director and CEO. Mr Pramukti Surjaudaja has an immediate family member, a sister, who is chief executive of the Bank’s subsidiary, PT Bank OCBC NISP Tbk.
The Board reviews the size of Board and Board Committees annually and it considers the current number of Board and Board Committee members to be appropriate
given the size of the Group and its business complexity. It also assesses the diversity of members’ profiles and determines the collective skills required to discharge its responsibilities effectively. A Board Diversity Policy, setting out the approach to diversify the appointment of members and composition of the Board is published on the Bank’s website. The policy embraces the diversity of skills, knowledge, experience including familiarity in the Bank’s core markets, age, gender and length of service as well as merit and independence. Steps are taken to improve effectiveness where necessary. It is assessed that the members of the Board as a group provide the appropriate balance and mix of skills, knowledge, experience, competencies and other aspects of diversity such as gender and age that foster constructive debate and ensure the effectiveness of the Board and its committees. Skills, knowledge and experience include banking, insurance, accounting, finance, law, strategy formulation, business acumen, management experience, understanding of industry and customer, familiarity with regulatory requirements and knowledge of risk management. Details of the Directors’ professional qualifications, background and age can be found on pages 24 to 27.
The non-executive Directors on the Board constructively challenge and help develop proposals on strategy, review the performance of management in meeting agreed goals and objectives, and monitor the reporting of performance. They meet during the year, without the presence of management, to discuss the effectiveness of management.
Separate sessions are also arranged for the independent Directors to meet at least once a year to ensure effective corporate governance in managing the affairs of the Board and the Bank.
The Board and senior executives meet as frequently as necessary to develop or refresh strategies for the Group.
Principle 3: Chairman and Chief Executive Officer The Chairman and CEO are not related.
The roles of the Chairman and the CEO are separated, which is consistent with the principle of instituting an appropriate balance of power and authority. The Chairman’s responsibilities, to name a few, include leading the Board to ensure its effectiveness in all aspects of its role; setting its meeting agenda; ensuring that Directors receive accurate, timely and clear information; ensuring effective communication with shareholders; encouraging constructive relations between the Board and management; facilitating the effective contribution of non-executive Directors; ensuring constructive relations between executive and non-executive Directors; and promoting high standards of corporate governance. The Bank does not appoint a Lead Independent Director as the Chairman is an independent Director.
Principle 4: Board Membership As a principle of good corporate governance, all Directors are subject to re-nomination and re-election at regular intervals and at least every three years. The Bank’s Constitution provides for the retirement of Directors by rotation and all appointments and re-appointments of Directors have to be approved by MAS.
The Board establishes a Nominating Committee to make recommendations to the Board on matters relating to board membership. The Committee reviews the independence of Directors at least annually in accordance with internal due diligence procedures and the Directors’ declarations. It also reviews the succession plans for Directors, including the appointment and/or replacement of the Chairman and executive Director, and ensures that only the most competent individuals capable of contributing to the success of the organisation are appointed. It reviews all nominations for the appointment, election or re-election – as well as resignations – of Directors of the Bank and members of the Executive Committee, Remuneration Committee, Audit Committee, Risk Management Committee and Ethics and Conduct Committee. It is also charged with determining annually whether or not a Director is independent, capable of carrying out relevant duties and qualified to remain in office.
87Governance
The Nominating Committee establishes annually the profile required of Board members, having regard to the competencies and skills required, and makes recommendations to the Board on the appointment of new Directors, when necessary. When the need for a new Director is identified, the Nominating Committee will prepare a shortlist of candidates with the appropriate profile and qualities for nomination. The Nominating Committee may engage external search consultants to search for the Director. The Board reviews the recommendation of the Nominating Committee and appoints the new Director, subject to the approval of MAS. In accordance with the Bank’s Constitution, the new Director will hold office until the next Annual General Meeting (AGM) and, if eligible, may then stand for re-election.
The Bank does not, as a matter of practice, appoint alternate directors.
Directors are aware of their duties and obligations and the expectation to set aside adequate time for their oversight of matters relating to the Bank. They attend and actively participate in Board and Board Committee meetings. The number of such meetings and each director’s attendances at such meetings are disclosed in the annual report. They must provide declarations of any changes in their other appointments and principal commitments, which are disseminated to all Board members. The Bank has guidelines on meeting attendance and the extent of other appointments that a Director can assume. The Nominating Committee, based on the guidelines established, assesses annually each Director’s attendance record and degree of participation at meetings to determine if a Director is able to and has been adequately carrying out his or her duties as a Director of the Bank. In respect of other appointments, it takes into account – among various factors – the nature of an appointment (full-time or otherwise), number of meetings to attend, complexity of organisation and degree of participation in sub-committees. Generally, a Director who has full-time employment in any organisation shall have appointments in
no more than three other listed companies, while a Director who has no full-time employment shall have appointments in no more than six other listed companies.
Key information on the Directors’ qualifications, working experience, and other directorships and principal commitmments/appointments are provided on pages 24 to 27 while information on their shareholdings in the Bank and its related corporations are provided in the Directors’ Statement on pages 134 to 139.
Principle 5: Board Performance The Board has an annual performance evaluation process, carried out by the Nominating Committee, Nominating Committee Chairman and Board Chairman, to assess the effectiveness of the Board, Board Committees and each Director’s contribution. The purpose of the evaluation process is to increase the overall effectiveness of the Board.
An external party is engaged after every three years to facilitate the Board evaluation process and to provide the Board with an independent perspective of the Board’s performance, including benchmarking against peer boards and industry best practices. In 2018, the Nominating Committee engaged Aon Hewitt to facilitate the board evaluation process. Aon Hewitt and its consultants are independent and not related to the Bank or its Directors.
The Directors participate in the evaluation. Each Director evaluates the performance of the Board and Board Committees whilst the Chairman and Nominating Committee Chairman evaluate the performance of each Director and meet to discuss the matter. The assessments are made against pre-established criteria which are derived from the Board’s charter and responsibilities. The results of the evaluation are used constructively to discuss improvements to the Board and ensure that each Director remains qualified for office. The Chairman and/or Nominating Committee Chairman acts on the results of the evaluation, and if appropriate, proposes new Directors or seeks
the resignation of Directors, in consultation with the Nominating Committee.
Remuneration Matters
Principle 6: Procedures for Developing Remuneration Policies The objective of the Bank’s remuneration policy is to attract, motivate, reward and retain talented and competent staff globally. The Board ensures that remuneration policies are in line with the strategic objectives and corporate values of the Bank, and do not give rise to conflicts between the objectives of the Bank and the interests of individual Directors or key executives.
The Remuneration Committee is tasked to review and recommend to the Board the general remuneration framework as well as the specific remuneration for each Director and for each key executive. The composition and summary terms of reference of the Remuneration Committee are provided on page 84. No member of the Remuneration Committee is involved in the deliberations regarding any remuneration, compensation, options or any form of benefits to be granted to himself or herself.
In its review of the Bank’s remuneration practices, the Remuneration Committee can seek expert advice, if necessary. In 2018, the Bank used salary surveys conducted by external compensation consultants, McLagan (a business unit of Aon Hewitt) and Willis Towers Watson for the purpose of benchmarking employee salaries in Singapore and overseas. McLagan and Willis Towers Watson and their consultants are independent and are not related to the Bank or its subsidiaries or any of their directors. The Bank’s compensation practices are also reviewed annually by McLagan against the Financial Stability Forum’s principles and implementation standards for Sound Compensation Practices for significant financial institutions.
The Bank’s remuneration policy is applied to all OCBC overseas branches and the
88 OCBC Annual Report 2018
Corporate Governance following subsidiaries: • Bank of Singapore Ltd • OCBC Management Services Pte Ltd • OCBC Securities Pte Ltd • OCBC Investment Research Pte Ltd • BOS Trustee Ltd • e2 Power Pte Ltd • e2 Power Sendirian Berhad • OCBC Bank (Malaysia) Berhad • OCBC Al-Amin Bank Berhad • OCBC Wing Hang Bank Ltd • OCBC Wing Hang Bank (China) Ltd
The Bank does not provide for any termination, retirement or post-employment benefits to executive Directors or the top five key management personnel.
Principle 7: Level and Mix of Remuneration
Compensation for Non-Executive Directors OCBC’s remuneration for non-executive Directors is intended to attract capable individuals to the Board, as well as retain and motivate them in their roles as non-executive Directors. It aligns their interests with those of shareholders, is competitive in the region and recognises individual contributions. The remuneration for non-executive Directors is subject to shareholder approval at the AGM.
The Remuneration Committee has considered market practices for non-executive director compensation. On its recommendation, the Board has decided to maintain the fee structure unchanged from the previous year. The fee structure for the newly established Ethics and Conduct Committee is similar to that of the Nominating Committee and Remuneration Committee.
The resolution proposing the fee for non-executive Directors will be presented to shareholders at the AGM in April 2019.
In the previous year, shareholders had approved the grant of 6,000 remuneration shares to each non-executive Director. The remuneration shares align the interests of non-executive Directors with the interests of shareholders. At the recommendation of the Remuneration Committee, the Board has decided to continue with the granting of 6,000 new ordinary shares to each non-executive Director. Any non-executive Director who has served on the Board for less than a full financial year will be awarded shares on a pro-rated basis, according to how long he/she has served. The resolution proposing these share grants will be presented to shareholders at the AGM in April 2019.
Compensation for Executive DirectorsThe compensation for an executive Director is formulated and reviewed annually by the Remuneration Committee to ensure that it is market-competitive and that the rewards are commensurate with the contributions made. The compensation package comprises basic salary, benefits-in-kind, performance bonus, share awards and compensation in the event of early termination where service contracts are applicable. Performance bonus relate directly to the financial performance of the Group and the contributions of the executive Director. The guidelines on the granting of share awards to the executive Director are similar to those for the executives of the Bank.
Employee RemunerationThe total compensation packages for employees comprise basic salary, fixed bonus, variable performance bonus, allowances and deferred share awards for eligible executives, as well as benefits. Compensation is tied to the achievement of business and performance objectives based on a balanced scorecard approach and adherence to core values. Where relevant, financial measurements – adjusted as appropriate for the various types of risk (such as market, credit and operational risks) – include: • Operating efficiency measures covering
revenue, direct and allocated costs and operating profits, net profits as well as efficiency indicators such as unit costs.
• Economic efficiency measures such as cost of capital. Capital is attributed to each business based on the amount of risk-weighted assets used and the return on capital.
• Liquidity is factored into the performance measurement of each business through the application of liquidity premiums charged or credited according to the behavioural maturity of each type of asset and liability booked.
There were no significant changes to the above measures during 2018.
In the Bank’s continuous efforts to create sustainable value for stakeholders, relevant performance measures are set for each business unit. These objectives which include broad-based growth across its core markets, delivering sustained earnings momentum from core businesses, driving core competencies of disciplined risk management, diversified funding base and continued investments in technology and people, and ensuring sustainable business practices are also consistent with the Group’s risk appetite. In the determination of remuneration of senior executives, risk and control indicators as well as audit findings and compliance issues are taken into account when assessing business performance. Executives are remunerated based on the achievements of their own performance measures, and the demonstration of core values and
S$1,400,000
S$45,000
S$70,000
S$40,000
The fee structure is as follows:
• Board chairman’s fee
• Retainer fee
• Committee chairperson’s fee for the Audit, Risk Management and Executive Committees
• Committee chairperson’s fee for the Nominating, Remuneration, and Ethics and Conduct Committees
• Committee member’s fee for the Audit, Risk Management and Executive Committees (committee chairpersons are not awarded these fees)
• Committee member’s fee for the Nominating, Remuneration, and Ethics and Conduct Committees (committee chairpersons are not awarded these fees)
• Attendance fee per meeting
S$40,000
S$20,000
S$3,000
89Governance
competencies, while taking into account market compensation data for their respective job roles.
The performance of risk and compliance functions is measured independently of the businesses they oversee. Employees in these functions are assessed based on achievement related to their respective performance measures. Market compensation data on risk and compliance functions is also taken into account for remuneration.
In determining the composition of compensation packages, the Bank takes into account the time horizon of risk and includes, in the total compensation for executives, a significant portion of deferred payment in the form of deferred shares. All awards of deferred shares or share options (granted in previous years) are subject to cancellation and clawback if it is determined that they were granted on the basis of materially inaccurate financial statements and/or that the employee has engaged in conduct that results in financial loss, reputational harm, restatement of financial results and/or adverse changes to the Bank’s risk profile/rating. To ensure that its remuneration packages are competitive, the Bank regularly reviews salary levels and benefits packages based on market data provided by recognised consultants who conduct surveys on comparative groups in the financial sector. The determination of the Bank’s variable bonus pool is fully discretionary and the factors taken into consideration include financial and non-financial metrics like the Bank’s performance, audit ratings, risk indicators and compliance issues, market conditions and competitive market practices.
The Bank adopts a performance-driven approach to compensation. Compensation packages are linked to personal performance, the performance of each business unit, and the overall performance of the Bank. Compensation is reviewed each year based on information from market surveys provided by reputable management consultants.
As a consequence of the last financial crisis, the Financial Stability Forum developed
principles and implementation standards for Sound Compensation Practices for significant financial institutions. The Remuneration Committee made changes to the Bank’s compensation structure to increase the proportion of the deferred remuneration component for senior executives. The Bank’s compensation practices are reviewed annually by McLagan which has confirmed for 2018 that the Bank had met the Financial Stability Forum principles and implementation standards.
The Bank has identified a group of senior executives whose authority and actions are deemed to have a major influence on the long-term performance of the Bank. This group, identified as “Material Risk Takers” comprises senior management (the CEO and his direct reports), employees of Senior Vice President rank and above, key personnel at business units, senior control staff, and employees who had been awarded significant variable performance bonuses. For the “Material Risk Takers” with bonuses exceeding S$100,000, at least 40% of their variable performance bonuses are deferred in the form of shares. The Board approves the compensation of the CEO, Chief Financial Officer, Chief Operating Officer, Chief Risk Officer, Chief Information Officer (Head, Group Operations and Technology) and Head, Global Treasury, and the Remuneration Committee approves the compensation of all other senior executives of Senior Vice President rank and above, as well as the top five employees who had been awarded significant variable performance bonuses who are below the rank of Senior Vice President.
The performance evaluation for senior executives in 2018 has been conducted in accordance with the above objectives and considerations.
The remuneration practices for staff in bargainable positions are established through negotiation with the Bank’s unions.
Share Schemes
• OCBC Share Option Scheme 2001 The Bank has ceased granting share options under the OCBC Share Option
Scheme 2001 (the Scheme) effective from financial year 2018 remuneration. Share options granted in prior years continue to be outstanding until the options lapse or are exercised by the recipients.
The cumulative total number of new ordinary shares issued by the Bank in respect of options granted under the Scheme has not exceeded 10% of the Bank’s total number of issued ordinary shares.
The acquisition price for each ordinary share in respect of which the option is exercisable was determined by the Remuneration Committee to be the price equal to the average of the last dealt price of the shares for the five consecutive trading days immediately prior to the date of grant. No options have been granted at a discount to the price as determined above since the commencement of the Scheme.
The validity period of the options granted is subject to legislation applicable on the date of grant. Based on current legislation, options granted to Group executives are exercisable for up to 10 years, while options granted to non-executive Directors are exercisable for up to five years. The options may be exercised after the first anniversary of the date of grant, in accordance with a vesting schedule to be determined by the Remuneration Committee on the date of grant of the respective options. The Committee has adopted the following vesting schedule:
Percentage of shares for which an option is exercisable
On or before the Nil first anniversary of the date of grant
After the first anniversary 33% but on or before the second anniversary of the date of grant
After the second anniversary 33% but on or before the third anniversary of the date of grant
90 OCBC Annual Report 2018
Corporate Governance After the third anniversary 34%
but before the date of expiry of the exercise period
The options granted will lapse immediately upon termination of employment or appointment, except in the event of retirement, redundancy or death, or where approved by the Remuneration Committee, in which case the Committee may allow the options to be retained and exercisable within the relevant option periods or such option periods as may be determined by the Remuneration Committee. Shares granted upon the exercising of options are allocated from treasury shares or from new ordinary shares issued by the Bank.
All grants are subject to cancellation and clawback if it is determined that they were made on the basis of materially inaccurate financial statements and/or that the employee has engaged in conduct that results in financial loss, reputational harm, restatement of financial results and/or adverse changes to the Bank’s risk profile/rating.
• OCBC Deferred Share Plan The OCBC Deferred Share Plan (the Plan) aims to increase the performance-orientation and retention factor in compensation packages of executives, and foster an ownership culture within the organisation. It also aligns the interests of executives with the sustained business performance of the Bank. Group executives holding the rank or equivalent rank of Assistant Manager and above, and any Group Executive Director selected by the Remuneration Committee, are eligible to participate in the Plan. In 2018, the participants are executives of the Bank, selected overseas locations and subsidiaries.
Share awards are granted annually to eligible executives who are paid variable performance bonuses exceeding S$100,000. The share awards form 20%
to 40% of their total variable performance bonus for the year. Half (50%) of the share awards will vest after two years with the remaining 50% vesting at the end of three years in accordance with the guidelines established under the Plan. Prior to the vesting date, the executives will not be accorded voting rights for the shares.
Shares granted are allocated from treasury shares or acquired from the market in accordance with guidelines established under the Plan. The unvested deferred share grants will be adjusted to take into account dividends declared by the Bank. The additional shares granted in respect of this adjustment may be acquired from the market in accordance with guidelines established under the Plan.
The awards will lapse immediately upon termination of employment or appointment, except in the event of retirement, redundancy or death, or where approved by the Remuneration Committee, in which case the Committee may allow the awards to be retained and vested within the relevant vesting periods or such periods as may be determined by the Remuneration Committee.
All awards are subject to cancellation and clawback if it is determined that they were granted on the basis of materially inaccurate financial statements and/or that the employee has engaged in conduct that results in financial loss, reputational harm, restatement of financial results and/or adverse changes to the Bank’s risk profile/rating.
During the financial year, an aggregate of 6,446,996 ordinary shares were granted to eligible executives of the Group pursuant to the Plan.
• OCBC Employee Share Purchase Plan The OCBC Employee Share Purchase Plan (ESPP) was implemented for all employees of the participating companies in the Group, including executive Directors, to
inculcate in all participants a stronger and more lasting sense of identification with the Group.
The ESPP is a saving-based share ownership plan to help employees own ordinary shares in the Bank through their monthly contributions via deductions from payroll and/or CPF funds. The employees have the option to convert the contributions to ordinary shares after one year or to withdraw the contributions at any time. As a further incentive to employees to enrol in the ESPP, the Bank pays interest on the amounts saved at a preferential interest rate.
The duration of the offering period is 24 months and the share acquisition price is fixed before the offering period based on the average of the last traded prices over the five consecutive trading days immediately preceding the price fixing date. Shares granted upon conversions in accordance with the rules of the ESPP are allocated from treasury shares or from new ordinary shares issued by the Bank.
The aggregate number of new ordinary shares issued by the Bank pursuant to the ESPP, together with the aggregate number of any new ordinary shares issued pursuant to the Scheme, cannot exceed 15% of the Bank’s total number of issued ordinary shares. Notwithstanding the limits allowed under the relevant rules, the Bank had been applying a lower aggregate limit of 5% instead of 15% as a matter of conservative practice.
Principle 8: Disclosure on Remuneration The following disclosures should be read in conjunction with the remuneration policies, practices and share plans as described under Principles 6 and 7.
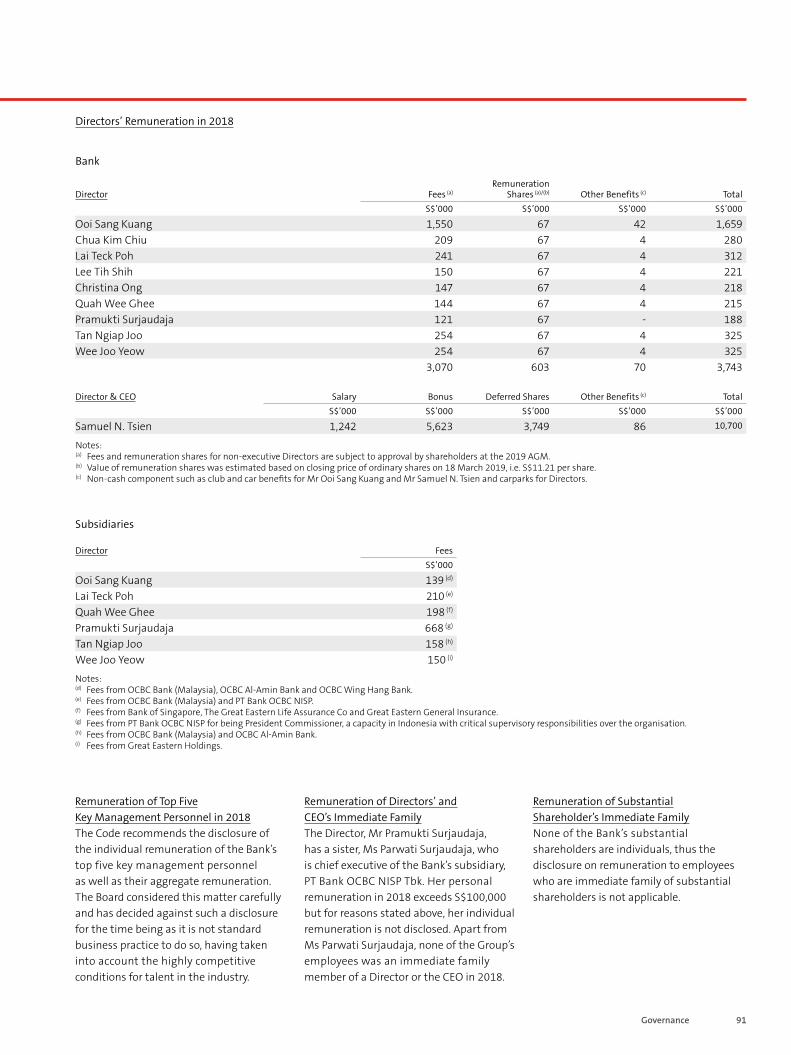
91Governance
Remuneration of Top Five Key Management Personnel in 2018The Code recommends the disclosure of the individual remuneration of the Bank’s top five key management personnel as well as their aggregate remuneration. The Board considered this matter carefully and has decided against such a disclosure for the time being as it is not standard business practice to do so, having taken into account the highly competitive conditions for talent in the industry.
Remuneration of Directors’ and CEO’s Immediate FamilyThe Director, Mr Pramukti Surjaudaja, has a sister, Ms Parwati Surjaudaja, who is chief executive of the Bank’s subsidiary, PT Bank OCBC NISP Tbk. Her personal remuneration in 2018 exceeds S$100,000 but for reasons stated above, her individual remuneration is not disclosed. Apart from Ms Parwati Surjaudaja, none of the Group’s employees was an immediate family member of a Director or the CEO in 2018.
Remuneration of Substantial Shareholder’s Immediate FamilyNone of the Bank’s substantial shareholders are individuals, thus the disclosure on remuneration to employees who are immediate family of substantial shareholders is not applicable.
Notes: (a) Fees and remuneration shares for non-executive Directors are subject to approval by shareholders at the 2019 AGM. (b) Value of remuneration shares was estimated based on closing price of ordinary shares on 18 March 2019, i.e. S$11.21 per share. (c) Non-cash component such as club and car benefits for Mr Ooi Sang Kuang and Mr Samuel N. Tsien and carparks for Directors.
Director Fees (a) Remuneration
Shares (a)/(b) Other Benefits (c) Total S$’000 S$’000 S$’000 S$’000
Ooi Sang Kuang 1,550 67 42 1,659 Chua Kim Chiu 209 67 4 280Lai Teck Poh 241 67 4 312 Lee Tih Shih 150 67 4 221Christina Ong 147 67 4 218 Quah Wee Ghee 144 67 4 215 Pramukti Surjaudaja 121 67 - 188Tan Ngiap Joo 254 67 4 325Wee Joo Yeow 254 67 4 325
3,070 603 70 3,743
Director & CEO Salary Bonus Deferred Shares Other Benefits (c) Total S$’000 S$’000 S$’000 S$’000 S$’000
Samuel N. Tsien 1,242 5,623 3,749 86 10,700
Director Fees S$’000
Ooi Sang Kuang 139 (d)
Lai Teck Poh 210 (e)
Quah Wee Ghee 198 (f)
Pramukti Surjaudaja 668 (g)
Tan Ngiap Joo 158 (h)
Wee Joo Yeow 150 (i)
Notes: (d) Fees from OCBC Bank (Malaysia), OCBC Al-Amin Bank and OCBC Wing Hang Bank. (e) Fees from OCBC Bank (Malaysia) and PT Bank OCBC NISP. (f) Fees from Bank of Singapore, The Great Eastern Life Assurance Co and Great Eastern General Insurance. (g) Fees from PT Bank OCBC NISP for being President Commissioner, a capacity in Indonesia with critical supervisory responsibilities over the organisation. (h) Fees from OCBC Bank (Malaysia) and OCBC Al-Amin Bank. (i) Fees from Great Eastern Holdings.
Subsidiaries
Directors’ Remuneration in 2018
Bank
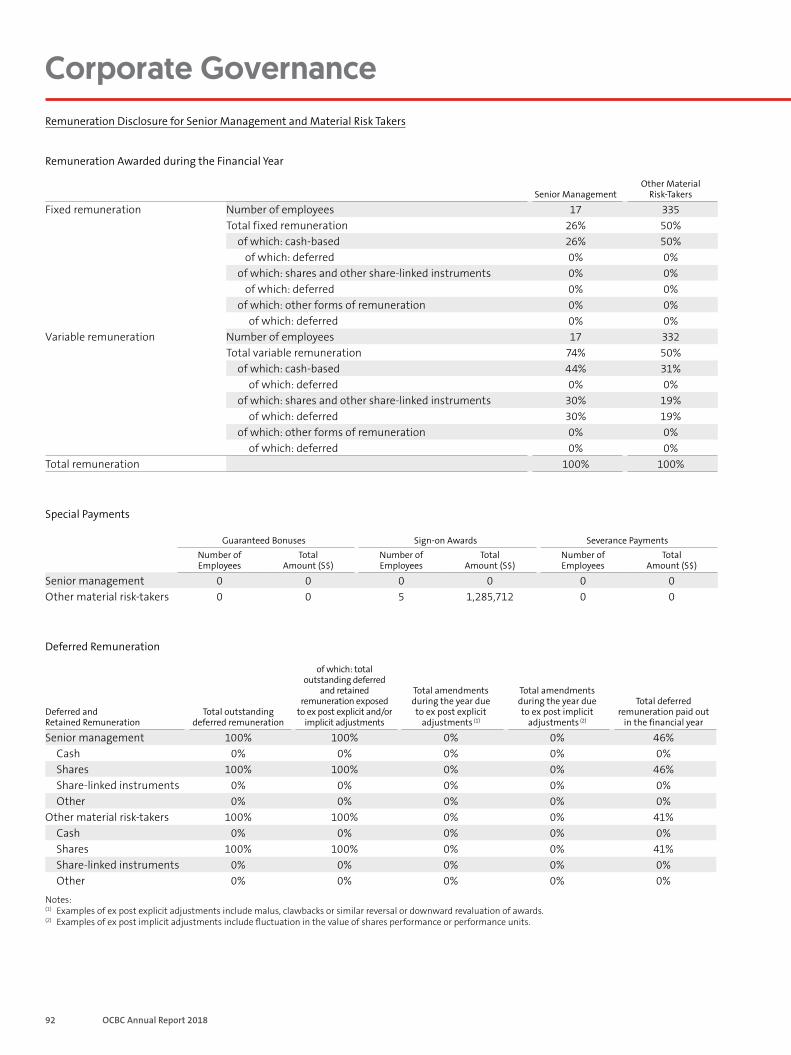
92 OCBC Annual Report 2018
Corporate Governance Remuneration Disclosure for Senior Management and Material Risk Takers
Remuneration Awarded during the Financial Year
Senior Management Other Material
Risk-Takers
Fixed remuneration Number of employees 17 335Total fixed remuneration 26% 50%
of which: cash-based 26% 50% of which: deferred 0% 0%
of which: shares and other share-linked instruments 0% 0%of which: deferred 0% 0%
of which: other forms of remuneration 0% 0%of which: deferred 0% 0%
Variable remuneration Number of employees 17 332Total variable remuneration 74% 50%
of which: cash-based 44% 31%of which: deferred 0% 0%
of which: shares and other share-linked instruments 30% 19% of which: deferred 30% 19%
of which: other forms of remuneration 0% 0%of which: deferred 0% 0%
Total remuneration 100% 100%
Guaranteed Bonuses Sign-on Awards Severance Payments Number of Employees
Total Amount (S$)
Number of Employees
Total Amount (S$)
Number of Employees
Total Amount (S$)
Senior management 0 0 0 0 0 0Other material risk-takers 0 0 5 1,285,712 0 0
Special Payments
Deferred Remuneration
Deferred and Retained Remuneration
Total outstanding deferred remuneration
of which: total outstanding deferred
and retained remuneration exposed
to ex post explicit and/or implicit adjustments
Total amendments during the year due to ex post explicit
adjustments (1)
Total amendments during the year due to ex post implicit
adjustments (2)
Total deferred remuneration paid out
in the financial year
Senior management 100% 100% 0% 0% 46% Cash 0% 0% 0% 0% 0% Shares 100% 100% 0% 0% 46% Share-linked instruments 0% 0% 0% 0% 0% Other 0% 0% 0% 0% 0%
Other material risk-takers 100% 100% 0% 0% 41%Cash 0% 0% 0% 0% 0% Shares 100% 100% 0% 0% 41%Share-linked instruments 0% 0% 0% 0% 0% Other 0% 0% 0% 0% 0%
Notes: (1) Examples of ex post explicit adjustments include malus, clawbacks or similar reversal or downward revaluation of awards. (2) Examples of ex post implicit adjustments include fluctuation in the value of shares performance or performance units.
93Governance
Accountability and Audit
Principle 9: Risk Management and Internal Controls The Board is responsible for the governance of risk. It sets the tone for the Bank’s risk culture and oversees, through the Risk Management Committee, the establishment and operation of an independent risk management system for managing risks on an enterprise-wide basis, the quality, adequacy and effectiveness of the internal controls and risk management processes and systems (including ensuring that the risk management function is sufficiently resourced to monitor risk by the various risk categories and that it has appropriate independent reporting lines). The Board approves the Bank’s risk appetite and has oversight of the risk activities to ensure that these are consistent with the Bank’s strategic intent and operating environment, as well as capital sufficiency and regulatory standards.
Further details on risk management are described under the section on Risk Management Committee on page 84.
The Board is also responsible for ensuring that the Bank’s internal controls adequately safeguard shareholders’ interests and the Bank’s assets. The Bank has in place self-assessment processes for all business units to assess and manage the adequacy and effectiveness of their internal controls, and their level of compliance with applicable rules and regulations. The results of evaluations are reviewed by senior management. The Board has received assurance from the CEO (which includes assurances provided by key management personnel to the CEO) on the effectiveness of the Bank’s risk management and internal control systems. The Board has also received assurances from the CEO and Chief Financial Officer that the financial records have been properly maintained and the financial statements give a true and fair view of the Bank’s operations and finances.
Based on the internal controls established and maintained by the Group, work performed by the internal and external auditors, and
reviews performed by management and various Board Committees, the Board – with the concurrence of the Audit and Risk Management Committees – is of the view that the system of internal controls, including financial, operational, compliance and information technology controls as well as risk management systems, were adequate and effective as at 31 December 2018, to address the risks which the Group considers relevant and material to its operations.
The system of internal controls provides reasonable but not absolute assurance that the Bank will not be adversely affected by any event that could be reasonably foreseen as it strives to achieve its business objectives. However, the Board also notes that no system of internal controls can provide absolute assurance in this regard, or absolute assurance against the occurrence of material errors, poor judgement in decision-making, human error, losses, fraud or other irregularities.
Principle 10: Audit Committee The composition and summary terms of reference of the Audit Committee are provided under the section on Audit Committee on pages 83 and 84 and the Committee’s summary activities are also provided in the Directors’ Statement on page 139. The Audit Committee adopts, where appropriate, relevant best practices set out in the Guidebook for Audit Committees in Singapore.
In addition to the review of the Group Financial Statements, which includes reviewing the assurances provided by the CEO and Chief Financial Officer on the financial records and statements, the Audit Committee reviews and evaluates, with the external auditor and internal auditor, the adequacy and effectiveness of the system of internal controls including financial, operational, compliance and information technology controls, and risk management policies and systems. It reviews the scope and results of the audits, the cost-effectiveness of the audits and the independence and objectivity of the external auditor and internal auditor. When the external
auditor provides non-audit services to the Bank, the Committee keeps the nature, extent and costs of such services under review. This is to balance the objectivity of the external auditor against its ability to provide value-for-money services. The Audit Committee members keep abreast of changes to accounting standards and issues which have a direct impact on financial statements through briefings provided by internal or external subject matter experts. The Audit Committee also reviews significant financial reporting issues and judgements to ensure the integrity of the financial statements. The Committee reviews announcements relating to financial performance.
The Audit Committee is also responsible for the review of the Bank’s whistle-blowing policy as well as any concerns, including anonymous complaints, which staff may in confidence raise about possible improprieties in matters of financial reporting or other matters. The whistle-blowing policy and procedures for raising such concerns are disclosed and clearly communicated to employees. The Committee will ensure such concerns are independently investigated and followed up on. If it is found that there has been fraud, appropriate remedial action will be taken and the Audit Committee updated regularly on its status. The whistle-blower’s interests will be safeguarded at all times, including a right to appeal to the Audit Committee if reprisals are taken against him.
The Audit Committee meets at least once a year with the external auditor and internal auditor in separate sessions and without the presence of management, to consider any matters which may be raised privately. In addition, the Chairman of the Audit Committee meets the head of internal audit on a regular basis to discuss the work undertaken, key findings and any other significant matters arising from the Group’s operations. Formal reports are sent to the Audit Committee on a regular basis.
External AuditThe Audit Committee has received the requisite disclosures from the
94 OCBC Annual Report 2018
Corporate Governance current external auditor evidencing its independence. It is satisfied that the financial, professional and business relationships between the Group and the external auditor will not prejudice the independence and objectivity of the external auditor. The aggregate amount of fees paid to the external auditor for financial year 2018, and the breakdown of total fees paid for audit and non-audit services, are shown in the Notes to the Financial Statements.
The Audit Committee assesses the quality of the current external auditor before its first appointment and at least annually thereafter. The selection of the external auditor was made after a tender process based on the established framework for the selection/appointment of OCBC’s external auditor. This framework lists the considerations and criteria for the external auditor and provides a robust tender process. Considerations include having global reach as well as technical and industry expertise, skills, resources and reputation, and quality of service delivery.
Exercising oversight over the external audit function, the Audit Committee is responsible for making recommendations to the Board in relation to the appointment, re-appointment and removal of the external auditor. The Audit Committee also considers the annual fee proposals presented by the external auditor and reviews the scope of the audit plan, the level of materiality, areas of focus and significant risks to be addressed.
In its recommendation on the re-appointment of the current external auditor, the Audit Committee considers the length of the external auditor’s tenure and the risk that may pose to objectivity and independence. The Audit Committee also takes into consideration the external auditor’s compliance with SGX-ST Listing Rules which require the lead engagement partner to be rotated every five years.
The Audit Committee noted that the current external auditor, KPMG LLP, has served as external auditor of the Bank since 2006.
In line with good corporate governance practice, the Audit Committee is of the view that a change of external auditor is in the best interests of the Bank and its shareholders. Taking into consideration the requirements of the revised MAS Notice 615 to Banks and the SGX Listing Manual, the Audit Committee initiated an audit tender exercise.
Four international audit firms were invited to tender and all four firms submitted proposals. Management meetings were organised for each firm, allowing them equal access to senior management across our key locations before they submitted their written proposals. Presentations by each firm were made to a selection panel comprising members of the Group Audit Committee and the Audit Committee Chairmen of our key subsidiaries. The selection panel reviewed and deliberated on the proposals received from each of the audit firms, taking into consideration the audit quality indicators introduced by the Accounting and Corporate Regulatory Authority and the criteria for the evaluation and selection of the external auditor contained in the Guidebook for Audit Committees in Singapore, including factors such as the adequacy of the resources and experience of the auditing firm and the proposed audit engagement partner, the audit firm’s other engagements, and the number and experience of supervisory and professional staff to be assigned. Management feedback was also sought and presented as part of the deliberations by the panel. An independent and objective approach was observed throughout the process.
After due consideration, the selection panel recommended through the Audit Committee, PricewaterhouseCoopers LLP for nomination as external auditor commencing the financial year ending 31 December 2020. The Board has taken into account the Audit Committee’s recommendation, including the factors considered in their evaluation, and is satisfied that PricewaterhouseCoopers LLP will be able to meet the audit requirements of the Bank.
The proposed change of external auditor would also provide the Bank with fresh perspectives and views of another professional audit firm and thus, could further enhance the value of the audit. Subject to the requisite approvals, notices, clearances and consents being obtained, the proposed appointment will be presented for shareholders’ approval at the 2020 AGM.
The scope of audit services to be provided by PricewaterhouseCoopers LLP will be comparable to those currently provided by KPMG LLP.
The Audit Committee is responsible for monitoring the performance, objectivity and independence of the external auditor. In its evaluation process, the Audit Committee takes into consideration the following: • the experience and expertise of senior
members of the engagement team;
• the audit plan agreed with the external auditor, the areas of audit focus and the external auditor’s approach to materiality;
• the quality of reports and findings presented by the external auditor;
• the external auditor’s presentation of its Audit Quality Framework and its confirmation of independence pursuant to its policies and processes for maintaining independence and objectivity;
• the external auditor’s report to the Audit Committee on main findings on audit quality reviews of the Bank’s audit;
• the key highlights or findings on the external auditor’s quality control systems by audit oversight bodies and, where relevant, the appropriate steps taken by the external auditor; and
• feedback through an annual evaluation exercise from senior management across geographical regions to gather internal perceptions as to the knowledge, competence, independence, efficiency and effectiveness – as well as communications by and with – the external auditor.

95Governance
As part of its assurance process on the objectivity and independence of the external auditor, the Audit Committee has in place a policy that lists the non-audit services which may not be provided by the external auditor and sets out the circumstances in which the external auditor may be permitted to undertake non-audit services. Permitted non-audit services exceeding S$250,000 require the approval of the Audit Committee before the auditor can be engaged. In addition, the Audit Committee reviews reports on non-audit services undertaken by the external auditor to satisfy itself as to the nature of non-audit services being provided and the fees incurred. The nature of the non-audit services provided during the financial year ended 31 December 2018 is shown in the Notes to the Financial Statements.
To reinforce the Audit Committee’s effectiveness and enhance the quality of the audit, the Audit Committee meets regularly with the external auditor. The external auditor discusses its audit plan with the Audit Committee and presents its engagement teams and its audit fee proposals. It reports to the Audit Committee on audit focus areas, the support rendered by management, key audit findings, quantitative and qualitative aspects of financial statement disclosures, any unadjusted audit differences (or review differences in the case of a half-yearly or a quarterly review) and any other matters relevant to its engagement. Discussions may be held privately without the presence of management. The external auditor also discusses with the Audit Committee key changes to regulatory requirements and reporting as well as developments in accounting standards.
In the review of the 2018 financial statements, the Audit Committee discussed with management the accounting principles applied and significant judgements affecting the financial statements. Matters raised by Group Audit and the external auditor in respect of risk management, accounting and internal controls over financial reporting were also reviewed. The following key audit matters highlighted in the Independent
Auditors’ Report on pages 140 to 146 of the Annual Report were discussed with management and the external auditor:
• Impairment of loans and bills receivable The Audit Committee reviewed management’s assessment and justification of allowances for impaired loans and non-impaired loans, including the appropriateness of forward-looking assumptions and scenarios adopted, in accordance with Singapore Financial Reporting Standards (International) 9 Financial Instruments and approved framework. The adequacy of allowances for impaired loans set aside for key loan accounts was also discussed with the external auditor. Additionally, the Audit Committee also considered the input from Group Audit’s independent assessment of the Group’s credit portfolio quality and credit risk management process.
• Valuation of financial instruments held at fair value The Audit Committee with the input of the Risk Management Committee, reviewed management’s valuation of financial instruments framework and their control, monitoring and issue escalation processes. In addition, the Committee reviewed both Group Audit’s and the external auditor‘s assessment of the controls over valuation which included independent verification of price and validation of valuation models.
• Valuation of insurance contract liabilities The Audit Committee reviewed the approach and methodology applied to the valuation of insurance contract liabilities of Great Eastern Holdings Ltd in their review of Great Eastern’s financial results together with the Group’s financial performance. In considering the valuation of insurance contract liabilities, the Committee considered the external auditor’s assessment of the valuation methodology and assumptions adopted by Great Eastern and its subsidiaries.
• Impairment of goodwill The Audit Committee reviewed management’s goodwill impairment
testing methodology and results, including the appropriateness of the cash flow forecasts and discount rates used. The Committee also considered the external auditor’s assessment of the methodology and testing results.
The Audit Committee believes that the financial statements are fairly presented in conformity with the relevant Singapore Financial Reporting Standards (International) in all material aspects, based on its review and discussions with management and the external auditor.
Internal AuditThe Audit Committee approves the terms of reference of internal audit (Group Audit) and reviews the adequacy and effectiveness of the internal audit function, at least annually. In line with leading practice, Group Audit’s mission statement and charter requires it to provide independent and reasonable, but not absolute, assurance that the Banking Group’s governance, risk management and internal control processes – as designed and implemented by senior management – are adequate and effective. Group Audit reports on the adequacy and effectiveness of the system of internal controls to the Audit Committee and management, but does not form any part of the system of internal controls. Group Audit meets or exceeds the International Standards for the Professional Practice of Internal Auditing of The Institute of Internal Auditors.
Group Audit adopts a risk-based approach where audit work is prioritised and scoped according to an assessment of current and emerging risks, including financial, operational, technology, compliance and strategic risks. The work undertaken by Group Audit involves the assessment of the adequacy and effectiveness of the Group’s governance, risk management and internal control processes in meeting its strategic objectives and operating within the risk appetite established. In addition, Group Audit provides an independent assessment of the Group’s credit portfolio quality and credit risk management process. Without assuming management responsibility,
96 OCBC Annual Report 2018
Corporate Governance Group Audit may provide consultative services to line management on certain business initiatives as well as system developments and enhancements where the objective is to add value and improve governance, risk management and controls.
The Audit Committee is responsible for the adequacy and independence of the internal audit function, its resources, and its standing and effectiveness. The Committee ensures that processes are in place for recommendations raised in internal audit reports to be dealt with in a timely manner and for outstanding exceptions or recommendations to be closely monitored. Group Audit is staffed with individuals with the relevant qualifications and experience. It reports functionally to the Audit Committee and administratively to the CEO, has unfettered access to the Audit Committee, Board and senior management, and has the right to seek information and explanations. Currently, the number of internal audit staff in the Group is 310. The division is organised into departments that are aligned with the structure of the Group. The Audit Committee approves the appointment, resignation, removal and remuneration of the Head of Group Audit.
Shareholder Rights and Engagement
Principle 11: Shareholder Rights and Conduct of General Meetings At the AGM, the Group’s financial performance for the preceding year is presented to shareholders.
Shareholders are given the opportunity to participate effectively at the general meetings of OCBC Bank, where they can ask
questions and communicate their views. They are allowed to vote in person or by proxy. The Bank’s Constitution currently allows a shareholder to appoint up to two proxies to attend, speak and vote in his place at general meetings. Under the new multiple proxies regime introduced pursuant to the Companies (Amendment) Act 2014, “relevant intermediaries” such as banks, capital markets services licence holders which provide custodial services for securities and the Central Provident Fund (CPF) Board are allowed to appoint more than two proxies to attend, speak and vote at general meetings. This will enable indirect investors, including CPF investors, to be appointed as proxies to participate at general meetings.
All the Directors attended the 2018 AGM together with the external auditor and senior management to address any relevant queries raised by shareholders. Independent scrutineers are also present at the AGM to review the voting process and address shareholders’ queries on the voting procedures.
To ensure authenticity of shareholder identity and due to other related security issues, the Bank currently does not allow voting in absentia by mail, email or fax. The Bank conducts voting by poll for all resolutions proposed at the general meetings, for greater transparency in the voting process. Following the meetings, it announces the detailed results of the votes, showing the number of votes cast for and against each resolution and the respective percentages.
The Bank provides for separate resolutions at general meetings on each substantially separate issue. It does not “bundle”
resolutions, unless the resolutions are interdependent and linked so as to form one significant proposal.
The Company Secretary prepares minutes of general meetings, which reflect responses from the Board and management to queries and comments from shareholders. The minutes are made available on the Bank’s website.
Principle 12: Engagement with Shareholders The Bank has a shareholders communication policy approved by the Board. OCBC Bank recognises the importance of communicating regularly and effectively with its shareholders so that they can better understand its operations, strategies and directions. One of the key roles of the Group’s Investor Relations and Group Brand and Communications units is to keep the market and investors apprised of the Group’s major corporate developments and financial performance through regular media releases, briefings and meetings with the investment community and media. Live webcasts of the Bank’s half-year and full-year financial results presentation are available for viewing on the Bank’s corporate website. The Bank’s dividend policy is also disclosed in the Capital Management section on page 101 of this Annual Report. In 2018, OCBC Bank hosted more than 500 meetings and conference calls with the investment community. In addition, shareholders and the public can access the Group’s media releases, financial results, presentation materials used at briefings and other corporate information via the Bank’s website. Material information is also announced through the stock exchange.
97Governance
Investors can submit feedback and queries to the Bank’s Investor Relations Unit through the contact details provided on the corporate website.
Managing Stakeholders Relationships
Principle 13: Engagement with Stakeholders OCBC Bank recognises the importance in maintaining positive stakeholder relationships, and adopts an inclusive approach in the management and engagement of its stakeholders – namely customers, investors, communities, regulators and employees. The Sustainability Report on pages 60 and 61 of this Annual Report sets out the Bank’s approach to stakeholder engagement including key areas of focus and how it responds to stakeholder concerns.
The Bank maintains a corporate website – OCBC.com – to communicate and engage with its stakeholders.
Related Party Transactions
OCBC Bank has established policies and procedures on related party transactions. These include definitions of relatedness, limits applied, terms of transactions, and the authorities governing and procedures for approving and monitoring the transactions. The Audit Committee reviews material related party and interested person transactions and keeps the Board informed of such transactions, if any. Measures are taken to ensure that terms and conditions for related party lendings are not more favourable than those
granted to non-related obligors under similar circumstances. The Bank also complies with the SGX-ST Listing Manual Rules on interested person transactions.
Ethical Standards
The Bank has adopted the SGX-ST Listing Manual’s guidelines on dealings in securities and has a policy against insider trading. Directors and officers are prohibited from dealing in the securities of the Bank and its listed subsidiary, Great Eastern Holdings Limited (GEH) during the period commencing two weeks before the announcement of the Bank’s and GEH’s quarterly or half-yearly financial results, and one month before the announcement of year-end results (the black-out period) and any time they are in possession of unpublished material price-sensitive information. The Bank will notify Directors and employees of the commencement date for each blackout period. The policy also states that employees are not to deal in the Bank’s securities on short-term considerations. In addition, employees are instructed to conduct all their personal securities transactions through the Group’s stockbroking subsidiary.
The Bank’s insider trading policy also includes instructions pertaining to dealings in the listed securities of customers of the Group.
The Bank has a code of conduct that applies to all employees and reinforces the core values expected of employees. The code covers all aspects of the business operations of the Bank and sets out principles to guide employees in carrying out their duties and responsibilities while adhering to the highest standards of personal and corporate integrity.
Employees are required to observe and comply with laws and regulations as well as company policies, along with the ABS Code of Conduct for Banks and Bank Staff.
The Bank has a suite of policies in place for proper governance and management that staff have to comply with. All policies, including those related to vendor management and procurement, are subject to the Bank’s risk management and internal control systems and processes, including management self-assessment and independent audits.
The Bank also has a policy to manage or eliminate any actual or potential conflicts of interest which may impact the impartiality of research analyses or research reports issued by research analysts in OCBC Bank or its financial subsidiaries. These include prohibitions on business units attempting to influence research analyses or recommendations by research analysts, as well as on securities trading by staff who receive information on research analyses or recommendations in unissued research reports.
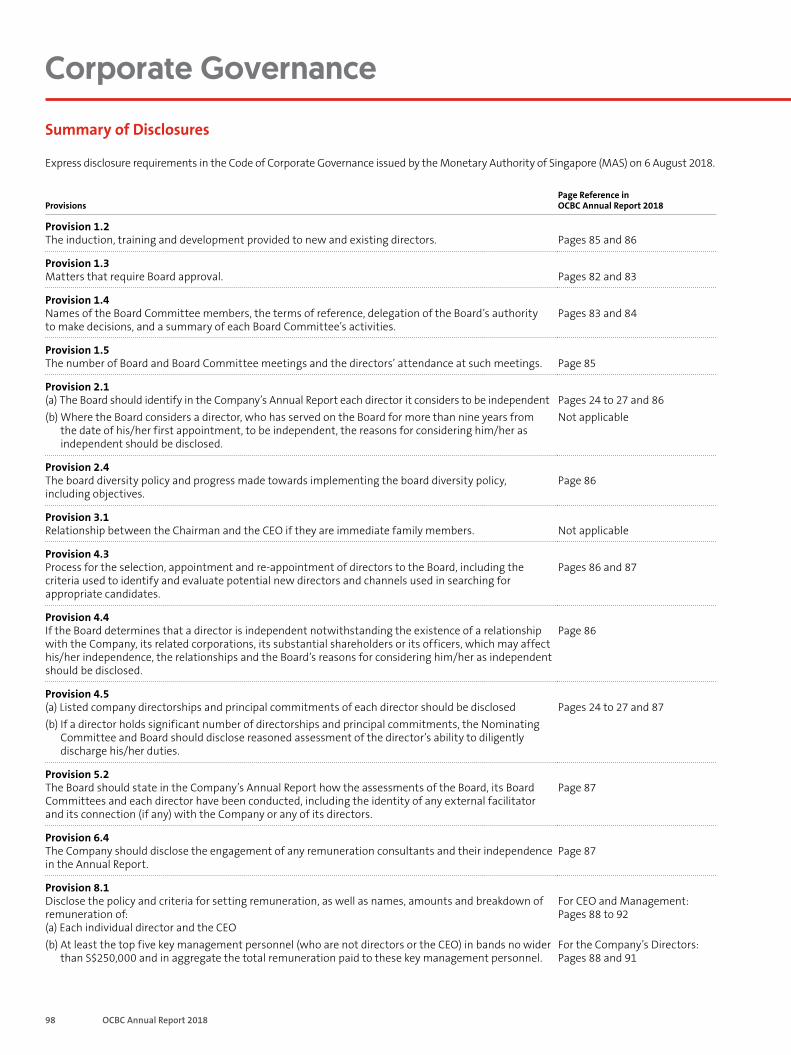
98 OCBC Annual Report 2018
Corporate Governance
Provisions Page Reference in OCBC Annual Report 2018
Provision 1.2 The induction, training and development provided to new and existing directors. Pages 85 and 86
Provision 1.3 Matters that require Board approval. Pages 82 and 83
Provision 1.4 Names of the Board Committee members, the terms of reference, delegation of the Board’s authority to make decisions, and a summary of each Board Committee’s activities.
Pages 83 and 84
Provision 1.5 The number of Board and Board Committee meetings and the directors’ attendance at such meetings. Page 85
Provision 2.1 (a) The Board should identify in the Company’s Annual Report each director it considers to be independent (b) Where the Board considers a director, who has served on the Board for more than nine years from
the date of his/her first appointment, to be independent, the reasons for considering him/her as independent should be disclosed.
Pages 24 to 27 and 86 Not applicable
Provision 2.4 The board diversity policy and progress made towards implementing the board diversity policy, including objectives.
Page 86
Provision 3.1 Relationship between the Chairman and the CEO if they are immediate family members. Not applicable
Provision 4.3 Process for the selection, appointment and re-appointment of directors to the Board, including the criteria used to identify and evaluate potential new directors and channels used in searching for appropriate candidates.
Pages 86 and 87
Provision 4.4 If the Board determines that a director is independent notwithstanding the existence of a relationship with the Company, its related corporations, its substantial shareholders or its officers, which may affect his/her independence, the relationships and the Board’s reasons for considering him/her as independent should be disclosed.
Page 86
Provision 4.5 (a) Listed company directorships and principal commitments of each director should be disclosed (b) If a director holds significant number of directorships and principal commitments, the Nominating
Committee and Board should disclose reasoned assessment of the director’s ability to diligently discharge his/her duties.
Pages 24 to 27 and 87
Provision 5.2 The Board should state in the Company’s Annual Report how the assessments of the Board, its Board Committees and each director have been conducted, including the identity of any external facilitator and its connection (if any) with the Company or any of its directors.
Page 87
Provision 6.4 The Company should disclose the engagement of any remuneration consultants and their independence in the Annual Report.
Page 87
Provision 8.1 Disclose the policy and criteria for setting remuneration, as well as names, amounts and breakdown of remuneration of: (a) Each individual director and the CEO (b) At least the top five key management personnel (who are not directors or the CEO) in bands no wider
than S$250,000 and in aggregate the total remuneration paid to these key management personnel.
For CEO and Management: Pages 88 to 92
For the Company’s Directors: Pages 88 and 91
Summary of Disclosures
Express disclosure requirements in the Code of Corporate Governance issued by the Monetary Authority of Singapore (MAS) on 6 August 2018.
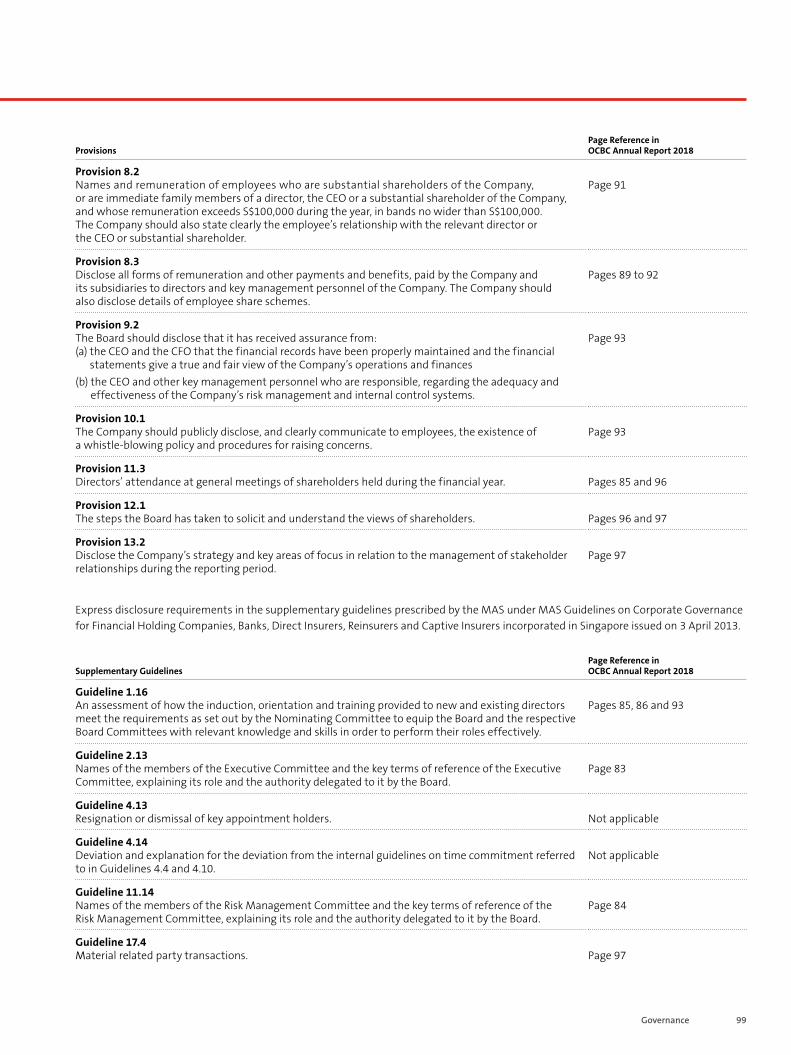
99Governance
Provisions
Page Reference in OCBC Annual Report 2018
Provision 8.2 Names and remuneration of employees who are substantial shareholders of the Company, or are immediate family members of a director, the CEO or a substantial shareholder of the Company, and whose remuneration exceeds S$100,000 during the year, in bands no wider than S$100,000. The Company should also state clearly the employee’s relationship with the relevant director or the CEO or substantial shareholder.
Page 91
Provision 8.3 Disclose all forms of remuneration and other payments and benefits, paid by the Company and its subsidiaries to directors and key management personnel of the Company. The Company should also disclose details of employee share schemes.
Pages 89 to 92
Provision 9.2 The Board should disclose that it has received assurance from: (a) the CEO and the CFO that the financial records have been properly maintained and the financial
statements give a true and fair view of the Company’s operations and finances (b) the CEO and other key management personnel who are responsible, regarding the adequacy and
effectiveness of the Company’s risk management and internal control systems.
Page 93
Provision 10.1 The Company should publicly disclose, and clearly communicate to employees, the existence of a whistle-blowing policy and procedures for raising concerns.
Page 93
Provision 11.3 Directors’ attendance at general meetings of shareholders held during the financial year. Pages 85 and 96
Provision 12.1 The steps the Board has taken to solicit and understand the views of shareholders. Pages 96 and 97
Provision 13.2 Disclose the Company’s strategy and key areas of focus in relation to the management of stakeholder relationships during the reporting period.
Page 97
Express disclosure requirements in the supplementary guidelines prescribed by the MAS under MAS Guidelines on Corporate Governance for Financial Holding Companies, Banks, Direct Insurers, Reinsurers and Captive Insurers incorporated in Singapore issued on 3 April 2013.
Supplementary Guidelines Page Reference in OCBC Annual Report 2018
Guideline 1.16 An assessment of how the induction, orientation and training provided to new and existing directors meet the requirements as set out by the Nominating Committee to equip the Board and the respective Board Committees with relevant knowledge and skills in order to perform their roles effectively.
Pages 85, 86 and 93
Guideline 2.13 Names of the members of the Executive Committee and the key terms of reference of the Executive Committee, explaining its role and the authority delegated to it by the Board.
Page 83
Guideline 4.13 Resignation or dismissal of key appointment holders. Not applicable
Guideline 4.14 Deviation and explanation for the deviation from the internal guidelines on time commitment referred to in Guidelines 4.4 and 4.10.
Not applicable
Guideline 11.14 Names of the members of the Risk Management Committee and the key terms of reference of the Risk Management Committee, explaining its role and the authority delegated to it by the Board.
Page 84
Guideline 17.4 Material related party transactions. Page 97
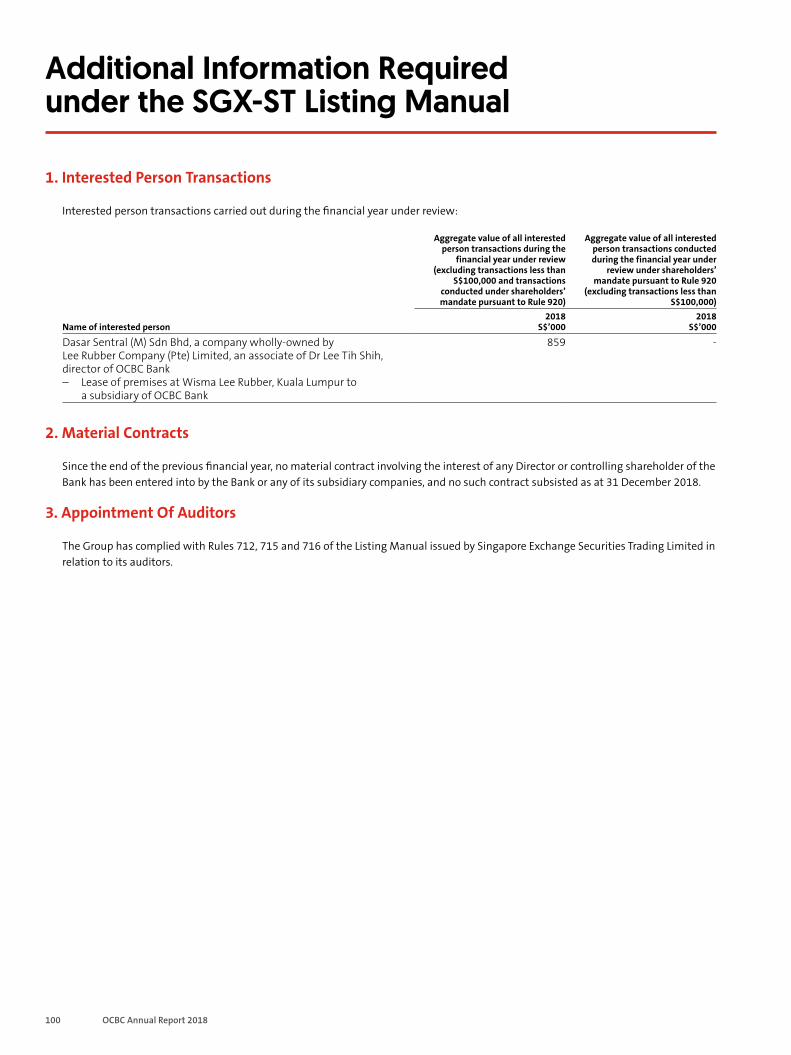
100 OCBC Annual Report 2018
Additional Information Required under the SGX-ST Listing Manual 1. Interested Person Transactions
Interested person transactions carried out during the financial year under review:
2. Material Contracts
Since the end of the previous financial year, no material contract involving the interest of any Director or controlling shareholder of the Bank has been entered into by the Bank or any of its subsidiary companies, and no such contract subsisted as at 31 December 2018.
3. Appointment Of Auditors
The Group has complied with Rules 712, 715 and 716 of the Listing Manual issued by Singapore Exchange Securities Trading Limited in relation to its auditors.
Aggregate value of all interested person transactions during the
financial year under review (excluding transactions less than
S$100,000 and transactions conducted under shareholders’ mandate pursuant to Rule 920)
Aggregate value of all interested person transactions conducted during the financial year under
review under shareholders’ mandate pursuant to Rule 920
(excluding transactions less than S$100,000)
Name of interested person 2018
S$’000 2018
S$’000
Dasar Sentral (M) Sdn Bhd, a company wholly-owned by Lee Rubber Company (Pte) Limited, an associate of Dr Lee Tih Shih, director of OCBC Bank – Lease of premises at Wisma Lee Rubber, Kuala Lumpur to
a subsidiary of OCBC Bank
859 -
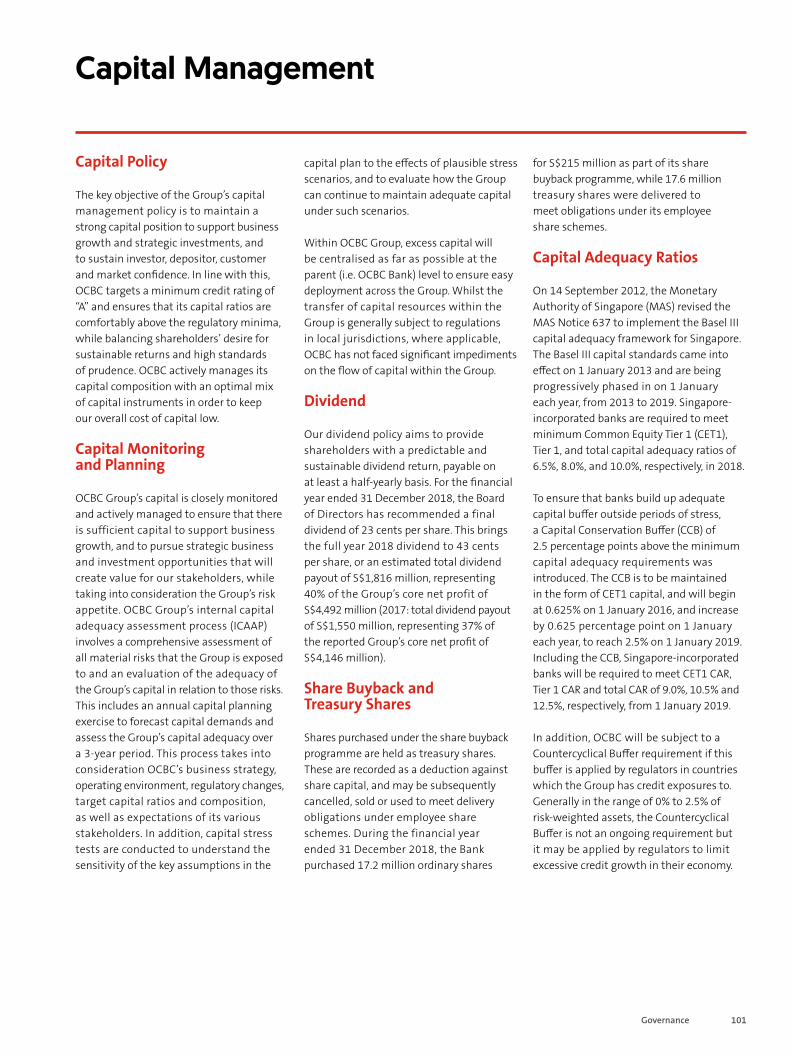
101Governance
Capital Management
Capital Policy
The key objective of the Group’s capital management policy is to maintain a strong capital position to support business growth and strategic investments, and to sustain investor, depositor, customer and market confidence. In line with this, OCBC targets a minimum credit rating of “A” and ensures that its capital ratios are comfortably above the regulatory minima, while balancing shareholders’ desire for sustainable returns and high standards of prudence. OCBC actively manages its capital composition with an optimal mix of capital instruments in order to keep our overall cost of capital low.
Capital Monitoring and Planning
OCBC Group’s capital is closely monitored and actively managed to ensure that there is sufficient capital to support business growth, and to pursue strategic business and investment opportunities that will create value for our stakeholders, while taking into consideration the Group’s risk appetite. OCBC Group’s internal capital adequacy assessment process (ICAAP) involves a comprehensive assessment of all material risks that the Group is exposed to and an evaluation of the adequacy of the Group’s capital in relation to those risks. This includes an annual capital planning exercise to forecast capital demands and assess the Group’s capital adequacy over a 3-year period. This process takes into consideration OCBC’s business strategy, operating environment, regulatory changes, target capital ratios and composition, as well as expectations of its various stakeholders. In addition, capital stress tests are conducted to understand the sensitivity of the key assumptions in the
capital plan to the effects of plausible stress scenarios, and to evaluate how the Group can continue to maintain adequate capital under such scenarios.
Within OCBC Group, excess capital will be centralised as far as possible at the parent (i.e. OCBC Bank) level to ensure easy deployment across the Group. Whilst the transfer of capital resources within the Group is generally subject to regulations in local jurisdictions, where applicable, OCBC has not faced significant impediments on the flow of capital within the Group.
Dividend
Our dividend policy aims to provide shareholders with a predictable and sustainable dividend return, payable on at least a half-yearly basis. For the financial year ended 31 December 2018, the Board of Directors has recommended a final dividend of 23 cents per share. This brings the full year 2018 dividend to 43 cents per share, or an estimated total dividend payout of S$1,816 million, representing 40% of the Group’s core net profit of S$4,492 million (2017: total dividend payout of S$1,550 million, representing 37% of the reported Group’s core net profit of S$4,146 million).
Share Buyback and Treasury Shares
Shares purchased under the share buyback programme are held as treasury shares. These are recorded as a deduction against share capital, and may be subsequently cancelled, sold or used to meet delivery obligations under employee share schemes. During the financial year ended 31 December 2018, the Bank purchased 17.2 million ordinary shares
for S$215 million as part of its share buyback programme, while 17.6 million treasury shares were delivered to meet obligations under its employee share schemes.
Capital Adequacy Ratios
On 14 September 2012, the Monetary Authority of Singapore (MAS) revised the MAS Notice 637 to implement the Basel III capital adequacy framework for Singapore. The Basel III capital standards came into effect on 1 January 2013 and are being progressively phased in on 1 January each year, from 2013 to 2019. Singapore-incorporated banks are required to meet minimum Common Equity Tier 1 (CET1), Tier 1, and total capital adequacy ratios of 6.5%, 8.0%, and 10.0%, respectively, in 2018.
To ensure that banks build up adequate capital buffer outside periods of stress, a Capital Conservation Buffer (CCB) of 2.5 percentage points above the minimum capital adequacy requirements was introduced. The CCB is to be maintained in the form of CET1 capital, and will begin at 0.625% on 1 January 2016, and increase by 0.625 percentage point on 1 January each year, to reach 2.5% on 1 January 2019. Including the CCB, Singapore-incorporated banks will be required to meet CET1 CAR, Tier 1 CAR and total CAR of 9.0%, 10.5% and 12.5%, respectively, from 1 January 2019.
In addition, OCBC will be subject to a Countercyclical Buffer requirement if this buffer is applied by regulators in countries which the Group has credit exposures to. Generally in the range of 0% to 2.5% of risk-weighted assets, the Countercyclical Buffer is not an ongoing requirement but it may be applied by regulators to limit excessive credit growth in their economy.
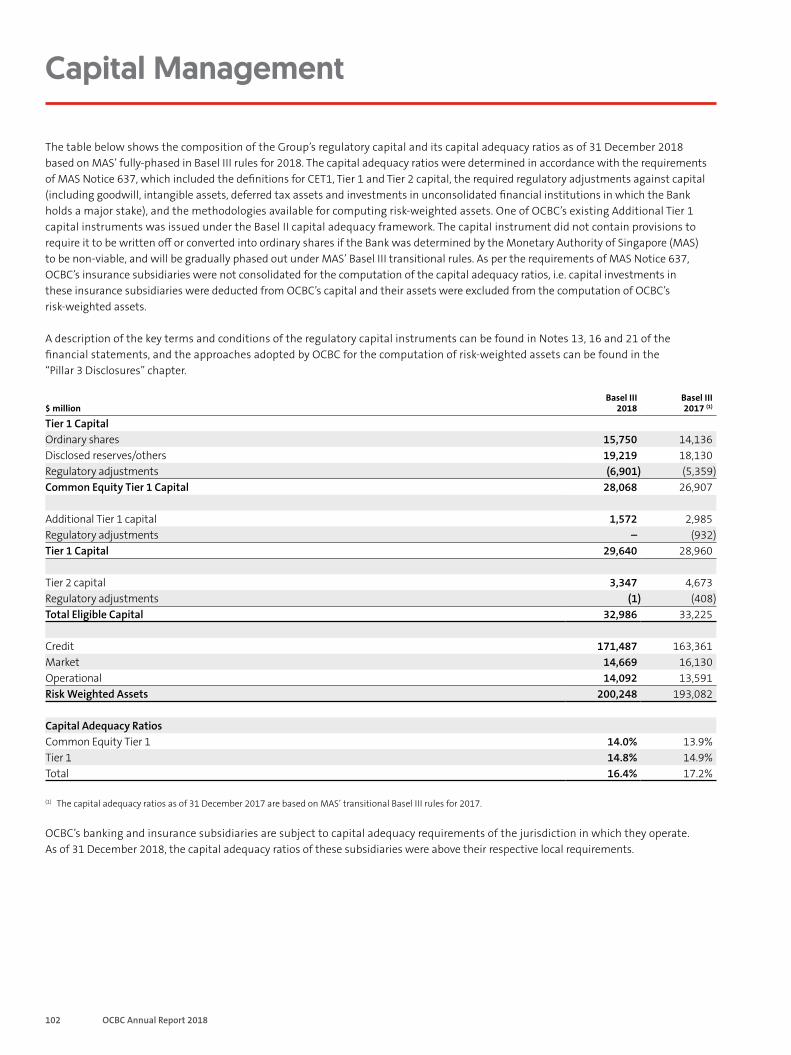
102 OCBC Annual Report 2018
Capital Management
The table below shows the composition of the Group’s regulatory capital and its capital adequacy ratios as of 31 December 2018 based on MAS’ fully-phased in Basel III rules for 2018. The capital adequacy ratios were determined in accordance with the requirements of MAS Notice 637, which included the definitions for CET1, Tier 1 and Tier 2 capital, the required regulatory adjustments against capital (including goodwill, intangible assets, deferred tax assets and investments in unconsolidated financial institutions in which the Bank holds a major stake), and the methodologies available for computing risk-weighted assets. One of OCBC’s existing Additional Tier 1 capital instruments was issued under the Basel II capital adequacy framework. The capital instrument did not contain provisions to require it to be written off or converted into ordinary shares if the Bank was determined by the Monetary Authority of Singapore (MAS) to be non-viable, and will be gradually phased out under MAS’ Basel III transitional rules. As per the requirements of MAS Notice 637, OCBC’s insurance subsidiaries were not consolidated for the computation of the capital adequacy ratios, i.e. capital investments in these insurance subsidiaries were deducted from OCBC’s capital and their assets were excluded from the computation of OCBC’s risk-weighted assets.
A description of the key terms and conditions of the regulatory capital instruments can be found in Notes 13, 16 and 21 of the financial statements, and the approaches adopted by OCBC for the computation of risk-weighted assets can be found in the “Pillar 3 Disclosures” chapter.
$ million Basel III
2018 Basel III 2017 (1)
Tier 1 Capital Ordinary shares 15,750 14,136Disclosed reserves/others 19,219 18,130Regulatory adjustments (6,901) (5,359)Common Equity Tier 1 Capital 28,068 26,907
Additional Tier 1 capital 1,572 2,985Regulatory adjustments – (932)Tier 1 Capital 29,640 28,960
Tier 2 capital 3,347 4,673Regulatory adjustments (1) (408)Total Eligible Capital 32,986 33,225
Credit 171,487 163,361Market 14,669 16,130Operational 14,092 13,591Risk Weighted Assets 200,248 193,082
Capital Adequacy Ratios Common Equity Tier 1 14.0% 13.9%Tier 1 14.8% 14.9%Total 16.4% 17.2%
(1) The capital adequacy ratios as of 31 December 2017 are based on MAS’ transitional Basel III rules for 2017.
OCBC’s banking and insurance subsidiaries are subject to capital adequacy requirements of the jurisdiction in which they operate. As of 31 December 2018, the capital adequacy ratios of these subsidiaries were above their respective local requirements.
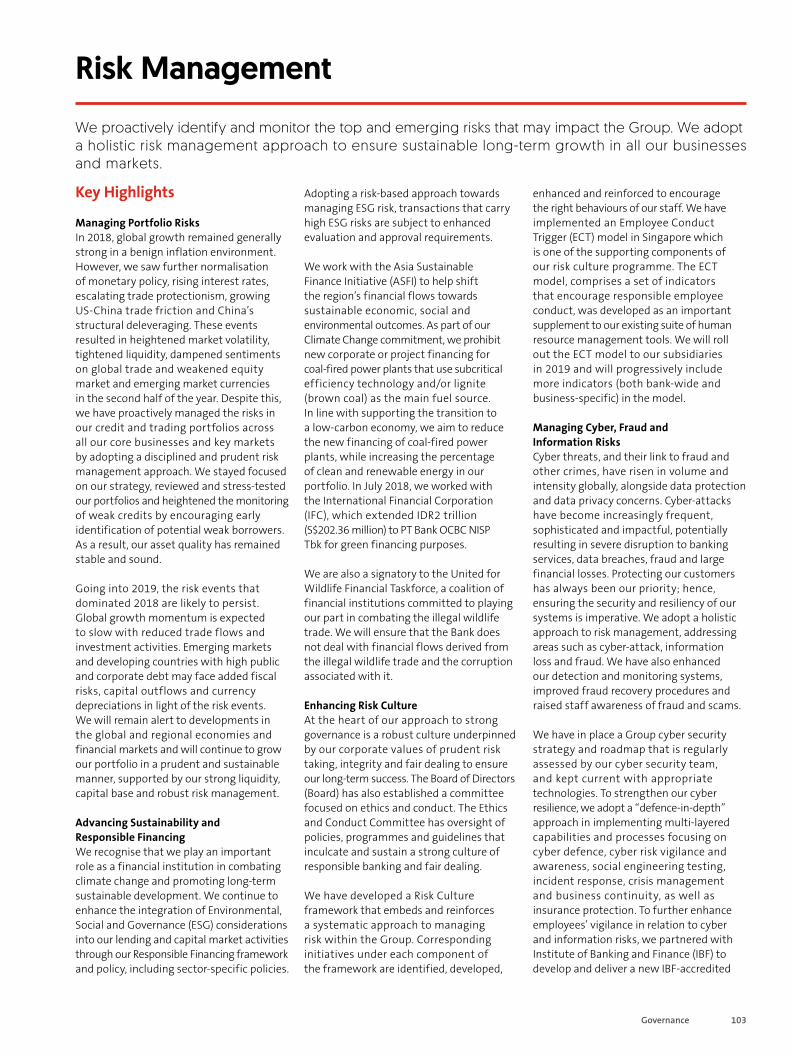
103Governance
Risk Management
We proactively identify and monitor the top and emerging risks that may impact the Group. We adopt a holistic risk management approach to ensure sustainable long-term growth in all our businesses and markets.
Key Highlights
Managing Portfolio Risks In 2018, global growth remained generally strong in a benign inflation environment. However, we saw further normalisation of monetary policy, rising interest rates, escalating trade protectionism, growing US-China trade friction and China’s structural deleveraging. These events resulted in heightened market volatility, tightened liquidity, dampened sentiments on global trade and weakened equity market and emerging market currencies in the second half of the year. Despite this, we have proactively managed the risks in our credit and trading portfolios across all our core businesses and key markets by adopting a disciplined and prudent risk management approach. We stayed focused on our strategy, reviewed and stress-tested our portfolios and heightened the monitoring of weak credits by encouraging early identification of potential weak borrowers. As a result, our asset quality has remained stable and sound.
Going into 2019, the risk events that dominated 2018 are likely to persist. Global growth momentum is expected to slow with reduced trade flows and investment activities. Emerging markets and developing countries with high public and corporate debt may face added fiscal risks, capital outflows and currency depreciations in light of the risk events. We will remain alert to developments in the global and regional economies and financial markets and will continue to grow our portfolio in a prudent and sustainable manner, supported by our strong liquidity, capital base and robust risk management.
Advancing Sustainability and Responsible Financing We recognise that we play an important role as a financial institution in combating climate change and promoting long-term sustainable development. We continue to enhance the integration of Environmental, Social and Governance (ESG) considerations into our lending and capital market activities through our Responsible Financing framework and policy, including sector-specific policies.
Adopting a risk-based approach towards managing ESG risk, transactions that carry high ESG risks are subject to enhanced evaluation and approval requirements.
We work with the Asia Sustainable Finance Initiative (ASFI) to help shift the region’s financial flows towards sustainable economic, social and environmental outcomes. As part of our Climate Change commitment, we prohibit new corporate or project financing for coal-fired power plants that use subcritical efficiency technology and/or lignite (brown coal) as the main fuel source. In line with supporting the transition to a low-carbon economy, we aim to reduce the new financing of coal-fired power plants, while increasing the percentage of clean and renewable energy in our portfolio. In July 2018, we worked with the International Financial Corporation (IFC), which extended IDR2 trillion (S$202.36 million) to PT Bank OCBC NISP Tbk for green financing purposes.
We are also a signatory to the United for Wildlife Financial Taskforce, a coalition of financial institutions committed to playing our part in combating the illegal wildlife trade. We will ensure that the Bank does not deal with financial flows derived from the illegal wildlife trade and the corruption associated with it.
Enhancing Risk Culture At the heart of our approach to strong governance is a robust culture underpinned by our corporate values of prudent risk taking, integrity and fair dealing to ensure our long-term success. The Board of Directors (Board) has also established a committee focused on ethics and conduct. The Ethics and Conduct Committee has oversight of policies, programmes and guidelines that inculcate and sustain a strong culture of responsible banking and fair dealing.
We have developed a Risk Culture framework that embeds and reinforces a systematic approach to managing risk within the Group. Corresponding initiatives under each component of the framework are identified, developed,
enhanced and reinforced to encourage the right behaviours of our staff. We have implemented an Employee Conduct Trigger (ECT) model in Singapore which is one of the supporting components of our risk culture programme. The ECT model, comprises a set of indicators that encourage responsible employee conduct, was developed as an important supplement to our existing suite of human resource management tools. We will roll out the ECT model to our subsidiaries in 2019 and will progressively include more indicators (both bank-wide and business-specific) in the model.
Managing Cyber, Fraud and Information Risks Cyber threats, and their link to fraud and other crimes, have risen in volume and intensity globally, alongside data protection and data privacy concerns. Cyber-attacks have become increasingly frequent, sophisticated and impactful, potentially resulting in severe disruption to banking services, data breaches, fraud and large financial losses. Protecting our customers has always been our priority; hence, ensuring the security and resiliency of our systems is imperative. We adopt a holistic approach to risk management, addressing areas such as cyber-attack, information loss and fraud. We have also enhanced our detection and monitoring systems, improved fraud recovery procedures and raised staff awareness of fraud and scams.
We have in place a Group cyber security strategy and roadmap that is regularly assessed by our cyber security team, and kept current with appropriate technologies. To strengthen our cyber resilience, we adopt a “defence-in-depth” approach in implementing multi-layered capabilities and processes focusing on cyber defence, cyber risk vigilance and awareness, social engineering testing, incident response, crisis management and business continuity, as well as insurance protection. To further enhance employees’ vigilance in relation to cyber and information risks, we partnered with Institute of Banking and Finance (IBF) to develop and deliver a new IBF-accredited
104 OCBC Annual Report 2018
Risk Management
cyber risk management programme. We have also rolled out a new mandatory cyber and information e-learning programme.
Leveraging on Financial Technology (Fintech) Solutions We continued to tap on Fintech solutions to redefine customer engagement, deliver greater customer value and bolster our internal controls and risk management capabilities. In our collective and continuous efforts to deepen engagement with customers, we leverage on big data and machine learning to sense customers’ needs in real time to make contextual offers to them across multiple touchpoints. We have also started integrating machine learning and artificial intelligence (AI) into our existing transaction monitoring system to detect money laundering patterns and fraudulent activities which might not be detected by rule-based monitoring systems.
The acceleration of digital transformation within the Bank, increased collaboration with Fintechs, as well as adoption of application programming interfaces (APIs) and new technology solutions, could introduce more risks if not adequately managed. In addition to our established corporate risk governance structure and processes, we have implemented a proactive risk advisory engagement approach to facilitate early identification and mitigation of associated risks.
Enhancing Risk Management and Reporting Systems We recognise the importance of data to support our businesses and clients and effective data governance and management to comply with the requirements stated in the Basel Committee on Banking Supervision’s Standard No. 239 on Principles for Effective Risk Data Aggregation and Risk Reporting (BCBS 239). The Group Data Management Committee was formed to oversee the effectiveness of policies and controls in meeting our data management objectives. We have also established a new function to perform the independent validation and reporting of our compliance status to BCBS 239 regulation.
Risk Management in OCBC Group
Effective risk management is critical to the long-term sustainability of the Group.
To achieve this, we have identified the following key high-level risk management fundamentals to forge a common approach to managing risk at the enterprise level.
• Risk Culture – The Board and top management set the tone for a strong risk culture. This is framed by the Board Ethics and Conduct Committee and Board Risk Management Committee (BRMC), supported by a Risk Culture framework, with robust internal control environment. The framework embeds and reinforces a systematic approach to managing risk across the Group to ensure awareness, competency and accountability of practices. All customer-facing business units, product teams, independent functional risk management units and support units are actively involved in the risk management process.
• Risk Appetite – The Board sets the Group’s risk appetite, which defines the level and nature of risks that we are willing to take. The risk appetite addresses the key considerations of our stakeholders and takes into account our risk and financial resource capacity in relation to regulatory requirements as well as the medium- to long-term operating environment. Our risk appetite is aligned with our strategic business goals and risk-adjusted return expectations and is operationalised through specific risk appetite statements for key businesses and subsidiaries. In addition, portfolio risk limits are cascaded from the risk appetite and used to establish business-operating boundaries.
• Risk Management Framework – The overarching risk management framework developed for each principal risk type is supported by policies, methodologies, tools, processes and controls. These are built around robust governance structures to ensure that they are effective and comprehensive in the identification, measurement, monitoring and control, and reporting of risks.
• Holistic Risk Management – Risks are managed holistically by evaluating risk interactions across the different risk types. Both business and risk-control units actively participate in regular forums to identify and assess top and emerging risks and opportunities arising from changes in the business environment.
Quantitative stress testing and sensitivity analysis supplemented with qualitative analysis help senior management quantify the impact that potential adverse events pose to our portfolios and earnings. The results and recommended risk-response strategies are considered in business strategy formulation, capital adequacy assessment and risk limits setting.
• Independent Review – Group Audit conducts risk-based internal audits to provide independent assurance that our risk management systems as well as control and governance processes are effective and comply with both regulatory requirements and internal rules and standards. Group Audit also evaluates the overall risk awareness and control consciousness of the management in discharging its supervisory and oversight responsibilities through a Management Control Oversight Rating (MCOR). This evaluation is done based on a set of factors including awareness, aptitude and attitude.
Our banking subsidiaries are required to implement risk management framework and policies that conform to the stricter of Group’s risk standards or local regulations. Their approving authority and limit structure are also consistent with those of the Group, which are designed to ensure proper ownership and accountability.
Great Eastern Holdings and Bank OCBC NISP are listed companies that publish their own annual reports which contain information on their risk management framework and practices (for information on GEH’s risk management, refer to Note 39 in the Group’s Financial Statements). Their risk management framework, policies and practices are aligned with the Group’s risk standards where appropriate.
Risk Governance and Organisation
The Board establishes the Group’s risk appetite and risk management principles. The BRMC is the principal board committee that oversees the Group’s risk management with the following key responsibilities:
• sets the Group’s overall risk management philosophy, ensuring it is in line with the Group strategy and within the risk appetite as approved by the Board.
105Governance
• reviews risk disclosure policy and risk management principles for the approval of the Board.
• oversees the Group’s risk management systems for identifying, measuring, monitoring and control, and reporting of risk exposures and ensuring the adequacy of risk management practices.
• approves risk management frameworks, major risk policies and material risk models.
The BRMC is supported by Group Risk Management (GRM), which is headed by the Group Chief Risk Officer (CRO). GRM is an independent risk and control oversight function that supports the Group’s business development within a prudent, consistent and effective risk management framework and governance structure. GRM establishes relevant risk management frameworks, policies and procedures, risk measurements and methodologies; it also reviews and monitors the Group’s risk profiles and portfolio concentrations. Any significant vulnerabilities and risk issues are highlighted to the respective risk management committees. Various risk reports, including key stress test results and action plans, are also submitted regularly to senior management, BRMC and the Board.
The independence of risk management from business functions ensures that we achieve the necessary balance between risk-taking and return considerations. The compensation of risk officers is also determined independent of business units and reviewed by the Remuneration Committee to ensure it remains market-competitive. Additionally, we have a Material Risk Takers (MRTs) framework to define and identify MRTs – employees whose authorities and actions are identified as having material influence on our long-term performance. Specific compensation measures would be commensurate with the risks the MRTs are authorised to take.
Senior management actively manages risks through various risk management committees, such as the Credit Risk Management Committee, the Market Risk Management Committee, the Asset and Liability Committee and the Operational Risk Management Committee. Together with senior representatives from business units and subsidiaries, GRM facilitates a
regular and structured emerging risk forum to identify and deliberate on potential dark clouds and opportunities. Identified emerging risks are actively monitored and updated to reflect changes in the operating environment, and serve as inputs into other risk management areas such as stress testing and portfolio limit setting. Both risk-taking and risk-control units are represented in the risk management committees and emerging risk forum, emphasising shared risk management responsibilities.
All new products and services are governed by a New Product Approval Process (NPAP) managed by GRM and approved by the New Product Approval Committee (NPAC). This process provides a platform to ensure that all risks associated with new products or market initiatives are comprehensively identified, measured, assessed and managed before market introduction.
Basel Requirements
We have implemented the MAS Notice 637 on Risk Based Capital Adequacy Requirements for Banks incorporated in Singapore (MAS Notice 637), including the enhanced quality of regulatory capital base and expanded risk coverage under Basel III. As part of enhanced public disclosures on risk profile and capital adequacy driven by changes in Part XI of MAS Notice 637, the Board approves the risk disclosure policy which – among other requirements – includes establishing and maintaining internal control processes over the disclosure. The Board has also appointed the Group Chief Financial Officer to attest that the Pillar 3 report has been prepared in accordance with approved internal control processes. Please refer to the Pillar 3 Disclosures section for information as at 31 December 2018.
For credit risk, we have adopted the Foundation Internal Ratings-Based (F-IRB) approach and supervisory slotting criteria to calculate credit risk-weighted assets for major wholesale portfolios and the Advanced Internal Ratings-Based (A-IRB) approach for major consumer, small business and margin lending portfolios. Other credit portfolios, including those belonging to OCBC Wing Hang and Bank OCBC NISP, are on the Standardised approach. They will be progressively migrated to the internal ratings-based approaches. The regulatory capital to be
set aside for credit risk-weighted assets depends on various factors, including internal risk grades, product type, counterparty type and maturity.
For market risk, we have adopted the Standardised approach. Risk weights for market risk assets are specified according to the instrument category, maturity period, credit quality grade as well as other factors and applied to the corresponding notional amount as prescribed under MAS Notice 637.
For operational risk, we have adopted the Standardised approach except for OCBC Wing Hang and Bank OCBC NISP, which have adopted the Basic Indicator approach. Operational risk-weighted assets are derived by applying specified factors or percentages to the annual gross income for the prescribed business lines in accordance with regulatory guidelines.
We conduct the Internal Capital Adequacy Assessment Process (ICAAP) at least annually to evaluate if we are able to maintain sound capital levels after considering business plans and material risks under both base case and severe stress scenarios. Management actions are proposed where necessary to ensure that the Group remains prudently managed.
Implementing the Basel framework is an integral part of our efforts to refine and strengthen our risk management. We closely follow ongoing industry and regulatory developments, including higher liquidity and capital requirements.
Risk Management and Reporting Systems
Our risk management and reporting systems are designed to ensure that risks are comprehensively identified, with the relevant data being accurate, fit-for-purpose, aggregated consistently and delivered in a timely manner to support well-founded decisions. As a recognition of the importance of data in supporting our businesses and clients, a new function was established within GRM, reporting to the CRO, to drive our efforts to achieve better data management and governance. We have also enhanced our Data Governance framework with a renewed focus on the enforcement of common data standards, processing controls and aggregation rules.
106 OCBC Annual Report 2018
Risk Management
A new Group Data Management Committee (GDMC), comprising members of senior management, was formed to support the BRMC and Group Chief Executive Officer (CEO) on the effectiveness of the policies and controls to meet our data management objectives. A number of other key initiatives to enhance our governance, reporting processes and systems are in progress, including the setting-up and operationalisation of the function to perform the independent validation and reporting of our compliance to BCBS 239 regulation.
Credit Risk Management
Credit risk is the risk of loss of principal and/or income arising from the failure of an obligor or counterparty to meet its financial or contractual obligations. As our primary business is commercial banking, we are exposed to credit risks from our lending activities. Trading and investment banking activities also expose the Group to counterparty and issuer credit risks. For derivative transactions, the total credit exposure is quantified by the positive mark-to-market value of the underlying instruments plus an appropriate add-on factor to cater for potential future exposure.
Credit Risk Management Oversight and Organisation The Credit Risk Management Committee (CRMC), comprising members of senior management, supports the BRMC and CEO in managing credit risk. It oversees the execution of the Group’s Credit Risk Management (CRM) framework and policies, including the effectiveness of our risk infrastructure, methodologies and systems in ensuring that credit risk taking is consistent with our risk appetite and aligned with the relevant business strategy. The CRMC also reviews the credit profile of material portfolios, recommends and monitors exposures undertaken against risk limits and highlights any material risk issues to the CEO and BRMC.
The Credit Risk Management department ensure the execution of the CRM framework, policies and procedures. This department also independently manage credit risk to ensure that risk-returns are within our risk appetite, target markets, limits and risk standards. We also have dedicated risk control functions for portfolio risk
monitoring, risk measurement methodology, risk reporting and remedial management.
Regular risk reports are provided to the CRMC, CEO, BRMC and the Board in a timely, objective and transparent manner for review. These reports include detailed credit exposures, credit migration, expected losses and risk concentrations by business segment and geography. Regular stress tests and portfolio reviews are conducted to assess the potential impact of emerging risks on our credit exposures, including interactions among credit, market and liquidity events. The results of the stress tests and portfolio reviews are factored into the adjustment and refinement of risk-taking strategies, as well as credit and concentration limits, to ensure we remain within our risk appetite.
Credit Risk Management Approach Our CRM framework encapsulates the complete cycle of credit risk management. It covers the identification, measurement, assessment, monitoring as well as the control and mitigation of credit risks. It also articulates the importance of proactive credit risk management.
We seek to undertake credit risks that meet our target market and risk acceptance criteria, lending parameters and risk-return expectations for sustainable performance. As Fair Dealing underpins our commitment to building long-term relationships with our customers, complex products are sold to them only after clearing suitability and appropriateness assessments. In addition to effective risk management practices, the sound judgement of our experienced credit officers is also key to our successful risk management.
We have a Responsible Financing framework and policy in place that sets out our overall approach towards the management of ESG risks, including the integration of ESG considerations into our credit and risk evaluation process for our lending and capital market activities. We have also developed sector-specific policies for Agriculture, Forestry, Energy, Mining and Metals that set out the criteria and thresholds for transactions involving these elevated ESG risk industries. Transactions with high ESG or reputational risks are escalated to the Reputational Risk Review Group for
clearance. Periodic reports are provided to the CEO and BRMC on our ESG profile and the progress of our responsible financing implementation. Please refer to our Sustainability Report for more information on responsible financing.
Lending to Consumers and Small BusinessesCredit risks for consumers and small businesses are managed on a portfolio basis under credit programmes such as mortgages, credit cards, unsecured loans, auto loans, commercial property loans and business term loans. Credit extended under these programmes should fall within the portfolio and transaction limits, customer selection criteria and acquisition strategy, product structure, lending criteria, as well as acceptable collateral and advance ratio. Apart from bankruptcy and credit bureau checks, systems and processes such as source identification of credit origination and independent verification of documentation are used to detect fraud. The performance of the portfolio is closely monitored on a monthly basis using management information system (MIS) analytics. Application models are also used in the credit decision process for most products to enable efficient, objective and consistent risk evaluation and decisions. Behavioural models are used for early identification of potential problem loans.
Lending to Corporate and Institutional CustomersCredit facilities extended to corporate and institutional customers are individually assessed, risk-rated and further reviewed and evaluated by experienced credit officers. Credit decisions are made after comprehensive qualitative and quantitative risk assessment, including a thorough understanding of the customer and customer group’s interdependencies, and their ability and willingness to meet their financial obligations. Credit extensions are guided by predefined target market and risk acceptance criteria. Collateral and other credit support are also taken to mitigate credit risk where appropriate. To ensure objectivity in credit extensions, co-grantor approvals and shared risk ownership are required from both business and credit risk units.
Lending to Private Banking CustomersCredit facilities extended to our wealth management clients with the Bank of Singapore, a wholly-owned subsidiary of the
107Governance
Group, are subject to comprehensive credit assessment, the availability of acceptable collateral and compliance with loan advance ratio and margin requirements. Joint approvals from both business and credit risk units ensure objectivity in the credit extensions. Advance ratios are dependent on the liquidity, volatility and diversification of the collateralised portfolio under stressed conditions. Credit exposures that are secured by marketable securities are subject to daily valuation and independent price verification controls. Timely and disciplined execution of margin calls, top-up provisions, stop loss and force-selling is strictly managed in accordance with approved procedures.
Credit Risk from Investment and Trading ActivitiesCounterparty credit risks arising from our trading, derivatives and debt securities activities are actively managed to protect against potential losses in replacing a contract if a counterparty fails to meet its obligations. Where possible, trading in standardised Over-the-Counter (OTC) derivatives is cleared through Central Clearing Counterparties (CCP). OTC derivatives which are not cleared via CCP will be governed under International Swaps and Derivatives Association (ISDA) agreements as well as Credit Support Annexes (CSAs) or an equivalent to allow for close-out netting if the counterparty defaults.
Credit limits are established for each counterparty based on our assessment of the counterparty’s creditworthiness, the suitability and appropriateness of the product offered and alignment with approved trading mandates and investment strategies. Credit exposures are independently managed through daily limit monitoring, excess escalation and approval, and timely risk reporting. We also have an established policy and process to manage wrong-way risk which can occur when the credit exposure to a counterparty is adversely correlated with the credit quality of the same counterparty.
Credit Risk from SecuritisationWe have limited exposure to asset-backed securities and collateralised debt obligations and are not active in securitisation activities.
Internal Credit Rating Models Internal credit rating models are an integral part of our credit risk management,
credit decision-making process and capital assessment. These internal rating models and the parameters – probability of default (PD), loss given default (LGD) and exposure at default (EAD) – are used in limit setting, credit approval, portfolio monitoring and reporting, remedial management, stress testing, internal assessment of the capital adequacy and impairment allowances.
Model risk is managed under our Model Risk Management framework and Credit Rating Model framework to govern the development, validation, application and performance monitoring of rating models. Approval for adoption and continued use of material models rests with the BRMC. The models are developed with the active participation of credit experts from risk-taking and risk-control units and subject to independent validation before implementation to ensure that all aspects of the model development process have met the internal standards.
The models are subject to annual (or more frequent) review and independent validation to ensure that they are performing as expected and that the assumptions used in model development remain appropriate. In addition, Group Audit conducts annual independent review of the ratings assignment process, the effectiveness of the independent validation and the accuracy of the rating system operation. All rating models are assessed against internal and regulatory requirements and approved by regulators for use in capital assessment. Our internal risk grades are not explicitly mapped to external credit ratings. Nevertheless, our internal risk grades may be correlated with the external credit ratings in terms of the PD ranges as factors used to rate obligors would be similar; an obligor rated poorly by an external credit rating agency is likely to have a weaker internal risk rating.
A-IRB for Major Consumer, Small Business and Margin Lending PortfoliosWe have adopted the A-IRB approach for major consumer portfolios, including residential mortgages, credit cards and auto loans as well as small business and margin lending. Internal rating models, developed from internal data, are used to estimate PD, LGD, and EAD parameters for each of these portfolios. Application and
Behaviour scores of obligors are key inputs to the PD models. Product, collateral and geographical characteristics are major factors used in the LGD and EAD models. The PD models are calibrated to the expected long-term average one-year default rate over an economic cycle, while the LGD models are calibrated to reflect the economic loss under downturn conditions. EAD models are also calibrated to reflect the long-run average or economic downturn conditions where necessary.
F-IRB for Major Wholesale PortfoliosOur major wholesale portfolios, namely sovereign, bank, non-bank financial institution, corporate real estate (including income-producing real estate specialised lending) and general corporate, are on the F-IRB approach. Under this approach, internal models are used to estimate the PD of each obligor, while LGD and EAD parameters are prescribed in MAS Notice 637. These PD models are statistical based or expert judgement models that use both quantitative and qualitative factors to assess an obligor’s repayment capacity and are calibrated to the expected long-term average one-year default rate over an economic cycle. Expert judgement models based on inputs from internal credit experts are typically used for portfolios with low defaults. The models also comply with the regulatory criteria for parameterisation. For other specialised lending portfolios, namely project finance, object finance and commodities finance, risk grades derived from internal models are mapped to the five supervisory slotting categories prescribed in MAS Notice 637. The risk weights prescribed for these slotting categories are used to determine the regulatory capital requirements.
IRB Approach for Securitisation ExposuresThe credit risk-weighted assets for securitisation exposures are computed using the ratings-based method prescribed by MAS Notice 637.
Standardised Approach for Other PortfoliosCredit portfolios in OCBC Wing Hang and Bank OCBC NISP are under the Standardised approach. These portfolios will be progressively migrated to the internal ratings-based approaches for which implementation initiatives are in progress for OCBC Wing Hang. Regulatory prescribed

108 OCBC Annual Report 2018
Risk Management
risk weights based on asset class and external ratings from approved credit rating agencies, where available, are used to determine regulatory capital. Approved external credit rating agencies are Standard and Poor’s, Moody’s and Fitch Ratings.
Credit Risk Control Credit Risk MitigationCredit facilities are granted primarily based on the borrower’s credit quality and repayment capacity from operating cash flows for corporates and institutions, and personal income or wealth (after assessing the total debts and commitments) for individuals. Where possible, we take credit risk mitigants as a secondary recourse to the borrower to mitigate credit risk. We accept collateral and credit protection such as cash, real estate, marketable securities, trade receivables, standby letters of credit and credit insurances. We have policies in place that set out the criteria for collateral and credit protection to be recognised as eligible credit risk mitigants. This includes factors such as legal certainty and enforceability, priority, correlation, marketability, liquidity, counterparty risk of the protection provider, as well as collateral-specific minimum operational requirements. Valuations are performed by independent qualified appraisers and the values of the collateral are monitored on a regular basis. The frequency of valuation depends on the type, liquidity and volatility of the collateral. Appropriate haircuts are applied to the market values of the collateral to reflect the underlying nature, quality, liquidity and volatility of the collateral. We also accept guarantees from individuals, corporates and institutions mainly as a form of support. Where guarantees are recognised as credit risk mitigants via the PD substitution approach, eligibility criteria and guidelines are in place.
To manage counterparty credit risk, eligible financial collateral may be taken to partially or fully cover mark-to-market exposures on outstanding positions, with a haircut to cover potential adverse market volatility. Collateral arrangements, typically covered under market standard documentation such as ISDA, include a minimum threshold amount where additional collateral is to be posted by either party if the mark-to-market exposures exceed the agreed threshold. The credit risk associated with contractual obligations is reduced by netting agreements in legally-approved jurisdictions, so that
if an event of default occurs, all amounts with the counterparty are settled on a net basis. Agreements may also contain rating triggers where additional collateral posting is required in the event of a rating downgrade. However, given our investment grade rating, there is minimal increase in collateral posting under a one-notch rating downgrade occurrence. We also use CCP to reduce counterparty risk for OTC derivatives.
Managing Credit Risk ConcentrationsCredit risk concentrations may arise from lending to a single borrower, a group of connected borrowers or diverse groups of borrowers affected by similar economic or market conditions. Where appropriate, limits are set and monitored to control concentrations by borrower, group of connected borrowers, product, industry and country. These limits are aligned with our risk appetite, business strategy, capacity and expertise. Impact on earnings and capital is also considered in limit-setting.
We continue to diversify our country exposures with our expanded presence and activities in Greater China, Malaysia and Indonesia. As a key player at home, we have significant exposure to the real estate market in Singapore. Dedicated specialised real estate units manage this risk by focusing on client selection, collateral quality, project viability and real estate cycle trends. Regular stress tests are also conducted to identify potential vulnerabilities in the portfolio.
Remedial Management We have an established process to constantly assess our portfolios to detect potential problem credits at an early stage. As we value long-term customer relationships, we understand that some customers may be facing temporary financial distress and prefer to work closely with them at the onset of their difficulties. We recognise the opportunity to promote customer loyalty and retention in such instances, even as we enforce strict discipline and place a priority on remedial management to minimise credit loss.
We classify credit exposures according to our assessment of the borrowers’ ability to repay their financial obligations from normal sources of income. Credit exposures are categorised as “Pass” or “Special Mention”,
while non-performing loans (NPLs) are categorised as “Substandard”, “Doubtful” or “Loss” in accordance with MAS Notice 612 on Credit Files, Grading and Provisioning (MAS Notice 612). Upgrading of NPL to performing status can only be done when there is an established trend of credit improvement. The upgrade needs to be supported by an assessment of the borrower’s repayment capability, cash flows and financial position.
Credit exposures are classified as restructured assets when we have granted concessions in restructured repayment terms to borrowers who are facing difficulties in meeting the original repayment schedules. A restructured credit exposure is classified into the appropriate non-performing grades based on the assessment of the borrower’s financial condition and ability to repay under the restructured terms. Such credit exposure must comply fully with the restructured terms before it can be restored to performing loan status in accordance with MAS Notice 612.
We have dedicated remedial management units to manage the restructuring, work-out and recovery of non-performing assets for wholesale portfolios. For retail portfolios, appropriate risk-based and time-based collections strategies are developed to maximise recoveries. We also use analytical data such as delinquency buckets and adverse status tags for delinquent consumer loans to constantly fine-tune and prioritise our collection efforts.
Credit Loss AllowancesWe maintain impairment allowances that are sufficient to absorb credit losses inherent in our loan portfolio. We recognise allowance for Expected Credit Losses (ECL) on credit impaired and non-credit impaired exposures in accordance to Singapore Financial Reporting Standard (International) 9: Financial Instruments (SFRS(I) 9) and MAS Notice 612 with a forward looking ECL model. Please refer to Note 2 in the Financial Statements for information on impairment allowances.
For credit impaired portfolio, specific allowance is assessed individually and measured based on lifetime ECL. The amount of specific allowance for an individual credit exposure is determined by ascertaining the net present value of future cash flows
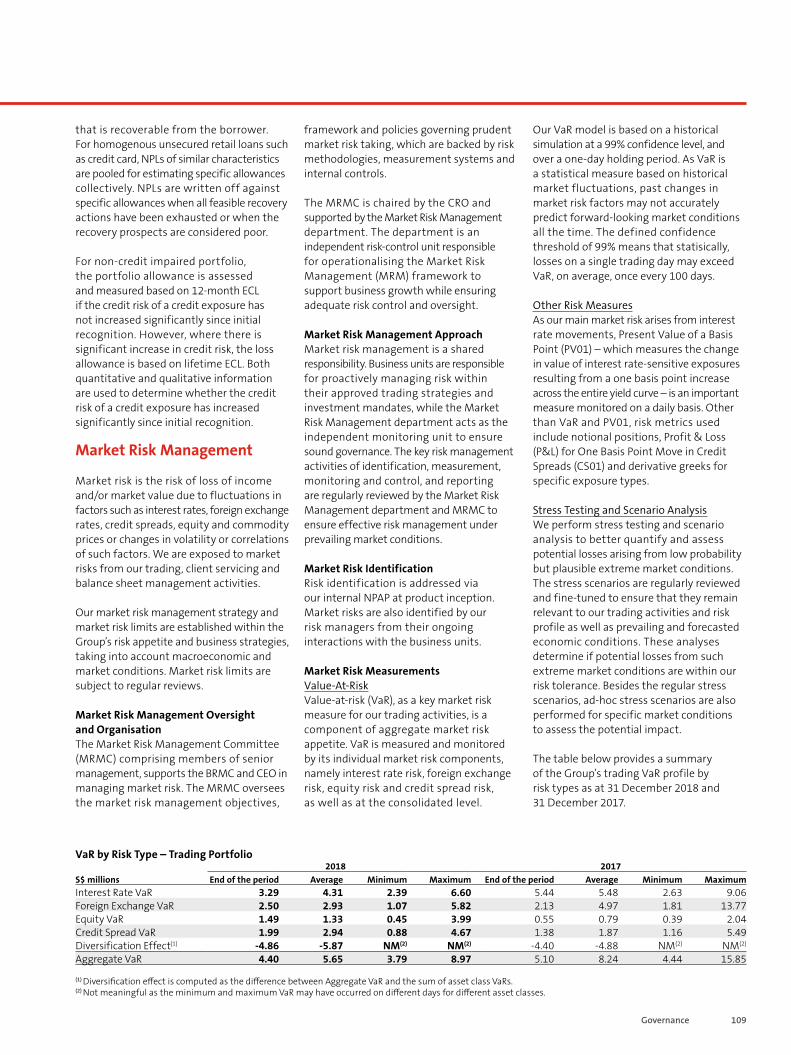
109Governance
that is recoverable from the borrower. For homogenous unsecured retail loans such as credit card, NPLs of similar characteristics are pooled for estimating specific allowances collectively. NPLs are written off against specific allowances when all feasible recovery actions have been exhausted or when the recovery prospects are considered poor.
For non-credit impaired portfolio, the portfolio allowance is assessed and measured based on 12-month ECL if the credit risk of a credit exposure has not increased significantly since initial recognition. However, where there is significant increase in credit risk, the loss allowance is based on lifetime ECL. Both quantitative and qualitative information are used to determine whether the credit risk of a credit exposure has increased significantly since initial recognition.
Market Risk Management
Market risk is the risk of loss of income and/or market value due to fluctuations in factors such as interest rates, foreign exchange rates, credit spreads, equity and commodity prices or changes in volatility or correlations of such factors. We are exposed to market risks from our trading, client servicing and balance sheet management activities.
Our market risk management strategy and market risk limits are established within the Group’s risk appetite and business strategies, taking into account macroeconomic and market conditions. Market risk limits are subject to regular reviews.
Market Risk Management Oversight and Organisation The Market Risk Management Committee (MRMC) comprising members of senior management, supports the BRMC and CEO in managing market risk. The MRMC oversees the market risk management objectives,
framework and policies governing prudent market risk taking, which are backed by risk methodologies, measurement systems and internal controls.
The MRMC is chaired by the CRO and supported by the Market Risk Management department. The department is an independent risk-control unit responsible for operationalising the Market Risk Management (MRM) framework to support business growth while ensuring adequate risk control and oversight.
Market Risk Management Approach Market risk management is a shared responsibility. Business units are responsible for proactively managing risk within their approved trading strategies and investment mandates, while the Market Risk Management department acts as the independent monitoring unit to ensure sound governance. The key risk management activities of identification, measurement, monitoring and control, and reporting are regularly reviewed by the Market Risk Management department and MRMC to ensure effective risk management under prevailing market conditions.
Market Risk Identification Risk identification is addressed via our internal NPAP at product inception. Market risks are also identified by our risk managers from their ongoing interactions with the business units.
Market Risk Measurements Value-At-RiskValue-at-risk (VaR), as a key market risk measure for our trading activities, is a component of aggregate market risk appetite. VaR is measured and monitored by its individual market risk components, namely interest rate risk, foreign exchange risk, equity risk and credit spread risk, as well as at the consolidated level.
Our VaR model is based on a historical simulation at a 99% confidence level, and over a one-day holding period. As VaR is a statistical measure based on historical market fluctuations, past changes in market risk factors may not accurately predict forward-looking market conditions all the time. The defined confidence threshold of 99% means that statisically, losses on a single trading day may exceed VaR, on average, once every 100 days.
Other Risk MeasuresAs our main market risk arises from interest rate movements, Present Value of a Basis Point (PV01) – which measures the change in value of interest rate-sensitive exposures resulting from a one basis point increase across the entire yield curve – is an important measure monitored on a daily basis. Other than VaR and PV01, risk metrics used include notional positions, Profit & Loss (P&L) for One Basis Point Move in Credit Spreads (CS01) and derivative greeks for specific exposure types.
Stress Testing and Scenario AnalysisWe perform stress testing and scenario analysis to better quantify and assess potential losses arising from low probability but plausible extreme market conditions. The stress scenarios are regularly reviewed and fine-tuned to ensure that they remain relevant to our trading activities and risk profile as well as prevailing and forecasted economic conditions. These analyses determine if potential losses from such extreme market conditions are within our risk tolerance. Besides the regular stress scenarios, ad-hoc stress scenarios are also performed for specific market conditions to assess the potential impact.
The table below provides a summary of the Group’s trading VaR profile by risk types as at 31 December 2018 and 31 December 2017.
2018 2017 S$ millions End of the period Average Minimum Maximum End of the period Average Minimum Maximum Interest Rate VaR 3.29 4.31 2.39 6.60 5.44 5.48 2.63 9.06 Foreign Exchange VaR 2.50 2.93 1.07 5.82 2.13 4.97 1.81 13.77 Equity VaR 1.49 1.33 0.45 3.99 0.55 0.79 0.39 2.04 Credit Spread VaR 1.99 2.94 0.88 4.67 1.38 1.87 1.16 5.49 Diversification Effect(1) -4.86 -5.87 NM(2) NM(2) -4.40 -4.88 NM(2) NM(2) Aggregate VaR 4.40 5.65 3.79 8.97 5.10 8.24 4.44 15.85
(1) Diversification effect is computed as the difference between Aggregate VaR and the sum of asset class VaRs. (2) Not meaningful as the minimum and maximum VaR may have occurred on different days for different asset classes.
VaR by Risk Type – Trading Portfolio
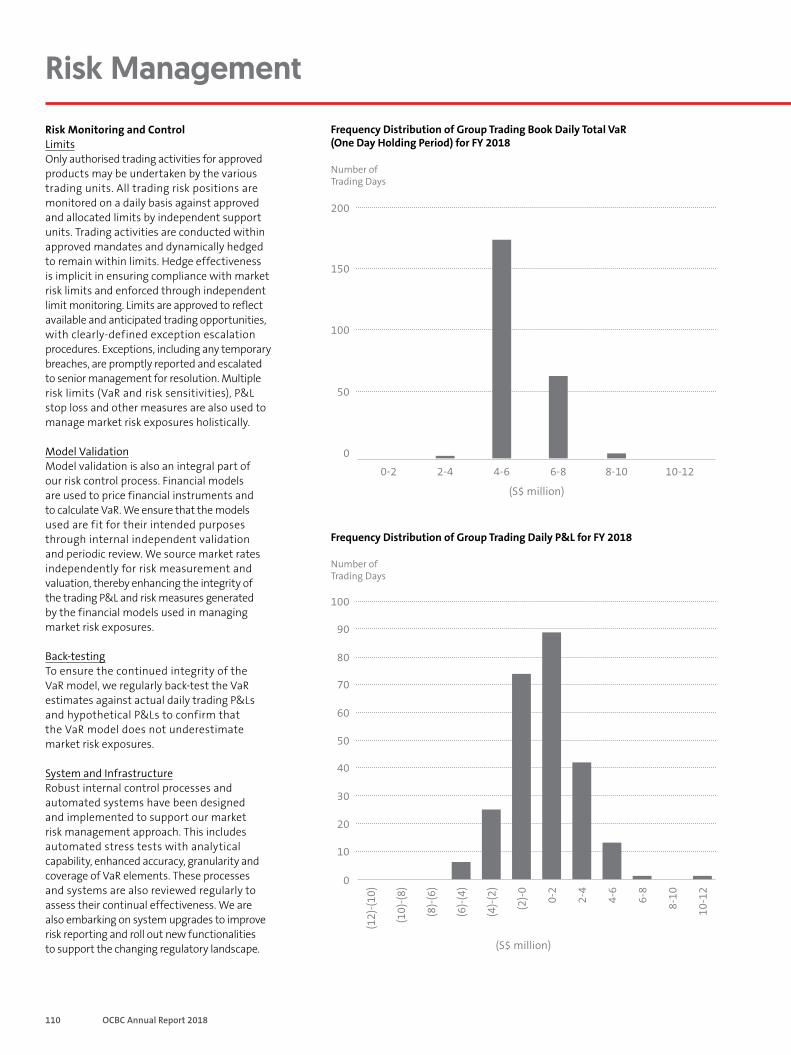
110 OCBC Annual Report 2018
Risk Management
Risk Monitoring and Control LimitsOnly authorised trading activities for approved products may be undertaken by the various trading units. All trading risk positions are monitored on a daily basis against approved and allocated limits by independent support units. Trading activities are conducted within approved mandates and dynamically hedged to remain within limits. Hedge effectiveness is implicit in ensuring compliance with market risk limits and enforced through independent limit monitoring. Limits are approved to reflect available and anticipated trading opportunities, with clearly-defined exception escalation procedures. Exceptions, including any temporary breaches, are promptly reported and escalated to senior management for resolution. Multiple risk limits (VaR and risk sensitivities), P&L stop loss and other measures are also used to manage market risk exposures holistically.
Model ValidationModel validation is also an integral part of our risk control process. Financial models are used to price financial instruments and to calculate VaR. We ensure that the models used are fit for their intended purposes through internal independent validation and periodic review. We source market rates independently for risk measurement and valuation, thereby enhancing the integrity of the trading P&L and risk measures generated by the financial models used in managing market risk exposures.
Back-testingTo ensure the continued integrity of the VaR model, we regularly back-test the VaR estimates against actual daily trading P&Ls and hypothetical P&Ls to confirm that the VaR model does not underestimate market risk exposures.
System and InfrastructureRobust internal control processes and automated systems have been designed and implemented to support our market risk management approach. This includes automated stress tests with analytical capability, enhanced accuracy, granularity and coverage of VaR elements. These processes and systems are also reviewed regularly to assess their continual effectiveness. We are also embarking on system upgrades to improve risk reporting and roll out new functionalities to support the changing regulatory landscape.
70
Frequency Distribution of Group Trading Book Daily Total VaR (One Day Holding Period) for FY 2018
Frequency Distribution of Group Trading Daily P&L for FY 2018
100
90
80
60
50
(S$ million)
Number of Trading Days
40
30
20
10
0
(12)
-(10)
(10)
-(8)
10-1
2
(8)-(
6)
(6)-(
4)
(4)-(
2)
(2)-0 0-
2
2-4
4-6
6-8
8-10
200
150
100
50
0
0-2 2-4 4-6 6-8 8-10 10-12
(S$ million)
Number of Trading Days
111Governance
Asset Liability Management
Asset liability management is the strategic management of our balance sheet structure and liquidity requirements, covering liquidity sourcing and diversification as well as interest rate and structural foreign exchange management.
Asset Liability Management Oversight and Organisation The Asset Liability Management Committee (ALCO), comprising members of senior management, is responsible for the management of our balance sheet and liquidity risks. The ALCO is chaired by the CEO and includes senior management from the business, risk and support units.
The ALCO is supported by the Corporate Treasury department within the Group Finance Division. The Asset Liability Management department within GRM monitors our banking book interest rate, structural foreign exchange and liquidity risk profiles under both business-as-usual and stressed scenarios. These are based on the standards established in the Asset Liability Management (ALM) framework, policies and procedures which are subject to regular reviews to ensure that they remain relevant in the context of the prevailing market conditions and practices.
Asset Liability Management Approach The ALM framework comprises liquidity risk management, interest rate risk management and structural foreign exchange risk management.
Liquidity RiskThe objective of liquidity risk management is to ensure that we have sufficient funds to meet contractual and regulatory financial obligations and to undertake new transactions.
Our liquidity management process involves establishing liquidity management policies and limits, and regular monitoring against them. We also perform short-term liquidity stress tests based on institution-specific and market-wide liquidity stress scenarios. The results of the stress tests are used to adjust liquidity risk management strategies, policies and positions and to develop effective contingency funding plans.
Liquidity monitoring is performed daily within a framework for projecting cash flows on a contractual and behavioural basis. Simulations of liquidity exposures under stressed market scenarios are performed and the results are taken into account in the risk management process. Indicators such as liquidity and deposit concentration ratios are used to establish the level of optimal funding mix and asset composition. Funding strategies are established to provide effective diversification and stability in funding sources across tenors, products and geographies. In addition, we maintain liquid assets in excess of regulatory requirements to strengthen our ability to meet liquidity needs during a crisis. These liquid assets comprise statutory reserve eligible securities as well as marketable shares and debt securities.
In 2018, we extended our daily regulatory reporting of our group-wide Liquidity Coverage Ratio (LCR) to include OCBC Wing Hang Hong Kong, OCBC Wing Hang Macao and OCBC Yangon. We also commenced regulatory reporting of our group-wide Net Stable Funding Ratio (NSFR).
Interest Rate Risk in the Banking BookThe primary goal of the management of Interest Rate Risk in the Banking Book (IRRBB) is to ensure that interest rate risk exposures are maintained within defined risk tolerances and are consistent with our risk appetite.
IRRBB is the risk to earnings and capital arising from exposure to adverse movements in interest rates. The material sources of IRRBB are repricing risk, yield curve risk, basis risk and optionality risk. We use a range of techniques to measure these risks from an earnings and economic value perspective. One method involves the simulation of the impact of various interest rate scenarios on our net interest income and economic value of equity (EVE). Other measures include interest rate sensitivity measures such as PV01 as well as repricing gap profile analysis. Triggers are set based on our risk appetite on earnings and capital. We use the results to adjust IRRBB management strategies, policies and positions.
Limits are established to manage interest rate exposures and reviewed regularly to ensure they remain relevant in the context of the prevailing external environment. Control systems are in place to monitor the risk profile against the approved risk thresholds. In 2018, we completed the implementation of group-wide IRRBB regulatory reporting which came into effect from 31 December 2018.
Structural Foreign Exchange RiskStructural foreign exchange exposure arises primarily from our net investment and retained earnings in overseas branches, subsidiaries as well as other strategic and property assets. We manage structural foreign exchange risk through hedges and matched funding for foreign currency investments where appropriate.
Other RisksNon-structural foreign exchange exposures in banking book are largely transferred to trading book for foreign exchange risk management. We are exposed to credit spread risk with the holding of high quality liquid assets (HQLA) in our banking book to comply with LCR. While HQLA are of low default risk, their value could be sensitive to changes in credit spreads. This risk is monitored against approved CS01 limits on a daily basis and subject to historical and anticipatory stress testing. The other risk residing in the banking book is non-strategic equity price risk arising from our equity investment in listed and non-listed companies. Such non-strategic equity forms an insignificant portion of our overall securities portfolio, excluding GEH.
Operational Risk Management
Operational risk is the risk of loss resulting from inadequate or failed internal processes, people, systems and management or from external events. Operational risk management enables us to fulfil our fiduciary duties, comply with legal and regulatory requirements and mitigate other risk factors. This will also help manage any reputational risk impact. We aim to manage both expected and unexpected losses, including those caused by catastrophic events. These twin objectives act as parameters to manage our risk as we pursue new business opportunities.
112 OCBC Annual Report 2018
Risk Management
Operational Risk Management Oversight and Organisation The Operational Risk Management Committee (ORC), comprising members of senior management, supports the BRMC and CEO in managing operational risk. It supports the Group’s business strategy by ensuring that the operational risk is within acceptable tolerance levels and approved risk appetite. ORC also ensures that our operational risk management (ORM) programmes are appropriate and effective.
The Operational Risk Management department establishes the ORM framework, supporting policies and procedures. It also independently oversees operational risk monitoring and controls that reside within each business, product and process. ORM programmes are actively implemented through the respective Operational Risk Partners (ORP) or managers in the business units and subsidiaries. Operational Risk Management department has also developed an industry-recognised accreditation programme to raise the competency level of ORPs or managers. In 2018, the accreditation programme was further enhanced to incorporate cyber risk management.
Operational Risk Management Approach We adopt an ORM framework that ensures operational risks are properly identified, managed, monitored, mitigated and reported in a structured and consistent manner. The framework is underpinned by a strong risk management and control culture.
Each business unit undertakes self-assessments on a regular basis by evaluating the robustness of its risk and control environment, including compliance with legal and regulatory requirements. Self-assessment declarations are subject to independent reviews. Performance metrics are also used to detect early warning signals and to drive appropriate management actions before the risks result in material losses. To enhance controls over trading activities and data loss prevention, we have specific risk units to perform surveillance over these areas.
Senior management attests annually to the CEO, BRMC and Audit Committee regarding the adequacy and effectiveness of the internal controls and risk management systems and highlights accompanying
remedial plans to address any outstanding key control deficiencies. Operational risk data is analysed and reported regularly to senior management.
To mitigate against operational losses, insurance programmes are in place to protect the Bank and its employees against adverse events. These programmes cover losses relating to crime, cyber risks, professional indemnity, directors’ and officers’ liability, property damage and public liability.
In addition, the subject-specific key risks that we focus on include but are not limited to:
Outsourcing Risk ManagementWe recognise the risks associated with outsourcing arrangements. As part of our outsourcing risk management programme, we have a multi-disciplinary outsourcing management group to manage outsourcing risks in a structured, systematic and consistent manner. In addition, as an active member of the Association of Banks in Singapore (ABS) Outsourcing Advisory Committee, we share outsourcing practices and keep abreast of developments in the industry.
Physical and People Security Risk ManagementWe have a programme to ensure that physical and security risks to people and assets are adequately addressed. The physical security programme includes active monitoring of external events that may pose a threat to OCBC locations, people and assets and provides advisories and response procedures to better prepare the Bank and our employees against risk events. We also have procedures in place to address risk posed to staff on business travel.
In 2018, as the chairperson of the ABS Physical Security Standing Committee, we supported ABS in developing and publishing an industry guideline on physical security. In collaboration with the Singapore Police Force, we conducted a desktop walkthrough and the first unrehearsed and unscripted exercise to test the security responses of our staff and security personnel as well as strengthened ground coordination and liaison during such incidents. To mitigate physical security risks, we are enhancing the access control management of our buildings.
Business Continuity Risk ManagementWe have a comprehensive and robust business continuity management programme that aims to minimise the interruption to essential business activities and services during a crisis. This is achieved through the implementation of robust recovery strategies and business recovery plans which are reviewed and tested annually.
In 2018, we further strengthened our resilience by developing recovery plans to address prolonged disruptive incidents. To create stronger awareness of crisis management amongst our Board members, we performed a walkthrough simulation with the Board Executive Committee. A cyber security incident desktop walkthrough exercise was also conducted, with participation from the chairpersons of the Board and BRMC. Such exercises will be conducted regularly to enhance awareness and the robustness of our programme. Senior management also provides an annual attestation to the BRMC which includes a measurement of the programme’s maturity across the Group and the extent of alignment with MAS guidelines, as well as a declaration of acceptable residual risk.
Fraud Risk ManagementOur fraud risk management and whistle-blowing programmes aim to prevent and detect fraud or misconduct. Apart from the internal reporting channel, to provide added assurance of the confidentiality and integrity of the process, we also have an external channel for employees to lodge whistle-blowing reports. Members of the public may also lodge whistle-blowing reports through any of our existing channels. We adopt a zero-tolerance stance in relation to fraud and conduct independent investigations into such incidents. Fraud incident reports – including root cause analysis, extent of damage, remedial actions and recovery steps for major incidents – are regularly reported to the ORC and BRMC. Group Audit independently reviews all fraud and whistle-blowing cases; findings are reported to the Audit Committee.
In 2018, we ran a targeted public awareness campaign to educate the public about scams and focused on strengthening public-private collaboration to combat fraud. We also
113Governance
continue to invest in new technologies to detect potential fraudulent transactions. This includes enhancing our Fraud Surveillance System to monitor transactions on our online banking, credit card and ATM channels. New technologies were also deployed to detect financial malware on devices interacting with our Internet and mobile banking platforms. These capabilities will be further enhanced through extending the scope of coverage, utilising machine learning and AIs.
Technology, Information and Cyber Risk ManagementWe adopt a “defence-in-depth” approach to ensure that technology, information and cyber risks are properly assessed, monitored, mitigated and reported. Appropriate controls are in place to ensure the confidentiality, integrity and availability of our information assets. We also conduct regular security reviews and audits to validate the effectiveness of these controls.
We have comprehensive policy and extensive programmes in place to focus on cyber defence capabilities, cyber risk vigilance and awareness, social engineering testing, incident response, crisis management and business continuity, as well as insurance protection against damages arising from cyber-attacks. We review relevant external events on a regular basis and derive learning lessons to enhance our cyber resilience. Senior Management is also actively involved in decision-making on strategies to prevent, detect and respond to evolving cyber threat landscape. We also participate in industry-level exercises and collaborate with industry participants and government agencies to share intelligence and counter-measures against new forms of cyber-attacks. Please refer to our Sustainability Report for more information on cyber resilience.
Reputational Risk ManagementReputational risk is the current and prospective risk to earnings and capital arising from adverse perceptions of the Group’s image among customers, counterparties, shareholders, investors and regulators. We have a reputational risk management policy which focuses on understanding and managing our responsibilities towards our different stakeholders as well as protecting our reputation. A key emphasis of the
programme is effective information sharing and engagement with stakeholders.
Fiduciary Risk ManagementWe have a fiduciary risk management programme to manage risks associated with fiduciary relationships arising from managing funds or providing other agency services. The programme provides guidelines on regular identification, assessment, monitoring and mitigation of fiduciary risk exposures to ensure our compliance with applicable corporate standards.
Legal and Regulatory Risk ManagementWe hold ourselves to high standards when conducting our business and at all times observe and comply with applicable laws, rules and standards. We have an established compliance risk programme which defines the required environment and organisational components for managing the risk in a structured, systematic and consistent manner. Each business unit is responsible for having adequate and effective controls to manage both legal and regulatory risks. Senior management provides the CEO and BRMC with an annual Regulatory Compliance Certification regarding the state of regulatory compliance.
Anti-Money Laundering/Countering the Financing of Terrorism and Sanctions Risk ManagementWe have a robust framework and programme for combating money-laundering, countering the financing of terrorism and guarding against sanctions violations that is implemented across the Group. The framework and programme comprises policy and procedures, risk assessment methodologies, senior management governance oversight structure, escalation protocol, monitoring and investigation processes, transaction monitoring and screening systems and management reporting platforms. The core pillars of the framework are aligned to the MAS Anti-Money Laundering and Countering the Financing of Terrorism (AML/CFT) and Sanctions regulations and are also in line with the principles or guidelines set by international organisations, such as the Financial Action Task Force (FATF), Basel Committee and Wolfsberg Group.
Our programme is aimed at managing and mitigating potential exposure to existing
and emerging money laundering and terrorism financing (ML/TF) risks emanating from the various customer segments, products and services, delivery channels as well as the range of host countries where we have business operations. It includes observance of sanctions required by the MAS and the respective regulators of countries where our international offices and subsidiaries operate.
Our AML/CFT programme is subject to internal and external audits as well as regulatory inspections. The Board and senior management have oversight of the programme, which is reviewed regularly to ensure that it remains robust and relevant in the context of the evolving regulatory landscape and operating environment. Our AML/CFT & Sanctions systems capabilities are continuously enhanced where new Fintech solutions such as machine learning and AIs are embedded into the monitoring and screening platforms.
We recognise that our employees play an integral role in our AML/CFT efforts and have emphasised the importance of staying vigilant against ML/TF and sanctions risks to our business and network. We require our employees to undergo basic training and regular refresher training to ensure that they understand these risks. We also provide specific training to enable relevant employees to carry out their respective roles and to keep abreast of developments in the financial industry. We provide regular training to the respective Board and management committees of our entities within the Group to enable them to oversee our AML/CFT programme. The training encompasses AML/CFT and sanctions regulations, case studies depicting local or transnational criminal activities and new or developing typologies.
114 OCBC Annual Report 2018
Pillar 3 Disclosures
(OCBC Group – As at 31 December 2018)
Introduction
In accordance with Pillar 3 disclosure requirements under Monetary Authority of Singapore (MAS) Notice 637 on Risk Based Capital Adequacy Requirements for Banks incorporated in Singapore, relevant quantitative and qualitative disclosures have been included in the Stand-alone Pillar 3 Disclosures Report and this Annual Report under Risk Management, Corporate Governance, Capital Management Sections and Notes to Financial Statements. The Pillar 3 disclosures are to enable market participants to better understand and compare the capital adequacy and risk profile across banks via improved consistency in public disclosure.
Scope Of Consolidation
The consolidation basis used for regulatory capital computation is similar to that used for financial reporting except for Great Eastern Holdings Limited and its insurance subsidiaries which are excluded from regulatory consolidation and are treated as investments in unconsolidated major stake companies that are financial institutions in accordance with MAS Notice 637’s amended definition of insurance subsidiary. The regulatory adjustments applied to these investments are in accordance with MAS Notice 637 paragraphs 6.1.3(p), 6.2.3(e) and 6.3.3(e).
The Stand-alone Pillar 3 Disclosures Report is located in the Capital and Regulatory section of OCBC’s website for Fourth Quarter and Full Year 2018 (www.ocbc.com/group/investors/cap_and_reg_disclosures.html).
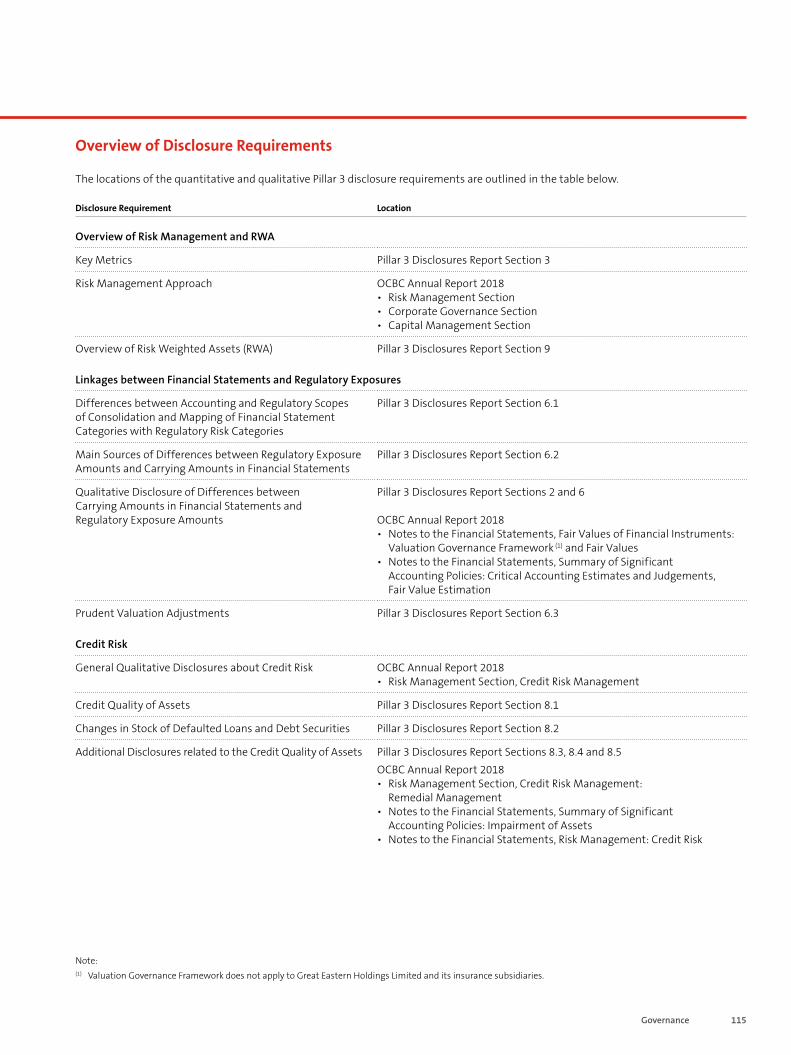
115Governance
Disclosure Requirement Location
Overview of Risk Management and RWA
Key Metrics Pillar 3 Disclosures Report Section 3
Risk Management Approach OCBC Annual Report 2018 • Risk Management Section • Corporate Governance Section • Capital Management Section
Overview of Risk Weighted Assets (RWA) Pillar 3 Disclosures Report Section 9
Linkages between Financial Statements and Regulatory Exposures
Differences between Accounting and Regulatory Scopes of Consolidation and Mapping of Financial Statement Categories with Regulatory Risk Categories
Pillar 3 Disclosures Report Section 6.1
Main Sources of Differences between Regulatory Exposure Amounts and Carrying Amounts in Financial Statements
Pillar 3 Disclosures Report Section 6.2
Qualitative Disclosure of Differences between Carrying Amounts in Financial Statements and Regulatory Exposure Amounts
Pillar 3 Disclosures Report Sections 2 and 6
OCBC Annual Report 2018 • Notes to the Financial Statements, Fair Values of Financial Instruments:
Valuation Governance Framework (1) and Fair Values • Notes to the Financial Statements, Summary of Significant
Accounting Policies: Critical Accounting Estimates and Judgements, Fair Value Estimation
Prudent Valuation Adjustments Pillar 3 Disclosures Report Section 6.3
Credit Risk
General Qualitative Disclosures about Credit Risk OCBC Annual Report 2018 • Risk Management Section, Credit Risk Management
Credit Quality of Assets Pillar 3 Disclosures Report Section 8.1
Changes in Stock of Defaulted Loans and Debt Securities Pillar 3 Disclosures Report Section 8.2
Additional Disclosures related to the Credit Quality of Assets Pillar 3 Disclosures Report Sections 8.3, 8.4 and 8.5 OCBC Annual Report 2018 • Risk Management Section, Credit Risk Management:
Remedial Management • Notes to the Financial Statements, Summary of Significant
Accounting Policies: Impairment of Assets • Notes to the Financial Statements, Risk Management: Credit Risk
Overview of Disclosure Requirements
The locations of the quantitative and qualitative Pillar 3 disclosure requirements are outlined in the table below.
Note: (1) Valuation Governance Framework does not apply to Great Eastern Holdings Limited and its insurance subsidiaries.
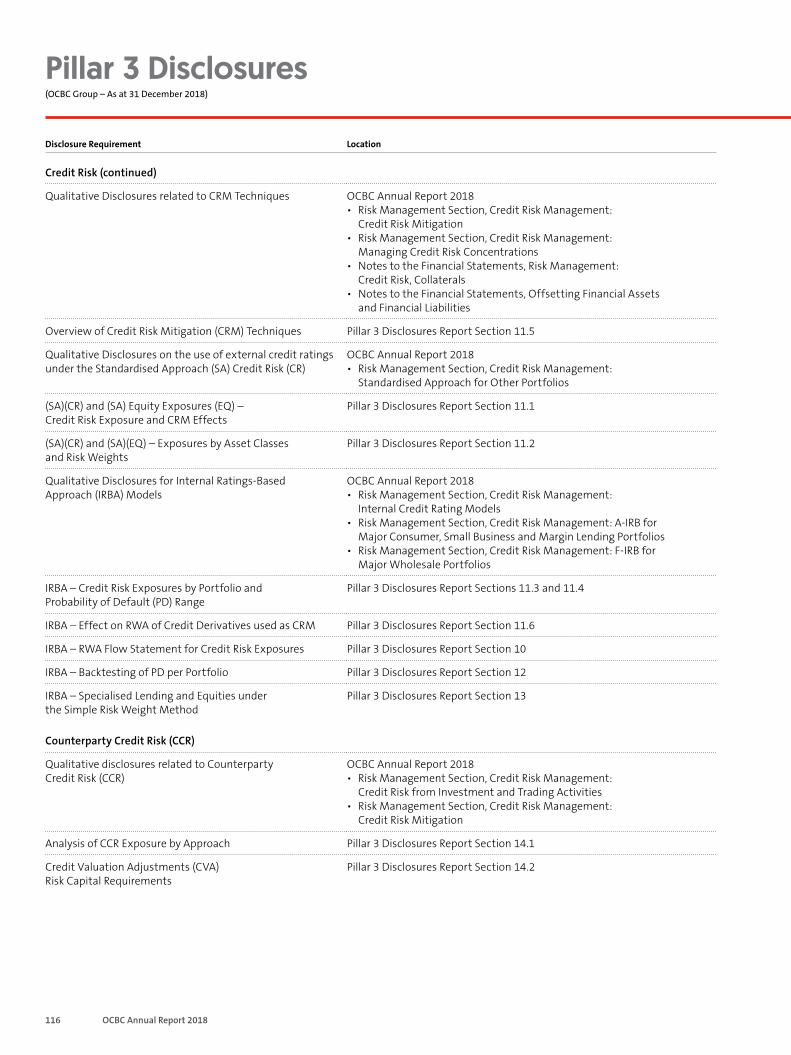
116 OCBC Annual Report 2018
Pillar 3 Disclosures
(OCBC Group – As at 31 December 2018)
Disclosure Requirement Location
Credit Risk (continued)
Qualitative Disclosures related to CRM Techniques OCBC Annual Report 2018 • Risk Management Section, Credit Risk Management:
Credit Risk Mitigation • Risk Management Section, Credit Risk Management:
Managing Credit Risk Concentrations • Notes to the Financial Statements, Risk Management:
Credit Risk, Collaterals • Notes to the Financial Statements, Offsetting Financial Assets
and Financial Liabilities
Overview of Credit Risk Mitigation (CRM) Techniques Pillar 3 Disclosures Report Section 11.5
Qualitative Disclosures on the use of external credit ratings under the Standardised Approach (SA) Credit Risk (CR)
OCBC Annual Report 2018 • Risk Management Section, Credit Risk Management:
Standardised Approach for Other Portfolios
(SA)(CR) and (SA) Equity Exposures (EQ) – Credit Risk Exposure and CRM Effects
Pillar 3 Disclosures Report Section 11.1
(SA)(CR) and (SA)(EQ) – Exposures by Asset Classes and Risk Weights
Pillar 3 Disclosures Report Section 11.2
Qualitative Disclosures for Internal Ratings-Based Approach (IRBA) Models
OCBC Annual Report 2018 • Risk Management Section, Credit Risk Management:
Internal Credit Rating Models • Risk Management Section, Credit Risk Management: A-IRB for
Major Consumer, Small Business and Margin Lending Portfolios • Risk Management Section, Credit Risk Management: F-IRB for
Major Wholesale Portfolios
IRBA – Credit Risk Exposures by Portfolio and Probability of Default (PD) Range
Pillar 3 Disclosures Report Sections 11.3 and 11.4
IRBA – Effect on RWA of Credit Derivatives used as CRM Pillar 3 Disclosures Report Section 11.6
IRBA – RWA Flow Statement for Credit Risk Exposures Pillar 3 Disclosures Report Section 10
IRBA – Backtesting of PD per Portfolio Pillar 3 Disclosures Report Section 12
IRBA – Specialised Lending and Equities under the Simple Risk Weight Method
Pillar 3 Disclosures Report Section 13
Counterparty Credit Risk (CCR)
Qualitative disclosures related to Counterparty Credit Risk (CCR)
OCBC Annual Report 2018 • Risk Management Section, Credit Risk Management:
Credit Risk from Investment and Trading Activities • Risk Management Section, Credit Risk Management:
Credit Risk Mitigation
Analysis of CCR Exposure by Approach Pillar 3 Disclosures Report Section 14.1
Credit Valuation Adjustments (CVA) Risk Capital Requirements
Pillar 3 Disclosures Report Section 14.2
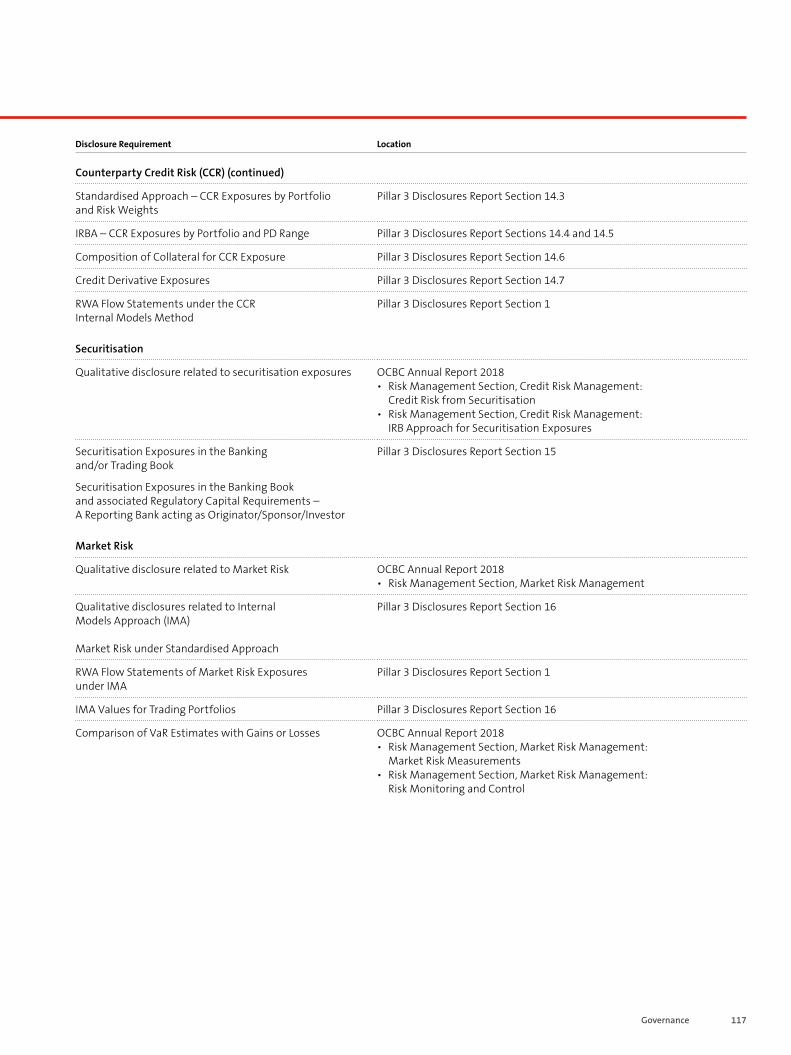
117Governance
Disclosure Requirement Location
Counterparty Credit Risk (CCR) (continued)
Standardised Approach – CCR Exposures by Portfolio and Risk Weights
Pillar 3 Disclosures Report Section 14.3
IRBA – CCR Exposures by Portfolio and PD Range Pillar 3 Disclosures Report Sections 14.4 and 14.5
Composition of Collateral for CCR Exposure Pillar 3 Disclosures Report Section 14.6
Credit Derivative Exposures Pillar 3 Disclosures Report Section 14.7
RWA Flow Statements under the CCR Internal Models Method
Pillar 3 Disclosures Report Section 1
Securitisation
Qualitative disclosure related to securitisation exposures OCBC Annual Report 2018 • Risk Management Section, Credit Risk Management:
Credit Risk from Securitisation • Risk Management Section, Credit Risk Management:
IRB Approach for Securitisation Exposures
Securitisation Exposures in the Banking and/or Trading Book
Securitisation Exposures in the Banking Book and associated Regulatory Capital Requirements – A Reporting Bank acting as Originator/Sponsor/Investor
Pillar 3 Disclosures Report Section 15
Market Risk
Qualitative disclosure related to Market Risk OCBC Annual Report 2018 • Risk Management Section, Market Risk Management
Qualitative disclosures related to Internal Models Approach (IMA)
Market Risk under Standardised Approach
Pillar 3 Disclosures Report Section 16
RWA Flow Statements of Market Risk Exposures under IMA
Pillar 3 Disclosures Report Section 1
IMA Values for Trading Portfolios Pillar 3 Disclosures Report Section 16
Comparison of VaR Estimates with Gains or Losses OCBC Annual Report 2018 • Risk Management Section, Market Risk Management:
Market Risk Measurements • Risk Management Section, Market Risk Management:
Risk Monitoring and Control
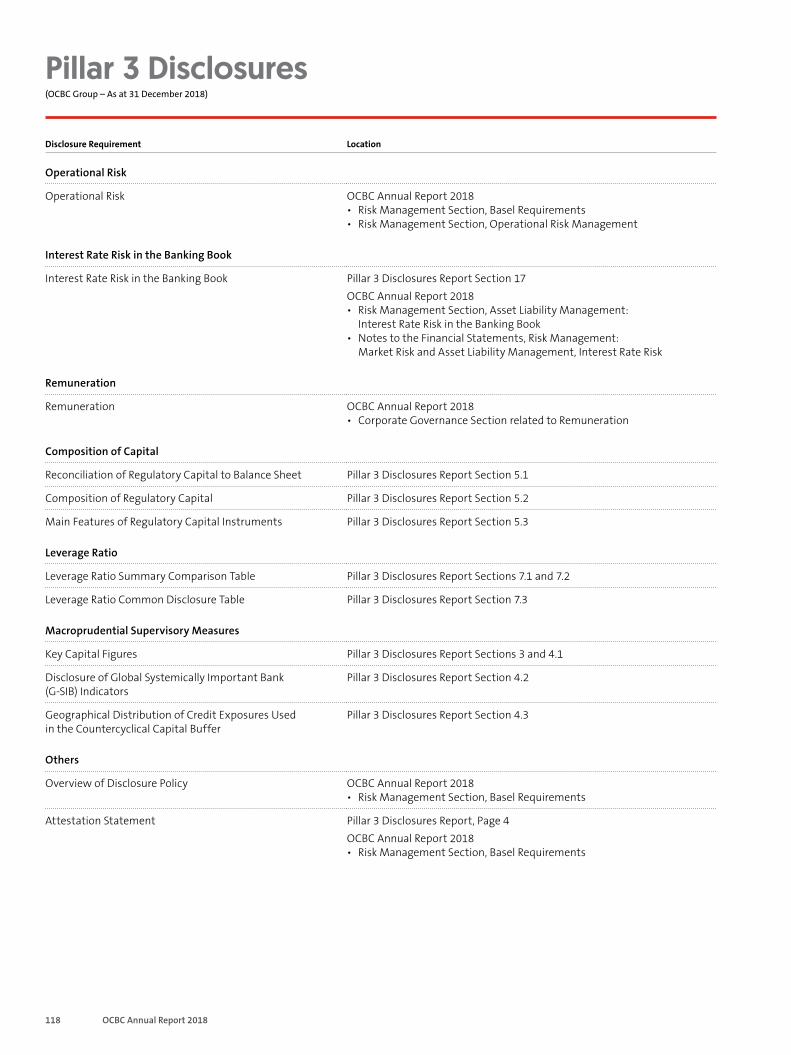
118 OCBC Annual Report 2018
Pillar 3 Disclosures
(OCBC Group – As at 31 December 2018)
Disclosure Requirement Location
Operational Risk
Operational Risk OCBC Annual Report 2018 • Risk Management Section, Basel Requirements • Risk Management Section, Operational Risk Management
Interest Rate Risk in the Banking Book
Interest Rate Risk in the Banking Book Pillar 3 Disclosures Report Section 17 OCBC Annual Report 2018 • Risk Management Section, Asset Liability Management:
Interest Rate Risk in the Banking Book • Notes to the Financial Statements, Risk Management:
Market Risk and Asset Liability Management, Interest Rate Risk
Remuneration
Remuneration OCBC Annual Report 2018 • Corporate Governance Section related to Remuneration
Composition of Capital
Reconciliation of Regulatory Capital to Balance Sheet Pillar 3 Disclosures Report Section 5.1
Composition of Regulatory Capital Pillar 3 Disclosures Report Section 5.2
Main Features of Regulatory Capital Instruments Pillar 3 Disclosures Report Section 5.3
Leverage Ratio
Leverage Ratio Summary Comparison Table Pillar 3 Disclosures Report Sections 7.1 and 7.2
Leverage Ratio Common Disclosure Table Pillar 3 Disclosures Report Section 7.3
Macroprudential Supervisory Measures
Key Capital Figures Pillar 3 Disclosures Report Sections 3 and 4.1
Disclosure of Global Systemically Important Bank (G-SIB) Indicators
Pillar 3 Disclosures Report Section 4.2
Geographical Distribution of Credit Exposures Used in the Countercyclical Capital Buffer
Pillar 3 Disclosures Report Section 4.3
Others
Overview of Disclosure Policy OCBC Annual Report 2018 • Risk Management Section, Basel Requirements
Attestation Statement Pillar 3 Disclosures Report, Page 4 OCBC Annual Report 2018 • Risk Management Section, Basel Requirements
Financial ReportManagement Discussion and Analysis 120
Financial Statements Directors’ Statement 134Independent Auditors’ Report 140Income Statements 147Statements of Comprehensive Income 148Balance Sheets 149Statement of Changes in Equity – Group 150Statement of Changes in Equity – Bank 152Consolidated Cash Flow Statement 153Notes to the Financial Statements 154
Group’s Major Properties 283
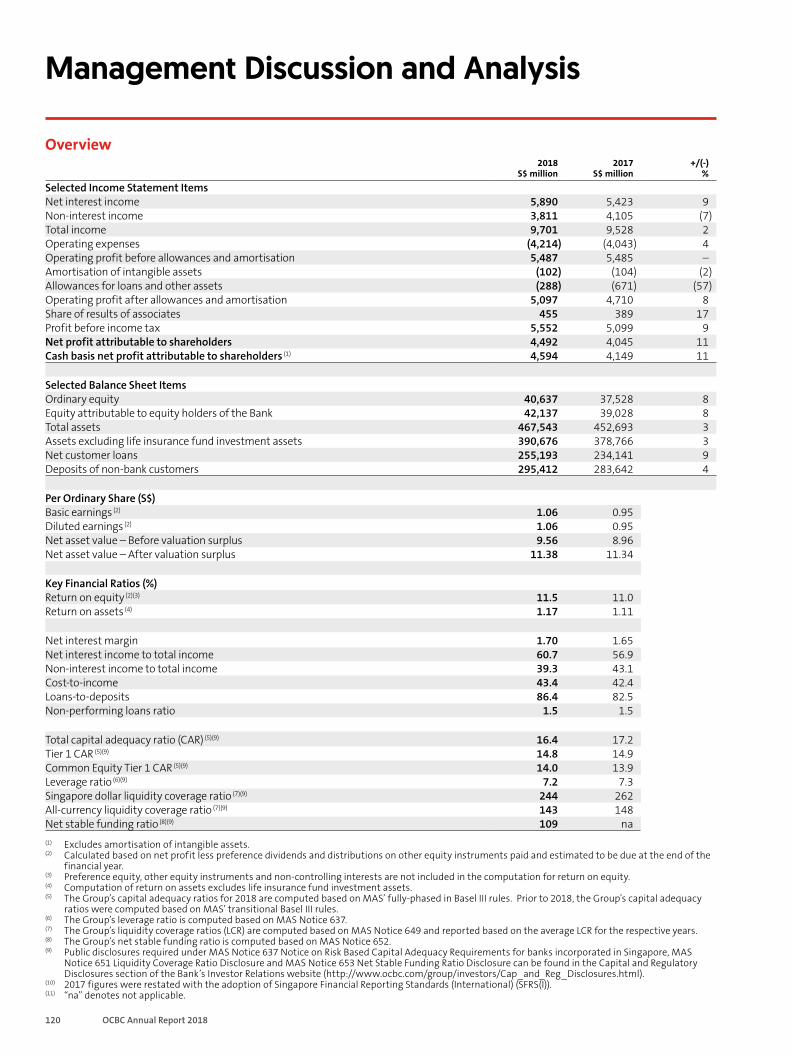
120 OCBC Annual Report 2018
Management Discussion and Analysis
Overview2018
S$ million2017
S$ million+/(-)
%Selected Income Statement ItemsNet interest income 5,890 5,423 9Non-interest income 3,811 4,105 (7)Total income 9,701 9,528 2Operating expenses (4,214) (4,043) 4Operating profit before allowances and amortisation 5,487 5,485 –Amortisation of intangible assets (102) (104) (2)Allowances for loans and other assets (288) (671) (57)Operating profit after allowances and amortisation 5,097 4,710 8Share of results of associates 455 389 17Profit before income tax 5,552 5,099 9Net profit attributable to shareholders 4,492 4,045 11Cash basis net profit attributable to shareholders (1) 4,594 4,149 11
Selected Balance Sheet ItemsOrdinary equity 40,637 37,528 8Equity attributable to equity holders of the Bank 42,137 39,028 8Total assets 467,543 452,693 3Assets excluding life insurance fund investment assets 390,676 378,766 3Net customer loans 255,193 234,141 9Deposits of non-bank customers 295,412 283,642 4
Per Ordinary Share (S$)Basic earnings (2) 1.06 0.95Diluted earnings (2) 1.06 0.95Net asset value – Before valuation surplus 9.56 8.96Net asset value – After valuation surplus 11.38 11.34
Key Financial Ratios (%)Return on equity (2)(3) 11.5 11.0Return on assets (4) 1.17 1.11
Net interest margin 1.70 1.65Net interest income to total income 60.7 56.9Non-interest income to total income 39.3 43.1Cost-to-income 43.4 42.4Loans-to-deposits 86.4 82.5Non-performing loans ratio 1.5 1.5
Total capital adequacy ratio (CAR) (5)(9) 16.4 17.2Tier 1 CAR (5)(9) 14.8 14.9Common Equity Tier 1 CAR (5)(9) 14.0 13.9Leverage ratio (6)(9) 7.2 7.3Singapore dollar liquidity coverage ratio (7)(9) 244 262All-currency liquidity coverage ratio (7)(9) 143 148Net stable funding ratio (8)(9) 109 na(1) Excludes amortisation of intangible assets.(2) Calculated based on net profit less preference dividends and distributions on other equity instruments paid and estimated to be due at the end of the
financial year.(3) Preference equity, other equity instruments and non-controlling interests are not included in the computation for return on equity.(4) Computation of return on assets excludes life insurance fund investment assets.(5) The Group’s capital adequacy ratios for 2018 are computed based on MAS’ fully-phased in Basel III rules. Prior to 2018, the Group’s capital adequacy
ratios were computed based on MAS’ transitional Basel III rules.(6) The Group’s leverage ratio is computed based on MAS Notice 637.(7) The Group’s liquidity coverage ratios (LCR) are computed based on MAS Notice 649 and reported based on the average LCR for the respective years.(8) The Group’s net stable funding ratio is computed based on MAS Notice 652.(9) Public disclosures required under MAS Notice 637 Notice on Risk Based Capital Adequacy Requirements for banks incorporated in Singapore, MAS
Notice 651 Liquidity Coverage Ratio Disclosure and MAS Notice 653 Net Stable Funding Ratio Disclosure can be found in the Capital and Regulatory Disclosures section of the Bank’s Investor Relations website (http://www.ocbc.com/group/investors/Cap_and_Reg_Disclosures.html).
(10) 2017 figures were restated with the adoption of Singapore Financial Reporting Standards (International) (SFRS(I)).(11) “na” denotes not applicable.
121Financials
Overview (continued)The Group reported a net profit after tax of S$4.49 billion for the financial year ended 31 December 2018, up 11% from S$4.05 billion a year ago. This was driven by record earnings from the Group’s banking operations which rose 22% year-on-year, led by income growth, disciplined cost control and lower allowances. The Group’s return on equity increased to 11.5% from 11.0% a year ago.
The Group’s total income climbed to a new high of S$9.70 billion from S$9.53 billion in the previous year.
Net interest income increased 9% year-on-year to S$5.89 billion from S$5.42 billion in 2017, underpinned by loan growth and a rise in net interest margin (NIM). Customer loans grew 9% to S$258 billion across all key markets. Full year NIM improved by 5 basis points to 1.70% from higher margins in Singapore, Malaysia and Greater China.
Non-interest income of S$3.81 billion declined 7% from the previous year, mainly attributed to lower investment income from Great Eastern Holdings (GEH), even though non-interest income from banking operations rose 4% year-on-year. The Group’s net fees and commissions grew 4% to S$2.03 billion, led by higher wealth management, credit card, loan and trade-related fees. Wealth management fee income was up 5% at S$958 million, despite slower fourth quarter performance as a result of weak investment sentiments during the quarter. Net trading income was 1% lower from a year ago at S$508 million, while income from life and general insurance was little changed at S$911 million. Net gains from sale of investment securities were significantly lower at S$16 million as compared to S$431 million a year ago, as substantially higher gains were realised from the divestment of investment securities by GEH in the prior year.
Operating expenses were S$4.21 billion and 4% above a year ago, with the cost-to-income ratio at 43.4%. Allowances for loans and other assets of S$288 million were below S$671 million a year ago.
The Group’s share of results of associates rose 17% to S$455 million from S$389 million a year ago.
Earnings per share increased to S$1.06 from S$0.95 in the previous year.
Allowances and Asset QualityNet allowances for loans and other assets in 2018 were S$288 million, significantly lower than the S$671 million a year ago.
Overall asset quality of the loan portfolio continued to be healthy. As at 31 December 2018, total non-performing assets were S$3.94 billion, higher than S$3.47 billion a year ago, with the increase led by the general commerce sector. The non-performing loans ratio of 1.5% was flat as compared to the prior year.
Funding and Capital Position The Group maintained its strong funding and capital position. Customer loans grew 9% year-on-year to S$258 billion while customer deposits were up 4% at S$295 billion, with current account and savings deposits representing 46.4% of total non-bank deposits. The Group’s loans-to-deposits ratio was 86.4% as compared to 82.5% a year ago.
The average Singapore dollar and all-currency liquidity coverage ratios for the Group in 2018 were 244% and 143% respectively, while the net stable funding ratio was 109%. The Group’s Common Equity Tier 1 capital adequacy ratio (CAR), Tier 1 CAR and Total CAR as at 31 December 2018 were 14.0%, 14.8% and 16.4% respectively. The Group’s leverage ratio was 7.2% as at 31 December 2018.
These regulatory ratios were all above their respective regulatory requirements.
122 OCBC Annual Report 2018
Management Discussion and Analysis
Overview (continued)Subsidiaries’ Full Year PerformanceGreat Eastern Holdings’ net profit after tax was S$741 million for the year, 29% lower than S$1.04 billion in 2017. Although operating profit from its underlying insurance business grew year-on-year, this was more than offset by unrealised mark-to-market losses in its investment portfolio and the absence of substantial gains from the sale of investment securities that were realised a year ago. GEH’s contribution to the Group’s net profit, after deducting amortisation of intangible assets and non-controlling interests, was S$604 million, representing 13% of the Group’s earnings, as compared to 21% in the prior year. Total weighted new sales and new business embedded value (NBEV) were S$1.24 billion and S$528 million respectively in 2018, while NBEV margin rose to 42.7% from 41.4% a year ago. Embedded value, a measure of the economic value of the existing business of a life insurance company, rose 0.4% year-on-year to S$13.44 billion.
Both OCBC Wing Hang and Bank OCBC NISP reported record net profit after tax in local currency terms in 2018. OCBC Wing Hang’s net profit increased 15% from a year ago to HK$2.76 billion (S$475 million), driven by broad-based income growth. Its customer loans rose 8% to HK$193 billion (S$34 billion) while deposits were relatively stable at HK$222 billion (S$39 billion). Bank OCBC NISP reported a 21% rise in full year net profit of IDR2.64 trillion (S$251 million), backed by strong net interest income growth and lower allowances. Customer loans and deposits both grew 11% year-on-year to IDR118 trillion (S$11 billion) and IDR126 trillion (S$12 billion) respectively.
OCBC Bank Malaysia’s full year net profit after tax fell 14% to RM814 million (S$272 million), as net interest income growth was offset by a decline in other income segments, while allowances were higher than the previous year. Customer loans were up 2% year-on-year at RM69 billion (S$23 billion) and deposits rose 3% to RM76 billion (S$25 billion).
As at 31 December 2018, Bank of Singapore’s assets under management grew 3% to US$102 billion (S$139 billion) from US$99 billion (S$132 billion) a year ago, driven by sustained net new money inflows. Including secured loans, its earnings asset base grew 4% to US$125 billion (S$171 billion) from US$121 billion (S$161 billion) in the previous year.
The Group’s overall wealth management-related income – comprising income from insurance, private banking, asset management, stockbroking and other wealth management products – was S$2.84 billion in 2018 and represented 29% of the Group’s total income.
Final DividendSupported by record earnings and a strong capital position, the Board has proposed a final tax-exempt dividend of 23 cents per share, representing an increase of 21% from the final dividend of 19 cents a year ago and a 15% rise from the interim dividend of 20 cents. Together with the interim dividend of 20 cents per share, this will bring the 2018 total dividend to 43 cents, up 16% or 6 cents, from 37 cents per share in 2017. To continue to provide our shareholders with the option of reinvesting in OCBC Bank, the Scrip Dividend Scheme will be applicable to the final dividend. The estimated total dividend payout will amount to S$1.82 billion, an increase of 17% from 2017. This represents a dividend payout ratio of 40% of the Group’s core net profit in 2018.
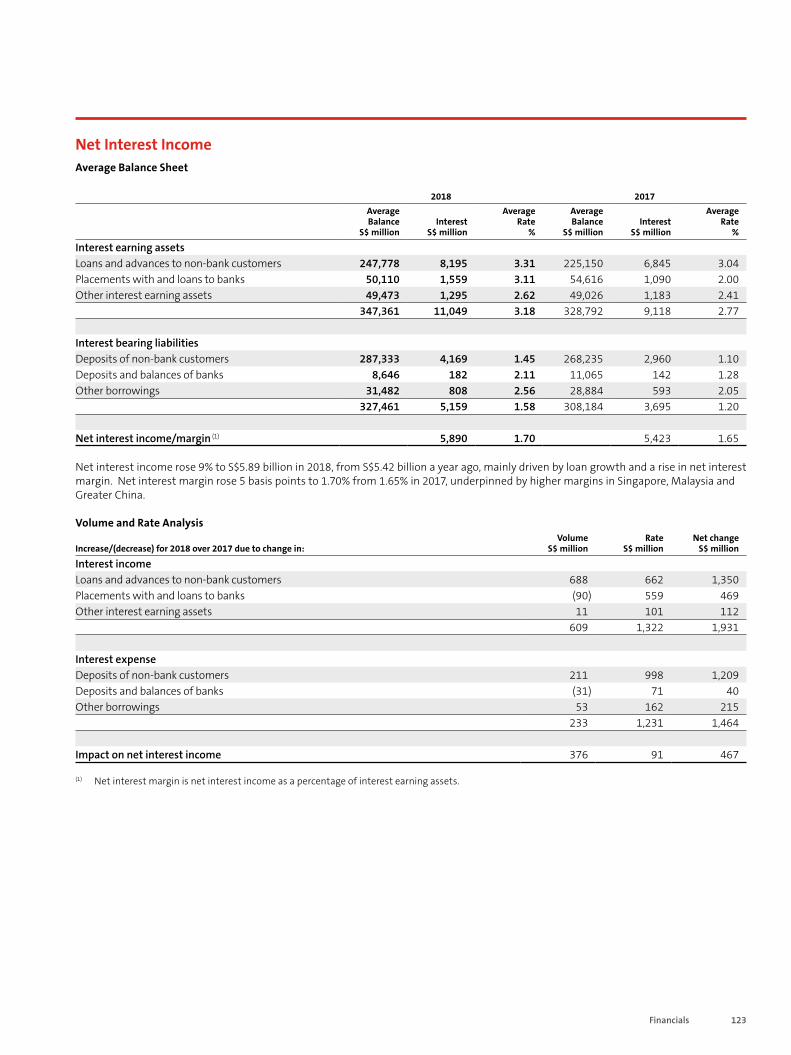
123Financials
Net Interest IncomeAverage Balance Sheet
2018 2017Average Average Average AverageBalance
S$ millionInterest
S$ millionRate
%Balance
S$ millionInterest
S$ millionRate
%
Interest earning assets Loans and advances to non-bank customers 247,778 8,195 3.31 225,150 6,845 3.04Placements with and loans to banks 50,110 1,559 3.11 54,616 1,090 2.00Other interest earning assets 49,473 1,295 2.62 49,026 1,183 2.41
347,361 11,049 3.18 328,792 9,118 2.77
Interest bearing liabilitiesDeposits of non-bank customers 287,333 4,169 1.45 268,235 2,960 1.10Deposits and balances of banks 8,646 182 2.11 11,065 142 1.28Other borrowings 31,482 808 2.56 28,884 593 2.05
327,461 5,159 1.58 308,184 3,695 1.20
Net interest income/margin (1) 5,890 1.70 5,423 1.65
Net interest income rose 9% to S$5.89 billion in 2018, from S$5.42 billion a year ago, mainly driven by loan growth and a rise in net interest margin. Net interest margin rose 5 basis points to 1.70% from 1.65% in 2017, underpinned by higher margins in Singapore, Malaysia and Greater China.
Volume and Rate Analysis
Increase/(decrease) for 2018 over 2017 due to change in: Volume
S$ millionRate
S$ millionNet change
S$ million
Interest incomeLoans and advances to non-bank customers 688 662 1,350Placements with and loans to banks (90) 559 469Other interest earning assets 11 101 112 609 1,322 1,931
Interest expenseDeposits of non-bank customers 211 998 1,209Deposits and balances of banks (31) 71 40Other borrowings 53 162 215
233 1,231 1,464
Impact on net interest income 376 91 467
(1) Net interest margin is net interest income as a percentage of interest earning assets.
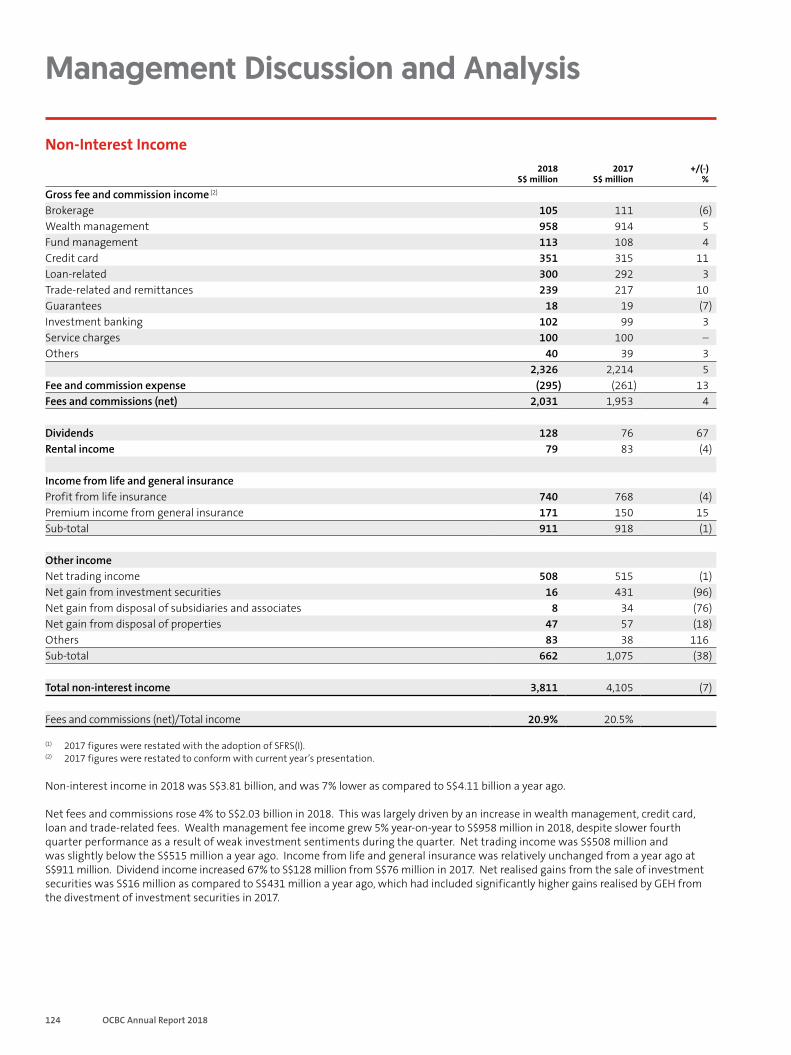
124 OCBC Annual Report 2018
Management Discussion and Analysis
Non-Interest Income2018
S$ million2017
S$ million+/(-)
%
Gross fee and commission income (2)
Brokerage 105 111 (6)Wealth management 958 914 5Fund management 113 108 4Credit card 351 315 11Loan-related 300 292 3Trade-related and remittances 239 217 10Guarantees 18 19 (7)Investment banking 102 99 3Service charges 100 100 –Others 40 39 3
2,326 2,214 5Fee and commission expense (295) (261) 13Fees and commissions (net) 2,031 1,953 4
Dividends 128 76 67Rental income 79 83 (4)
Income from life and general insuranceProfit from life insurance 740 768 (4)Premium income from general insurance 171 150 15Sub-total 911 918 (1)
Other incomeNet trading income 508 515 (1)Net gain from investment securities 16 431 (96)Net gain from disposal of subsidiaries and associates 8 34 (76)Net gain from disposal of properties 47 57 (18)Others 83 38 116Sub-total 662 1,075 (38)
Total non-interest income 3,811 4,105 (7)
Fees and commissions (net)/Total income 20.9% 20.5%
(1) 2017 figures were restated with the adoption of SFRS(I).(2) 2017 figures were restated to conform with current year’s presentation.
Non-interest income in 2018 was S$3.81 billion, and was 7% lower as compared to S$4.11 billion a year ago. Net fees and commissions rose 4% to S$2.03 billion in 2018. This was largely driven by an increase in wealth management, credit card, loan and trade-related fees. Wealth management fee income grew 5% year-on-year to S$958 million in 2018, despite slower fourth quarter performance as a result of weak investment sentiments during the quarter. Net trading income was S$508 million and was slightly below the S$515 million a year ago. Income from life and general insurance was relatively unchanged from a year ago at S$911 million. Dividend income increased 67% to S$128 million from S$76 million in 2017. Net realised gains from the sale of investment securities was S$16 million as compared to S$431 million a year ago, which had included significantly higher gains realised by GEH from the divestment of investment securities in 2017.
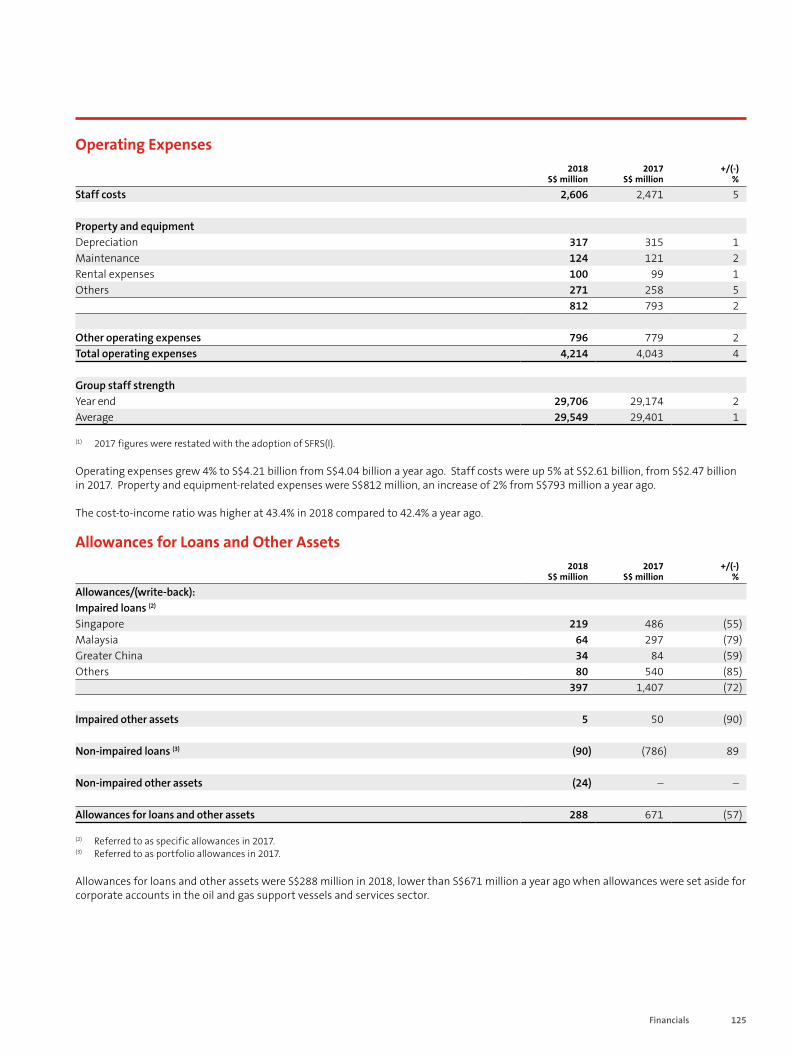
125Financials
Operating Expenses2018
S$ million2017
S$ million+/(-)
%
Staff costs 2,606 2,471 5
Property and equipmentDepreciation 317 315 1Maintenance 124 121 2Rental expenses 100 99 1Others 271 258 5
812 793 2
Other operating expenses 796 779 2Total operating expenses 4,214 4,043 4
Group staff strength Year end 29,706 29,174 2Average 29,549 29,401 1
(1) 2017 figures were restated with the adoption of SFRS(I).
Operating expenses grew 4% to S$4.21 billion from S$4.04 billion a year ago. Staff costs were up 5% at S$2.61 billion, from S$2.47 billion in 2017. Property and equipment-related expenses were S$812 million, an increase of 2% from S$793 million a year ago.
The cost-to-income ratio was higher at 43.4% in 2018 compared to 42.4% a year ago.
Allowances for Loans and Other Assets2018
S$ million2017
S$ million+/(-)
%
Allowances/(write-back): Impaired loans (2) Singapore 219 486 (55)Malaysia 64 297 (79)Greater China 34 84 (59)Others 80 540 (85)
397 1,407 (72)
Impaired other assets 5 50 (90)
Non-impaired loans (3) (90) (786) 89
Non-impaired other assets (24) – –
Allowances for loans and other assets 288 671 (57)
(2) Referred to as specific allowances in 2017.(3) Referred to as portfolio allowances in 2017.
Allowances for loans and other assets were S$288 million in 2018, lower than S$671 million a year ago when allowances were set aside for corporate accounts in the oil and gas support vessels and services sector.
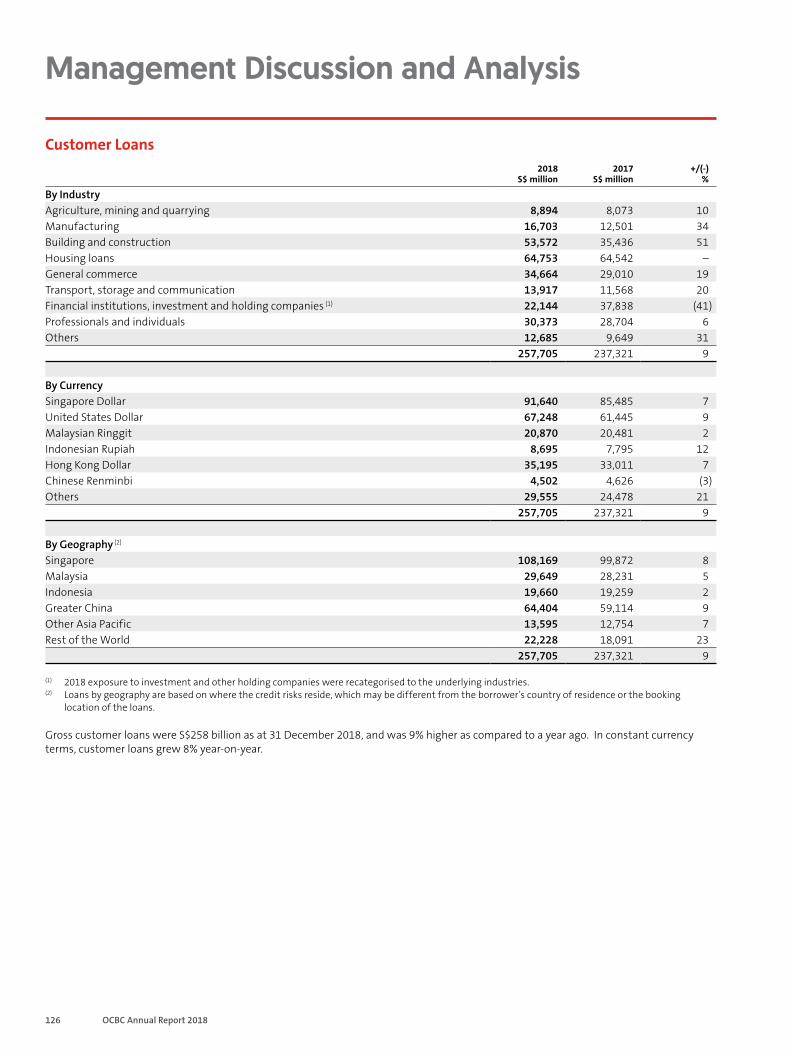
126 OCBC Annual Report 2018
Management Discussion and Analysis
Customer Loans2018
S$ million2017
S$ million+/(-)
%
By IndustryAgriculture, mining and quarrying 8,894 8,073 10Manufacturing 16,703 12,501 34Building and construction 53,572 35,436 51Housing loans 64,753 64,542 –General commerce 34,664 29,010 19Transport, storage and communication 13,917 11,568 20Financial institutions, investment and holding companies (1) 22,144 37,838 (41)Professionals and individuals 30,373 28,704 6Others 12,685 9,649 31
257,705 237,321 9
By Currency Singapore Dollar 91,640 85,485 7United States Dollar 67,248 61,445 9Malaysian Ringgit 20,870 20,481 2Indonesian Rupiah 8,695 7,795 12Hong Kong Dollar 35,195 33,011 7Chinese Renminbi 4,502 4,626 (3)Others 29,555 24,478 21
257,705 237,321 9
By Geography (2)
Singapore 108,169 99,872 8Malaysia 29,649 28,231 5Indonesia 19,660 19,259 2Greater China 64,404 59,114 9Other Asia Pacific 13,595 12,754 7Rest of the World 22,228 18,091 23
257,705 237,321 9
(1) 2018 exposure to investment and other holding companies were recategorised to the underlying industries.(2) Loans by geography are based on where the credit risks reside, which may be different from the borrower’s country of residence or the booking
location of the loans.
Gross customer loans were S$258 billion as at 31 December 2018, and was 9% higher as compared to a year ago. In constant currency terms, customer loans grew 8% year-on-year.
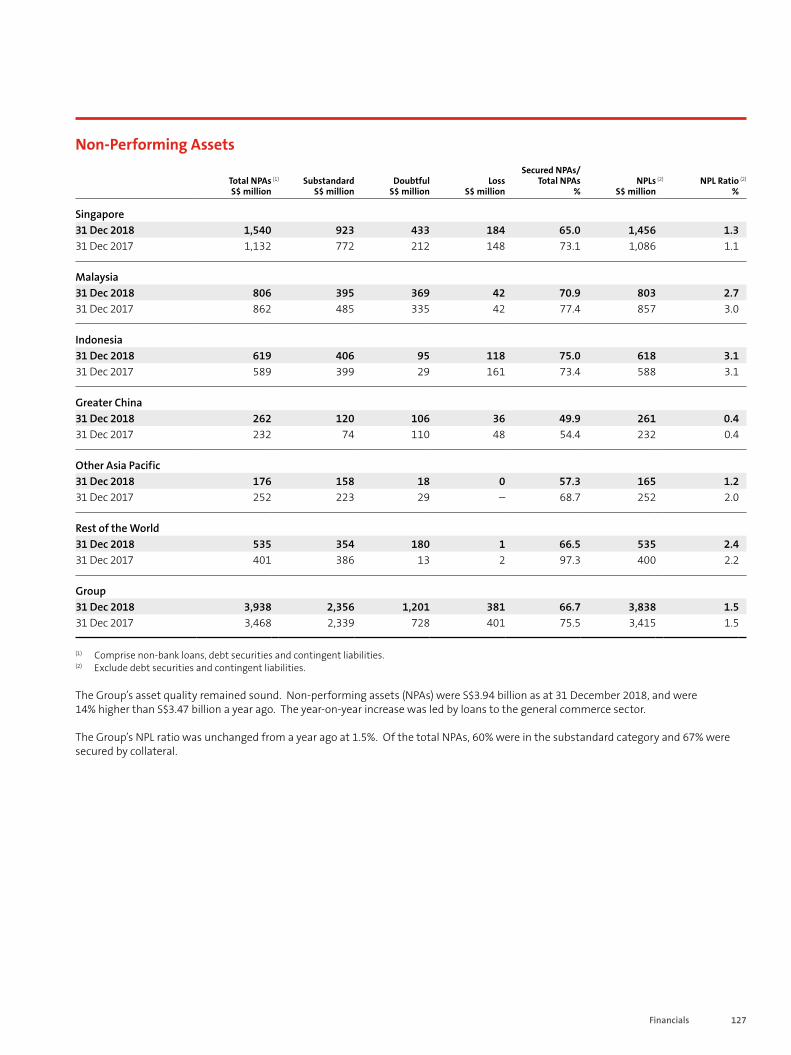
127Financials
Non-Performing Assets
Total NPAs S$ million
(1) Substandard S$ million
Doubtful S$ million
Loss S$ million
Secured NPAs/Total NPAs
%NPLs
S$ million(2) NPL Ratio
%(2)
Singapore31 Dec 2018 1,540 923 433 184 65.0 1,456 1.331 Dec 2017 1,132 772 212 148 73.1 1,086 1.1
Malaysia31 Dec 2018 806 395 369 42 70.9 803 2.731 Dec 2017 862 485 335 42 77.4 857 3.0
Indonesia31 Dec 2018 619 406 95 118 75.0 618 3.131 Dec 2017 589 399 29 161 73.4 588 3.1
Greater China31 Dec 2018 262 120 106 36 49.9 261 0.431 Dec 2017 232 74 110 48 54.4 232 0.4
Other Asia Pacific31 Dec 2018 176 158 18 0 57.3 165 1.231 Dec 2017 252 223 29 – 68.7 252 2.0
Rest of the World 31 Dec 2018 535 354 180 1 66.5 535 2.431 Dec 2017 401 386 13 2 97.3 400 2.2
Group 31 Dec 2018 3,938 2,356 1,201 381 66.7 3,838 1.531 Dec 2017 3,468 2,339 728 401 75.5 3,415 1.5
(1) Comprise non-bank loans, debt securities and contingent liabilities.(2) Exclude debt securities and contingent liabilities.
The Group’s asset quality remained sound. Non-performing assets (NPAs) were S$3.94 billion as at 31 December 2018, and were 14% higher than S$3.47 billion a year ago. The year-on-year increase was led by loans to the general commerce sector.
The Group’s NPL ratio was unchanged from a year ago at 1.5%. Of the total NPAs, 60% were in the substandard category and 67% were secured by collateral.
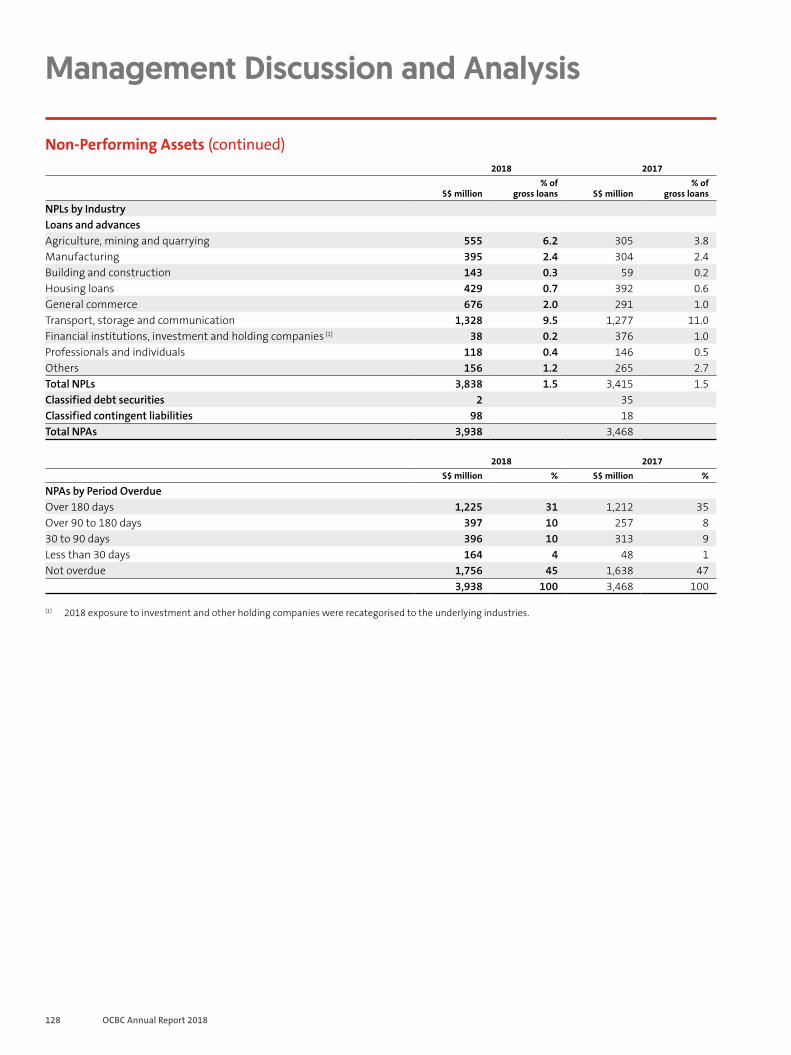
128 OCBC Annual Report 2018
Management Discussion and Analysis
Non-Performing Assets (continued) 2018 2017
S$ million% of
gross loans S$ million% of
gross loans
NPLs by IndustryLoans and advancesAgriculture, mining and quarrying 555 6.2 305 3.8Manufacturing 395 2.4 304 2.4Building and construction 143 0.3 59 0.2Housing loans 429 0.7 392 0.6General commerce 676 2.0 291 1.0Transport, storage and communication 1,328 9.5 1,277 11.0Financial institutions, investment and holding companies (1) 38 0.2 376 1.0Professionals and individuals 118 0.4 146 0.5Others 156 1.2 265 2.7Total NPLs 3,838 1.5 3,415 1.5Classified debt securities 2 35Classified contingent liabilities 98 18Total NPAs 3,938 3,468
2018 2017S$ million % S$ million %
NPAs by Period Overdue Over 180 days 1,225 31 1,212 35Over 90 to 180 days 397 10 257 830 to 90 days 396 10 313 9Less than 30 days 164 4 48 1Not overdue 1,756 45 1,638 47
3,938 100 3,468 100
(1) 2018 exposure to investment and other holding companies were recategorised to the underlying industries.

129Financials
Cumulative Allowances for Assets (1)
Total cumulative allowances
S$ million
Allowances for impaired assets
S$ million(2)
Allowances for non-impaired
assetsS$ million
(3)
Allowances for impaired assets
as % of total NPAs
%
Cumulative allowances
as % of total NPAs
%
Singapore31 Dec 2018 1,160 483 677 31.3 75.431 Dec 2017 764 320 444 28.2 67.4
Malaysia31 Dec 2018 552 333 219 41.3 68.531 Dec 2017 618 340 278 39.4 71.8
Indonesia31 Dec 2018 407 200 207 32.2 65.731 Dec 2017 416 232 184 39.4 70.7
Greater China31 Dec 2018 390 61 329 23.4 148.931 Dec 2017 428 61 367 26.5 184.8
Other Asia Pacific31 Dec 2018 45 2 43 1.4 25.831 Dec 2017 194 111 83 44.1 77.0
Rest of the World31 Dec 2018 215 142 73 26.6 40.131 Dec 2017 246 185 61 46.2 61.4
Group 31 Dec 2018 2,769 1,221 1,548 31.0 70.331 Dec 2017 2,666 1,249 1,417 36.0 76.9
(1) Included regulatory loss allowance reserve.(2) Referred to as specific allowances in 2017.(3) Referred to as portfolio allowances in 2017.
As at 31 December 2018, the Group’s total cumulative allowances for assets were S$2.77 billion, comprising S$1.22 billion in allowances for impaired assets and S$1.55 billion in allowances for non-impaired assets. The cumulative allowances represented 211% of unsecured NPAs and 70% of total NPAs.
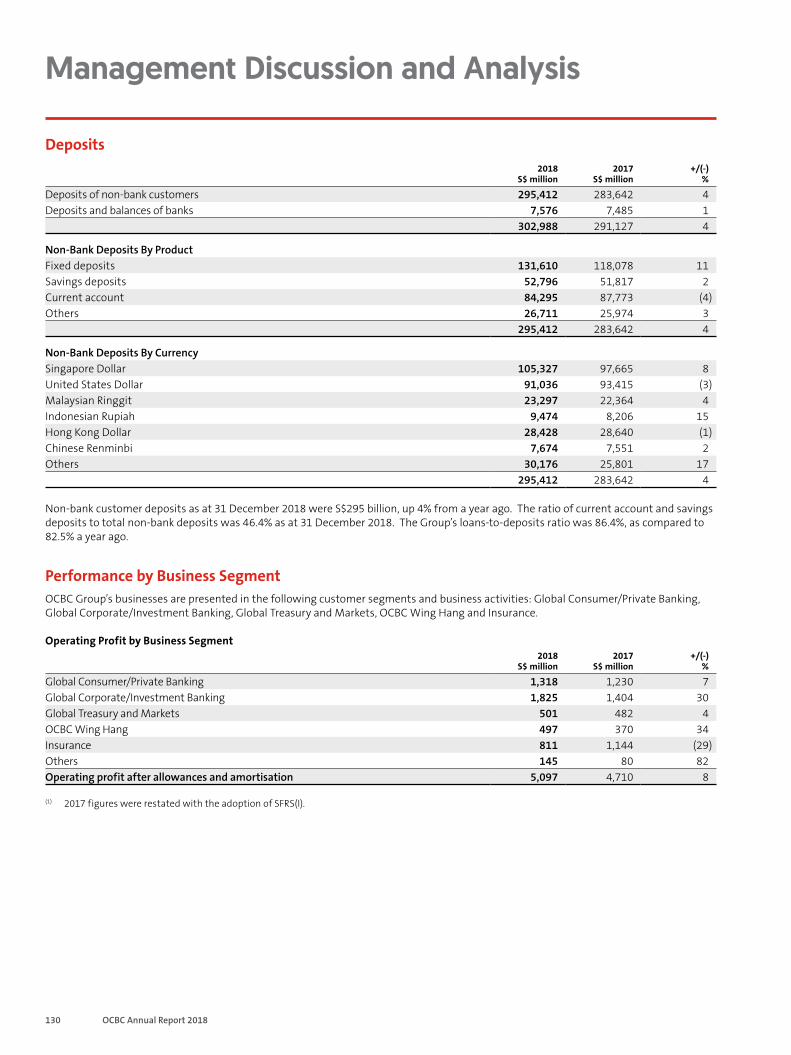
130 OCBC Annual Report 2018
Management Discussion and Analysis
Deposits2018
S$ million2017
S$ million+/(-)
%
Deposits of non-bank customers 295,412 283,642 4Deposits and balances of banks 7,576 7,485 1
302,988 291,127 4
Non-Bank Deposits By ProductFixed deposits 131,610 118,078 11Savings deposits 52,796 51,817 2Current account 84,295 87,773 (4)Others 26,711 25,974 3
295,412 283,642 4
Non-Bank Deposits By Currency Singapore Dollar 105,327 97,665 8United States Dollar 91,036 93,415 (3)Malaysian Ringgit 23,297 22,364 4Indonesian Rupiah 9,474 8,206 15Hong Kong Dollar 28,428 28,640 (1)Chinese Renminbi 7,674 7,551 2Others 30,176 25,801 17
295,412 283,642 4
Non-bank customer deposits as at 31 December 2018 were S$295 billion, up 4% from a year ago. The ratio of current account and savings deposits to total non-bank deposits was 46.4% as at 31 December 2018. The Group’s loans-to-deposits ratio was 86.4%, as compared to 82.5% a year ago.
Performance by Business SegmentOCBC Group’s businesses are presented in the following customer segments and business activities: Global Consumer/Private Banking, Global Corporate/Investment Banking, Global Treasury and Markets, OCBC Wing Hang and Insurance.
Operating Profit by Business Segment 2018
S$ million2017
S$ million+/(-)
%
Global Consumer/Private Banking 1,318 1,230 7Global Corporate/Investment Banking 1,825 1,404 30Global Treasury and Markets 501 482 4OCBC Wing Hang 497 370 34Insurance 811 1,144 (29)Others 145 80 82Operating profit after allowances and amortisation 5,097 4,710 8
(1) 2017 figures were restated with the adoption of SFRS(I).
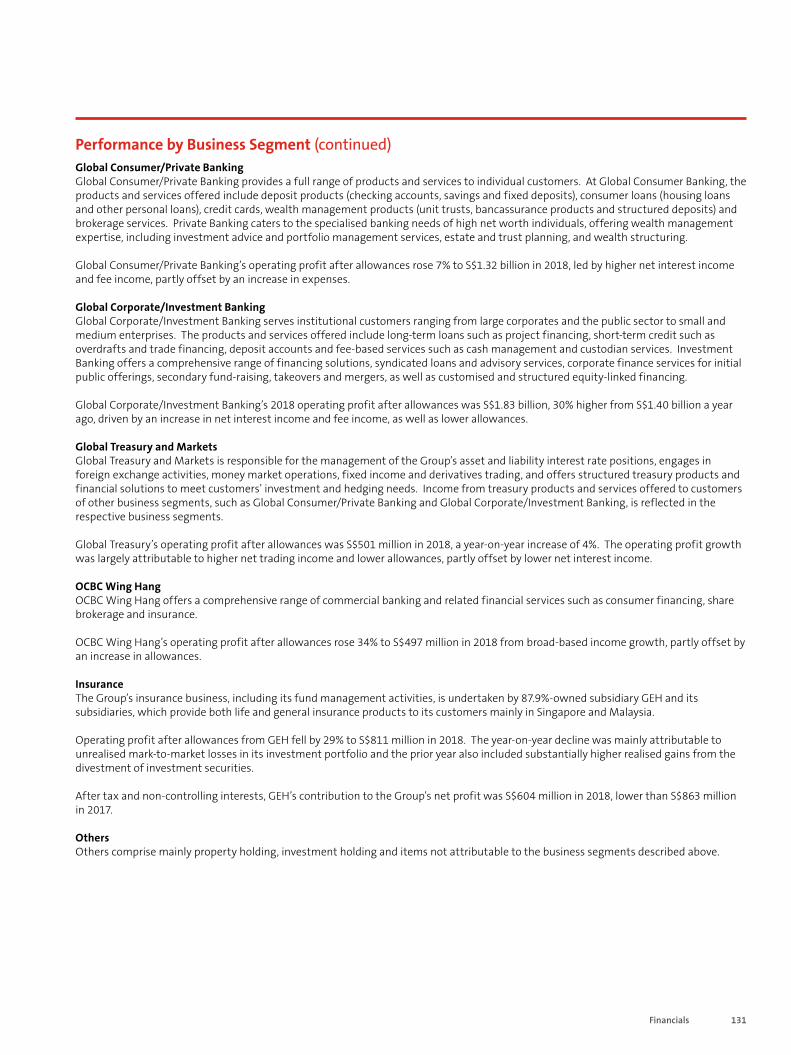
131Financials
Performance by Business Segment (continued) Global Consumer/Private Banking Global Consumer/Private Banking provides a full range of products and services to individual customers. At Global Consumer Banking, the products and services offered include deposit products (checking accounts, savings and fixed deposits), consumer loans (housing loans and other personal loans), credit cards, wealth management products (unit trusts, bancassurance products and structured deposits) and brokerage services. Private Banking caters to the specialised banking needs of high net worth individuals, offering wealth management expertise, including investment advice and portfolio management services, estate and trust planning, and wealth structuring.
Global Consumer/Private Banking’s operating profit after allowances rose 7% to S$1.32 billion in 2018, led by higher net interest income and fee income, partly offset by an increase in expenses.
Global Corporate/Investment Banking Global Corporate/Investment Banking serves institutional customers ranging from large corporates and the public sector to small and medium enterprises. The products and services offered include long-term loans such as project financing, short-term credit such as overdrafts and trade financing, deposit accounts and fee-based services such as cash management and custodian services. Investment Banking offers a comprehensive range of financing solutions, syndicated loans and advisory services, corporate finance services for initial public offerings, secondary fund-raising, takeovers and mergers, as well as customised and structured equity-linked financing.
Global Corporate/Investment Banking’s 2018 operating profit after allowances was S$1.83 billion, 30% higher from S$1.40 billion a year ago, driven by an increase in net interest income and fee income, as well as lower allowances.
Global Treasury and Markets Global Treasury and Markets is responsible for the management of the Group’s asset and liability interest rate positions, engages in foreign exchange activities, money market operations, fixed income and derivatives trading, and offers structured treasury products and financial solutions to meet customers’ investment and hedging needs. Income from treasury products and services offered to customers of other business segments, such as Global Consumer/Private Banking and Global Corporate/Investment Banking, is reflected in the respective business segments.
Global Treasury’s operating profit after allowances was S$501 million in 2018, a year-on-year increase of 4%. The operating profit growth was largely attributable to higher net trading income and lower allowances, partly offset by lower net interest income.
OCBC Wing HangOCBC Wing Hang offers a comprehensive range of commercial banking and related financial services such as consumer financing, share brokerage and insurance.
OCBC Wing Hang’s operating profit after allowances rose 34% to S$497 million in 2018 from broad-based income growth, partly offset by an increase in allowances.
InsuranceThe Group’s insurance business, including its fund management activities, is undertaken by 87.9%-owned subsidiary GEH and its subsidiaries, which provide both life and general insurance products to its customers mainly in Singapore and Malaysia.
Operating profit after allowances from GEH fell by 29% to S$811 million in 2018. The year-on-year decline was mainly attributable to unrealised mark-to-market losses in its investment portfolio and the prior year also included substantially higher realised gains from the divestment of investment securities.
After tax and non-controlling interests, GEH’s contribution to the Group’s net profit was S$604 million in 2018, lower than S$863 million in 2017.
OthersOthers comprise mainly property holding, investment holding and items not attributable to the business segments described above.
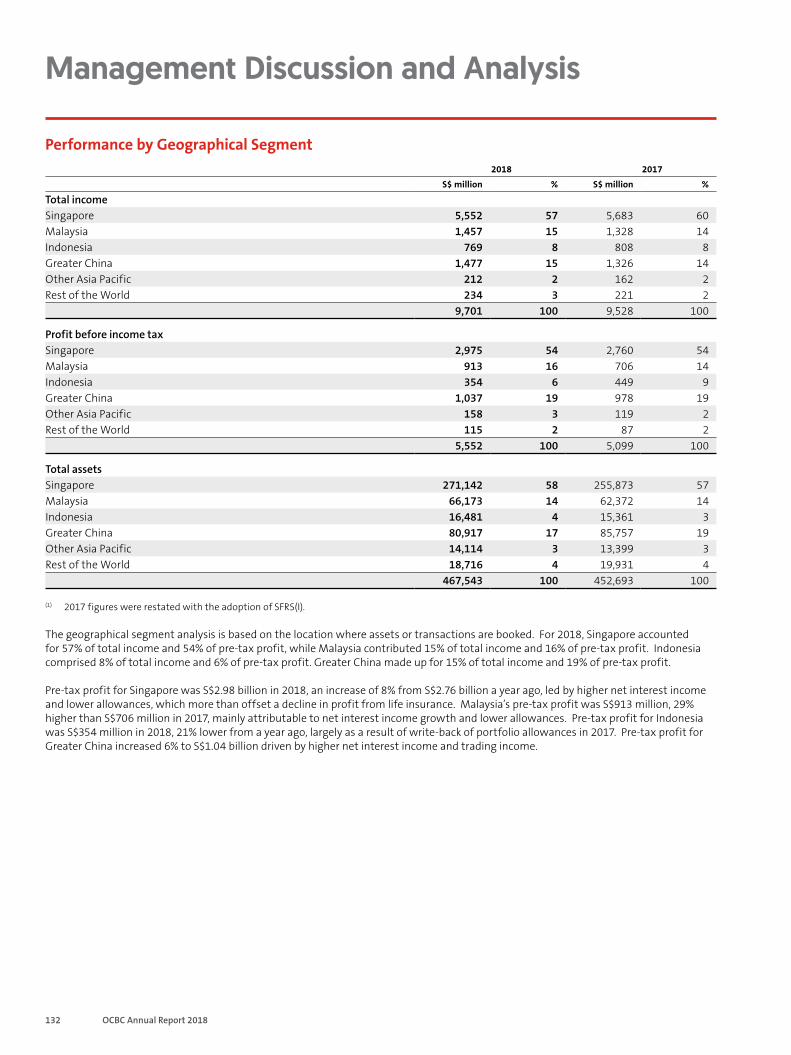
132 OCBC Annual Report 2018
Management Discussion and Analysis
Performance by Geographical Segment2018 2017
S$ million % S$ million %
Total income Singapore 5,552 57 5,683 60Malaysia 1,457 15 1,328 14Indonesia 769 8 808 8Greater China 1,477 15 1,326 14Other Asia Pacific 212 2 162 2Rest of the World 234 3 221 2
9,701 100 9,528 100
Profit before income tax Singapore 2,975 54 2,760 54Malaysia 913 16 706 14Indonesia 354 6 449 9Greater China 1,037 19 978 19Other Asia Pacific 158 3 119 2Rest of the World 115 2 87 2
5,552 100 5,099 100
Total assetsSingapore 271,142 58 255,873 57Malaysia 66,173 14 62,372 14Indonesia 16,481 4 15,361 3Greater China 80,917 17 85,757 19Other Asia Pacific 14,114 3 13,399 3Rest of the World 18,716 4 19,931 4
467,543 100 452,693 100
(1) 2017 figures were restated with the adoption of SFRS(I).
The geographical segment analysis is based on the location where assets or transactions are booked. For 2018, Singapore accounted for 57% of total income and 54% of pre-tax profit, while Malaysia contributed 15% of total income and 16% of pre-tax profit. Indonesia comprised 8% of total income and 6% of pre-tax profit. Greater China made up for 15% of total income and 19% of pre-tax profit.
Pre-tax profit for Singapore was S$2.98 billion in 2018, an increase of 8% from S$2.76 billion a year ago, led by higher net interest income and lower allowances, which more than offset a decline in profit from life insurance. Malaysia’s pre-tax profit was S$913 million, 29% higher than S$706 million in 2017, mainly attributable to net interest income growth and lower allowances. Pre-tax profit for Indonesia was S$354 million in 2018, 21% lower from a year ago, largely as a result of write-back of portfolio allowances in 2017. Pre-tax profit for Greater China increased 6% to S$1.04 billion driven by higher net interest income and trading income.

133Financials
Capital Adequacy RatiosThe Group remains strongly capitalised, with a Common Equity Tier 1 capital adequacy ratio (CAR) of 14.0%, and Tier 1 and Total CAR of 14.8% and 16.4% respectively. These ratios were well above the regulatory minima of 6.5%, 8% and 10%, respectively, for 2018. In addition to these minimum capital requirements, Capital Conservation Buffer (CCB) of 2.5% and Countercyclical Buffer (CCyB) of up to 2.5% are being phased in from 2016 to 2019. The CCB was 1.875% on 1 January 2018 and increases by 0.625% to reach 2.5% on 1 January 2019. The CCyB is not an on-going requirement and the applicable magnitude will be the weighted average of the country-specific CCyB requirements that are being applied by national authorities in jurisdictions to which the Bank has private sector credit exposures.
134 OCBC Annual Report 2018
Directors’ Statement
The directors present this statement to the members of the Bank together with the audited consolidated financial statements of the Group and the income statement, statement of comprehensive income, balance sheet and statement of changes in equity of the Bank for the financial year ended 31 December 2018.
In our opinion:
(a) the financial statements set out on pages 147 to 282 are drawn up so as to give a true and fair view of the financial position of the Group and of the Bank as at 31 December 2018, the financial performance and changes in equity of the Group and of the Bank for the financial year ended on that date, and cash flows of the Group for the financial year ended on that date, in accordance with the provisions of the Singapore Companies Act, Chapter 50 (the Act) and Singapore Financial Reporting Standards (International); and
(b) at the date of this statement, there are reasonable grounds to believe that the Bank will be able to pay its debts as and when they fall due.
The Board of Directors has, on the date of this statement, authorised these financial statements for issue.
DirectorsThe directors of the Bank in office at the date of this statement are as follows:
Ooi Sang Kuang, ChairmanSamuel N. Tsien, Chief Executive Officer Christina Hon Kwee Fong (Christina Ong)Chua Kim Chiu Lai Teck PohLee Tih ShihPramukti SurjaudajaQuah Wee GheeTan Ngiap Joo Wee Joo Yeow
Christina Hon Kwee Fong (Christina Ong), Quah Wee Ghee, Samuel N. Tsien and Tan Ngiap Joo will retire by rotation under Article 98 of the Constitution at the forthcoming annual general meeting of the Bank and, being eligible, will offer themselves for re-election thereat.
Arrangements to Enable Directors to Acquire Shares and DebenturesNeither at the end of, nor at any time during the financial year, was the Bank a party to any arrangement whose objects are, or one of whose objects is, to enable the directors of the Bank to acquire benefits by means of the acquisition of shares in, or debentures of, the Bank or any other body corporate, other than as disclosed in this statement.
For the financial year ended 31 December 2018
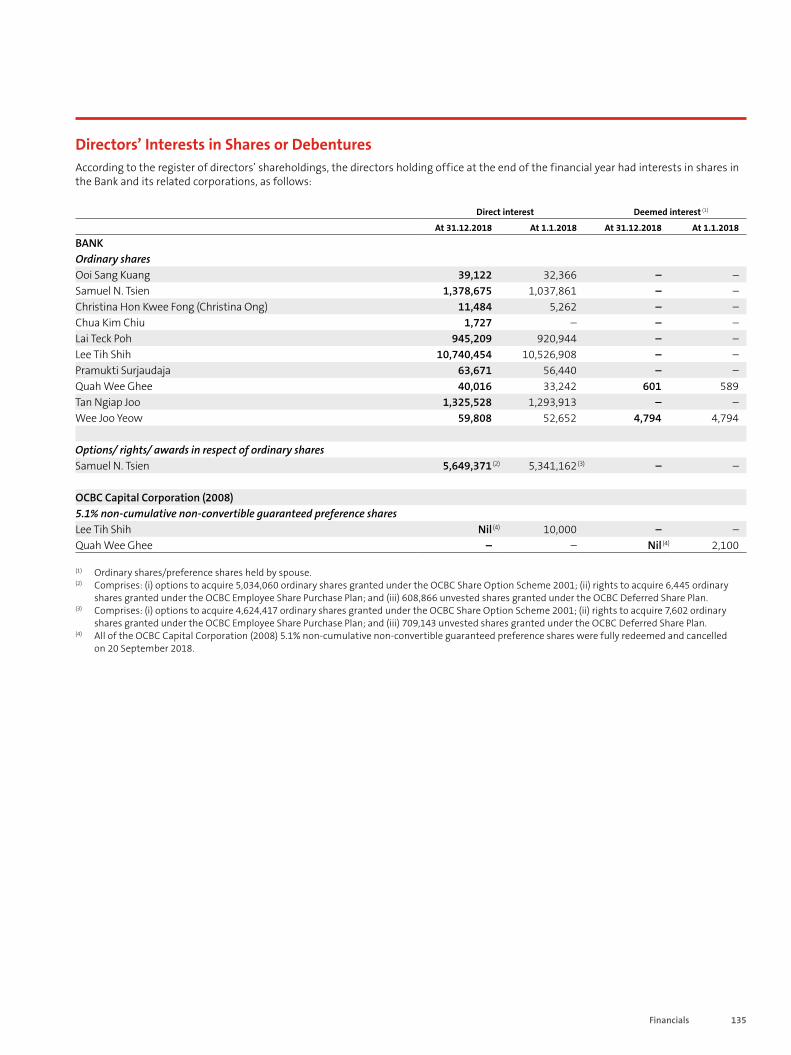
135Financials
Directors’ Interests in Shares or DebenturesAccording to the register of directors’ shareholdings, the directors holding office at the end of the financial year had interests in shares in the Bank and its related corporations, as follows:
Direct interest Deemed interest (1)
At 31.12.2018 At 1.1.2018 At 31.12.2018 At 1.1.2018
BANKOrdinary shares Ooi Sang Kuang 39,122 32,366 – –Samuel N. Tsien 1,378,675 1,037,861 – –Christina Hon Kwee Fong (Christina Ong) 11,484 5,262 – –Chua Kim Chiu 1,727 – – –Lai Teck Poh 945,209 920,944 – – Lee Tih Shih 10,740,454 10,526,908 – –Pramukti Surjaudaja 63,671 56,440 – –Quah Wee Ghee 40,016 33,242 601 589Tan Ngiap Joo 1,325,528 1,293,913 – –Wee Joo Yeow 59,808 52,652 4,794 4,794
Options/ rights/ awards in respect of ordinary sharesSamuel N. Tsien 5,649,371 (2) 5,341,162(3) – –
OCBC Capital Corporation (2008)5.1% non-cumulative non-convertible guaranteed preference sharesLee Tih Shih Nil (4) 10,000 – –Quah Wee Ghee – – Nil (4) 2,100
(1) Ordinary shares/preference shares held by spouse.(2) Comprises: (i) options to acquire 5,034,060 ordinary shares granted under the OCBC Share Option Scheme 2001; (ii) rights to acquire 6,445 ordinary
shares granted under the OCBC Employee Share Purchase Plan; and (iii) 608,866 unvested shares granted under the OCBC Deferred Share Plan.(3) Comprises: (i) options to acquire 4,624,417 ordinary shares granted under the OCBC Share Option Scheme 2001; (ii) rights to acquire 7,602 ordinary
shares granted under the OCBC Employee Share Purchase Plan; and (iii) 709,143 unvested shares granted under the OCBC Deferred Share Plan.(4) All of the OCBC Capital Corporation (2008) 5.1% non-cumulative non-convertible guaranteed preference shares were fully redeemed and cancelled
on 20 September 2018.
136 OCBC Annual Report 2018
Directors’ Statement
Directors’ Interests in Shares or Debentures (continued)Save as disclosed above, no director holding office at the end of the financial year had any interest in shares in, or debentures of, the Bank or any of its related corporations either at the beginning of the financial year or at the end of the financial year.
There were no changes to any of the above mentioned interests between the end of the financial year and 21 January 2019.
Share-Based Compensation PlansThe Bank’s share-based compensation plans are administered by the Remuneration Committee, which comprises:
Wee Joo Yeow, ChairmanChristina Hon Kwee Fong (Christina Ong)Ooi Sang Kuang Quah Wee Ghee Tan Ngiap Joo
Under the share-based compensation plans, no options or rights have been granted to controlling shareholders of the Bank or their associates, nor has any participant received 5% or more of the total number of options or rights available under each respective scheme or plan during the financial year. No options or rights were granted at a discount during the financial year. The persons to whom the options or rights were issued have no right by virtue of these options or rights to participate in any share issue of any other company. The disclosure requirement in Rule 852(1)(c) of the SGX Listing Manual relating to the grant of options to directors and employees of the parent company and its subsidiaries is not applicable to the Bank’s share-based compensation plans.
The Bank’s share-based compensation plans are as follows:
(a) OCBC Share Option Scheme 2001
The OCBC Share Option Scheme 2001 (2001 Scheme), which was implemented in 2001, was extended for another 10 years from 2011 to 2021, with the approval of shareholders. Executives of the Group ranked Manager and above and non-executive directors of the Group are eligible to participate in this scheme. The Bank will either issue new shares or transfer treasury shares to the participants upon the exercise of their options.
Particulars of Options 2008, 2009, 2010, 2011, 2012, 2013, 2013NED, 2014, 2015, 2015CT, 2015JL, 2016, 2016A, 2017, 2017SL and 2017DM were set out in the Directors’ Reports/Directors’ Statements for the financial years ended 31 December 2008 to 2017.
During the financial year, pursuant to the 2001 Scheme, options to acquire 6,868,764 ordinary shares at S$13.34 per ordinary share were granted to 289 eligible executives of the Group (2018 Options). The acquisition price was equal to the average of the last traded price of the ordinary shares of the Bank on the Singapore Exchange over the five consecutive trading days immediately prior to the date of grant.
For the financial year ended 31 December 2018
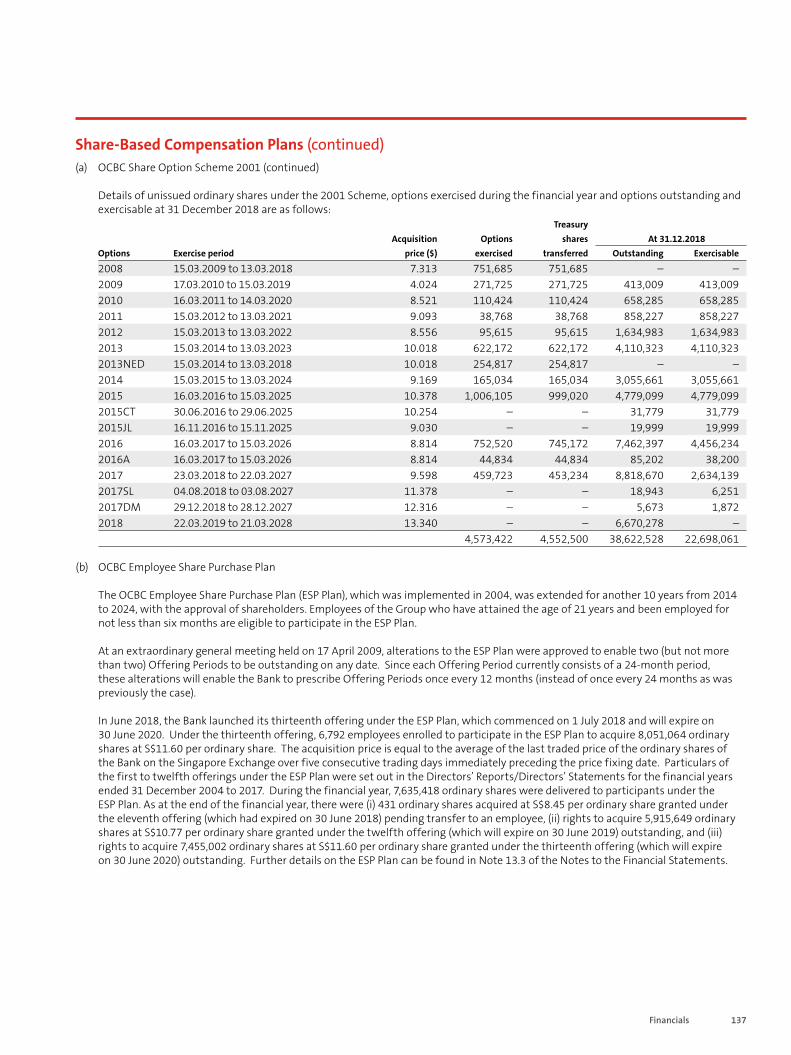
137Financials
Share-Based Compensation Plans (continued)(a) OCBC Share Option Scheme 2001 (continued)
Details of unissued ordinary shares under the 2001 Scheme, options exercised during the financial year and options outstanding and exercisable at 31 December 2018 are as follows:
TreasuryAcquisition Options shares At 31.12.2018
Options Exercise period price ($) exercised transferred Outstanding Exercisable
2008 15.03.2009 to 13.03.2018 7.313 751,685 751,685 – –2009 17.03.2010 to 15.03.2019 4.024 271,725 271,725 413,009 413,0092010 16.03.2011 to 14.03.2020 8.521 110,424 110,424 658,285 658,2852011 15.03.2012 to 13.03.2021 9.093 38,768 38,768 858,227 858,2272012 15.03.2013 to 13.03.2022 8.556 95,615 95,615 1,634,983 1,634,9832013 15.03.2014 to 13.03.2023 10.018 622,172 622,172 4,110,323 4,110,3232013NED 15.03.2014 to 13.03.2018 10.018 254,817 254,817 – –2014 15.03.2015 to 13.03.2024 9.169 165,034 165,034 3,055,661 3,055,6612015 16.03.2016 to 15.03.2025 10.378 1,006,105 999,020 4,779,099 4,779,0992015CT 30.06.2016 to 29.06.2025 10.254 – – 31,779 31,7792015JL 16.11.2016 to 15.11.2025 9.030 – – 19,999 19,9992016 16.03.2017 to 15.03.2026 8.814 752,520 745,172 7,462,397 4,456,2342016A 16.03.2017 to 15.03.2026 8.814 44,834 44,834 85,202 38,2002017 23.03.2018 to 22.03.2027 9.598 459,723 453,234 8,818,670 2,634,1392017SL 04.08.2018 to 03.08.2027 11.378 – – 18,943 6,2512017DM 29.12.2018 to 28.12.2027 12.316 – – 5,673 1,8722018 22.03.2019 to 21.03.2028 13.340 – – 6,670,278 –
4,573,422 4,552,500 38,622,528 22,698,061
(b) OCBC Employee Share Purchase Plan
The OCBC Employee Share Purchase Plan (ESP Plan), which was implemented in 2004, was extended for another 10 years from 2014 to 2024, with the approval of shareholders. Employees of the Group who have attained the age of 21 years and been employed for not less than six months are eligible to participate in the ESP Plan.
At an extraordinary general meeting held on 17 April 2009, alterations to the ESP Plan were approved to enable two (but not more than two) Offering Periods to be outstanding on any date. Since each Offering Period currently consists of a 24-month period, these alterations will enable the Bank to prescribe Offering Periods once every 12 months (instead of once every 24 months as was previously the case).
In June 2018, the Bank launched its thirteenth offering under the ESP Plan, which commenced on 1 July 2018 and will expire on 30 June 2020. Under the thirteenth offering, 6,792 employees enrolled to participate in the ESP Plan to acquire 8,051,064 ordinary shares at S$11.60 per ordinary share. The acquisition price is equal to the average of the last traded price of the ordinary shares of the Bank on the Singapore Exchange over five consecutive trading days immediately preceding the price fixing date. Particulars of the first to twelfth offerings under the ESP Plan were set out in the Directors’ Reports/Directors’ Statements for the financial years ended 31 December 2004 to 2017. During the financial year, 7,635,418 ordinary shares were delivered to participants under the ESP Plan. As at the end of the financial year, there were (i) 431 ordinary shares acquired at S$8.45 per ordinary share granted under the eleventh offering (which had expired on 30 June 2018) pending transfer to an employee, (ii) rights to acquire 5,915,649 ordinary shares at S$10.77 per ordinary share granted under the twelfth offering (which will expire on 30 June 2019) outstanding, and (iii) rights to acquire 7,455,002 ordinary shares at S$11.60 per ordinary share granted under the thirteenth offering (which will expire on 30 June 2020) outstanding. Further details on the ESP Plan can be found in Note 13.3 of the Notes to the Financial Statements.
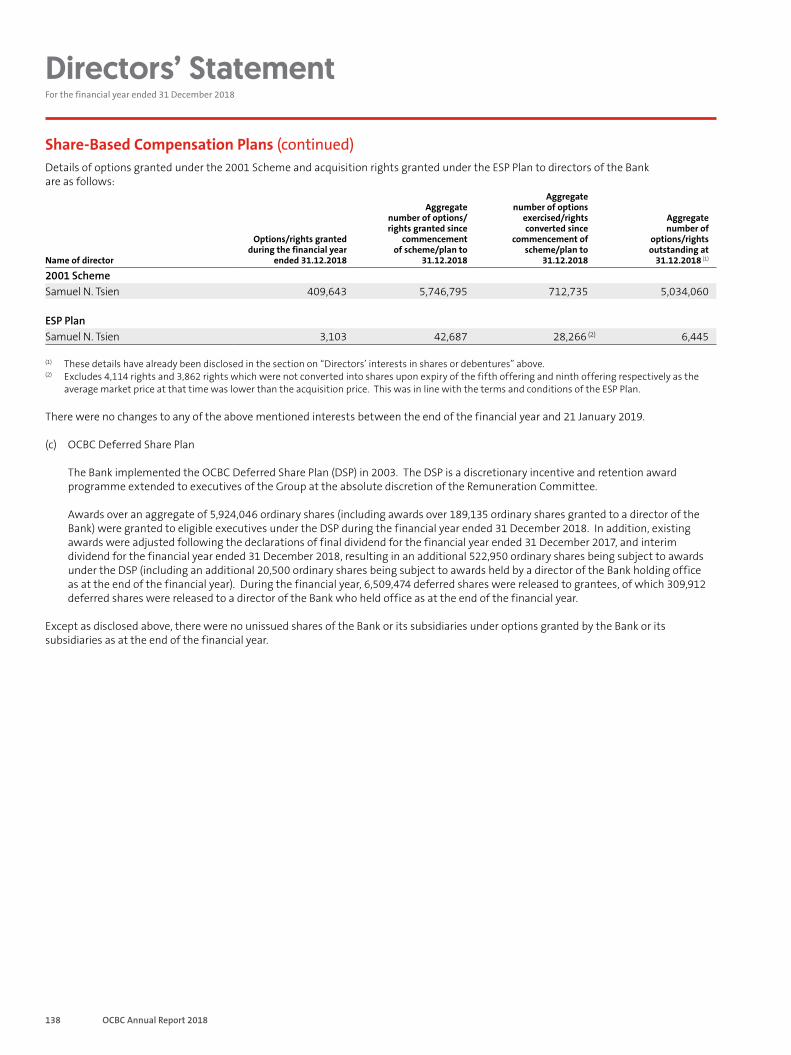
138 OCBC Annual Report 2018
Directors’ Statement
Share-Based Compensation Plans (continued)Details of options granted under the 2001 Scheme and acquisition rights granted under the ESP Plan to directors of the Bank are as follows:
Name of director
Options/rights granted during the financial year
ended 31.12.2018
Aggregate number of options/rights granted since
commencement of scheme/plan to
31.12.2018
Aggregatenumber of options
exercised/rights converted since
commencement ofscheme/plan to
31.12.2018
Aggregate number of
options/rights outstanding at
31.12.2018 (1)
2001 SchemeSamuel N. Tsien 409,643 5,746,795 712,735 5,034,060
ESP PlanSamuel N. Tsien 3,103 42,687 28,266 (2) 6,445
(1) These details have already been disclosed in the section on “Directors’ interests in shares or debentures” above.(2) Excludes 4,114 rights and 3,862 rights which were not converted into shares upon expiry of the fifth offering and ninth offering respectively as the
average market price at that time was lower than the acquisition price. This was in line with the terms and conditions of the ESP Plan.
There were no changes to any of the above mentioned interests between the end of the financial year and 21 January 2019.
(c) OCBC Deferred Share Plan
The Bank implemented the OCBC Deferred Share Plan (DSP) in 2003. The DSP is a discretionary incentive and retention award programme extended to executives of the Group at the absolute discretion of the Remuneration Committee.
Awards over an aggregate of 5,924,046 ordinary shares (including awards over 189,135 ordinary shares granted to a director of the Bank) were granted to eligible executives under the DSP during the financial year ended 31 December 2018. In addition, existing awards were adjusted following the declarations of final dividend for the financial year ended 31 December 2017, and interim dividend for the financial year ended 31 December 2018, resulting in an additional 522,950 ordinary shares being subject to awards under the DSP (including an additional 20,500 ordinary shares being subject to awards held by a director of the Bank holding office as at the end of the financial year). During the financial year, 6,509,474 deferred shares were released to grantees, of which 309,912 deferred shares were released to a director of the Bank who held office as at the end of the financial year.
Except as disclosed above, there were no unissued shares of the Bank or its subsidiaries under options granted by the Bank or its subsidiaries as at the end of the financial year.
For the financial year ended 31 December 2018
139Financials
Audit CommitteeThe members of the Audit Committee during the financial year and at the date of this statement are:
Chua Kim Chiu, Chairman Christina Hon Kwee Fong (Christina Ong)Lai Teck PohTan Ngiap Joo
The Audit Committee performed the functions specified in the Act, the SGX Listing Manual, the Banking (Corporate Governance) Regulations 2005, the MAS Guidelines for Corporate Governance and the Code of Corporate Governance 2012 and/or 2018, as applicable. In performing these functions, the Audit Committee met with the Bank’s external and internal auditors, and reviewed the audit plans, the internal audit programme, as well as the results of the auditors’ examination and their evaluation of the system of internal controls.
The Audit Committee also reviewed the following:
(a) response of the Bank’s management and the assistance provided by officers of the Bank to the external and internal auditors; (b) the financial statements of the Group and the Bank and the auditors’ report thereon prior to their submission to the Board of
Directors; and(c) the independence and objectivity of the external auditors including its tenure.
The Audit Committee has full access to, and the cooperation of, the management and has been given the resources required for it to discharge its functions. It has full authority and discretion to invite any director and executive officer to attend its meetings.
The Audit Committee is satisfied with the independence and objectivity of the external auditors and has recommended to the Board of Directors that the auditors, KPMG LLP, be nominated for re-appointment as auditors of the Bank at the forthcoming annual general meeting of the Bank. The Audit Committee notes that KPMG LLP have served as the Bank’s external auditors since financial year 2006. In line with good corporate governance practice, the Audit Committee has nominated PricewaterhouseCoopers LLP for appointment as the Bank’s external auditors in place of KPMG LLP for financial year 2020. The nomination was made following a tender process based on an established framework for the selection of external auditors. Subject to the requisite approvals, notices, clearances and consents being obtained, the proposed appointment will be presented for shareholders’ approval at the 2020 annual general meeting.
AuditorsThe auditors, KPMG LLP, have indicated their willingness to accept re-appointment at the forthcoming annual general meeting.
On behalf of the Board of Directors,
OOI SANG KUANG SAMUEL N. TSIENDirector Director
Singapore21 February 2019
140 OCBC Annual Report 2018
Independent Auditors’ Report
Report on the Audit of the Financial StatementsOpinionWe have audited the financial statements of Oversea-Chinese Banking Corporation Limited (the Bank) and its subsidiaries (the Group), which comprise the consolidated balance sheet of the Group and the balance sheet of the Bank as at 31 December 2018, the consolidated income statement, consolidated statement of comprehensive income, consolidated statement of changes in equity and consolidated cash flow statement of the Group and the income statement, statement of comprehensive income and statement of changes in equity of the Bank for the year then ended, and notes to the financial statements, including a summary of significant accounting policies as set out on pages 147 to 282.
In our opinion, the accompanying consolidated financial statements of the Group and the balance sheet, income statement, statement of comprehensive income and statement of changes in equity of the Bank are properly drawn up in accordance with the provisions of the Companies Act, Chapter 50 (the Act) and Singapore Financial Reporting Standards (International) (SFRS(I)s) so as to give a true and fair view of the consolidated financial position of the Group and the financial position of the Bank as at 31 December 2018 and of the consolidated financial performance, consolidated changes in equity and consolidated cash flows of the Group and the financial performance and changes in equity of the Bank for the year ended on that date.
Basis for OpinionWe conducted our audit in accordance with Singapore Standards on Auditing (SSAs). Our responsibilities under those standards are further described in the Auditors’ responsibilities for the audit of the financial statements section of our report. We are independent of the Group in accordance with the Accounting and Corporate Regulatory Authority (ACRA) Code of Professional Conduct and Ethics for Public Accountants and Accounting Entities (ACRA Code) together with the ethical requirements that are relevant to our audit of the financial statements in Singapore, and we have fulfilled our other ethical responsibilities in accordance with these requirements and the ACRA Code. We believe that the audit evidence we have obtained is sufficient and appropriate to provide a basis for our opinion.
Key Audit MattersKey audit matters are those matters that, in our professional judgement, were of most significance in our audit of the financial statements of the current period. These matters were addressed in the context of our audit of the financial statements as a whole, and in forming our opinion thereon, and we do not provide a separate opinion on these matters.
Impairment of Loans and Bills Receivable (Refer to Notes 9, 26, 28 and 30 to the Financial Statements.)
The key audit matter How the matter was addressed in our audit
At 31 December 2018, the Group’s loans and bills receivable comprised 55% of Total Assets.
SFRS(I) 9 “Financial Instruments”, effective 1 January 2018, introduces the expected credit loss (ECL) impairment model. ECL applies to financial assets measured at amortised cost, amongst others.
The Group had developed quantitative models to determine the ECL allowances for credit exposures. Significant judgement is applied in developing the models and in determining the relevant inputs and applicable assumptions.
Non-credit impaired exposuresWe tested the design, implementation and operating effectiveness of key controls surrounding the determination of ECL allowances.
We involved our Information Technology (IT) specialists to test the (i) general IT controls over the ECL system, including user-acceptance-testing (UAT), access rights and change management controls, and (ii) specific IT controls over the accuracy and integrity of the data interface between the source systems and the ECL system.
In order to ascertain the accuracy of key inputs into the ECL models, we checked a sample of exposures against source systems.
We assessed the reasonableness of the criteria used for determining a “significant increase in credit risk”.
To The Members Of Oversea-Chinese Banking Corporation Limited
141Financials
Impairment of Loans and Bills Receivable(Refer to Notes 9, 26, 28 and 30 to the Financial Statements.) (continued)
The key audit matter How the matter was addressed in our audit
In respect of non-credit impaired exposures, significant judgement and assumptions are required in areas including:• Development of ECL model parameters, including the
probability of default (PD), loss given default (LGD) and exposure at default (EAD) for each portfolio;
• Selection of criteria to determine whether a credit exposure has exhibited “significant increase in credit risk”, thus requiring lifetime ECL allowance; and
• Determination of relevant macroeconomic factors to incorporate into the models.
In respect of credit-impaired exposures, management judgement and estimation are applied in (i) identifying impaired exposures; (ii) estimating the related recoverable amounts; and (iii) where applicable, determining collateral values and timing of expected cash flows.
Macroeconomic policies and geopolitical events during 2018 introduced added complexity to the estimation of ECL allowances. The consequence of policy changes and geopolitical tensions are inherently difficult to predict and the impact is therefore difficult to model or quantify.
As a result of the significance of loans and bills receivable and the related estimation uncertainty over ECL allowances, the impairment of loans and bills receivable is considered a key audit matter.
We involved our valuation specialists in the following areas:• review the robustness of the Group’s model validation
framework and the methodology applied, including the model performance testing conducted by the Group’s model validation team;
• assess the Group’s ECL modelling methodology for a sample of key portfolios against the requirements of SFRS(I) 9;
• apply statistical techniques on a sample of PD curves to assess the reasonableness of their calibration;
• perform back-testing of LGD over key portfolios using actual loss experience; and
• in respect of forward looking assumptions, review the appropriateness of management’s macroeconomic forecast assumptions, including reasonableness of the regression analysis performed by the Group on the macroeconomic factors applied in the ECL models.
We also assessed the reasonableness of the probability weighting of the economic scenarios applied.
For a sample of credit exposures, we independently re-calculated the ECL allowance to test the mathematical accuracy of the modelled calculations produced by the ECL system.
Credit-impaired exposuresWe tested the design, implementation and operating effectiveness of the key controls in place over credit grading, credit reviews and monitoring of credit-impaired exposures.
In relation to key economic and geopolitical triggers, we assessed the Group’s response in identifying credit-impaired exposures.
For a sample of exposures, we performed credit file reviews to test the appropriateness of credit grading. On a sample of credit-impaired exposures, we challenged the Group’s assumptions of the expected future cash inflows, including cash flows from operations, the realisable value of collaterals and time to sell based on our understanding of the counterparties, the business environment and other externally derived evidence.
We found that the ECL allowances were within an acceptable range of estimates.
142 OCBC Annual Report 2018
Valuation of Financial Instruments Held at Fair Value(Refer to Notes 18, 22, 24, 25, 29 and 41 to the Financial Statements.)
The key audit matter How the matter was addressed in our audit
The Group’s financial instruments held at fair value comprised mainly debt and equity securities, government treasury bills and securities, and derivative contracts.
Of the financial instruments carried at fair value in the Group’s balance sheet as at 31 December 2018, the significant majority qualified as Level 1 or Level 2 financial instruments. These instruments were valued using prices that were observable in financial markets or estimated based on financial models using market observable inputs, resulting in a lower valuation risk.
The remaining financial instruments classified as Level 3 comprised mainly unlisted debt and equity investments and derivatives. The valuation of these instruments may involve complex models and the application of unobservable inputs, such as cash flow forecasts, discount rates and measures of volatility. The valuation of Level 3 financial instruments therefore typically requires a higher level of management judgement and the application of assumptions. As such, there is a greater degree of estimation uncertainty in the determination of the fair value of these instruments.
The valuation of financial instruments held at fair value is considered a key audit matter in view of the management judgement and inherent subjectivity, increasing the risk of material misstatement of the Group’s financial statements.
We obtained an understanding of the control environment and internal controls over the measurement of financial instruments at their fair values. We tested the operating effectiveness of the following key controls:• General IT controls over key valuation systems, including access
rights and change management controls;
• Specific IT controls, in particular, over the capture of complete and accurate external market data within the Group’s valuation systems and the interface between transaction processing systems, valuation systems and financial reporting systems;
• Controls over governance of valuation models, including model validation; and
• Controls over independent price verification and month-end valuation adjustments.
We reviewed a sample of the Group’s financial instruments valuation models, evaluating the reasonableness of the modelling methodology, the inputs and assumptions being used.
For a selection of pricing inputs, we checked that the inputs used were appropriately sourced (by comparing to independent market data) and accurately input into the valuation models and systems.
We priced a sample of the Group’s financial instruments held at fair value independently and compared the values to the Group’s valuations. Additionally, we recalculated a sample of valuation adjustments as at year-end.
For a sample of Level 3 instruments, we challenged the appropriateness of the valuation methodology, and the reasonableness of key inputs and assumptions. We also considered alternative valuation methods and assessed sensitivities to key factors.
In respect of financial instruments held by GEH, we assessed, through a review of GEH’s auditors’ working papers, whether the valuation methods used were appropriate.
We found that the fair values of the Group’s financial instruments were within an acceptable range of estimates.
Independent Auditors’ ReportTo The Members Of Oversea-Chinese Banking Corporation Limited
143Financials
Valuation of Insurance Contract Liabilities (Refer to Notes 4, 22, 39 and 41 to the Financial Statements.)
The key audit matter How the matter was addressed in our audit
The Group’s insurance operations are conducted entirely through its subsidiary, Great Eastern Holdings Limited (GEH).
The Group’s insurance business comprises life and general insurance contracts. There are several sources of uncertainty that need to be considered in the estimation of the liabilities that the Group will ultimately be required to pay as claims.
The valuation of life insurance contract liabilities is dependent on the valuation method adopted and key assumptions such as prevailing interest rates of government securities and estimates of mortality, disability, dread disease, expenses, lapse and surrenders based on GEH’s internal experience studies and publicly available data.
The valuation of general insurance contract liabilities is dependent on estimates including the ultimate settlement cost of claims reported, and claims incurred but not yet reported.
As changes in the assumptions used in the valuation of insurance contract liabilities could result in a material impact to the carrying amount of insurance contract liabilities and the related movements in the income statement, the valuation of insurance contract liabilities is considered a key audit matter.
We planned, scoped and issued group audit instructions to GEH’s auditors to obtain an independent auditors’ report of the significant component. The scope of reporting included valuation of insurance contract liabilities.
We reviewed GEH’s auditors’ work performed in relation to the design and operating effectiveness of GEH’s controls over the valuation of insurance contract liabilities, including the determination and approval of actuarial assumptions.
We involved our actuarial specialists in our discussions with GEH’s auditors and in the following areas:
• assess that GEH’s auditors challenged management’s methodologies and assumptions used in the valuation of insurance contract liabilities; and
• assess the appropriateness of the methodologies, models and assumptions used against regulatory requirements and industry practices.
Based on the reports from GEH’s auditors and our review of GEH’s auditors’ working papers, we concluded that the valuation methods and assumptions used by the Group in the valuation of insurance contract liabilities were reasonable, and the values of insurance contract liabilities were within an acceptable range of outcomes.
144 OCBC Annual Report 2018
Independent Auditors’ Report
Impairment of Goodwill (Refer to Note 37 to the Financial Statements.)
The key audit matter How the matter was addressed in our audit
At 31 December 2018, the Group’s balance sheet included goodwill of $4.5 billion arising from a number of acquisitions. Goodwill is impaired if its carrying amount is not supported by the recoverable amount of the respective cash generating units (CGUs). The recoverable amounts are determined based on estimates that require significant management judgement in application of methodologies and assumptions.
In respect of goodwill of banking CGUs amounting to $4.0 billion, the value-in-use method was used to determine the recoverable amount. In this aspect, significant judgement and key assumptions include:• Methodology and inputs used to calculate the appropriate
discount rate;
• Determination of the terminal growth rate; and
• Projections of the future cash flows.
In respect of the insurance CGU, the recoverable amount was estimated using the appraisal value method, based on the adjusted shareholders’ funds and the expected future profits generated by the portfolio of the business in force at the valuation date and the capacity to generate future profitable new business. Significant assumptions used in the assessment of these values include:• Risk-adjusted discount rates; and
• Investment return rates.
As a result of the significance of the goodwill amount and the judgement and subjectivity involved in estimating the recoverable amounts, the impairment of goodwill is considered a key audit matter.
We assessed the appropriateness of management’s identification of the Group’s CGUs and whether it reflects our understanding of the business and its operations.
Banking CGUsWe assessed management’s future cash flow projections for consistency with operating plans and back-tested prior year’s cash flow forecasts against historical cash flows.
We involved our valuation specialists to assess the methodologies applied and assumptions used for deriving:• discount rate by independently estimating the discount rate
using external data sources for risk free rates, beta, market risk premium, country risk premium and small capitalisation premium; and
• terminal growth rate by comparing the rates to market data and inflation rates based on the CGU’s country of operation.
We performed sensitivity analysis on the future cash flows, discount rates and terminal growth rates.
Insurance CGUWe involved our actuarial specialists to assess the reasonableness of management’s significant assumptions including discount rates and investment returns rates used in the estimation of appraisal value.
We performed sensitivity analysis on the impact of change in key assumptions.
Based on our procedures performed, the carrying amount of goodwill was supported by the recoverable amount of the respective CGUs.
To The Members Of Oversea-Chinese Banking Corporation Limited
145Financials
Other InformationManagement is responsible for the other information contained in the annual report. Other information is defined as all information in the annual report other than the financial statements and auditors’ report thereon.
We have obtained all other information prior to the date of this auditors’ report except for the information captioned Message from Chairman and CEO, Our Well-Diversified Business, Our Year In Review, Sustainability Report, Corporate Governance, Management Discussion and Analysis and, Ordinary/Preference Shareholding Statistics (the Reports), which are expected to be made available to us after that date.
Our opinion on the financial statements does not cover the other information and we do not and will not express any form of assurance conclusion thereon.
In connection with our audit of the financial statements, our responsibility is to read the other information identified above and, in doing so, consider whether the other information is materially inconsistent with the financial statements or our knowledge obtained in the audit, or otherwise appears to be materially misstated.
If, based on the work we have performed on the other information that we obtained prior to the date of this auditors’ report, we conclude that there is a material misstatement of this other information, we are required to report that fact. We have nothing to report in this regard.
When we read the Reports, if we conclude that there is a material misstatement therein, we are required to communicate the matter to those charged with governance and take appropriate actions in accordance with SSAs.
Responsibilities of Management and Directors for the Financial StatementsManagement is responsible for the preparation of financial statements that give a true and fair view in accordance with the provisions of the Act and SFRS(I)s, and for devising and maintaining a system of internal accounting controls sufficient to provide a reasonable assurance that assets are safeguarded against loss from unauthorised use or disposition; and transactions are properly authorised and that they are recorded as necessary to permit the preparation of true and fair financial statements and to maintain accountability of assets.
In preparing the financial statements, management is responsible for assessing the Group’s ability to continue as a going concern, disclosing, as applicable, matters related to going concern and using the going concern basis of accounting unless management either intends to liquidate the Group or to cease operations, or has no realistic alternative but to do so.
The directors’ responsibilities include overseeing the Group’s financial reporting process.
Auditors’ Responsibilities for the Audit of the Financial StatementsOur objectives are to obtain reasonable assurance about whether the financial statements as a whole are free from material misstatement, whether due to fraud or error, and to issue an auditors’ report that includes our opinion. Reasonable assurance is a high level of assurance, but is not a guarantee that an audit conducted in accordance with SSAs will always detect a material misstatement when it exists. Misstatements can arise from fraud or error and are considered material if, individually or in the aggregate, they could reasonably be expected to influence the economic decisions of users taken on the basis of these financial statements.
146 OCBC Annual Report 2018
Independent Auditors’ Report
As part of an audit in accordance with SSAs, we exercise professional judgement and maintain professional scepticism throughout the audit. We also:
• Identify and assess the risks of material misstatement of the financial statements, whether due to fraud or error, design and perform audit procedures responsive to those risks, and obtain audit evidence that is sufficient and appropriate to provide a basis for our opinion. The risk of not detecting a material misstatement resulting from fraud is higher than for one resulting from error, as fraud may involve collusion, forgery, intentional omissions, misrepresentations, or the override of internal controls.
• Obtain an understanding of internal controls relevant to the audit in order to design audit procedures that are appropriate in the circumstances, but not for the purpose of expressing an opinion on the effectiveness of the Group’s internal controls.
• Evaluate the appropriateness of accounting policies used and the reasonableness of accounting estimates and related disclosures made by management.
• Conclude on the appropriateness of management’s use of the going concern basis of accounting and, based on the audit evidence obtained, whether a material uncertainty exists related to events or conditions that may cast significant doubt on the Group’s ability to continue as a going concern. If we conclude that a material uncertainty exists, we are required to draw attention in our auditors’ report to the related disclosures in the financial statements or, if such disclosures are inadequate, to modify our opinion. Our conclusions are based on the audit evidence obtained up to the date of our auditors’ report. However, future events or conditions may cause the Group to cease to continue as a going concern.
• Evaluate the overall presentation, structure and content of the financial statements, including the disclosures, and whether the financial statements represent the underlying transactions and events in a manner that achieves fair presentation.
• Obtain sufficient appropriate audit evidence regarding the financial information of the entities or business activities within the Group to express an opinion on the consolidated financial statements. We are responsible for the direction, supervision and performance of the group audit. We remain solely responsible for our audit opinion.
We communicate with the directors regarding, among other matters, the planned scope and timing of the audit and significant audit findings, including any significant deficiencies in internal controls that we identify during our audit.
We also provide the directors with a statement that we have complied with relevant ethical requirements regarding independence, and to communicate with them all relationships and other matters that may reasonably be thought to bear on our independence, and where applicable, related safeguards.
From the matters communicated with the directors, we determine those matters that were of most significance in the audit of the financial statements of the current period and are therefore the key audit matters. We describe these matters in our auditors’ report unless the law or regulations preclude public disclosure about the matter or when, in extremely rare circumstances, we determine that a matter should not be communicated in our report because the adverse consequences of doing so would reasonably be expected to outweigh the public interest benefits of such communication.
Report on Other Legal and Regulatory RequirementsIn our opinion, the accounting and other records required by the Act to be kept by the Bank and by those subsidiaries incorporated in Singapore of which we are the auditors have been properly kept in accordance with the provisions of the Act.
The engagement partner on the audit resulting in this independent auditors’ report is Leong Kok Keong.
KPMG LLPPublic Accountants andChartered Accountants
Singapore21 February 2019
To The Members Of Oversea-Chinese Banking Corporation Limited
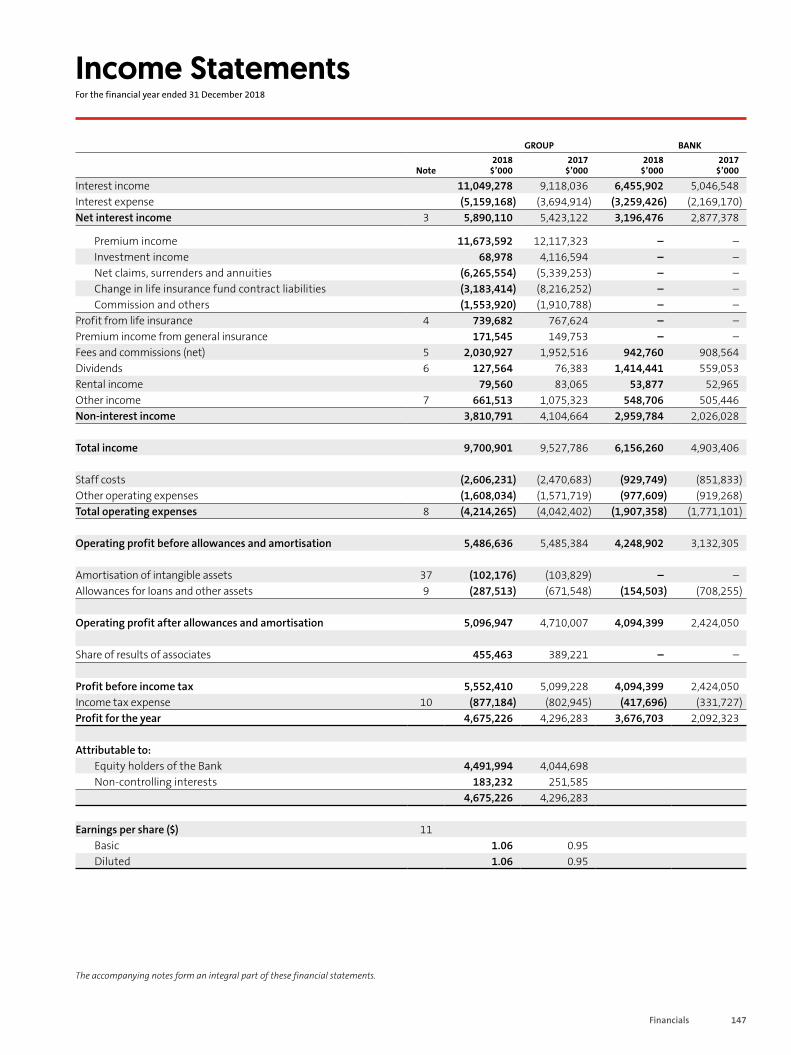
147Financials
Income Statements
The accompanying notes form an integral part of these financial statements.
For the financial year ended 31 December 2018
GROUP BANK
Note2018
$’0002017
$’0002018
$’0002017
$’000
Interest income 11,049,278 9,118,036 6,455,902 5,046,548Interest expense (5,159,168) (3,694,914) (3,259,426) (2,169,170)Net interest income 3 5,890,110 5,423,122 3,196,476 2,877,378
Premium income 11,673,592 12,117,323 – –Investment income 68,978 4,116,594 – –Net claims, surrenders and annuities (6,265,554) (5,339,253) – –Change in life insurance fund contract liabilities (3,183,414) (8,216,252) – –Commission and others (1,553,920) (1,910,788) – –
Profit from life insurance 4 739,682 767,624 – –Premium income from general insurance 171,545 149,753 – –Fees and commissions (net) 5 2,030,927 1,952,516 942,760 908,564Dividends 6 127,564 76,383 1,414,441 559,053Rental income 79,560 83,065 53,877 52,965Other income 7 661,513 1,075,323 548,706 505,446Non-interest income 3,810,791 4,104,664 2,959,784 2,026,028
Total income 9,700,901 9,527,786 6,156,260 4,903,406
Staff costs (2,606,231) (2,470,683) (929,749) (851,833)Other operating expenses (1,608,034) (1,571,719) (977,609) (919,268)Total operating expenses 8 (4,214,265) (4,042,402) (1,907,358) (1,771,101)
Operating profit before allowances and amortisation 5,486,636 5,485,384 4,248,902 3,132,305
Amortisation of intangible assets 37 (102,176) (103,829) – –Allowances for loans and other assets 9 (287,513) (671,548) (154,503) (708,255)
Operating profit after allowances and amortisation 5,096,947 4,710,007 4,094,399 2,424,050
Share of results of associates 455,463 389,221 – –
Profit before income tax 5,552,410 5,099,228 4,094,399 2,424,050Income tax expense 10 (877,184) (802,945) (417,696) (331,727)Profit for the year 4,675,226 4,296,283 3,676,703 2,092,323
Attributable to:Equity holders of the Bank 4,491,994 4,044,698Non-controlling interests 183,232 251,585
4,675,226 4,296,283
Earnings per share ($) 11Basic 1.06 0.95Diluted 1.06 0.95
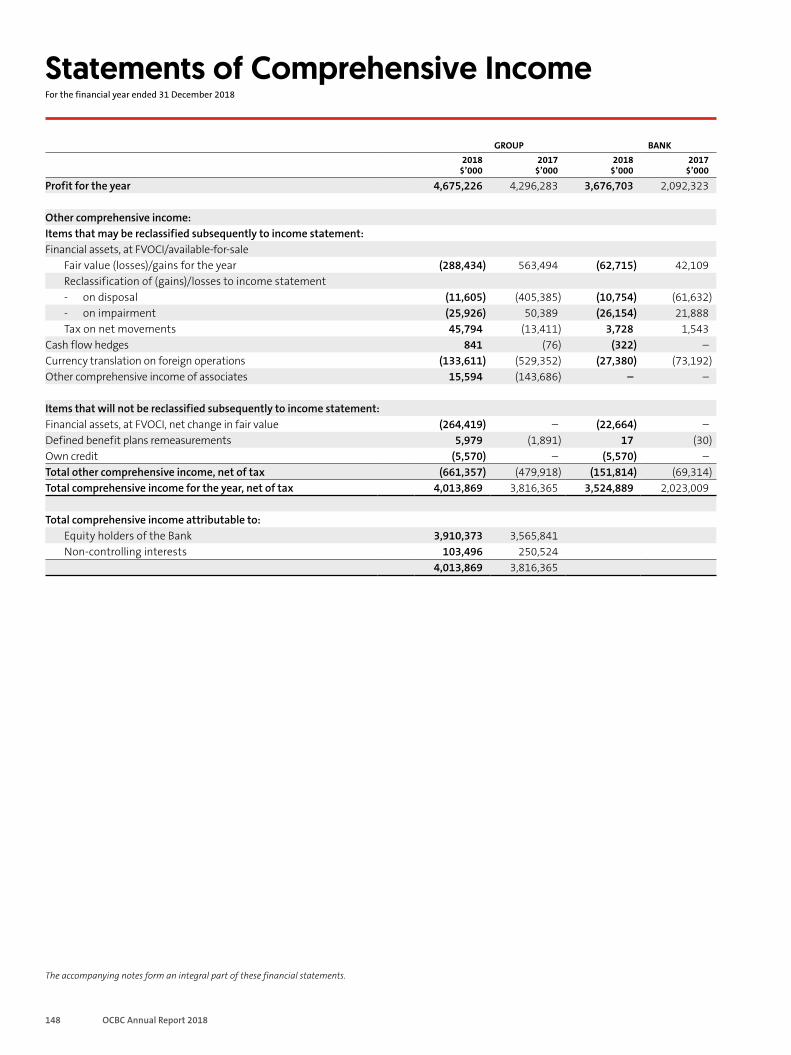
148 OCBC Annual Report 2018
Statements of Comprehensive Income
The accompanying notes form an integral part of these financial statements.
For the financial year ended 31 December 2018
GROUP BANK2018
$’0002017
$’0002018
$’0002017
$’000
Profit for the year 4,675,226 4,296,283 3,676,703 2,092,323
Other comprehensive income:Items that may be reclassified subsequently to income statement:Financial assets, at FVOCI/available-for-sale
Fair value (losses)/gains for the year (288,434) 563,494 (62,715) 42,109Reclassification of (gains)/losses to income statement- on disposal (11,605) (405,385) (10,754) (61,632)- on impairment (25,926) 50,389 (26,154) 21,888Tax on net movements 45,794 (13,411) 3,728 1,543
Cash flow hedges 841 (76) (322) –Currency translation on foreign operations (133,611) (529,352) (27,380) (73,192)Other comprehensive income of associates 15,594 (143,686) – –
Items that will not be reclassified subsequently to income statement:Financial assets, at FVOCI, net change in fair value (264,419) – (22,664) –Defined benefit plans remeasurements 5,979 (1,891) 17 (30)Own credit (5,570) – (5,570) –Total other comprehensive income, net of tax (661,357) (479,918) (151,814) (69,314)Total comprehensive income for the year, net of tax 4,013,869 3,816,365 3,524,889 2,023,009
Total comprehensive income attributable to:Equity holders of the Bank 3,910,373 3,565,841Non-controlling interests 103,496 250,524
4,013,869 3,816,365
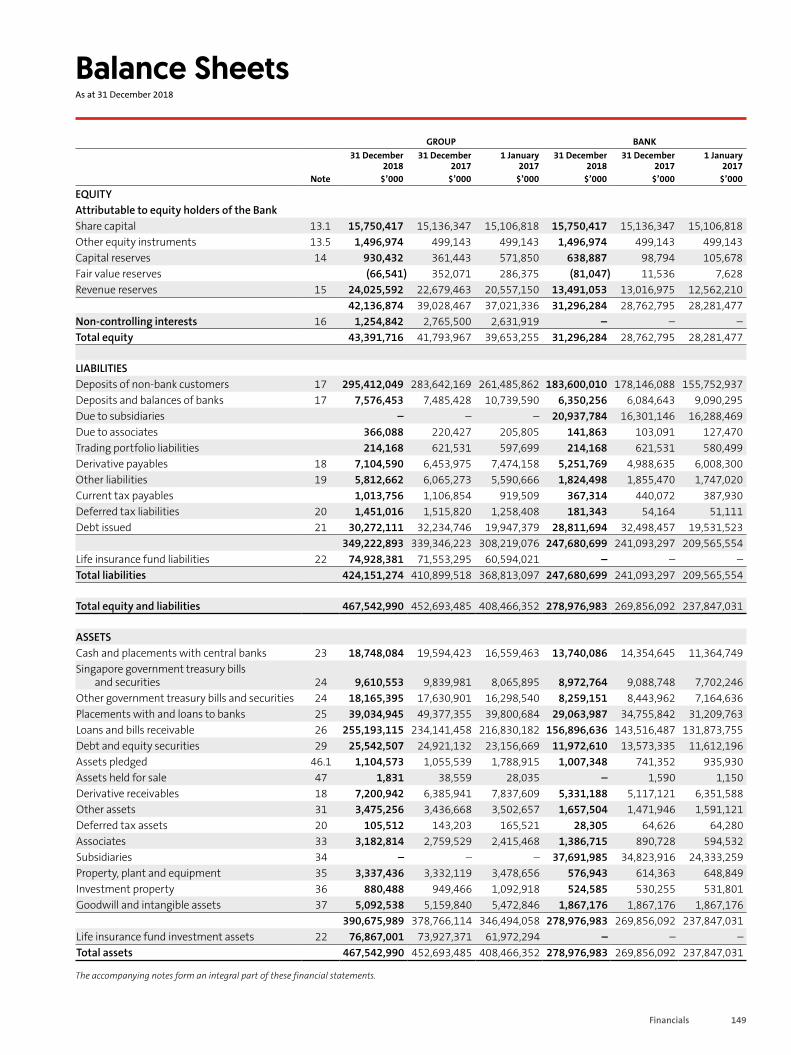
149Financials
Balance SheetsAs at 31 December 2018
GROUP BANK31 December
201831 December
20171 January
201731 December
201831 December
20171 January
2017Note $’000 $’000 $’000 $’000 $’000 $’000
EQUITYAttributable to equity holders of the BankShare capital 13.1 15,750,417 15,136,347 15,106,818 15,750,417 15,136,347 15,106,818Other equity instruments 13.5 1,496,974 499,143 499,143 1,496,974 499,143 499,143Capital reserves 14 930,432 361,443 571,850 638,887 98,794 105,678Fair value reserves (66,541) 352,071 286,375 (81,047) 11,536 7,628Revenue reserves 15 24,025,592 22,679,463 20,557,150 13,491,053 13,016,975 12,562,210
42,136,874 39,028,467 37,021,336 31,296,284 28,762,795 28,281,477Non-controlling interests 16 1,254,842 2,765,500 2,631,919 – – –Total equity 43,391,716 41,793,967 39,653,255 31,296,284 28,762,795 28,281,477
LIABILITIESDeposits of non-bank customers 17 295,412,049 283,642,169 261,485,862 183,600,010 178,146,088 155,752,937Deposits and balances of banks 17 7,576,453 7,485,428 10,739,590 6,350,256 6,084,643 9,090,295Due to subsidiaries – – – 20,937,784 16,301,146 16,288,469Due to associates 366,088 220,427 205,805 141,863 103,091 127,470Trading portfolio liabilities 214,168 621,531 597,699 214,168 621,531 580,499Derivative payables 18 7,104,590 6,453,975 7,474,158 5,251,769 4,988,635 6,008,300Other liabilities 19 5,812,662 6,065,273 5,590,666 1,824,498 1,855,470 1,747,020Current tax payables 1,013,756 1,106,854 919,509 367,314 440,072 387,930Deferred tax liabilities 20 1,451,016 1,515,820 1,258,408 181,343 54,164 51,111Debt issued 21 30,272,111 32,234,746 19,947,379 28,811,694 32,498,457 19,531,523
349,222,893 339,346,223 308,219,076 247,680,699 241,093,297 209,565,554Life insurance fund liabilities 22 74,928,381 71,553,295 60,594,021 – – –Total liabilities 424,151,274 410,899,518 368,813,097 247,680,699 241,093,297 209,565,554
Total equity and liabilities 467,542,990 452,693,485 408,466,352 278,976,983 269,856,092 237,847,031
ASSETSCash and placements with central banks 23 18,748,084 19,594,423 16,559,463 13,740,086 14,354,645 11,364,749Singapore government treasury bills
and securities 24 9,610,553 9,839,981 8,065,895 8,972,764 9,088,748 7,702,246Other government treasury bills and securities 24 18,165,395 17,630,901 16,298,540 8,259,151 8,443,962 7,164,636Placements with and loans to banks 25 39,034,945 49,377,355 39,800,684 29,063,987 34,755,842 31,209,763Loans and bills receivable 26 255,193,115 234,141,458 216,830,182 156,896,636 143,516,487 131,873,755Debt and equity securities 29 25,542,507 24,921,132 23,156,669 11,972,610 13,573,335 11,612,196Assets pledged 46.1 1,104,573 1,055,539 1,788,915 1,007,348 741,352 935,930Assets held for sale 47 1,831 38,559 28,035 – 1,590 1,150Derivative receivables 18 7,200,942 6,385,941 7,837,609 5,331,188 5,117,121 6,351,588Other assets 31 3,475,256 3,436,668 3,502,657 1,657,504 1,471,946 1,591,121Deferred tax assets 20 105,512 143,203 165,521 28,305 64,626 64,280Associates 33 3,182,814 2,759,529 2,415,468 1,386,715 890,728 594,532Subsidiaries 34 – – – 37,691,985 34,823,916 24,333,259Property, plant and equipment 35 3,337,436 3,332,119 3,478,656 576,943 614,363 648,849Investment property 36 880,488 949,466 1,092,918 524,585 530,255 531,801Goodwill and intangible assets 37 5,092,538 5,159,840 5,472,846 1,867,176 1,867,176 1,867,176
390,675,989 378,766,114 346,494,058 278,976,983 269,856,092 237,847,031Life insurance fund investment assets 22 76,867,001 73,927,371 61,972,294 – – –Total assets 467,542,990 452,693,485 408,466,352 278,976,983 269,856,092 237,847,031
The accompanying notes form an integral part of these financial statements.
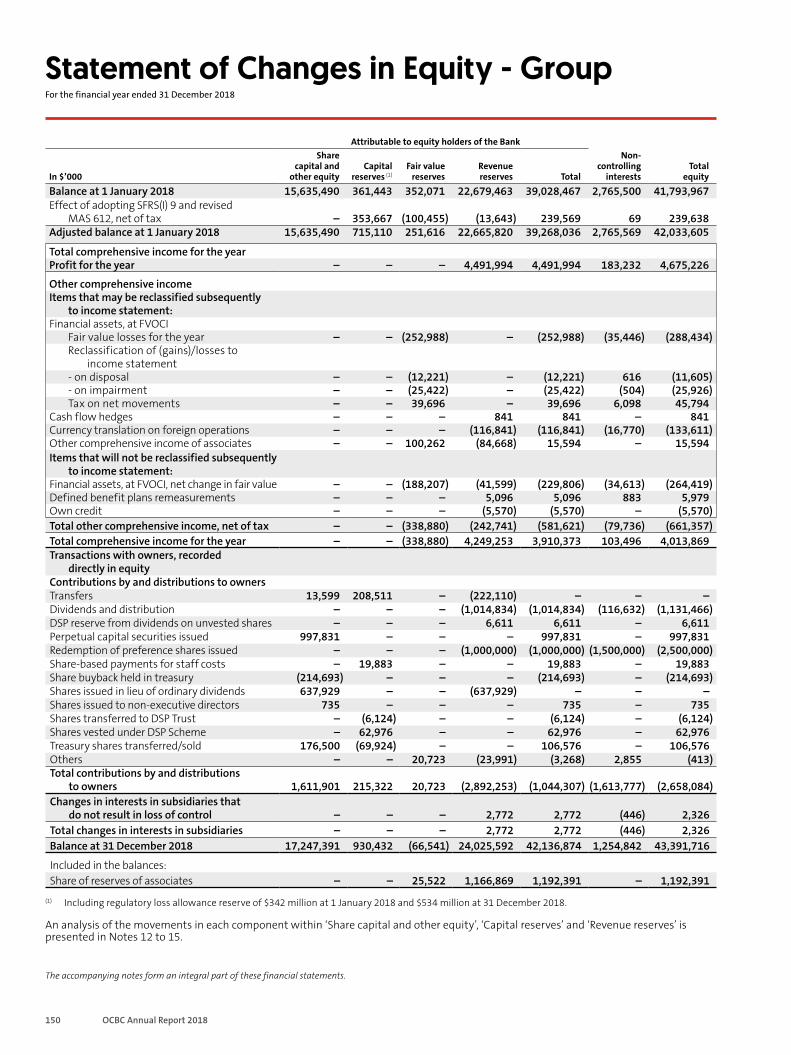
150 OCBC Annual Report 2018
Statement of Changes in Equity - GroupFor the financial year ended 31 December 2018
Attributable to equity holders of the Bank
In $’000
Share capital and
other equityCapital
reserves (1)Fair value
reserves Revenuereserves Total
Non-controlling
interestsTotal
equity
Balance at 1 January 2018 15,635,490 361,443 352,071 22,679,463 39,028,467 2,765,500 41,793,967Effect of adopting SFRS(I) 9 and revised
MAS 612, net of tax – 353,667 (100,455) (13,643) 239,569 69 239,638Adjusted balance at 1 January 2018 15,635,490 715,110 251,616 22,665,820 39,268,036 2,765,569 42,033,605
Total comprehensive income for the yearProfit for the year – – – 4,491,994 4,491,994 183,232 4,675,226
Other comprehensive incomeItems that may be reclassified subsequently
to income statement:Financial assets, at FVOCI
Fair value losses for the year – – (252,988) – (252,988) (35,446) (288,434)Reclassification of (gains)/losses to
income statement- on disposal – – (12,221) – (12,221) 616 (11,605)- on impairment – – (25,422) – (25,422) (504) (25,926)Tax on net movements – – 39,696 – 39,696 6,098 45,794
Cash flow hedges – – – 841 841 – 841Currency translation on foreign operations – – – (116,841) (116,841) (16,770) (133,611)Other comprehensive income of associates – – 100,262 (84,668) 15,594 – 15,594Items that will not be reclassified subsequently
to income statement:Financial assets, at FVOCI, net change in fair value – – (188,207) (41,599) (229,806) (34,613) (264,419)Defined benefit plans remeasurements – – – 5,096 5,096 883 5,979Own credit – – – (5,570) (5,570) – (5,570)Total other comprehensive income, net of tax – – (338,880) (242,741) (581,621) (79,736) (661,357)Total comprehensive income for the year – – (338,880) 4,249,253 3,910,373 103,496 4,013,869Transactions with owners, recorded
directly in equityContributions by and distributions to ownersTransfers 13,599 208,511 – (222,110) – – –Dividends and distribution – – – (1,014,834) (1,014,834) (116,632) (1,131,466)DSP reserve from dividends on unvested shares – – – 6,611 6,611 – 6,611Perpetual capital securities issued 997,831 – – – 997,831 – 997,831Redemption of preference shares issued – – – (1,000,000) (1,000,000) (1,500,000) (2,500,000)Share-based payments for staff costs – 19,883 – – 19,883 – 19,883Share buyback held in treasury (214,693) – – – (214,693) – (214,693)Shares issued in lieu of ordinary dividends 637,929 – – (637,929) – – –Shares issued to non-executive directors 735 – – – 735 – 735Shares transferred to DSP Trust – (6,124) – – (6,124) – (6,124)Shares vested under DSP Scheme – 62,976 – – 62,976 – 62,976Treasury shares transferred/sold 176,500 (69,924) – – 106,576 – 106,576Others – – 20,723 (23,991) (3,268) 2,855 (413)Total contributions by and distributions
to owners 1,611,901 215,322 20,723 (2,892,253) (1,044,307) (1,613,777) (2,658,084)Changes in interests in subsidiaries that
do not result in loss of control – – – 2,772 2,772 (446) 2,326Total changes in interests in subsidiaries – – – 2,772 2,772 (446) 2,326Balance at 31 December 2018 17,247,391 930,432 (66,541) 24,025,592 42,136,874 1,254,842 43,391,716
Included in the balances:Share of reserves of associates – – 25,522 1,166,869 1,192,391 – 1,192,391
(1) Including regulatory loss allowance reserve of $342 million at 1 January 2018 and $534 million at 31 December 2018.
An analysis of the movements in each component within ‘Share capital and other equity’, ‘Capital reserves’ and ‘Revenue reserves’ is presented in Notes 12 to 15.
The accompanying notes form an integral part of these financial statements.
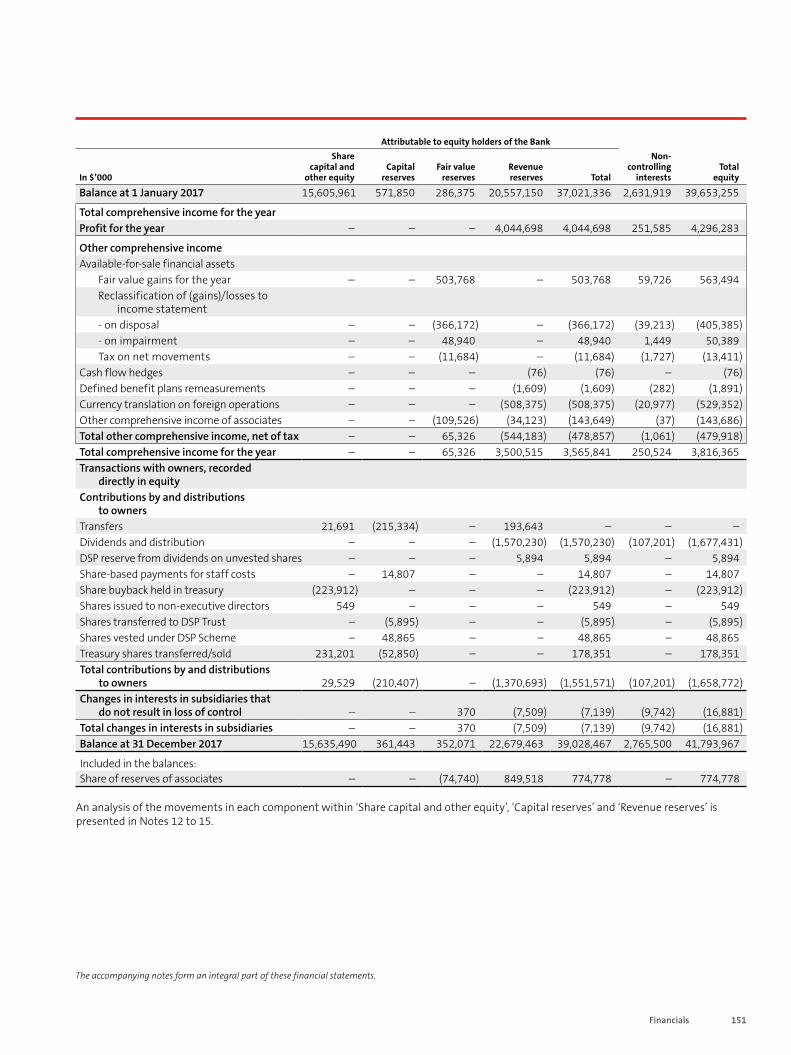
151Financials
Attributable to equity holders of the Bank
In $’000
Share capital and
other equityCapital
reservesFair value
reserves Revenuereserves Total
Non-controlling
interestsTotal
equity
Balance at 1 January 2017 15,605,961 571,850 286,375 20,557,150 37,021,336 2,631,919 39,653,255
Total comprehensive income for the year Profit for the year – – – 4,044,698 4,044,698 251,585 4,296,283
Other comprehensive incomeAvailable-for-sale financial assets
Fair value gains for the year – – 503,768 – 503,768 59,726 563,494Reclassification of (gains)/losses to
income statement- on disposal – – (366,172) – (366,172) (39,213) (405,385)- on impairment – – 48,940 – 48,940 1,449 50,389Tax on net movements – – (11,684) – (11,684) (1,727) (13,411)
Cash flow hedges – – – (76) (76) – (76)Defined benefit plans remeasurements – – – (1,609) (1,609) (282) (1,891)Currency translation on foreign operations – – – (508,375) (508,375) (20,977) (529,352)Other comprehensive income of associates – – (109,526) (34,123) (143,649) (37) (143,686)Total other comprehensive income, net of tax – – 65,326 (544,183) (478,857) (1,061) (479,918)Total comprehensive income for the year – – 65,326 3,500,515 3,565,841 250,524 3,816,365Transactions with owners, recorded
directly in equityContributions by and distributions
to ownersTransfers 21,691 (215,334) – 193,643 – – –Dividends and distribution – – – (1,570,230) (1,570,230) (107,201) (1,677,431)DSP reserve from dividends on unvested shares – – – 5,894 5,894 – 5,894Share-based payments for staff costs – 14,807 – – 14,807 – 14,807Share buyback held in treasury (223,912) – – – (223,912) – (223,912)Shares issued to non-executive directors 549 – – – 549 – 549Shares transferred to DSP Trust – (5,895) – – (5,895) – (5,895)Shares vested under DSP Scheme – 48,865 – – 48,865 – 48,865Treasury shares transferred/sold 231,201 (52,850) – – 178,351 – 178,351Total contributions by and distributions
to owners 29,529 (210,407) – (1,370,693) (1,551,571) (107,201) (1,658,772)Changes in interests in subsidiaries that
do not result in loss of control – – 370 (7,509) (7,139) (9,742) (16,881)Total changes in interests in subsidiaries – – 370 (7,509) (7,139) (9,742) (16,881)Balance at 31 December 2017 15,635,490 361,443 352,071 22,679,463 39,028,467 2,765,500 41,793,967
Included in the balances:Share of reserves of associates – – (74,740) 849,518 774,778 – 774,778
An analysis of the movements in each component within ‘Share capital and other equity’, ‘Capital reserves’ and ‘Revenue reserves’ is presented in Notes 12 to 15.
The accompanying notes form an integral part of these financial statements.
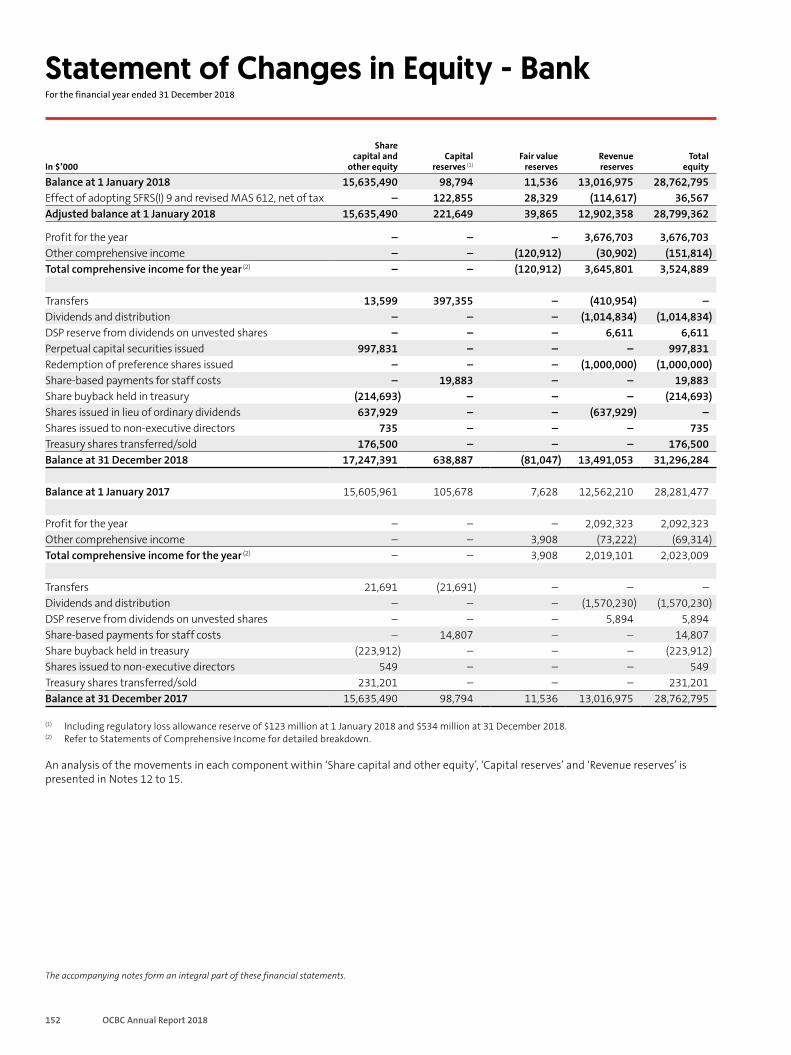
152 OCBC Annual Report 2018
Statement of Changes in Equity - Bank For the financial year ended 31 December 2018
The accompanying notes form an integral part of these financial statements.
In $’000
Share capital and
other equityCapital
reserves (1)Fair value
reserves Revenuereserves
Totalequity
Balance at 1 January 2018 15,635,490 98,794 11,536 13,016,975 28,762,795Effect of adopting SFRS(I) 9 and revised MAS 612, net of tax – 122,855 28,329 (114,617) 36,567Adjusted balance at 1 January 2018 15,635,490 221,649 39,865 12,902,358 28,799,362
Profit for the year – – – 3,676,703 3,676,703Other comprehensive income – – (120,912) (30,902) (151,814)Total comprehensive income for the year (2) – – (120,912) 3,645,801 3,524,889
Transfers 13,599 397,355 – (410,954) –Dividends and distribution – – – (1,014,834) (1,014,834)DSP reserve from dividends on unvested shares – – – 6,611 6,611Perpetual capital securities issued 997,831 – – – 997,831Redemption of preference shares issued – – – (1,000,000) (1,000,000)Share-based payments for staff costs – 19,883 – – 19,883Share buyback held in treasury (214,693) – – – (214,693)Shares issued in lieu of ordinary dividends 637,929 – – (637,929) –Shares issued to non-executive directors 735 – – – 735Treasury shares transferred/sold 176,500 – – – 176,500Balance at 31 December 2018 17,247,391 638,887 (81,047) 13,491,053 31,296,284
Balance at 1 January 2017 15,605,961 105,678 7,628 12,562,210 28,281,477
Profit for the year – – – 2,092,323 2,092,323Other comprehensive income – – 3,908 (73,222) (69,314)Total comprehensive income for the year (2) – – 3,908 2,019,101 2,023,009
Transfers 21,691 (21,691) – – –Dividends and distribution – – – (1,570,230) (1,570,230)DSP reserve from dividends on unvested shares – – – 5,894 5,894Share-based payments for staff costs – 14,807 – – 14,807Share buyback held in treasury (223,912) – – – (223,912)Shares issued to non-executive directors 549 – – – 549Treasury shares transferred/sold 231,201 – – – 231,201Balance at 31 December 2017 15,635,490 98,794 11,536 13,016,975 28,762,795
(1) Including regulatory loss allowance reserve of $123 million at 1 January 2018 and $534 million at 31 December 2018.(2) Refer to Statements of Comprehensive Income for detailed breakdown.
An analysis of the movements in each component within ‘Share capital and other equity’, ‘Capital reserves’ and ‘Revenue reserves’ is presented in Notes 12 to 15.
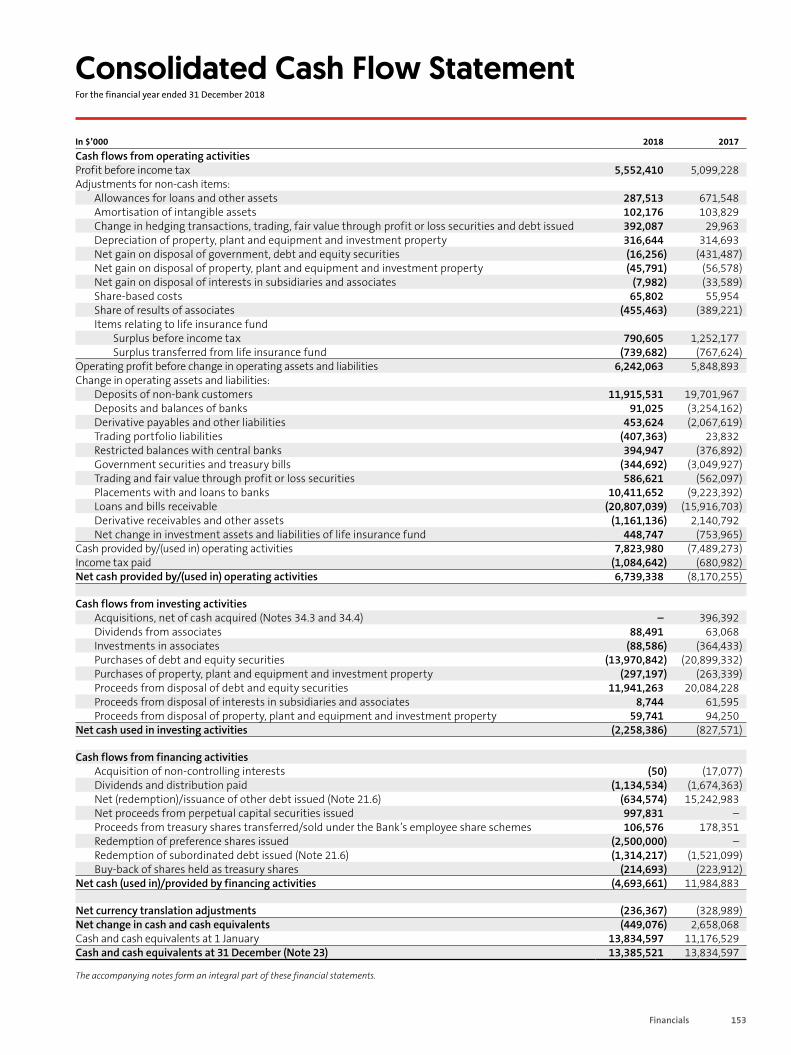
153Financials
Consolidated Cash Flow Statement For the financial year ended 31 December 2018
In $’000 2018 2017Cash flows from operating activitiesProfit before income tax 5,552,410 5,099,228Adjustments for non-cash items:
Allowances for loans and other assets 287,513 671,548Amortisation of intangible assets 102,176 103,829Change in hedging transactions, trading, fair value through profit or loss securities and debt issued 392,087 29,963Depreciation of property, plant and equipment and investment property 316,644 314,693Net gain on disposal of government, debt and equity securities (16,256) (431,487)Net gain on disposal of property, plant and equipment and investment property (45,791) (56,578)Net gain on disposal of interests in subsidiaries and associates (7,982) (33,589)Share-based costs 65,802 55,954Share of results of associates (455,463) (389,221)Items relating to life insurance fund Surplus before income tax 790,605 1,252,177 Surplus transferred from life insurance fund (739,682) (767,624)
Operating profit before change in operating assets and liabilities 6,242,063 5,848,893Change in operating assets and liabilities:
Deposits of non-bank customers 11,915,531 19,701,967Deposits and balances of banks 91,025 (3,254,162)Derivative payables and other liabilities 453,624 (2,067,619)Trading portfolio liabilities (407,363) 23,832Restricted balances with central banks 394,947 (376,892)Government securities and treasury bills (344,692) (3,049,927)Trading and fair value through profit or loss securities 586,621 (562,097)Placements with and loans to banks 10,411,652 (9,223,392)Loans and bills receivable (20,807,039) (15,916,703)Derivative receivables and other assets (1,161,136) 2,140,792Net change in investment assets and liabilities of life insurance fund 448,747 (753,965)
Cash provided by/(used in) operating activities 7,823,980 (7,489,273)Income tax paid (1,084,642) (680,982)Net cash provided by/(used in) operating activities 6,739,338 (8,170,255)
Cash flows from investing activitiesAcquisitions, net of cash acquired (Notes 34.3 and 34.4) – 396,392Dividends from associates 88,491 63,068Investments in associates (88,586) (364,433)Purchases of debt and equity securities (13,970,842) (20,899,332)Purchases of property, plant and equipment and investment property (297,197) (263,339)Proceeds from disposal of debt and equity securities 11,941,263 20,084,228Proceeds from disposal of interests in subsidiaries and associates 8,744 61,595Proceeds from disposal of property, plant and equipment and investment property 59,741 94,250
Net cash used in investing activities (2,258,386) (827,571)
Cash flows from financing activitiesAcquisition of non-controlling interests (50) (17,077)Dividends and distribution paid (1,134,534) (1,674,363)Net (redemption)/issuance of other debt issued (Note 21.6) (634,574) 15,242,983Net proceeds from perpetual capital securities issued 997,831 –Proceeds from treasury shares transferred/sold under the Bank’s employee share schemes 106,576 178,351Redemption of preference shares issued (2,500,000) –Redemption of subordinated debt issued (Note 21.6) (1,314,217) (1,521,099)Buy-back of shares held as treasury shares (214,693) (223,912)
Net cash (used in)/provided by financing activities (4,693,661) 11,984,883
Net currency translation adjustments (236,367) (328,989)Net change in cash and cash equivalents (449,076) 2,658,068Cash and cash equivalents at 1 January 13,834,597 11,176,529Cash and cash equivalents at 31 December (Note 23) 13,385,521 13,834,597
The accompanying notes form an integral part of these financial statements.
154 OCBC Annual Report 2018
Notes to the Financial Statements For the financial year ended 31 December 2018
These notes form an integral part of the financial statements.
The Board of Directors of Oversea-Chinese Banking Corporation Limited authorised these financial statements for issue on 21 February 2019.
1. GeneralOversea-Chinese Banking Corporation Limited (the Bank) is incorporated and domiciled in Singapore and is listed on the Singapore Exchange Securities Trading Limited. The address of the Bank’s registered office is 63 Chulia Street, #10-00 OCBC Centre East, Singapore 049514.
The consolidated financial statements relate to the Bank and its subsidiaries (together referred to as the Group) and the Group’s interests in associates. The Group is principally engaged in the business of banking, life insurance, general insurance, asset management, investment holding, futures and stockbroking.
2. Summary of Significant Accounting Policies
2.1 Basis of PreparationThe financial statements have been prepared in accordance with Singapore Financial Reporting Standards (International) (SFRS(I)) including SFRS(I) 1 First-time Adoption of Singapore Financial Reporting Standards (International) as required by the Singapore Companies Act (the Act).
The financial statements are presented in Singapore Dollar, rounded to the nearest thousand unless otherwise stated. The financial statements have been prepared under the historical cost convention, except as disclosed in the accounting policies below.
In 2014, the Accounting Standards Council (ASC) announced that Singapore-incorporated companies that have issued, or are in the process of issuing, equity or debt instruments for trading on the Singapore Exchange Securities Trading Limited, will apply a new financial reporting framework identical to the International Financial Reporting Standards (IFRS) with effect from annual periods beginning on or after 1 January 2018, with the objective to achieve full convergence with IFRS. Subsequently, the ASC issued SFRS(I) in 2017 for local implementation. SFRS(I) are equivalent of the International Financial Reporting Standards.
The Group’s previously issued financial statements for periods up to and including the financial year ended 31 December 2017 were prepared in accordance with Singapore Financial Reporting Standards (FRS), including the modification to FRS 39 Financial Instruments: Recognition and Measurement requirement on loan loss provisioning under Notice to Banks No. 612 Credit Files, Grading and Provisioning issued by the Monetary Authority of Singapore (MAS).
On initial implementation of SFRS(I), the Group was required to apply the specific transition requirements in SFRS(I) 1. SFRS(I) requires financial statements to be prepared using accounting policies that comply with SFRS(I) effective for the financial year ending
31 December 2018. Full retrospective application of all SFRS(I) effective for the financial year ending 31 December 2018 was required, subject to the mandatory exceptions and optional exemptions in SFRS(I) 1. In this regard, the date of transition to SFRS(I) for the Group was 1 January 2017, being the beginning of the earliest comparative period. The Group elected to apply the exemptions granted under SFRS(I) 1 to not restate the financial information of its comparative period in respect to financial instruments.
The effects of the adoption of new accounting framework SFRS(I) and change in Great Eastern Holdings Limited (GEH) accounting policy are described in Note 2.2.
The preparation of financial statements in conformity with SFRS(I) requires management to exercise its judgement, use estimates and make assumptions in the application of accounting policies on the reported amounts of assets, liabilities, revenues and expenses. Although these estimates are based on management’s best knowledge of current events and actions, actual results may ultimately differ from these estimates. Critical accounting estimates and assumptions used that are significant to the financial statements, and areas involving a high degree of judgement or complexity, are disclosed in Note 2.25.
In addition to the adoption of the new framework, the Group also concurrently applied the following SFRS(I)s, interpretations of SFRS(I)s and requirements of SFRS(I)s which are mandatorily effective from 1 January 2018:
SFRS(I) TitleSFRS(I) 9 Financial InstrumentsSFRS(I) 15 Revenue from Contracts with CustomersSFRS(I) 1-28 (Amendments) Measuring an Associate or Joint Venture
at Fair ValueSFRS(I) 1-40 (Amendments) Investment Property: Transfers of
Investment PropertySFRS(I) 2 (Amendments) Share-based Payment: Classification
and Measurement of Share-based Payment Transactions
SFRS(I) 4 (Amendments) Insurance Contracts: Applying SFRS(I) 9 Financial Instruments with SFRS(I) 4 Insurance Contracts
SFRS(I) INT 22 Foreign Currency Transactions and Advance Consideration
The initial application of the above standards (including their consequential amendments) and interpretations did not have any material impact on the Group’s financial statements, except for the adoption of new accounting framework SFRS(I) 1 and SFRS(I) 9 as disclosed in Note 2.2.
The accounting policies set out below have been applied consistently to all periods presented in these financial statements and in preparing the opening SFRS(I) statements of financial position at 1 January 2017 for the purposes of the transition to SFRS(I), unless otherwise indicated.
The accounting policies have been applied consistently by Group entities.
155Financials
2. Summary of Significant Accounting Policies (continued)
2.2 Adoption of New Accounting Framework SFRS(I) and GEH Accounting Policy Change
(A) Optional Exemptions AppliedFirst-time adoption of new accounting framework SFRS(I) 1 allows the exemption from application of certain requirements under SFRS(I) on a retrospective basis. The Group applied the following exemptions in the preparation of its first set of financial statement in accordance with SFRS(I) 1.
Except as described below, the application of the optional exemptions in SFRS(I) did not have any significant impact on the financial statements.
(i) Foreign Currency Translation Reserve (FCTR) The Group elected to apply the optional exemption in SFRS(I) 1 to reset its cumulative FCTR for all foreign operations to nil at the date of transition. At 1 January 2017, the cumulative FCTR of $0.9 billion recognised by the Group, which was determined in accordance with FRS, was reclassified from FCTR to unappropriated profit within revenue reserves. After the date of transition, any gain or loss on disposal of any foreign operations will exclude translation differences that arose before the date of transition.
(ii) Adoption of SFRS(I) 9 Financial Instruments The date of transition to SFRS(I) 9 was 1 January 2018, as the Group elected to apply the exemptions granted under SFRS(I) 1 to not restate the financial information of its comparative period in respect of financial instruments. The Group was also exempted from the application of SFRS(I) 7 Financial Instruments: Disclosures for the comparative period to the extent the disclosures relate to items in scope of SFRS(I) 9. The Group, as first-time adopter of SFRS(I), was required to recognise the cumulative effect of adopting SFRS(I) 9 in revenue reserves as at 1 January 2018.
(iii) Adoption of SFRS(I) 15 Revenue from Contracts with Customers
The Group elected to apply the transitional provisions in SFRS(I) 1 and applied the following practical expedients: • For completed contracts with variable considerations, the
Group used the transaction price at the date the contract was completed and did not re-estimate the variable considerations in the comparative period retrospectively;
• For contracts which were modified before the date of transition, the Group did not retrospectively restate the contract for those contract modifications; and
• For the financial year ended 31 December 2017, the Group
did not disclose the amount of transaction price allocated to the remaining performance obligations and explanation of when the Group expected to recognise the revenue.
(iv) Business Combination The Group applied the optional exemption in SFRS(I) 1 which allowed it to account for business combinations that occurred before the date of transition on 1 January 2017, and the associated fair value adjustments and goodwill, on the same basis as the previously applied FRS.
Accordingly, SFRS(I) 3 Business Combinations and SFRS(I) 1-21 The Effects of Changes in Foreign Exchange Rates had not been applied to these past business combinations.
(v) Leases The Group had applied the transitional provision in accordance with SFRS(I) INT 4 Determining whether an Arrangement contains a Lease and determined whether its arrangement contained a lease arrangement based on existing facts and circumstances on the date of transition to SFRS(I).
(vi) Other Optional Exemptions• The Group elected the optional exemption in SFRS(I) 1 to
be exempted from retrospective application of SFRS(I) 2 Share-based Payment on share-based payments that were granted on or before 7 November 2002 but vested before the date of transition, or liabilities arising from cash-settled share-based payment transactions that were settled before the date of transition.
• The Group elected the optional exemption in SFRS(I) 1 to be exempted from retrospective application of SFRS(I) 1-32 Financial Instruments to separate equity and liability components of compound instruments for which liability component is no longer outstanding at the date of transition.
• SFRS(I) 1 provides transitional relief from retrospective application of the fair value measurement requirements in respect of the recognition of ‘day one’ gains or losses. The Group elected the optional exemption and therefore prospectively apply the fair value measurement requirements provided in SFRS(I) 9 to transactions entered into on or after the date of transition.
• The Group elected to apply SFRS(I) INT 19 Extinguishing Financial Liabilities with Equity Instruments for extinguishments that occurred from the beginning of the earliest comparative period.
(B) GEH Accounting Policy Change(i) Adoption of Enterprise Wide Accounting BasisGEH and its subsidiaries, changed its basis for the preparation of the financial statements from fund accounting basis to an enterprise wide basis for comparability to industry practices. Under the fund accounting basis, GEH Group presented the Shareholders’ Profit and Loss Statement, Life Assurance Revenue Statement and General Insurance Revenue Statement separately. The three Statements are now presented as a single Profit and Loss Statement under enterprise wide basis. With the adoption of enterprise wide basis, the insurance fund profit is no longer determined in accordance with the insurance regulations of the respective jurisdictions in which the insurance subsidiaries operates, but now align with SFRS(I) instead.
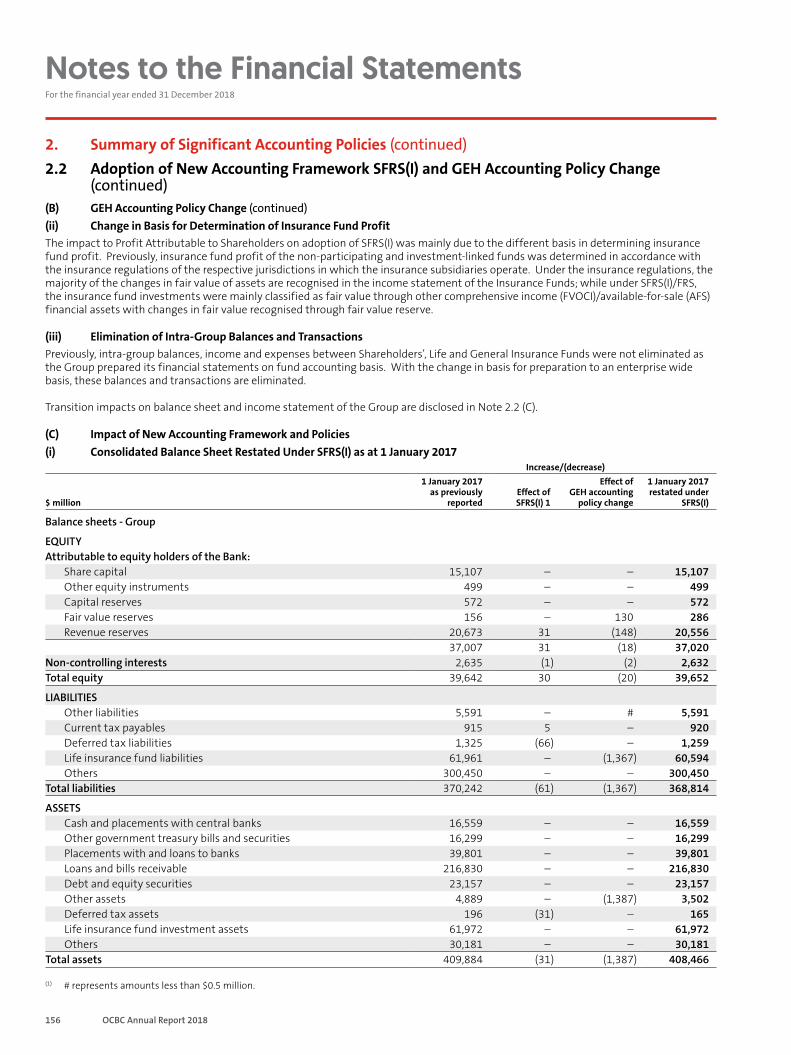
156 OCBC Annual Report 2018
Notes to the Financial Statements For the financial year ended 31 December 2018
2. Summary of Significant Accounting Policies (continued)2.2 Adoption of New Accounting Framework SFRS(I) and GEH Accounting Policy Change
(continued)(B) GEH Accounting Policy Change (continued)(ii) Change in Basis for Determination of Insurance Fund ProfitThe impact to Profit Attributable to Shareholders on adoption of SFRS(I) was mainly due to the different basis in determining insurance fund profit. Previously, insurance fund profit of the non-participating and investment-linked funds was determined in accordance with the insurance regulations of the respective jurisdictions in which the insurance subsidiaries operate. Under the insurance regulations, the majority of the changes in fair value of assets are recognised in the income statement of the Insurance Funds; while under SFRS(I)/FRS, the insurance fund investments were mainly classified as fair value through other comprehensive income (FVOCI)/available-for-sale (AFS) financial assets with changes in fair value recognised through fair value reserve.
(iii) Elimination of Intra-Group Balances and TransactionsPreviously, intra-group balances, income and expenses between Shareholders’, Life and General Insurance Funds were not eliminated as the Group prepared its financial statements on fund accounting basis. With the change in basis for preparation to an enterprise wide basis, these balances and transactions are eliminated.
Transition impacts on balance sheet and income statement of the Group are disclosed in Note 2.2 (C).
(C) Impact of New Accounting Framework and Policies(i) Consolidated Balance Sheet Restated Under SFRS(I) as at 1 January 2017
Increase/(decrease)
$ million
1 January 2017 as previously
reportedEffect of SFRS(I) 1
Effect of GEH accounting
policy change
1 January 2017 restated under
SFRS(I)
Balance sheets - Group
EQUITYAttributable to equity holders of the Bank:
Share capital 15,107 – – 15,107Other equity instruments 499 – – 499Capital reserves 572 – – 572Fair value reserves 156 – 130 286Revenue reserves 20,673 31 (148) 20,556
37,007 31 (18) 37,020Non-controlling interests 2,635 (1) (2) 2,632Total equity 39,642 30 (20) 39,652
LIABILITIESOther liabilities 5,591 – # 5,591Current tax payables 915 5 – 920Deferred tax liabilities 1,325 (66) – 1,259Life insurance fund liabilities 61,961 – (1,367) 60,594Others 300,450 – – 300,450
Total liabilities 370,242 (61) (1,367) 368,814
ASSETSCash and placements with central banks 16,559 – – 16,559Other government treasury bills and securities 16,299 – – 16,299Placements with and loans to banks 39,801 – – 39,801Loans and bills receivable 216,830 – – 216,830Debt and equity securities 23,157 – – 23,157Other assets 4,889 – (1,387) 3,502Deferred tax assets 196 (31) – 165Life insurance fund investment assets 61,972 – – 61,972Others 30,181 – – 30,181
Total assets 409,884 (31) (1,387) 408,466
(1) # represents amounts less than $0.5 million.
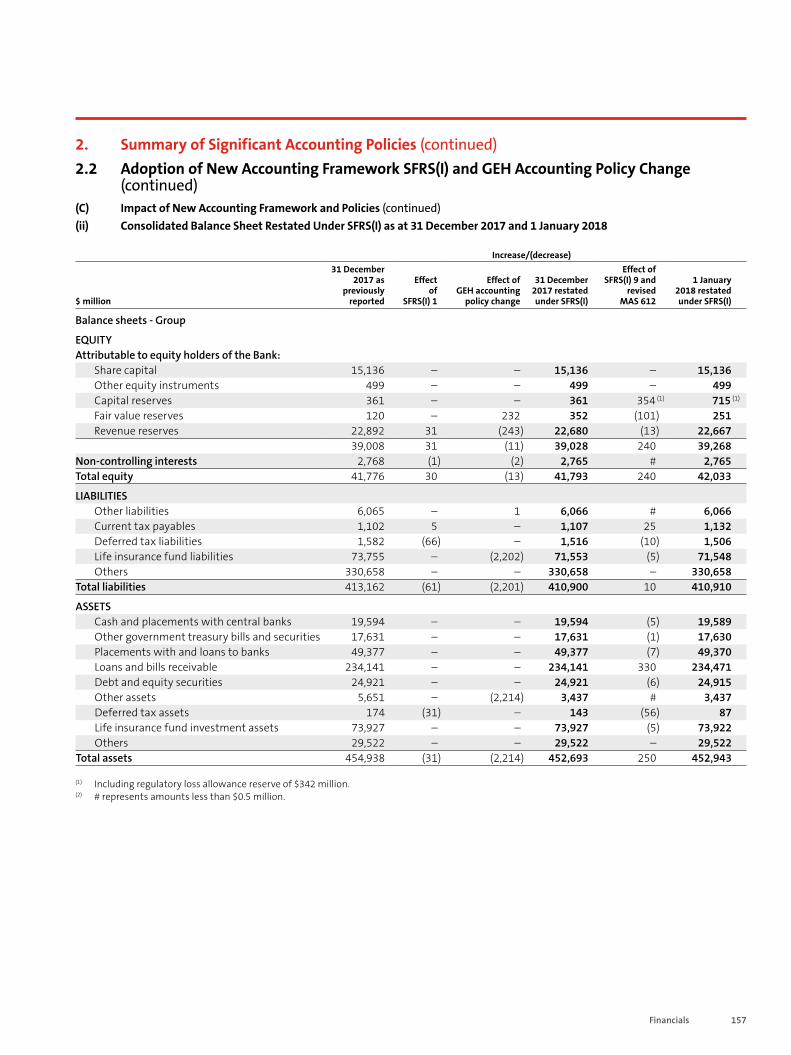
157Financials
2. Summary of Significant Accounting Policies (continued)2.2 Adoption of New Accounting Framework SFRS(I) and GEH Accounting Policy Change
(continued)(C) Impact of New Accounting Framework and Policies (continued)(ii) Consolidated Balance Sheet Restated Under SFRS(I) as at 31 December 2017 and 1 January 2018
Increase/(decrease)
$ million
31 December 2017 as
previously reported
Effect of
SFRS(I) 1
Effect of GEH accounting
policy change
31 December 2017 restated under SFRS(I)
Effect of SFRS(I) 9 and
revised MAS 612
1 January 2018 restated under SFRS(I)
Balance sheets - Group
EQUITYAttributable to equity holders of the Bank:
Share capital 15,136 – – 15,136 – 15,136Other equity instruments 499 – – 499 – 499Capital reserves 361 – – 361 354 (1) 715 (1)
Fair value reserves 120 – 232 352 (101) 251Revenue reserves 22,892 31 (243) 22,680 (13) 22,667
39,008 31 (11) 39,028 240 39,268Non-controlling interests 2,768 (1) (2) 2,765 # 2,765Total equity 41,776 30 (13) 41,793 240 42,033
LIABILITIESOther liabilities 6,065 – 1 6,066 # 6,066Current tax payables 1,102 5 – 1,107 25 1,132Deferred tax liabilities 1,582 (66) – 1,516 (10) 1,506Life insurance fund liabilities 73,755 – (2,202) 71,553 (5) 71,548Others 330,658 – – 330,658 – 330,658
Total liabilities 413,162 (61) (2,201) 410,900 10 410,910
ASSETSCash and placements with central banks 19,594 – – 19,594 (5) 19,589Other government treasury bills and securities 17,631 – – 17,631 (1) 17,630Placements with and loans to banks 49,377 – – 49,377 (7) 49,370Loans and bills receivable 234,141 – – 234,141 330 234,471Debt and equity securities 24,921 – – 24,921 (6) 24,915Other assets 5,651 – (2,214) 3,437 # 3,437Deferred tax assets 174 (31) – 143 (56) 87Life insurance fund investment assets 73,927 – – 73,927 (5) 73,922Others 29,522 – – 29,522 – 29,522
Total assets 454,938 (31) (2,214) 452,693 250 452,943
(1) Including regulatory loss allowance reserve of $342 million. (2) # represents amounts less than $0.5 million.
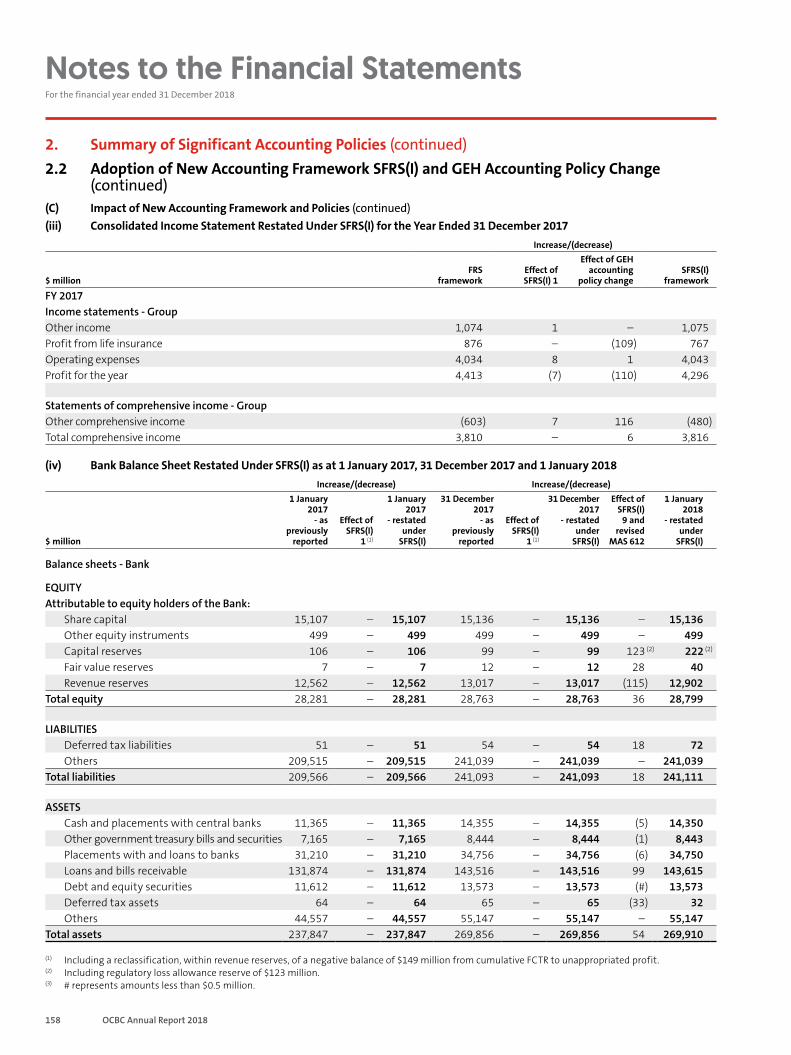
158 OCBC Annual Report 2018
Notes to the Financial Statements For the financial year ended 31 December 2018
2. Summary of Significant Accounting Policies (continued)2.2 Adoption of New Accounting Framework SFRS(I) and GEH Accounting Policy Change
(continued)(C) Impact of New Accounting Framework and Policies (continued)(iii) Consolidated Income Statement Restated Under SFRS(I) for the Year Ended 31 December 2017
Increase/(decrease)
$ millionFRS
frameworkEffect of SFRS(I) 1
Effect of GEH accounting
policy changeSFRS(I)
framework
FY 2017Income statements - GroupOther income 1,074 1 – 1,075Profit from life insurance 876 – (109) 767Operating expenses 4,034 8 1 4,043Profit for the year 4,413 (7) (110) 4,296
Statements of comprehensive income - GroupOther comprehensive income (603) 7 116 (480)Total comprehensive income 3,810 – 6 3,816
(iv) Bank Balance Sheet Restated Under SFRS(I) as at 1 January 2017, 31 December 2017 and 1 January 2018Increase/(decrease) Increase/(decrease)
$ million
1 January 2017
- as previously
reported
Effect of SFRS(I)
1 (1)
1 January 2017
- restated under
SFRS(I)
31 December 2017
- as previously
reported
Effect of SFRS(I)
1 (1)
31 December 2017
- restated under
SFRS(I)
Effect of SFRS(I)
9 and revised
MAS 612
1 January 2018
- restated under
SFRS(I)
Balance sheets - Bank
EQUITYAttributable to equity holders of the Bank:
Share capital 15,107 – 15,107 15,136 – 15,136 – 15,136Other equity instruments 499 – 499 499 – 499 – 499Capital reserves 106 – 106 99 – 99 123 (2) 222 (2)
Fair value reserves 7 – 7 12 – 12 28 40Revenue reserves 12,562 – 12,562 13,017 – 13,017 (115) 12,902
Total equity 28,281 – 28,281 28,763 – 28,763 36 28,799
LIABILITIESDeferred tax liabilities 51 – 51 54 – 54 18 72Others 209,515 – 209,515 241,039 – 241,039 – 241,039
Total liabilities 209,566 – 209,566 241,093 – 241,093 18 241,111
ASSETSCash and placements with central banks 11,365 – 11,365 14,355 – 14,355 (5) 14,350Other government treasury bills and securities 7,165 – 7,165 8,444 – 8,444 (1) 8,443Placements with and loans to banks 31,210 – 31,210 34,756 – 34,756 (6) 34,750Loans and bills receivable 131,874 – 131,874 143,516 – 143,516 99 143,615Debt and equity securities 11,612 – 11,612 13,573 – 13,573 (#) 13,573Deferred tax assets 64 – 64 65 – 65 (33) 32Others 44,557 – 44,557 55,147 – 55,147 – 55,147
Total assets 237,847 – 237,847 269,856 – 269,856 54 269,910
(1) Including a reclassification, within revenue reserves, of a negative balance of $149 million from cumulative FCTR to unappropriated profit.(2) Including regulatory loss allowance reserve of $123 million.(3) # represents amounts less than $0.5 million.
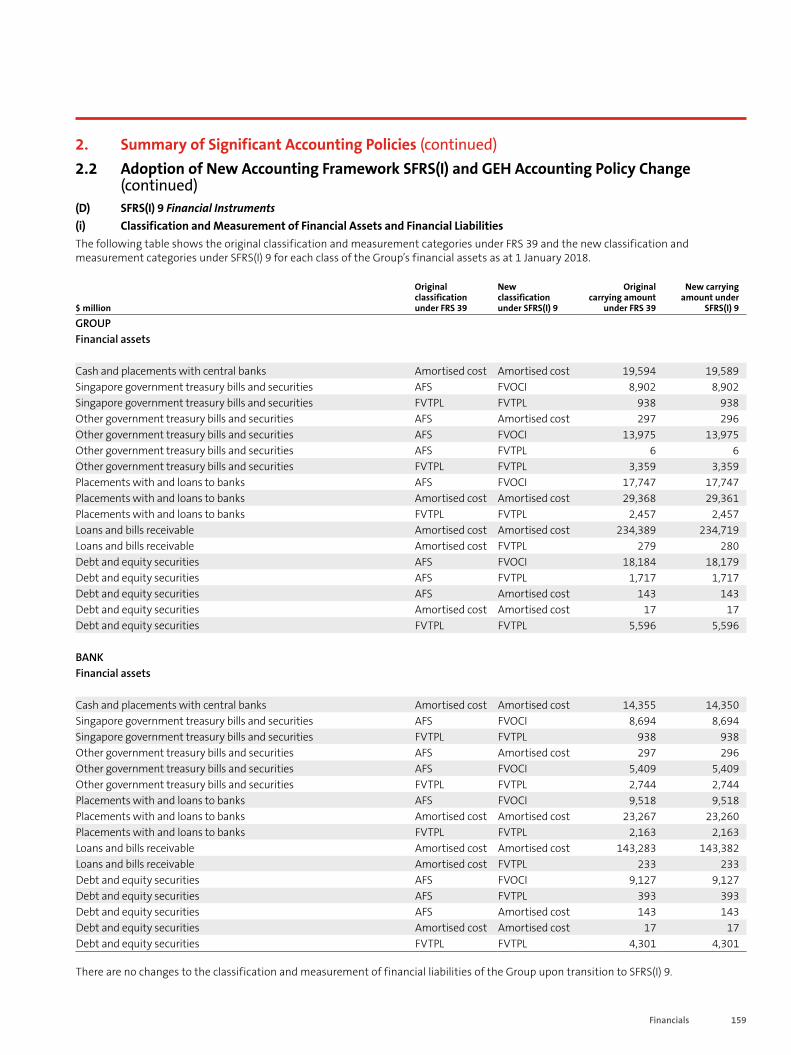
159Financials
2. Summary of Significant Accounting Policies (continued)2.2 Adoption of New Accounting Framework SFRS(I) and GEH Accounting Policy Change
(continued)(D) SFRS(I) 9 Financial Instruments(i) Classification and Measurement of Financial Assets and Financial LiabilitiesThe following table shows the original classification and measurement categories under FRS 39 and the new classification and measurement categories under SFRS(I) 9 for each class of the Group’s financial assets as at 1 January 2018.
$ million
Original classification under FRS 39
New classification under SFRS(I) 9
Original carrying amount
under FRS 39
New carrying amount under
SFRS(I) 9
GROUPFinancial assets
Cash and placements with central banks Amortised cost Amortised cost 19,594 19,589Singapore government treasury bills and securities AFS FVOCI 8,902 8,902Singapore government treasury bills and securities FVTPL FVTPL 938 938Other government treasury bills and securities AFS Amortised cost 297 296Other government treasury bills and securities AFS FVOCI 13,975 13,975Other government treasury bills and securities AFS FVTPL 6 6Other government treasury bills and securities FVTPL FVTPL 3,359 3,359Placements with and loans to banks AFS FVOCI 17,747 17,747Placements with and loans to banks Amortised cost Amortised cost 29,368 29,361Placements with and loans to banks FVTPL FVTPL 2,457 2,457Loans and bills receivable Amortised cost Amortised cost 234,389 234,719Loans and bills receivable Amortised cost FVTPL 279 280Debt and equity securities AFS FVOCI 18,184 18,179Debt and equity securities AFS FVTPL 1,717 1,717Debt and equity securities AFS Amortised cost 143 143Debt and equity securities Amortised cost Amortised cost 17 17Debt and equity securities FVTPL FVTPL 5,596 5,596
BANKFinancial assets
Cash and placements with central banks Amortised cost Amortised cost 14,355 14,350Singapore government treasury bills and securities AFS FVOCI 8,694 8,694Singapore government treasury bills and securities FVTPL FVTPL 938 938Other government treasury bills and securities AFS Amortised cost 297 296Other government treasury bills and securities AFS FVOCI 5,409 5,409Other government treasury bills and securities FVTPL FVTPL 2,744 2,744Placements with and loans to banks AFS FVOCI 9,518 9,518Placements with and loans to banks Amortised cost Amortised cost 23,267 23,260Placements with and loans to banks FVTPL FVTPL 2,163 2,163Loans and bills receivable Amortised cost Amortised cost 143,283 143,382Loans and bills receivable Amortised cost FVTPL 233 233Debt and equity securities AFS FVOCI 9,127 9,127Debt and equity securities AFS FVTPL 393 393Debt and equity securities AFS Amortised cost 143 143Debt and equity securities Amortised cost Amortised cost 17 17Debt and equity securities FVTPL FVTPL 4,301 4,301
There are no changes to the classification and measurement of financial liabilities of the Group upon transition to SFRS(I) 9.
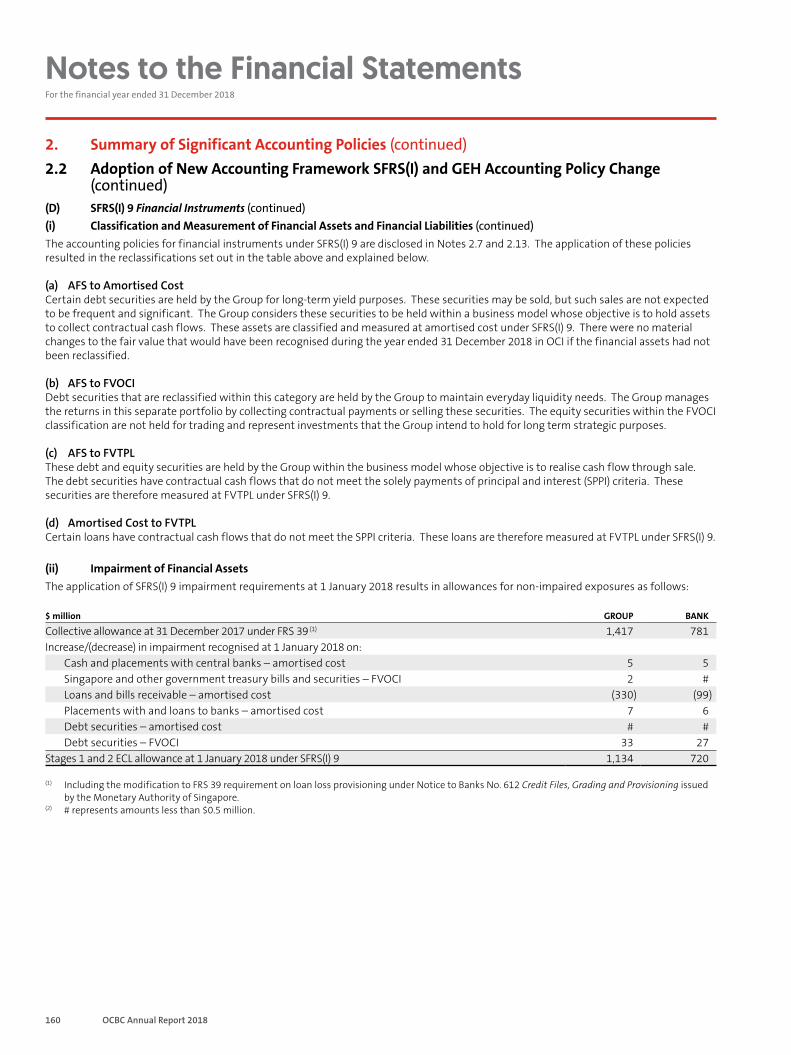
160 OCBC Annual Report 2018
Notes to the Financial Statements For the financial year ended 31 December 2018
2. Summary of Significant Accounting Policies (continued)2.2 Adoption of New Accounting Framework SFRS(I) and GEH Accounting Policy Change
(continued)(D) SFRS(I) 9 Financial Instruments (continued)(i) Classification and Measurement of Financial Assets and Financial Liabilities (continued)The accounting policies for financial instruments under SFRS(I) 9 are disclosed in Notes 2.7 and 2.13. The application of these policies resulted in the reclassifications set out in the table above and explained below.
(a) AFS to Amortised CostCertain debt securities are held by the Group for long-term yield purposes. These securities may be sold, but such sales are not expected to be frequent and significant. The Group considers these securities to be held within a business model whose objective is to hold assets to collect contractual cash flows. These assets are classified and measured at amortised cost under SFRS(I) 9. There were no material changes to the fair value that would have been recognised during the year ended 31 December 2018 in OCI if the financial assets had not been reclassified.
(b) AFS to FVOCIDebt securities that are reclassified within this category are held by the Group to maintain everyday liquidity needs. The Group manages the returns in this separate portfolio by collecting contractual payments or selling these securities. The equity securities within the FVOCI classification are not held for trading and represent investments that the Group intend to hold for long term strategic purposes.
(c) AFS to FVTPLThese debt and equity securities are held by the Group within the business model whose objective is to realise cash flow through sale. The debt securities have contractual cash flows that do not meet the solely payments of principal and interest (SPPI) criteria. These securities are therefore measured at FVTPL under SFRS(I) 9.
(d) Amortised Cost to FVTPLCertain loans have contractual cash flows that do not meet the SPPI criteria. These loans are therefore measured at FVTPL under SFRS(I) 9.
(ii) Impairment of Financial AssetsThe application of SFRS(I) 9 impairment requirements at 1 January 2018 results in allowances for non-impaired exposures as follows:
$ million GROUP BANK
Collective allowance at 31 December 2017 under FRS 39 (1) 1,417 781Increase/(decrease) in impairment recognised at 1 January 2018 on:
Cash and placements with central banks – amortised cost 5 5Singapore and other government treasury bills and securities – FVOCI 2 #Loans and bills receivable – amortised cost (330) (99)Placements with and loans to banks – amortised cost 7 6Debt securities – amortised cost # #Debt securities – FVOCI 33 27
Stages 1 and 2 ECL allowance at 1 January 2018 under SFRS(I) 9 1,134 720
(1) Including the modification to FRS 39 requirement on loan loss provisioning under Notice to Banks No. 612 Credit Files, Grading and Provisioning issued by the Monetary Authority of Singapore.
(2) # represents amounts less than $0.5 million.
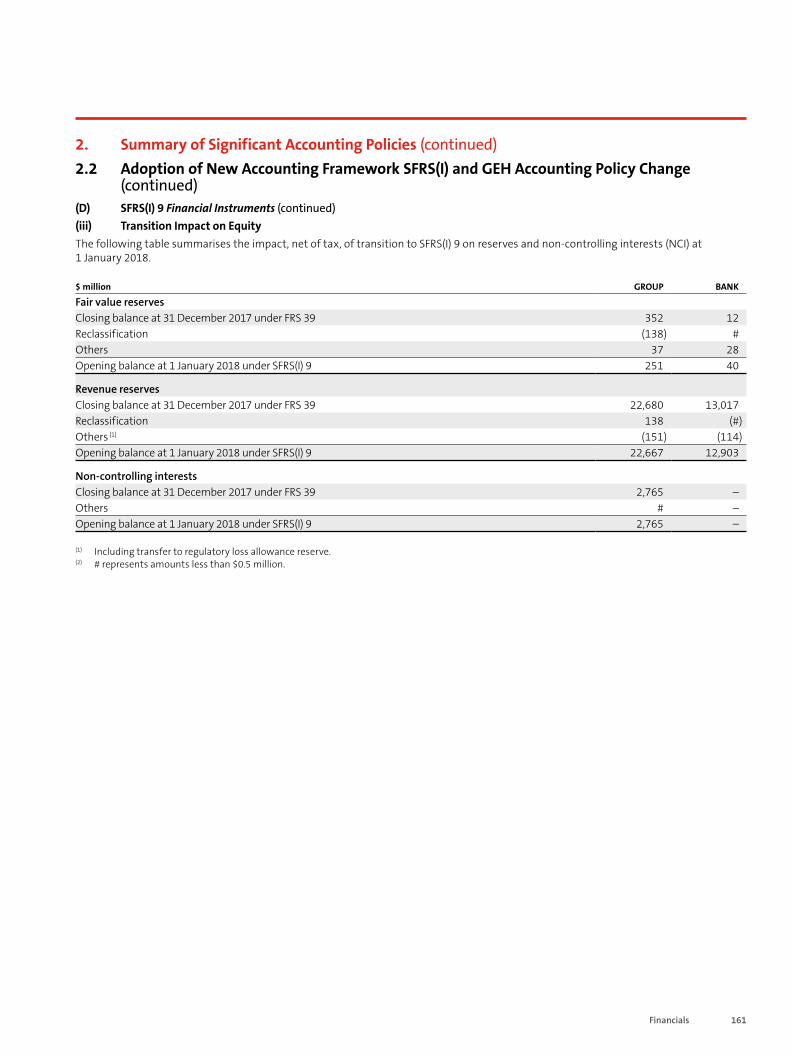
161Financials
2. Summary of Significant Accounting Policies (continued)2.2 Adoption of New Accounting Framework SFRS(I) and GEH Accounting Policy Change
(continued)(D) SFRS(I) 9 Financial Instruments (continued)(iii) Transition Impact on EquityThe following table summarises the impact, net of tax, of transition to SFRS(I) 9 on reserves and non-controlling interests (NCI) at 1 January 2018.
$ million GROUP BANK
Fair value reservesClosing balance at 31 December 2017 under FRS 39 352 12Reclassification (138) #Others 37 28Opening balance at 1 January 2018 under SFRS(I) 9 251 40
Revenue reservesClosing balance at 31 December 2017 under FRS 39 22,680 13,017Reclassification 138 (#)Others (1) (151) (114)Opening balance at 1 January 2018 under SFRS(I) 9 22,667 12,903
Non-controlling interestsClosing balance at 31 December 2017 under FRS 39 2,765 –Others # –Opening balance at 1 January 2018 under SFRS(I) 9 2,765 –
(1) Including transfer to regulatory loss allowance reserve.(2) # represents amounts less than $0.5 million.
162 OCBC Annual Report 2018
Notes to the Financial Statements For the financial year ended 31 December 2018
2. Summary of Significant Accounting Policies (continued)
2.3 Basis of Consolidation 2.3.1 SubsidiariesSubsidiaries are entities over which the Group controls when it is exposed to, or has rights to, variable returns from its involvement with the entity and has the ability to affect those returns through its power over the entity.
Subsidiaries are consolidated from the date when control is transferred to the Group and cease to be consolidated on the date when that control ceases. The Group reassesses whether it controls an investee if facts and circumstances indicate that there have been changes to its power, its rights to variable returns or its ability to use its power to affect its returns.
In preparing the consolidated financial statements, intra-group transactions and balances, together with unrealised income and expenses arising from the intra-group transactions among group companies are eliminated. Unrealised losses are also eliminated unless the transaction provides evidence of an impairment of the asset transferred. Where necessary, adjustments are made to the financial statements of subsidiaries to ensure consistency of accounting policies within the Group.
NCI represent the equity in subsidiaries not attributable, directly or indirectly, to shareholders of the Bank, and are presented separately from equity attributable to equity holders of the Bank. For NCI that arise through minority unit holders’ interest in the insurance subsidiaries of GEH consolidated investment funds, they are recognised as a liability. These interests qualify as a financial liability as they give the holder the right to put the instrument back to the issuer for cash. Changes in these liabilities are recognised in the income statement as expenses.
The Group applies the acquisition method to account for business combinations. The cost of an acquisition is measured at the fair value of the assets given, equity instruments issued or liabilities incurred or assumed at the date of exchange. Acquisition-related costs are expensed as incurred. Identifiable assets acquired and liabilities and contingent liabilities assumed in a business combination are measured initially at their fair values at the acquisition date. The Group recognises any NCI either at fair value or at the NCI’s proportionate share of the recognised amounts of the acquiree’s identifiable net assets at the date of acquisition on an acquisition-by-acquisition basis.
The excess of the fair value of consideration transferred, the recognised amount of any NCI in the acquiree and the acquisition-date fair values of any previously held equity interest in the acquiree over the fair value of the identifiable net assets acquired is recognised as goodwill at the date of acquisition. When the excess is negative, a bargain purchase gain is recognised immediately in the income statements.
Business combinations arising from transfers of interests in entities that are under the control of the shareholder that
controls the Group are accounted for as if the acquisition has occurred at the beginning of the earliest comparative year presented or, if later, at the date that common control was established; for this purpose comparatives are restated. The assets and liabilities acquired are recognised at the carrying amounts recognised previously in the Group controlling shareholder’s consolidated financial statements. The components of equity of the acquired entities are added to the same components within the Group’s equity and any gain/loss arising is recognised directly in equity.
2.3.2 Structured EntitiesA structured entity is an entity in which voting or similar rights are not the dominant factor in deciding control and is generally established for a narrow and well-defined objective.
For the purpose of disclosure, the Group would be considered to sponsor a structured entity if it has a key role in establishing the structured entity or its name appears in the overall structure of the structured entity.
2.3.3 Associates and Joint VenturesThe Group applies SFRS(I) 1-28 Investments in Associates and Joint Ventures and SFRS(I) 11 Joint Arrangements for its investments in associates and joint ventures.
Associates are entities over which the Bank has significant influence, but not control or joint control, over the financial and operating policies of these entities. Significant influence is presumed to exist when the Group holds 20% or more of the voting power of another entity.
Joint ventures are arrangements to undertake economic activities in which the Group has joint control and rights to the net assets of the entity.
Investments in associates and joint ventures are accounted for in the consolidated financial statements using the equity method of accounting. Under equity accounting, the investment is initially recognised at cost, and the carrying amount is adjusted for post-acquisition changes of the Group’s share of the net assets of the entity until the date the significant influence or joint control ceases. The Group’s investment in associates and joint ventures includes goodwill identified on acquisition, where applicable. When the Group’s share of losses equals or exceeds its interests in the associates and joint ventures, including any other unsecured receivables, the Group does not recognise further losses, unless it has incurred obligations or made payments on behalf of the entities.
In applying the equity method of accounting, unrealised gains on transactions between the Group and its associates and joint ventures are eliminated to the extent of the Group’s interests in these entities. Unrealised losses are also eliminated unless the transaction provides evidence of an impairment of the asset transferred. Where necessary, adjustments are made to the financial statements of associates and joint ventures to ensure consistency of accounting policies with those of the Group.
163Financials
2. Summary of Significant Accounting Policies (continued)
2.3 Basis of Consolidation (continued)2.3.3 Associates and Joint Ventures (continued)The results of associates and joint ventures are taken from audited financial statements or unaudited management accounts of the entities concerned, made up to dates of not more than three months prior to the reporting date of the Group.
The investment in an associate or joint venture is derecognised when the Group ceases to have significant influence or joint control over the investee. Amounts previously recognised in other comprehensive income in respect of the investee are transferred to the income statement. Any retained interest in the entity is re-measured at its fair value. The difference between the carrying amount of the retained interest at the date when significant influence or joint control ceases, and its corresponding fair value, is recognised in the income statement.
2.3.4 Life Insurance CompaniesCertain subsidiaries of the Group engaged in life insurance business are structured into one or more long-term life insurance funds, and shareholders’ fund. All premiums received, investment returns, claims and expenses, and changes in liabilities to policyholders are accounted for within the related life insurance fund. Any surplus, which is determined by the appointed Actuary after taking into account these items, may either be distributed between the shareholders and the policyholders according to a predetermined formula or retained within the life insurance funds. The amount allocated to shareholders is reported as “Profit from life insurance” in the consolidated income statement.
2.3.5 Accounting for Subsidiaries and Associates by the BankInvestments in subsidiaries and associates are stated in the Bank’s balance sheet at cost less any impairment in value after the date of acquisition.
2.4 Currency Translation 2.4.1 Foreign Currency Transactions Transactions in foreign currencies are recorded in the respective functional currencies of the Bank and its subsidiaries at the exchange rates prevailing on the transaction dates. Monetary items denominated in foreign currencies are translated to the respective entities’ functional currencies at the exchange rates prevailing at the balance sheet date. Exchange differences arising on settlement and translation of such items are recognised in the income statement.
Non-monetary items denominated in foreign currencies that are measured at fair value are translated at the exchange rate on the date the fair value is determined. Exchange differences on non-monetary items such as equity investments classified as FVOCI/available-for-sale financial assets are recognised in other comprehensive income and presented in the fair value reserve within equity.
2.4.2 Foreign OperationsThe assets and liabilities of foreign operations, including goodwill and fair value adjustment arising on the acquisition of a foreign operation, are translated to Singapore Dollar at exchange rates prevailing at the balance sheet date. The income and expenses of foreign operations are translated to Singapore Dollar at average exchange rates for the year, which approximate the exchange rates at the dates of the transactions.
Differences arising from the translation of a foreign operation are recognised in other comprehensive income and presented in the currency translation reserve within equity. When a foreign operation is disposed of, in part or in full, the relevant amount in the currency translation reserve is included in the gain or loss on disposal of the operation.
2.5 Cash and Cash EquivalentsIn the consolidated cash flow statement, cash and cash equivalents comprise cash on hand, balances, money market placements and reverse repo transactions with central banks which are generally short-term financial instruments or repayable on demand.
2.6 Financial Instruments2.6.1 RecognitionThe Group initially recognises loans and advances, deposits and debts issued on the date of origination. All regular way purchases and sales of financial assets with delivery of assets within the time period established by regulation or market convention are recognised on the settlement date.
2.6.2 De-RecognitionFinancial assets are de-recognised when the Group’s contractual rights to the cash flows from the financial assets expire or when the Group transfers the financial asset to another party without retaining control or transfers substantially all the risks and rewards of ownership of the asset. Financial liabilities are de-recognised when the Group’s obligations specified in the contract expire or are discharged or cancelled.
2.6.3 ModificationThe original terms of a financial asset may be renegotiated or otherwise modified, resulting in changes to the contractual cash flows of the financial asset. Financial assets that are renegotiated or otherwise modified will be primarily accounted based on the process undertaken to execute the renegotiation and the nature and extent of changes that is expected to arise as a result of the modification or renegotiation.
2.6.4 OffsettingFinancial assets and liabilities are offset and the net amount presented in the balance sheet when there is a legally enforceable right to offset the amounts and an intention to settle on a net basis or realise the asset and settle the liability simultaneously. Income and expenses are presented on a net basis only when permitted by the accounting standards.
164 OCBC Annual Report 2018
Notes to the Financial Statements For the financial year ended 31 December 2018
2. Summary of Significant Accounting Policies (continued)
2.6 Financial Instruments (continued)2.6.5 Sale and Repurchase Agreements (Including Securities
Lending and Borrowing)Repurchase agreements (repos) are regarded as collateralised borrowing. The securities sold under repos are treated as pledged assets and remain as assets on the balance sheets. The amount borrowed is recorded as a liability. Reverse repos are treated as collateralised lending and the amount of securities purchased is included in placements with central banks, loans to banks and non-bank customers. The difference between the amount received and the amount paid under repos and reverse repos is amortised as interest expense and interest income respectively.
Securities lending and borrowing transactions are generally secured, with collaterals taking the form of securities or cash. The transfer of securities to or from counterparties is not reflected on the balance sheet. Cash collateral advanced or received is recorded as an asset or a liability respectively.
2.7 Non-Derivative Financial Assets(A) Policy Applicable before 1 January 2018Non-derivative financial assets are classified according to the purpose for which the assets were acquired. Management determines the classification of its financial assets at initial recognition and evaluates this designation at every reporting date.
2.7.1 Loans and ReceivablesLoans and receivables are non-derivative financial assets with fixed or determinable payments that are not quoted in an active market. They are initially recognised at acquisition cost and subsequently measured at amortised cost using the effective interest method, less impairment allowance.
2.7.2 Available-for-Sale Financial Assets Available-for-sale financial assets are intended to be held for an indefinite period of time, and may be sold in response to needs for liquidity or changes in interest rates, exchange rates or market prices.
At the balance sheet date, the Group recognises unrealised gains and losses on revaluing unsettled contracts in other comprehensive income. Upon settlement, available-for-sale assets are carried at fair value (including transaction costs) on the balance sheet, with cumulative fair value changes taken to other comprehensive income and presented in fair value reserve within equity, and recognised in the income statement when the asset is disposed of, collected or otherwise sold, or when the asset is assessed to be impaired.
The fair value for quoted investments is derived from market bid prices. For unquoted securities, fair value is determined based on quotes from brokers and market makers, discounted cash flow and other valuation techniques commonly used by market participants.
2.7.3 Financial Assets at Fair Value Through Profit or LossFinancial assets at fair value through profit or loss are acquired by the trading business units of the Group for the purpose of selling them in the near term. The Group may also designate financial assets under the fair value option if they are managed on a fair value basis, contain embedded derivatives that would otherwise be required to be separately accounted for or if by doing so would eliminate or significantly reduce accounting mismatch that would otherwise arise.
At the balance sheet date, unrealised profits and losses on revaluing unsettled contracts are recognised in the income statement. Upon settlement, these assets are carried at fair value on the balance sheet, with subsequent fair value changes recognised in the income statement.
Fair value is derived from quoted market bid prices. All realised and unrealised gains and losses are included in net trading income in the income statement. Interest earned whilst holding trading assets is included in interest income.
2.7.4 Held-to-Maturity InvestmentsHeld-to-maturity investments are non-derivative financial assets with fixed or determinable payments and fixed maturities that the Group’s management has the positive intention and ability to hold to maturity. These assets are carried at amortised cost using the effective interest method, less any impairment loss.
(B) Policy Applicable from 1 January 2018Classification and Measurement of Financial AssetsOn initial recognition, a non-derivative financial asset is either measured at amortised cost, Fair Value through Other Comprehensive Income (FVOCI) or Fair Value through Profit or Loss (FVTPL).
(a) Business Model AssessmentThe Group makes an assessment of the objective of a business model in which an asset is held at a portfolio level because this best reflects the way the business is managed, and information is provided to management. The information considered includes:• the stated policies and objectives for the portfolio and the
operation of those policies in practice. In particular, whether management’s strategy focuses on earning contractual interest revenue, maintaining a particular interest rate profile, matching the duration of the financial assets to the duration of the liabilities that are funding those assets or realising cash flows through the sale of the assets;
• how the performance of the portfolio is evaluated and reported to the Group’s management;
• the risks that affect the performance of the business model (and the financial assets held within that business model) and its strategy of how those risks are managed;
• how managers of the business are compensated (e.g. whether compensation is based on the fair value of the assets managed or the contractual cash flows collected); and
• the frequency, volume and timing of sales in prior periods, the reasons for such sales and its expectations about future sales activity. However, information about sales activity is not considered in isolation, but as part of an overall assessment of how the Group’s stated objective for managing the financial assets is achieved and how cash flows are realised.
165Financials
2. Summary of Significant Accounting Policies (continued)
2.7 Non-Derivative Financial Assets (continued)
(B) Policy Applicable from 1 January 2018 (continued)Classification and Measurement of Financial Assets (continued)(a) Business Model Assessment (continued)Financial assets that are held for trading and whose performance is evaluated or managed on a fair value basis are measured at FVTPL because they are neither within the business model to hold to collect contractual cash flows, nor within the business model to hold both to collect contractual cash flows and to sell financial assets.
(b) Assessment of Whether Contractual Cash Flows are Solely Payments of Principal and Interest
For the purposes of this assessment, ‘principal’ is defined as the fair value of the financial asset on initial recognition. ‘Interest’ is defined as consideration for the time value of money and for the credit risk associated with the principal amount outstanding during a particular period of time and for other basic lending risks and costs (e.g. liquidity risk and administrative costs), as well as profit margin.
2.7.5 Debt Instruments Measured at Amortised CostA debt financial instrument is measured at amortised cost if it meets both of the following conditions and is not designated at FVTPL: • it is held within a business model whose objective is to hold
the asset until maturity to collect contractual cash flows; and • its contractual terms give rise to cash flows that are solely
payments of principal and interest on the principal outstanding.
Debt instruments classified at amortised cost are subject to the expected credit loss requirements in accordance with SFRS(I) 9. Interest earned whilst holding the financial assets is included in interest income.
2.7.6 Debt Instruments Measured at FVOCIA debt financial instrument is measured at FVOCI if it meets both of the following conditions and is not designated at FVTPL: • it is held within a business model whose objective is achieved
by both collecting contractual cash flows and selling the financial asset; and
• its contractual terms give rise to cash flows that are solely payments of principal and interest on the principal outstanding.
Debt instruments classified at FVOCI are subject to the expected credit loss requirements in accordance with SFRS(I) 9. Interest earned whilst holding the financial assets is included in interest income.
At the balance sheet date, the Group recognises unrealised fair value gains and losses on revaluing these assets in other comprehensive income (OCI) and presents the cumulative gains
and losses in fair value reserve within equity, except for the recognition of impairment gains or losses, interest income and foreign exchange gains and losses, which are recognised in the income statement. At maturity or upon disposal, the cumulative gain or loss previously recognised in OCI is reclassified from fair value reserve to income statement.
2.7.7 Debt Instruments Measured at FVTPLDebt instruments that do not meet the requirements to be measured at amortised cost or at FVOCI are measured at FVTPL. At the balance sheet date, the Group recognises realised and unrealised gains and losses as trading income in the income statement. Interest earned while holding the assets are included in interest income.
2.7.8 Designation at FVTPLOn initial recognition, the Group may irrevocably designate a financial asset, which otherwise meets the requirements to be measured at amortised cost or at FVOCI, at FVTPL if doing so, it eliminates or significantly reduces an accounting mismatch that would otherwise arise. Upon designation, financial assets are measured at fair value on each balance sheet date until maturity or derecognition. Realised and unrealised fair value changes are recognised in the income statement.
2.7.9 Equity InstrumentsEquity instruments held for trading are classified at FVTPL. Equity instruments that are not held for trading may be classified as FVOCI based on an irrevocable election on initial recognition on an investment-by-investment basis.
At the balance sheet date, realised and unrealised fair value gains or losses on revaluing the equity instruments classified at FVTPL are recognised in the income statement. Realised and unrealised fair value gains or losses on revaluing the equity instruments classified at FVOCI are recognised in other comprehensive income and are never reclassified to the income statement.
Dividend earned whilst holding the equity instruments classified at FVTPL is reported as dividend income in the income statement. Dividend from equity instruments classified at FVOCI is recognised as dividend income in the income statement unless the dividend clearly represents a recovery of part of the cost of the investment.
2.7.10 ReclassificationFinancial assets are not reclassified subsequent to their initial recognition, except in the period when the Group changes its business model for managing its financial assets.
2.8 Derivative Financial InstrumentsExisting hedging relationships designated under FRS 39 as at 31 December 2017 are treated as continuing hedges and hedge documentations were aligned accordingly to the requirements of SFRS(I) 9.
166 OCBC Annual Report 2018
Notes to the Financial Statements For the financial year ended 31 December 2018
2. Summary of Significant Accounting Policies (continued)
2.8 Derivative Financial Instruments (continued)
All derivative financial instruments are recognised at fair value on the balance sheet and classified as derivative receivables when their fair value is favourable and as derivative payables when their fair value is unfavourable. Fair values reflect the exit price of the instrument and include adjustments to take into account the credit risk of the Group and the counterparty where appropriate. Embedded derivatives are separated from the host contract and accounted for separately if the host contract is not a financial asset and certain criteria are met.
The Group enters into derivative transactions for trading purposes, and the realised and unrealised gains and losses are recognised in the income statement. The Group also enters into hedging derivative transactions to manage exposures to interest rate, foreign currency and credit risks arising from its core banking activities of lending and accepting deposits. The Group applies fair value, cash flow or net investment hedge accounting when the transactions meet the specified criteria for hedge accounting.
Before the Group applies any hedge accounting, the Group determines whether an economic relationship exists between the hedged item and the hedging instrument by considering qualitative characteristics of these items and wherever necessary, supported by quantitative analysis. In its qualitative assessment, the Group considers whether the critical terms of its hedged item and the hedging instrument are closely aligned and evaluates whether the hedged item and hedging instrument respond similarly to similar risks. For all hedge accounting of the Group, where economic hedge relationships meet the hedge accounting criteria, the Group establishes its hedge ratio by aligning the principal amount of the hedged instrument to the extent of its hedged item.
In a fair value hedging relationship, the Group mainly uses interest rate swaps and cross currency swaps to hedge its exposure to changes in the fair value of fixed rate instruments and its foreign currency risk exposure. For qualifying fair value hedges, changes in the fair values of the derivative and of the hedged item relating to the hedged risk are recognised in the income statement. If the hedge relationship is terminated, the fair value adjustment to the hedged item continues to be reported as part of the carrying amount of the asset or liability and is amortised to the income statement as a yield adjustment over the remaining maturity of the asset or liability. For fair value portfolio hedge of interest rate exposure, adjustment will be on the straight-line method if amortisation using a re-calculated effective interest rate is not practicable.
The risk exposure for cash flow hedge is managed similarly to that for fair value hedges. The Group uses interest rate swaps to hedge the variability in the cash flows that is related to a variable or fixed rate asset or liability, resulting from changes in interest
rate risk. For qualifying cash flow hedges, the effective portion of the change in fair value of the derivative is taken to the hedge reserve in equity. The gain or loss relating to the ineffective portion is recognised immediately in the income statement. Amounts accumulated in the hedge reserve remain in equity until the forecasted transaction is recognised in the income statement. When the forecasted transaction is no longer expected to occur, the cumulative gain or loss in the hedge reserve is immediately transferred to the income statement.
“Hedge ineffectiveness” represents the amount by which the changes in the fair value of the hedging derivative differ from changes in the fair value of the hedged item. The amount of ineffectiveness is recognised immediately in profit or loss. The sources of ineffectiveness for both fair value hedges and cash flow hedges include imperfect relationship or matching between the hedging instrument and the risk being hedged as well as the effect of credit risk existing in the hedging instrument.
The hedged risk in the Group’s net investment hedges is the foreign currency exposure that arises from a net investment in subsidiaries and foreign operations that have a different functional currency from that of the Group. The risk arises from the fluctuation in spot exchange rates between the functional currency of the subsidiaries and the Bank’s functional currency. The Group uses a mixture of derivative financial instruments and liabilities to manage its foreign currency exposure in its net investment hedges. For hedges of net investments in foreign operations which are accounted in a similar way as cash flow hedges, the gain or loss relating to the effective portion of the hedging instrument is recognised in equity and that relating to the ineffective portion is recognised in the income statement. Gains and losses accumulated in equity are transferred to income statement on disposal of the foreign operations. The source of ineffectiveness for the Group’s net investment hedge arises from a foreign currency exposure that is denominated in the pegged currency.
2.9 Property, Plant and Equipment Property, plant and equipment are stated at cost less accumulated depreciation and impairment losses. The cost of an item of property, plant and equipment includes the purchase price and costs directly attributable to bringing the asset to the location and condition necessary for it to be capable of operating in the manner intended by management.
Subsequent expenditure relating to property, plant and equipment is added to the carrying amount of the asset when it is probable that future economic benefits, in excess of the standard of performance of the asset before the expenditure was made, will flow to the Group and the cost can be reliably measured. Other subsequent expenditure is recognised in the income statement during the financial year in which the expenditure is incurred.
The residual values, useful lives and depreciation methods of property, plant and equipment are reviewed and adjusted as appropriate, at each balance sheet date, to ensure that they reflect the expected economic benefits derived from these assets.
167Financials
2. Summary of Significant Accounting Policies (continued)
2.9 Property, Plant and Equipment (continued)
Property, plant and equipment are depreciated on a straight-line basis over their estimated useful lives as follows: Furniture and fixtures – 5 to 10 yearsOffice equipment – 5 to 10 yearsComputers – 3 to 10 yearsRenovation – 3 to 5 yearsMotor vehicles – 5 years
Freehold land and leasehold land with leases of more than 100 years to expiry are not depreciated. Buildings and other leasehold land are depreciated over 50 years or the period of the lease, whichever is shorter.
An item of property, plant and equipment is de-recognised upon disposal or when no future economic benefit is expected from its use. Any gain or loss arising on de-recognition of the asset is included in the income statement in the year the asset is de-recognised.
2.10 Investment PropertyInvestment property is property held either for rental income or for capital appreciation or for both. Investment properties, other than those held under the Group’s life insurance funds, are stated at cost less accumulated depreciation and impairment losses. Freehold land and leasehold land with leases of more than 100 years to expiry are not depreciated. Buildings and other leasehold land are depreciated over 50 years or the period of the lease, whichever is shorter.
Investment property held under the Group’s life insurance fund is stated at fair value at the balance sheet date and collectively form an asset class which is an integral part of the overall investment strategy for the asset-liability management of the life insurance business. The fair value of the investment property is determined based on objective valuations undertaken by independent valuers at the reporting date. Changes in the carrying amount resulting from revaluation are recognised in the income statement of the life insurance fund.
2.11 Goodwill and Intangible Assets2.11.1 Goodwill Goodwill on acquisition of subsidiaries represents the excess of the consideration transferred, the amount of any non-controlling interest in the acquiree and the acquisition-date fair value of any previously held equity interest over the fair value of the identifiable net assets acquired.
Goodwill is stated at cost less impairment loss. Impairment test is carried out annually, or when there is indication that the goodwill may be impaired.
Gains or losses on disposal of subsidiaries and associates include the carrying amount of goodwill relating to the entity sold.
2.11.2 Intangible AssetsIntangible assets are separately identifiable intangible items arising from acquisitions and are stated at cost less accumulated amortisation and impairment losses. Intangible assets with finite useful lives are amortised over their estimated useful lives. The estimated useful lives range from 10 to 20 years. The useful life of an intangible asset is reviewed at least at each financial year end.
2.12 Non-Current Assets Held for SaleNon-current assets that are expected to be recovered through sale rather than through continuing use are classified as held for sale. Immediately before classification as held for sale, the assets are measured in accordance with the Group’s accounting policies. Thereafter, the assets are generally measured at the lower of their carrying amount and fair value less cost to sell.
2.13 Impairment of Assets(I) Financial Assets(A) Policy Applicable before 1 January 2018The Group assesses at each balance sheet date whether there is objective evidence that a financial asset or a group of financial assets is impaired.
2.13.1 Loans and Receivables/Financial Assets Carried at Amortised Cost
Loans are assessed for impairment on a loan-by-loan basis except for homogeneous loans below a certain materiality threshold, which are grouped together according to their risk characteristics and collectively assessed, taking into account the historical loss experience on such loans.
A specific allowance is established when the present value of recoverable cash flows for a loan is lower than the carrying amount of the loan. Portfolio allowances are set aside for unimpaired loans based on portfolio and country risks, as well as industry practices. A minimum 1% portfolio allowance is maintained by the Group in accordance with the transitional arrangement set out in MAS Notice 612.
Specific allowances are written back to the income statement when the loans are no longer impaired or when the loss on loan is determined to be less than the amount of specific allowance previously made. Loans are written-off when recovery action has been instituted and the loss can be reasonably determined.
2.13.2 Other Non-Derivative Financial AssetsImpairment of other non-derivative financial assets is calculated as the difference between the asset’s carrying amounts and the estimated recoverable amount. For equity investments classified as available-for-sale, when there is a significant or prolonged decline in the fair value of the asset below its cost, the cumulative loss (measured as the difference between the acquisition cost and the current fair value, less any impairment loss on that asset previously recognised in the income statement) is removed from the fair value reserve within equity and recognised in the income statement.
168 OCBC Annual Report 2018
Notes to the Financial Statements For the financial year ended 31 December 2018
2. Summary of Significant Accounting Policies (continued)
2.13 Impairment of Assets (continued)(I) Financial Assets (continued)(A) Policy Applicable before 1 January 2018 (continued)2.13.2 Other Non-Derivative Financial Assets (continued)Impairment losses on equity investments recognised in the income statement are not reversed through the income statement, until the investments are disposed of. For debt investments, reversal of an impairment loss that can be related objectively to an event occurring after the impairment loss was recognised, is recognised in the income statement.
(B) Policy Applicable from 1 January 20182.13.3 Financial AssetsSFRS(I) 9 replaces the existing FRS 39 loan provisioning requirements as modified by MAS Notice 612 with a forward-looking expected credit loss (ECL) model.
2.13.3.1 ScopeUnder SFRS(I) 9, the expected credit loss model is applied to debt financial assets classified at amortised cost or FVOCI, except for equity investments, and certain off-balance sheet loan commitments and financial guarantees which were previously provided for under FRS 37 Provisions, Contingent Liabilities and Contingent Assets.
2.13.3.2 Expected Credit Loss Impairment ModelUnder SFRS(I) 9, credit loss allowances are measured on each reporting date according to a three-stage expected credit loss impairment model:• Stage 1 – On initial recognition, expected credit loss will be
that resulting from default events that are possible over the next 12 months (12-month ECL).
• Stage 2 – Following a significant increase in credit risk of the financial assets since its initial recognition, the credit loss allowance will be that resulting from default events that are possible over the expected life of the asset (Lifetime ECL).
• Stage 3 – When a financial asset exhibits objective evidence of impairment and is considered to be credit-impaired, the credit loss allowance will be the full lifetime expected credit loss.
2.13.3.3 Measurement ECLs are a probability-weighted estimate of credit losses. They are measured as follows:(a) financial assets that are not credit-impaired at the reporting
date: as the present value of all cash shortfalls (i.e. the difference between the cash flows due to the entity in accordance with the contract and the cash flows that the Group expects to receive);
(b) financial assets that are credit-impaired at the reporting date: as the difference between the gross carrying amount and the present value of estimated future cash flows;
(c) undrawn loan commitments: as the present value of the difference between the contractual cash flows that are due to the Group if the commitment is drawn down and the cash flows that the Group expects to receive; and
(d) financial guarantee contracts: the expected payments to reimburse the holder less any amounts that the Group expects to recover.
The key inputs used in the measurement of ECL are:• Probability of default (PD) – This is an estimate of the
likelihood of default over a given time horizon• Exposure at default (EAD) – This is an estimate of the exposure
at a future default date, taking into account expected changes in the exposure after the reporting date, including repayments of principal and interest as well as expected drawdowns on committed facilities
• Loss given default (LGD) – This is an estimate of the loss arising on default. It is based on the difference between the contractual cash flows due and those that the Group would expect to receive, including from any collateral.
ECL for exposures in Stage 1 is calculated by multiplying the 12-month PD by LGD and EAD. Lifetime ECL is calculated by multiplying lifetime PD by LGD and EAD.
Loans and bills receivable that are collectively assessed are grouped on the basis of shared credit risk characteristics such as account loan type, industry, geographical location of the borrower, collateral type and other relevant factors.
All key inputs (PD, LGD and EAD) used to estimate Stage 1 and Stage 2 credit loss allowances are modelled based on three macroeconomic scenarios (or changes in macroeconomic variables) that are most closely correlated with credit losses in the relevant portfolio.
The three macroeconomic scenarios represent a most likely “Base” outcome, and two other less likely “Upside” and “Downside” scenarios. These scenarios are probability-weighted and underlying key macroeconomic assumptions are based on independent external and in-house views. The assumptions are subject to regular management reviews to reflect current economic situations.
Each macroeconomic scenario used in the expected credit loss calculation includes a projection of all relevant macroeconomic variables used in the models for the lifetime period, reverting to long-run averages generally after 3 to 5 years periods. Depending on their usage in the models, macroeconomic variables are projected at a country or more granular level which differ by portfolio. The primary macroeconomic variables adopted are Gross Domestic Product, Unemployment rate, Property Price Index and Interest rate.
The definition of default used in the measurement of expected credit losses is consistent with the definition of default used for credit risk management purposes. The default definition has been applied consistently to model the PD, LGD and EAD throughout Group’s expected credit loss calculations.
The Group considers a financial asset to be in default by assessing both quantitative and qualitative criteria such as days past due and the terms of financial covenants. A default occurs when the borrower or bond issuer is unlikely to pay its credit obligations to the Group in full, without recourse by the Group to actions such as realising security (if any is held) or when the financial asset is more than 90 days past due.
169Financials
2. Summary of Significant Accounting Policies (continued)
2.13 Impairment of Assets (continued)(B) Policy Applicable from 1 January 2018 (continued)2.13.3 Financial Assets (continued)2.13.3.3 Measurement (continued)The maximum period considered when estimating ECLs is the maximum contractual period over which the Group is exposed to credit risk.
Financial assets are written off against their related impairment allowances when all feasible recovery actions have been exhausted or when the recovery prospects are considered remote.
2.13.3.4 Movement Between StagesMovements between Stage 1 and Stage 2 are based on whether an instrument’s credit risk as at the reporting date has increased significantly since its initial recognition.
In accordance with SFRS(I) 9, financial assets are classified in Stage 2 where there is a significant increase in credit risk since initial recognition, where the credit loss allowance will be measured using lifetime ECL.
The Group considers both qualitative and quantitative parameters in the assessment of whether this is a significant increase in credit risk. These include the following:(a) The Group has established thresholds for significant increases
in credit risk based on both a relative and absolute change in lifetime PD relative to initial recognition.
(b) The Group conducts qualitative assessment to ascertain if there has been significant increase in credit risk.
(c) The Group uses days past due as a further indication of significant increase in credit risk.
Movements between Stage 2 and Stage 3 are based on whether financial assets are credit-impaired as at the reporting date. The determination of whether a financial asset is credit-impaired under SFRS(I) 9 will be based on objective evidence of impairment.
The assessments for a significant increase in credit risk since initial recognition and credit-impairment are performed independently as at each reporting period. Assets can move in both directions through the stages of the impairment model. After a financial asset has migrated to Stage 2, if it is no longer considered that credit risk has significantly increased relative to initial recognition in a subsequent reporting period, it will move back to Stage 1. A modification of the terms of a financial asset that does not result in derecognition will result in the financial asset being transferred out of Stage 3 if the indicators of it being identified as credit-impaired is no longer met and that the evidence for its transfer out of Stage 3 solely relates to events such as up-to-date and timely payment occurring in the subsequent periods.
If a modified financial asset results in derecognition, the new financial asset will be recognised under Stage 1, unless it is assessed to be credit-impaired at time of the modification.
2.13.3.5 Regulatory FrameworkUnder the revised MAS 612 requirement, the Group is required to maintain a minimum regulatory loss allowance (MRLA) of 1% of the gross carrying amount of selected credit exposures, net of collateral. Where the accounting loss allowance computed under SFRS(I) 9 is less than the MRLA, the Group shall maintain the difference in a non-distributable regulatory loss allowance reserve (RLAR) account through the appropriation of revenue reserves to meet the minimum 1% amount. Where the aggregated accounting loss allowance and RLAR exceeds the MRLA, the Group may transfer the excess amount in the RLAR to revenue reserves.
(II) Other Assets2.13.4 GoodwillFor the purpose of impairment testing, goodwill is allocated to each of the Group’s Cash Generating Units (CGU) expected to benefit from synergies of the business combination. The Group’s CGUs correspond with the business segments identified in the primary segment report.
An impairment loss is recognised in the income statement when the carrying amount of the CGU, including the goodwill, exceeds the recoverable amount of the CGU. The CGU’s recoverable amount is the higher of its fair value less cost to sell and its value in use. Impairment loss on goodwill cannot be reversed in subsequent periods.
2.13.5 Investments in Subsidiaries and Associates Property, Plant and Equipment Investment Property Intangible Assets
Investments in subsidiaries and associates, property, plant and equipment, investment property and intangible assets, are reviewed for impairment on the balance sheet date or whenever there is any indication that the carrying amount of an asset may not be recoverable. If such an indication exists, the carrying amount of the asset is written down to its recoverable amount (i.e. the higher of the fair value less cost to sell and the value in use).
The impairment loss is recognised in the income statement, and is reversed only if there has been a change in the estimates used to determine the asset’s recoverable amount since the last impairment loss was recognised. The carrying amount of an asset is increased to its revised recoverable amount, provided that this amount does not exceed the carrying amount that would have been determined (net of amortisation or depreciation) had no impairment loss been recognised for the asset in prior years.
2.14 Insurance ReceivablesInsurance receivables are recognised when due. They are measured at initial recognition at the fair value received or receivable. Subsequent to initial recognition, insurance receivables are measured at amortised cost, using the effective interest method. Prior to 1 January 2018, the carrying amount of insurance receivables is reviewed for impairment whenever events or circumstances indicate that the carrying amount may not be recoverable, with the impairment loss recognised in the income statement. From 1 January 2018, a loss allowance is measured at an amount equal to lifetime expected credit losses, with the impairment loss recognised in the income statement. Insurance receivables are derecognised when the derecognition criterion for financial assets has been met.
170 OCBC Annual Report 2018
Notes to the Financial Statements For the financial year ended 31 December 2018
2. Summary of Significant Accounting Policies (continued)
2.15 Financial LiabilitiesFinancial liabilities are initially recognised at fair value plus transaction costs, and are subsequently measured at amortised cost using the effective interest method, except when the liabilities are held at fair value through profit or loss.
For financial liabilities designated at fair value, gains and losses arising from changes in fair value are taken directly to the net trading income line in the income statement except for changes in fair value attributable to the Group’s own credit risk where it is presented directly within other comprehensive income. Amounts recorded in OCI related to this credit risk are not subject to recycling in profit or loss, but are transferred to unappropriated profit when realised. Financial liabilities are held at fair value through the income statement when:(a) they are acquired or incurred for the purpose of selling or
repurchasing in the near term;(b) the fair value option designation eliminates or significantly
reduces accounting mismatch that would otherwise arise; or(c) the financial liability contains an embedded derivative that
would need to be separately recorded.
2.16 Provisions and Other LiabilitiesProvisions are recognised when there is a present legal or constructive obligation as a result of past events, it is probable that an outflow of resources will be required to settle the obligation, and a reliable estimate of the amount can be made. Where a provision is expected to be reimbursed, for example under an insurance contract, the reimbursement is recognised as a separate asset only when it is virtually certain that reimbursement will be received.
Provision for insurance agents’ retirement benefits, including deferred benefits, is calculated according to terms and conditions stipulated in the respective agent’s agreement. The deferred/retirement benefit accumulated at the balance sheet date includes accrued interest.
Policy benefits are recognised when a policyholder exercises the option to deposit the survival benefits with the life insurance subsidiaries when the benefit falls due. Policy benefits are interest bearing at rates adjusted from time to time by the life insurance subsidiaries. Interest payable on policy benefits is recognised in the income statements as incurred.
2.17 Insurance ContractsInsurance contracts are those contracts where the Group, mainly the insurance subsidiaries of GEH, has accepted significant insurance risk from the policyholders by agreeing to compensate the policyholders if a specified uncertain future event (the insured event) adversely affects the policyholders. As a general guideline, the Group determines whether it has significant insurance risk, by comparing benefits paid with benefits payable if the insured event did not occur. Insurance contracts can also transfer financial risk.
Once a contract has been classified as an insurance contract, it remains an insurance contract for the remainder of its lifetime, even if the insurance risk reduces significantly during this period, unless all rights and obligations are extinguished or expire.
For the purpose of SFRS(I) 4 Insurance Contracts, the Group adopts maximum policy benefits as the proxy for insurance risk and cash surrender value as the proxy for realisable value of the insurance contract on surrender. The Group defines insurance risk to be significant when the ratio of the insurance risk over the deposit component is not less than 105% of the deposit component at inception of the insurance contract. Based on this definition, all policy contracts issued by insurance subsidiaries within the Group are considered insurance contracts as at the balance sheet date.
Certain subsidiaries within the Group, primarily GEH and its subsidiaries (GEH Group), write insurance contracts in accordance with insurance regulations prevailing in their respective jurisdictions. Disclosures on the various insurance contract liabilities are classified into the principal components, as follows:(a) Life insurance contract liabilities, comprising · Participating Fund contract liabilities; · Non-participating Fund contract liabilities; and · Investment-linked Fund contract liabilities.(b) Non-life insurance contract liabilities(c) Reinsurance contracts
The Group does not adopt a policy of deferring acquisition costs for its insurance contracts.
Life Insurance Contract LiabilitiesInsurance contracts are recognised and measured in accordance with the terms and conditions of the respective contracts and are based on guidelines laid down by the respective insurance regulations. Premiums, claims and benefit payments, acquisition and management expenses and valuation of future policy benefit payments or premium reserves as the case may be, are recognised in the income statements of the respective insurance funds.
Life insurance liabilities are recognised when contracts are entered into and premiums are charged. These liabilities are measured by using the gross premium valuation method. The liability is determined as the sum of the present value of future guaranteed and, where relevant, appropriate level of non-guaranteed benefits, less the present value of future gross considerations arising from the policy discounted at the appropriate discount rate. The liability is based on best estimate assumptions and with due regard to significant recent experience. An appropriate risk margin allowance for adverse deviation from expected experience is made in the valuation of non-participating life policies, the guaranteed benefit liabilities of participating life policies and liabilities of non-unit investment-linked policies.
The liability in respect of participating insurance contract is based on the higher of the guaranteed benefit liabilities or the total benefit liabilities at the contract level derived as stated above.
171Financials
2. Summary of Significant Accounting Policies (continued)
2.17 Insurance Contracts (continued)Life Insurance Contract Liabilities (continued)In the case of life policies where part of, or all the premiums are accumulated in a fund, the accumulated amounts, as declared to policyholders are shown as liabilities if the accumulated amounts are higher than the amounts as calculated using the gross premium valuation method.
In the case of short-term life policies covering contingencies other than death or survival, the liability for such life insurance contracts comprises the provision for unearned premiums and unexpired risks, together with provision for claims outstanding, which includes an estimate of the incurred claims that have not yet been reported to the Group.
Adjustments to liabilities at each reporting date are recorded in the respective income statements. Profits originating from margins for adverse deviations on run-off contracts are recognised in the income statements over the lives of the contracts, whereas losses are fully recognised in the income statements during the first year of run-off.
The liability is extinguished when the contract expires, is discharged or is cancelled.
The Group issues a variety of short and long duration insurance contracts which transfer risks from the policyholders to the Group to protect policyholders from the consequences of insured events such as death, disability, illness, accident, including survival. These contracts may transfer both insurance and investment risk or insurance risk alone, from the policyholders to the Group.
For non-participating policy contracts, both insurance and investment risks are transferred from policyholders to the Group. For non-participating policy contracts other than medical insurance policy contracts, the payout to policyholders upon the occurrence of the insured event is pre-determined and the transfer of risk is absolute. For medical insurance policy contracts, the payout is dependent on the actual medical costs incurred upon the occurrence of the insured event.
Contracts which transfer insurance risk alone from policyholders to the Group are commonly known as investment-linked policies. As part of the pricing for these contracts, the insurance subsidiaries within the Group include certain charges and fees to cover for expenses and insured risk. The net investment returns derived from the variety of investment funds as selected by the policyholders accrue directly to the policyholders.
A significant portion of insurance contracts issued by subsidiaries within the Group contain discretionary participating features. These contracts are classified as participating policies. In addition to guaranteed benefits payable upon insured events associated with human life such as death or disability, the contracts entitle the policyholder to receive benefits, which could vary according to investment performance of the fund. The Group does not recognise the guaranteed components separately from the discretionary participating features.
Profits to shareholders from the participating fund are allocated from the surplus or surplus capital, based on the results of the annual actuarial valuation (such valuation also determines the liabilities relating to all the policyholders’ benefits of the participating fund). Parameters for the valuation are set out in the insurance regulations governing the Group’s insurance subsidiaries in the respective jurisdictions in which they operate. The provisions in the Articles of Association of the Group’s insurance subsidiaries are applied in conjunction with the prescriptions in the respective insurance regulations, such that the distribution for any year to policyholders of the participating fund and shareholders approximate 90% and 10% respectively of total distribution from the participating fund. The annual declaration of the quantum of policyholders’ bonus and correspondingly the profits to shareholders to be distributed out of the participating fund is approved by the Board of Directors of each insurance subsidiary under the advice of the Appointed Actuary of the respective subsidiary, in accordance with the insurance regulations and the Articles of Association of the respective subsidiaries.
The valuation of insurance contract liabilities is determined according to:(a) Singapore Insurance Act (Chapter 142), Insurance (Valuation
and Capital) Regulations 2004 for insurance funds regulated in Singapore (MAS Regulations); and
(b) Risk-based Capital Framework for Insurers for insurance funds regulated in Malaysia.
Each insurance subsidiary within the Group is required under the respective insurance regulations and accounting standards to carry out a liability adequacy test using current estimates of future cash flows relating to its insurance contracts; the process is referred to as the gross premium valuation or bonus reserve valuation, depending on the jurisdiction in which the insurance subsidiary operates.
The liability adequacy test is applied to both the guaranteed benefits and the discretionary participating features; the assumptions are based on best estimates, the basis adopted is prescribed by the insurance regulations of the respective jurisdiction in which the insurance subsidiary operates. The Group performs liability adequacy tests on its actuarial reserves to ensure that the carrying amount of provisions is sufficient to cover estimated future cash flows. When performing the liability adequacy test, the Group discounts all contractual cash flows and compares this amount against the carrying amount of the liability. Any deficiency is charged to the income statement.
The Group issues investment-linked contracts as insurance contracts which insure human life events such as death or survival over a long duration; coupled with an embedded derivative linking death benefit payments on the contract to the value of a pool of investments within the investment-linked fund set up by the insurance subsidiary. As this embedded derivative meets the definition of an insurance contract, it need not be separately accounted for from the host insurance contract. The liability valuation for such contracts is adjusted for changes in the fair value of the underlying assets at frequencies as stated under the terms and conditions of the insurance contracts.
172 OCBC Annual Report 2018
Notes to the Financial Statements For the financial year ended 31 December 2018
2. Summary of Significant Accounting Policies (continued)2.17 Insurance Contracts (continued)Life Insurance Contract Liabilities (continued)The table below provides the key underlying assumptions used for valuation of life insurance contract liabilities.
Singapore Malaysia
Valuation method (1)
Gross premium valuation
For Participating Fund, the method that produces the higher reserves of:(i) Total assets backing policy benefits;
(ii) Guaranteed and non-guaranteed cash flows discounted at the appropriate rate of return reflecting the strategic asset allocation; and
(iii) Guaranteed cash flows discounted using the interest rate outlined under ‘Interest rate’ item (i) below.
Gross premium valuation
For Participating Fund, the method that produces the higher reserves of: (i) Guaranteed and non-guaranteed cash flows
discounted at the appropriate rate of return reflecting the strategic asset allocation; and
(ii) Guaranteed cash flows discounted using Malaysia Government Securities (MGS) zero coupon spot yields (as outlined below).
Interest rate (1) (i) Singapore Government Securities (SGS) zero coupon spot yields for cash flows up to year 15, an interpolation of the 15-year Singapore Government Securities zero coupon spot yield and the Long Term Risk Free Discount Rate (LTRFDR) for cash flows between 15 and 20 years, and the LTRFDR for cash flows year 20 and after.
(ii) For Universal Life policies denominated in US Dollar:
a) Observable market yields of US Treasury Yield Curve Rates for cash flows up to year 30;
b) Ultimate forward rate (UFR) of 3.5% applicable for cash flows beyond 60 years; and
c) Extrapolated yields in between.
Data source: Bloomberg
Malaysia Government Securities yields determined based on the following:(i) For cash flows with duration less than 15 years,
Malaysia Government Securities zero coupon spot yields of matching duration.
(ii) For cash flows with duration 15 years or more, Malaysia Government Securities zero coupon spot yields of 15 years to maturity.
Data source: Bond Pricing Agency Malaysia
Mortality, Disability, Dread disease, Expenses, Lapse and surrenders (1)
Participating Fund:(i) Best estimates for Gross Premium Valuation
method (ii); (ii) Best estimates plus provision for adverse
deviation (PAD) for Gross Premium Valuation method (iii).
Non-Participating and Non-Unit reserves of Investment-linked Fund:Best estimates plus provision for adverse deviation (PAD).
Data source: Internal experience studies
Participating Fund:(i) Best estimates for Gross Premium Valuation
method (i);(ii) Best estimates plus provision for risk of adverse
deviation (PRAD) for Gross Premium Valuation method (ii).
Non-participating and Non-unit reserves of Investment-linked Fund: Best estimates plus provision for risk of adverse deviation (PRAD).
Data source: Internal experience studies
(1) Refer to Note 2.25 on Critical accounting estimates and judgements.
173Financials
2. Summary of Significant Accounting Policies (continued)
2.17 Insurance Contracts (continued)Non-Life Insurance Contract LiabilitiesThe Group issues short term property and casualty contracts which protect the policyholders against the risk of loss of property premises due to fire or theft in the form of fire or burglary insurance contracts and/or business interruption contracts; risk of liability to pay compensation to a third party for bodily harm or property damage in the form of public liability insurance contracts. The Group also issues short term medical and personal accident non-life insurance contracts.
Non-life insurance contract liabilities include premium liabilities and claim liabilities.
Outstanding claims provisions are based on the estimated ultimate cost of all claims incurred but not settled at the balance sheet date, whether reported or not, together with related claims handling costs and reduction for the expected value of salvage and other recoveries. Delays can be experienced in the notification and settlement of certain types of claims, therefore, the ultimate cost of these claims cannot be known with certainty at the balance sheet date. The liabilities are calculated at the reporting date using a range of standard actuarial claim projection techniques based on empirical data and current assumptions that may include a margin for adverse deviation. The liabilities are not discounted for the time value of money. No provision for equalisation or catastrophe reserves is recognised. The liabilities are derecognised when the contracts expire, are discharged or are cancelled.
Premium liabilities are the provision of unearned premiums representing premiums received for risks that have not yet expired at the reporting date. The provision is recognised when contracts are entered into and premiums are charged. The provision is released over the term of the contract and is recognised as premium income. Further provisions are made if expected future cash flow of unexpired insurance contracts exceed the unearned premiums of these contracts.
The valuation of non-life insurance claim liabilities at the balance sheet date is based on best estimates of the ultimate settlement cost of claims plus a provision for adverse deviation. For Singapore and Malaysia, the valuation methods used include the Paid Claim Development Method, the Incurred Claim Development Method, the Paid Bornhuetter-Ferguson Method, the Incurred Bornhuetter-Ferguson Method and the Expected Loss Ratio Method. As required by the local insurance regulations, the provision for adverse deviation is set at 75% level of sufficiency for both Singapore and Malaysia. The claim liabilities are not discounted for the time value of money. No provision for equalisation or catastrophe reserves is recognised.
Reinsurance ContractsThe Group cedes insurance risk in the normal course of business for all of its businesses. Reinsurance assets represent balances
due from reinsurers. These amounts are estimated in a manner consistent with the outstanding claims provision or settled claims associated with the reinsurer’s policies and are in accordance with the related reinsurance contract.
Reinsurance assets are reviewed for impairment at each reporting date or more frequently when an indication of impairment arises during the financial year. Impairment occurs when there is objective evidence as a result of an event that occurred after initial recognition of the reinsurance asset that the Group may not receive part or all outstanding amounts due under the terms of the contract. The impairment loss is recorded in the income statements. Gains or losses on reinsurance are recognised in the income statements immediately at the date of contract and are not amortised. Ceded reinsurance arrangements do not relieve the Group from its obligations to policyholders.
The Group also assumes reinsurance risk in the normal course of business for life insurance and non-life insurance contracts where applicable. Premiums and claims on assumed reinsurance are recognised as revenue or expenses in the same manner as they would be if the reinsurance were considered direct business, taking into account the product classification of the reinsured business. Reinsurance liabilities represent balances due to reinsurance companies. Amounts payable are estimated in a manner consistent with the related reinsurance contract. Premiums and claims are presented on a gross basis for both ceded and assumed reinsurance. Reinsurance assets or liabilities are derecognised when the contractual rights are extinguished or expire or when the contract is transferred to another party.
2.18 Unexpired Risk ReserveThe unexpired risk reserve (URR) represents the unearned portion of written premiums of general insurance policies, gross of commission payable to intermediaries attributable to periods after the balance sheet date. The change in provision for unearned premium is taken to the income statements in the order that revenue is recognised over the period of the risk exposure. Further provisions are made for claims anticipated under unexpired insurance contracts which may exceed the unearned premiums and the premiums due in respect of these contracts.
URR is computed using the 1/24th method and is reduced by the corresponding percentage of gross direct business, commissions and agency related expenses not exceeding limits specified by regulators in the respective jurisdictions in which the insurance entity operates.
2.19 Share Capital and DividendOrdinary shares, non-cumulative non-convertible preference shares and perpetual capital securities are classified as equity on the balance sheet.
Incremental costs directly attributable to the issue of new capital securities are shown in equity as a deduction from the proceeds.
174 OCBC Annual Report 2018
Notes to the Financial Statements For the financial year ended 31 December 2018
2. Summary of Significant Accounting Policies (continued)
2.19 Share Capital and Dividend (continued)Where share capital recognised as equity is repurchased (treasury shares), the amount of the consideration paid, including directly attributable costs, is presented as a deduction from equity. Treasury shares which are subsequently reissued, sold or cancelled, are recognised as changes in equity.
Interim dividends on ordinary shares and dividends on preference shares are recorded in the year in which they are declared payable by the Board of Directors. Final dividends are recorded in the year when the dividends are approved by shareholders at the annual general meeting.
2.20 Recognition of Income and Expense2.20.1 Interest Income and ExpenseInterest income or expense is recognised using the effective interest method.
The effective interest rate is the rate that exactly discounts estimated future cash payments or receipts through the expected life of the financial instrument to the gross carrying amount of the financial asset or amortised cost of the financial liability.
In calculating the interest income and expense, the effective interest rate is applied to the gross carrying amount of the asset (when the asset is not credit-impaired) or to the amortised cost of the liability. However, for financial assets that have become credit-impaired subsequent to initial recognition, interest income is calculated by applying the effective interest rate to the amortised cost of the financial asset. If the asset is no longer credit-impaired, then the calculation of interest income reverts to the gross basis.
2.20.2 Premiums and Commissions From Insurance BusinessLife Insurance BusinessFirst year premiums of insurance policies are recognised from inception date and subsequent renewal premiums are recognised when due. Single premiums are recognised on the dates on which the policies are effective. Premiums from the investment-linked business, universal life and certain Takaful non-participating products are recognised as revenue when payment is received.
Non-Life Insurance BusinessPremiums from the non-life insurance business are recognised as revenue upon commencement of insurance cover. Premiums pertaining to periods after the balance sheet date are adjusted through the unexpired risk reserve (Note 2.18). Commission is recognised as an expense when incurred, typically upon the risk underwritten as reflected in the premium recognised.
Premiums ceded out and the corresponding commission income from non-life insurance contracts are recognised in the income statement upon receipt of acceptance confirmation from the ceding company or in accordance with provisions incorporated in the treaty contracts. Premiums ceded out pertaining to periods after the balance sheet date are adjusted through the movement in unexpired risk reserve.
2.20.3 Fees and CommissionsThe Group earns fees and commissions from a range of services rendered to its customers. Fees and commissions are generally recognised upon the completion of a transaction. For services provided over a period of time or credit risk undertaken, fees and commissions are amortised over the relevant period. Expenses are offset against gross fees and commissions in the income statement only when they are directly related.
2.20.4 DividendsDividends from equity securities, subsidiaries and associates are recognised when the right to receive payment is established.
2.20.5 Rental Rental income on tenanted areas of the buildings owned by the Group is recognised in the income statement on a straight line basis over the term of the lease. Lease incentives granted are recognised as an integral part of the total rental income, over the term of the lease.
2.20.6 Employee Benefits The Group’s compensation package for staff consists of base salaries, allowances, defined contribution plans such as the Central Provident Fund, defined benefit plans, commissions, cash bonuses, and share-based compensation plans. These are recognised in the income statement when incurred. Employee leave entitlements are estimated according to the terms of employment contract and accrued on the balance sheet date.
For defined benefit plans, the liability recognised in the balance sheet is the present value of the defined benefit obligation at the balance sheet date less the fair value of plan assets, adjusted for unrecognised actuarial gains or losses and past service costs. Remeasurements of defined benefit plans are recognised in other comprehensive income in the period in which they arise.
Share-based compensation plans include the Bank’s Share Option Schemes, the Employee Share Purchase Plan (ESP Plan) and the Deferred Share Plan (DSP). Equity instruments granted are recognised as expense in the income statement based on the fair value of the equity instrument at the date of the grant. The expense is recognised over the vesting period of the grant, with corresponding entries to equity.
175Financials
2. Summary of Significant Accounting Policies (continued)
2.20 Recognition of Income and Expense (continued)
2.20.6 Employee Benefits (continued)At each balance sheet date, the Group revises its estimates of the number of equity instruments expected to be vested, and the impact of the change to the original estimates, if any, is recognised in the income statement, with a corresponding adjustment to equity over the remaining vesting period.
The Group accrues for interest on the monthly contributions made by employees to the savings-based ESP Plan. For the DSP, a trust is set up to administer the shares. The DSP Trust is consolidated in the Group’s financial statements.
Proceeds received upon the exercise of options and acquisition rights, net of any directly attributable transaction costs, are credited to share capital.
2.20.7 Lease Payments Payments made under operating leases (net of any incentives received from the lessor) are taken to the income statement on a straight-line basis over the term of the lease. When a lease is terminated before its expiry, any payment required to be made to the lessor by way of penalty is recognised as an expense in the period when the termination takes place.
Minimum lease payments made under finance leases are apportioned between the finance expense and the reduction of the outstanding liability. The expense is allocated to each period over the lease term so as to produce a constant periodic rate of interest on the remaining balance of the liability.
2.21 Income Tax Expense Income tax expense is recognised in the income statement except to the extent that it relates to items recognised directly in equity, in which case it is recognised in equity or in other comprehensive income.
Current tax is the expected tax payable on the taxable income for the year, using tax rates enacted or substantively enacted at the reporting date, and any adjustment to tax payable in respect of previous years.
Deferred tax is recognised using the balance sheet method, on temporary differences between the carrying amounts of assets and liabilities for financial reporting purposes and the amounts used for tax computation. Deferred tax is not recognised for the following temporary differences: the initial recognition of goodwill, the initial recognition of assets or liabilities in a
transaction that is not a business combination and that does not affect accounting or taxable profit, and differences relating to investments in subsidiaries, associates and joint ventures to the extent that they probably will not reverse in the foreseeable future. Deferred tax is measured at the tax rates that are expected to be applied to the temporary differences when they reverse, based on the laws that have been enacted or substantively enacted by the reporting date.
A deferred tax asset is recognised to the extent that it is probable that future taxable profits will be available for utilisation against the temporary differences. Deferred tax assets are reviewed at each reporting date and are reduced to the extent that it is no longer probable that the related tax benefit will be realised.
Unrecognised deferred tax assets are reassessed at each reporting date and recognised to the extent that it has become probable that future taxable profits will be available against which they can be used.
In determining the amount of current and deferred tax, the Group takes into account the impact of uncertain tax positions and whether additional taxes and interest may be due. The Group believes that its accruals for tax liabilities are adequate for all open tax years based on its assessment of many factors, including interpretations of tax law and prior experience. This assessment relies on estimates and assumptions and may involve a series of judgements about future events. New information may become available that causes the Group to change its judgement regarding the adequacy of existing tax liabilities; such changes to tax liabilities will impact tax expense in the period that such a determination is made.
2.22 Fiduciary ActivitiesThe Group acts as trustees and in other fiduciary capacities that result in the holding or placing of assets on behalf of individuals, trusts, retirement benefit plans and other institutions. The assets and income from these assets do not belong to the Group, and are therefore excluded from these financial statements.
2.23 Earnings Per ShareThe Group presents basic and diluted earnings per share data for its ordinary shares. Basic earnings per share is calculated by dividing the profit or loss attributable to ordinary shareholders of the Bank by the weighted-average number of ordinary shares outstanding during the year, adjusted for own shares held. Diluted earnings per share is determined by adjusting the profit or loss attributable to ordinary shareholders and the weighted-average number of ordinary shares outstanding, adjusted for own shares held, for the effects of all dilutive potential ordinary shares, which comprise share options granted to employees.
176 OCBC Annual Report 2018
Notes to the Financial Statements For the financial year ended 31 December 2018
2. Summary of Significant Accounting Policies (continued)
2.24 Segment ReportingThe Group’s business segments represent the key customer and product groups, as follows: Global Consumer/Private Banking, Global Corporate/Investment Banking, Global Treasury and Markets, Insurance and OCBC Wing Hang. All operating segments’ results are reviewed regularly by the senior management to make decisions about resources to be allocated to the segment and to assess its performance, and for which discrete financial information is available. In determining the segment results, balance sheet items are internally transfer priced and revenues and expenses are attributed to each segment based on internal management reporting policies. Transactions between business segments are recorded within the segment as if they are third party transactions and are eliminated on consolidation.
A geographical segment engages in providing products and services within a particular economic environment that is subject to different risks from those of other economic environments. Geographical segment information is prepared based on the country in which the transactions are booked and presented after elimination of intra-group transactions and balances.
2.25 Critical Accounting Estimates and Judgements
Certain estimates are made in the preparation of the financial statements. These often require management judgement in determining the appropriate methodology for valuation of assets and liabilities. A brief description of the Group’s critical accounting estimates is set out below.
2.25.1 Impairment of Financial AssetsPolicy Applicable before 1 January 20182.25.1.1 Impairment of LoansThe Group assesses impairment of loans by calculating the present value of future recoverable cash flows and the fair value of the underlying collaterals, which is determined based on credit assessment on a loan-by-loan basis. Homogeneous loans below a materiality threshold are grouped together according to their risk characteristics and collectively assessed taking into account the historical loss experience on such loans. The portfolio allowances set aside for unimpaired loans are based on management’s credit experiences and judgement, taking into account geographical and industry factors. A minimum 1% portfolio allowance is maintained by the Group in accordance with the transitional arrangement set out in MAS Notice 612. The assumptions and judgements used by management may affect these allowances.
2.25.1.2 Impairment of Available-for-Sale Financial AssetsThe Group follows the guidance of FRS 39 in determining when an investment is impaired. This determination requires significant judgement. The Group evaluates, among other factors, the duration and extent to which the fair value of an investment is
less than its cost; and the financial health and near-term business outlook of the investee, including factors such as industry and sector performance, changes in technology and operations, and financial cash flows.
Policy Applicable from 1 January 20182.25.1.3 Impairment of Financial AssetsIn determining whether the credit risk of the Group’s financial exposures has increased significantly since initial recognition, the Group will consider reasonable and supportable information that is readily available without undue cost or effort. This includes both quantitative and qualitative information such as the Group’s historical credit assessment experience and available forward-looking information. ECL estimates are produced for all relevant instruments based on probability-weighted forward-looking economic scenarios. The measurement of ECL is primarily calculated based on the probability of default, loss given default and exposure at default. These are parameters derived from internal rating models after adjusting them to be unbiased and forward-looking. Where internal rating models are not available, such estimates are based on comparable internal rating models after adjusting for portfolio differences.
The PD, LGD and EAD models which support these determinations are reviewed regularly in light of differences between loss estimates and actual loss experience. Given that SFRS(I) 9 requirements have only just been applied, the underlying models and their calibration, including how they react to forward-looking economic conditions, remain subject to review and refinement.
2.25.2 Fair Value EstimationFair value is derived from quoted market prices or valuation techniques which maximise the use of relevant observable inputs and minimise the use of unobservable inputs. The fair values of financial instruments that are not traded in an active market (for example, over-the-counter derivatives) are determined by using valuation techniques. Where unobservable data inputs have a significant impact on the value obtained from the valuation model, such a financial instrument is initially recognised at the transaction price, which is the best indicator of fair value. The difference between the transaction price and the model value, commonly referred to as “day one profit and loss” is not recognised immediately in the income statement.
The timing of recognition of deferred day one profit and loss is determined individually. It is amortised over the life of the transaction, released when the instrument’s fair value can be determined using market observable inputs, or when the transaction is derecognised.
2.25.3 Liabilities of Insurance Business The estimation of the ultimate liabilities arising from claims made under life and non-life insurance contracts is one of the Group’s critical accounting estimates. There are several sources of uncertainty that need to be considered in the estimation of the liabilities that the Group will ultimately be required to pay as claims.
177Financials
2. Summary of Significant Accounting Policies (continued)
2.25 Critical Accounting Estimates and Judgements (continued)
2.25.3 Liabilities of Insurance Business (continued)For life insurance contracts, estimates are made for future deaths, morbidity, disabilities, lapses, voluntary terminations, investment returns and administration expenses. The Group relies on standard industry reinsurance and national mortality and morbidity tables which represent historical experience, and makes appropriate adjustments for its respective risk exposures and portfolio experience in deriving the mortality and morbidity estimates. These estimates provide the basis for the valuation of the future benefits to be paid to policyholders, and to ensure adequate provisions which are monitored against current and future premiums. For those contracts that insure risk on longevity and disability, estimates are made based on recent past experience and emerging trends. Epidemics and changing patterns of lifestyle could result in significant changes to the expected future exposures. Each year, these estimates are assessed for adequacy and changes will be reflected as adjustments to the insurance fund contract liabilities.
For non-life insurance contracts, estimates have to be made for both the expected ultimate cost of claims reported at the balance sheet date and for the expected ultimate cost of claims incurred but not yet reported at the balance sheet date (IBNR).
It can take a significant time before the ultimate claims costs can be established with certainty and for some type of policies, IBNR claims form the majority of the insurance subsidiaries’ balance sheet liability. The ultimate cost of outstanding claims is estimated using a range of standard actuarial claims projection techniques such as Chain Ladder and Bornhuetter-Ferguson methods.
The main assumption underlying these techniques is that a company’s past development experience can be used to project future claims development and hence, ultimate claim costs. As such, these methods extrapolate the development of paid and incurred losses, average costs per claim and claim numbers based on the observed development of earlier years and expected loss ratios. Historical claims development is mainly analysed by accident years but can also be further analysed by significant business lines and claims type. Large claims are usually separately addressed, either by being reserved at the face of loss adjustor estimates or separately projected in order to reflect their future development. In most cases, no explicit assumptions are made regarding future rates of claims inflation or loss ratios. Additional qualitative judgement is used to assess the extent to which past trends may not apply in future (for example, to reflect one-off occurrences, changes in external or market factors, economic conditions as well as internal factors such as portfolio mix, policy features and claims handling procedures) in order to arrive at the estimated ultimate cost of claims that present the likely outcome from the range of possible outcomes, taking account of all uncertainties involved.
2.25.4 Impairment of Goodwill and Intangible AssetsThe Group performs an annual review of the carrying amount of its goodwill and intangible assets, against the recoverable amounts of the CGU to which the goodwill and intangible assets have been allocated. Recoverable amounts of CGUs are determined based on the present value of estimated future cash flows expected to arise from the respective CGUs’ continuing operations. Management exercises its judgement in estimating the future cash flows, growth rates and discount rates used in computing the recoverable amounts of the CGUs.
2.25.5 Income TaxesThe Group is subject to income taxes in several jurisdictions. Significant judgement is required in determining the capital allowances and deductibility of certain expenses in estimating the provision for income taxes. There are many transactions and calculations for which the ultimate tax determination is uncertain during the ordinary course of business. The Group recognises liabilities for anticipated tax issues based on estimates of whether additional taxes will be due. Where the final tax outcome of these matters is different from the amounts that were initially recorded, such differences will impact the income tax and deferred tax balances in the period in which the determination is made.
2.25.6 Insurance Contract ClassificationContracts are classified as insurance contracts where significant insurance risk is transferred from the policyholder to the Group. The Group exercises judgement about the level of insurance risk transferred. The level of insurance risk is assessed by considering whether upon the occurrence of the insured event, the Group is required to pay significant additional benefits. These additional benefits include claims liability and assessment costs, but exclude the loss of the ability to charge the policyholder for future services. The assessment covers the whole of the expected term of the contract where such additional benefits could be payable. Some contracts contain options for the policyholder to purchase insurance risk protection at a later date; these insurance risks are deemed not significant.
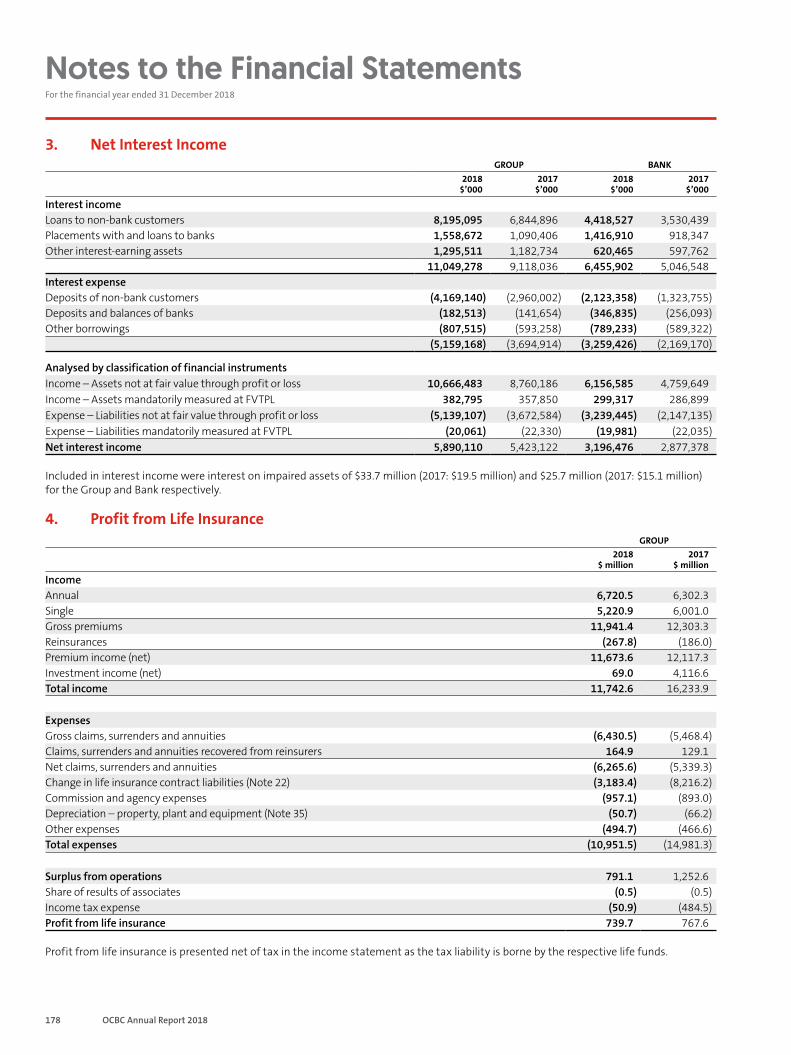
178 OCBC Annual Report 2018
Notes to the Financial Statements For the financial year ended 31 December 2018
3. Net Interest IncomeGROUP BANK
2018 $’000
2017 $’000
2018 $’000
2017 $’000
Interest incomeLoans to non-bank customers 8,195,095 6,844,896 4,418,527 3,530,439Placements with and loans to banks 1,558,672 1,090,406 1,416,910 918,347Other interest-earning assets 1,295,511 1,182,734 620,465 597,762
11,049,278 9,118,036 6,455,902 5,046,548Interest expenseDeposits of non-bank customers (4,169,140) (2,960,002) (2,123,358) (1,323,755)Deposits and balances of banks (182,513) (141,654) (346,835) (256,093)Other borrowings (807,515) (593,258) (789,233) (589,322)
(5,159,168) (3,694,914) (3,259,426) (2,169,170)
Analysed by classification of financial instrumentsIncome – Assets not at fair value through profit or loss 10,666,483 8,760,186 6,156,585 4,759,649Income – Assets mandatorily measured at FVTPL 382,795 357,850 299,317 286,899Expense – Liabilities not at fair value through profit or loss (5,139,107) (3,672,584) (3,239,445) (2,147,135)Expense – Liabilities mandatorily measured at FVTPL (20,061) (22,330) (19,981) (22,035)Net interest income 5,890,110 5,423,122 3,196,476 2,877,378
Included in interest income were interest on impaired assets of $33.7 million (2017: $19.5 million) and $25.7 million (2017: $15.1 million) for the Group and Bank respectively.
4. Profit from Life InsuranceGROUP
2018$ million
2017$ million
IncomeAnnual 6,720.5 6,302.3Single 5,220.9 6,001.0Gross premiums 11,941.4 12,303.3Reinsurances (267.8) (186.0)Premium income (net) 11,673.6 12,117.3Investment income (net) 69.0 4,116.6Total income 11,742.6 16,233.9
ExpensesGross claims, surrenders and annuities (6,430.5) (5,468.4)Claims, surrenders and annuities recovered from reinsurers 164.9 129.1Net claims, surrenders and annuities (6,265.6) (5,339.3)Change in life insurance contract liabilities (Note 22) (3,183.4) (8,216.2)Commission and agency expenses (957.1) (893.0)Depreciation – property, plant and equipment (Note 35) (50.7) (66.2)Other expenses (494.7) (466.6)Total expenses (10,951.5) (14,981.3)
Surplus from operations 791.1 1,252.6Share of results of associates (0.5) (0.5)Income tax expense (50.9) (484.5)Profit from life insurance 739.7 767.6
Profit from life insurance is presented net of tax in the income statement as the tax liability is borne by the respective life funds.
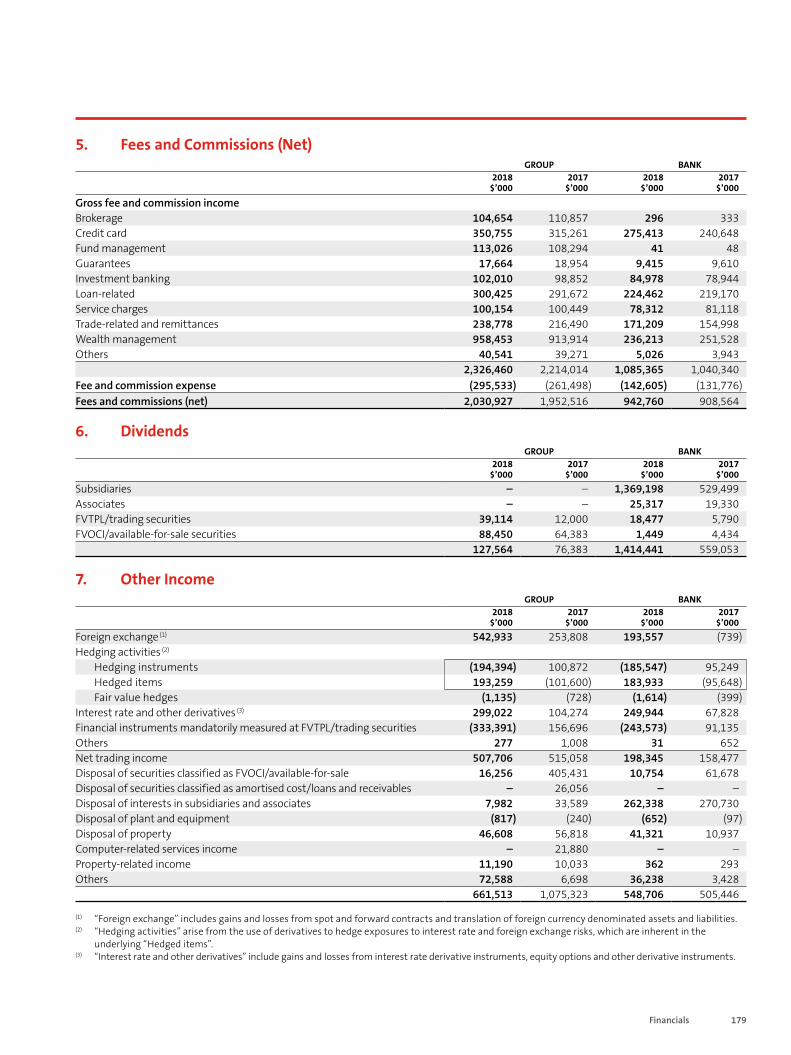
179Financials
5. Fees and Commissions (Net)GROUP BANK
2018 $’000
2017 $’000
2018 $’000
2017 $’000
Gross fee and commission income Brokerage 104,654 110,857 296 333Credit card 350,755 315,261 275,413 240,648Fund management 113,026 108,294 41 48Guarantees 17,664 18,954 9,415 9,610Investment banking 102,010 98,852 84,978 78,944Loan-related 300,425 291,672 224,462 219,170Service charges 100,154 100,449 78,312 81,118Trade-related and remittances 238,778 216,490 171,209 154,998Wealth management 958,453 913,914 236,213 251,528Others 40,541 39,271 5,026 3,943
2,326,460 2,214,014 1,085,365 1,040,340Fee and commission expense (295,533) (261,498) (142,605) (131,776)Fees and commissions (net) 2,030,927 1,952,516 942,760 908,564
6. DividendsGROUP BANK
2018 $’000
2017 $’000
2018 $’000
2017 $’000
Subsidiaries – – 1,369,198 529,499Associates – – 25,317 19,330FVTPL/trading securities 39,114 12,000 18,477 5,790FVOCI/available-for-sale securities 88,450 64,383 1,449 4,434
127,564 76,383 1,414,441 559,053
7. Other IncomeGROUP BANK
2018 $’000
2017 $’000
2018 $’000
2017 $’000
Foreign exchange (1) 542,933 253,808 193,557 (739)Hedging activities (2)
Hedging instruments (194,394) 100,872 (185,547) 95,249Hedged items 193,259 (101,600) 183,933 (95,648)Fair value hedges (1,135) (728) (1,614) (399)
Interest rate and other derivatives (3) 299,022 104,274 249,944 67,828Financial instruments mandatorily measured at FVTPL/trading securities (333,391) 156,696 (243,573) 91,135Others 277 1,008 31 652Net trading income 507,706 515,058 198,345 158,477Disposal of securities classified as FVOCI/available-for-sale 16,256 405,431 10,754 61,678Disposal of securities classified as amortised cost/loans and receivables – 26,056 – –Disposal of interests in subsidiaries and associates 7,982 33,589 262,338 270,730Disposal of plant and equipment (817) (240) (652) (97)Disposal of property 46,608 56,818 41,321 10,937Computer-related services income – 21,880 – –Property-related income 11,190 10,033 362 293Others 72,588 6,698 36,238 3,428
661,513 1,075,323 548,706 505,446
(1) “Foreign exchange” includes gains and losses from spot and forward contracts and translation of foreign currency denominated assets and liabilities.(2) “Hedging activities” arise from the use of derivatives to hedge exposures to interest rate and foreign exchange risks, which are inherent in the
underlying “Hedged items”.(3) “Interest rate and other derivatives” include gains and losses from interest rate derivative instruments, equity options and other derivative instruments.
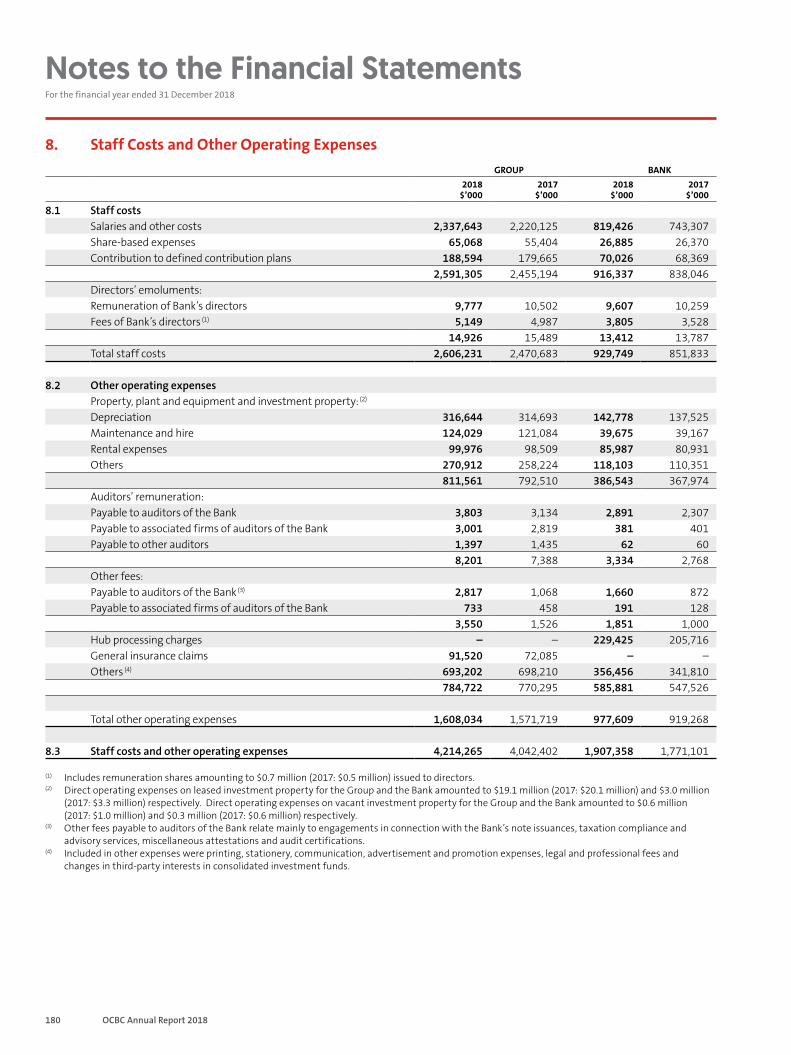
180 OCBC Annual Report 2018
Notes to the Financial Statements For the financial year ended 31 December 2018
8. Staff Costs and Other Operating ExpensesGROUP BANK
2018 $’000
2017 $’000
2018 $’000
2017 $’000
8.1 Staff costsSalaries and other costs 2,337,643 2,220,125 819,426 743,307Share-based expenses 65,068 55,404 26,885 26,370Contribution to defined contribution plans 188,594 179,665 70,026 68,369
2,591,305 2,455,194 916,337 838,046Directors’ emoluments: Remuneration of Bank’s directors 9,777 10,502 9,607 10,259Fees of Bank’s directors (1) 5,149 4,987 3,805 3,528
14,926 15,489 13,412 13,787Total staff costs 2,606,231 2,470,683 929,749 851,833
8.2 Other operating expensesProperty, plant and equipment and investment property: (2)
Depreciation 316,644 314,693 142,778 137,525Maintenance and hire 124,029 121,084 39,675 39,167Rental expenses 99,976 98,509 85,987 80,931Others 270,912 258,224 118,103 110,351
811,561 792,510 386,543 367,974Auditors’ remuneration:Payable to auditors of the Bank 3,803 3,134 2,891 2,307Payable to associated firms of auditors of the Bank 3,001 2,819 381 401Payable to other auditors 1,397 1,435 62 60
8,201 7,388 3,334 2,768Other fees:Payable to auditors of the Bank (3) 2,817 1,068 1,660 872Payable to associated firms of auditors of the Bank 733 458 191 128
3,550 1,526 1,851 1,000Hub processing charges – – 229,425 205,716General insurance claims 91,520 72,085 – –Others (4) 693,202 698,210 356,456 341,810
784,722 770,295 585,881 547,526
Total other operating expenses 1,608,034 1,571,719 977,609 919,268
8.3 Staff costs and other operating expenses 4,214,265 4,042,402 1,907,358 1,771,101
(1) Includes remuneration shares amounting to $0.7 million (2017: $0.5 million) issued to directors.(2) Direct operating expenses on leased investment property for the Group and the Bank amounted to $19.1 million (2017: $20.1 million) and $3.0 million
(2017: $3.3 million) respectively. Direct operating expenses on vacant investment property for the Group and the Bank amounted to $0.6 million (2017: $1.0 million) and $0.3 million (2017: $0.6 million) respectively.
(3) Other fees payable to auditors of the Bank relate mainly to engagements in connection with the Bank’s note issuances, taxation compliance and advisory services, miscellaneous attestations and audit certifications.
(4) Included in other expenses were printing, stationery, communication, advertisement and promotion expenses, legal and professional fees and changes in third-party interests in consolidated investment funds.
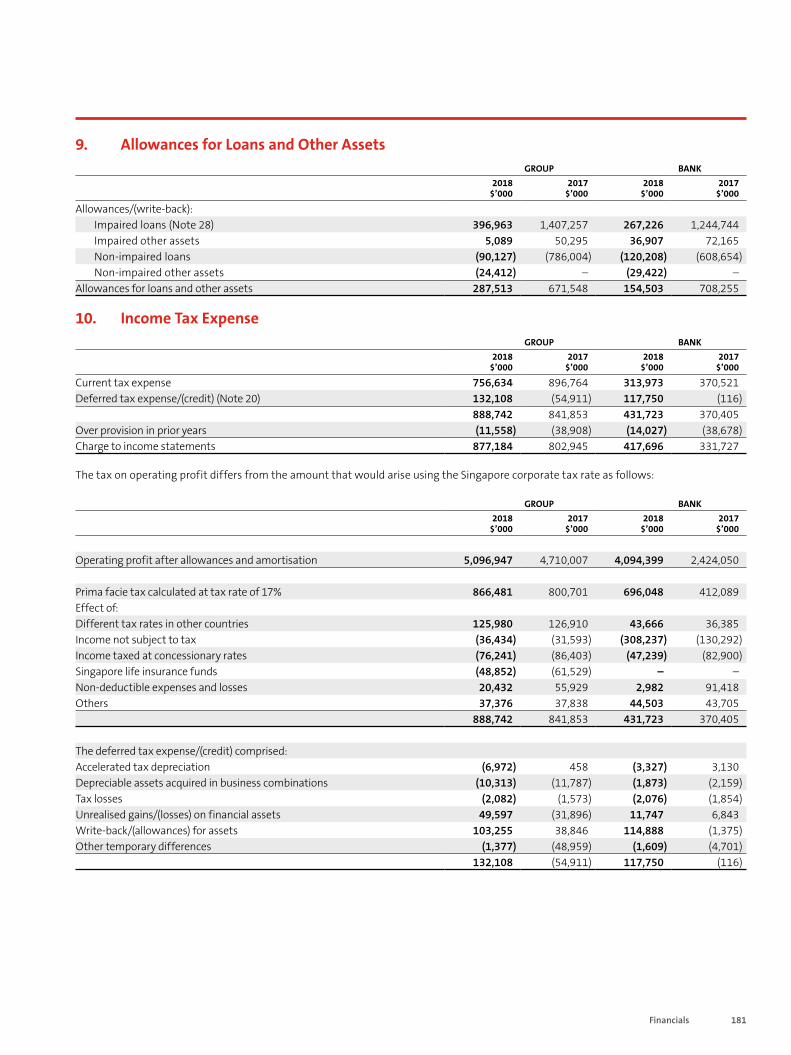
181Financials
9. Allowances for Loans and Other AssetsGROUP BANK
2018 $’000
2017 $’000
2018 $’000
2017 $’000
Allowances/(write-back):Impaired loans (Note 28) 396,963 1,407,257 267,226 1,244,744Impaired other assets 5,089 50,295 36,907 72,165Non-impaired loans (90,127) (786,004) (120,208) (608,654)Non-impaired other assets (24,412) – (29,422) –
Allowances for loans and other assets 287,513 671,548 154,503 708,255
10. Income Tax ExpenseGROUP BANK
2018 $’000
2017 $’000
2018 $’000
2017 $’000
Current tax expense 756,634 896,764 313,973 370,521Deferred tax expense/(credit) (Note 20) 132,108 (54,911) 117,750 (116)
888,742 841,853 431,723 370,405Over provision in prior years (11,558) (38,908) (14,027) (38,678)Charge to income statements 877,184 802,945 417,696 331,727
The tax on operating profit differs from the amount that would arise using the Singapore corporate tax rate as follows:
GROUP BANK2018
$’0002017
$’0002018
$’0002017
$’000
Operating profit after allowances and amortisation 5,096,947 4,710,007 4,094,399 2,424,050
Prima facie tax calculated at tax rate of 17% 866,481 800,701 696,048 412,089Effect of:Different tax rates in other countries 125,980 126,910 43,666 36,385Income not subject to tax (36,434) (31,593) (308,237) (130,292)Income taxed at concessionary rates (76,241) (86,403) (47,239) (82,900)Singapore life insurance funds (48,852) (61,529) – –Non-deductible expenses and losses 20,432 55,929 2,982 91,418Others 37,376 37,838 44,503 43,705
888,742 841,853 431,723 370,405
The deferred tax expense/(credit) comprised:Accelerated tax depreciation (6,972) 458 (3,327) 3,130Depreciable assets acquired in business combinations (10,313) (11,787) (1,873) (2,159)Tax losses (2,082) (1,573) (2,076) (1,854)Unrealised gains/(losses) on financial assets 49,597 (31,896) 11,747 6,843Write-back/(allowances) for assets 103,255 38,846 114,888 (1,375)Other temporary differences (1,377) (48,959) (1,609) (4,701)
132,108 (54,911) 117,750 (116)
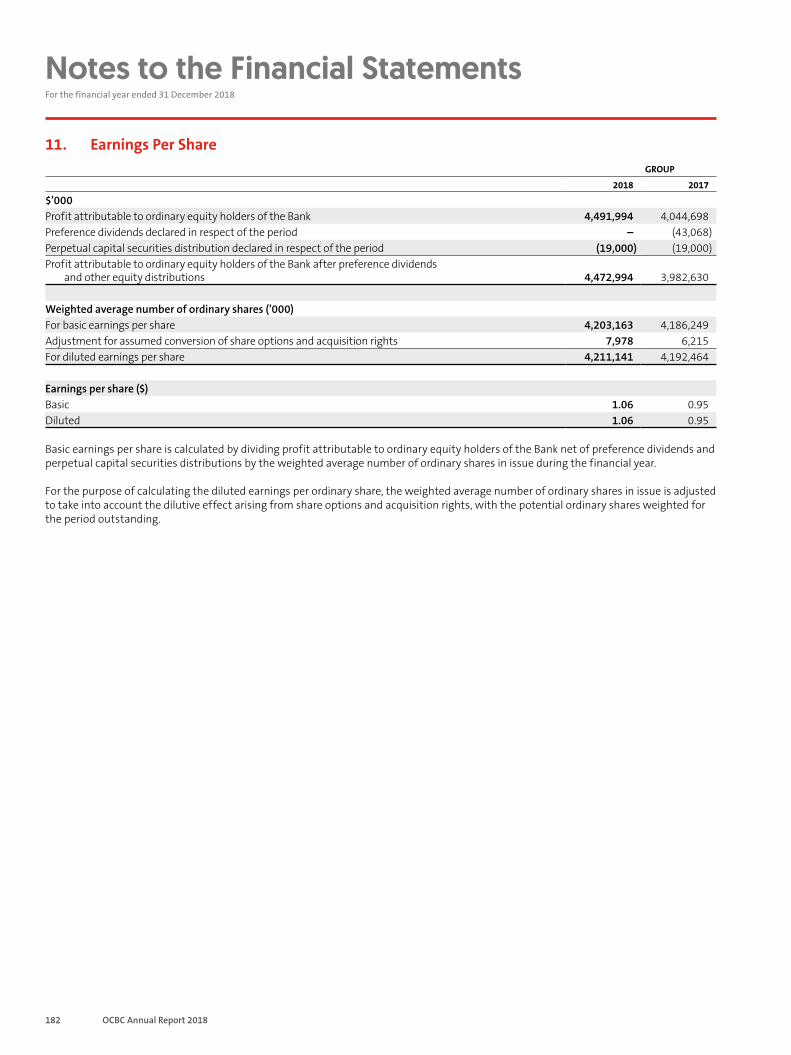
182 OCBC Annual Report 2018
Notes to the Financial Statements For the financial year ended 31 December 2018
11. Earnings Per ShareGROUP
2018 2017
$’000Profit attributable to ordinary equity holders of the Bank 4,491,994 4,044,698Preference dividends declared in respect of the period – (43,068)Perpetual capital securities distribution declared in respect of the period (19,000) (19,000)Profit attributable to ordinary equity holders of the Bank after preference dividends
and other equity distributions 4,472,994 3,982,630
Weighted average number of ordinary shares (’000)For basic earnings per share 4,203,163 4,186,249Adjustment for assumed conversion of share options and acquisition rights 7,978 6,215For diluted earnings per share 4,211,141 4,192,464
Earnings per share ($) Basic 1.06 0.95Diluted 1.06 0.95
Basic earnings per share is calculated by dividing profit attributable to ordinary equity holders of the Bank net of preference dividends and perpetual capital securities distributions by the weighted average number of ordinary shares in issue during the financial year.
For the purpose of calculating the diluted earnings per ordinary share, the weighted average number of ordinary shares in issue is adjusted to take into account the dilutive effect arising from share options and acquisition rights, with the potential ordinary shares weighted for the period outstanding.
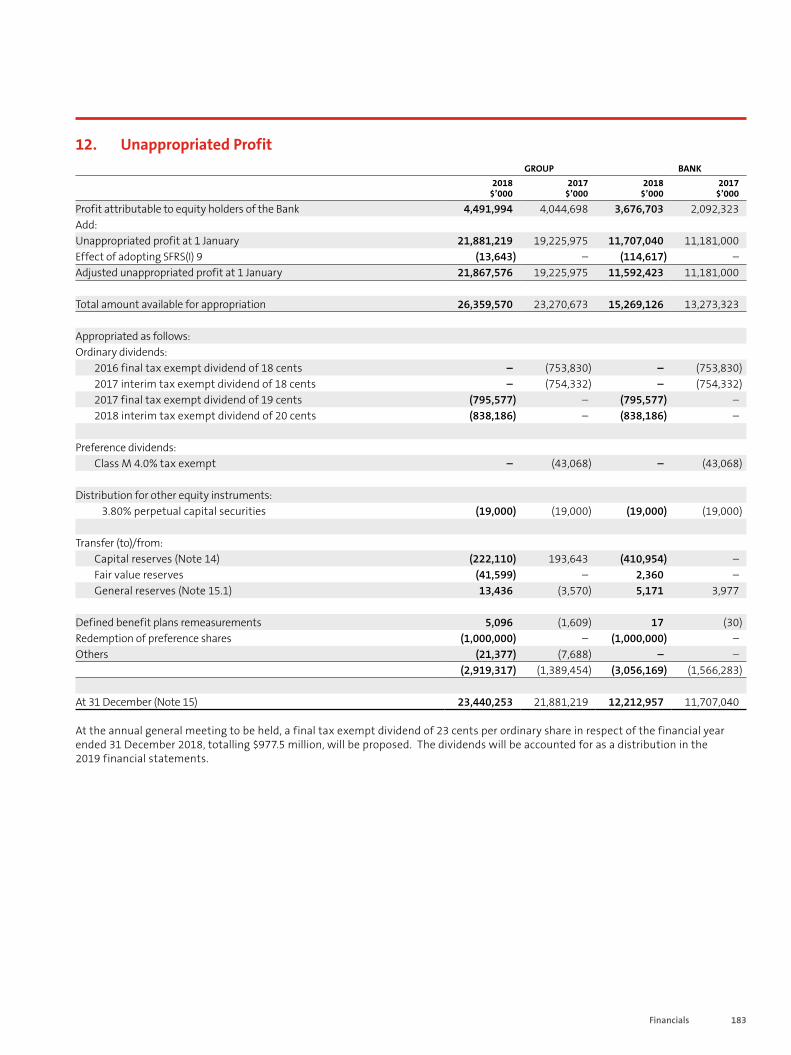
183Financials
12. Unappropriated ProfitGROUP BANK
2018 $’000
2017 $’000
2018 $’000
2017 $’000
Profit attributable to equity holders of the Bank 4,491,994 4,044,698 3,676,703 2,092,323Add:Unappropriated profit at 1 January 21,881,219 19,225,975 11,707,040 11,181,000Effect of adopting SFRS(I) 9 (13,643) – (114,617) –Adjusted unappropriated profit at 1 January 21,867,576 19,225,975 11,592,423 11,181,000
Total amount available for appropriation 26,359,570 23,270,673 15,269,126 13,273,323
Appropriated as follows:Ordinary dividends:
2016 final tax exempt dividend of 18 cents – (753,830) – (753,830)2017 interim tax exempt dividend of 18 cents – (754,332) – (754,332)2017 final tax exempt dividend of 19 cents (795,577) – (795,577) –2018 interim tax exempt dividend of 20 cents (838,186) – (838,186) –
Preference dividends:Class M 4.0% tax exempt – (43,068) – (43,068)
Distribution for other equity instruments: 3.80% perpetual capital securities (19,000) (19,000) (19,000) (19,000)
Transfer (to)/from:Capital reserves (Note 14) (222,110) 193,643 (410,954) –Fair value reserves (41,599) – 2,360 –General reserves (Note 15.1) 13,436 (3,570) 5,171 3,977
Defined benefit plans remeasurements 5,096 (1,609) 17 (30)Redemption of preference shares (1,000,000) – (1,000,000) –Others (21,377) (7,688) – –
(2,919,317) (1,389,454) (3,056,169) (1,566,283)
At 31 December (Note 15) 23,440,253 21,881,219 12,212,957 11,707,040
At the annual general meeting to be held, a final tax exempt dividend of 23 cents per ordinary share in respect of the financial year ended 31 December 2018, totalling $977.5 million, will be proposed. The dividends will be accounted for as a distribution in the 2019 financial statements.

184 OCBC Annual Report 2018
Notes to the Financial Statements For the financial year ended 31 December 2018
13. Share Capital and Other Equity13.1 Share Capital
2018 2017GROUP AND BANK Shares (’000) Shares (’000)
Ordinary sharesAt 1 January 4,193,784 4,193,729Shares issued in lieu of ordinary dividends 62,933 –Shares issued to non-executive directors 53 55At 31 December 4,256,770 4,193,784
Treasury sharesAt 1 January (7,071) (11,022)Share buyback (17,225) (20,560)Share Option Schemes 4,553 13,133Share Purchase Plan 7,635 6,302Shares sold for cash 47 #Treasury shares transferred to DSP Trust 5,322 5,076At 31 December (6,739) (7,071)
Preference sharesClass MAt 1 January 1,000,000 1,000,000Redemption of preference shares (1,000,000) –At 31 December – 1,000,000
2018 2017GROUP AND BANK $’000 $’000
Issued share capital, at 31 December 15,750,417 15,136,347
(1) # represents amounts less than 500 shares.
The holders of ordinary shares (excluding treasury shares) are entitled to receive dividends as declared from time to time and to one vote per share at meetings of the Bank. All shares (excluding treasury shares) rank equally with regard to the Bank’s residual assets.
The issued ordinary shares qualify as Common Equity Tier 1 capital for the Group, while the Class M non-cumulative non-convertible preference shares qualify as Additional Tier 1 capital for the Group. The 4.0% Class M non-cumulative non-convertible preference shares were fully redeemed by the Bank on 17 January 2018.
All issued shares were fully paid. Associates of the Group did not hold shares in the capital of the Bank as at 31 December 2018 and 31 December 2017.
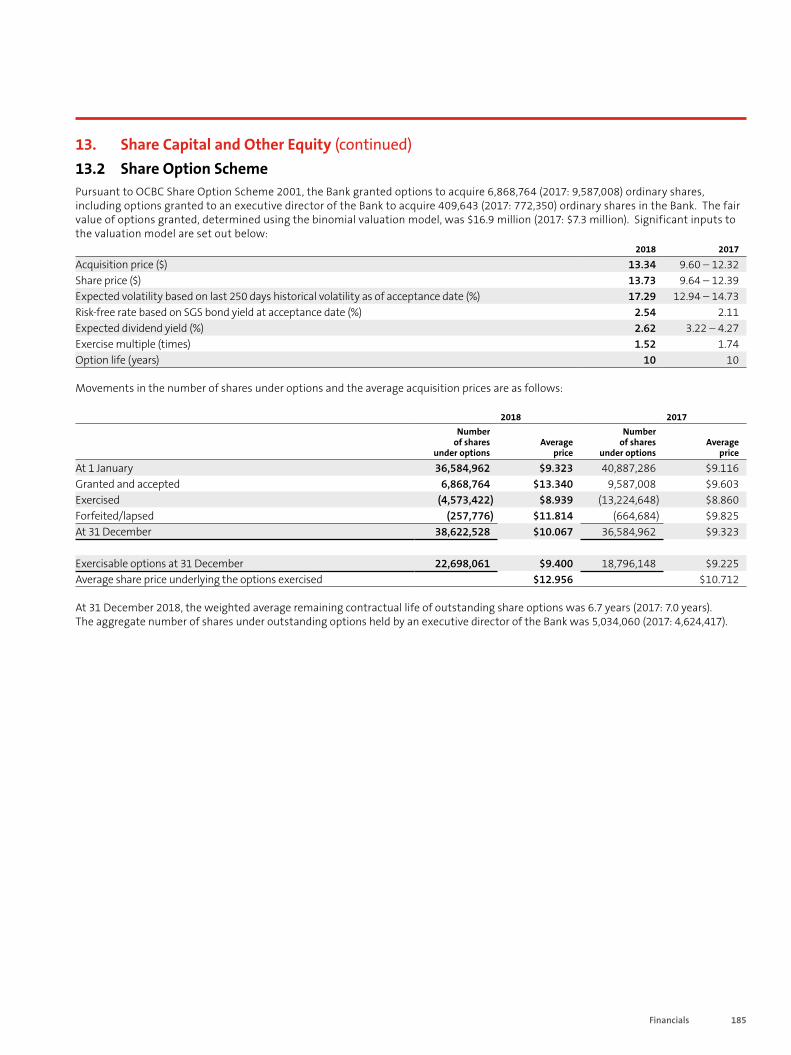
185Financials
13. Share Capital and Other Equity (continued)13.2 Share Option SchemePursuant to OCBC Share Option Scheme 2001, the Bank granted options to acquire 6,868,764 (2017: 9,587,008) ordinary shares, including options granted to an executive director of the Bank to acquire 409,643 (2017: 772,350) ordinary shares in the Bank. The fair value of options granted, determined using the binomial valuation model, was $16.9 million (2017: $7.3 million). Significant inputs to the valuation model are set out below:
2018 2017
Acquisition price ($) 13.34 9.60 – 12.32Share price ($) 13.73 9.64 – 12.39Expected volatility based on last 250 days historical volatility as of acceptance date (%) 17.29 12.94 – 14.73 Risk-free rate based on SGS bond yield at acceptance date (%) 2.54 2.11Expected dividend yield (%) 2.62 3.22 – 4.27Exercise multiple (times) 1.52 1.74Option life (years) 10 10
Movements in the number of shares under options and the average acquisition prices are as follows:
2018 2017Number
of shares under options
Averageprice
Number of shares
under optionsAverage
price
At 1 January 36,584,962 $9.323 40,887,286 $9.116Granted and accepted 6,868,764 $13.340 9,587,008 $9.603Exercised (4,573,422) $8.939 (13,224,648) $8.860Forfeited/lapsed (257,776) $11.814 (664,684) $9.825At 31 December 38,622,528 $10.067 36,584,962 $9.323
Exercisable options at 31 December 22,698,061 $9.400 18,796,148 $9.225Average share price underlying the options exercised $12.956 $10.712
At 31 December 2018, the weighted average remaining contractual life of outstanding share options was 6.7 years (2017: 7.0 years). The aggregate number of shares under outstanding options held by an executive director of the Bank was 5,034,060 (2017: 4,624,417).
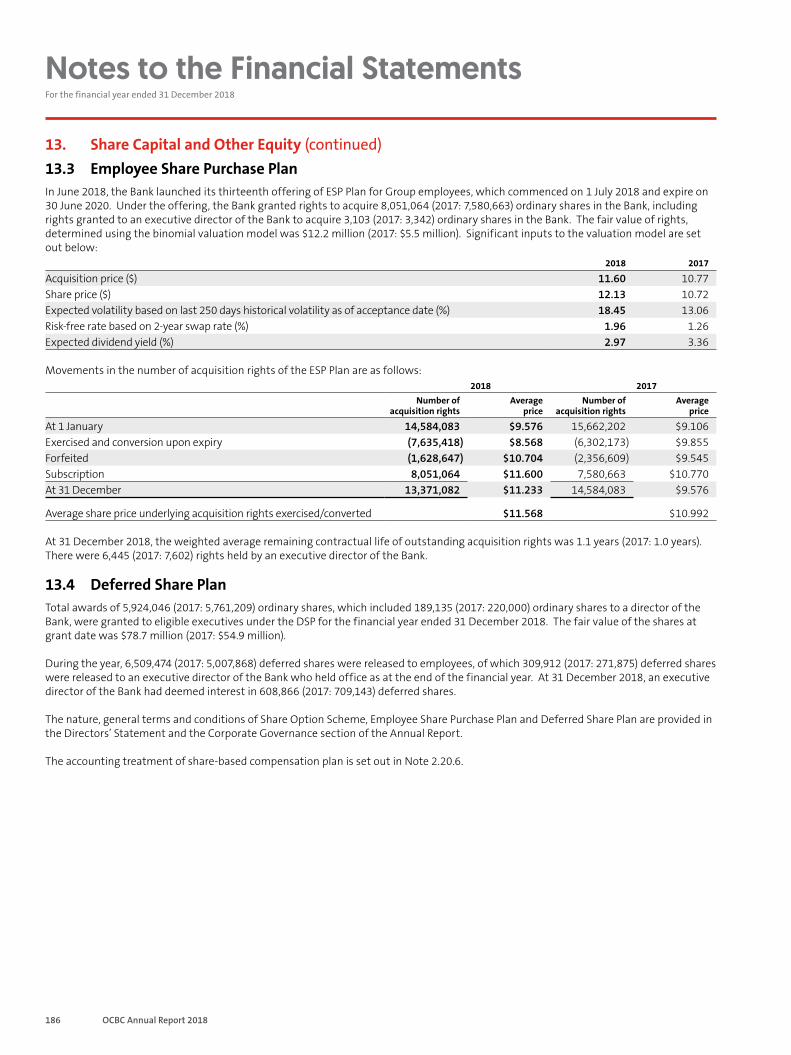
186 OCBC Annual Report 2018
Notes to the Financial Statements For the financial year ended 31 December 2018
13. Share Capital and Other Equity (continued)13.3 Employee Share Purchase PlanIn June 2018, the Bank launched its thirteenth offering of ESP Plan for Group employees, which commenced on 1 July 2018 and expire on 30 June 2020. Under the offering, the Bank granted rights to acquire 8,051,064 (2017: 7,580,663) ordinary shares in the Bank, including rights granted to an executive director of the Bank to acquire 3,103 (2017: 3,342) ordinary shares in the Bank. The fair value of rights, determined using the binomial valuation model was $12.2 million (2017: $5.5 million). Significant inputs to the valuation model are set out below:
2018 2017
Acquisition price ($) 11.60 10.77Share price ($) 12.13 10.72Expected volatility based on last 250 days historical volatility as of acceptance date (%) 18.45 13.06Risk-free rate based on 2-year swap rate (%) 1.96 1.26Expected dividend yield (%) 2.97 3.36
Movements in the number of acquisition rights of the ESP Plan are as follows:2018 2017
Number of acquisition rights
Averageprice
Number of acquisition rights
Averageprice
At 1 January 14,584,083 $9.576 15,662,202 $9.106Exercised and conversion upon expiry (7,635,418) $8.568 (6,302,173) $9.855Forfeited (1,628,647) $10.704 (2,356,609) $9.545Subscription 8,051,064 $11.600 7,580,663 $10.770At 31 December 13,371,082 $11.233 14,584,083 $9.576
Average share price underlying acquisition rights exercised/converted $11.568 $10.992
At 31 December 2018, the weighted average remaining contractual life of outstanding acquisition rights was 1.1 years (2017: 1.0 years). There were 6,445 (2017: 7,602) rights held by an executive director of the Bank.
13.4 Deferred Share PlanTotal awards of 5,924,046 (2017: 5,761,209) ordinary shares, which included 189,135 (2017: 220,000) ordinary shares to a director of the Bank, were granted to eligible executives under the DSP for the financial year ended 31 December 2018. The fair value of the shares at grant date was $78.7 million (2017: $54.9 million).
During the year, 6,509,474 (2017: 5,007,868) deferred shares were released to employees, of which 309,912 (2017: 271,875) deferred shares were released to an executive director of the Bank who held office as at the end of the financial year. At 31 December 2018, an executive director of the Bank had deemed interest in 608,866 (2017: 709,143) deferred shares.
The nature, general terms and conditions of Share Option Scheme, Employee Share Purchase Plan and Deferred Share Plan are provided in the Directors’ Statement and the Corporate Governance section of the Annual Report.
The accounting treatment of share-based compensation plan is set out in Note 2.20.6.
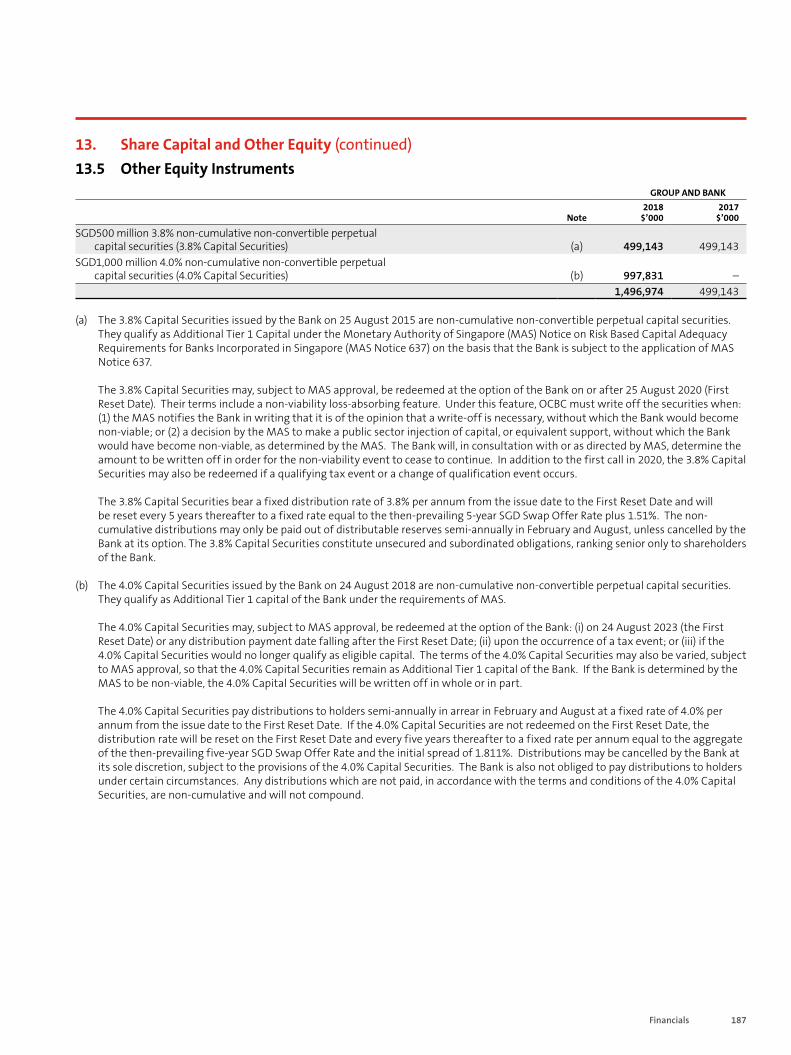
187Financials
13. Share Capital and Other Equity (continued)13.5 Other Equity Instruments
GROUP AND BANK
Note2018
$’0002017
$’000
SGD500 million 3.8% non-cumulative non-convertible perpetual capital securities (3.8% Capital Securities) (a) 499,143 499,143
SGD1,000 million 4.0% non-cumulative non-convertible perpetual capital securities (4.0% Capital Securities) (b) 997,831 –
1,496,974 499,143
(a) The 3.8% Capital Securities issued by the Bank on 25 August 2015 are non-cumulative non-convertible perpetual capital securities. They qualify as Additional Tier 1 Capital under the Monetary Authority of Singapore (MAS) Notice on Risk Based Capital Adequacy Requirements for Banks Incorporated in Singapore (MAS Notice 637) on the basis that the Bank is subject to the application of MAS Notice 637.
The 3.8% Capital Securities may, subject to MAS approval, be redeemed at the option of the Bank on or after 25 August 2020 (First Reset Date). Their terms include a non-viability loss-absorbing feature. Under this feature, OCBC must write off the securities when: (1) the MAS notifies the Bank in writing that it is of the opinion that a write-off is necessary, without which the Bank would become non-viable; or (2) a decision by the MAS to make a public sector injection of capital, or equivalent support, without which the Bank would have become non-viable, as determined by the MAS. The Bank will, in consultation with or as directed by MAS, determine the amount to be written off in order for the non-viability event to cease to continue. In addition to the first call in 2020, the 3.8% Capital Securities may also be redeemed if a qualifying tax event or a change of qualification event occurs.
The 3.8% Capital Securities bear a fixed distribution rate of 3.8% per annum from the issue date to the First Reset Date and will be reset every 5 years thereafter to a fixed rate equal to the then-prevailing 5-year SGD Swap Offer Rate plus 1.51%. The non-cumulative distributions may only be paid out of distributable reserves semi-annually in February and August, unless cancelled by the Bank at its option. The 3.8% Capital Securities constitute unsecured and subordinated obligations, ranking senior only to shareholders of the Bank.
(b) The 4.0% Capital Securities issued by the Bank on 24 August 2018 are non-cumulative non-convertible perpetual capital securities. They qualify as Additional Tier 1 capital of the Bank under the requirements of MAS.
The 4.0% Capital Securities may, subject to MAS approval, be redeemed at the option of the Bank: (i) on 24 August 2023 (the First Reset Date) or any distribution payment date falling after the First Reset Date; (ii) upon the occurrence of a tax event; or (iii) if the 4.0% Capital Securities would no longer qualify as eligible capital. The terms of the 4.0% Capital Securities may also be varied, subject to MAS approval, so that the 4.0% Capital Securities remain as Additional Tier 1 capital of the Bank. If the Bank is determined by the MAS to be non-viable, the 4.0% Capital Securities will be written off in whole or in part.
The 4.0% Capital Securities pay distributions to holders semi-annually in arrear in February and August at a fixed rate of 4.0% per annum from the issue date to the First Reset Date. If the 4.0% Capital Securities are not redeemed on the First Reset Date, the distribution rate will be reset on the First Reset Date and every five years thereafter to a fixed rate per annum equal to the aggregate of the then-prevailing five-year SGD Swap Offer Rate and the initial spread of 1.811%. Distributions may be cancelled by the Bank at its sole discretion, subject to the provisions of the 4.0% Capital Securities. The Bank is also not obliged to pay distributions to holders under certain circumstances. Any distributions which are not paid, in accordance with the terms and conditions of the 4.0% Capital Securities, are non-cumulative and will not compound.
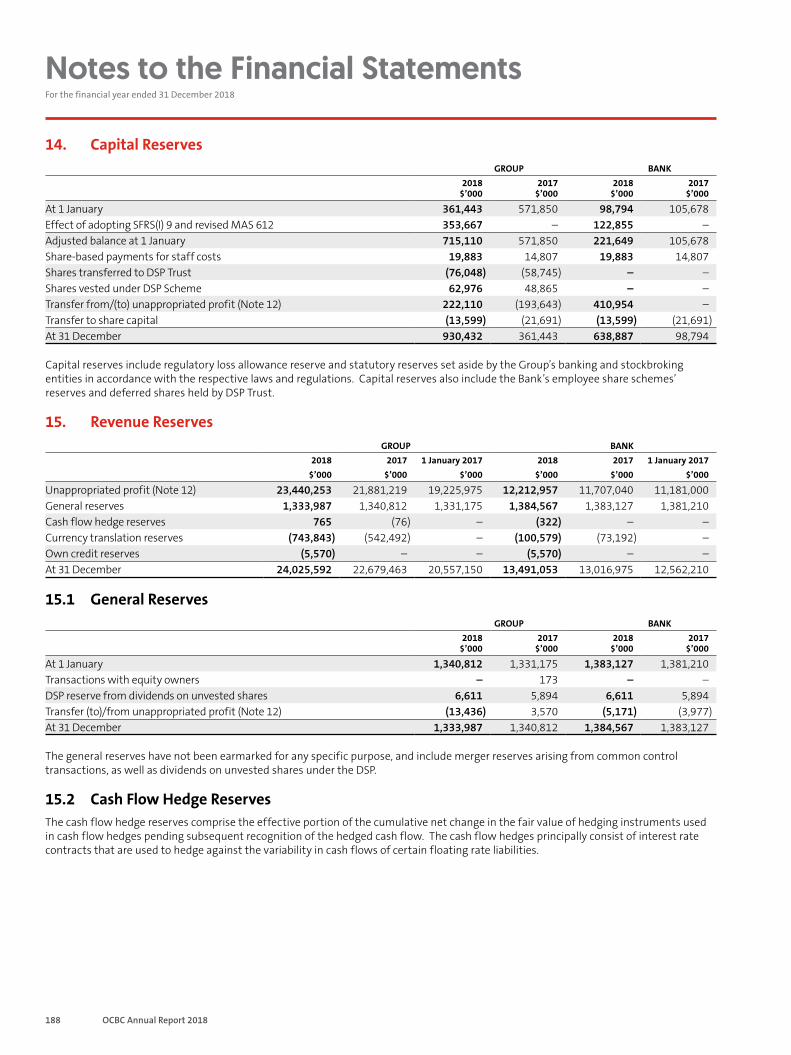
188 OCBC Annual Report 2018
Notes to the Financial Statements For the financial year ended 31 December 2018
14. Capital ReservesGROUP BANK
2018 $’000
2017 $’000
2018 $’000
2017 $’000
At 1 January 361,443 571,850 98,794 105,678Effect of adopting SFRS(I) 9 and revised MAS 612 353,667 – 122,855 –Adjusted balance at 1 January 715,110 571,850 221,649 105,678Share-based payments for staff costs 19,883 14,807 19,883 14,807Shares transferred to DSP Trust (76,048) (58,745) – –Shares vested under DSP Scheme 62,976 48,865 – –Transfer from/(to) unappropriated profit (Note 12) 222,110 (193,643) 410,954 –Transfer to share capital (13,599) (21,691) (13,599) (21,691)At 31 December 930,432 361,443 638,887 98,794
Capital reserves include regulatory loss allowance reserve and statutory reserves set aside by the Group’s banking and stockbroking entities in accordance with the respective laws and regulations. Capital reserves also include the Bank’s employee share schemes’ reserves and deferred shares held by DSP Trust.
15. Revenue ReservesGROUP BANK
2018 2017 1 January 2017 2018 2017 1 January 2017$’000 $’000 $’000 $’000 $’000 $’000
Unappropriated profit (Note 12) 23,440,253 21,881,219 19,225,975 12,212,957 11,707,040 11,181,000General reserves 1,333,987 1,340,812 1,331,175 1,384,567 1,383,127 1,381,210Cash flow hedge reserves 765 (76) – (322) – –Currency translation reserves (743,843) (542,492) – (100,579) (73,192) –Own credit reserves (5,570) – – (5,570) – –At 31 December 24,025,592 22,679,463 20,557,150 13,491,053 13,016,975 12,562,210
15.1 General ReservesGROUP BANK
2018 $’000
2017 $’000
2018 $’000
2017 $’000
At 1 January 1,340,812 1,331,175 1,383,127 1,381,210Transactions with equity owners – 173 – –DSP reserve from dividends on unvested shares 6,611 5,894 6,611 5,894Transfer (to)/from unappropriated profit (Note 12) (13,436) 3,570 (5,171) (3,977)At 31 December 1,333,987 1,340,812 1,384,567 1,383,127
The general reserves have not been earmarked for any specific purpose, and include merger reserves arising from common control transactions, as well as dividends on unvested shares under the DSP.
15.2 Cash Flow Hedge ReservesThe cash flow hedge reserves comprise the effective portion of the cumulative net change in the fair value of hedging instruments used in cash flow hedges pending subsequent recognition of the hedged cash flow. The cash flow hedges principally consist of interest rate contracts that are used to hedge against the variability in cash flows of certain floating rate liabilities.
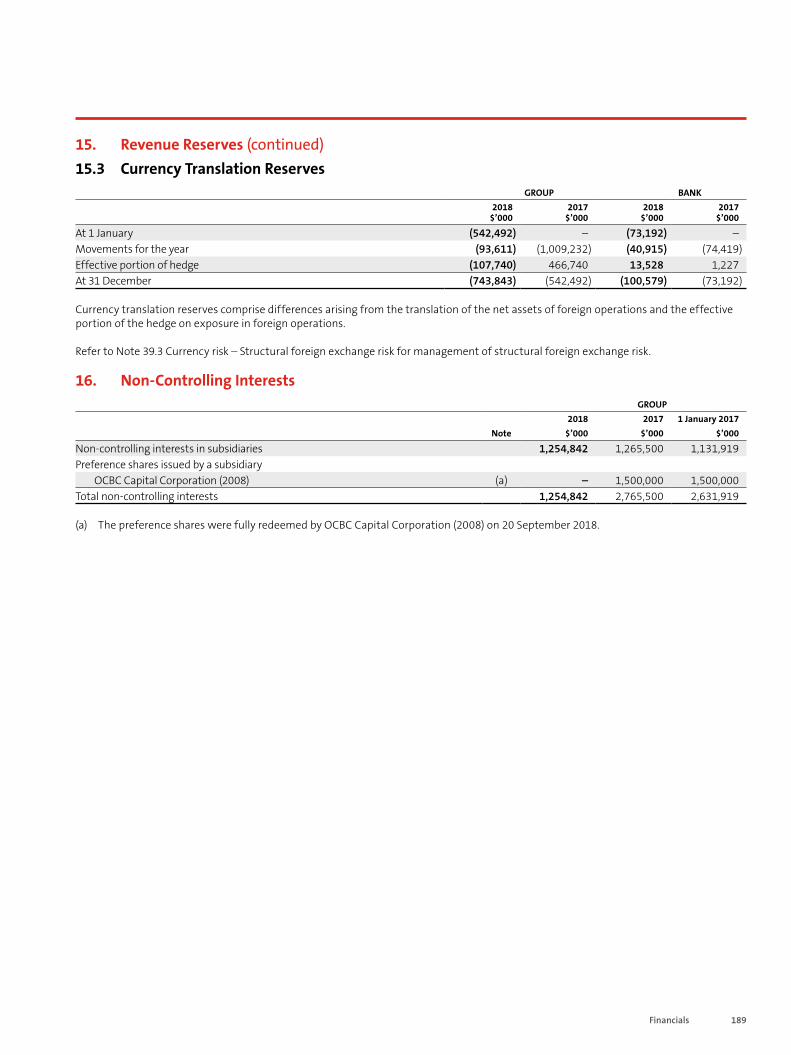
189Financials
15. Revenue Reserves (continued)15.3 Currency Translation Reserves
GROUP BANK2018
$’0002017
$’0002018
$’0002017
$’000
At 1 January (542,492) – (73,192) –Movements for the year (93,611) (1,009,232) (40,915) (74,419)Effective portion of hedge (107,740) 466,740 13,528 1,227At 31 December (743,843) (542,492) (100,579) (73,192)
Currency translation reserves comprise differences arising from the translation of the net assets of foreign operations and the effective portion of the hedge on exposure in foreign operations.
Refer to Note 39.3 Currency risk – Structural foreign exchange risk for management of structural foreign exchange risk.
16. Non-Controlling InterestsGROUP
2018 2017 1 January 2017Note $’000 $’000 $’000
Non-controlling interests in subsidiaries 1,254,842 1,265,500 1,131,919Preference shares issued by a subsidiary OCBC Capital Corporation (2008) (a) – 1,500,000 1,500,000Total non-controlling interests 1,254,842 2,765,500 2,631,919
(a) The preference shares were fully redeemed by OCBC Capital Corporation (2008) on 20 September 2018.
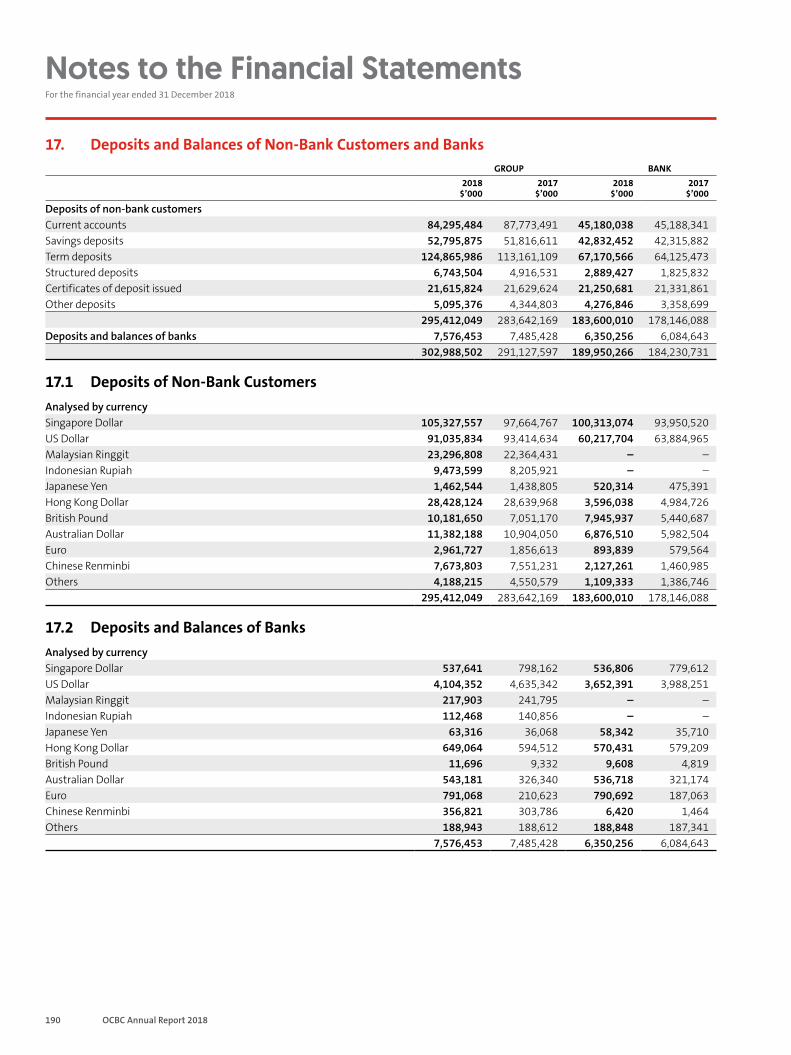
190 OCBC Annual Report 2018
Notes to the Financial Statements For the financial year ended 31 December 2018
17. Deposits and Balances of Non-Bank Customers and BanksGROUP BANK
2018 $’000
2017 $’000
2018 $’000
2017 $’000
Deposits of non-bank customersCurrent accounts 84,295,484 87,773,491 45,180,038 45,188,341Savings deposits 52,795,875 51,816,611 42,832,452 42,315,882Term deposits 124,865,986 113,161,109 67,170,566 64,125,473Structured deposits 6,743,504 4,916,531 2,889,427 1,825,832Certificates of deposit issued 21,615,824 21,629,624 21,250,681 21,331,861Other deposits 5,095,376 4,344,803 4,276,846 3,358,699
295,412,049 283,642,169 183,600,010 178,146,088Deposits and balances of banks 7,576,453 7,485,428 6,350,256 6,084,643
302,988,502 291,127,597 189,950,266 184,230,731
17.1 Deposits of Non-Bank CustomersAnalysed by currencySingapore Dollar 105,327,557 97,664,767 100,313,074 93,950,520US Dollar 91,035,834 93,414,634 60,217,704 63,884,965Malaysian Ringgit 23,296,808 22,364,431 – –Indonesian Rupiah 9,473,599 8,205,921 – –Japanese Yen 1,462,544 1,438,805 520,314 475,391Hong Kong Dollar 28,428,124 28,639,968 3,596,038 4,984,726British Pound 10,181,650 7,051,170 7,945,937 5,440,687Australian Dollar 11,382,188 10,904,050 6,876,510 5,982,504Euro 2,961,727 1,856,613 893,839 579,564Chinese Renminbi 7,673,803 7,551,231 2,127,261 1,460,985Others 4,188,215 4,550,579 1,109,333 1,386,746
295,412,049 283,642,169 183,600,010 178,146,088
17.2 Deposits and Balances of BanksAnalysed by currencySingapore Dollar 537,641 798,162 536,806 779,612US Dollar 4,104,352 4,635,342 3,652,391 3,988,251Malaysian Ringgit 217,903 241,795 – –Indonesian Rupiah 112,468 140,856 – –Japanese Yen 63,316 36,068 58,342 35,710Hong Kong Dollar 649,064 594,512 570,431 579,209British Pound 11,696 9,332 9,608 4,819Australian Dollar 543,181 326,340 536,718 321,174Euro 791,068 210,623 790,692 187,063Chinese Renminbi 356,821 303,786 6,420 1,464Others 188,943 188,612 188,848 187,341
7,576,453 7,485,428 6,350,256 6,084,643
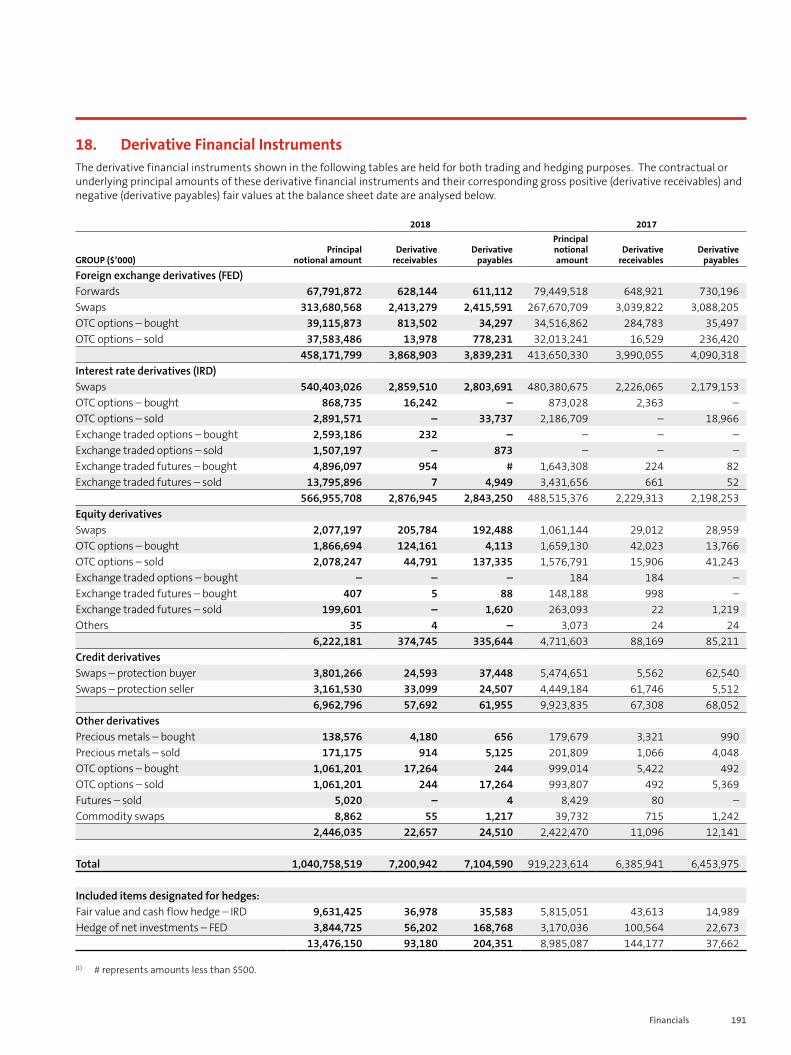
191Financials
18. Derivative Financial InstrumentsThe derivative financial instruments shown in the following tables are held for both trading and hedging purposes. The contractual or underlying principal amounts of these derivative financial instruments and their corresponding gross positive (derivative receivables) and negative (derivative payables) fair values at the balance sheet date are analysed below.
2018 2017
GROUP ($’000)Principal
notional amountDerivative
receivablesDerivative
payables
Principalnotional amount
Derivativereceivables
Derivative payables
Foreign exchange derivatives (FED)Forwards 67,791,872 628,144 611,112 79,449,518 648,921 730,196Swaps 313,680,568 2,413,279 2,415,591 267,670,709 3,039,822 3,088,205OTC options – bought 39,115,873 813,502 34,297 34,516,862 284,783 35,497OTC options – sold 37,583,486 13,978 778,231 32,013,241 16,529 236,420
458,171,799 3,868,903 3,839,231 413,650,330 3,990,055 4,090,318Interest rate derivatives (IRD)Swaps 540,403,026 2,859,510 2,803,691 480,380,675 2,226,065 2,179,153OTC options – bought 868,735 16,242 – 873,028 2,363 –OTC options – sold 2,891,571 – 33,737 2,186,709 – 18,966Exchange traded options – bought 2,593,186 232 – – – –Exchange traded options – sold 1,507,197 – 873 – – –Exchange traded futures – bought 4,896,097 954 # 1,643,308 224 82Exchange traded futures – sold 13,795,896 7 4,949 3,431,656 661 52
566,955,708 2,876,945 2,843,250 488,515,376 2,229,313 2,198,253Equity derivativesSwaps 2,077,197 205,784 192,488 1,061,144 29,012 28,959OTC options – bought 1,866,694 124,161 4,113 1,659,130 42,023 13,766OTC options – sold 2,078,247 44,791 137,335 1,576,791 15,906 41,243Exchange traded options – bought – – – 184 184 –Exchange traded futures – bought 407 5 88 148,188 998 –Exchange traded futures – sold 199,601 – 1,620 263,093 22 1,219Others 35 4 – 3,073 24 24
6,222,181 374,745 335,644 4,711,603 88,169 85,211Credit derivativesSwaps – protection buyer 3,801,266 24,593 37,448 5,474,651 5,562 62,540Swaps – protection seller 3,161,530 33,099 24,507 4,449,184 61,746 5,512
6,962,796 57,692 61,955 9,923,835 67,308 68,052Other derivativesPrecious metals – bought 138,576 4,180 656 179,679 3,321 990Precious metals – sold 171,175 914 5,125 201,809 1,066 4,048OTC options – bought 1,061,201 17,264 244 999,014 5,422 492OTC options – sold 1,061,201 244 17,264 993,807 492 5,369Futures – sold 5,020 – 4 8,429 80 –Commodity swaps 8,862 55 1,217 39,732 715 1,242
2,446,035 22,657 24,510 2,422,470 11,096 12,141
Total 1,040,758,519 7,200,942 7,104,590 919,223,614 6,385,941 6,453,975
Included items designated for hedges:Fair value and cash flow hedge – IRD 9,631,425 36,978 35,583 5,815,051 43,613 14,989Hedge of net investments – FED 3,844,725 56,202 168,768 3,170,036 100,564 22,673
13,476,150 93,180 204,351 8,985,087 144,177 37,662
(1) # represents amounts less than $500.

192 OCBC Annual Report 2018
Notes to the Financial Statements For the financial year ended 31 December 2018
18. Derivative Financial Instruments (continued)For the fair value hedges, the carrying amount at 31 December 2018 relating to the assets and liabilities designated as hedged items were $3,125 million and $5,829 million respectively. The hedged items were mainly fixed rate debt securities held (financial assets) and debt securities issued (financial liabilities).
For the cash flow hedges, the carrying amount at 31 December 2018 relating to the assets and liabilities designated as hedged items were $2,898 million and $2,898 million respectively. The hedged items were mainly variable rate loans (financial assets) and deposits (financial liabilities).
2018 2017
BANK ($’000)
Principalnotional amount
Derivativereceivables
Derivative payables
Principalnotional amount
Derivativereceivables
Derivative payables
Foreign exchange derivatives (FED)Forwards 34,192,396 304,902 297,395 26,867,182 197,307 229,522Swaps 280,808,610 1,905,954 1,911,588 241,666,109 2,533,571 2,415,762OTC options – bought 7,722,974 109,422 31,767 11,990,517 135,775 29,010OTC options – sold 6,334,771 11,446 75,480 9,775,087 10,034 108,861
329,058,751 2,331,724 2,316,230 290,298,895 2,876,687 2,783,155Interest rate derivatives (IRD)Swaps 502,147,797 2,702,682 2,651,294 445,480,040 2,143,771 2,094,828OTC options – bought 837,217 15,961 – 846,786 2,156 –OTC options – sold 2,840,283 – 33,372 2,140,002 – 17,993Exchange traded options – bought 2,593,185 232 – – – –Exchange traded options – sold 1,507,197 – 873 – – –Exchange traded futures – bought 4,875,488 891 # 1,643,308 224 82Exchange traded futures – sold 13,652,992 7 4,505 2,892,394 618 42
528,454,159 2,719,773 2,690,044 453,002,530 2,146,769 2,112,945Equity derivativesSwaps 2,005,364 201,925 188,629 1,017,073 26,610 26,545OTC options – bought 459,253 3,008 420 134,137 1,046 227OTC options – sold 692,391 41,129 16,203 87,979 2,686 713Exchange traded futures – bought 403 – – 148,188 998 –Exchange traded futures – sold 199,601 – 1,620 263,093 22 1,219Others 35 4 – 3,073 24 24
3,357,047 246,066 206,872 1,653,543 31,386 28,728Credit derivativesSwaps – protection buyer 3,594,253 526 37,446 5,398,439 543 62,529Swaps – protection seller 2,956,791 33,099 440 4,376,951 61,736 494
6,551,044 33,625 37,886 9,775,390 62,279 63,023Other derivativesPrecious metals – sold 23,681 – 737 21,735 – 784
23,681 – 737 21,735 – 784
Total 867,444,682 5,331,188 5,251,769 754,752,093 5,117,121 4,988,635
Included items designated for hedges:Fair value hedge – FED 2,932,118 54,123 149,399 1,597,531 94,826 –Fair value hedge – IRD 5,054,585 26,376 14,420 4,345,405 39,366 14,168Hedge of net investments – FED 418,862 655 17,495 1,268,975 5,738 8,914
8,405,565 81,154 181,314 7,211,911 139,930 23,082
(1) # represents amounts less than $500.
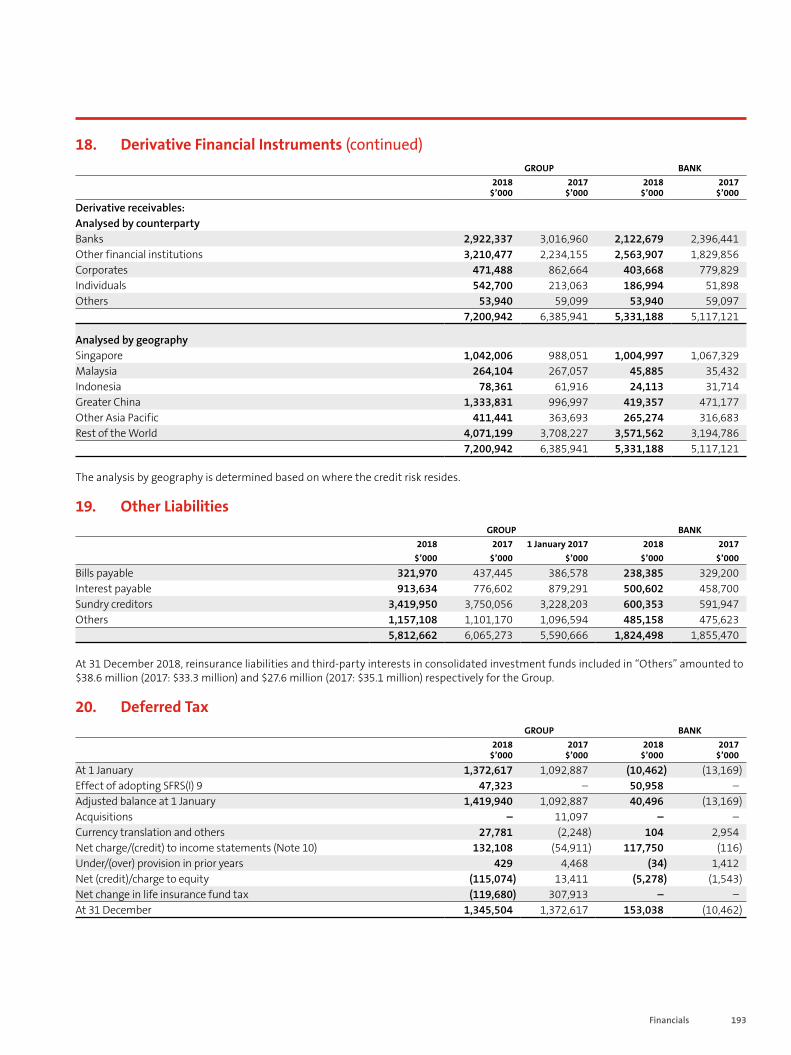
193Financials
18. Derivative Financial Instruments (continued)GROUP BANK
2018 $’000
2017 $’000
2018 $’000
2017 $’000
Derivative receivables:Analysed by counterpartyBanks 2,922,337 3,016,960 2,122,679 2,396,441Other financial institutions 3,210,477 2,234,155 2,563,907 1,829,856Corporates 471,488 862,664 403,668 779,829Individuals 542,700 213,063 186,994 51,898Others 53,940 59,099 53,940 59,097
7,200,942 6,385,941 5,331,188 5,117,121
Analysed by geographySingapore 1,042,006 988,051 1,004,997 1,067,329Malaysia 264,104 267,057 45,885 35,432Indonesia 78,361 61,916 24,113 31,714Greater China 1,333,831 996,997 419,357 471,177Other Asia Pacific 411,441 363,693 265,274 316,683Rest of the World 4,071,199 3,708,227 3,571,562 3,194,786
7,200,942 6,385,941 5,331,188 5,117,121
The analysis by geography is determined based on where the credit risk resides.
19. Other LiabilitiesGROUP BANK
2018 2017 1 January 2017 2018 2017$’000 $’000 $’000 $’000 $’000
Bills payable 321,970 437,445 386,578 238,385 329,200Interest payable 913,634 776,602 879,291 500,602 458,700Sundry creditors 3,419,950 3,750,056 3,228,203 600,353 591,947Others 1,157,108 1,101,170 1,096,594 485,158 475,623
5,812,662 6,065,273 5,590,666 1,824,498 1,855,470
At 31 December 2018, reinsurance liabilities and third-party interests in consolidated investment funds included in “Others” amounted to $38.6 million (2017: $33.3 million) and $27.6 million (2017: $35.1 million) respectively for the Group.
20. Deferred TaxGROUP BANK
2018 $’000
2017 $’000
2018 $’000
2017 $’000
At 1 January 1,372,617 1,092,887 (10,462) (13,169)Effect of adopting SFRS(I) 9 47,323 – 50,958 –Adjusted balance at 1 January 1,419,940 1,092,887 40,496 (13,169)Acquisitions – 11,097 – –Currency translation and others 27,781 (2,248) 104 2,954Net charge/(credit) to income statements (Note 10) 132,108 (54,911) 117,750 (116)Under/(over) provision in prior years 429 4,468 (34) 1,412Net (credit)/charge to equity (115,074) 13,411 (5,278) (1,543)Net change in life insurance fund tax (119,680) 307,913 – –At 31 December 1,345,504 1,372,617 153,038 (10,462)
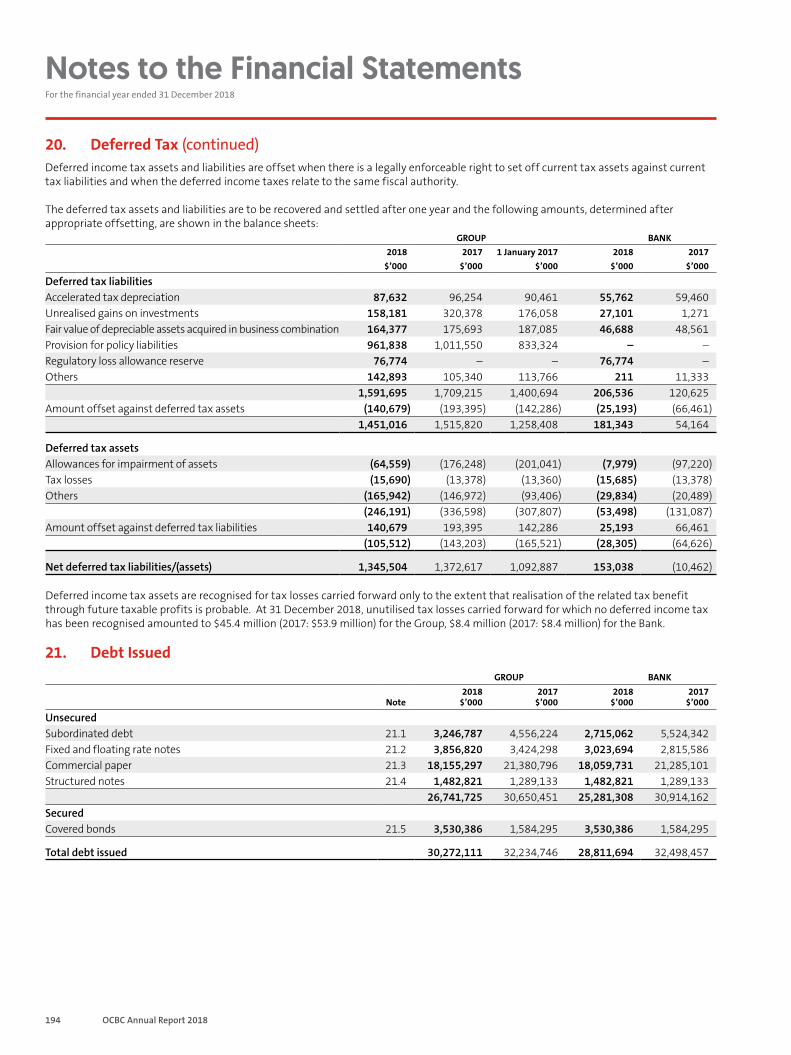
194 OCBC Annual Report 2018
Notes to the Financial Statements For the financial year ended 31 December 2018
20. Deferred Tax (continued)Deferred income tax assets and liabilities are offset when there is a legally enforceable right to set off current tax assets against current tax liabilities and when the deferred income taxes relate to the same fiscal authority.
The deferred tax assets and liabilities are to be recovered and settled after one year and the following amounts, determined after appropriate offsetting, are shown in the balance sheets:
GROUP BANK2018 2017 1 January 2017 2018 2017
$’000 $’000 $’000 $’000 $’000
Deferred tax liabilitiesAccelerated tax depreciation 87,632 96,254 90,461 55,762 59,460Unrealised gains on investments 158,181 320,378 176,058 27,101 1,271Fair value of depreciable assets acquired in business combination 164,377 175,693 187,085 46,688 48,561Provision for policy liabilities 961,838 1,011,550 833,324 – –Regulatory loss allowance reserve 76,774 – – 76,774 –Others 142,893 105,340 113,766 211 11,333
1,591,695 1,709,215 1,400,694 206,536 120,625Amount offset against deferred tax assets (140,679) (193,395) (142,286) (25,193) (66,461)
1,451,016 1,515,820 1,258,408 181,343 54,164
Deferred tax assetsAllowances for impairment of assets (64,559) (176,248) (201,041) (7,979) (97,220)Tax losses (15,690) (13,378) (13,360) (15,685) (13,378)Others (165,942) (146,972) (93,406) (29,834) (20,489)
(246,191) (336,598) (307,807) (53,498) (131,087)Amount offset against deferred tax liabilities 140,679 193,395 142,286 25,193 66,461
(105,512) (143,203) (165,521) (28,305) (64,626)
Net deferred tax liabilities/(assets) 1,345,504 1,372,617 1,092,887 153,038 (10,462)
Deferred income tax assets are recognised for tax losses carried forward only to the extent that realisation of the related tax benefit through future taxable profits is probable. At 31 December 2018, unutilised tax losses carried forward for which no deferred income tax has been recognised amounted to $45.4 million (2017: $53.9 million) for the Group, $8.4 million (2017: $8.4 million) for the Bank.
21. Debt IssuedGROUP BANK
Note2018
$’0002017
$’0002018
$’0002017
$’000
UnsecuredSubordinated debt 21.1 3,246,787 4,556,224 2,715,062 5,524,342Fixed and floating rate notes 21.2 3,856,820 3,424,298 3,023,694 2,815,586Commercial paper 21.3 18,155,297 21,380,796 18,059,731 21,285,101Structured notes 21.4 1,482,821 1,289,133 1,482,821 1,289,133
26,741,725 30,650,451 25,281,308 30,914,162SecuredCovered bonds 21.5 3,530,386 1,584,295 3,530,386 1,584,295
Total debt issued 30,272,111 32,234,746 28,811,694 32,498,457
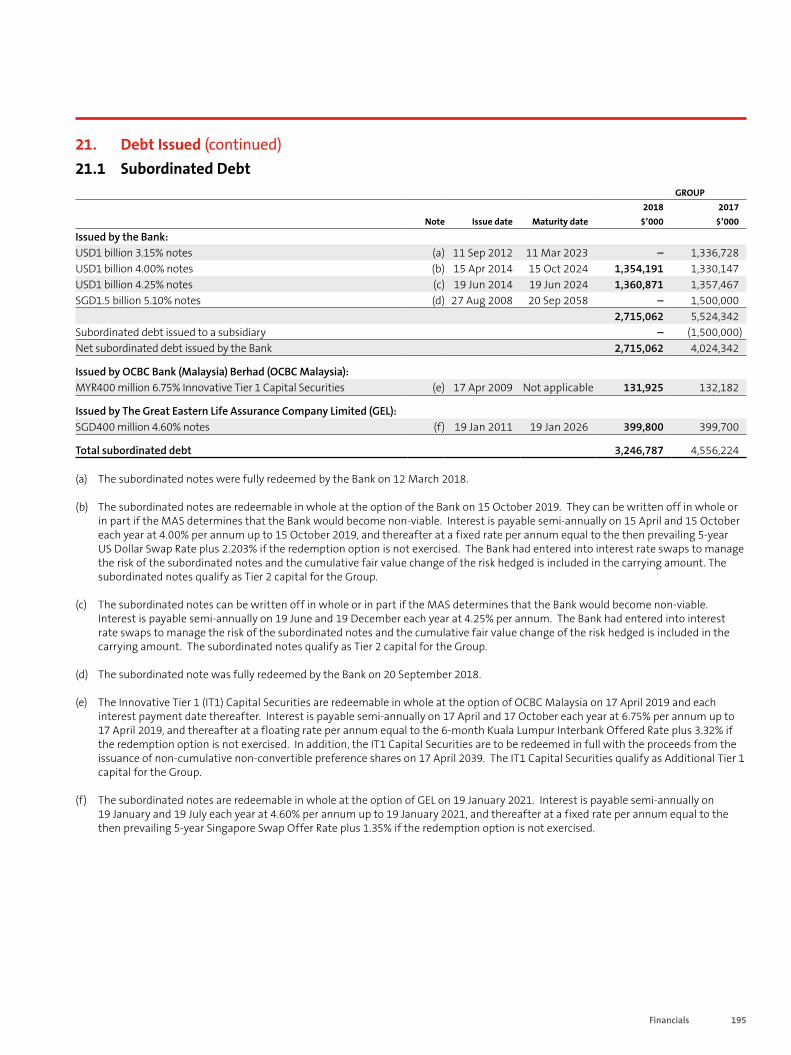
195Financials
21. Debt Issued (continued)21.1 Subordinated Debt
GROUP2018 2017
Note Issue date Maturity date $’000 $’000
Issued by the Bank:USD1 billion 3.15% notes (a) 11 Sep 2012 11 Mar 2023 – 1,336,728USD1 billion 4.00% notes (b) 15 Apr 2014 15 Oct 2024 1,354,191 1,330,147USD1 billion 4.25% notes (c) 19 Jun 2014 19 Jun 2024 1,360,871 1,357,467SGD1.5 billion 5.10% notes (d) 27 Aug 2008 20 Sep 2058 – 1,500,000
2,715,062 5,524,342Subordinated debt issued to a subsidiary – (1,500,000)Net subordinated debt issued by the Bank 2,715,062 4,024,342
Issued by OCBC Bank (Malaysia) Berhad (OCBC Malaysia):MYR400 million 6.75% Innovative Tier 1 Capital Securities (e) 17 Apr 2009 Not applicable 131,925 132,182
Issued by The Great Eastern Life Assurance Company Limited (GEL):SGD400 million 4.60% notes (f) 19 Jan 2011 19 Jan 2026 399,800 399,700
Total subordinated debt 3,246,787 4,556,224
(a) The subordinated notes were fully redeemed by the Bank on 12 March 2018.
(b) The subordinated notes are redeemable in whole at the option of the Bank on 15 October 2019. They can be written off in whole or in part if the MAS determines that the Bank would become non-viable. Interest is payable semi-annually on 15 April and 15 October each year at 4.00% per annum up to 15 October 2019, and thereafter at a fixed rate per annum equal to the then prevailing 5-year US Dollar Swap Rate plus 2.203% if the redemption option is not exercised. The Bank had entered into interest rate swaps to manage the risk of the subordinated notes and the cumulative fair value change of the risk hedged is included in the carrying amount. The subordinated notes qualify as Tier 2 capital for the Group.
(c) The subordinated notes can be written off in whole or in part if the MAS determines that the Bank would become non-viable. Interest is payable semi-annually on 19 June and 19 December each year at 4.25% per annum. The Bank had entered into interest rate swaps to manage the risk of the subordinated notes and the cumulative fair value change of the risk hedged is included in the carrying amount. The subordinated notes qualify as Tier 2 capital for the Group.
(d) The subordinated note was fully redeemed by the Bank on 20 September 2018.
(e) The Innovative Tier 1 (IT1) Capital Securities are redeemable in whole at the option of OCBC Malaysia on 17 April 2019 and each interest payment date thereafter. Interest is payable semi-annually on 17 April and 17 October each year at 6.75% per annum up to 17 April 2019, and thereafter at a floating rate per annum equal to the 6-month Kuala Lumpur Interbank Offered Rate plus 3.32% if the redemption option is not exercised. In addition, the IT1 Capital Securities are to be redeemed in full with the proceeds from the issuance of non-cumulative non-convertible preference shares on 17 April 2039. The IT1 Capital Securities qualify as Additional Tier 1 capital for the Group.
(f) The subordinated notes are redeemable in whole at the option of GEL on 19 January 2021. Interest is payable semi-annually on 19 January and 19 July each year at 4.60% per annum up to 19 January 2021, and thereafter at a fixed rate per annum equal to the then prevailing 5-year Singapore Swap Offer Rate plus 1.35% if the redemption option is not exercised.
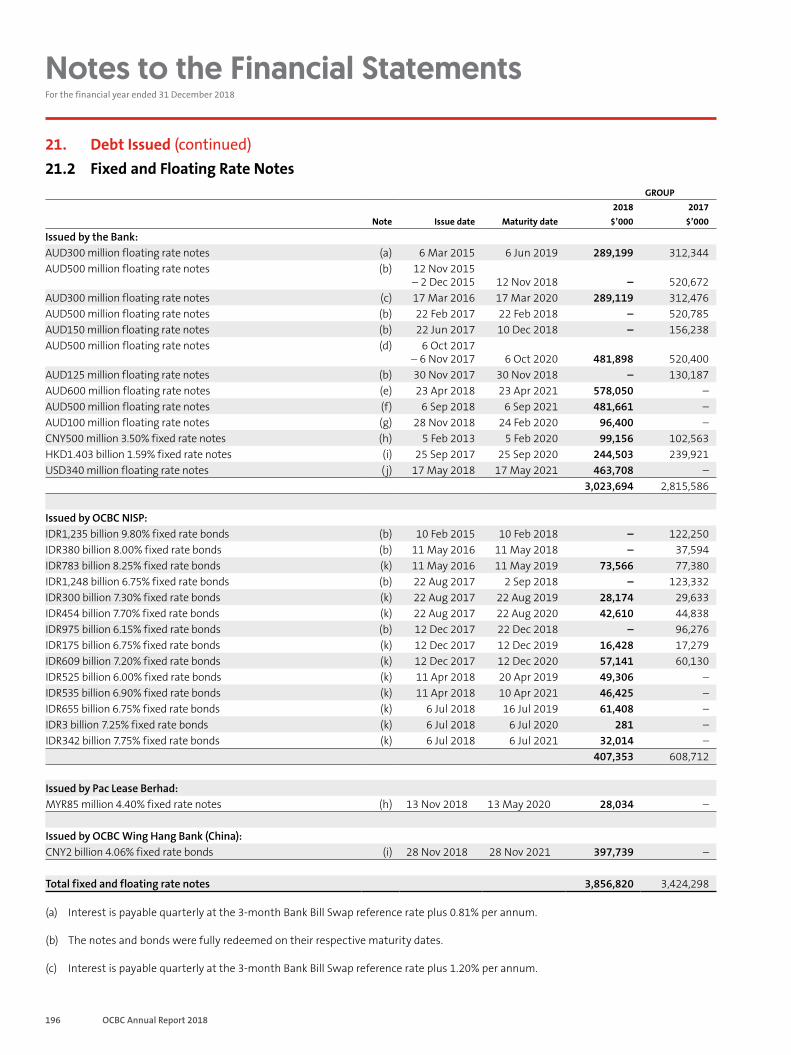
196 OCBC Annual Report 2018
Notes to the Financial Statements For the financial year ended 31 December 2018
21. Debt Issued (continued)21.2 Fixed and Floating Rate Notes
GROUP2018 2017
Note Issue date Maturity date $’000 $’000
Issued by the Bank:AUD300 million floating rate notes (a) 6 Mar 2015 6 Jun 2019 289,199 312,344AUD500 million floating rate notes (b) 12 Nov 2015
– 2 Dec 2015 12 Nov 2018 – 520,672AUD300 million floating rate notes (c) 17 Mar 2016 17 Mar 2020 289,119 312,476AUD500 million floating rate notes (b) 22 Feb 2017 22 Feb 2018 – 520,785 AUD150 million floating rate notes (b) 22 Jun 2017 10 Dec 2018 – 156,238 AUD500 million floating rate notes (d) 6 Oct 2017
– 6 Nov 2017 6 Oct 2020 481,898 520,400 AUD125 million floating rate notes (b) 30 Nov 2017 30 Nov 2018 – 130,187 AUD600 million floating rate notes (e) 23 Apr 2018 23 Apr 2021 578,050 –AUD500 million floating rate notes (f) 6 Sep 2018 6 Sep 2021 481,661 –AUD100 million floating rate notes (g) 28 Nov 2018 24 Feb 2020 96,400 –CNY500 million 3.50% fixed rate notes (h) 5 Feb 2013 5 Feb 2020 99,156 102,563HKD1.403 billion 1.59% fixed rate notes (i) 25 Sep 2017 25 Sep 2020 244,503 239,921USD340 million floating rate notes (j) 17 May 2018 17 May 2021 463,708 –
3,023,694 2,815,586
Issued by OCBC NISP:IDR1,235 billion 9.80% fixed rate bonds (b) 10 Feb 2015 10 Feb 2018 – 122,250IDR380 billion 8.00% fixed rate bonds (b) 11 May 2016 11 May 2018 – 37,594 IDR783 billion 8.25% fixed rate bonds (k) 11 May 2016 11 May 2019 73,566 77,380 IDR1,248 billion 6.75% fixed rate bonds (b) 22 Aug 2017 2 Sep 2018 – 123,332 IDR300 billion 7.30% fixed rate bonds (k) 22 Aug 2017 22 Aug 2019 28,174 29,633 IDR454 billion 7.70% fixed rate bonds (k) 22 Aug 2017 22 Aug 2020 42,610 44,838 IDR975 billion 6.15% fixed rate bonds (b) 12 Dec 2017 22 Dec 2018 – 96,276 IDR175 billion 6.75% fixed rate bonds (k) 12 Dec 2017 12 Dec 2019 16,428 17,279 IDR609 billion 7.20% fixed rate bonds (k) 12 Dec 2017 12 Dec 2020 57,141 60,130 IDR525 billion 6.00% fixed rate bonds (k) 11 Apr 2018 20 Apr 2019 49,306 –IDR535 billion 6.90% fixed rate bonds (k) 11 Apr 2018 10 Apr 2021 46,425 –IDR655 billion 6.75% fixed rate bonds (k) 6 Jul 2018 16 Jul 2019 61,408 –IDR3 billion 7.25% fixed rate bonds (k) 6 Jul 2018 6 Jul 2020 281 –IDR342 billion 7.75% fixed rate bonds (k) 6 Jul 2018 6 Jul 2021 32,014 –
407,353 608,712
Issued by Pac Lease Berhad:MYR85 million 4.40% fixed rate notes (h) 13 Nov 2018 13 May 2020 28,034 –
Issued by OCBC Wing Hang Bank (China):CNY2 billion 4.06% fixed rate bonds (i) 28 Nov 2018 28 Nov 2021 397,739 –
Total fixed and floating rate notes 3,856,820 3,424,298
(a) Interest is payable quarterly at the 3-month Bank Bill Swap reference rate plus 0.81% per annum.
(b) The notes and bonds were fully redeemed on their respective maturity dates.
(c) Interest is payable quarterly at the 3-month Bank Bill Swap reference rate plus 1.20% per annum.

197Financials
21. Debt Issued (continued)21.2 Fixed and Floating Rate Notes (continued) (d) Interest is payable quarterly at the 3-month Bank Bill Swap reference rate plus 0.60% per annum.
(e) Interest is payable quarterly at the 3-month Bank Bill Swap reference rate plus 0.70% per annum.
(f) Interest is payable quarterly at the 3-month Bank Bill Swap reference rate plus 0.72% per annum.
(g) Interest is payable quarterly at the 3-month Bank Bill Swap reference rate plus 0.48% per annum.
(h) Interest is payable semi-annually.
(i) Interest is payable annually.
(j) Interest is payable quarterly at the 3-month US Dollar London Interbank Offer Rate plus 0.45% per annum.
(k) Interest is payable quarterly.
21.3 Commercial Paper GROUP
Note2018
$’0002017
$’000
Issued by the Bank (a) 18,059,731 21,285,101Issued by Pac Lease Berhad (b) 95,566 95,695Total commercial paper issued 18,155,297 21,380,796
(a) The Bank issued the commercial paper under its USD10 billion ECP programme and USD15 billion USCP programme. The notes outstanding as at 31 December 2018 were issued between 11 January 2018 (2017: 8 March 2017) and 17 December 2018 (2017: 22 December 2017), and mature between 3 January 2019 (2017: 4 January 2018) and 18 October 2019 (2017: 4 October 2018), yielding between 0.42% and 3.01% (2017: 0.23% and 1.60%).
(b) A subsidiary of the Group issued the commercial paper under its MYR1 billion 7-year CP/MTN programme. The notes outstanding as at 31 December 2018 were issued between 30 October 2018 (2017: 9 November 2017) and 26 December 2018 (2017: 22 December 2017), and mature between 4 January 2019 (2017: 4 January 2018) and 25 January 2019 (2017: 22 January 2018), with interest rate ranging from 3.90% to 4.10% (2017: 3.87% to 4.05%).
21.4 Structured Notes GROUP
Issue date Maturity date2018
$’0002017
$’000
Issued by the Bank:Credit linked notes 1 Oct 2012 – 26 Dec 2018 15 Jan 2019 – 15 Apr 2025 904,054 980,518Fixed rate notes 9 Oct 2012 – 27 Dec 2012 9 Oct 2037 – 28 Dec 2037 109,166 106,929Bond linked notes 28 Jul 2016 – 23 Oct 2018 16 Jan 2019 – 12 Nov 2027 336,680 194,911Equity linked notes 5 Apr 2017 – 18 Dec 2017 5 Jan 2018 – 10 Apr 2018 – 3,539Index linked notes 12 Feb 2018 – 9 Nov 2018 20 Feb 2019 92,877 –Fund linked notes 3 Jul 2018 – 23 Oct 2018 14 Jul 2020 – 27 Apr 2023 40,044 3,236
1,482,821 1,289,133
The structured notes were issued by the Bank under its Structured Note and Global Medium Term Notes Programmes and were measured at amortised cost, except for $738.5 million (2017: $749.1 million) included under credit linked notes and $336.7 million (2017: $194.9 million) included under bond linked notes as at 31 December 2018 which were measured at fair value through profit or loss.
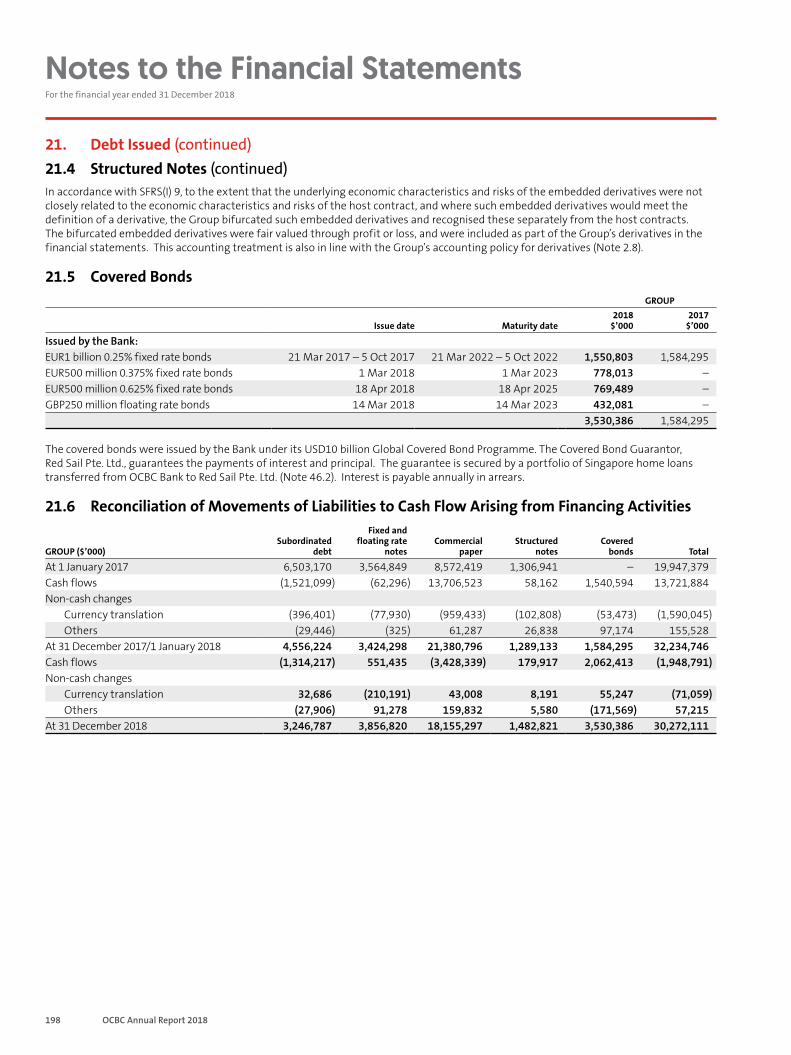
198 OCBC Annual Report 2018
Notes to the Financial Statements For the financial year ended 31 December 2018
21. Debt Issued (continued)21.4 Structured Notes (continued)In accordance with SFRS(I) 9, to the extent that the underlying economic characteristics and risks of the embedded derivatives were not closely related to the economic characteristics and risks of the host contract, and where such embedded derivatives would meet the definition of a derivative, the Group bifurcated such embedded derivatives and recognised these separately from the host contracts. The bifurcated embedded derivatives were fair valued through profit or loss, and were included as part of the Group’s derivatives in the financial statements. This accounting treatment is also in line with the Group’s accounting policy for derivatives (Note 2.8).
21.5 Covered Bonds GROUP
Issue date Maturity date2018
$’0002017
$’000
Issued by the Bank:EUR1 billion 0.25% fixed rate bonds 21 Mar 2017 – 5 Oct 2017 21 Mar 2022 – 5 Oct 2022 1,550,803 1,584,295EUR500 million 0.375% fixed rate bonds 1 Mar 2018 1 Mar 2023 778,013 –EUR500 million 0.625% fixed rate bonds 18 Apr 2018 18 Apr 2025 769,489 –GBP250 million floating rate bonds 14 Mar 2018 14 Mar 2023 432,081 –
3,530,386 1,584,295
The covered bonds were issued by the Bank under its USD10 billion Global Covered Bond Programme. The Covered Bond Guarantor, Red Sail Pte. Ltd., guarantees the payments of interest and principal. The guarantee is secured by a portfolio of Singapore home loans transferred from OCBC Bank to Red Sail Pte. Ltd. (Note 46.2). Interest is payable annually in arrears.
21.6 Reconciliation of Movements of Liabilities to Cash Flow Arising from Financing Activities
GROUP ($’000)Subordinated
debt
Fixed and floating rate
notesCommercial
paperStructured
notesCovered
bonds Total
At 1 January 2017 6,503,170 3,564,849 8,572,419 1,306,941 – 19,947,379Cash flows (1,521,099) (62,296) 13,706,523 58,162 1,540,594 13,721,884Non-cash changes
Currency translation (396,401) (77,930) (959,433) (102,808) (53,473) (1,590,045)Others (29,446) (325) 61,287 26,838 97,174 155,528
At 31 December 2017/1 January 2018 4,556,224 3,424,298 21,380,796 1,289,133 1,584,295 32,234,746Cash flows (1,314,217) 551,435 (3,428,339) 179,917 2,062,413 (1,948,791)Non-cash changes
Currency translation 32,686 (210,191) 43,008 8,191 55,247 (71,059)Others (27,906) 91,278 159,832 5,580 (171,569) 57,215
At 31 December 2018 3,246,787 3,856,820 18,155,297 1,482,821 3,530,386 30,272,111
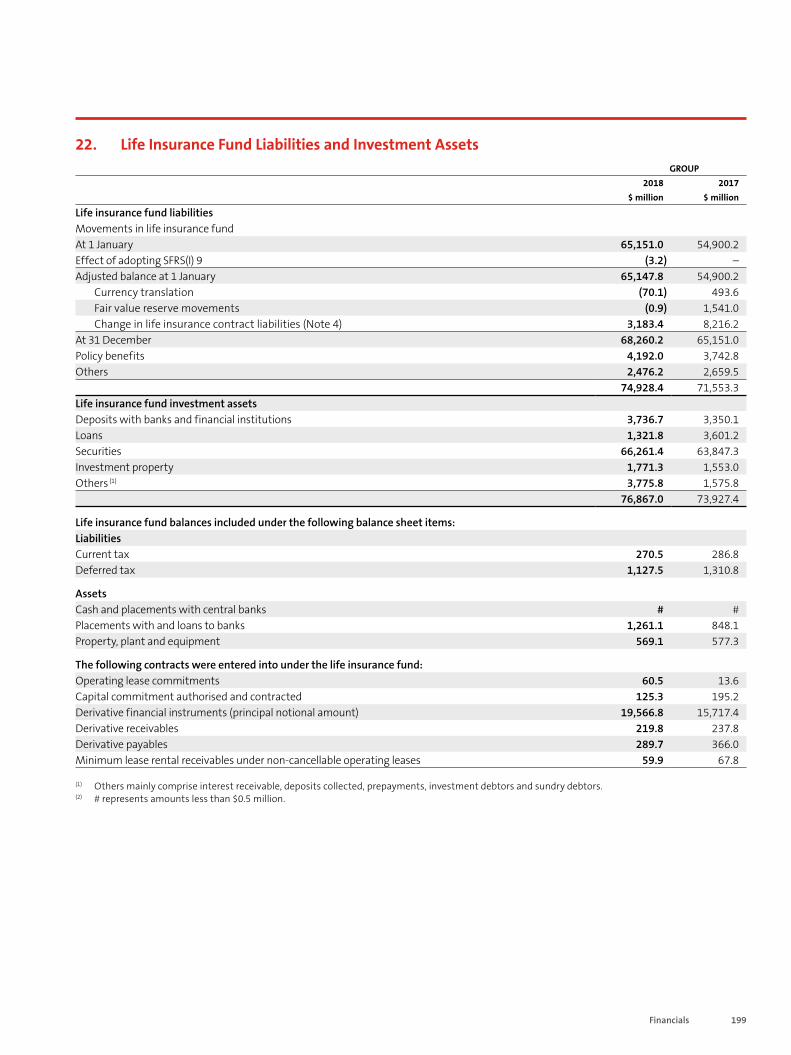
199Financials
22. Life Insurance Fund Liabilities and Investment AssetsGROUP
2018 2017$ million $ million
Life insurance fund liabilitiesMovements in life insurance fundAt 1 January 65,151.0 54,900.2Effect of adopting SFRS(I) 9 (3.2) –Adjusted balance at 1 January 65,147.8 54,900.2
Currency translation (70.1) 493.6Fair value reserve movements (0.9) 1,541.0Change in life insurance contract liabilities (Note 4) 3,183.4 8,216.2
At 31 December 68,260.2 65,151.0Policy benefits 4,192.0 3,742.8Others 2,476.2 2,659.5
74,928.4 71,553.3Life insurance fund investment assetsDeposits with banks and financial institutions 3,736.7 3,350.1Loans 1,321.8 3,601.2Securities 66,261.4 63,847.3Investment property 1,771.3 1,553.0Others (1) 3,775.8 1,575.8
76,867.0 73,927.4
Life insurance fund balances included under the following balance sheet items: LiabilitiesCurrent tax 270.5 286.8 Deferred tax 1,127.5 1,310.8
AssetsCash and placements with central banks # #Placements with and loans to banks 1,261.1 848.1 Property, plant and equipment 569.1 577.3
The following contracts were entered into under the life insurance fund:Operating lease commitments 60.5 13.6Capital commitment authorised and contracted 125.3 195.2Derivative financial instruments (principal notional amount) 19,566.8 15,717.4Derivative receivables 219.8 237.8Derivative payables 289.7 366.0Minimum lease rental receivables under non-cancellable operating leases 59.9 67.8
(1) Others mainly comprise interest receivable, deposits collected, prepayments, investment debtors and sundry debtors.(2) # represents amounts less than $0.5 million.
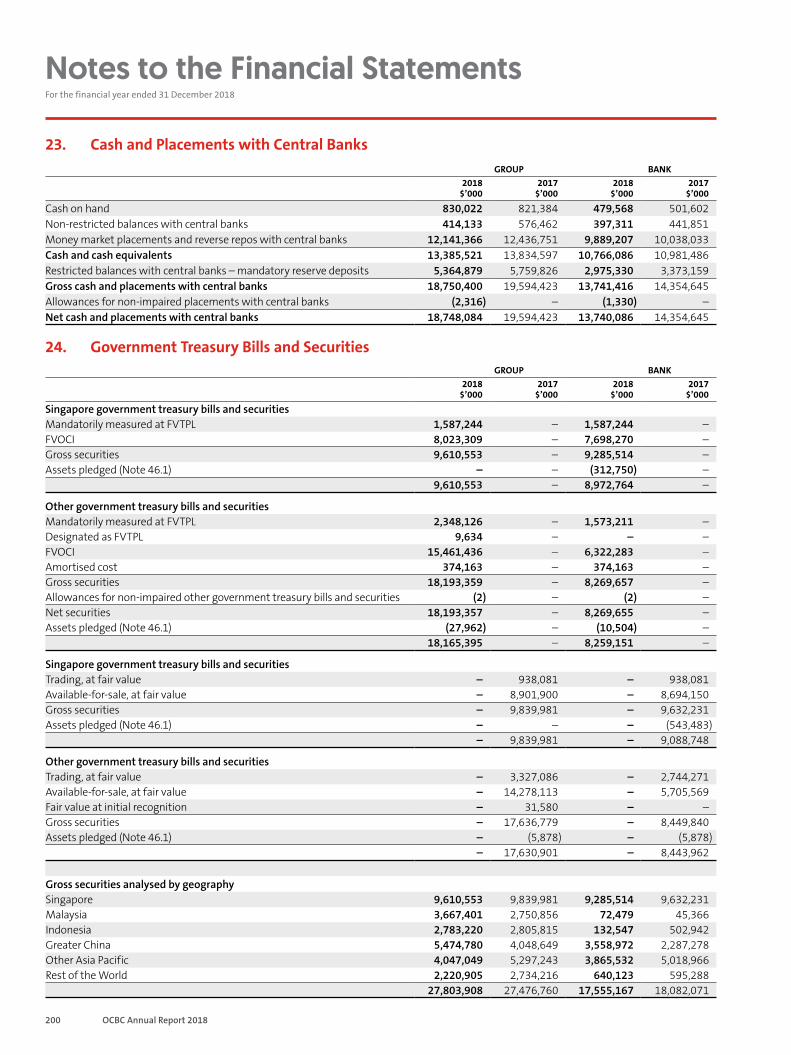
200 OCBC Annual Report 2018
Notes to the Financial Statements For the financial year ended 31 December 2018
23. Cash and Placements with Central BanksGROUP BANK
2018 $’000
2017 $’000
2018 $’000
2017 $’000
Cash on hand 830,022 821,384 479,568 501,602Non-restricted balances with central banks 414,133 576,462 397,311 441,851Money market placements and reverse repos with central banks 12,141,366 12,436,751 9,889,207 10,038,033Cash and cash equivalents 13,385,521 13,834,597 10,766,086 10,981,486Restricted balances with central banks – mandatory reserve deposits 5,364,879 5,759,826 2,975,330 3,373,159Gross cash and placements with central banks 18,750,400 19,594,423 13,741,416 14,354,645Allowances for non-impaired placements with central banks (2,316) – (1,330) –Net cash and placements with central banks 18,748,084 19,594,423 13,740,086 14,354,645
24. Government Treasury Bills and SecuritiesGROUP BANK
2018 $’000
2017 $’000
2018 $’000
2017 $’000
Singapore government treasury bills and securitiesMandatorily measured at FVTPL 1,587,244 – 1,587,244 –FVOCI 8,023,309 – 7,698,270 –Gross securities 9,610,553 – 9,285,514 –Assets pledged (Note 46.1) – – (312,750) –
9,610,553 – 8,972,764 –
Other government treasury bills and securitiesMandatorily measured at FVTPL 2,348,126 – 1,573,211 –Designated as FVTPL 9,634 – – –FVOCI 15,461,436 – 6,322,283 –Amortised cost 374,163 – 374,163 –Gross securities 18,193,359 – 8,269,657 –Allowances for non-impaired other government treasury bills and securities (2) – (2) –Net securities 18,193,357 – 8,269,655 –Assets pledged (Note 46.1) (27,962) – (10,504) –
18,165,395 – 8,259,151 –
Singapore government treasury bills and securitiesTrading, at fair value – 938,081 – 938,081Available-for-sale, at fair value – 8,901,900 – 8,694,150Gross securities – 9,839,981 – 9,632,231Assets pledged (Note 46.1) – – – (543,483)
– 9,839,981 – 9,088,748
Other government treasury bills and securitiesTrading, at fair value – 3,327,086 – 2,744,271Available-for-sale, at fair value – 14,278,113 – 5,705,569Fair value at initial recognition – 31,580 – –Gross securities – 17,636,779 – 8,449,840Assets pledged (Note 46.1) – (5,878) – (5,878)
– 17,630,901 – 8,443,962
Gross securities analysed by geographySingapore 9,610,553 9,839,981 9,285,514 9,632,231Malaysia 3,667,401 2,750,856 72,479 45,366Indonesia 2,783,220 2,805,815 132,547 502,942Greater China 5,474,780 4,048,649 3,558,972 2,287,278Other Asia Pacific 4,047,049 5,297,243 3,865,532 5,018,966Rest of the World 2,220,905 2,734,216 640,123 595,288
27,803,908 27,476,760 17,555,167 18,082,071
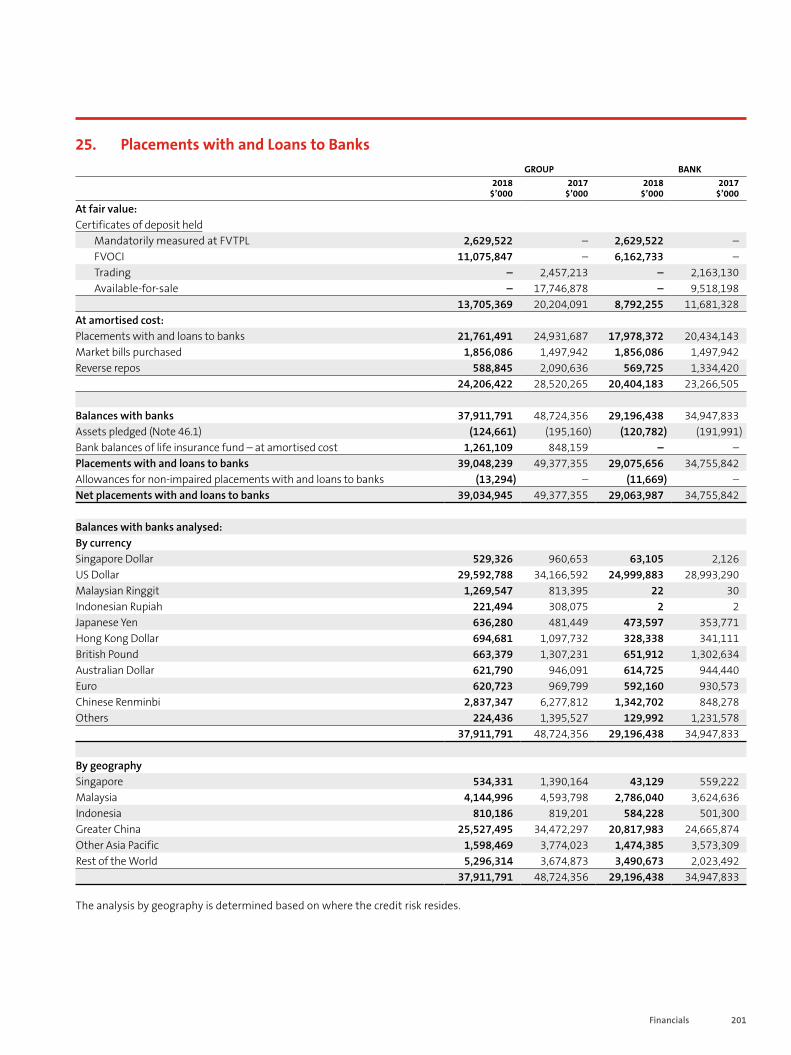
201Financials
25. Placements with and Loans to BanksGROUP BANK
2018 $’000
2017 $’000
2018 $’000
2017 $’000
At fair value:Certificates of deposit held
Mandatorily measured at FVTPL 2,629,522 – 2,629,522 –FVOCI 11,075,847 – 6,162,733 –Trading – 2,457,213 – 2,163,130Available-for-sale – 17,746,878 – 9,518,198
13,705,369 20,204,091 8,792,255 11,681,328At amortised cost:Placements with and loans to banks 21,761,491 24,931,687 17,978,372 20,434,143Market bills purchased 1,856,086 1,497,942 1,856,086 1,497,942Reverse repos 588,845 2,090,636 569,725 1,334,420
24,206,422 28,520,265 20,404,183 23,266,505
Balances with banks 37,911,791 48,724,356 29,196,438 34,947,833Assets pledged (Note 46.1) (124,661) (195,160) (120,782) (191,991)Bank balances of life insurance fund – at amortised cost 1,261,109 848,159 – –Placements with and loans to banks 39,048,239 49,377,355 29,075,656 34,755,842Allowances for non-impaired placements with and loans to banks (13,294) – (11,669) –Net placements with and loans to banks 39,034,945 49,377,355 29,063,987 34,755,842
Balances with banks analysed:By currencySingapore Dollar 529,326 960,653 63,105 2,126US Dollar 29,592,788 34,166,592 24,999,883 28,993,290Malaysian Ringgit 1,269,547 813,395 22 30Indonesian Rupiah 221,494 308,075 2 2Japanese Yen 636,280 481,449 473,597 353,771Hong Kong Dollar 694,681 1,097,732 328,338 341,111British Pound 663,379 1,307,231 651,912 1,302,634Australian Dollar 621,790 946,091 614,725 944,440Euro 620,723 969,799 592,160 930,573Chinese Renminbi 2,837,347 6,277,812 1,342,702 848,278Others 224,436 1,395,527 129,992 1,231,578
37,911,791 48,724,356 29,196,438 34,947,833
By geographySingapore 534,331 1,390,164 43,129 559,222Malaysia 4,144,996 4,593,798 2,786,040 3,624,636Indonesia 810,186 819,201 584,228 501,300Greater China 25,527,495 34,472,297 20,817,983 24,665,874Other Asia Pacific 1,598,469 3,774,023 1,474,385 3,573,309Rest of the World 5,296,314 3,674,873 3,490,673 2,023,492
37,911,791 48,724,356 29,196,438 34,947,833
The analysis by geography is determined based on where the credit risk resides.
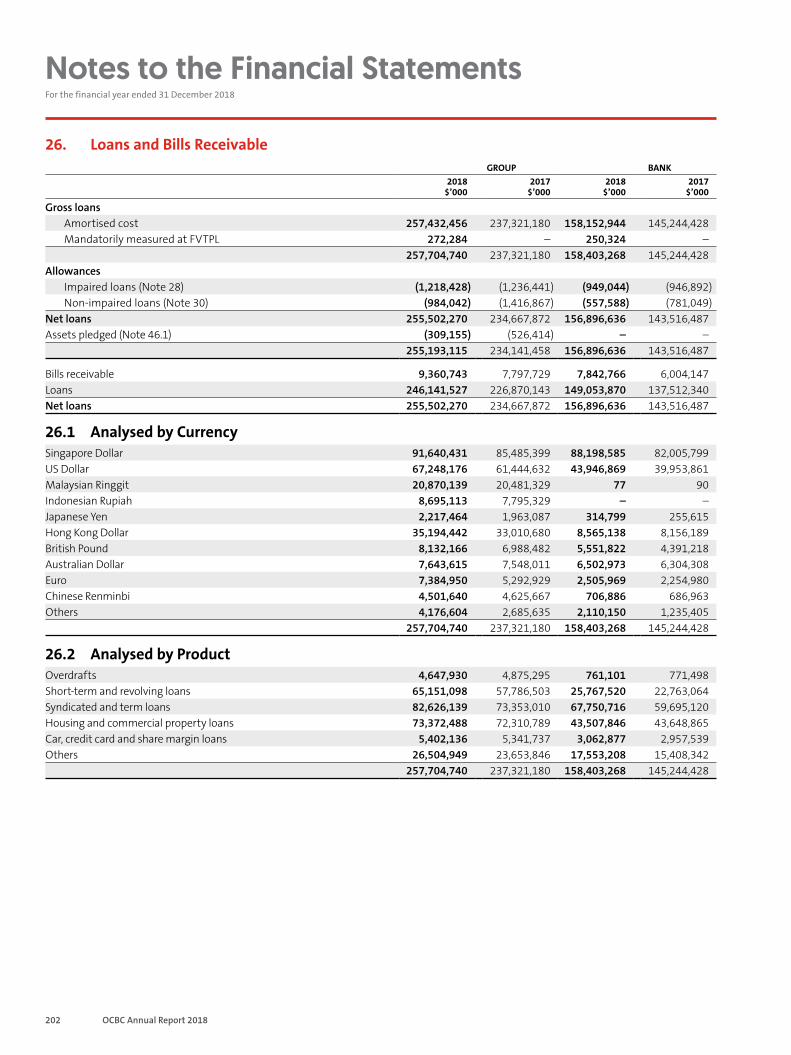
202 OCBC Annual Report 2018
Notes to the Financial Statements For the financial year ended 31 December 2018
26. Loans and Bills ReceivableGROUP BANK
2018 $’000
2017 $’000
2018 $’000
2017 $’000
Gross loansAmortised cost 257,432,456 237,321,180 158,152,944 145,244,428Mandatorily measured at FVTPL 272,284 – 250,324 –
257,704,740 237,321,180 158,403,268 145,244,428Allowances
Impaired loans (Note 28) (1,218,428) (1,236,441) (949,044) (946,892)Non-impaired loans (Note 30) (984,042) (1,416,867) (557,588) (781,049)
Net loans 255,502,270 234,667,872 156,896,636 143,516,487Assets pledged (Note 46.1) (309,155) (526,414) – –
255,193,115 234,141,458 156,896,636 143,516,487
Bills receivable 9,360,743 7,797,729 7,842,766 6,004,147Loans 246,141,527 226,870,143 149,053,870 137,512,340Net loans 255,502,270 234,667,872 156,896,636 143,516,487
26.1 Analysed by CurrencySingapore Dollar 91,640,431 85,485,399 88,198,585 82,005,799US Dollar 67,248,176 61,444,632 43,946,869 39,953,861Malaysian Ringgit 20,870,139 20,481,329 77 90Indonesian Rupiah 8,695,113 7,795,329 – –Japanese Yen 2,217,464 1,963,087 314,799 255,615Hong Kong Dollar 35,194,442 33,010,680 8,565,138 8,156,189British Pound 8,132,166 6,988,482 5,551,822 4,391,218Australian Dollar 7,643,615 7,548,011 6,502,973 6,304,308Euro 7,384,950 5,292,929 2,505,969 2,254,980Chinese Renminbi 4,501,640 4,625,667 706,886 686,963Others 4,176,604 2,685,635 2,110,150 1,235,405
257,704,740 237,321,180 158,403,268 145,244,428
26.2 Analysed by ProductOverdrafts 4,647,930 4,875,295 761,101 771,498Short-term and revolving loans 65,151,098 57,786,503 25,767,520 22,763,064Syndicated and term loans 82,626,139 73,353,010 67,750,716 59,695,120Housing and commercial property loans 73,372,488 72,310,789 43,507,846 43,648,865Car, credit card and share margin loans 5,402,136 5,341,737 3,062,877 2,957,539Others 26,504,949 23,653,846 17,553,208 15,408,342
257,704,740 237,321,180 158,403,268 145,244,428
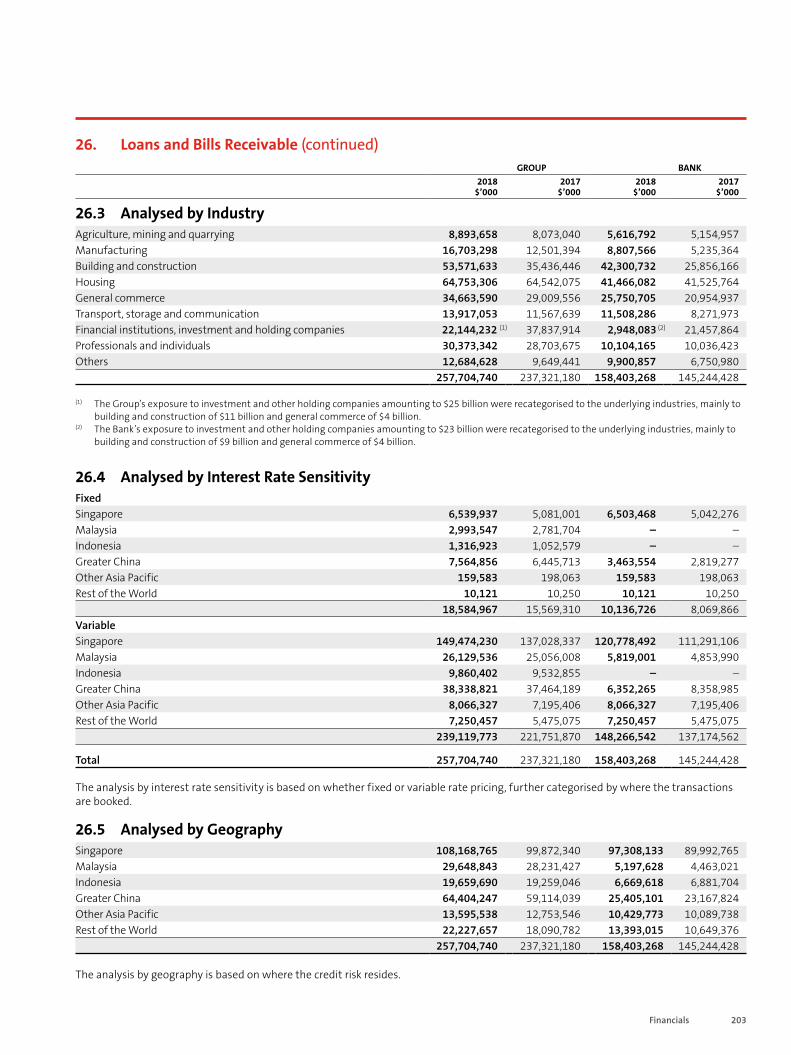
203Financials
26. Loans and Bills Receivable (continued)GROUP BANK
2018 $’000
2017 $’000
2018 $’000
2017 $’000
26.3 Analysed by IndustryAgriculture, mining and quarrying 8,893,658 8,073,040 5,616,792 5,154,957Manufacturing 16,703,298 12,501,394 8,807,566 5,235,364Building and construction 53,571,633 35,436,446 42,300,732 25,856,166Housing 64,753,306 64,542,075 41,466,082 41,525,764General commerce 34,663,590 29,009,556 25,750,705 20,954,937Transport, storage and communication 13,917,053 11,567,639 11,508,286 8,271,973Financial institutions, investment and holding companies 22,144,232 (1) 37,837,914 2,948,083 (2) 21,457,864Professionals and individuals 30,373,342 28,703,675 10,104,165 10,036,423Others 12,684,628 9,649,441 9,900,857 6,750,980
257,704,740 237,321,180 158,403,268 145,244,428
(1) The Group’s exposure to investment and other holding companies amounting to $25 billion were recategorised to the underlying industries, mainly to building and construction of $11 billion and general commerce of $4 billion.
(2) The Bank’s exposure to investment and other holding companies amounting to $23 billion were recategorised to the underlying industries, mainly to building and construction of $9 billion and general commerce of $4 billion.
26.4 Analysed by Interest Rate SensitivityFixedSingapore 6,539,937 5,081,001 6,503,468 5,042,276Malaysia 2,993,547 2,781,704 – –Indonesia 1,316,923 1,052,579 – –Greater China 7,564,856 6,445,713 3,463,554 2,819,277Other Asia Pacific 159,583 198,063 159,583 198,063Rest of the World 10,121 10,250 10,121 10,250
18,584,967 15,569,310 10,136,726 8,069,866VariableSingapore 149,474,230 137,028,337 120,778,492 111,291,106Malaysia 26,129,536 25,056,008 5,819,001 4,853,990Indonesia 9,860,402 9,532,855 – –Greater China 38,338,821 37,464,189 6,352,265 8,358,985Other Asia Pacific 8,066,327 7,195,406 8,066,327 7,195,406Rest of the World 7,250,457 5,475,075 7,250,457 5,475,075
239,119,773 221,751,870 148,266,542 137,174,562
Total 257,704,740 237,321,180 158,403,268 145,244,428
The analysis by interest rate sensitivity is based on whether fixed or variable rate pricing, further categorised by where the transactions are booked.
26.5 Analysed by GeographySingapore 108,168,765 99,872,340 97,308,133 89,992,765Malaysia 29,648,843 28,231,427 5,197,628 4,463,021Indonesia 19,659,690 19,259,046 6,669,618 6,881,704Greater China 64,404,247 59,114,039 25,405,101 23,167,824Other Asia Pacific 13,595,538 12,753,546 10,429,773 10,089,738Rest of the World 22,227,657 18,090,782 13,393,015 10,649,376
257,704,740 237,321,180 158,403,268 145,244,428
The analysis by geography is based on where the credit risk resides.
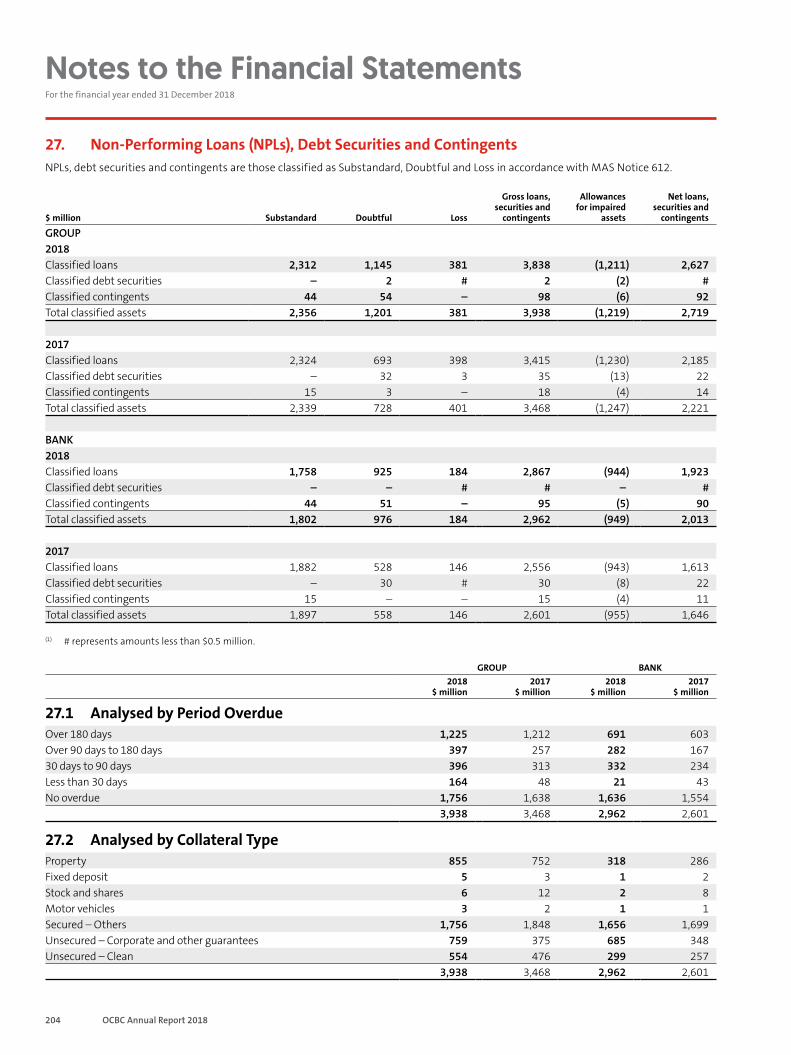
204 OCBC Annual Report 2018
Notes to the Financial Statements For the financial year ended 31 December 2018
27. Non-Performing Loans (NPLs), Debt Securities and ContingentsNPLs, debt securities and contingents are those classified as Substandard, Doubtful and Loss in accordance with MAS Notice 612.
$ million Substandard Doubtful Loss
Gross loans, securities and
contingents
Allowances for impaired
assets
Net loans, securities and
contingents
GROUP2018Classified loans 2,312 1,145 381 3,838 (1,211) 2,627Classified debt securities – 2 # 2 (2) #Classified contingents 44 54 – 98 (6) 92Total classified assets 2,356 1,201 381 3,938 (1,219) 2,719
2017Classified loans 2,324 693 398 3,415 (1,230) 2,185Classified debt securities – 32 3 35 (13) 22Classified contingents 15 3 – 18 (4) 14Total classified assets 2,339 728 401 3,468 (1,247) 2,221
BANK2018Classified loans 1,758 925 184 2,867 (944) 1,923Classified debt securities – – # # – #Classified contingents 44 51 – 95 (5) 90Total classified assets 1,802 976 184 2,962 (949) 2,013
2017Classified loans 1,882 528 146 2,556 (943) 1,613Classified debt securities – 30 # 30 (8) 22Classified contingents 15 – – 15 (4) 11Total classified assets 1,897 558 146 2,601 (955) 1,646
(1) # represents amounts less than $0.5 million.
GROUP BANK2018
$ million2017
$ million2018
$ million2017
$ million
27.1 Analysed by Period OverdueOver 180 days 1,225 1,212 691 603Over 90 days to 180 days 397 257 282 16730 days to 90 days 396 313 332 234Less than 30 days 164 48 21 43No overdue 1,756 1,638 1,636 1,554
3,938 3,468 2,962 2,601
27.2 Analysed by Collateral TypeProperty 855 752 318 286Fixed deposit 5 3 1 2Stock and shares 6 12 2 8Motor vehicles 3 2 1 1Secured – Others 1,756 1,848 1,656 1,699Unsecured – Corporate and other guarantees 759 375 685 348Unsecured – Clean 554 476 299 257
3,938 3,468 2,962 2,601
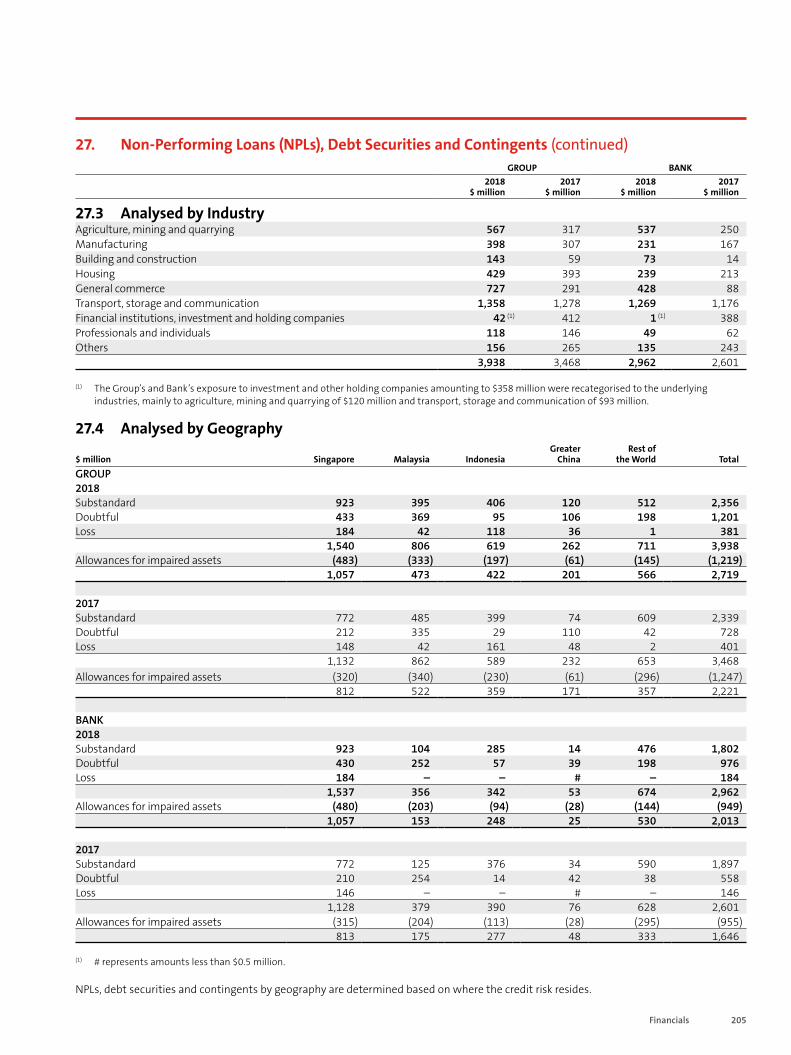
205Financials
27. Non-Performing Loans (NPLs), Debt Securities and Contingents (continued) GROUP BANK
2018 $ million
2017 $ million
2018 $ million
2017 $ million
27.3 Analysed by IndustryAgriculture, mining and quarrying 567 317 537 250Manufacturing 398 307 231 167Building and construction 143 59 73 14Housing 429 393 239 213General commerce 727 291 428 88Transport, storage and communication 1,358 1,278 1,269 1,176Financial institutions, investment and holding companies 42 (1) 412 1 (1) 388Professionals and individuals 118 146 49 62Others 156 265 135 243
3,938 3,468 2,962 2,601
(1) The Group’s and Bank’s exposure to investment and other holding companies amounting to $358 million were recategorised to the underlying industries, mainly to agriculture, mining and quarrying of $120 million and transport, storage and communication of $93 million.
27.4 Analysed by Geography
$ million Singapore Malaysia IndonesiaGreater
ChinaRest of
the World Total
GROUP 2018Substandard 923 395 406 120 512 2,356Doubtful 433 369 95 106 198 1,201Loss 184 42 118 36 1 381
1,540 806 619 262 711 3,938Allowances for impaired assets (483) (333) (197) (61) (145) (1,219)
1,057 473 422 201 566 2,719
2017Substandard 772 485 399 74 609 2,339Doubtful 212 335 29 110 42 728Loss 148 42 161 48 2 401
1,132 862 589 232 653 3,468Allowances for impaired assets (320) (340) (230) (61) (296) (1,247)
812 522 359 171 357 2,221
BANK2018Substandard 923 104 285 14 476 1,802Doubtful 430 252 57 39 198 976Loss 184 – – # – 184
1,537 356 342 53 674 2,962Allowances for impaired assets (480) (203) (94) (28) (144) (949)
1,057 153 248 25 530 2,013
2017Substandard 772 125 376 34 590 1,897Doubtful 210 254 14 42 38 558Loss 146 – – # – 146
1,128 379 390 76 628 2,601Allowances for impaired assets (315) (204) (113) (28) (295) (955)
813 175 277 48 333 1,646
(1) # represents amounts less than $0.5 million.
NPLs, debt securities and contingents by geography are determined based on where the credit risk resides.
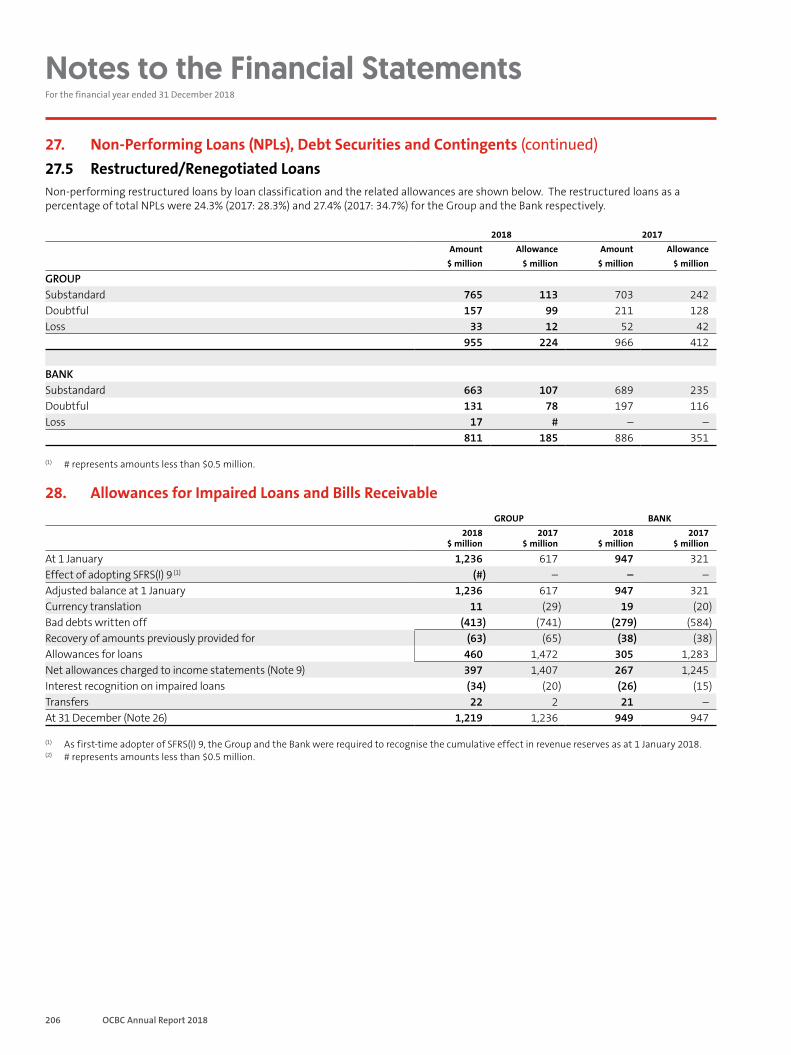
206 OCBC Annual Report 2018
Notes to the Financial Statements For the financial year ended 31 December 2018
27. Non-Performing Loans (NPLs), Debt Securities and Contingents (continued) 27.5 Restructured/Renegotiated LoansNon-performing restructured loans by loan classification and the related allowances are shown below. The restructured loans as a percentage of total NPLs were 24.3% (2017: 28.3%) and 27.4% (2017: 34.7%) for the Group and the Bank respectively.
2018 2017Amount Allowance Amount Allowance
$ million $ million $ million $ million
GROUPSubstandard 765 113 703 242Doubtful 157 99 211 128Loss 33 12 52 42
955 224 966 412
BANKSubstandard 663 107 689 235Doubtful 131 78 197 116Loss 17 # – –
811 185 886 351
(1) # represents amounts less than $0.5 million.
28. Allowances for Impaired Loans and Bills ReceivableGROUP BANK
2018 $ million
2017 $ million
2018 $ million
2017 $ million
At 1 January 1,236 617 947 321Effect of adopting SFRS(I) 9 (1) (#) – – –Adjusted balance at 1 January 1,236 617 947 321Currency translation 11 (29) 19 (20)Bad debts written off (413) (741) (279) (584)Recovery of amounts previously provided for (63) (65) (38) (38)Allowances for loans 460 1,472 305 1,283Net allowances charged to income statements (Note 9) 397 1,407 267 1,245Interest recognition on impaired loans (34) (20) (26) (15)Transfers 22 2 21 –At 31 December (Note 26) 1,219 1,236 949 947
(1) As first-time adopter of SFRS(I) 9, the Group and the Bank were required to recognise the cumulative effect in revenue reserves as at 1 January 2018.(2) # represents amounts less than $0.5 million.

207Financials
28. Allowances for Impaired Loans and Bills Receivable (continued)Analysed by Industry
Cumulative allowances for impaired loans
Net allowances for impaired loans charged to income statements
2018 2017 2018 2017$ million $ million $ million $ million
GROUPAgriculture, mining and quarrying 146 134 69 175Manufacturing 64 63 33 93Building and construction 17 12 6 48Housing 39 42 5 11General commerce 272 139 185 92Transport, storage and communication 499 499 7 694Financial institutions, investment and holding companies 74 124 51 130Professionals and individuals 68 90 26 52Others 40 133 15 112
1,219 1,236 397 1,407BANKAgriculture, mining and quarrying 145 132 20 165Manufacturing 27 19 25 63Building and construction 3 5 (1) 9Housing 7 5 – –General commerce 159 41 123 45Transport, storage and communication 462 450 4 663Financial institutions, investment and holding companies 72 123 50 135Professionals and individuals 42 58 16 42Others 32 114 30 123
949 947 267 1,245
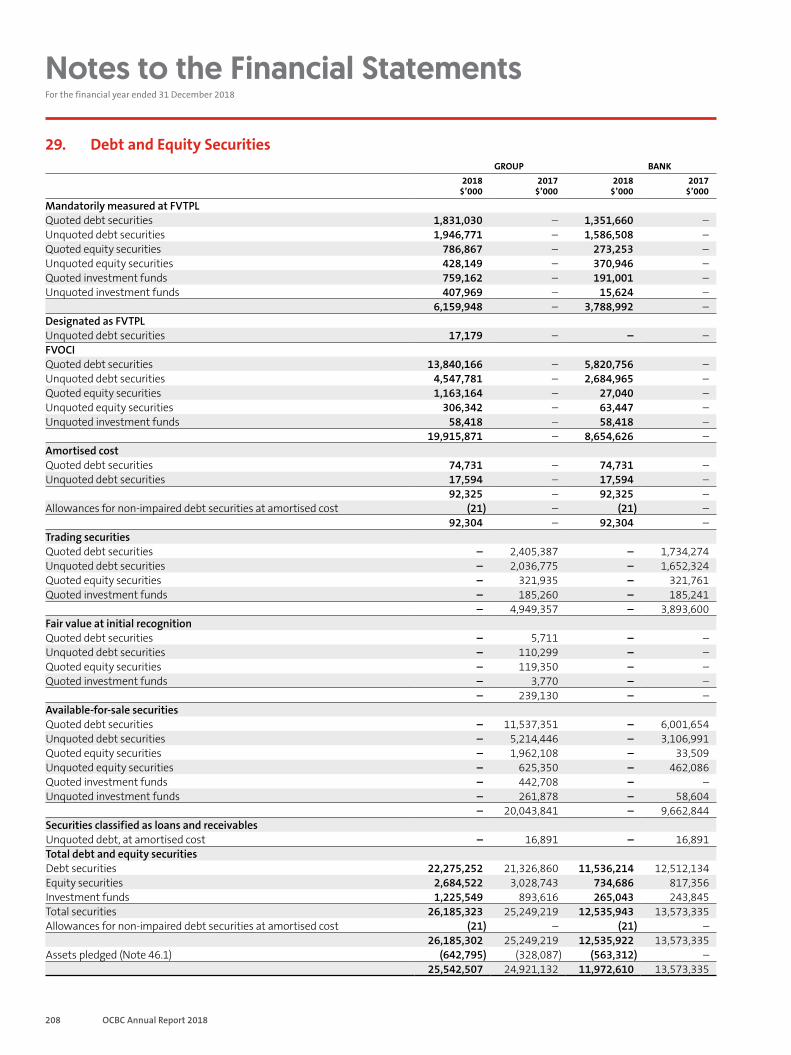
208 OCBC Annual Report 2018
Notes to the Financial Statements For the financial year ended 31 December 2018
29. Debt and Equity SecuritiesGROUP BANK
2018 $’000
2017 $’000
2018 $’000
2017 $’000
Mandatorily measured at FVTPLQuoted debt securities 1,831,030 – 1,351,660 –Unquoted debt securities 1,946,771 – 1,586,508 –Quoted equity securities 786,867 – 273,253 –Unquoted equity securities 428,149 – 370,946 –Quoted investment funds 759,162 – 191,001 –Unquoted investment funds 407,969 – 15,624 –
6,159,948 – 3,788,992 –Designated as FVTPLUnquoted debt securities 17,179 – – –FVOCI Quoted debt securities 13,840,166 – 5,820,756 –Unquoted debt securities 4,547,781 – 2,684,965 –Quoted equity securities 1,163,164 – 27,040 –Unquoted equity securities 306,342 – 63,447 –Unquoted investment funds 58,418 – 58,418 –
19,915,871 – 8,654,626 –Amortised costQuoted debt securities 74,731 – 74,731 –Unquoted debt securities 17,594 – 17,594 –
92,325 – 92,325 –Allowances for non-impaired debt securities at amortised cost (21) – (21) –
92,304 – 92,304 –Trading securitiesQuoted debt securities – 2,405,387 – 1,734,274Unquoted debt securities – 2,036,775 – 1,652,324Quoted equity securities – 321,935 – 321,761Quoted investment funds – 185,260 – 185,241
– 4,949,357 – 3,893,600Fair value at initial recognitionQuoted debt securities – 5,711 – –Unquoted debt securities – 110,299 – –Quoted equity securities – 119,350 – –Quoted investment funds – 3,770 – –
– 239,130 – –Available-for-sale securities Quoted debt securities – 11,537,351 – 6,001,654Unquoted debt securities – 5,214,446 – 3,106,991Quoted equity securities – 1,962,108 – 33,509Unquoted equity securities – 625,350 – 462,086Quoted investment funds – 442,708 – –Unquoted investment funds – 261,878 – 58,604
– 20,043,841 – 9,662,844Securities classified as loans and receivablesUnquoted debt, at amortised cost – 16,891 – 16,891Total debt and equity securitiesDebt securities 22,275,252 21,326,860 11,536,214 12,512,134Equity securities 2,684,522 3,028,743 734,686 817,356Investment funds 1,225,549 893,616 265,043 243,845Total securities 26,185,323 25,249,219 12,535,943 13,573,335Allowances for non-impaired debt securities at amortised cost (21) – (21) –
26,185,302 25,249,219 12,535,922 13,573,335Assets pledged (Note 46.1) (642,795) (328,087) (563,312) –
25,542,507 24,921,132 11,972,610 13,573,335
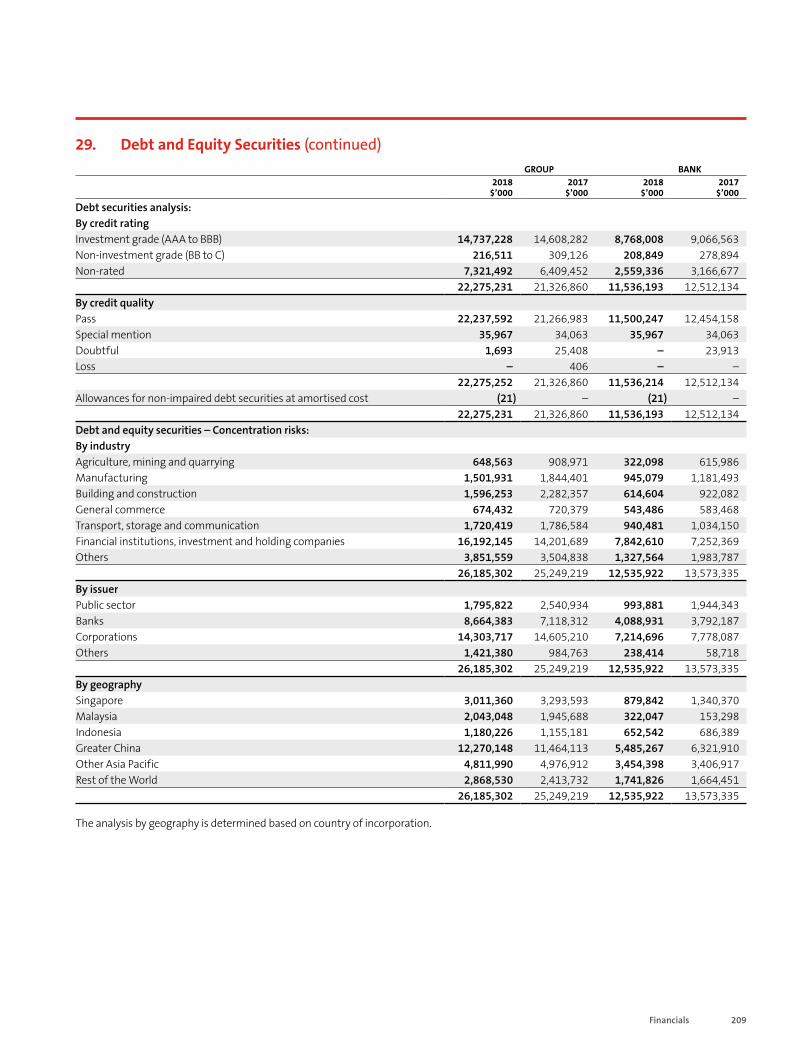
209Financials
29. Debt and Equity Securities (continued)GROUP BANK
2018 $’000
2017 $’000
2018 $’000
2017 $’000
Debt securities analysis:By credit ratingInvestment grade (AAA to BBB) 14,737,228 14,608,282 8,768,008 9,066,563Non-investment grade (BB to C) 216,511 309,126 208,849 278,894Non-rated 7,321,492 6,409,452 2,559,336 3,166,677
22,275,231 21,326,860 11,536,193 12,512,134By credit qualityPass 22,237,592 21,266,983 11,500,247 12,454,158Special mention 35,967 34,063 35,967 34,063Doubtful 1,693 25,408 – 23,913Loss – 406 – –
22,275,252 21,326,860 11,536,214 12,512,134Allowances for non-impaired debt securities at amortised cost (21) – (21) –
22,275,231 21,326,860 11,536,193 12,512,134Debt and equity securities – Concentration risks:By industryAgriculture, mining and quarrying 648,563 908,971 322,098 615,986Manufacturing 1,501,931 1,844,401 945,079 1,181,493Building and construction 1,596,253 2,282,357 614,604 922,082General commerce 674,432 720,379 543,486 583,468Transport, storage and communication 1,720,419 1,786,584 940,481 1,034,150Financial institutions, investment and holding companies 16,192,145 14,201,689 7,842,610 7,252,369Others 3,851,559 3,504,838 1,327,564 1,983,787
26,185,302 25,249,219 12,535,922 13,573,335By issuerPublic sector 1,795,822 2,540,934 993,881 1,944,343Banks 8,664,383 7,118,312 4,088,931 3,792,187Corporations 14,303,717 14,605,210 7,214,696 7,778,087Others 1,421,380 984,763 238,414 58,718
26,185,302 25,249,219 12,535,922 13,573,335By geographySingapore 3,011,360 3,293,593 879,842 1,340,370Malaysia 2,043,048 1,945,688 322,047 153,298Indonesia 1,180,226 1,155,181 652,542 686,389Greater China 12,270,148 11,464,113 5,485,267 6,321,910Other Asia Pacific 4,811,990 4,976,912 3,454,398 3,406,917Rest of the World 2,868,530 2,413,732 1,741,826 1,664,451
26,185,302 25,249,219 12,535,922 13,573,335
The analysis by geography is determined based on country of incorporation.
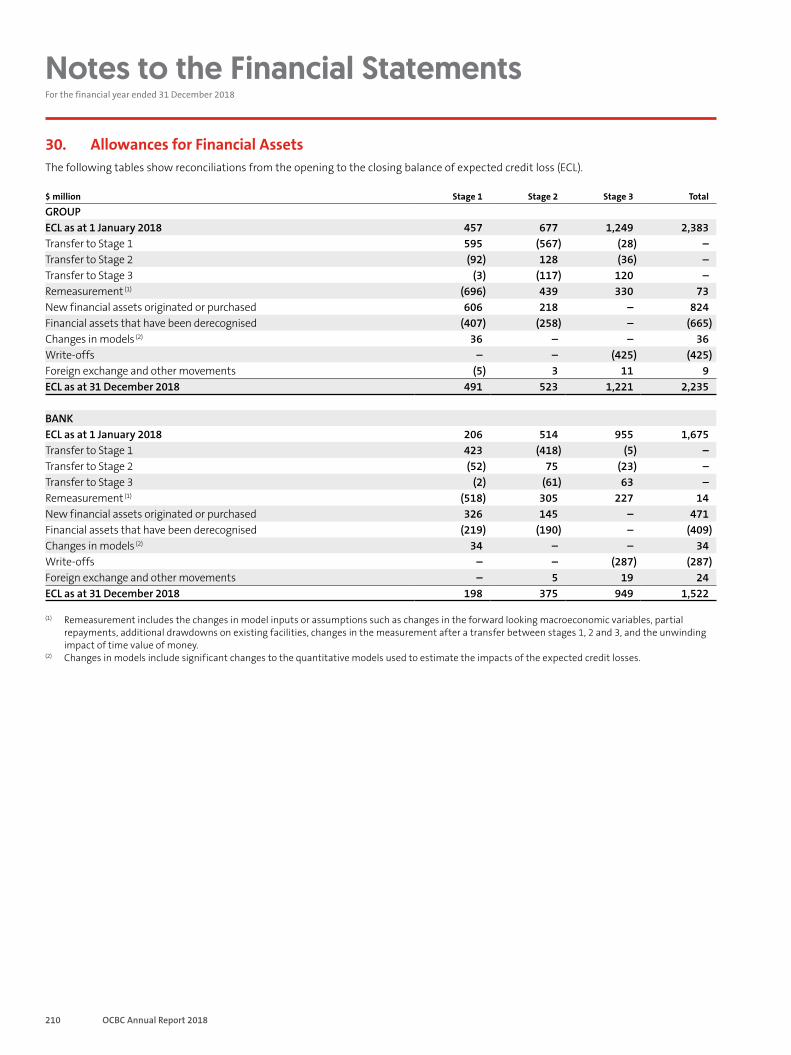
210 OCBC Annual Report 2018
Notes to the Financial Statements For the financial year ended 31 December 2018
30. Allowances for Financial Assets The following tables show reconciliations from the opening to the closing balance of expected credit loss (ECL).
$ million Stage 1 Stage 2 Stage 3 Total
GROUPECL as at 1 January 2018 457 677 1,249 2,383Transfer to Stage 1 595 (567) (28) –Transfer to Stage 2 (92) 128 (36) –Transfer to Stage 3 (3) (117) 120 –Remeasurement (1) (696) 439 330 73New financial assets originated or purchased 606 218 – 824Financial assets that have been derecognised (407) (258) – (665)Changes in models (2) 36 – – 36Write-offs – – (425) (425)Foreign exchange and other movements (5) 3 11 9ECL as at 31 December 2018 491 523 1,221 2,235
BANKECL as at 1 January 2018 206 514 955 1,675Transfer to Stage 1 423 (418) (5) –Transfer to Stage 2 (52) 75 (23) –Transfer to Stage 3 (2) (61) 63 –Remeasurement (1) (518) 305 227 14New financial assets originated or purchased 326 145 – 471Financial assets that have been derecognised (219) (190) – (409)Changes in models (2) 34 – – 34Write-offs – – (287) (287)Foreign exchange and other movements – 5 19 24ECL as at 31 December 2018 198 375 949 1,522
(1) Remeasurement includes the changes in model inputs or assumptions such as changes in the forward looking macroeconomic variables, partial repayments, additional drawdowns on existing facilities, changes in the measurement after a transfer between stages 1, 2 and 3, and the unwinding impact of time value of money.
(2) Changes in models include significant changes to the quantitative models used to estimate the impacts of the expected credit losses.

211Financials
30. Allowances for Financial Assets (continued)Analysed by Main Class of Financial InstrumentsLoans and bills receivable at amortised cost (3)
$ million Stage 1 Stage 2 Stage 3 Total
GROUPECL as at 1 January 2018 433 655 1,236 2,324Transfer to Stage 1 580 (552) (28) –Transfer to Stage 2 (91) 127 (36) –Transfer to Stage 3 (3) (117) 120 –Remeasurement (1) (689) 437 329 77New financial assets originated or purchased 563 212 – 775Financial assets that have been derecognised (361) (246) – (607)Changes in models (2) 36 – – 36Write-offs – – (413) (413)Foreign exchange and other movements (2) 2 11 11ECL as at 31 December 2018 466 518 1,219 2,203
BANKECL as at 1 January 2018 191 495 947 1,633Transfer to Stage 1 408 (403) (5) –Transfer to Stage 2 (51) 74 (23) –Transfer to Stage 3 (2) (61) 63 –Remeasurement (1) (513) 305 227 19New financial assets originated or purchased 294 144 – 438Financial assets that have been derecognised (179) (184) – (363)Changes in models (2) 34 – – 34Write-offs – – (279) (279)Foreign exchange and other movements 2 4 19 25ECL as at 31 December 2018 184 374 949 1,507
(1) Remeasurement includes the changes in model inputs or assumptions such as changes in the forward looking macroeconomic variables, partial repayments, additional drawdowns on existing facilities, changes in the measurement after a transfer between stages 1, 2 and 3, and the unwinding impact of time value of money.
(2) Changes in models include significant changes to the quantitative models used to estimate the impacts of the expected credit losses.(3) Includes ECL on contingent liabilities and other credit commitments.
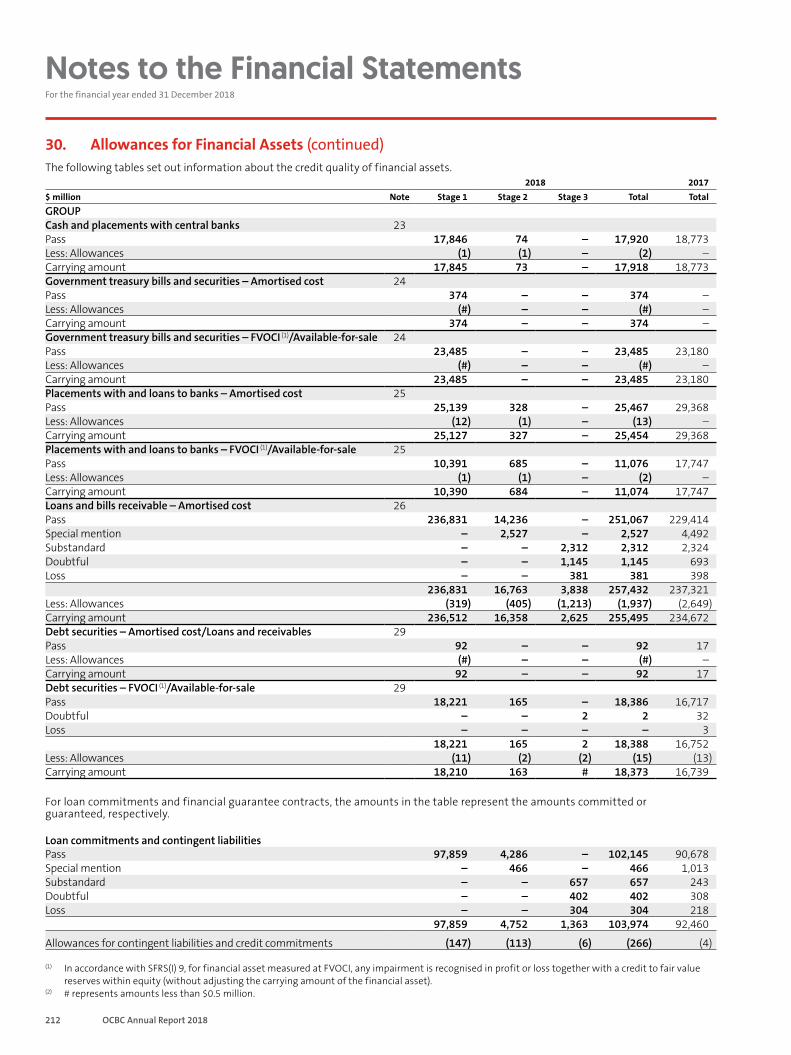
212 OCBC Annual Report 2018
Notes to the Financial Statements For the financial year ended 31 December 2018
30. Allowances for Financial Assets (continued)The following tables set out information about the credit quality of financial assets.
2018 2017$ million Note Stage 1 Stage 2 Stage 3 Total TotalGROUPCash and placements with central banks 23Pass 17,846 74 – 17,920 18,773Less: Allowances (1) (1) – (2) –Carrying amount 17,845 73 – 17,918 18,773Government treasury bills and securities – Amortised cost 24Pass 374 – – 374 –Less: Allowances (#) – – (#) –Carrying amount 374 – – 374 –Government treasury bills and securities – FVOCI (1)/Available-for-sale 24Pass 23,485 – – 23,485 23,180Less: Allowances (#) – – (#) –Carrying amount 23,485 – – 23,485 23,180Placements with and loans to banks – Amortised cost 25Pass 25,139 328 – 25,467 29,368Less: Allowances (12) (1) – (13) –Carrying amount 25,127 327 – 25,454 29,368Placements with and loans to banks – FVOCI (1)/Available-for-sale 25Pass 10,391 685 – 11,076 17,747Less: Allowances (1) (1) – (2) –Carrying amount 10,390 684 – 11,074 17,747Loans and bills receivable – Amortised cost 26Pass 236,831 14,236 – 251,067 229,414 Special mention – 2,527 – 2,527 4,492 Substandard – – 2,312 2,312 2,324 Doubtful – – 1,145 1,145 693 Loss – – 381 381 398
236,831 16,763 3,838 257,432 237,321Less: Allowances (319) (405) (1,213) (1,937) (2,649)Carrying amount 236,512 16,358 2,625 255,495 234,672Debt securities – Amortised cost/Loans and receivables 29Pass 92 – – 92 17Less: Allowances (#) – – (#) –Carrying amount 92 – – 92 17Debt securities – FVOCI (1)/Available-for-sale 29Pass 18,221 165 – 18,386 16,717Doubtful – – 2 2 32Loss – – – – 3
18,221 165 2 18,388 16,752Less: Allowances (11) (2) (2) (15) (13)Carrying amount 18,210 163 # 18,373 16,739
For loan commitments and financial guarantee contracts, the amounts in the table represent the amounts committed or guaranteed, respectively.
Loan commitments and contingent liabilitiesPass 97,859 4,286 – 102,145 90,678Special mention – 466 – 466 1,013Substandard – – 657 657 243Doubtful – – 402 402 308Loss – – 304 304 218
97,859 4,752 1,363 103,974 92,460
Allowances for contingent liabilities and credit commitments (147) (113) (6) (266) (4)
(1) In accordance with SFRS(I) 9, for financial asset measured at FVOCI, any impairment is recognised in profit or loss together with a credit to fair value reserves within equity (without adjusting the carrying amount of the financial asset).
(2) # represents amounts less than $0.5 million.
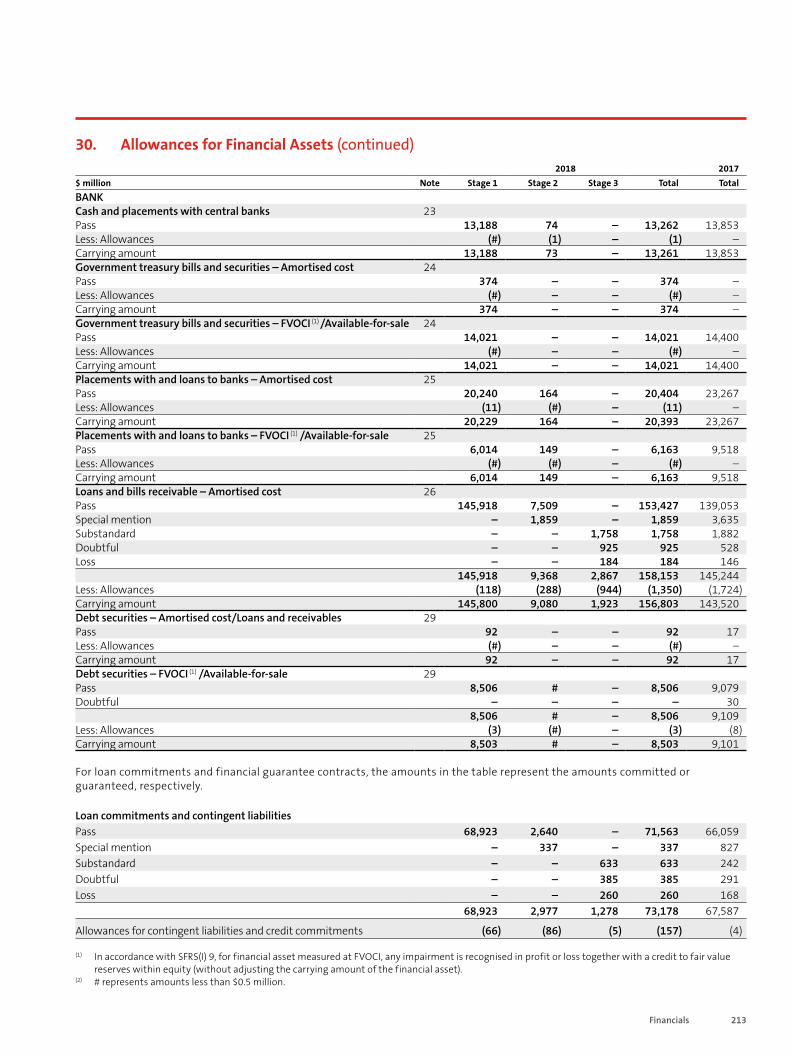
213Financials
30. Allowances for Financial Assets (continued)2018 2017
$ million Note Stage 1 Stage 2 Stage 3 Total TotalBANKCash and placements with central banks 23Pass 13,188 74 – 13,262 13,853Less: Allowances (#) (1) – (1) –Carrying amount 13,188 73 – 13,261 13,853Government treasury bills and securities – Amortised cost 24Pass 374 – – 374 –Less: Allowances (#) – – (#) –Carrying amount 374 – – 374 –Government treasury bills and securities – FVOCI (1) /Available-for-sale 24Pass 14,021 – – 14,021 14,400Less: Allowances (#) – – (#) –Carrying amount 14,021 – – 14,021 14,400Placements with and loans to banks – Amortised cost 25Pass 20,240 164 – 20,404 23,267Less: Allowances (11) (#) – (11) –Carrying amount 20,229 164 – 20,393 23,267Placements with and loans to banks – FVOCI (1) /Available-for-sale 25Pass 6,014 149 – 6,163 9,518Less: Allowances (#) (#) – (#) –Carrying amount 6,014 149 – 6,163 9,518Loans and bills receivable – Amortised cost 26Pass 145,918 7,509 – 153,427 139,053Special mention – 1,859 – 1,859 3,635Substandard – – 1,758 1,758 1,882Doubtful – – 925 925 528Loss – – 184 184 146
145,918 9,368 2,867 158,153 145,244Less: Allowances (118) (288) (944) (1,350) (1,724)Carrying amount 145,800 9,080 1,923 156,803 143,520Debt securities – Amortised cost/Loans and receivables 29Pass 92 – – 92 17Less: Allowances (#) – – (#) –Carrying amount 92 – – 92 17Debt securities – FVOCI (1) /Available-for-sale 29Pass 8,506 # – 8,506 9,079Doubtful – – – – 30
8,506 # – 8,506 9,109Less: Allowances (3) (#) – (3) (8)Carrying amount 8,503 # – 8,503 9,101
For loan commitments and financial guarantee contracts, the amounts in the table represent the amounts committed or guaranteed, respectively.
Loan commitments and contingent liabilitiesPass 68,923 2,640 – 71,563 66,059Special mention – 337 – 337 827Substandard – – 633 633 242Doubtful – – 385 385 291Loss – – 260 260 168
68,923 2,977 1,278 73,178 67,587
Allowances for contingent liabilities and credit commitments (66) (86) (5) (157) (4)
(1) In accordance with SFRS(I) 9, for financial asset measured at FVOCI, any impairment is recognised in profit or loss together with a credit to fair value reserves within equity (without adjusting the carrying amount of the financial asset).
(2) # represents amounts less than $0.5 million.
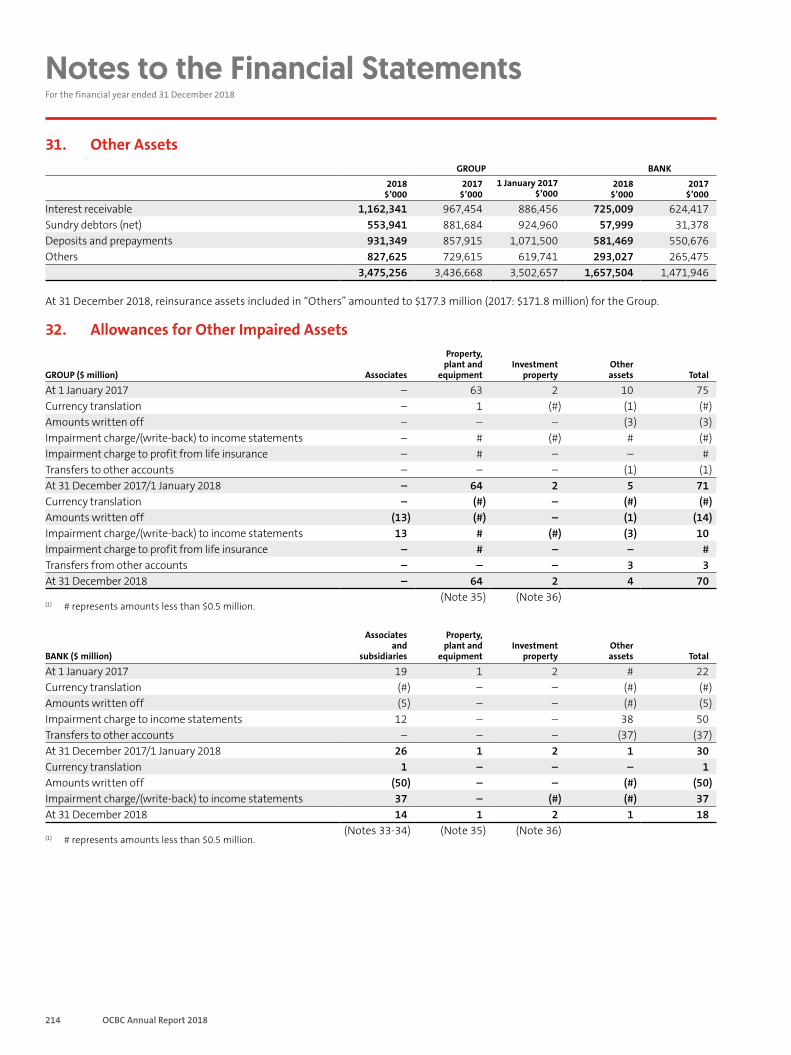
214 OCBC Annual Report 2018
Notes to the Financial Statements For the financial year ended 31 December 2018
31. Other AssetsGROUP BANK
2018 $’000
2017 $’000
1 January 2017$’000
2018 $’000
2017 $’000
Interest receivable 1,162,341 967,454 886,456 725,009 624,417Sundry debtors (net) 553,941 881,684 924,960 57,999 31,378Deposits and prepayments 931,349 857,915 1,071,500 581,469 550,676Others 827,625 729,615 619,741 293,027 265,475
3,475,256 3,436,668 3,502,657 1,657,504 1,471,946
At 31 December 2018, reinsurance assets included in “Others” amounted to $177.3 million (2017: $171.8 million) for the Group.
32. Allowances for Other Impaired Assets
GROUP ($ million) Associates
Property, plant and
equipmentInvestment
propertyOtherassets Total
At 1 January 2017 – 63 2 10 75Currency translation – 1 (#) (1) (#)Amounts written off – – – (3) (3)Impairment charge/(write-back) to income statements – # (#) # (#)Impairment charge to profit from life insurance – # – – #Transfers to other accounts – – – (1) (1)At 31 December 2017/1 January 2018 – 64 2 5 71Currency translation – (#) – (#) (#)Amounts written off (13) (#) – (1) (14)Impairment charge/(write-back) to income statements 13 # (#) (3) 10Impairment charge to profit from life insurance – # – – #Transfers from other accounts – – – 3 3At 31 December 2018 – 64 2 4 70
(Note 35) (Note 36)(1) # represents amounts less than $0.5 million.
BANK ($ million)
Associates and
subsidiaries
Property, plant and
equipmentInvestment
property Other assets Total
At 1 January 2017 19 1 2 # 22Currency translation (#) – – (#) (#)Amounts written off (5) – – (#) (5)Impairment charge to income statements 12 – – 38 50Transfers to other accounts – – – (37) (37)At 31 December 2017/1 January 2018 26 1 2 1 30Currency translation 1 – – – 1Amounts written off (50) – – (#) (50)Impairment charge/(write-back) to income statements 37 – (#) (#) 37At 31 December 2018 14 1 2 1 18
(Notes 33-34) (Note 35) (Note 36)(1) # represents amounts less than $0.5 million.
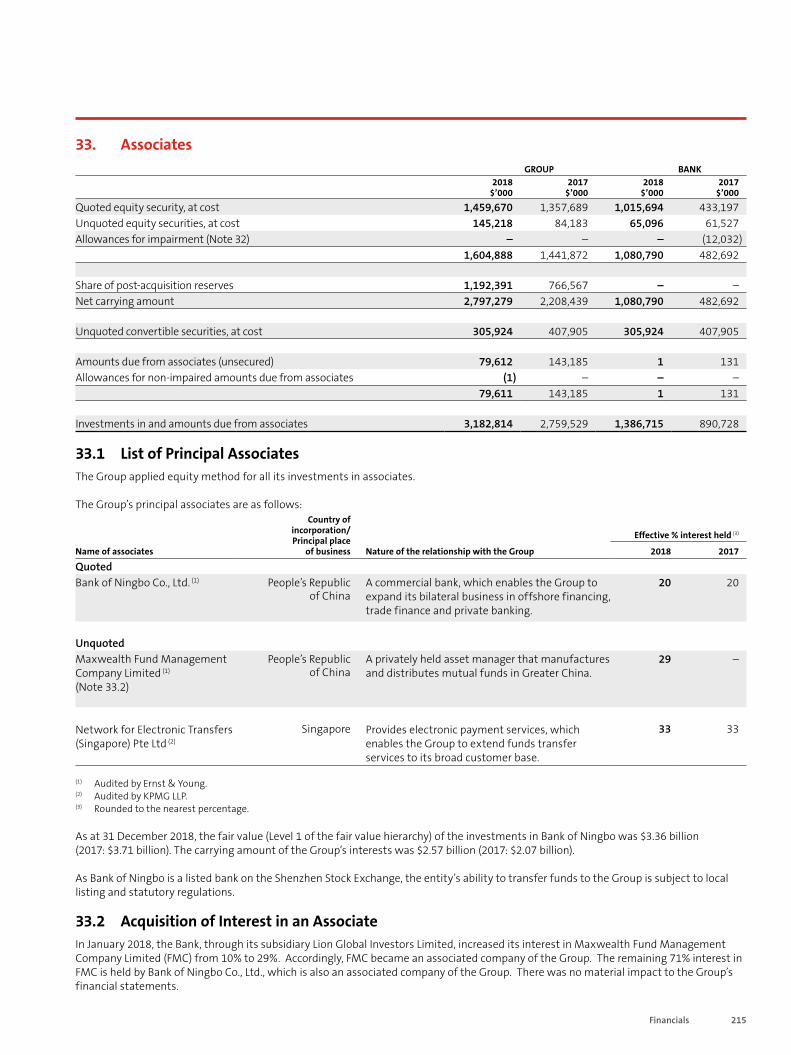
215Financials
33. AssociatesGROUP BANK
2018 $’000
2017 $’000
2018 $’000
2017 $’000
Quoted equity security, at cost 1,459,670 1,357,689 1,015,694 433,197Unquoted equity securities, at cost 145,218 84,183 65,096 61,527Allowances for impairment (Note 32) – – – (12,032)
1,604,888 1,441,872 1,080,790 482,692
Share of post-acquisition reserves 1,192,391 766,567 – –Net carrying amount 2,797,279 2,208,439 1,080,790 482,692
Unquoted convertible securities, at cost 305,924 407,905 305,924 407,905
Amounts due from associates (unsecured) 79,612 143,185 1 131Allowances for non-impaired amounts due from associates (1) – – –
79,611 143,185 1 131
Investments in and amounts due from associates 3,182,814 2,759,529 1,386,715 890,728
33.1 List of Principal AssociatesThe Group applied equity method for all its investments in associates.
The Group’s principal associates are as follows:Country of
incorporation/ Principal place
of business
Effective % interest held (3)
Name of associates Nature of the relationship with the Group 2018 2017
QuotedBank of Ningbo Co., Ltd. (1) People’s Republic
of ChinaA commercial bank, which enables the Group to expand its bilateral business in offshore financing, trade finance and private banking.
20 20
UnquotedMaxwealth Fund Management Company Limited (1)
(Note 33.2)
People’s Republic of China
A privately held asset manager that manufactures and distributes mutual funds in Greater China.
29 –
Network for Electronic Transfers (Singapore) Pte Ltd (2)
Singapore Provides electronic payment services, which enables the Group to extend funds transfer services to its broad customer base.
33 33
(1) Audited by Ernst & Young.(2) Audited by KPMG LLP.(3) Rounded to the nearest percentage.
As at 31 December 2018, the fair value (Level 1 of the fair value hierarchy) of the investments in Bank of Ningbo was $3.36 billion (2017: $3.71 billion). The carrying amount of the Group’s interests was $2.57 billion (2017: $2.07 billion).
As Bank of Ningbo is a listed bank on the Shenzhen Stock Exchange, the entity’s ability to transfer funds to the Group is subject to local listing and statutory regulations.
33.2 Acquisition of Interest in an AssociateIn January 2018, the Bank, through its subsidiary Lion Global Investors Limited, increased its interest in Maxwealth Fund Management Company Limited (FMC) from 10% to 29%. Accordingly, FMC became an associated company of the Group. The remaining 71% interest in FMC is held by Bank of Ningbo Co., Ltd., which is also an associated company of the Group. There was no material impact to the Group’s financial statements.
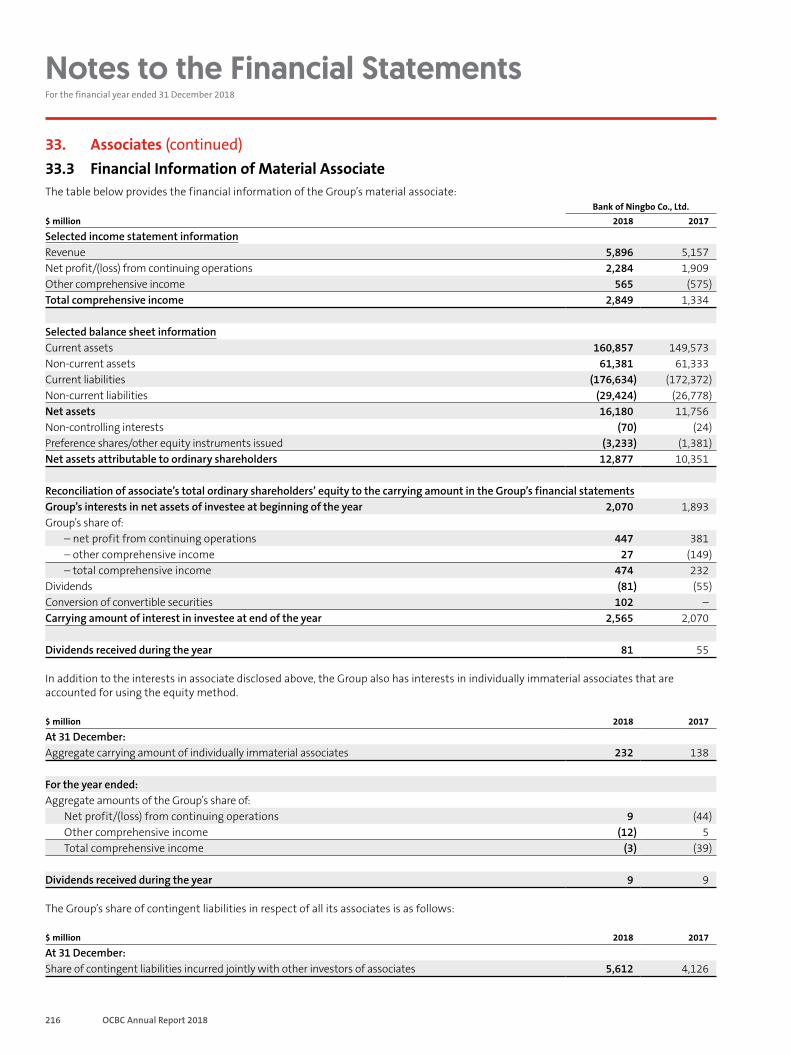
216 OCBC Annual Report 2018
Notes to the Financial Statements For the financial year ended 31 December 2018
33. Associates (continued)33.3 Financial Information of Material AssociateThe table below provides the financial information of the Group’s material associate:
Bank of Ningbo Co., Ltd.$ million 2018 2017
Selected income statement informationRevenue 5,896 5,157Net profit/(loss) from continuing operations 2,284 1,909Other comprehensive income 565 (575)Total comprehensive income 2,849 1,334
Selected balance sheet informationCurrent assets 160,857 149,573Non-current assets 61,381 61,333Current liabilities (176,634) (172,372)Non-current liabilities (29,424) (26,778)Net assets 16,180 11,756Non-controlling interests (70) (24)Preference shares/other equity instruments issued (3,233) (1,381)Net assets attributable to ordinary shareholders 12,877 10,351
Reconciliation of associate’s total ordinary shareholders’ equity to the carrying amount in the Group’s financial statementsGroup’s interests in net assets of investee at beginning of the year 2,070 1,893Group’s share of:
– net profit from continuing operations 447 381– other comprehensive income 27 (149)– total comprehensive income 474 232
Dividends (81) (55)Conversion of convertible securities 102 –Carrying amount of interest in investee at end of the year 2,565 2,070
Dividends received during the year 81 55
In addition to the interests in associate disclosed above, the Group also has interests in individually immaterial associates that are accounted for using the equity method.
$ million 2018 2017
At 31 December:Aggregate carrying amount of individually immaterial associates 232 138
For the year ended:Aggregate amounts of the Group’s share of:
Net profit/(loss) from continuing operations 9 (44)Other comprehensive income (12) 5Total comprehensive income (3) (39)
Dividends received during the year 9 9
The Group’s share of contingent liabilities in respect of all its associates is as follows:
$ million 2018 2017
At 31 December:Share of contingent liabilities incurred jointly with other investors of associates 5,612 4,126
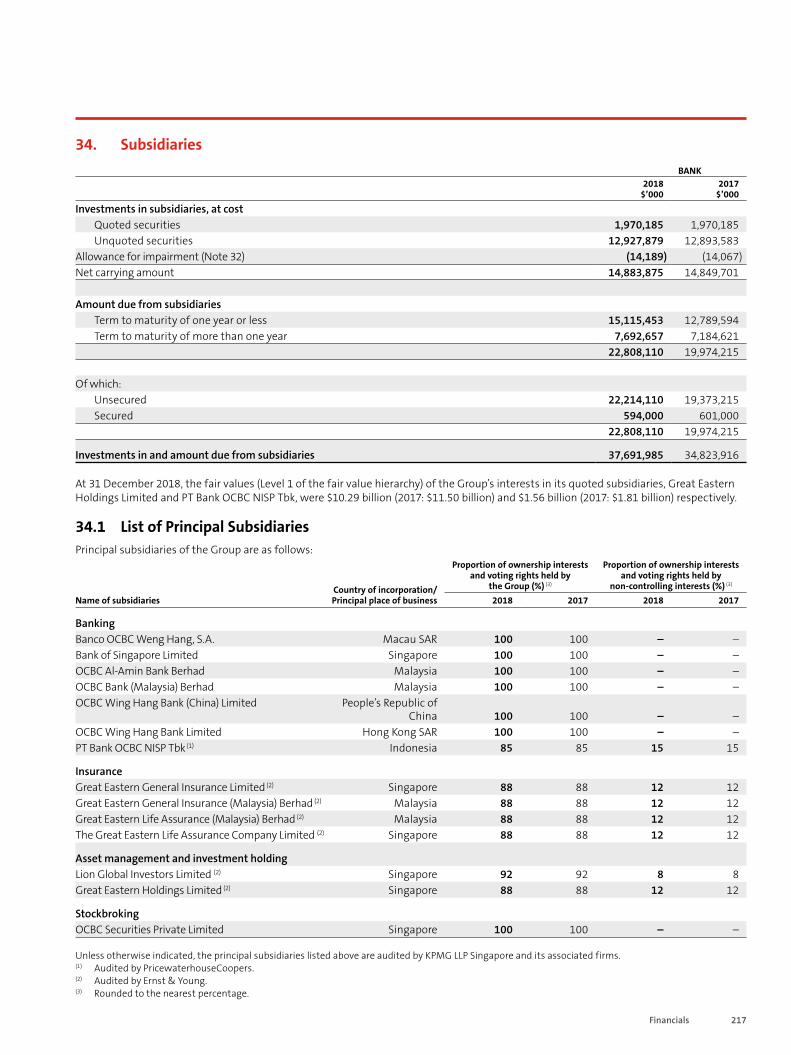
217Financials
34. SubsidiariesBANK
2018 $’000
2017 $’000
Investments in subsidiaries, at costQuoted securities 1,970,185 1,970,185Unquoted securities 12,927,879 12,893,583
Allowance for impairment (Note 32) (14,189) (14,067)Net carrying amount 14,883,875 14,849,701
Amount due from subsidiariesTerm to maturity of one year or less 15,115,453 12,789,594Term to maturity of more than one year 7,692,657 7,184,621
22,808,110 19,974,215
Of which:Unsecured 22,214,110 19,373,215Secured 594,000 601,000
22,808,110 19,974,215
Investments in and amount due from subsidiaries 37,691,985 34,823,916
At 31 December 2018, the fair values (Level 1 of the fair value hierarchy) of the Group’s interests in its quoted subsidiaries, Great Eastern Holdings Limited and PT Bank OCBC NISP Tbk, were $10.29 billion (2017: $11.50 billion) and $1.56 billion (2017: $1.81 billion) respectively.
34.1 List of Principal SubsidiariesPrincipal subsidiaries of the Group are as follows:
Country of incorporation/Principal place of business
Proportion of ownership interests and voting rights held by
the Group (%) (3)
Proportion of ownership interests and voting rights held by
non-controlling interests (%) (3)
Name of subsidiaries 2018 2017 2018 2017
BankingBanco OCBC Weng Hang, S.A. Macau SAR 100 100 – –Bank of Singapore Limited Singapore 100 100 – –OCBC Al-Amin Bank Berhad Malaysia 100 100 – –OCBC Bank (Malaysia) Berhad Malaysia 100 100 – –OCBC Wing Hang Bank (China) Limited People’s Republic of
China 100 100 – –OCBC Wing Hang Bank Limited Hong Kong SAR 100 100 – –PT Bank OCBC NISP Tbk (1) Indonesia 85 85 15 15
InsuranceGreat Eastern General Insurance Limited (2) Singapore 88 88 12 12Great Eastern General Insurance (Malaysia) Berhad (2) Malaysia 88 88 12 12Great Eastern Life Assurance (Malaysia) Berhad (2) Malaysia 88 88 12 12The Great Eastern Life Assurance Company Limited (2) Singapore 88 88 12 12
Asset management and investment holdingLion Global Investors Limited (2) Singapore 92 92 8 8Great Eastern Holdings Limited (2) Singapore 88 88 12 12
StockbrokingOCBC Securities Private Limited Singapore 100 100 – –
Unless otherwise indicated, the principal subsidiaries listed above are audited by KPMG LLP Singapore and its associated firms.(1) Audited by PricewaterhouseCoopers.(2) Audited by Ernst & Young.(3) Rounded to the nearest percentage.
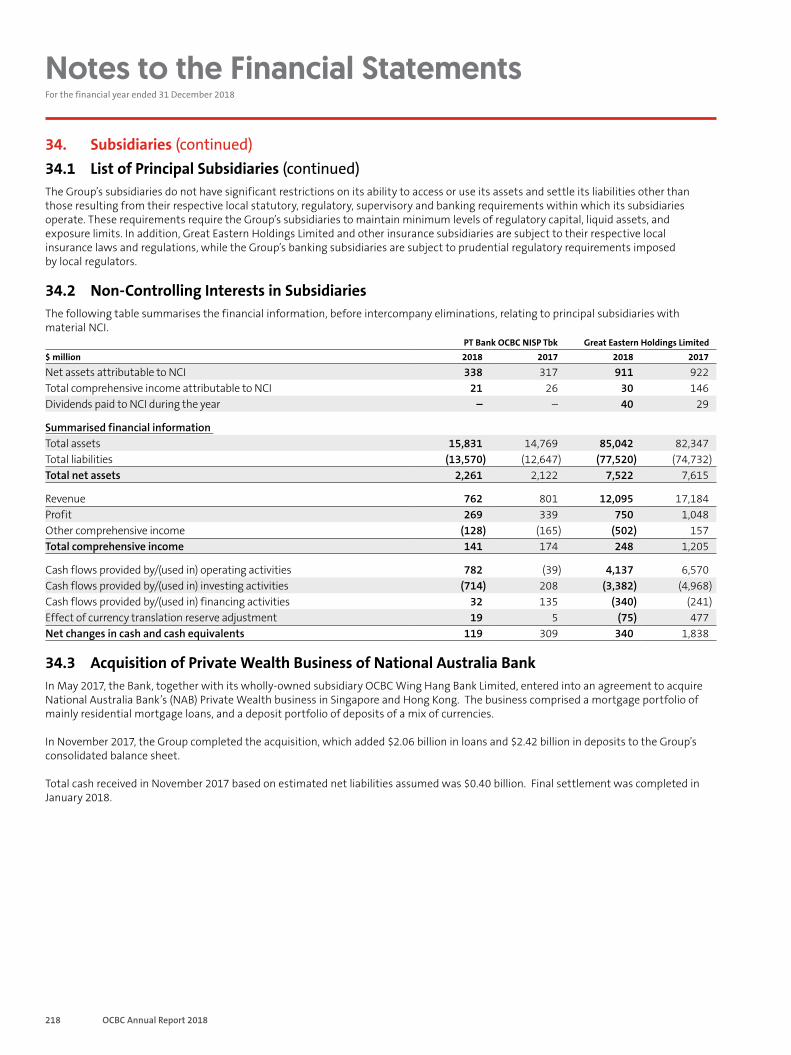
218 OCBC Annual Report 2018
Notes to the Financial Statements For the financial year ended 31 December 2018
34. Subsidiaries (continued)34.1 List of Principal Subsidiaries (continued)The Group’s subsidiaries do not have significant restrictions on its ability to access or use its assets and settle its liabilities other than those resulting from their respective local statutory, regulatory, supervisory and banking requirements within which its subsidiaries operate. These requirements require the Group’s subsidiaries to maintain minimum levels of regulatory capital, liquid assets, and exposure limits. In addition, Great Eastern Holdings Limited and other insurance subsidiaries are subject to their respective local insurance laws and regulations, while the Group’s banking subsidiaries are subject to prudential regulatory requirements imposed by local regulators.
34.2 Non-Controlling Interests in SubsidiariesThe following table summarises the financial information, before intercompany eliminations, relating to principal subsidiaries with material NCI.
PT Bank OCBC NISP Tbk Great Eastern Holdings Limited$ million 2018 2017 2018 2017
Net assets attributable to NCI 338 317 911 922Total comprehensive income attributable to NCI 21 26 30 146Dividends paid to NCI during the year – – 40 29
Summarised financial information Total assets 15,831 14,769 85,042 82,347Total liabilities (13,570) (12,647) (77,520) (74,732)Total net assets 2,261 2,122 7,522 7,615
Revenue 762 801 12,095 17,184Profit 269 339 750 1,048Other comprehensive income (128) (165) (502) 157Total comprehensive income 141 174 248 1,205
Cash flows provided by/(used in) operating activities 782 (39) 4,137 6,570Cash flows provided by/(used in) investing activities (714) 208 (3,382) (4,968)Cash flows provided by/(used in) financing activities 32 135 (340) (241)Effect of currency translation reserve adjustment 19 5 (75) 477Net changes in cash and cash equivalents 119 309 340 1,838
34.3 Acquisition of Private Wealth Business of National Australia BankIn May 2017, the Bank, together with its wholly-owned subsidiary OCBC Wing Hang Bank Limited, entered into an agreement to acquire National Australia Bank’s (NAB) Private Wealth business in Singapore and Hong Kong. The business comprised a mortgage portfolio of mainly residential mortgage loans, and a deposit portfolio of deposits of a mix of currencies.
In November 2017, the Group completed the acquisition, which added $2.06 billion in loans and $2.42 billion in deposits to the Group’s consolidated balance sheet.
Total cash received in November 2017 based on estimated net liabilities assumed was $0.40 billion. Final settlement was completed in January 2018.
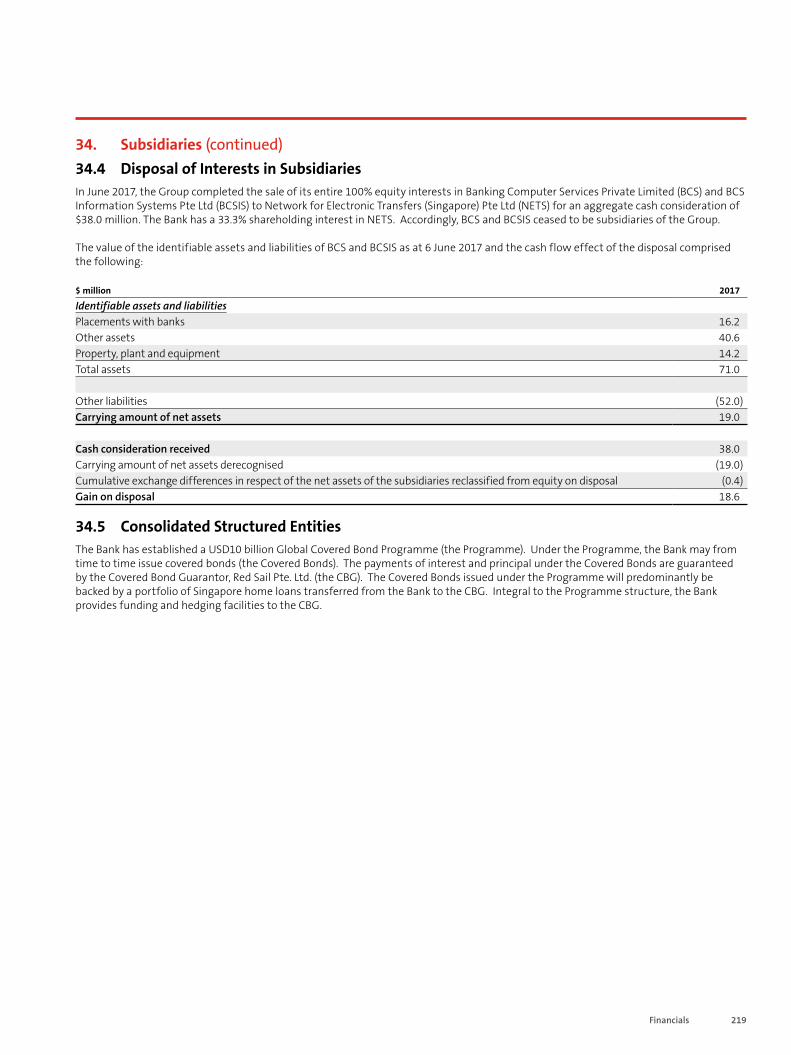
219Financials
34. Subsidiaries (continued)34.4 Disposal of Interests in SubsidiariesIn June 2017, the Group completed the sale of its entire 100% equity interests in Banking Computer Services Private Limited (BCS) and BCS Information Systems Pte Ltd (BCSIS) to Network for Electronic Transfers (Singapore) Pte Ltd (NETS) for an aggregate cash consideration of $38.0 million. The Bank has a 33.3% shareholding interest in NETS. Accordingly, BCS and BCSIS ceased to be subsidiaries of the Group.
The value of the identifiable assets and liabilities of BCS and BCSIS as at 6 June 2017 and the cash flow effect of the disposal comprised the following:
$ million 2017
Identifiable assets and liabilitiesPlacements with banks 16.2Other assets 40.6Property, plant and equipment 14.2Total assets 71.0
Other liabilities (52.0)Carrying amount of net assets 19.0
Cash consideration received 38.0Carrying amount of net assets derecognised (19.0)Cumulative exchange differences in respect of the net assets of the subsidiaries reclassified from equity on disposal (0.4)Gain on disposal 18.6
34.5 Consolidated Structured EntitiesThe Bank has established a USD10 billion Global Covered Bond Programme (the Programme). Under the Programme, the Bank may from time to time issue covered bonds (the Covered Bonds). The payments of interest and principal under the Covered Bonds are guaranteed by the Covered Bond Guarantor, Red Sail Pte. Ltd. (the CBG). The Covered Bonds issued under the Programme will predominantly be backed by a portfolio of Singapore home loans transferred from the Bank to the CBG. Integral to the Programme structure, the Bank provides funding and hedging facilities to the CBG.
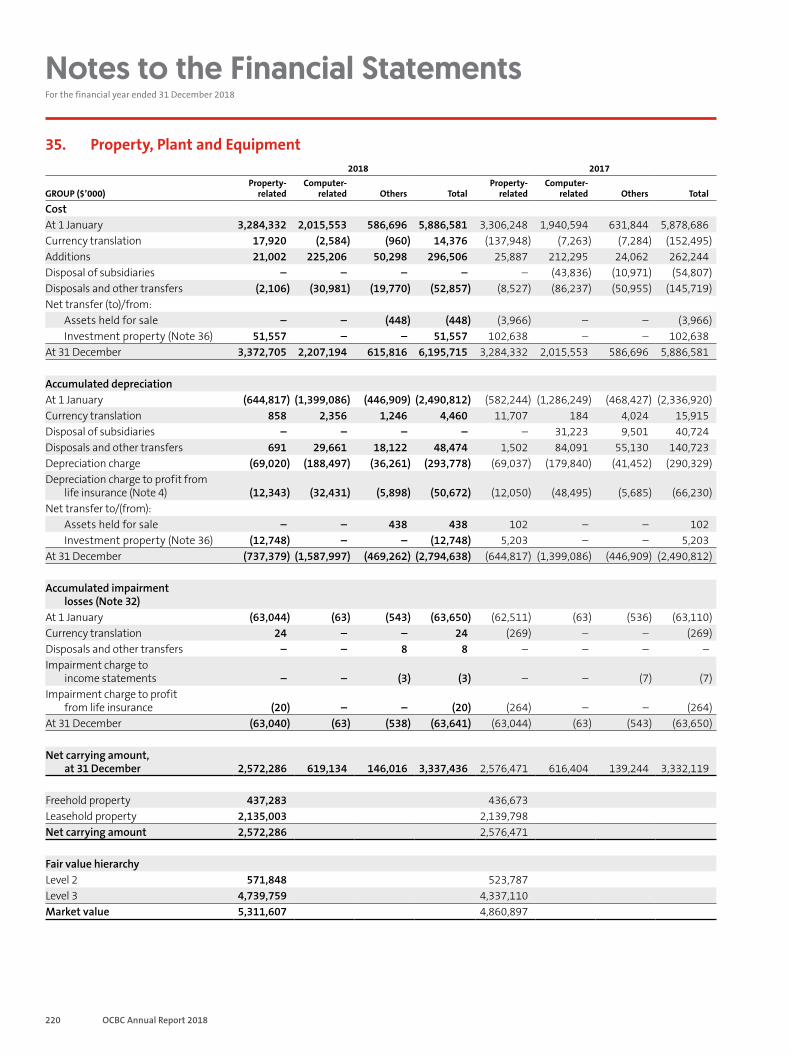
220 OCBC Annual Report 2018
Notes to the Financial Statements For the financial year ended 31 December 2018
35. Property, Plant and Equipment 2018 2017
GROUP ($’000)Property-
relatedComputer-
related Others TotalProperty-
relatedComputer-
related Others Total
CostAt 1 January 3,284,332 2,015,553 586,696 5,886,581 3,306,248 1,940,594 631,844 5,878,686Currency translation 17,920 (2,584) (960) 14,376 (137,948) (7,263) (7,284) (152,495)Additions 21,002 225,206 50,298 296,506 25,887 212,295 24,062 262,244Disposal of subsidiaries – – – – – (43,836) (10,971) (54,807)Disposals and other transfers (2,106) (30,981) (19,770) (52,857) (8,527) (86,237) (50,955) (145,719)Net transfer (to)/from:
Assets held for sale – – (448) (448) (3,966) – – (3,966)Investment property (Note 36) 51,557 – – 51,557 102,638 – – 102,638
At 31 December 3,372,705 2,207,194 615,816 6,195,715 3,284,332 2,015,553 586,696 5,886,581
Accumulated depreciationAt 1 January (644,817) (1,399,086) (446,909) (2,490,812) (582,244) (1,286,249) (468,427) (2,336,920)Currency translation 858 2,356 1,246 4,460 11,707 184 4,024 15,915Disposal of subsidiaries – – – – – 31,223 9,501 40,724Disposals and other transfers 691 29,661 18,122 48,474 1,502 84,091 55,130 140,723Depreciation charge (69,020) (188,497) (36,261) (293,778) (69,037) (179,840) (41,452) (290,329)Depreciation charge to profit from
life insurance (Note 4) (12,343) (32,431) (5,898) (50,672) (12,050) (48,495) (5,685) (66,230)Net transfer to/(from):
Assets held for sale – – 438 438 102 – – 102Investment property (Note 36) (12,748) – – (12,748) 5,203 – – 5,203
At 31 December (737,379) (1,587,997) (469,262) (2,794,638) (644,817) (1,399,086) (446,909) (2,490,812)
Accumulated impairment losses (Note 32)
At 1 January (63,044) (63) (543) (63,650) (62,511) (63) (536) (63,110)Currency translation 24 – – 24 (269) – – (269)Disposals and other transfers – – 8 8 – – – –Impairment charge to
income statements – – (3) (3) – – (7) (7)Impairment charge to profit
from life insurance (20) – – (20) (264) – – (264)At 31 December (63,040) (63) (538) (63,641) (63,044) (63) (543) (63,650)
Net carrying amount, at 31 December 2,572,286 619,134 146,016 3,337,436 2,576,471 616,404 139,244 3,332,119
Freehold property 437,283 436,673Leasehold property 2,135,003 2,139,798Net carrying amount 2,572,286 2,576,471
Fair value hierarchyLevel 2 571,848 523,787Level 3 4,739,759 4,337,110Market value 5,311,607 4,860,897
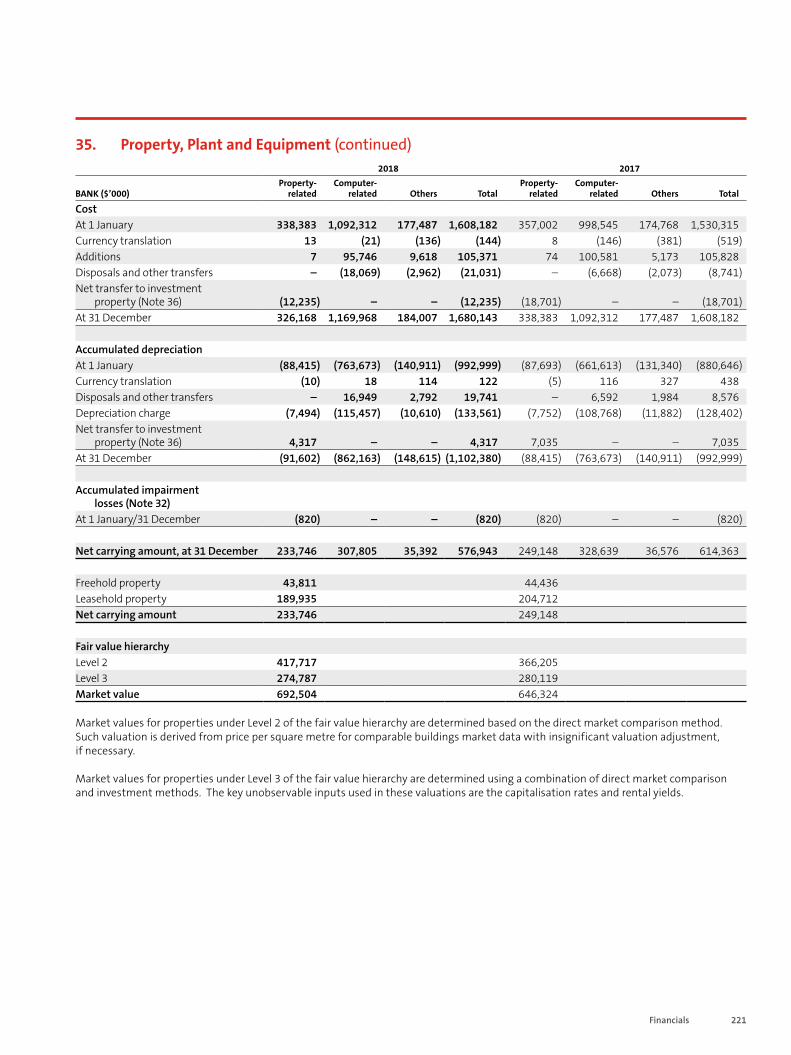
221Financials
35. Property, Plant and Equipment (continued)2018 2017
BANK ($’000)Property-
relatedComputer-
related Others TotalProperty-
relatedComputer-
related Others Total
CostAt 1 January 338,383 1,092,312 177,487 1,608,182 357,002 998,545 174,768 1,530,315Currency translation 13 (21) (136) (144) 8 (146) (381) (519)Additions 7 95,746 9,618 105,371 74 100,581 5,173 105,828Disposals and other transfers – (18,069) (2,962) (21,031) – (6,668) (2,073) (8,741)Net transfer to investment
property (Note 36) (12,235) – – (12,235) (18,701) – – (18,701)At 31 December 326,168 1,169,968 184,007 1,680,143 338,383 1,092,312 177,487 1,608,182
Accumulated depreciationAt 1 January (88,415) (763,673) (140,911) (992,999) (87,693) (661,613) (131,340) (880,646)Currency translation (10) 18 114 122 (5) 116 327 438Disposals and other transfers – 16,949 2,792 19,741 – 6,592 1,984 8,576Depreciation charge (7,494) (115,457) (10,610) (133,561) (7,752) (108,768) (11,882) (128,402)Net transfer to investment
property (Note 36) 4,317 – – 4,317 7,035 – – 7,035At 31 December (91,602) (862,163) (148,615) (1,102,380) (88,415) (763,673) (140,911) (992,999)
Accumulated impairment losses (Note 32)
At 1 January/31 December (820) – – (820) (820) – – (820)
Net carrying amount, at 31 December 233,746 307,805 35,392 576,943 249,148 328,639 36,576 614,363
Freehold property 43,811 44,436Leasehold property 189,935 204,712Net carrying amount 233,746 249,148
Fair value hierarchyLevel 2 417,717 366,205Level 3 274,787 280,119Market value 692,504 646,324
Market values for properties under Level 2 of the fair value hierarchy are determined based on the direct market comparison method. Such valuation is derived from price per square metre for comparable buildings market data with insignificant valuation adjustment, if necessary.
Market values for properties under Level 3 of the fair value hierarchy are determined using a combination of direct market comparison and investment methods. The key unobservable inputs used in these valuations are the capitalisation rates and rental yields.
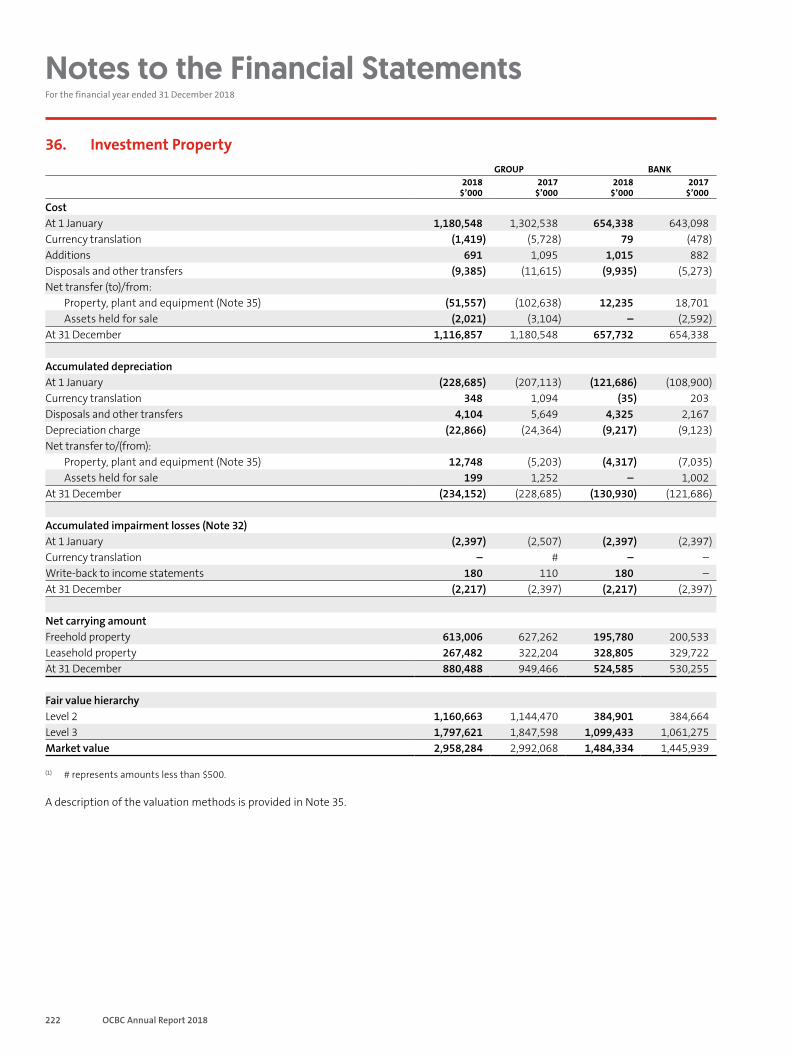
222 OCBC Annual Report 2018
Notes to the Financial Statements For the financial year ended 31 December 2018
36. Investment PropertyGROUP BANK
2018 $’000
2017 $’000
2018 $’000
2017 $’000
Cost At 1 January 1,180,548 1,302,538 654,338 643,098Currency translation (1,419) (5,728) 79 (478)Additions 691 1,095 1,015 882Disposals and other transfers (9,385) (11,615) (9,935) (5,273)Net transfer (to)/from:
Property, plant and equipment (Note 35) (51,557) (102,638) 12,235 18,701Assets held for sale (2,021) (3,104) – (2,592)
At 31 December 1,116,857 1,180,548 657,732 654,338
Accumulated depreciationAt 1 January (228,685) (207,113) (121,686) (108,900)Currency translation 348 1,094 (35) 203Disposals and other transfers 4,104 5,649 4,325 2,167Depreciation charge (22,866) (24,364) (9,217) (9,123)Net transfer to/(from):
Property, plant and equipment (Note 35) 12,748 (5,203) (4,317) (7,035)Assets held for sale 199 1,252 – 1,002
At 31 December (234,152) (228,685) (130,930) (121,686)
Accumulated impairment losses (Note 32)At 1 January (2,397) (2,507) (2,397) (2,397)Currency translation – # – –Write-back to income statements 180 110 180 –At 31 December (2,217) (2,397) (2,217) (2,397)
Net carrying amountFreehold property 613,006 627,262 195,780 200,533Leasehold property 267,482 322,204 328,805 329,722At 31 December 880,488 949,466 524,585 530,255
Fair value hierarchyLevel 2 1,160,663 1,144,470 384,901 384,664Level 3 1,797,621 1,847,598 1,099,433 1,061,275Market value 2,958,284 2,992,068 1,484,334 1,445,939
(1) # represents amounts less than $500.
A description of the valuation methods is provided in Note 35.
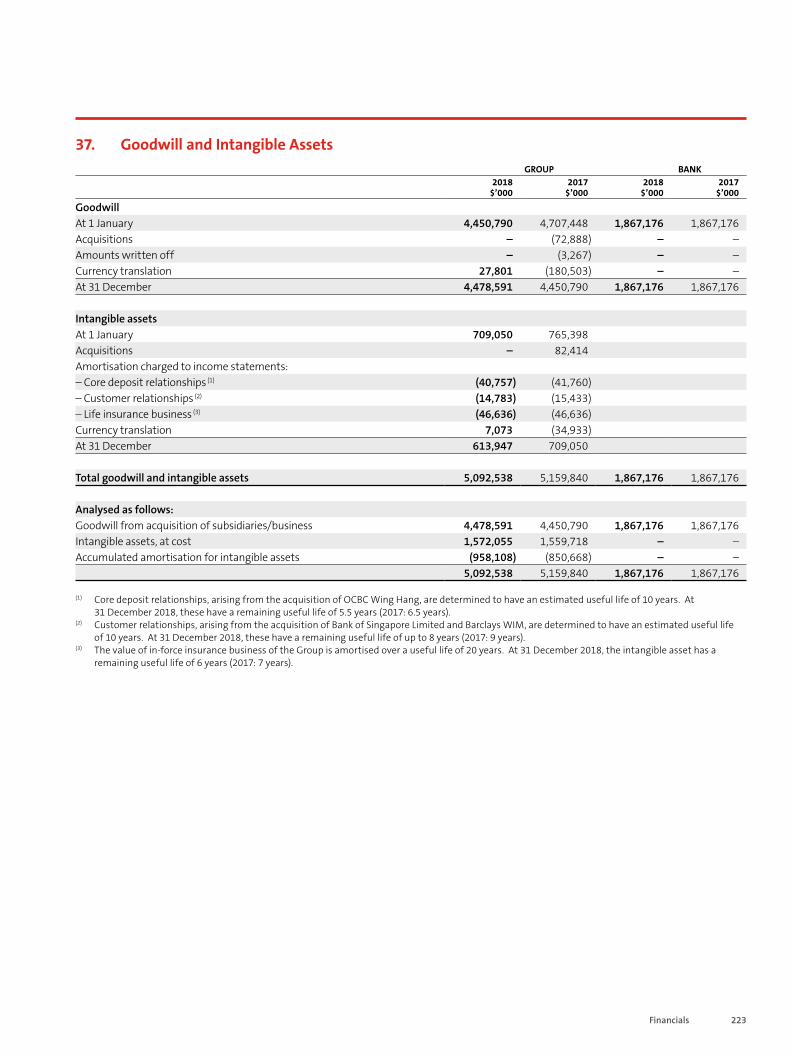
223Financials
37. Goodwill and Intangible AssetsGROUP BANK
2018 $’000
2017 $’000
2018 $’000
2017 $’000
Goodwill At 1 January 4,450,790 4,707,448 1,867,176 1,867,176Acquisitions – (72,888) – –Amounts written off – (3,267) – –Currency translation 27,801 (180,503) – –At 31 December 4,478,591 4,450,790 1,867,176 1,867,176
Intangible assetsAt 1 January 709,050 765,398Acquisitions – 82,414Amortisation charged to income statements: – Core deposit relationships (1) (40,757) (41,760)– Customer relationships (2) (14,783) (15,433)– Life insurance business (3) (46,636) (46,636)Currency translation 7,073 (34,933)At 31 December 613,947 709,050
Total goodwill and intangible assets 5,092,538 5,159,840 1,867,176 1,867,176
Analysed as follows:Goodwill from acquisition of subsidiaries/business 4,478,591 4,450,790 1,867,176 1,867,176Intangible assets, at cost 1,572,055 1,559,718 – –Accumulated amortisation for intangible assets (958,108) (850,668) – –
5,092,538 5,159,840 1,867,176 1,867,176
(1) Core deposit relationships, arising from the acquisition of OCBC Wing Hang, are determined to have an estimated useful life of 10 years. At 31 December 2018, these have a remaining useful life of 5.5 years (2017: 6.5 years).
(2) Customer relationships, arising from the acquisition of Bank of Singapore Limited and Barclays WIM, are determined to have an estimated useful life of 10 years. At 31 December 2018, these have a remaining useful life of up to 8 years (2017: 9 years).
(3) The value of in-force insurance business of the Group is amortised over a useful life of 20 years. At 31 December 2018, the intangible asset has a remaining useful life of 6 years (2017: 7 years).
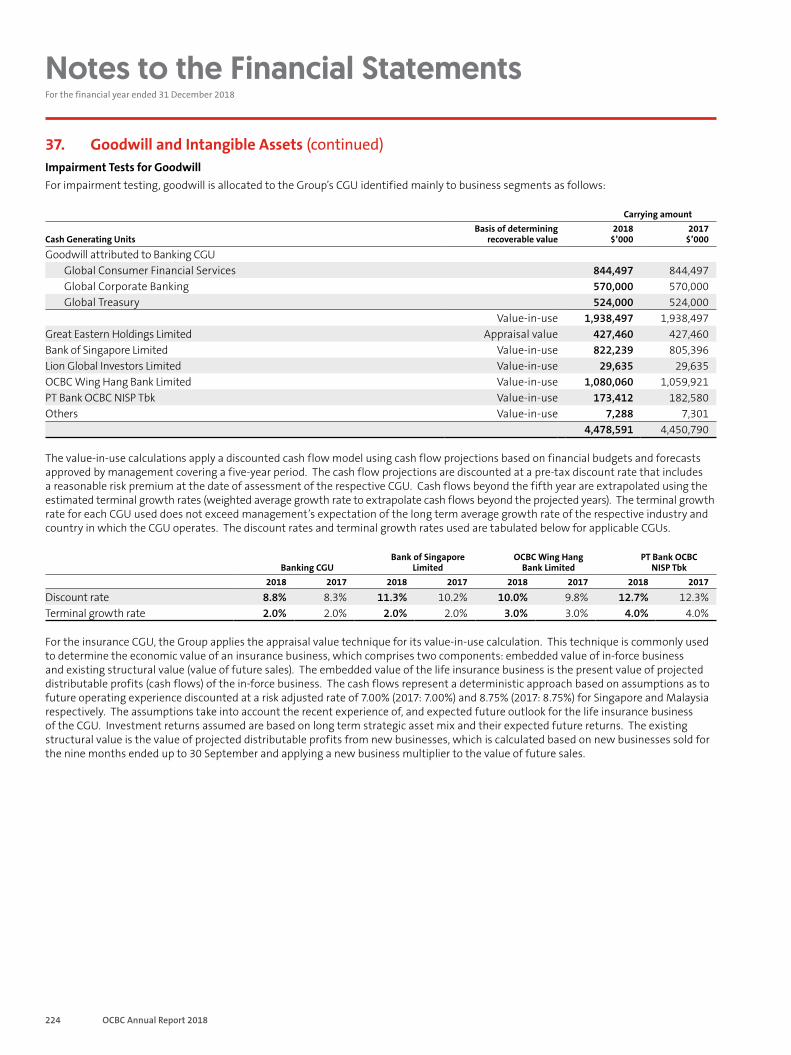
224 OCBC Annual Report 2018
Notes to the Financial Statements For the financial year ended 31 December 2018
37. Goodwill and Intangible Assets (continued)Impairment Tests for GoodwillFor impairment testing, goodwill is allocated to the Group’s CGU identified mainly to business segments as follows:
Carrying amount
Cash Generating UnitsBasis of determining
recoverable value2018
$’0002017
$’000
Goodwill attributed to Banking CGUGlobal Consumer Financial Services 844,497 844,497Global Corporate Banking 570,000 570,000Global Treasury 524,000 524,000
Value-in-use 1,938,497 1,938,497Great Eastern Holdings Limited Appraisal value 427,460 427,460Bank of Singapore Limited Value-in-use 822,239 805,396Lion Global Investors Limited Value-in-use 29,635 29,635OCBC Wing Hang Bank Limited Value-in-use 1,080,060 1,059,921PT Bank OCBC NISP Tbk Value-in-use 173,412 182,580Others Value-in-use 7,288 7,301
4,478,591 4,450,790
The value-in-use calculations apply a discounted cash flow model using cash flow projections based on financial budgets and forecasts approved by management covering a five-year period. The cash flow projections are discounted at a pre-tax discount rate that includes a reasonable risk premium at the date of assessment of the respective CGU. Cash flows beyond the fifth year are extrapolated using the estimated terminal growth rates (weighted average growth rate to extrapolate cash flows beyond the projected years). The terminal growth rate for each CGU used does not exceed management’s expectation of the long term average growth rate of the respective industry and country in which the CGU operates. The discount rates and terminal growth rates used are tabulated below for applicable CGUs.
Banking CGUBank of Singapore
LimitedOCBC Wing Hang
Bank LimitedPT Bank OCBC
NISP Tbk2018 2017 2018 2017 2018 2017 2018 2017
Discount rate 8.8% 8.3% 11.3% 10.2% 10.0% 9.8% 12.7% 12.3%Terminal growth rate 2.0% 2.0% 2.0% 2.0% 3.0% 3.0% 4.0% 4.0%
For the insurance CGU, the Group applies the appraisal value technique for its value-in-use calculation. This technique is commonly used to determine the economic value of an insurance business, which comprises two components: embedded value of in-force business and existing structural value (value of future sales). The embedded value of the life insurance business is the present value of projected distributable profits (cash flows) of the in-force business. The cash flows represent a deterministic approach based on assumptions as to future operating experience discounted at a risk adjusted rate of 7.00% (2017: 7.00%) and 8.75% (2017: 8.75%) for Singapore and Malaysia respectively. The assumptions take into account the recent experience of, and expected future outlook for the life insurance business of the CGU. Investment returns assumed are based on long term strategic asset mix and their expected future returns. The existing structural value is the value of projected distributable profits from new businesses, which is calculated based on new businesses sold for the nine months ended up to 30 September and applying a new business multiplier to the value of future sales.
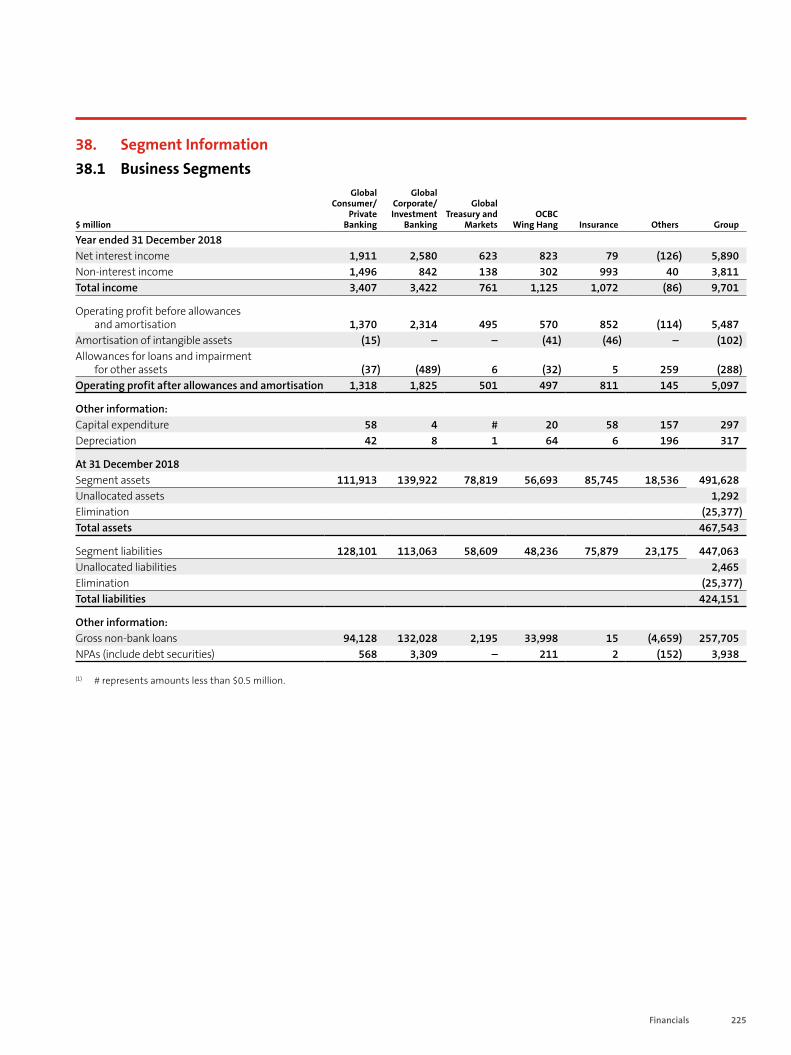
225Financials
38. Segment Information38.1 Business Segments
$ million
Global Consumer/
Private Banking
Global Corporate/Investment
Banking
Global Treasury and
MarketsOCBC
Wing Hang Insurance Others Group
Year ended 31 December 2018Net interest income 1,911 2,580 623 823 79 (126) 5,890Non-interest income 1,496 842 138 302 993 40 3,811Total income 3,407 3,422 761 1,125 1,072 (86) 9,701
Operating profit before allowances and amortisation 1,370 2,314 495 570 852 (114) 5,487
Amortisation of intangible assets (15) – – (41) (46) – (102)Allowances for loans and impairment
for other assets (37) (489) 6 (32) 5 259 (288)Operating profit after allowances and amortisation 1,318 1,825 501 497 811 145 5,097
Other information:Capital expenditure 58 4 # 20 58 157 297Depreciation 42 8 1 64 6 196 317
At 31 December 2018Segment assets 111,913 139,922 78,819 56,693 85,745 18,536 491,628Unallocated assets 1,292Elimination (25,377)Total assets 467,543
Segment liabilities 128,101 113,063 58,609 48,236 75,879 23,175 447,063Unallocated liabilities 2,465Elimination (25,377)Total liabilities 424,151
Other information:Gross non-bank loans 94,128 132,028 2,195 33,998 15 (4,659) 257,705NPAs (include debt securities) 568 3,309 – 211 2 (152) 3,938
(1) # represents amounts less than $0.5 million.
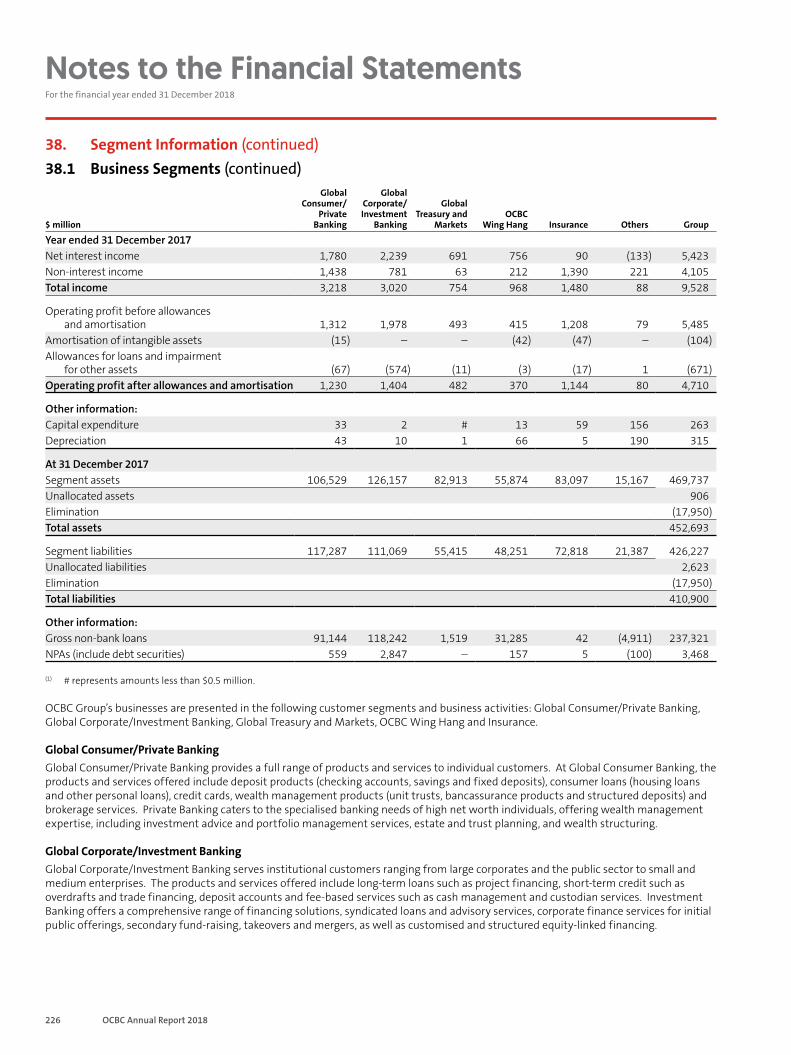
226 OCBC Annual Report 2018
Notes to the Financial Statements For the financial year ended 31 December 2018
38. Segment Information (continued)38.1 Business Segments (continued)
$ million
Global Consumer/
Private Banking
Global Corporate/Investment
Banking
Global Treasury and
MarketsOCBC
Wing Hang Insurance Others Group
Year ended 31 December 2017Net interest income 1,780 2,239 691 756 90 (133) 5,423Non-interest income 1,438 781 63 212 1,390 221 4,105Total income 3,218 3,020 754 968 1,480 88 9,528
Operating profit before allowances and amortisation 1,312 1,978 493 415 1,208 79 5,485
Amortisation of intangible assets (15) – – (42) (47) – (104)Allowances for loans and impairment
for other assets (67) (574) (11) (3) (17) 1 (671)Operating profit after allowances and amortisation 1,230 1,404 482 370 1,144 80 4,710
Other information:Capital expenditure 33 2 # 13 59 156 263Depreciation 43 10 1 66 5 190 315
At 31 December 2017Segment assets 106,529 126,157 82,913 55,874 83,097 15,167 469,737Unallocated assets 906Elimination (17,950)Total assets 452,693
Segment liabilities 117,287 111,069 55,415 48,251 72,818 21,387 426,227Unallocated liabilities 2,623Elimination (17,950)Total liabilities 410,900
Other information:Gross non-bank loans 91,144 118,242 1,519 31,285 42 (4,911) 237,321NPAs (include debt securities) 559 2,847 – 157 5 (100) 3,468
(1) # represents amounts less than $0.5 million.
OCBC Group’s businesses are presented in the following customer segments and business activities: Global Consumer/Private Banking, Global Corporate/Investment Banking, Global Treasury and Markets, OCBC Wing Hang and Insurance.
Global Consumer/Private BankingGlobal Consumer/Private Banking provides a full range of products and services to individual customers. At Global Consumer Banking, the products and services offered include deposit products (checking accounts, savings and fixed deposits), consumer loans (housing loans and other personal loans), credit cards, wealth management products (unit trusts, bancassurance products and structured deposits) and brokerage services. Private Banking caters to the specialised banking needs of high net worth individuals, offering wealth management expertise, including investment advice and portfolio management services, estate and trust planning, and wealth structuring.
Global Corporate/Investment BankingGlobal Corporate/Investment Banking serves institutional customers ranging from large corporates and the public sector to small and medium enterprises. The products and services offered include long-term loans such as project financing, short-term credit such as overdrafts and trade financing, deposit accounts and fee-based services such as cash management and custodian services. Investment Banking offers a comprehensive range of financing solutions, syndicated loans and advisory services, corporate finance services for initial public offerings, secondary fund-raising, takeovers and mergers, as well as customised and structured equity-linked financing.
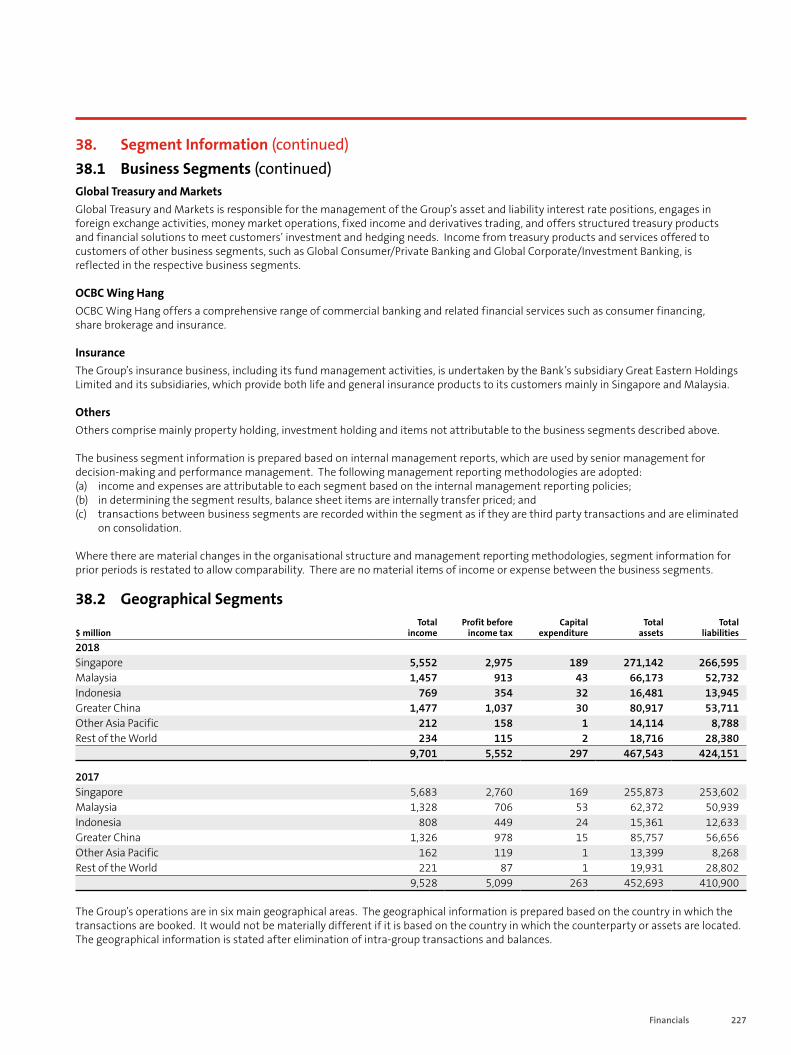
227Financials
38. Segment Information (continued)38.1 Business Segments (continued)Global Treasury and MarketsGlobal Treasury and Markets is responsible for the management of the Group’s asset and liability interest rate positions, engages in foreign exchange activities, money market operations, fixed income and derivatives trading, and offers structured treasury products and financial solutions to meet customers’ investment and hedging needs. Income from treasury products and services offered to customers of other business segments, such as Global Consumer/Private Banking and Global Corporate/Investment Banking, is reflected in the respective business segments.
OCBC Wing HangOCBC Wing Hang offers a comprehensive range of commercial banking and related financial services such as consumer financing, share brokerage and insurance.
InsuranceThe Group’s insurance business, including its fund management activities, is undertaken by the Bank’s subsidiary Great Eastern Holdings Limited and its subsidiaries, which provide both life and general insurance products to its customers mainly in Singapore and Malaysia.
Others Others comprise mainly property holding, investment holding and items not attributable to the business segments described above.
The business segment information is prepared based on internal management reports, which are used by senior management for decision-making and performance management. The following management reporting methodologies are adopted:(a) income and expenses are attributable to each segment based on the internal management reporting policies;(b) in determining the segment results, balance sheet items are internally transfer priced; and(c) transactions between business segments are recorded within the segment as if they are third party transactions and are eliminated
on consolidation.
Where there are material changes in the organisational structure and management reporting methodologies, segment information for prior periods is restated to allow comparability. There are no material items of income or expense between the business segments.
38.2 Geographical Segments
$ millionTotal
incomeProfit before
income taxCapital
expenditureTotal
assetsTotal
liabilities
2018Singapore 5,552 2,975 189 271,142 266,595Malaysia 1,457 913 43 66,173 52,732Indonesia 769 354 32 16,481 13,945Greater China 1,477 1,037 30 80,917 53,711Other Asia Pacific 212 158 1 14,114 8,788Rest of the World 234 115 2 18,716 28,380
9,701 5,552 297 467,543 424,151
2017Singapore 5,683 2,760 169 255,873 253,602Malaysia 1,328 706 53 62,372 50,939Indonesia 808 449 24 15,361 12,633Greater China 1,326 978 15 85,757 56,656Other Asia Pacific 162 119 1 13,399 8,268Rest of the World 221 87 1 19,931 28,802
9,528 5,099 263 452,693 410,900
The Group’s operations are in six main geographical areas. The geographical information is prepared based on the country in which the transactions are booked. It would not be materially different if it is based on the country in which the counterparty or assets are located. The geographical information is stated after elimination of intra-group transactions and balances.

228 OCBC Annual Report 2018
Notes to the Financial Statements For the financial year ended 31 December 2018
39. Risk Management 39.1 OverviewThe objective of the Group’s risk management practice is to support the business through an integrated proactive risk management approach with strong risk analytics, while protecting the Group against losses that could arise from taking risks beyond its risk appetite. The Group’s philosophy is that all risks must be properly understood, identified, measured, assessed, monitored, controlled and managed. In addition, risk management processes must be closely aligned to the Group’s business strategy, to enable the Group to maximise its risk-adjusted return on capital.
The Board establishes the Group’s risk appetite and risk management principles. The Board Risk Management Committee (BRMC) is the principal board committee that oversees the Group’s risk management with the following key responsibilities:• sets the Group’s overall risk management philosophy, ensuring it is in line with the Group overall corporate strategy and within the
risk appetite as approved by the Board.• reviews risk disclosure policy and risk management principles for the approval of the Board. • oversees the Group’s risk management systems for identifying, measuring, monitoring and control, and reporting of risk exposures
and ensuring the adequacy of risk management practices. • approves risk management frameworks, major risk policies and material risk models.
The BRMC is supported by Group Risk Management (GRM), which is headed by the Group Chief Risk Officer (CRO). GRM is an independent risk and control oversight function that supports the Group’s business development within a prudent, consistent and effective risk management framework and governance structure. GRM establishes relevant risk management frameworks, policies and procedures, risk measurements and methodologies; it also reviews and monitors the Group’s risk profiles and portfolio concentrations. Any significant vulnerabilities and risk issues are highlighted to the respective risk management committees. Various risk reports, including key stress test results and action plans, are also submitted regularly to senior management, BRMC and the Board.
The independence of risk management from business functions ensures that the Group achieves the necessary balance between risk-taking and return considerations. The compensation of risk officers is also determined independent of business units and reviewed by the Remuneration Committee to ensure it remains market-competitive. Additionally, the Group has a Material Risk Takers (MRTs) framework to define and identify MRTs – employees whose authorities and actions are identified as having material influence on our long-term performance. Specific compensation measures would be commensurate with the risks the MRTs are authorised to take.
Senior management actively manages risks through various risk management committees, such as the Credit Risk Management Committee, the Market Risk Management Committee, the Asset and Liability Committee and the Operational Risk Management Committee. Together with senior representatives from business units and subsidiaries, GRM facilitates a regular and structured emerging risk forum to identify and deliberate on potential dark clouds and opportunities. Identified emerging risks are actively monitored and updated to reflect changes in the operating environment, and serve as inputs into other risk management areas such as stress testing and portfolio limit setting. Both risk-taking and risk-control units are represented in the risk management committees and emerging risk forum, emphasising shared risk management responsibilities.
All new products and services are governed by a New Product Approval Process (NPAP) managed by GRM and approved by the New Product Approval Committee (NPAC). This process provides a platform to ensure that all risks associated with new products or market initiatives are comprehensively identified, measured, assessed and managed before market introduction.
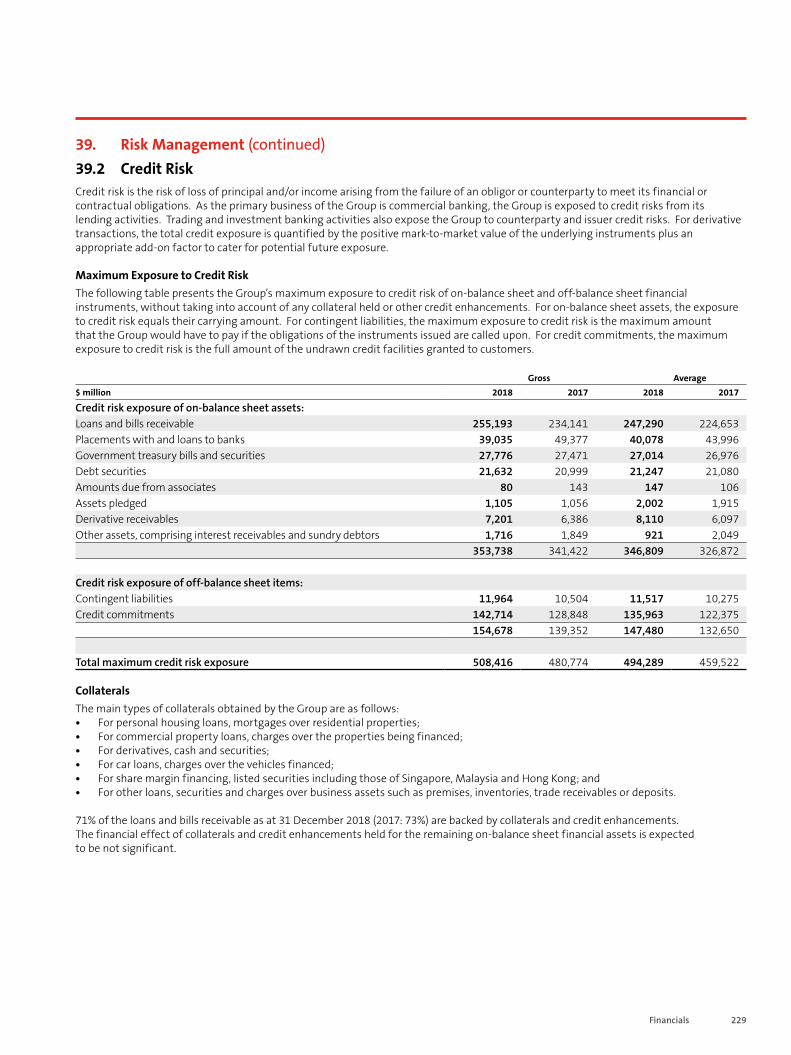
229Financials
39. Risk Management (continued)39.2 Credit RiskCredit risk is the risk of loss of principal and/or income arising from the failure of an obligor or counterparty to meet its financial or contractual obligations. As the primary business of the Group is commercial banking, the Group is exposed to credit risks from its lending activities. Trading and investment banking activities also expose the Group to counterparty and issuer credit risks. For derivative transactions, the total credit exposure is quantified by the positive mark-to-market value of the underlying instruments plus an appropriate add-on factor to cater for potential future exposure.
Maximum Exposure to Credit Risk The following table presents the Group’s maximum exposure to credit risk of on-balance sheet and off-balance sheet financial instruments, without taking into account of any collateral held or other credit enhancements. For on-balance sheet assets, the exposure to credit risk equals their carrying amount. For contingent liabilities, the maximum exposure to credit risk is the maximum amount that the Group would have to pay if the obligations of the instruments issued are called upon. For credit commitments, the maximum exposure to credit risk is the full amount of the undrawn credit facilities granted to customers.
Gross Average$ million 2018 2017 2018 2017
Credit risk exposure of on-balance sheet assets:Loans and bills receivable 255,193 234,141 247,290 224,653Placements with and loans to banks 39,035 49,377 40,078 43,996Government treasury bills and securities 27,776 27,471 27,014 26,976Debt securities 21,632 20,999 21,247 21,080Amounts due from associates 80 143 147 106Assets pledged 1,105 1,056 2,002 1,915Derivative receivables 7,201 6,386 8,110 6,097Other assets, comprising interest receivables and sundry debtors 1,716 1,849 921 2,049
353,738 341,422 346,809 326,872
Credit risk exposure of off-balance sheet items:Contingent liabilities 11,964 10,504 11,517 10,275Credit commitments 142,714 128,848 135,963 122,375
154,678 139,352 147,480 132,650
Total maximum credit risk exposure 508,416 480,774 494,289 459,522
CollateralsThe main types of collaterals obtained by the Group are as follows:• For personal housing loans, mortgages over residential properties;• For commercial property loans, charges over the properties being financed;• For derivatives, cash and securities;• For car loans, charges over the vehicles financed;• For share margin financing, listed securities including those of Singapore, Malaysia and Hong Kong; and• For other loans, securities and charges over business assets such as premises, inventories, trade receivables or deposits.
71% of the loans and bills receivable as at 31 December 2018 (2017: 73%) are backed by collaterals and credit enhancements. The financial effect of collaterals and credit enhancements held for the remaining on-balance sheet financial assets is expected to be not significant.
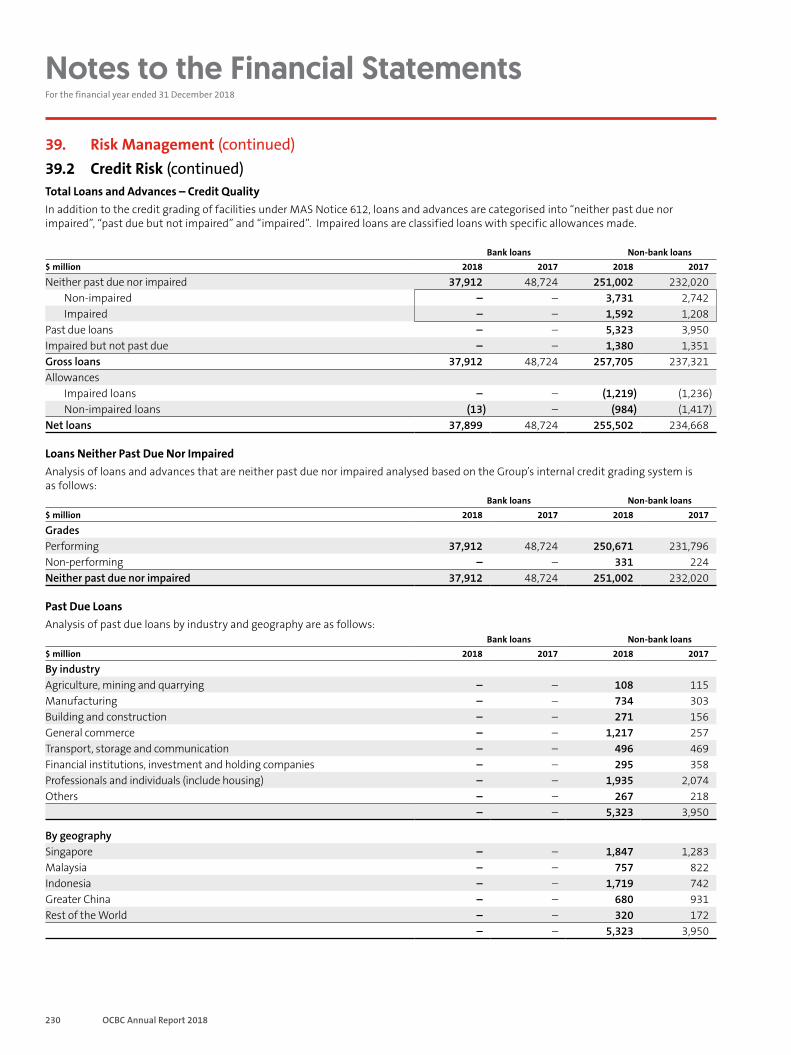
230 OCBC Annual Report 2018
Notes to the Financial Statements For the financial year ended 31 December 2018
39. Risk Management (continued)39.2 Credit Risk (continued)Total Loans and Advances – Credit Quality In addition to the credit grading of facilities under MAS Notice 612, loans and advances are categorised into “neither past due nor impaired”, “past due but not impaired” and “impaired”. Impaired loans are classified loans with specific allowances made.
Bank loans Non-bank loans$ million 2018 2017 2018 2017
Neither past due nor impaired 37,912 48,724 251,002 232,020Non-impaired – – 3,731 2,742Impaired – – 1,592 1,208
Past due loans – – 5,323 3,950Impaired but not past due – – 1,380 1,351Gross loans 37,912 48,724 257,705 237,321Allowances
Impaired loans – – (1,219) (1,236)Non-impaired loans (13) – (984) (1,417)
Net loans 37,899 48,724 255,502 234,668
Loans Neither Past Due Nor ImpairedAnalysis of loans and advances that are neither past due nor impaired analysed based on the Group’s internal credit grading system is as follows:
Bank loans Non-bank loans$ million 2018 2017 2018 2017
GradesPerforming 37,912 48,724 250,671 231,796Non-performing – – 331 224Neither past due nor impaired 37,912 48,724 251,002 232,020
Past Due LoansAnalysis of past due loans by industry and geography are as follows:
Bank loans Non-bank loans$ million 2018 2017 2018 2017
By industry Agriculture, mining and quarrying – – 108 115Manufacturing – – 734 303Building and construction – – 271 156General commerce – – 1,217 257Transport, storage and communication – – 496 469Financial institutions, investment and holding companies – – 295 358Professionals and individuals (include housing) – – 1,935 2,074Others – – 267 218
– – 5,323 3,950
By geography Singapore – – 1,847 1,283Malaysia – – 757 822Indonesia – – 1,719 742Greater China – – 680 931Rest of the World – – 320 172
– – 5,323 3,950
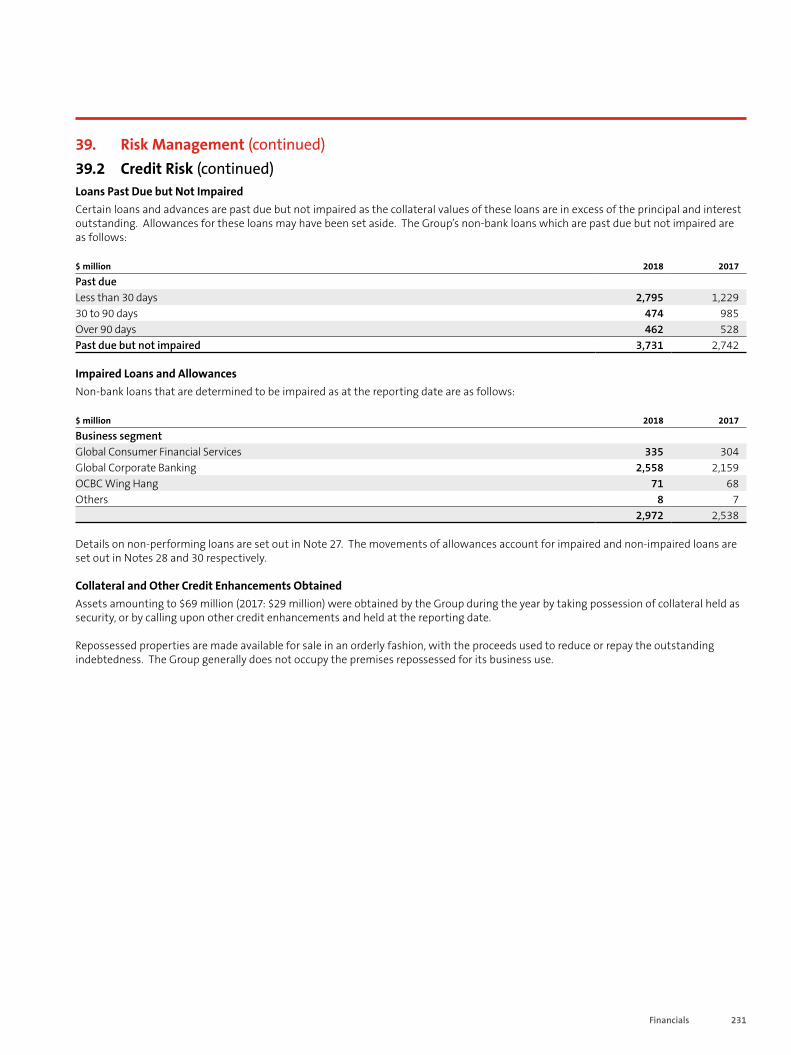
231Financials
39. Risk Management (continued)39.2 Credit Risk (continued)Loans Past Due but Not ImpairedCertain loans and advances are past due but not impaired as the collateral values of these loans are in excess of the principal and interest outstanding. Allowances for these loans may have been set aside. The Group’s non-bank loans which are past due but not impaired are as follows:
$ million 2018 2017
Past due Less than 30 days 2,795 1,22930 to 90 days 474 985Over 90 days 462 528Past due but not impaired 3,731 2,742
Impaired Loans and AllowancesNon-bank loans that are determined to be impaired as at the reporting date are as follows:
$ million 2018 2017
Business segmentGlobal Consumer Financial Services 335 304Global Corporate Banking 2,558 2,159OCBC Wing Hang 71 68Others 8 7
2,972 2,538
Details on non-performing loans are set out in Note 27. The movements of allowances account for impaired and non-impaired loans are set out in Notes 28 and 30 respectively.
Collateral and Other Credit Enhancements ObtainedAssets amounting to $69 million (2017: $29 million) were obtained by the Group during the year by taking possession of collateral held as security, or by calling upon other credit enhancements and held at the reporting date.
Repossessed properties are made available for sale in an orderly fashion, with the proceeds used to reduce or repay the outstanding indebtedness. The Group generally does not occupy the premises repossessed for its business use.
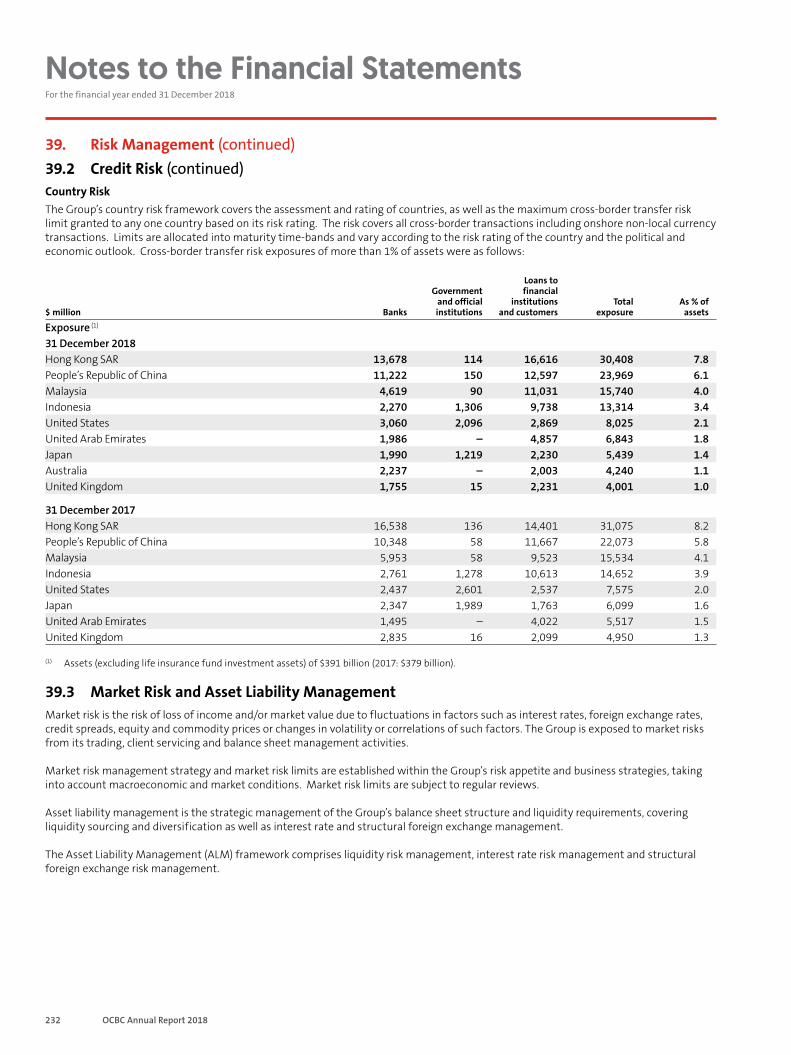
232 OCBC Annual Report 2018
Notes to the Financial Statements For the financial year ended 31 December 2018
39. Risk Management (continued)39.2 Credit Risk (continued)Country RiskThe Group’s country risk framework covers the assessment and rating of countries, as well as the maximum cross-border transfer risk limit granted to any one country based on its risk rating. The risk covers all cross-border transactions including onshore non-local currency transactions. Limits are allocated into maturity time-bands and vary according to the risk rating of the country and the political and economic outlook. Cross-border transfer risk exposures of more than 1% of assets were as follows:
$ million Banks
Governmentand officialinstitutions
Loans to financial
institutions and customers
Total exposure
As % of assets
Exposure (1)
31 December 2018Hong Kong SAR 13,678 114 16,616 30,408 7.8People’s Republic of China 11,222 150 12,597 23,969 6.1Malaysia 4,619 90 11,031 15,740 4.0Indonesia 2,270 1,306 9,738 13,314 3.4United States 3,060 2,096 2,869 8,025 2.1United Arab Emirates 1,986 – 4,857 6,843 1.8Japan 1,990 1,219 2,230 5,439 1.4Australia 2,237 – 2,003 4,240 1.1United Kingdom 1,755 15 2,231 4,001 1.0
31 December 2017Hong Kong SAR 16,538 136 14,401 31,075 8.2People’s Republic of China 10,348 58 11,667 22,073 5.8Malaysia 5,953 58 9,523 15,534 4.1Indonesia 2,761 1,278 10,613 14,652 3.9United States 2,437 2,601 2,537 7,575 2.0Japan 2,347 1,989 1,763 6,099 1.6United Arab Emirates 1,495 – 4,022 5,517 1.5United Kingdom 2,835 16 2,099 4,950 1.3
(1) Assets (excluding life insurance fund investment assets) of $391 billion (2017: $379 billion).
39.3 Market Risk and Asset Liability ManagementMarket risk is the risk of loss of income and/or market value due to fluctuations in factors such as interest rates, foreign exchange rates, credit spreads, equity and commodity prices or changes in volatility or correlations of such factors. The Group is exposed to market risks from its trading, client servicing and balance sheet management activities.
Market risk management strategy and market risk limits are established within the Group’s risk appetite and business strategies, taking into account macroeconomic and market conditions. Market risk limits are subject to regular reviews.
Asset liability management is the strategic management of the Group’s balance sheet structure and liquidity requirements, covering liquidity sourcing and diversification as well as interest rate and structural foreign exchange management.
The Asset Liability Management (ALM) framework comprises liquidity risk management, interest rate risk management and structural foreign exchange risk management.
233Financials
39. Risk Management (continued)39.3 Market Risk and Asset Liability Management (continued)Interest Rate RiskThe primary goal of the management of Interest Rate Risk in the Banking Book (IRRBB) is to ensure that interest rate risk exposures are maintained within defined risk tolerances and are consistent with the Group’s risk appetite.
IRRBB is the risk to earnings and capital arising from exposure to adverse movements in interest rates. The material sources of IRRBB are repricing risk, yield curve risk, basis risk and optionality risk. A range of techniques are used to measure these risks from an earnings and economic value perspective. One method involves the simulation of the impact of various interest rate scenarios on our net interest income and economic value of equity (EVE). Other measures include interest rate sensitivity measures such as PV01 as well as repricing gap profile analysis. Triggers are set based on our risk appetite on earnings and capital. The results are used to adjust IRRBB management strategies, policies and positions.
The significant market risk faced by the Group is interest rate risk arising from the re-pricing mismatches of assets and liabilities from its banking businesses. These are monitored using a variety of risk metrics. The impact on net interest income of the banking book is simulated under various interest rate scenarios and assumptions. Based on a 100 bp parallel rise in yield curves on the Group’s exposure to major currencies i.e. Singapore Dollar, US Dollar, Hong Kong Dollar and Malaysian Ringgit, net interest income is estimated to increase by $744 million (2017: $436 million), or approximately +12.6% (2017: +8.0%) of reported net interest income. The corresponding impact from a 100 bp decrease is an estimated reduction of $744 million (2017: $446 million) in net interest income, or approximately -12.6% (2017: -8.2%) of reported net interest income.
The 1% rate shock impact on net interest income is based on the Group’s interest rate risk profile as at reporting date. It does not take into account actions that would be taken by Global Treasury or the business units to mitigate the impact of this interest rate risk. In reality, Global Treasury seeks proactively to change the interest rate risk profile to minimise losses and maximise net revenues. The projections also assume a constant balance sheet position and that all positions run to maturity.
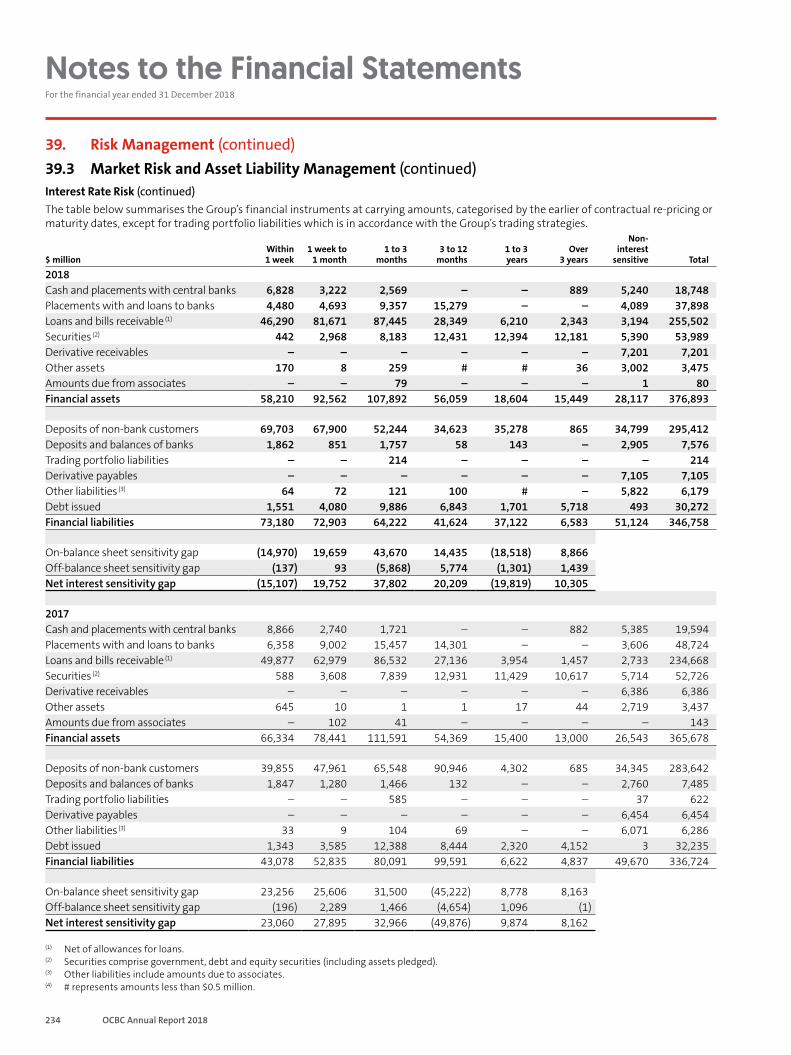
234 OCBC Annual Report 2018
Notes to the Financial Statements For the financial year ended 31 December 2018
39. Risk Management (continued)39.3 Market Risk and Asset Liability Management (continued)Interest Rate Risk (continued)The table below summarises the Group’s financial instruments at carrying amounts, categorised by the earlier of contractual re-pricing or maturity dates, except for trading portfolio liabilities which is in accordance with the Group’s trading strategies.
$ millionWithin 1 week
1 week to1 month
1 to 3months
3 to 12months
1 to 3 years
Over3 years
Non-interest
sensitive Total
2018Cash and placements with central banks 6,828 3,222 2,569 – – 889 5,240 18,748Placements with and loans to banks 4,480 4,693 9,357 15,279 – – 4,089 37,898Loans and bills receivable (1) 46,290 81,671 87,445 28,349 6,210 2,343 3,194 255,502Securities (2) 442 2,968 8,183 12,431 12,394 12,181 5,390 53,989Derivative receivables – – – – – – 7,201 7,201Other assets 170 8 259 # # 36 3,002 3,475Amounts due from associates – – 79 – – – 1 80Financial assets 58,210 92,562 107,892 56,059 18,604 15,449 28,117 376,893
Deposits of non-bank customers 69,703 67,900 52,244 34,623 35,278 865 34,799 295,412Deposits and balances of banks 1,862 851 1,757 58 143 – 2,905 7,576Trading portfolio liabilities – – 214 – – – – 214Derivative payables – – – – – – 7,105 7,105Other liabilities (3) 64 72 121 100 # – 5,822 6,179Debt issued 1,551 4,080 9,886 6,843 1,701 5,718 493 30,272Financial liabilities 73,180 72,903 64,222 41,624 37,122 6,583 51,124 346,758
On-balance sheet sensitivity gap (14,970) 19,659 43,670 14,435 (18,518) 8,866Off-balance sheet sensitivity gap (137) 93 (5,868) 5,774 (1,301) 1,439Net interest sensitivity gap (15,107) 19,752 37,802 20,209 (19,819) 10,305
2017Cash and placements with central banks 8,866 2,740 1,721 – – 882 5,385 19,594Placements with and loans to banks 6,358 9,002 15,457 14,301 – – 3,606 48,724Loans and bills receivable (1) 49,877 62,979 86,532 27,136 3,954 1,457 2,733 234,668Securities (2) 588 3,608 7,839 12,931 11,429 10,617 5,714 52,726Derivative receivables – – – – – – 6,386 6,386Other assets 645 10 1 1 17 44 2,719 3,437Amounts due from associates – 102 41 – – – – 143Financial assets 66,334 78,441 111,591 54,369 15,400 13,000 26,543 365,678
Deposits of non-bank customers 39,855 47,961 65,548 90,946 4,302 685 34,345 283,642Deposits and balances of banks 1,847 1,280 1,466 132 – – 2,760 7,485Trading portfolio liabilities – – 585 – – – 37 622Derivative payables – – – – – – 6,454 6,454Other liabilities (3) 33 9 104 69 – – 6,071 6,286Debt issued 1,343 3,585 12,388 8,444 2,320 4,152 3 32,235Financial liabilities 43,078 52,835 80,091 99,591 6,622 4,837 49,670 336,724
On-balance sheet sensitivity gap 23,256 25,606 31,500 (45,222) 8,778 8,163Off-balance sheet sensitivity gap (196) 2,289 1,466 (4,654) 1,096 (1)Net interest sensitivity gap 23,060 27,895 32,966 (49,876) 9,874 8,162
(1) Net of allowances for loans. (2) Securities comprise government, debt and equity securities (including assets pledged).(3) Other liabilities include amounts due to associates.(4) # represents amounts less than $0.5 million.

235Financials
39. Risk Management (continued)39.3 Market Risk and Asset Liability Management (continued)Currency RiskThe Group’s foreign exchange position by major currencies is shown below. “Others” include mainly Indonesian Rupiah, Chinese Renminbi, Australian Dollar, Euro, Japanese Yen and Sterling Pound.
$ million SGD USD MYR HKD Others Total
2018Cash and placements with central banks 10,761 1,753 2,014 426 3,794 18,748Placements with and loans to banks 518 29,592 1,269 694 5,825 37,898Loans and bills receivable 91,021 66,333 20,562 35,114 42,472 255,502Securities (1) 12,683 14,302 5,261 1,881 19,862 53,989Derivative receivables 1,855 3,392 84 443 1,427 7,201Other assets 1,235 1,135 240 321 544 3,475Amounts due from associates – – – – 80 80Financial assets 118,073 116,507 29,430 38,879 74,004 376,893
Deposits of non-bank customers 105,327 91,036 23,297 28,428 47,324 295,412Deposits and balances of banks 538 4,104 218 649 2,067 7,576Trading portfolio liabilities 206 8 – – – 214Derivative payables 1,814 3,429 72 445 1,345 7,105Other liabilities (2) 2,627 1,564 620 609 759 6,179Debt issued 406 20,071 256 358 9,181 30,272Financial liabilities 110,918 120,212 24,463 30,489 60,676 346,758
Net financial assets/(liabilities) exposure (3) 7,155 (3,705) 4,967 8,390 13,328
2017Cash and placements with central banks 9,040 3,368 2,132 305 4,749 19,594Placements with and loans to banks 961 34,167 813 1,098 11,685 48,724Loans and bills receivable 84,827 60,475 20,116 32,782 36,468 234,668Securities (1) 13,639 13,569 4,271 1,556 19,691 52,726Derivative receivables 1,886 2,559 82 551 1,308 6,386Other assets 1,419 983 192 313 530 3,437Amounts due from associates – – – – 143 143Financial assets 111,772 115,121 27,606 36,605 74,574 365,678
Deposits of non-bank customers 97,665 93,415 22,364 28,640 41,558 283,642Deposits and balances of banks 798 4,635 242 595 1,215 7,485Trading portfolio liabilities 586 6 – 30 – 622Derivative payables 1,866 2,465 154 514 1,455 6,454Other liabilities (2) 2,747 1,608 612 526 793 6,286Debt issued 457 21,778 228 327 9,445 32,235Financial liabilities 104,119 123,907 23,600 30,632 54,466 336,724
Net financial assets/(liabilities) exposure (3) 7,653 (8,786) 4,006 5,973 20,108
(1) Securities comprise government, debt and equity securities (including assets pledged).(2) Other liabilities include amounts due to associates.(3) Net exposure without taking into account the effect of offsetting derivative exposures.
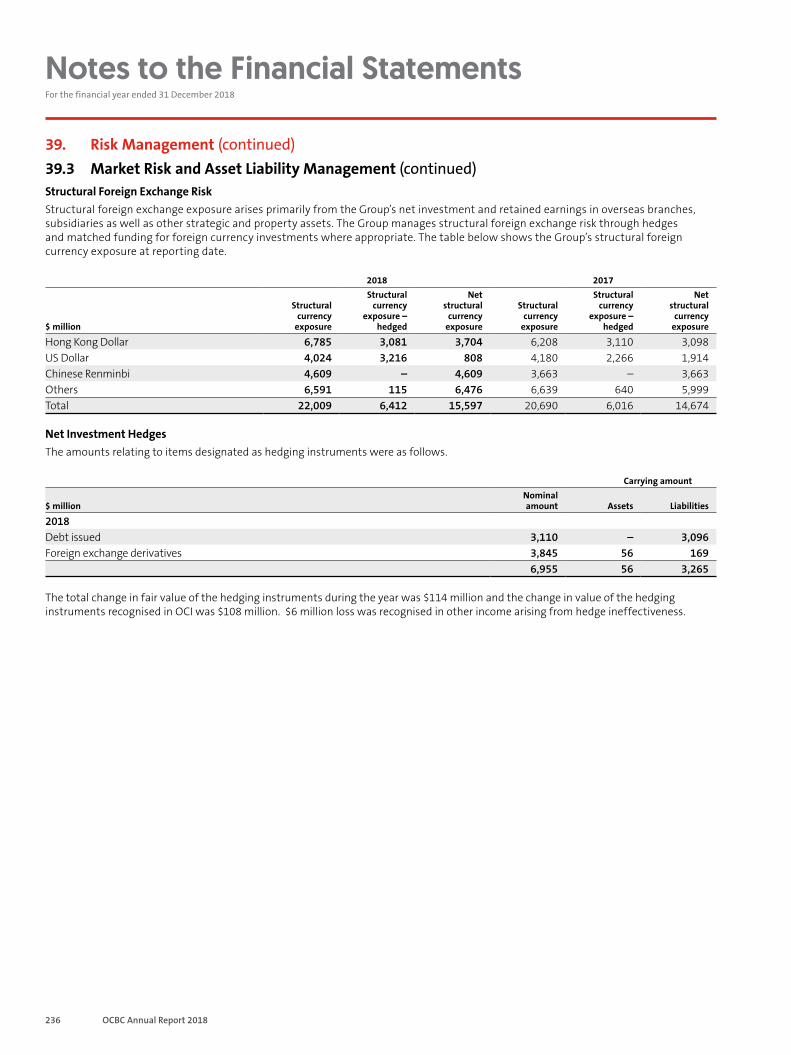
236 OCBC Annual Report 2018
Notes to the Financial Statements For the financial year ended 31 December 2018
39. Risk Management (continued)39.3 Market Risk and Asset Liability Management (continued)Structural Foreign Exchange RiskStructural foreign exchange exposure arises primarily from the Group’s net investment and retained earnings in overseas branches, subsidiaries as well as other strategic and property assets. The Group manages structural foreign exchange risk through hedges and matched funding for foreign currency investments where appropriate. The table below shows the Group’s structural foreign currency exposure at reporting date.
2018 2017
$ million
Structural currency
exposure
Structural currency
exposure – hedged
Net structural
currency exposure
Structural currency
exposure
Structural currency
exposure – hedged
Net structural
currency exposure
Hong Kong Dollar 6,785 3,081 3,704 6,208 3,110 3,098US Dollar 4,024 3,216 808 4,180 2,266 1,914Chinese Renminbi 4,609 – 4,609 3,663 – 3,663Others 6,591 115 6,476 6,639 640 5,999Total 22,009 6,412 15,597 20,690 6,016 14,674
Net Investment HedgesThe amounts relating to items designated as hedging instruments were as follows.
Carrying amount
$ millionNominal amount Assets Liabilities
2018Debt issued 3,110 – 3,096Foreign exchange derivatives 3,845 56 169
6,955 56 3,265
The total change in fair value of the hedging instruments during the year was $114 million and the change in value of the hedging instruments recognised in OCI was $108 million. $6 million loss was recognised in other income arising from hedge ineffectiveness.
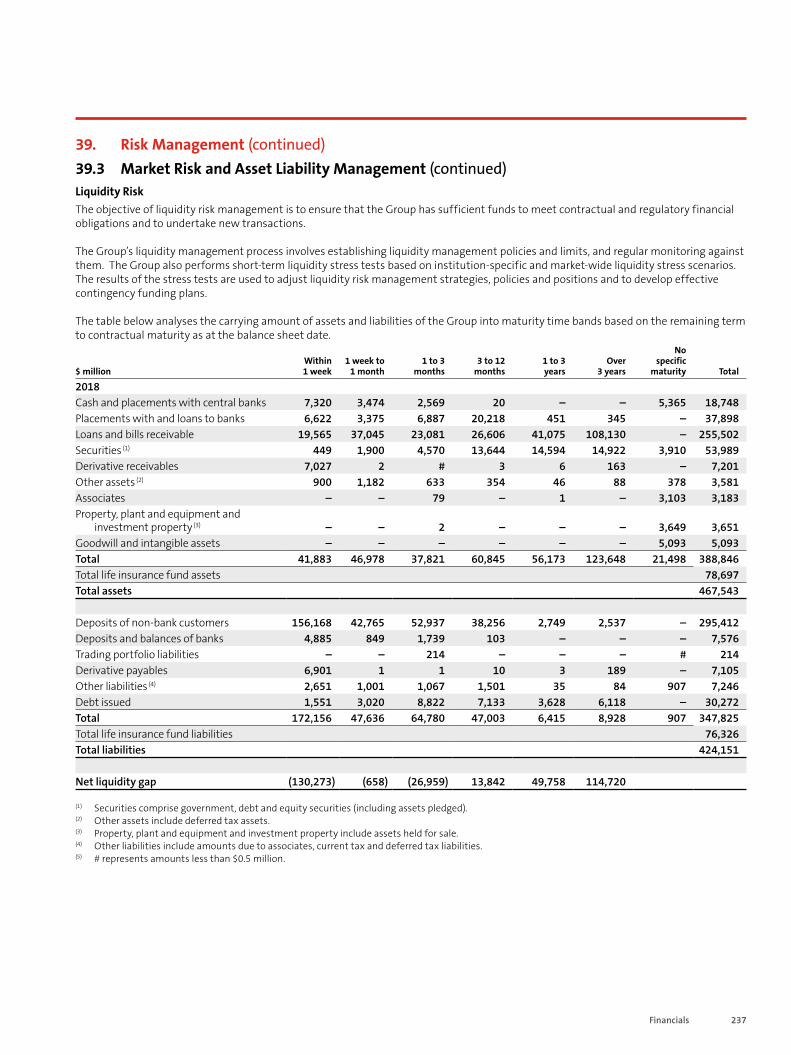
237Financials
39. Risk Management (continued)39.3 Market Risk and Asset Liability Management (continued)Liquidity Risk The objective of liquidity risk management is to ensure that the Group has sufficient funds to meet contractual and regulatory financial obligations and to undertake new transactions.
The Group’s liquidity management process involves establishing liquidity management policies and limits, and regular monitoring against them. The Group also performs short-term liquidity stress tests based on institution-specific and market-wide liquidity stress scenarios. The results of the stress tests are used to adjust liquidity risk management strategies, policies and positions and to develop effective contingency funding plans.
The table below analyses the carrying amount of assets and liabilities of the Group into maturity time bands based on the remaining term to contractual maturity as at the balance sheet date.
$ millionWithin 1 week
1 week to 1 month
1 to 3 months
3 to 12 months
1 to 3 years
Over3 years
Nospecific
maturity Total
2018Cash and placements with central banks 7,320 3,474 2,569 20 – – 5,365 18,748Placements with and loans to banks 6,622 3,375 6,887 20,218 451 345 – 37,898Loans and bills receivable 19,565 37,045 23,081 26,606 41,075 108,130 – 255,502Securities (1) 449 1,900 4,570 13,644 14,594 14,922 3,910 53,989Derivative receivables 7,027 2 # 3 6 163 – 7,201Other assets (2) 900 1,182 633 354 46 88 378 3,581Associates – – 79 – 1 – 3,103 3,183Property, plant and equipment and
investment property (3) – – 2 – – – 3,649 3,651Goodwill and intangible assets – – – – – – 5,093 5,093Total 41,883 46,978 37,821 60,845 56,173 123,648 21,498 388,846Total life insurance fund assets 78,697Total assets 467,543
Deposits of non-bank customers 156,168 42,765 52,937 38,256 2,749 2,537 – 295,412Deposits and balances of banks 4,885 849 1,739 103 – – – 7,576Trading portfolio liabilities – – 214 – – – # 214Derivative payables 6,901 1 1 10 3 189 – 7,105Other liabilities (4) 2,651 1,001 1,067 1,501 35 84 907 7,246Debt issued 1,551 3,020 8,822 7,133 3,628 6,118 – 30,272Total 172,156 47,636 64,780 47,003 6,415 8,928 907 347,825Total life insurance fund liabilities 76,326Total liabilities 424,151
Net liquidity gap (130,273) (658) (26,959) 13,842 49,758 114,720
(1) Securities comprise government, debt and equity securities (including assets pledged).(2) Other assets include deferred tax assets.(3) Property, plant and equipment and investment property include assets held for sale.(4) Other liabilities include amounts due to associates, current tax and deferred tax liabilities.(5) # represents amounts less than $0.5 million.

238 OCBC Annual Report 2018
Notes to the Financial Statements For the financial year ended 31 December 2018
39. Risk Management (continued)39.3 Market Risk and Asset Liability Management (continued)Liquidity Risk (continued)
$ millionWithin 1 week
1 week to1 month
1 to 3 months
3 to 12 months
1 to 3 years
Over3 years
No specific
maturity Total
2017Cash and placements with central banks 9,157 2,874 1,746 57 – – 5,760 19,594Placements with and loans to banks 7,770 8,208 14,329 16,583 1,216 618 – 48,724Loans and bills receivable 17,535 28,022 20,589 29,257 36,861 102,404 – 234,668Securities (1) 525 2,723 5,406 14,292 12,627 13,231 3,922 52,726Derivative receivables 6,101 3 10 # 3 269 – 6,386Other assets (2) 1,260 937 335 479 37 82 450 3,580Associates – 102 41 – 1 – 2,616 2,760 Property, plant and equipment and
investment property (3) – – 2 37 – – 3,704 3,743Goodwill and intangible assets – – – – – – 5,160 5,160Total 42,348 42,869 42,458 60,705 50,745 116,604 21,612 377,341 Total life insurance fund assets 75,352Total assets 452,693
Deposits of non-bank customers 158,604 42,211 42,201 37,456 1,328 1,842 – 283,642Deposits and balances of banks 4,836 1,282 1,221 146 – – – 7,485Trading portfolio liabilities – – 585 – – – 37 622Derivative payables 6,416 5 18 1 8 6 – 6,454Other liabilities (4) 2,285 1,091 956 2,075 53 89 761 7,310Debt issued 1,343 3,065 10,959 9,251 3,465 4,152 – 32,235Total 173,484 47,654 55,940 48,929 4,854 6,089 798 337,748Total life insurance fund liabilities 73,152Total liabilities 410,900
Net liquidity gap (131,136) (4,785) (13,482) 11,776 45,891 110,515
(1) Securities comprise government, debt and equity securities (including assets pledged).(2) Other assets include deferred tax assets.(3) Property, plant and equipment and investment property include assets held for sale.(4) Other liabilities include amounts due to associates, current tax and deferred tax liabilities.(5) # represents amounts less than $0.5 million.
As contractual maturities may not necessarily reflect the timing of actual cash flows of assets and liabilities, cash flows for liquidity risk analysis are based on a contractual and behavioural basis.
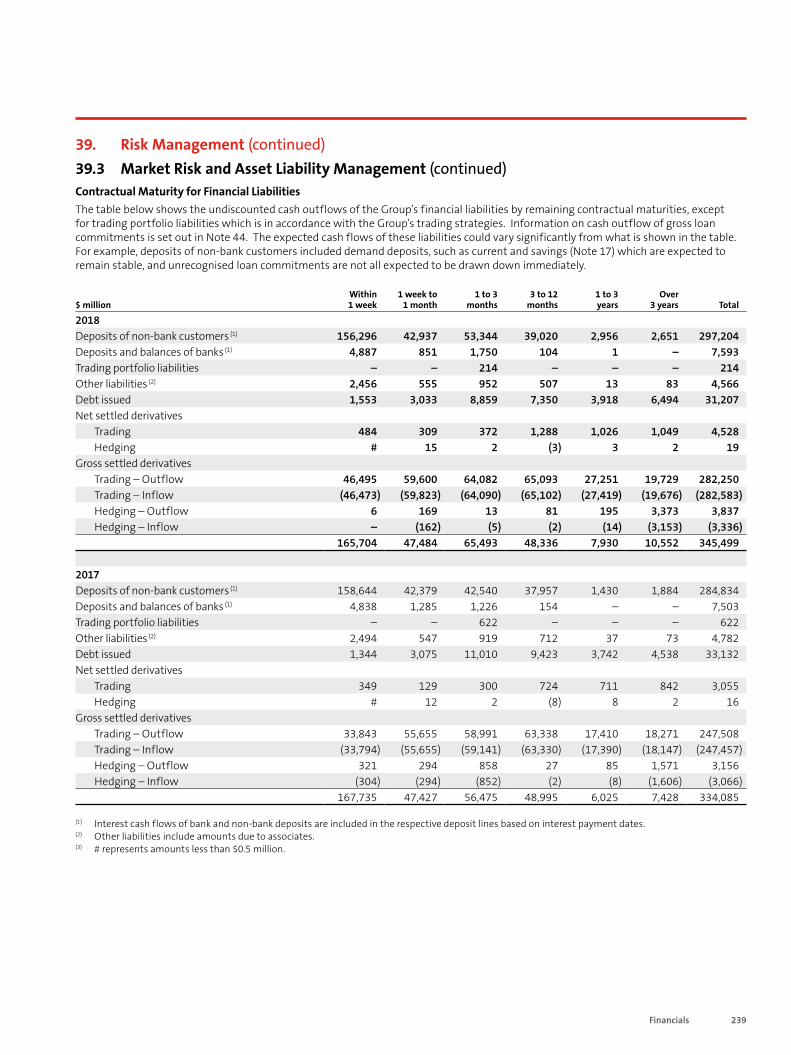
239Financials
39. Risk Management (continued)39.3 Market Risk and Asset Liability Management (continued)Contractual Maturity for Financial Liabilities The table below shows the undiscounted cash outflows of the Group’s financial liabilities by remaining contractual maturities, except for trading portfolio liabilities which is in accordance with the Group’s trading strategies. Information on cash outflow of gross loan commitments is set out in Note 44. The expected cash flows of these liabilities could vary significantly from what is shown in the table. For example, deposits of non-bank customers included demand deposits, such as current and savings (Note 17) which are expected to remain stable, and unrecognised loan commitments are not all expected to be drawn down immediately.
$ millionWithin 1 week
1 week to1 month
1 to 3 months
3 to 12 months
1 to 3 years
Over3 years Total
2018Deposits of non-bank customers (1) 156,296 42,937 53,344 39,020 2,956 2,651 297,204Deposits and balances of banks (1) 4,887 851 1,750 104 1 – 7,593Trading portfolio liabilities – – 214 – – – 214Other liabilities (2) 2,456 555 952 507 13 83 4,566Debt issued 1,553 3,033 8,859 7,350 3,918 6,494 31,207Net settled derivatives
Trading 484 309 372 1,288 1,026 1,049 4,528Hedging # 15 2 (3) 3 2 19
Gross settled derivativesTrading – Outflow 46,495 59,600 64,082 65,093 27,251 19,729 282,250Trading – Inflow (46,473) (59,823) (64,090) (65,102) (27,419) (19,676) (282,583)Hedging – Outflow 6 169 13 81 195 3,373 3,837Hedging – Inflow – (162) (5) (2) (14) (3,153) (3,336)
165,704 47,484 65,493 48,336 7,930 10,552 345,499
2017Deposits of non-bank customers (1) 158,644 42,379 42,540 37,957 1,430 1,884 284,834Deposits and balances of banks (1) 4,838 1,285 1,226 154 – – 7,503Trading portfolio liabilities – – 622 – – – 622Other liabilities (2) 2,494 547 919 712 37 73 4,782Debt issued 1,344 3,075 11,010 9,423 3,742 4,538 33,132Net settled derivatives
Trading 349 129 300 724 711 842 3,055Hedging # 12 2 (8) 8 2 16
Gross settled derivativesTrading – Outflow 33,843 55,655 58,991 63,338 17,410 18,271 247,508Trading – Inflow (33,794) (55,655) (59,141) (63,330) (17,390) (18,147) (247,457)Hedging – Outflow 321 294 858 27 85 1,571 3,156Hedging – Inflow (304) (294) (852) (2) (8) (1,606) (3,066)
167,735 47,427 56,475 48,995 6,025 7,428 334,085
(1) Interest cash flows of bank and non-bank deposits are included in the respective deposit lines based on interest payment dates.(2) Other liabilities include amounts due to associates.(3) # represents amounts less than $0.5 million.
240 OCBC Annual Report 2018
Notes to the Financial Statements For the financial year ended 31 December 2018
39. Risk Management (continued)39.4 Insurance-Related Risk Management This note sets out the risk management information of GEH Group.
Governance FrameworkManaging risk is an integral part of GEH Group’s core business. As stated in the Enterprise Risk Management (ERM) Framework, GEH Group shall operate within parameters and limits that have been set based on the risk appetite approved by the GEH Board, and pursue appropriate risk-adjusted returns.
GEH Group Risk Management department spearheads the development and implementation of the ERM Framework for GEH Group.
GEH Board is responsible to provide oversight on the risk management initiatives. GEH Board may delegate this responsibility to the Risk Management Committee (RMC). At GEH Group level, detailed risk management and oversight activities are undertaken by the following group management committees chaired by the Group Chief Executive Officer and comprising key Senior Management Executives, namely: Group Management Committee (GMC), Group Asset-Liability Committee (Group ALC), Group Investment Committee (Group IC), Group Product Management and Approval Committee (Group PMAC) and Group Information Technology Steering Committee (Group ITSC).
GMC is responsible for providing leadership, direction and functional oversight with regards to all matters of GEH Group. The GMC is also responsible for ensuring compliance and alignment with Group Governance and Oversight Framework, i.e. Group standards and guidelines. The GMC is supported by the local Senior Management Team (SMT) and local Product Development Committee (PDC).
Group IC is responsible for the oversight of all investment management activities of the company with added oversight to ensure that for the insurance funds, the interests and rights of policyholders are not compromised.
Group ALC is responsible for balance sheet management. Specifically, Group ALC reviews and formulates technical frameworks, policies and methodologies relating to balance sheet management. Group ALC is also responsible for ensuring compliance and alignment with Group Governance and Oversight Framework, i.e. Group standards and guidelines. Group ALC is supported by the local Asset-Liability Committee (ALC).
Group ITSC is responsible for the management of technology and information risks, and any relevant regulatory and compliance risks relating to technology and cyber security risks.
Group PMAC is responsible for reviewing, approving and managing new and existing products, ensuring the business operates within the risk appetite to deliver the annual business targets. Local PDC is responsible for reviewing and endorsing new products at the local operating subsidiaries.
Regulatory FrameworkInsurers are required to comply with the Insurance Act and Regulations, as applicable, including guidelines on investment limits. The responsibility for the formulation, establishment and approval of the investment policy rests with the respective Board of Directors (Board) of the insurance subsidiaries. The Board exercises oversight on investments to safeguard the interests of policyholders and shareholders.
Capital Management GEH’s capital management policy objectives are to create shareholder value, deliver sustainable returns to shareholders, maintain a strong capital position with sufficient buffer to meet policyholders’ obligations and regulatory requirements and make strategic investments for business growth.
GEH Group had no significant changes in the policies and processes relating to its capital structure during the year.
Regulatory CapitalThe insurance subsidiaries of GEH Group are required to comply with capital ratios prescribed by the insurance regulations of the jurisdiction in which the subsidiaries operate. The Capital Adequacy Ratios of GEH Group’s insurance subsidiaries in both Singapore and Malaysia remained well above the regulatory minimum ratios under the Risk based Capital Frameworks established by the Monetary Authority of Singapore (MAS) and Bank Negara, Malaysia (BNM) respectively.
241Financials
39. Risk Management (continued)39.4 Insurance-Related Risk Management (continued)Regulatory Capital (continued)GEH Group’s approach to capital management aims to maintain an adequate level of capital to meet regulatory requirements, including any additional amounts required by the respective regulators. This involves managing assets, liabilities and risks in a coordinated way by assessing and monitoring available and required capital (by each regulated entity) on a regular basis and, where appropriate, taking suitable actions to influence the capital position of GEH Group in light of changes in economic conditions and risk characteristics.
The primary sources of capital of GEH Group are shareholders’ equity and issued subordinated debt. GEH Group defines available capital as the amount of assets in excess of liabilities measured in accordance with the insurance regulations of the respective jurisdictions in which the insurance subsidiaries operate. Available capital of the consolidated Singapore insurance subsidiaries as at 31 December 2018 amounted to $11.5 billion (2017: $11.8 billion) while available capital of the consolidated Malaysia insurance subsidiaries as at 31 December 2018 amounted to $8.0 billion (2017: $8.2 billion).
DividendGEH’s dividend policy aims to provide shareholders with a predictable and sustainable dividend return, payable on a half-yearly basis.
Financial Risk ManagementThe following sections provide details regarding GEH Group’s exposure to insurance and key financial risks and the objectives, policies and processes for the management of these risks.
There has been no change to GEH Group’s exposure to these insurance and key financial risks or the manner in which it manages and measures the risks.
Insurance RiskThe principal activity of GEH Group is the provision of insurance products and related financial advisory services. The products cover risks such as mortality, morbidity (health, disability, critical illness, personal accident), and property and casualty, and meet customer needs in investment and retirement provision.
GEH Group’s underwriting strategy is designed to ensure that risks are well diversified across the types of risk and level of insured benefits. This is largely achieved through diversification across industry sectors and geography, the use of medical screening in order to ensure that pricing takes account of current health conditions and family medical history, regular review of actual claims experience, as well as detailed claims handling procedures. Underwriting limits are also set in place to enforce appropriate risk selection criteria. For example, GEH Group has the right not to renew individual policies, it can impose deductibles and it has the right to reject the payment of fraudulent claims.
Risks inherent in GEH Group’s activities include but are not limited to the risks discussed below.
Insurance Risks of Life Insurance ContractsInsurance risks arise when GEH Group underwrites insurance contracts. While insurance risks do not vary significantly across the geographical locations in which GEH Group currently operates, the types of risks insured, assumptions used in pricing the insurance products as well as subsequent setting of the technical provisions may give rise to potential shortfalls in provision for future claims and expenses when actual experience is different from expected experience. Assumptions that may cause insurance risks to be underestimated include assumptions on policy lapses, mortality, morbidity and expenses.
GEH Group utilises reinsurance to manage the mortality and morbidity risks. GEH Group’s reinsurance management strategy and policy are reviewed annually by RMC and Group ALC. Reinsurance structures are set based on the type of risk. Catastrophe reinsurance is procured to limit catastrophic losses. GEH Group’s exposure to group insurance business is not significant and there is no material concentration risk.
In general, reinsurers must have a minimum credit rating of S&P A- or equivalent to be considered for reinsurance business. GEH Group limits its risk to any one reinsurer by ceding different products to different reinsurers or to a panel of reinsurers.
Group ALC reviews the actual experience of mortality, morbidity, lapses and surrenders, and expenses to ensure that the policies, guidelines and limits put in place to manage the risks remain adequate and appropriate.
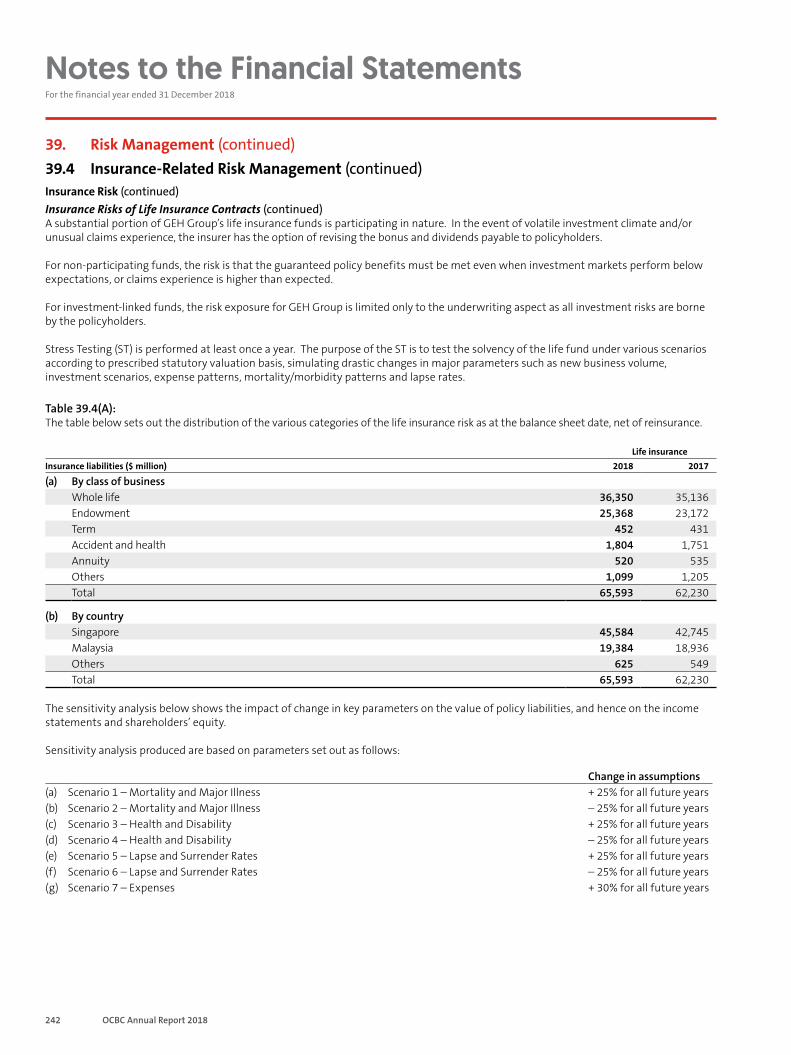
242 OCBC Annual Report 2018
Notes to the Financial Statements For the financial year ended 31 December 2018
39. Risk Management (continued)39.4 Insurance-Related Risk Management (continued)Insurance Risk (continued)Insurance Risks of Life Insurance Contracts (continued)A substantial portion of GEH Group’s life insurance funds is participating in nature. In the event of volatile investment climate and/or unusual claims experience, the insurer has the option of revising the bonus and dividends payable to policyholders.
For non-participating funds, the risk is that the guaranteed policy benefits must be met even when investment markets perform below expectations, or claims experience is higher than expected.
For investment-linked funds, the risk exposure for GEH Group is limited only to the underwriting aspect as all investment risks are borne by the policyholders.
Stress Testing (ST) is performed at least once a year. The purpose of the ST is to test the solvency of the life fund under various scenarios according to prescribed statutory valuation basis, simulating drastic changes in major parameters such as new business volume, investment scenarios, expense patterns, mortality/morbidity patterns and lapse rates.
Table 39.4(A):The table below sets out the distribution of the various categories of the life insurance risk as at the balance sheet date, net of reinsurance.
Life insuranceInsurance liabilities ($ million) 2018 2017
(a) By class of businessWhole life 36,350 35,136Endowment 25,368 23,172Term 452 431Accident and health 1,804 1,751Annuity 520 535Others 1,099 1,205Total 65,593 62,230
(b) By countrySingapore 45,584 42,745Malaysia 19,384 18,936Others 625 549Total 65,593 62,230
The sensitivity analysis below shows the impact of change in key parameters on the value of policy liabilities, and hence on the income statements and shareholders’ equity.
Sensitivity analysis produced are based on parameters set out as follows:
Change in assumptions(a) Scenario 1 – Mortality and Major Illness + 25% for all future years(b) Scenario 2 – Mortality and Major Illness – 25% for all future years(c) Scenario 3 – Health and Disability + 25% for all future years(d) Scenario 4 – Health and Disability – 25% for all future years(e) Scenario 5 – Lapse and Surrender Rates + 25% for all future years(f) Scenario 6 – Lapse and Surrender Rates – 25% for all future years(g) Scenario 7 – Expenses + 30% for all future years
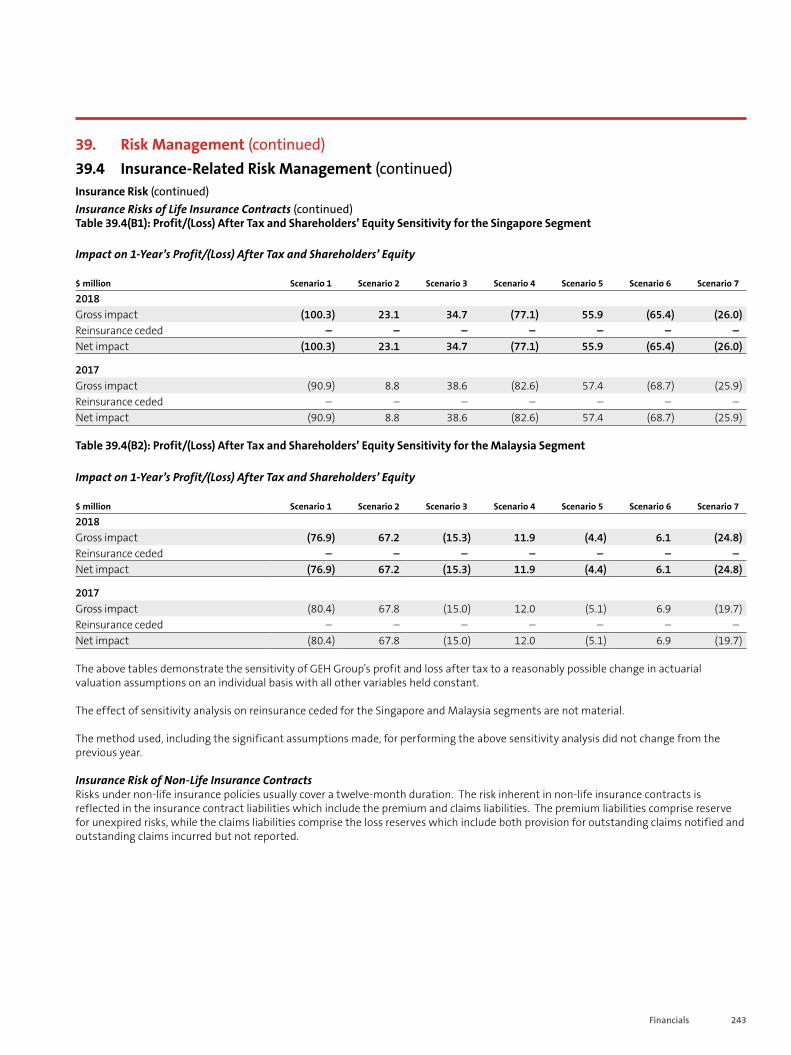
243Financials
39. Risk Management (continued)39.4 Insurance-Related Risk Management (continued)Insurance Risk (continued)Insurance Risks of Life Insurance Contracts (continued)Table 39.4(B1): Profit/(Loss) After Tax and Shareholders’ Equity Sensitivity for the Singapore Segment
Impact on 1-Year’s Profit/(Loss) After Tax and Shareholders’ Equity
$ million Scenario 1 Scenario 2 Scenario 3 Scenario 4 Scenario 5 Scenario 6 Scenario 7
2018Gross impact (100.3) 23.1 34.7 (77.1) 55.9 (65.4) (26.0)Reinsurance ceded – – – – – – –Net impact (100.3) 23.1 34.7 (77.1) 55.9 (65.4) (26.0)
2017Gross impact (90.9) 8.8 38.6 (82.6) 57.4 (68.7) (25.9)Reinsurance ceded – – – – – – –Net impact (90.9) 8.8 38.6 (82.6) 57.4 (68.7) (25.9)
Table 39.4(B2): Profit/(Loss) After Tax and Shareholders’ Equity Sensitivity for the Malaysia Segment
Impact on 1-Year’s Profit/(Loss) After Tax and Shareholders’ Equity
$ million Scenario 1 Scenario 2 Scenario 3 Scenario 4 Scenario 5 Scenario 6 Scenario 7
2018Gross impact (76.9) 67.2 (15.3) 11.9 (4.4) 6.1 (24.8)Reinsurance ceded – – – – – – –Net impact (76.9) 67.2 (15.3) 11.9 (4.4) 6.1 (24.8)
2017Gross impact (80.4) 67.8 (15.0) 12.0 (5.1) 6.9 (19.7)Reinsurance ceded – – – – – – –Net impact (80.4) 67.8 (15.0) 12.0 (5.1) 6.9 (19.7)
The above tables demonstrate the sensitivity of GEH Group’s profit and loss after tax to a reasonably possible change in actuarial valuation assumptions on an individual basis with all other variables held constant.
The effect of sensitivity analysis on reinsurance ceded for the Singapore and Malaysia segments are not material.
The method used, including the significant assumptions made, for performing the above sensitivity analysis did not change from the previous year.
Insurance Risk of Non-Life Insurance ContractsRisks under non-life insurance policies usually cover a twelve-month duration. The risk inherent in non-life insurance contracts is reflected in the insurance contract liabilities which include the premium and claims liabilities. The premium liabilities comprise reserve for unexpired risks, while the claims liabilities comprise the loss reserves which include both provision for outstanding claims notified and outstanding claims incurred but not reported.

244 OCBC Annual Report 2018
Notes to the Financial Statements For the financial year ended 31 December 2018
39. Risk Management (continued)39.4 Insurance-Related Risk Management (continued)Insurance Risk (continued)Insurance Risk of Non-Life Insurance Contracts (continued)Table 39.4(C1): The table below sets out the distribution of the various categories of the non-life insurance risk as at the balance sheet date:
2018 2017
Non-life insurance contracts $ million
Gross premium liabilities
Reinsured premiumliabilities
Net premium liabilities
Gross premium liabilities
Reinsured premium liabilities
Net premium liabilities
(a) By class of businessFire 19 (6) 13 19 (7) 12Motor 35 (2) 33 30 – 30Marine and aviation 3 (3) # 6 (5) 1Workmen’s compensation 16 (4) 12 13 (4) 9Personal accident and health 24 (2) 22 19 1 20Miscellaneous 50 (34) 16 42 (29) 13Total 147 (51) 96 129 (44) 85
(b) By countrySingapore 78 (35) 43 65 (29) 36Malaysia 69 (16) 53 64 (15) 49Total 147 (51) 96 129 (44) 85
2018 2017
Non-life insurance contracts $ million
Gross claims
liabilities
Reinsured claims
liabilities
Net claims
liabilities
Gross claims
liabilities
Reinsured claims
liabilities
Net claims
liabilities
(a) By class of businessFire 29 (19) 10 28 (20) 8Motor 55 (5) 50 56 (3) 53Marine and aviation 25 (22) 3 23 (20) 3Workmen’s compensation 26 (9) 17 26 (9) 17Personal accident and health 18 (2) 16 14 (1) 13Miscellaneous 84 (64) 20 85 (67) 18Total 237 (121) 116 232 (120) 112
(b) By countrySingapore 123 (74) 49 110 (61) 49Malaysia 114 (47) 67 122 (59) 63Total 237 (121) 116 232 (120) 112
(1) # represents amounts less than $0.5 million.
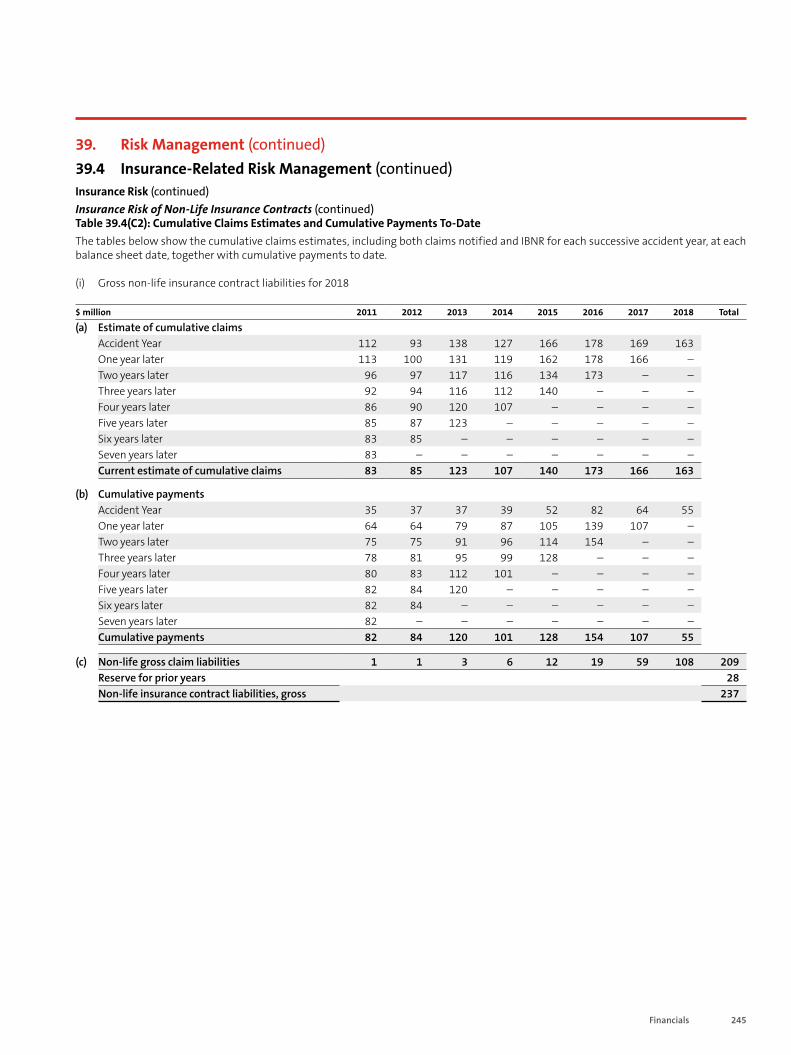
245Financials
39. Risk Management (continued)39.4 Insurance-Related Risk Management (continued)Insurance Risk (continued)Insurance Risk of Non-Life Insurance Contracts (continued)Table 39.4(C2): Cumulative Claims Estimates and Cumulative Payments To-DateThe tables below show the cumulative claims estimates, including both claims notified and IBNR for each successive accident year, at each balance sheet date, together with cumulative payments to date.
(i) Gross non-life insurance contract liabilities for 2018
$ million 2011 2012 2013 2014 2015 2016 2017 2018 Total
(a) Estimate of cumulative claimsAccident Year 112 93 138 127 166 178 169 163One year later 113 100 131 119 162 178 166 –Two years later 96 97 117 116 134 173 – –Three years later 92 94 116 112 140 – – –Four years later 86 90 120 107 – – – –Five years later 85 87 123 – – – – –Six years later 83 85 – – – – – –Seven years later 83 – – – – – – –Current estimate of cumulative claims 83 85 123 107 140 173 166 163
(b) Cumulative paymentsAccident Year 35 37 37 39 52 82 64 55One year later 64 64 79 87 105 139 107 –Two years later 75 75 91 96 114 154 – –Three years later 78 81 95 99 128 – – –Four years later 80 83 112 101 – – – –Five years later 82 84 120 – – – – –Six years later 82 84 – – – – – –Seven years later 82 – – – – – – –Cumulative payments 82 84 120 101 128 154 107 55
(c) Non-life gross claim liabilities 1 1 3 6 12 19 59 108 209Reserve for prior years 28Non-life insurance contract liabilities, gross 237
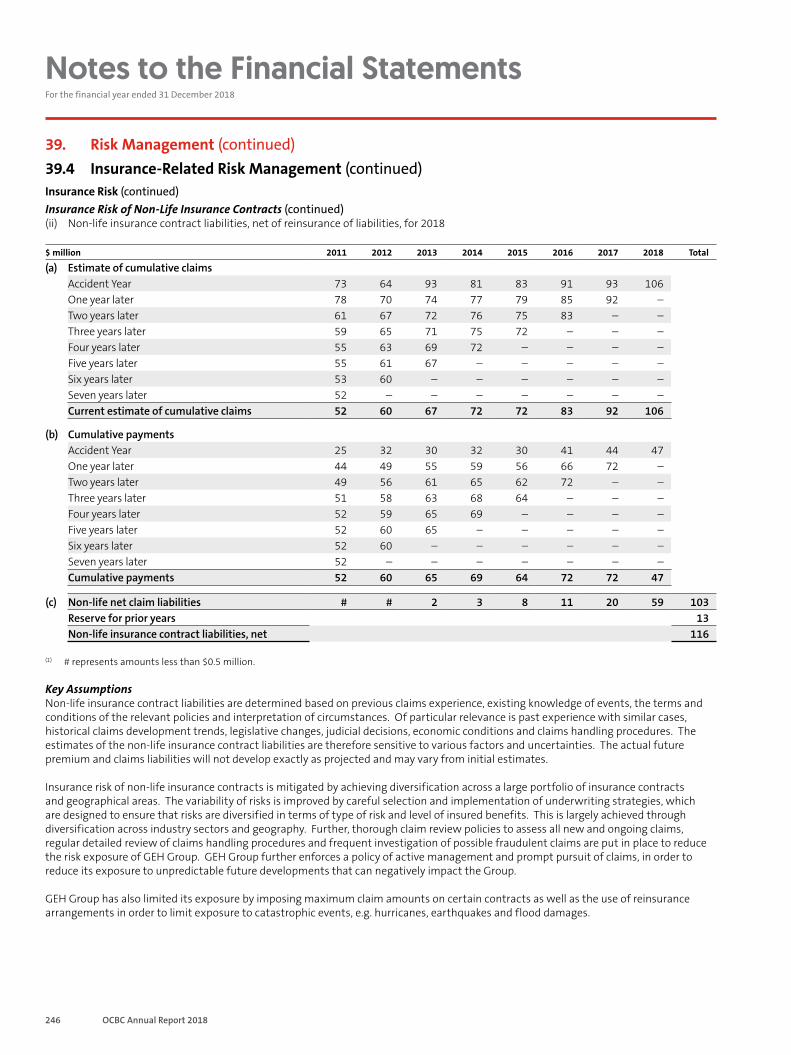
246 OCBC Annual Report 2018
Notes to the Financial Statements For the financial year ended 31 December 2018
39. Risk Management (continued)39.4 Insurance-Related Risk Management (continued)Insurance Risk (continued)Insurance Risk of Non-Life Insurance Contracts (continued)(ii) Non-life insurance contract liabilities, net of reinsurance of liabilities, for 2018
$ million 2011 2012 2013 2014 2015 2016 2017 2018 Total
(a) Estimate of cumulative claimsAccident Year 73 64 93 81 83 91 93 106One year later 78 70 74 77 79 85 92 –Two years later 61 67 72 76 75 83 – –Three years later 59 65 71 75 72 – – –Four years later 55 63 69 72 – – – –Five years later 55 61 67 – – – – –Six years later 53 60 – – – – – –Seven years later 52 – – – – – – –Current estimate of cumulative claims 52 60 67 72 72 83 92 106
(b) Cumulative paymentsAccident Year 25 32 30 32 30 41 44 47One year later 44 49 55 59 56 66 72 –Two years later 49 56 61 65 62 72 – –Three years later 51 58 63 68 64 – – –Four years later 52 59 65 69 – – – –Five years later 52 60 65 – – – – –Six years later 52 60 – – – – – –Seven years later 52 – – – – – – –Cumulative payments 52 60 65 69 64 72 72 47
(c) Non-life net claim liabilities # # 2 3 8 11 20 59 103Reserve for prior years 13Non-life insurance contract liabilities, net 116
(1) # represents amounts less than $0.5 million.
Key AssumptionsNon-life insurance contract liabilities are determined based on previous claims experience, existing knowledge of events, the terms and conditions of the relevant policies and interpretation of circumstances. Of particular relevance is past experience with similar cases, historical claims development trends, legislative changes, judicial decisions, economic conditions and claims handling procedures. The estimates of the non-life insurance contract liabilities are therefore sensitive to various factors and uncertainties. The actual future premium and claims liabilities will not develop exactly as projected and may vary from initial estimates.
Insurance risk of non-life insurance contracts is mitigated by achieving diversification across a large portfolio of insurance contracts and geographical areas. The variability of risks is improved by careful selection and implementation of underwriting strategies, which are designed to ensure that risks are diversified in terms of type of risk and level of insured benefits. This is largely achieved through diversification across industry sectors and geography. Further, thorough claim review policies to assess all new and ongoing claims, regular detailed review of claims handling procedures and frequent investigation of possible fraudulent claims are put in place to reduce the risk exposure of GEH Group. GEH Group further enforces a policy of active management and prompt pursuit of claims, in order to reduce its exposure to unpredictable future developments that can negatively impact the Group.
GEH Group has also limited its exposure by imposing maximum claim amounts on certain contracts as well as the use of reinsurance arrangements in order to limit exposure to catastrophic events, e.g. hurricanes, earthquakes and flood damages.
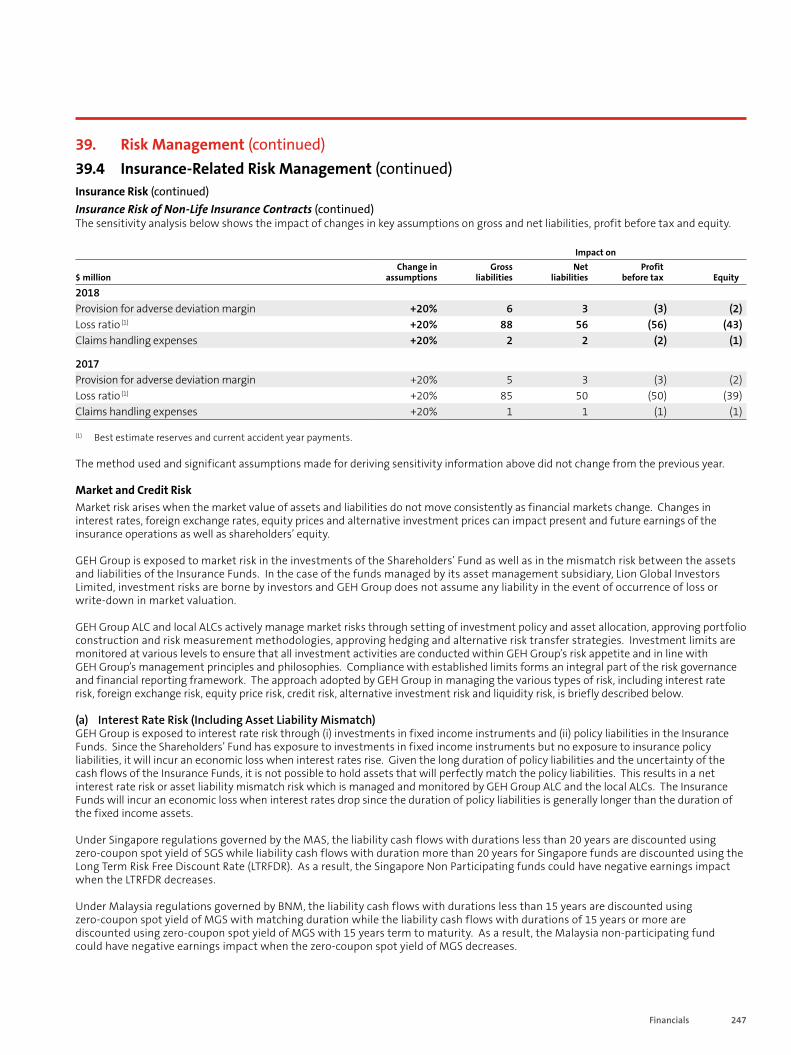
247Financials
39. Risk Management (continued)39.4 Insurance-Related Risk Management (continued)Insurance Risk (continued)Insurance Risk of Non-Life Insurance Contracts (continued)The sensitivity analysis below shows the impact of changes in key assumptions on gross and net liabilities, profit before tax and equity.
Impact on
$ millionChange in
assumptionsGross
liabilitiesNet
liabilitiesProfit
before tax Equity
2018Provision for adverse deviation margin +20% 6 3 (3) (2)Loss ratio (1) +20% 88 56 (56) (43)Claims handling expenses +20% 2 2 (2) (1)
2017Provision for adverse deviation margin +20% 5 3 (3) (2)Loss ratio (1) +20% 85 50 (50) (39)Claims handling expenses +20% 1 1 (1) (1)
(1) Best estimate reserves and current accident year payments.
The method used and significant assumptions made for deriving sensitivity information above did not change from the previous year.
Market and Credit RiskMarket risk arises when the market value of assets and liabilities do not move consistently as financial markets change. Changes in interest rates, foreign exchange rates, equity prices and alternative investment prices can impact present and future earnings of the insurance operations as well as shareholders’ equity.
GEH Group is exposed to market risk in the investments of the Shareholders’ Fund as well as in the mismatch risk between the assets and liabilities of the Insurance Funds. In the case of the funds managed by its asset management subsidiary, Lion Global Investors Limited, investment risks are borne by investors and GEH Group does not assume any liability in the event of occurrence of loss or write-down in market valuation.
GEH Group ALC and local ALCs actively manage market risks through setting of investment policy and asset allocation, approving portfolio construction and risk measurement methodologies, approving hedging and alternative risk transfer strategies. Investment limits are monitored at various levels to ensure that all investment activities are conducted within GEH Group’s risk appetite and in line with GEH Group’s management principles and philosophies. Compliance with established limits forms an integral part of the risk governance and financial reporting framework. The approach adopted by GEH Group in managing the various types of risk, including interest rate risk, foreign exchange risk, equity price risk, credit risk, alternative investment risk and liquidity risk, is briefly described below.
(a) Interest Rate Risk (Including Asset Liability Mismatch)GEH Group is exposed to interest rate risk through (i) investments in fixed income instruments and (ii) policy liabilities in the Insurance Funds. Since the Shareholders’ Fund has exposure to investments in fixed income instruments but no exposure to insurance policy liabilities, it will incur an economic loss when interest rates rise. Given the long duration of policy liabilities and the uncertainty of the cash flows of the Insurance Funds, it is not possible to hold assets that will perfectly match the policy liabilities. This results in a net interest rate risk or asset liability mismatch risk which is managed and monitored by GEH Group ALC and the local ALCs. The Insurance Funds will incur an economic loss when interest rates drop since the duration of policy liabilities is generally longer than the duration of the fixed income assets.
Under Singapore regulations governed by the MAS, the liability cash flows with durations less than 20 years are discounted using zero-coupon spot yield of SGS while liability cash flows with duration more than 20 years for Singapore funds are discounted using the Long Term Risk Free Discount Rate (LTRFDR). As a result, the Singapore Non Participating funds could have negative earnings impact when the LTRFDR decreases.
Under Malaysia regulations governed by BNM, the liability cash flows with durations less than 15 years are discounted using zero-coupon spot yield of MGS with matching duration while the liability cash flows with durations of 15 years or more are discounted using zero-coupon spot yield of MGS with 15 years term to maturity. As a result, the Malaysia non-participating fund could have negative earnings impact when the zero-coupon spot yield of MGS decreases.
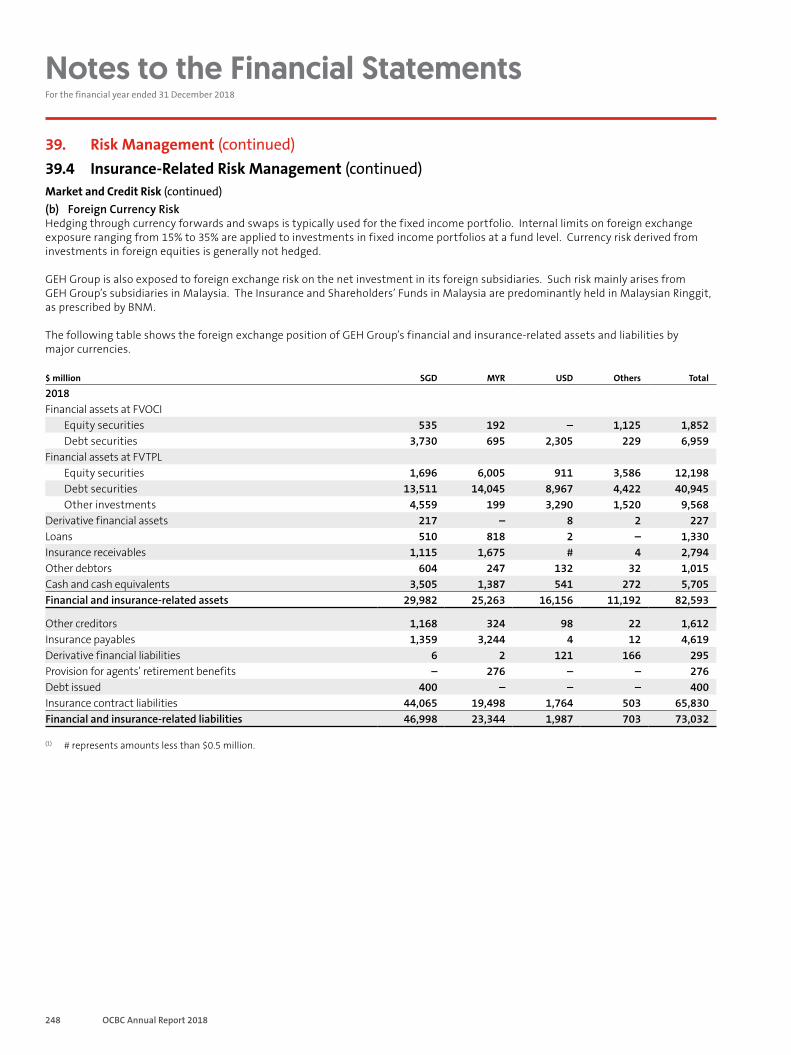
248 OCBC Annual Report 2018
Notes to the Financial Statements For the financial year ended 31 December 2018
39. Risk Management (continued)39.4 Insurance-Related Risk Management (continued)Market and Credit Risk (continued)(b) Foreign Currency RiskHedging through currency forwards and swaps is typically used for the fixed income portfolio. Internal limits on foreign exchange exposure ranging from 15% to 35% are applied to investments in fixed income portfolios at a fund level. Currency risk derived from investments in foreign equities is generally not hedged.
GEH Group is also exposed to foreign exchange risk on the net investment in its foreign subsidiaries. Such risk mainly arises from GEH Group’s subsidiaries in Malaysia. The Insurance and Shareholders’ Funds in Malaysia are predominantly held in Malaysian Ringgit, as prescribed by BNM.
The following table shows the foreign exchange position of GEH Group’s financial and insurance-related assets and liabilities by major currencies.
$ million SGD MYR USD Others Total
2018Financial assets at FVOCI
Equity securities 535 192 – 1,125 1,852Debt securities 3,730 695 2,305 229 6,959
Financial assets at FVTPLEquity securities 1,696 6,005 911 3,586 12,198Debt securities 13,511 14,045 8,967 4,422 40,945Other investments 4,559 199 3,290 1,520 9,568
Derivative financial assets 217 – 8 2 227Loans 510 818 2 – 1,330Insurance receivables 1,115 1,675 # 4 2,794Other debtors 604 247 132 32 1,015Cash and cash equivalents 3,505 1,387 541 272 5,705Financial and insurance-related assets 29,982 25,263 16,156 11,192 82,593
Other creditors 1,168 324 98 22 1,612Insurance payables 1,359 3,244 4 12 4,619Derivative financial liabilities 6 2 121 166 295Provision for agents’ retirement benefits – 276 – – 276Debt issued 400 – – – 400Insurance contract liabilities 44,065 19,498 1,764 503 65,830Financial and insurance-related liabilities 46,998 23,344 1,987 703 73,032
(1) # represents amounts less than $0.5 million.
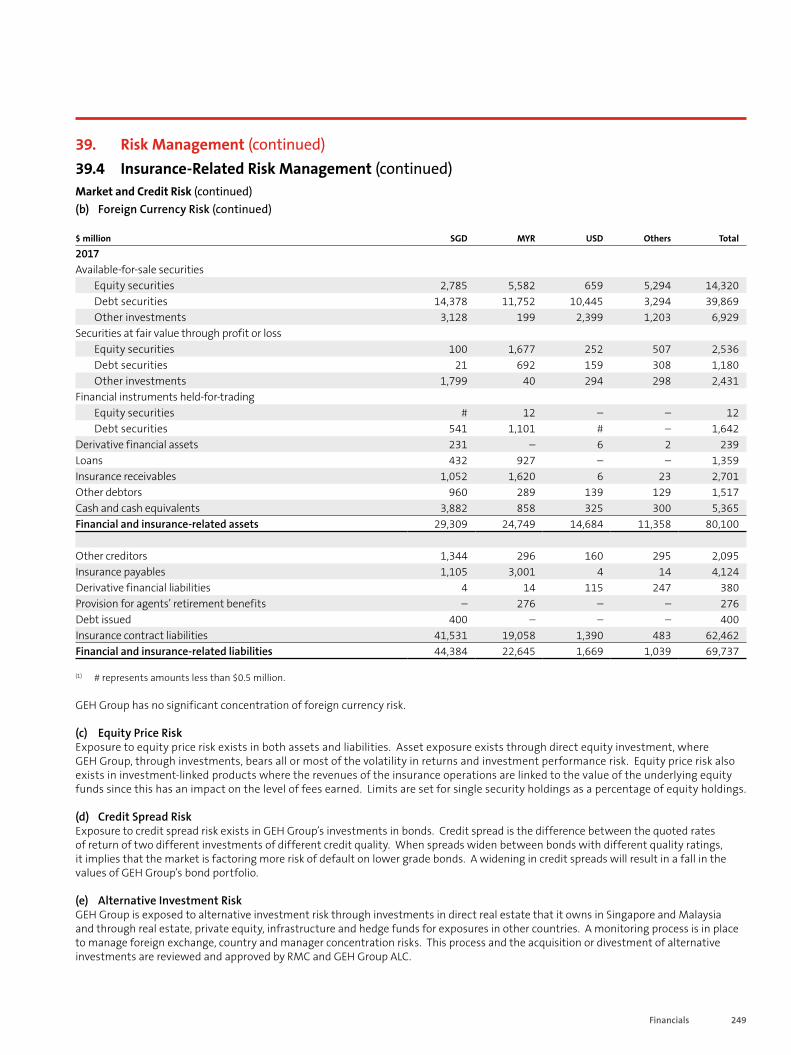
249Financials
39. Risk Management (continued)39.4 Insurance-Related Risk Management (continued)Market and Credit Risk (continued)(b) Foreign Currency Risk (continued)
$ million SGD MYR USD Others Total
2017Available-for-sale securities
Equity securities 2,785 5,582 659 5,294 14,320Debt securities 14,378 11,752 10,445 3,294 39,869Other investments 3,128 199 2,399 1,203 6,929
Securities at fair value through profit or lossEquity securities 100 1,677 252 507 2,536Debt securities 21 692 159 308 1,180Other investments 1,799 40 294 298 2,431
Financial instruments held-for-tradingEquity securities # 12 – – 12Debt securities 541 1,101 # – 1,642
Derivative financial assets 231 – 6 2 239Loans 432 927 – – 1,359Insurance receivables 1,052 1,620 6 23 2,701Other debtors 960 289 139 129 1,517Cash and cash equivalents 3,882 858 325 300 5,365Financial and insurance-related assets 29,309 24,749 14,684 11,358 80,100
Other creditors 1,344 296 160 295 2,095Insurance payables 1,105 3,001 4 14 4,124Derivative financial liabilities 4 14 115 247 380Provision for agents’ retirement benefits – 276 – – 276Debt issued 400 – – – 400Insurance contract liabilities 41,531 19,058 1,390 483 62,462Financial and insurance-related liabilities 44,384 22,645 1,669 1,039 69,737
(1) # represents amounts less than $0.5 million.
GEH Group has no significant concentration of foreign currency risk.
(c) Equity Price RiskExposure to equity price risk exists in both assets and liabilities. Asset exposure exists through direct equity investment, where GEH Group, through investments, bears all or most of the volatility in returns and investment performance risk. Equity price risk also exists in investment-linked products where the revenues of the insurance operations are linked to the value of the underlying equity funds since this has an impact on the level of fees earned. Limits are set for single security holdings as a percentage of equity holdings.
(d) Credit Spread RiskExposure to credit spread risk exists in GEH Group’s investments in bonds. Credit spread is the difference between the quoted rates of return of two different investments of different credit quality. When spreads widen between bonds with different quality ratings, it implies that the market is factoring more risk of default on lower grade bonds. A widening in credit spreads will result in a fall in the values of GEH Group’s bond portfolio.
(e) Alternative Investment RiskGEH Group is exposed to alternative investment risk through investments in direct real estate that it owns in Singapore and Malaysia and through real estate, private equity, infrastructure and hedge funds for exposures in other countries. A monitoring process is in place to manage foreign exchange, country and manager concentration risks. This process and the acquisition or divestment of alternative investments are reviewed and approved by RMC and GEH Group ALC.
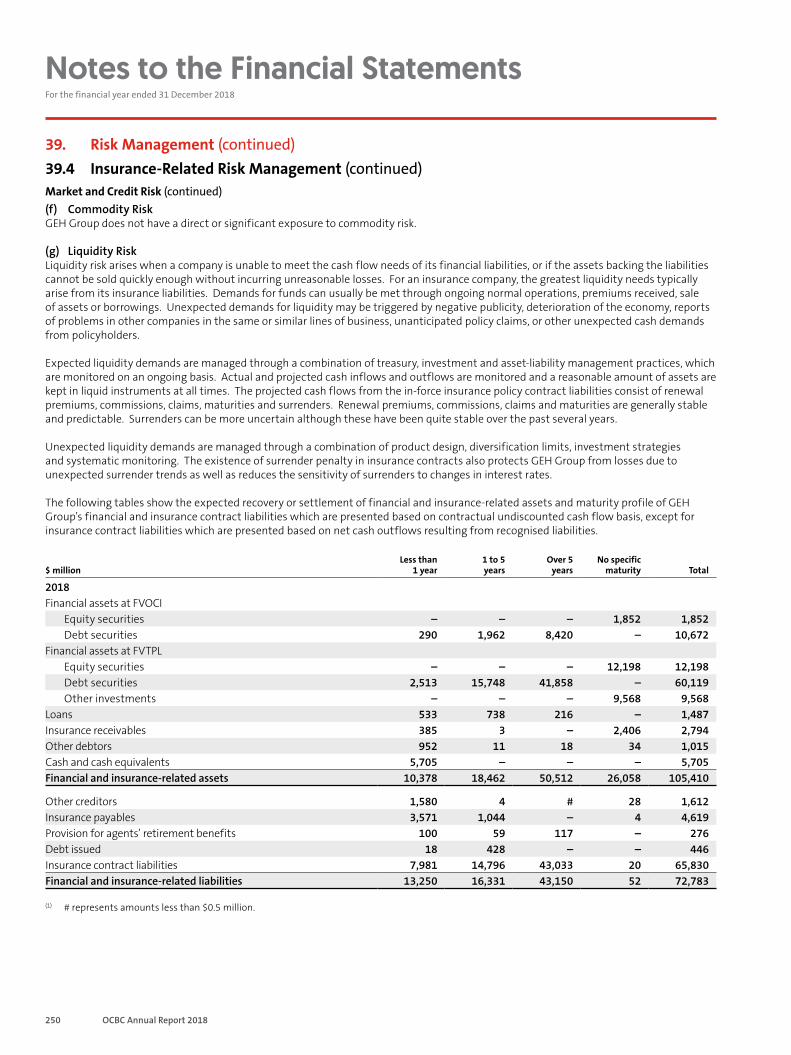
250 OCBC Annual Report 2018
Notes to the Financial Statements For the financial year ended 31 December 2018
39. Risk Management (continued)39.4 Insurance-Related Risk Management (continued)Market and Credit Risk (continued)(f) Commodity RiskGEH Group does not have a direct or significant exposure to commodity risk.
(g) Liquidity RiskLiquidity risk arises when a company is unable to meet the cash flow needs of its financial liabilities, or if the assets backing the liabilities cannot be sold quickly enough without incurring unreasonable losses. For an insurance company, the greatest liquidity needs typically arise from its insurance liabilities. Demands for funds can usually be met through ongoing normal operations, premiums received, sale of assets or borrowings. Unexpected demands for liquidity may be triggered by negative publicity, deterioration of the economy, reports of problems in other companies in the same or similar lines of business, unanticipated policy claims, or other unexpected cash demands from policyholders.
Expected liquidity demands are managed through a combination of treasury, investment and asset-liability management practices, which are monitored on an ongoing basis. Actual and projected cash inflows and outflows are monitored and a reasonable amount of assets are kept in liquid instruments at all times. The projected cash flows from the in-force insurance policy contract liabilities consist of renewal premiums, commissions, claims, maturities and surrenders. Renewal premiums, commissions, claims and maturities are generally stable and predictable. Surrenders can be more uncertain although these have been quite stable over the past several years.
Unexpected liquidity demands are managed through a combination of product design, diversification limits, investment strategies and systematic monitoring. The existence of surrender penalty in insurance contracts also protects GEH Group from losses due to unexpected surrender trends as well as reduces the sensitivity of surrenders to changes in interest rates.
The following tables show the expected recovery or settlement of financial and insurance-related assets and maturity profile of GEH Group’s financial and insurance contract liabilities which are presented based on contractual undiscounted cash flow basis, except for insurance contract liabilities which are presented based on net cash outflows resulting from recognised liabilities.
$ millionLess than
1 year1 to 5 years
Over 5 years
No specific maturity Total
2018Financial assets at FVOCI
Equity securities – – – 1,852 1,852Debt securities 290 1,962 8,420 – 10,672
Financial assets at FVTPLEquity securities – – – 12,198 12,198Debt securities 2,513 15,748 41,858 – 60,119Other investments – – – 9,568 9,568
Loans 533 738 216 – 1,487Insurance receivables 385 3 – 2,406 2,794Other debtors 952 11 18 34 1,015Cash and cash equivalents 5,705 – – – 5,705Financial and insurance-related assets 10,378 18,462 50,512 26,058 105,410
Other creditors 1,580 4 # 28 1,612Insurance payables 3,571 1,044 – 4 4,619Provision for agents’ retirement benefits 100 59 117 – 276Debt issued 18 428 – – 446Insurance contract liabilities 7,981 14,796 43,033 20 65,830Financial and insurance-related liabilities 13,250 16,331 43,150 52 72,783
(1) # represents amounts less than $0.5 million.
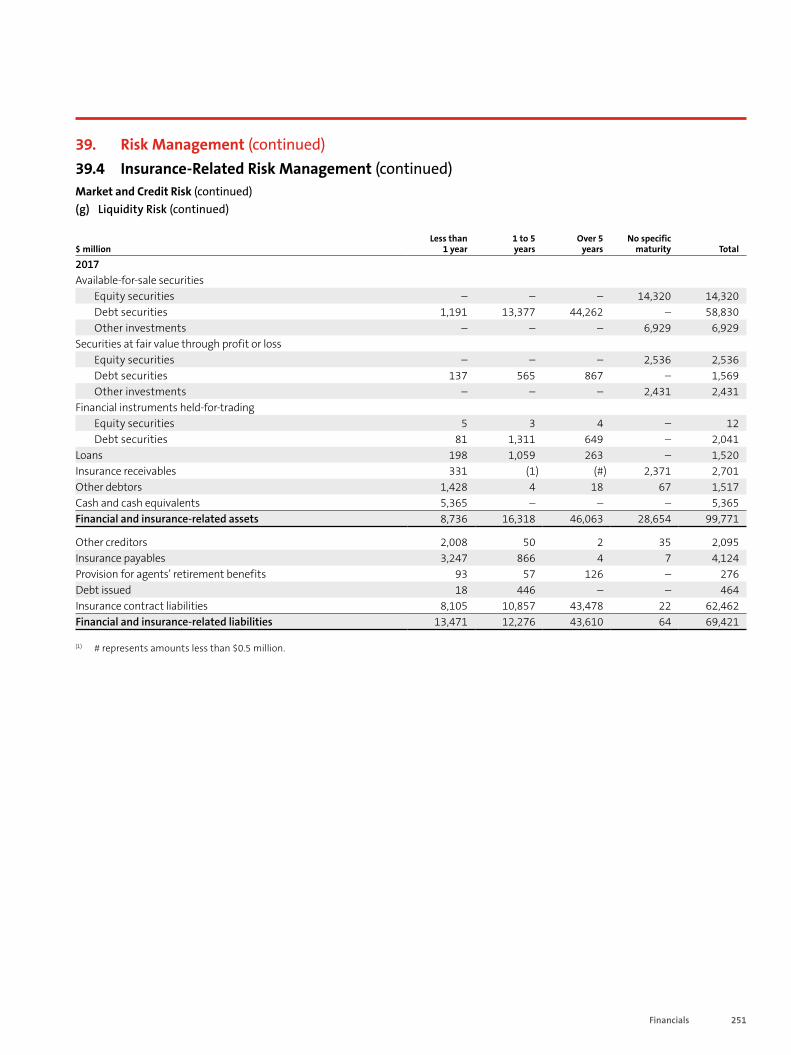
251Financials
39. Risk Management (continued)39.4 Insurance-Related Risk Management (continued)Market and Credit Risk (continued)(g) Liquidity Risk (continued)
$ millionLess than
1 year1 to 5 years
Over 5 years
No specific maturity Total
2017Available-for-sale securities
Equity securities – – – 14,320 14,320Debt securities 1,191 13,377 44,262 – 58,830Other investments – – – 6,929 6,929
Securities at fair value through profit or lossEquity securities – – – 2,536 2,536Debt securities 137 565 867 – 1,569Other investments – – – 2,431 2,431
Financial instruments held-for-tradingEquity securities 5 3 4 – 12Debt securities 81 1,311 649 – 2,041
Loans 198 1,059 263 – 1,520Insurance receivables 331 (1) (#) 2,371 2,701Other debtors 1,428 4 18 67 1,517Cash and cash equivalents 5,365 – – – 5,365Financial and insurance-related assets 8,736 16,318 46,063 28,654 99,771
Other creditors 2,008 50 2 35 2,095Insurance payables 3,247 866 4 7 4,124Provision for agents’ retirement benefits 93 57 126 – 276Debt issued 18 446 – – 464Insurance contract liabilities 8,105 10,857 43,478 22 62,462Financial and insurance-related liabilities 13,471 12,276 43,610 64 69,421
(1) # represents amounts less than $0.5 million.
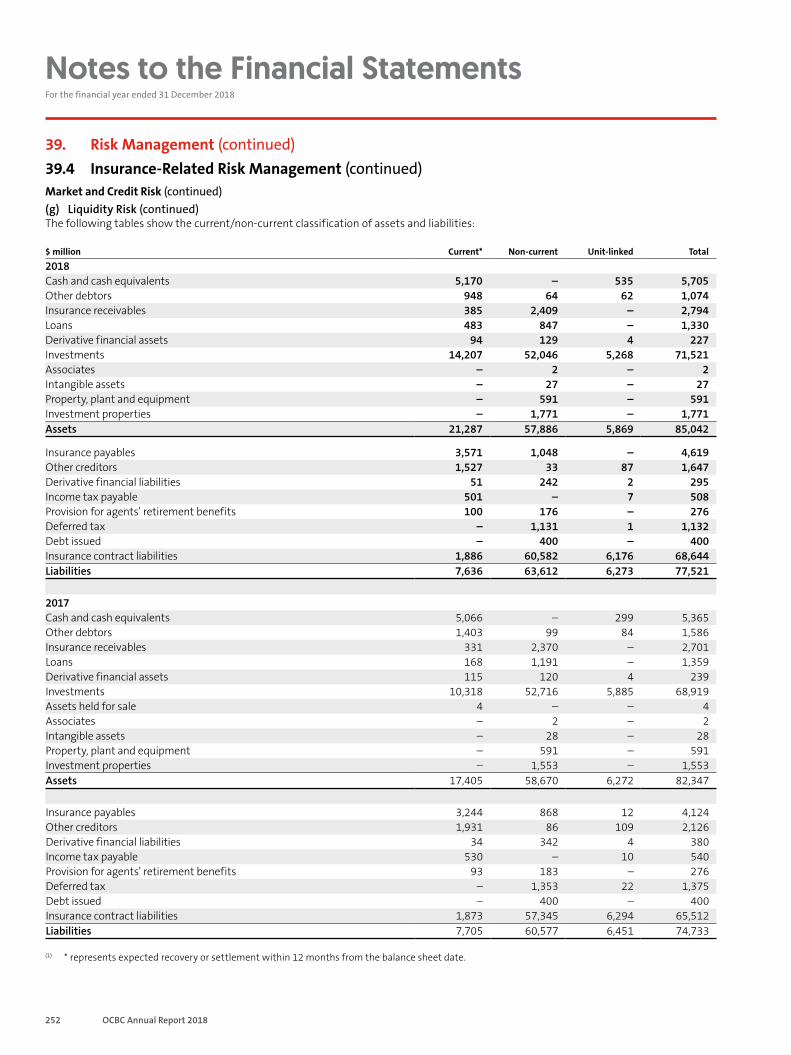
252 OCBC Annual Report 2018
Notes to the Financial Statements For the financial year ended 31 December 2018
39. Risk Management (continued)39.4 Insurance-Related Risk Management (continued)Market and Credit Risk (continued)(g) Liquidity Risk (continued)The following tables show the current/non-current classification of assets and liabilities:
$ million Current* Non-current Unit-linked Total
2018Cash and cash equivalents 5,170 – 535 5,705Other debtors 948 64 62 1,074Insurance receivables 385 2,409 – 2,794Loans 483 847 – 1,330Derivative financial assets 94 129 4 227Investments 14,207 52,046 5,268 71,521Associates – 2 – 2Intangible assets – 27 – 27Property, plant and equipment – 591 – 591Investment properties – 1,771 – 1,771Assets 21,287 57,886 5,869 85,042
Insurance payables 3,571 1,048 – 4,619Other creditors 1,527 33 87 1,647Derivative financial liabilities 51 242 2 295Income tax payable 501 – 7 508Provision for agents’ retirement benefits 100 176 – 276Deferred tax – 1,131 1 1,132Debt issued – 400 – 400Insurance contract liabilities 1,886 60,582 6,176 68,644Liabilities 7,636 63,612 6,273 77,521
2017Cash and cash equivalents 5,066 – 299 5,365Other debtors 1,403 99 84 1,586Insurance receivables 331 2,370 – 2,701Loans 168 1,191 – 1,359Derivative financial assets 115 120 4 239Investments 10,318 52,716 5,885 68,919Assets held for sale 4 – – 4Associates – 2 – 2Intangible assets – 28 – 28Property, plant and equipment – 591 – 591Investment properties – 1,553 – 1,553Assets 17,405 58,670 6,272 82,347
Insurance payables 3,244 868 12 4,124Other creditors 1,931 86 109 2,126Derivative financial liabilities 34 342 4 380Income tax payable 530 – 10 540Provision for agents’ retirement benefits 93 183 – 276Deferred tax – 1,353 22 1,375Debt issued – 400 – 400Insurance contract liabilities 1,873 57,345 6,294 65,512Liabilities 7,705 60,577 6,451 74,733
(1) * represents expected recovery or settlement within 12 months from the balance sheet date.
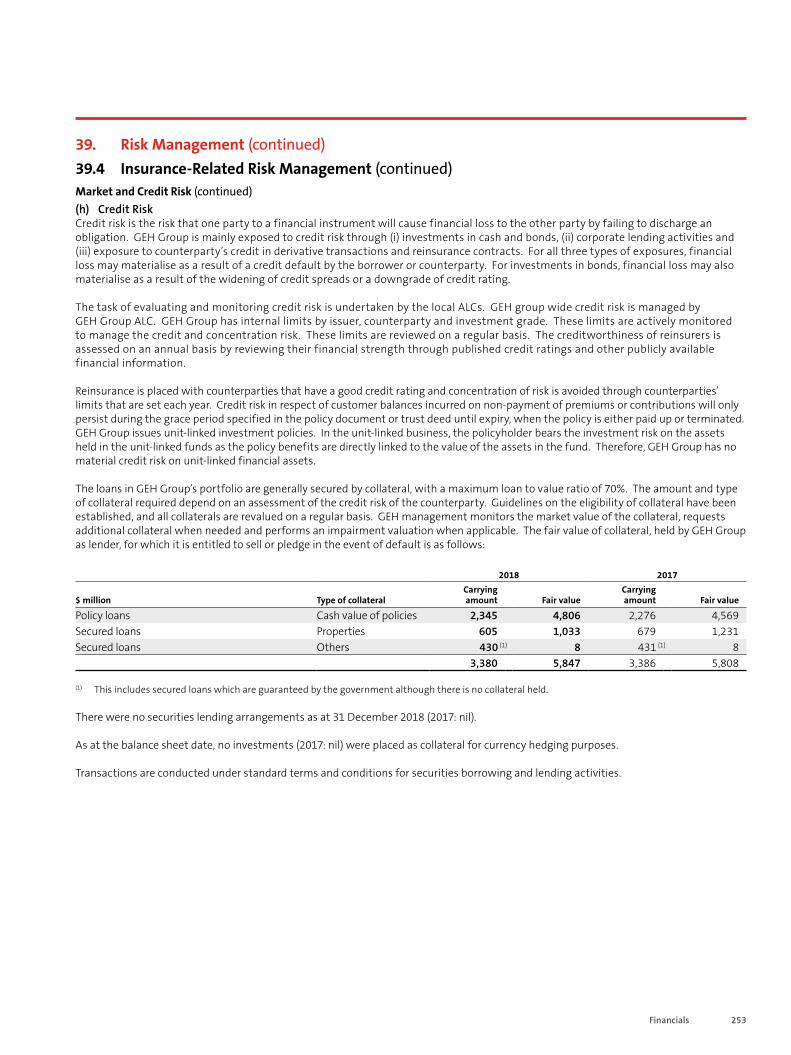
253Financials
39. Risk Management (continued)39.4 Insurance-Related Risk Management (continued)Market and Credit Risk (continued)(h) Credit Risk Credit risk is the risk that one party to a financial instrument will cause financial loss to the other party by failing to discharge an obligation. GEH Group is mainly exposed to credit risk through (i) investments in cash and bonds, (ii) corporate lending activities and (iii) exposure to counterparty’s credit in derivative transactions and reinsurance contracts. For all three types of exposures, financial loss may materialise as a result of a credit default by the borrower or counterparty. For investments in bonds, financial loss may also materialise as a result of the widening of credit spreads or a downgrade of credit rating.
The task of evaluating and monitoring credit risk is undertaken by the local ALCs. GEH group wide credit risk is managed by GEH Group ALC. GEH Group has internal limits by issuer, counterparty and investment grade. These limits are actively monitored to manage the credit and concentration risk. These limits are reviewed on a regular basis. The creditworthiness of reinsurers is assessed on an annual basis by reviewing their financial strength through published credit ratings and other publicly available financial information.
Reinsurance is placed with counterparties that have a good credit rating and concentration of risk is avoided through counterparties’ limits that are set each year. Credit risk in respect of customer balances incurred on non-payment of premiums or contributions will only persist during the grace period specified in the policy document or trust deed until expiry, when the policy is either paid up or terminated. GEH Group issues unit-linked investment policies. In the unit-linked business, the policyholder bears the investment risk on the assets held in the unit-linked funds as the policy benefits are directly linked to the value of the assets in the fund. Therefore, GEH Group has no material credit risk on unit-linked financial assets.
The loans in GEH Group’s portfolio are generally secured by collateral, with a maximum loan to value ratio of 70%. The amount and type of collateral required depend on an assessment of the credit risk of the counterparty. Guidelines on the eligibility of collateral have been established, and all collaterals are revalued on a regular basis. GEH management monitors the market value of the collateral, requests additional collateral when needed and performs an impairment valuation when applicable. The fair value of collateral, held by GEH Group as lender, for which it is entitled to sell or pledge in the event of default is as follows:
2018 2017
$ million Type of collateralCarrying amount Fair value
Carrying amount Fair value
Policy loans Cash value of policies 2,345 4,806 2,276 4,569Secured loans Properties 605 1,033 679 1,231Secured loans Others 430 (1) 8 431 (1) 8
3,380 5,847 3,386 5,808
(1) This includes secured loans which are guaranteed by the government although there is no collateral held.
There were no securities lending arrangements as at 31 December 2018 (2017: nil).
As at the balance sheet date, no investments (2017: nil) were placed as collateral for currency hedging purposes.
Transactions are conducted under standard terms and conditions for securities borrowing and lending activities.
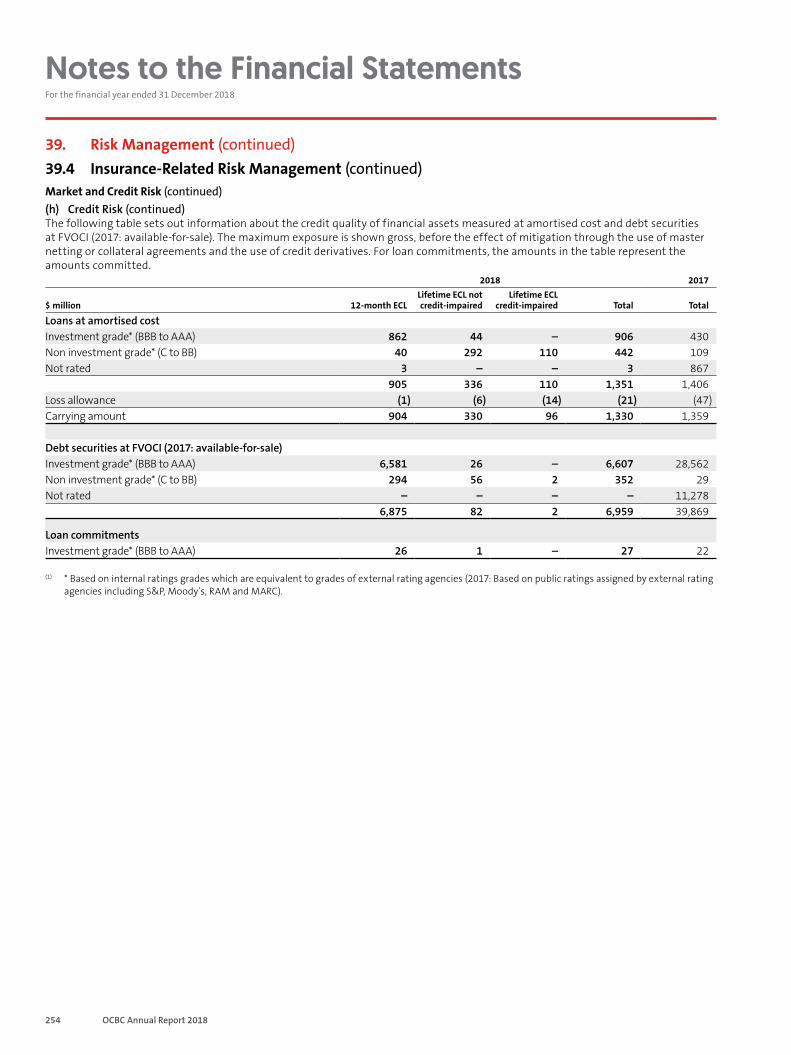
254 OCBC Annual Report 2018
Notes to the Financial Statements For the financial year ended 31 December 2018
39. Risk Management (continued)39.4 Insurance-Related Risk Management (continued)Market and Credit Risk (continued)(h) Credit Risk (continued)The following table sets out information about the credit quality of financial assets measured at amortised cost and debt securities at FVOCI (2017: available-for-sale). The maximum exposure is shown gross, before the effect of mitigation through the use of master netting or collateral agreements and the use of credit derivatives. For loan commitments, the amounts in the table represent the amounts committed.
2018 2017
$ million 12-month ECLLifetime ECL not credit-impaired
Lifetime ECL credit-impaired Total Total
Loans at amortised costInvestment grade* (BBB to AAA) 862 44 – 906 430Non investment grade* (C to BB) 40 292 110 442 109Not rated 3 – – 3 867
905 336 110 1,351 1,406Loss allowance (1) (6) (14) (21) (47)Carrying amount 904 330 96 1,330 1,359
Debt securities at FVOCI (2017: available-for-sale)Investment grade* (BBB to AAA) 6,581 26 – 6,607 28,562Non investment grade* (C to BB) 294 56 2 352 29Not rated – – – – 11,278
6,875 82 2 6,959 39,869
Loan commitmentsInvestment grade* (BBB to AAA) 26 1 – 27 22
(1) * Based on internal ratings grades which are equivalent to grades of external rating agencies (2017: Based on public ratings assigned by external rating agencies including S&P, Moody’s, RAM and MARC).
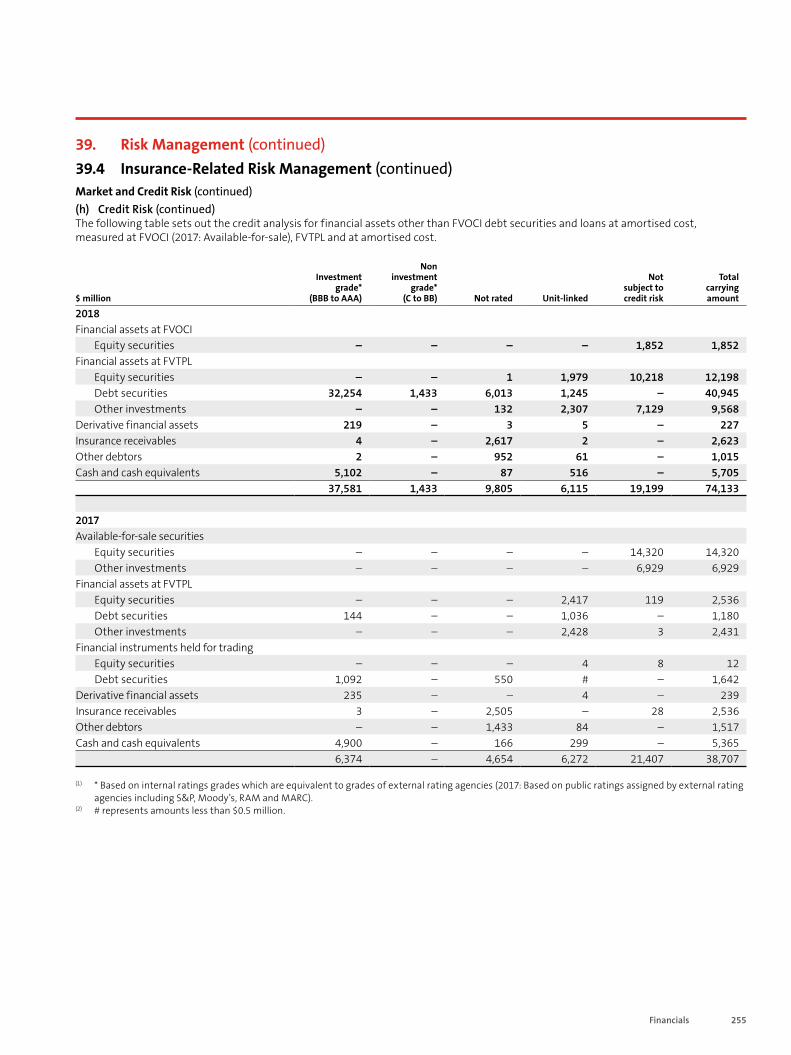
255Financials
39. Risk Management (continued)39.4 Insurance-Related Risk Management (continued)Market and Credit Risk (continued)(h) Credit Risk (continued)The following table sets out the credit analysis for financial assets other than FVOCI debt securities and loans at amortised cost, measured at FVOCI (2017: Available-for-sale), FVTPL and at amortised cost.
$ million
Investment grade*
(BBB to AAA)
Non investment
grade* (C to BB) Not rated Unit-linked
Not subject to credit risk
Total carrying amount
2018Financial assets at FVOCI
Equity securities – – – – 1,852 1,852Financial assets at FVTPL
Equity securities – – 1 1,979 10,218 12,198Debt securities 32,254 1,433 6,013 1,245 – 40,945Other investments – – 132 2,307 7,129 9,568
Derivative financial assets 219 – 3 5 – 227Insurance receivables 4 – 2,617 2 – 2,623Other debtors 2 – 952 61 – 1,015Cash and cash equivalents 5,102 – 87 516 – 5,705
37,581 1,433 9,805 6,115 19,199 74,133
2017Available-for-sale securities
Equity securities – – – – 14,320 14,320Other investments – – – – 6,929 6,929
Financial assets at FVTPLEquity securities – – – 2,417 119 2,536Debt securities 144 – – 1,036 – 1,180Other investments – – – 2,428 3 2,431
Financial instruments held for trading Equity securities – – – 4 8 12Debt securities 1,092 – 550 # – 1,642
Derivative financial assets 235 – – 4 – 239Insurance receivables 3 – 2,505 – 28 2,536Other debtors – – 1,433 84 – 1,517Cash and cash equivalents 4,900 – 166 299 – 5,365
6,374 – 4,654 6,272 21,407 38,707
(1) * Based on internal ratings grades which are equivalent to grades of external rating agencies (2017: Based on public ratings assigned by external rating agencies including S&P, Moody’s, RAM and MARC).
(2) # represents amounts less than $0.5 million.
256 OCBC Annual Report 2018
Notes to the Financial Statements For the financial year ended 31 December 2018
39. Risk Management (continued)39.4 Insurance-Related Risk Management (continued)Market and Credit Risk (continued)(h) Credit Risk (continued)Amounts Arising from ECLMeasurement of ECL - Explanation of Inputs, Assumptions and Estimation TechniquesThe key inputs into the measurement of ECL are the term structure of the following variables:· probability of default (PD);· loss given default (LGD); and· exposure at default (EAD).
These parameters are derived from internally developed statistical models as developed by GEH Group based on historical data. They are adjusted to reflect forward-looking information.
PD represents the likelihood of a borrower defaulting on its financial obligation, either over the next 12 months (12M PD), or over the remaining lifetime (Lifetime PD) of the obligation. PD estimates are based on rating models which use quantitative as well as qualitative input parameters and which are based on internal and external compiled data.
LGD is the magnitude of the likely loss if there is a default. LGD is expressed as a percentage per loss per unit of exposure at the time of default and represents the estimate of the economic loss in the event of the default of the counterparty. Drivers of LGD include the seniority of the claim, the availability and quality of collateral, legal enforceability processes in the jurisdiction and industry of borrower and existing market conditions. They are estimates at a certain date, which are calculated based on statistical rating models. These statistical models are based on internally compiled data comprising both quantitative and qualitative factors.
EAD represents the expected exposure in the event of a default. GEH Group derives the EAD from the current exposure to the counterparty, including amortisation schedules. The EAD of a financial asset is its gross carrying amount.
The ECL is determined by projecting PD, LGD and EAD for each individual exposure. These three components are multiplied together and adjusted for forward looking information. This is then discounted back to the reporting date. The discount rate used in the ECL calculation is the original effective interest rate or an approximation thereof.
Significant Increase in Credit RiskTo assess whether there is a significant increase in credit risk, GEH Group compares the risk of a default occurring on the asset as at reporting date with the risk of default as at the date of initial recognition. GEH Group considers available reasonable and supportive forwarding-looking information which includes the following indicators:– Internal credit rating;– External credit rating;– Actual or expected significant adverse changes in business, financial or economic conditions that are expected to cause a significant
change to the counterparty’s ability to meet its obligations.
A movement of an instrument’s credit rating along the rating scale will represent changes in credit risk, measured by the change in PD.
The criteria for assessing whether credit risk has increased significantly will be determined by both quantitative changes in 12M PDs and qualitative factors. The credit risk of a particular exposure is deemed to have increased significantly since initial recognition if, based on GEH Group’s quantitative model, the 12M PD is determined to have more than doubled since origination except where the counterparty remains within the investment grade rating. The criteria as described above would only apply if the financial instrument does not have an investment grade rating.
Using its expert credit judgement and, where possible, relevant historical experience, GEH Group may determine that an exposure has undergone a significant increase in credit risk based on particular qualitative indicators that it considers are indicative of such and whose effect may not otherwise be fully reflected in its quantitative analysis on a timely basis. GEH Group uses the watch-list as an additional trigger for the identification of significant increase in credit risk.
GEH Group considers “low credit risk” to be an investment grade credit rating using a combination of internal and external credit rating models.
257Financials
39. Risk Management (continued)39.4 Insurance-Related Risk Management (continued)Market and Credit Risk (continued)(h) Credit Risk (continued)Credit Risk GradesGEH Group assigns each exposure to a credit risk grade reflecting the PD of the counterparty and applying experienced credit judgement. Credit risk grades are established based on qualitative and quantitative factors that are indicative of risk of default. These factors vary depending on the nature of the exposure and the type of counterparty.
Credit risk grades are defined and calibrated such that the risk of default occurring increases as the credit risk deteriorates. Each exposure is allocated to a credit risk grade at initial recognition based on available information about the borrower. Exposures are subject to ongoing monitoring, which may result in an exposure being moved to a different credit risk grade. The monitoring typically involves the use of information obtained during periodic review, including published financial statements, external rating (where available), qualitative information about an obligor’s industry characteristics, competitive positioning, management, financial policy and financial flexibility.
Definition of DefaultGEH Group considers a financial asset to be in default by assessing the following criteria:
Quantitative CriteriaFor insurance receivables, the counterparty fails to make contractual payments within 12 months when they fall due, which are derived based on GEH Group’s historical information. For bonds and loans, the instrument is in overdue status and there are non-payments on another debt obligation of the same issuer to GEH Group.
Qualitative CriteriaThe counterparty is in bankruptcy or has indications of potentially significant financial difficulty such as lawsuits or similar actions that threaten the financial viability of the counterparty; distressed exchange, merger or amalgamation without assumption or breach of material loan covenants not rectified within a given timeframe, restructuring with expected principal haircut or a breach in material loan covenant that is not rectified within given timeframe.
The criteria above have been applied to all financial instruments held by GEH Group and are consistent with the definition of default used for credit risk management purposes. The default definition has been applied consistently to model the PD, EAD and LGD throughout GEH Group’s expected loss calculations.
Incorporating of Forward-Looking InformationGEH Group incorporates forward-looking information into both its assessment of whether the credit risk of an instrument has increased significantly since its initial recognition and its measurement of ECL. GEH Group has performed historical analysis and identified key economic variables impacting credit risk and expected credit losses for each portfolio.
These economic variables and their associated impact on the PD, EAD and LGD vary by financial instrument. Expert judgement has also been applied in this process. Forecasts of these economic variables (the base economic scenario) are obtained from publicly available economic databases published on a quarterly basis and provide the best estimate view of the economy over the next four to five years, after which, to project the economic variables for the full remaining lifetime of each instrument, a mean reversion approach is used. The impact of these economic variables on the PD, EAD and LGD has been determined by performing statistical regression analysis to understand the impact changes in these variables have had historically on default rates and the components of LGD and EAD.
In addition to the base economic scenario, GEH Group uses multiple scenarios to ensure non-linearities are captured. The number of scenarios and their attributes are reassessed at each reporting date. At 1 January 2018 and 31 December 2018, for all portfolios, GEH Group concluded that two scenarios appropriately captured non-linearities. The scenario weightings are determined by expert credit judgement, taking into account the range of possible outcomes the chosen scenario is representative of. The assessment of significant increase in credit risk is performed using the 12M PD under each of the base, and the other scenario, multiplied by the associated scenario weighting. This determines whether the whole financial instrument is in Stage 1, Stage 2 or Stage 3 and hence whether 12M or lifetime ECL should be recorded. Following this assessment, GEH Group measures ECL as either a probability weighted 12M ECL (Stage 1), or a probability weighted lifetime ECL (Stages 2 and 3). These probability-weighted ECLs are determined by running each scenario through the relevant ECL model and multiplying it by the appropriate scenario weighting (as opposed to weighting the inputs).
As with any economic forecasts, the projections and likelihoods of occurrence are subject to a high degree of inherent uncertainty and the actual outcomes may be significantly different from those projected. GEH Group considers these forecasts to represent its best estimate of the possible outcomes and has analysed the non-linearities and asymmetries within GEH Group’s different portfolios to establish that the chosen scenarios are appropriately representative of the range of possible scenarios.
The sensitivity of the ECL to the economic variable assumptions affecting the calculation of ECL was not material to GEH Group for the year ended 31 December 2018.
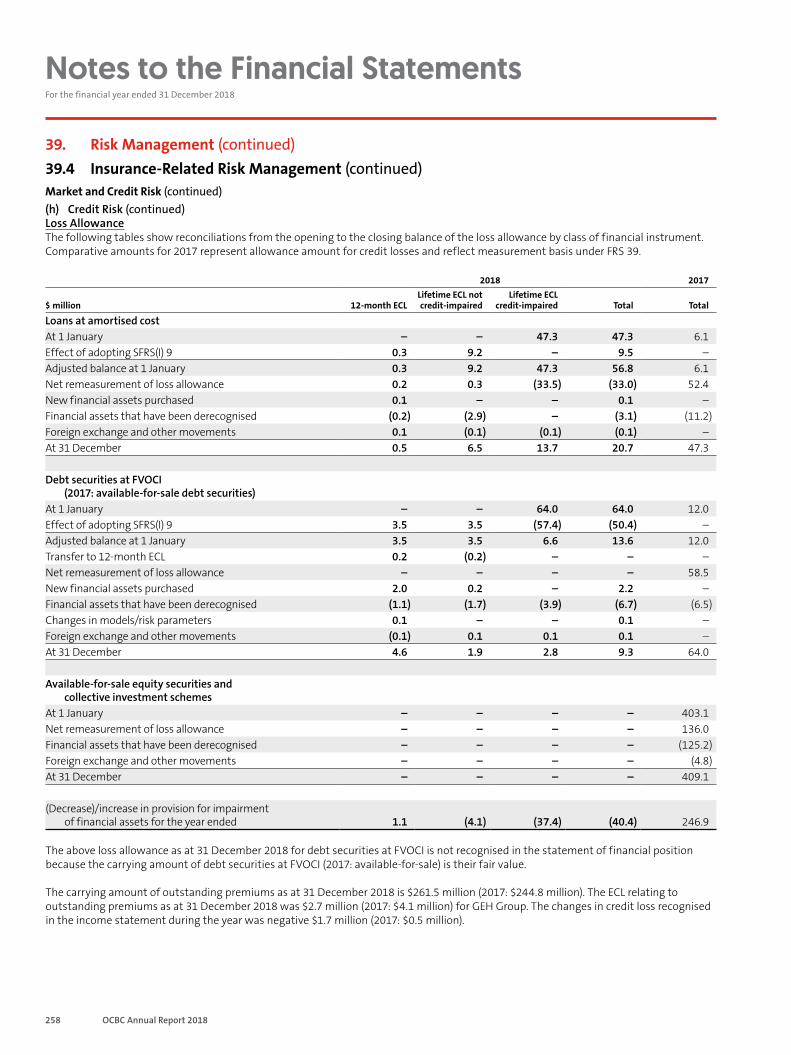
258 OCBC Annual Report 2018
Notes to the Financial Statements For the financial year ended 31 December 2018
39. Risk Management (continued)39.4 Insurance-Related Risk Management (continued)Market and Credit Risk (continued)(h) Credit Risk (continued)Loss AllowanceThe following tables show reconciliations from the opening to the closing balance of the loss allowance by class of financial instrument. Comparative amounts for 2017 represent allowance amount for credit losses and reflect measurement basis under FRS 39.
2018 2017
$ million 12-month ECLLifetime ECL not credit-impaired
Lifetime ECL credit-impaired Total Total
Loans at amortised costAt 1 January – – 47.3 47.3 6.1Effect of adopting SFRS(I) 9 0.3 9.2 – 9.5 –Adjusted balance at 1 January 0.3 9.2 47.3 56.8 6.1Net remeasurement of loss allowance 0.2 0.3 (33.5) (33.0) 52.4New financial assets purchased 0.1 – – 0.1 –Financial assets that have been derecognised (0.2) (2.9) – (3.1) (11.2)Foreign exchange and other movements 0.1 (0.1) (0.1) (0.1) –At 31 December 0.5 6.5 13.7 20.7 47.3
Debt securities at FVOCI (2017: available-for-sale debt securities)
At 1 January – – 64.0 64.0 12.0Effect of adopting SFRS(I) 9 3.5 3.5 (57.4) (50.4) –Adjusted balance at 1 January 3.5 3.5 6.6 13.6 12.0Transfer to 12-month ECL 0.2 (0.2) – – –Net remeasurement of loss allowance – – – – 58.5New financial assets purchased 2.0 0.2 – 2.2 –Financial assets that have been derecognised (1.1) (1.7) (3.9) (6.7) (6.5)Changes in models/risk parameters 0.1 – – 0.1 –Foreign exchange and other movements (0.1) 0.1 0.1 0.1 –At 31 December 4.6 1.9 2.8 9.3 64.0
Available-for-sale equity securities and collective investment schemes
At 1 January – – – – 403.1Net remeasurement of loss allowance – – – – 136.0Financial assets that have been derecognised – – – – (125.2)Foreign exchange and other movements – – – – (4.8)At 31 December – – – – 409.1
(Decrease)/increase in provision for impairment of financial assets for the year ended 1.1 (4.1) (37.4) (40.4) 246.9
The above loss allowance as at 31 December 2018 for debt securities at FVOCI is not recognised in the statement of financial position because the carrying amount of debt securities at FVOCI (2017: available-for-sale) is their fair value.
The carrying amount of outstanding premiums as at 31 December 2018 is $261.5 million (2017: $244.8 million). The ECL relating to outstanding premiums as at 31 December 2018 was $2.7 million (2017: $4.1 million) for GEH Group. The changes in credit loss recognised in the income statement during the year was negative $1.7 million (2017: $0.5 million).
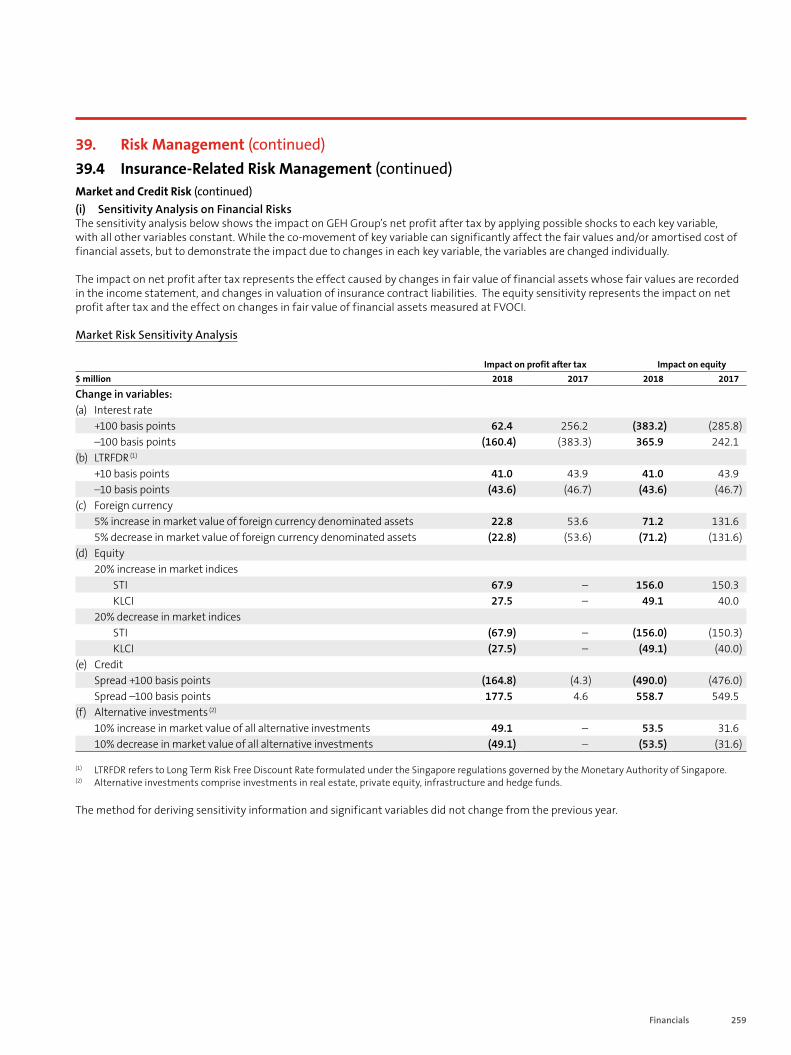
259Financials
39. Risk Management (continued)39.4 Insurance-Related Risk Management (continued)Market and Credit Risk (continued)(i) Sensitivity Analysis on Financial RisksThe sensitivity analysis below shows the impact on GEH Group’s net profit after tax by applying possible shocks to each key variable, with all other variables constant. While the co-movement of key variable can significantly affect the fair values and/or amortised cost of financial assets, but to demonstrate the impact due to changes in each key variable, the variables are changed individually.
The impact on net profit after tax represents the effect caused by changes in fair value of financial assets whose fair values are recorded in the income statement, and changes in valuation of insurance contract liabilities. The equity sensitivity represents the impact on net profit after tax and the effect on changes in fair value of financial assets measured at FVOCI.
Market Risk Sensitivity Analysis
Impact on profit after tax Impact on equity$ million 2018 2017 2018 2017
Change in variables:(a) Interest rate
+100 basis points 62.4 256.2 (383.2) (285.8)–100 basis points (160.4) (383.3) 365.9 242.1
(b) LTRFDR (1)
+10 basis points 41.0 43.9 41.0 43.9–10 basis points (43.6) (46.7) (43.6) (46.7)
(c) Foreign currency5% increase in market value of foreign currency denominated assets 22.8 53.6 71.2 131.65% decrease in market value of foreign currency denominated assets (22.8) (53.6) (71.2) (131.6)
(d) Equity 20% increase in market indices
STI 67.9 – 156.0 150.3KLCI 27.5 – 49.1 40.0
20% decrease in market indicesSTI (67.9) – (156.0) (150.3)KLCI (27.5) – (49.1) (40.0)
(e) Credit Spread +100 basis points (164.8) (4.3) (490.0) (476.0)Spread –100 basis points 177.5 4.6 558.7 549.5
(f) Alternative investments (2)
10% increase in market value of all alternative investments 49.1 – 53.5 31.610% decrease in market value of all alternative investments (49.1) – (53.5) (31.6)
(1) LTRFDR refers to Long Term Risk Free Discount Rate formulated under the Singapore regulations governed by the Monetary Authority of Singapore. (2) Alternative investments comprise investments in real estate, private equity, infrastructure and hedge funds.
The method for deriving sensitivity information and significant variables did not change from the previous year.
260 OCBC Annual Report 2018
Notes to the Financial Statements For the financial year ended 31 December 2018
39. Risk Management (continued)39.4 Insurance-Related Risk Management (continued)Market and Credit Risk (continued)(j) Concentration RiskAn important element of managing both market and credit risks is to actively manage concentration to specific issuers, counterparties, industry sectors, countries and currencies. Both internal and regulatory limits are put in place and monitored to manage concentration risk. These limits are reviewed on a regular basis by the respective management committees. GEH Group’s exposures are within the concentration limits set by the respective local regulators.
GEH Group actively manages its product mix to ensure that there is no significant concentration of credit risk.
Operational and Compliance RiskOperational risk is an event or action that may potentially impact partly or completely the achievement of the organisation’s objectives resulting from inadequate or failed internal processes and systems, human factors, or external events.
Compliance risk is any event or action that may potentially impact partly or completely the achievement of the organisation’s objectives, as a result of its failure to comply with applicable laws, regulations and standards. The applicable key compliance areas include:- laws, regulations and rules governing insurance business and regulated financial activities undertaken by GEH Group;- codes of practice promoted by industry associations; - anti-money laundering; and - countering of financing of terrorism.
The day-to-day management of operational and compliance risk is through the maintenance of comprehensive internal control frameworks, supported by an infrastructure of systems and procedures to monitor processes and transactions. GMC reviews operational and compliance issues on a GEH Group basis at its monthly meetings while local level issues are managed and monitored by the local SMTs. GEH Group Internal Audit team reviews the systems of internal controls to assess their ongoing relevance and effectiveness, and reports at least quarterly to GEH Audit Committee.
Technology RiskTechnology risk is defined as risk related to any potential adverse outcome, damage, loss, disruption, violation, or failure arising from the use of or reliance on computer hardware, software, electronic devices, and networks.
GEH Group adopts a risk based approach in managing technology risks relating to cyber-attacks, data loss/leakage, deficiency in change management, emerging technology, inadequate vendor management, inferior system acquisition and development, network security vulnerability, privilege access misuse, system security vulnerability, system unavailability and technology obsolescence. Key risk indicators related to technology risks are reported to GEH Group Board on a regular basis. Independent assessment is performed by GEH Group Internal Audit for its adequacy and effectiveness.
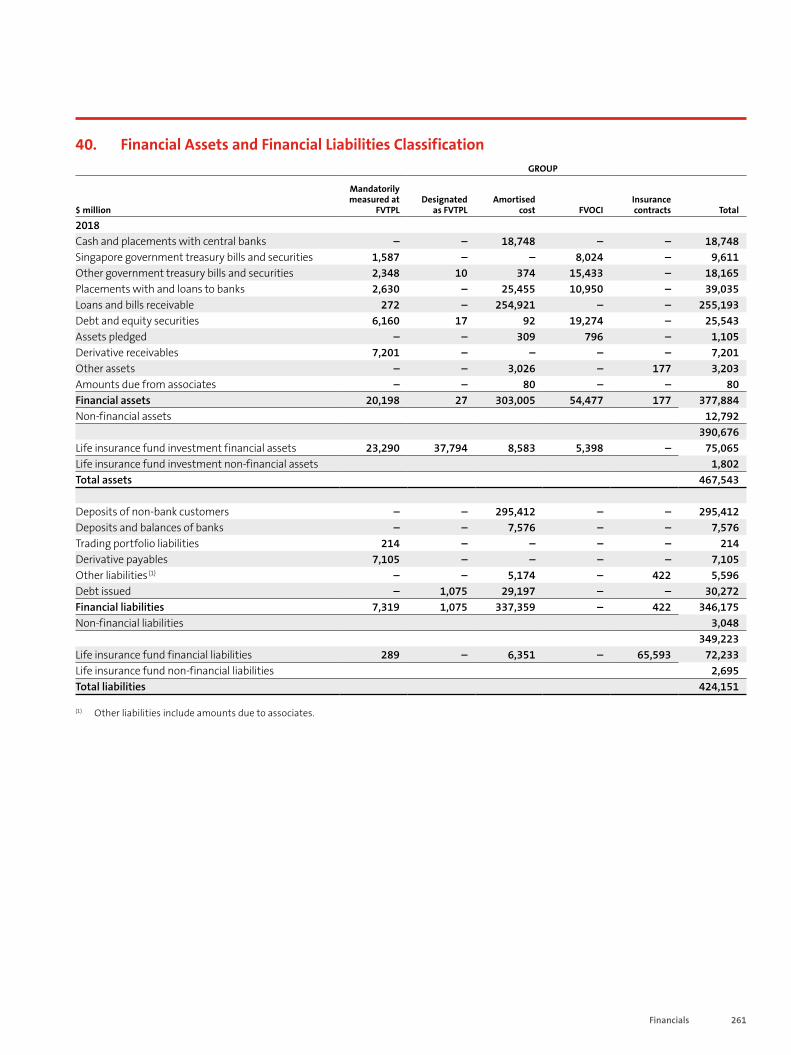
261Financials
40. Financial Assets and Financial Liabilities ClassificationGROUP
$ million
Mandatorily measured at
FVTPLDesignated
as FVTPLAmortised
cost FVOCIInsurance contracts Total
2018Cash and placements with central banks – – 18,748 – – 18,748Singapore government treasury bills and securities 1,587 – – 8,024 – 9,611Other government treasury bills and securities 2,348 10 374 15,433 – 18,165Placements with and loans to banks 2,630 – 25,455 10,950 – 39,035Loans and bills receivable 272 – 254,921 – – 255,193Debt and equity securities 6,160 17 92 19,274 – 25,543Assets pledged – – 309 796 – 1,105Derivative receivables 7,201 – – – – 7,201Other assets – – 3,026 – 177 3,203Amounts due from associates – – 80 – – 80Financial assets 20,198 27 303,005 54,477 177 377,884Non-financial assets 12,792
390,676Life insurance fund investment financial assets 23,290 37,794 8,583 5,398 – 75,065Life insurance fund investment non-financial assets 1,802Total assets 467,543
Deposits of non-bank customers – – 295,412 – – 295,412Deposits and balances of banks – – 7,576 – – 7,576Trading portfolio liabilities 214 – – – – 214Derivative payables 7,105 – – – – 7,105Other liabilities (1) – – 5,174 – 422 5,596Debt issued – 1,075 29,197 – – 30,272Financial liabilities 7,319 1,075 337,359 – 422 346,175Non-financial liabilities 3,048
349,223Life insurance fund financial liabilities 289 – 6,351 – 65,593 72,233Life insurance fund non-financial liabilities 2,695Total liabilities 424,151
(1) Other liabilities include amounts due to associates.
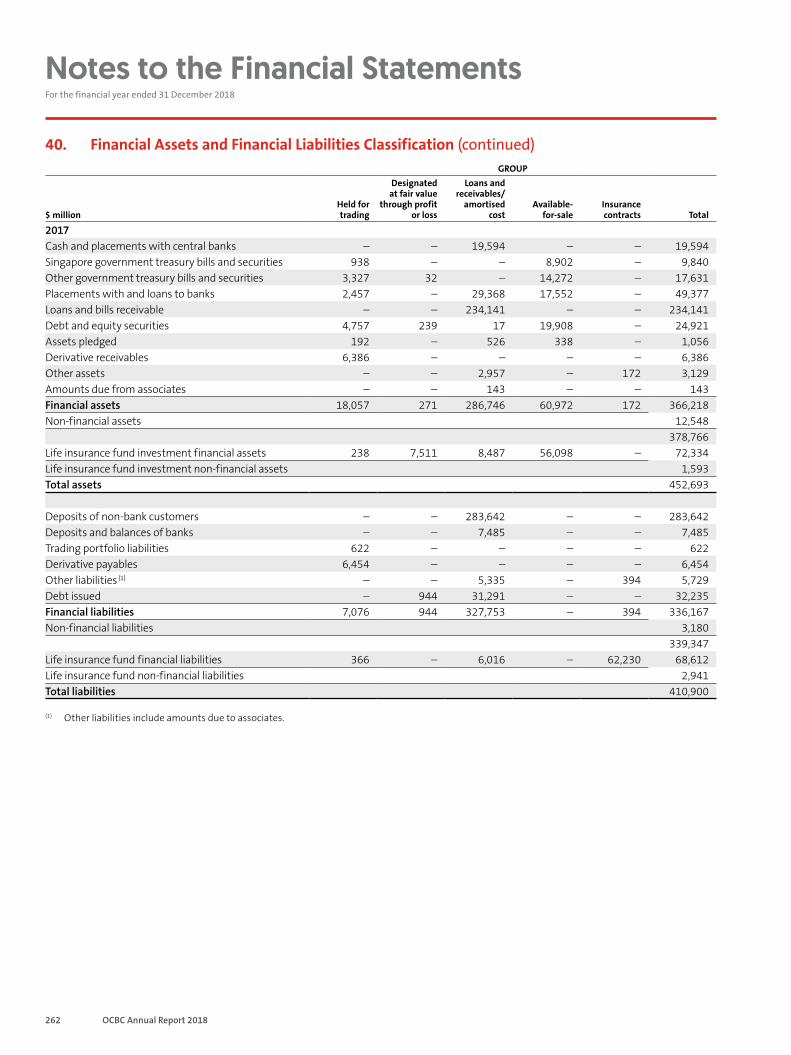
262 OCBC Annual Report 2018
Notes to the Financial Statements For the financial year ended 31 December 2018
40. Financial Assets and Financial Liabilities Classification (continued)GROUP
$ millionHeld for trading
Designated at fair value
through profit or loss
Loans and receivables/
amortised cost
Available- for-sale
Insurance contracts Total
2017Cash and placements with central banks – – 19,594 – – 19,594Singapore government treasury bills and securities 938 – – 8,902 – 9,840Other government treasury bills and securities 3,327 32 – 14,272 – 17,631Placements with and loans to banks 2,457 – 29,368 17,552 – 49,377Loans and bills receivable – – 234,141 – – 234,141Debt and equity securities 4,757 239 17 19,908 – 24,921Assets pledged 192 – 526 338 – 1,056Derivative receivables 6,386 – – – – 6,386Other assets – – 2,957 – 172 3,129Amounts due from associates – – 143 – – 143Financial assets 18,057 271 286,746 60,972 172 366,218Non-financial assets 12,548
378,766Life insurance fund investment financial assets 238 7,511 8,487 56,098 – 72,334Life insurance fund investment non-financial assets 1,593Total assets 452,693
Deposits of non-bank customers – – 283,642 – – 283,642Deposits and balances of banks – – 7,485 – – 7,485Trading portfolio liabilities 622 – – – – 622Derivative payables 6,454 – – – – 6,454Other liabilities (1) – – 5,335 – 394 5,729Debt issued – 944 31,291 – – 32,235Financial liabilities 7,076 944 327,753 – 394 336,167Non-financial liabilities 3,180
339,347Life insurance fund financial liabilities 366 – 6,016 – 62,230 68,612Life insurance fund non-financial liabilities 2,941Total liabilities 410,900
(1) Other liabilities include amounts due to associates.
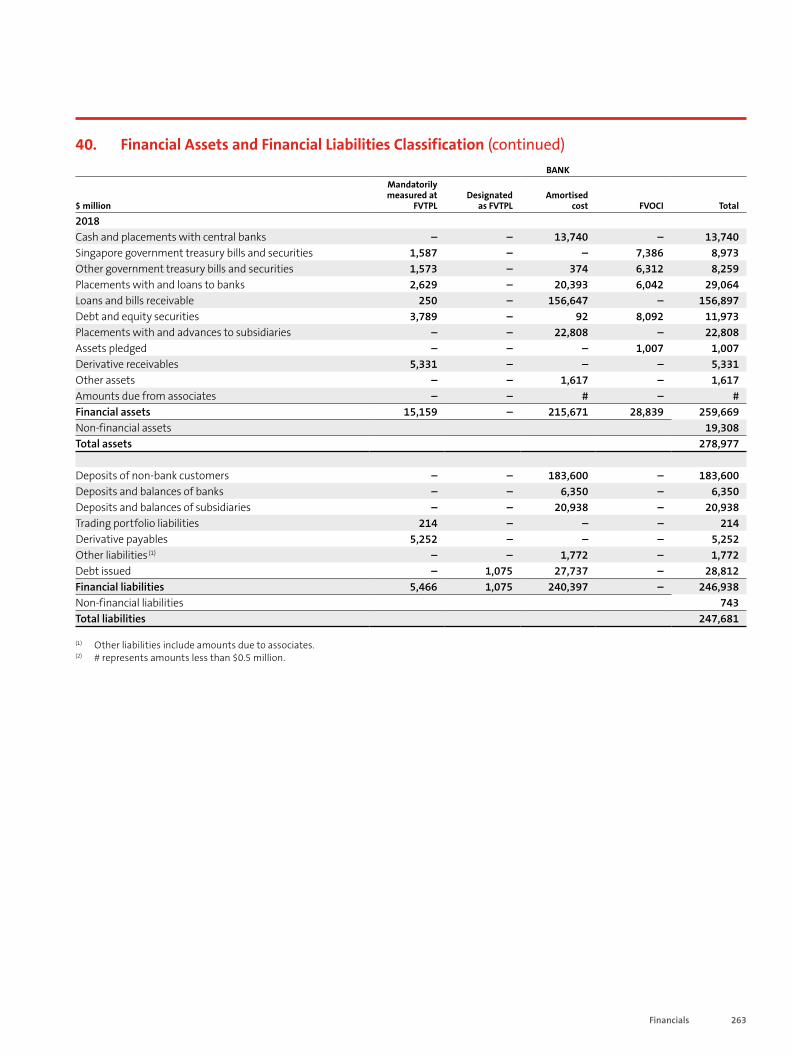
263Financials
40. Financial Assets and Financial Liabilities Classification (continued)BANK
$ million
Mandatorily measured at
FVTPLDesignated
as FVTPLAmortised
cost FVOCI Total
2018Cash and placements with central banks – – 13,740 – 13,740Singapore government treasury bills and securities 1,587 – – 7,386 8,973Other government treasury bills and securities 1,573 – 374 6,312 8,259Placements with and loans to banks 2,629 – 20,393 6,042 29,064Loans and bills receivable 250 – 156,647 – 156,897Debt and equity securities 3,789 – 92 8,092 11,973Placements with and advances to subsidiaries – – 22,808 – 22,808Assets pledged – – – 1,007 1,007Derivative receivables 5,331 – – – 5,331Other assets – – 1,617 – 1,617Amounts due from associates – – # – #Financial assets 15,159 – 215,671 28,839 259,669Non-financial assets 19,308Total assets 278,977
Deposits of non-bank customers – – 183,600 – 183,600Deposits and balances of banks – – 6,350 – 6,350Deposits and balances of subsidiaries – – 20,938 – 20,938Trading portfolio liabilities 214 – – – 214Derivative payables 5,252 – – – 5,252Other liabilities (1) – – 1,772 – 1,772Debt issued – 1,075 27,737 – 28,812Financial liabilities 5,466 1,075 240,397 – 246,938Non-financial liabilities 743Total liabilities 247,681
(1) Other liabilities include amounts due to associates. (2) # represents amounts less than $0.5 million.
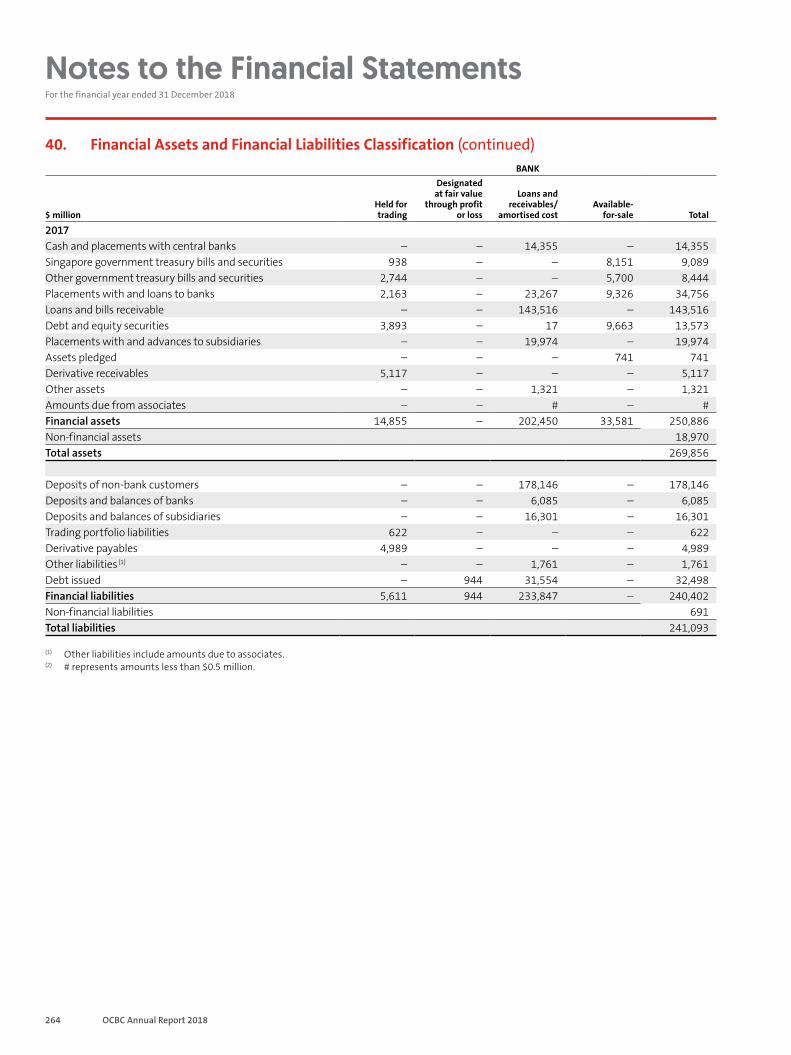
264 OCBC Annual Report 2018
Notes to the Financial Statements For the financial year ended 31 December 2018
40. Financial Assets and Financial Liabilities Classification (continued)BANK
$ millionHeld for trading
Designated at fair value
through profit or loss
Loans and receivables/
amortised costAvailable-
for-sale Total
2017Cash and placements with central banks – – 14,355 – 14,355Singapore government treasury bills and securities 938 – – 8,151 9,089Other government treasury bills and securities 2,744 – – 5,700 8,444Placements with and loans to banks 2,163 – 23,267 9,326 34,756Loans and bills receivable – – 143,516 – 143,516Debt and equity securities 3,893 – 17 9,663 13,573Placements with and advances to subsidiaries – – 19,974 – 19,974Assets pledged – – – 741 741Derivative receivables 5,117 – – – 5,117Other assets – – 1,321 – 1,321Amounts due from associates – – # – #Financial assets 14,855 – 202,450 33,581 250,886Non-financial assets 18,970Total assets 269,856
Deposits of non-bank customers – – 178,146 – 178,146Deposits and balances of banks – – 6,085 – 6,085Deposits and balances of subsidiaries – – 16,301 – 16,301Trading portfolio liabilities 622 – – – 622Derivative payables 4,989 – – – 4,989Other liabilities (1) – – 1,761 – 1,761Debt issued – 944 31,554 – 32,498Financial liabilities 5,611 944 233,847 – 240,402Non-financial liabilities 691Total liabilities 241,093
(1) Other liabilities include amounts due to associates. (2) # represents amounts less than $0.5 million.
265Financials
41. Fair Values of Financial Instruments41.1 Valuation Governance FrameworkThe Group has an established governance framework with respect to the measurement of fair values, which includes formalised processes for the review and validation of fair values independent of the businesses entering into the transactions.
The Market Risk Management (MRM) function within the Group Risk Management Division is responsible for market data validation, initial model validation and ongoing performance monitoring.
The Treasury Financial Control and Advisory – Valuation Control function within the Group Finance Division is responsible for the establishment of the overall valuation control framework. This includes, but is not limited to, reviewing and recommending appropriate valuation methodologies and adjustments, independent price testing, and identifying valuation gaps.
Valuation policies are reviewed annually by the MRM function. Any material changes to the framework require the approval of the CEO and concurrence from the BRMC. Group’s internal audit provides independent assurance on the respective divisions’ compliance with the policy.
41.2 Fair ValuesFinancial instruments comprise financial assets, financial liabilities and off-balance sheet financial instruments. The fair value of a financial instrument is the price that would be received to sell an asset or paid to transfer a liability in an orderly transaction between market participants. For financial assets and liabilities not carried at fair value on the financial statements, the Group has determined that their fair values were not materially different from the carrying amounts at the reporting date. The carrying amounts and fair values of financial instruments of the Group are described below.
Financial Assets Fair values of cash and balances with central banks, placements with banks, interest and other short term receivables are expected to approximate their carrying amounts due to their short tenor or frequent re-pricing.
Securities held by the Group, comprising government securities and debt and equity securities are substantially carried at fair value on the balance sheet.
Non-bank customer loans are mainly carried at amortised cost on the balance sheet, net of allowances for impaired and non-impaired loans. The Group deems that the carrying amounts of non-bank loans approximate their fair values as substantially all the loans are subject to frequent re-pricing.
Financial Liabilities Fair value of certain financial liabilities, which include mainly customer deposits with no stated maturity, interbank borrowings and borrowings under repurchase agreements, are expected to approximate their carrying amounts due to their short tenor. For non-bank customer term deposits, contractual or derived cash flows are discounted at market rates as at reporting date to estimate the fair values, which approximate the carrying amounts.
The fair values of the Group’s subordinated term notes and covered bonds are determined based on quoted market prices and independent broker offer prices. For other debts issued which are usually short term, the fair values approximate the carrying amounts.
41.3 Fair Value HierarchyThe Group determines the fair values of its financial assets and liabilities using various measurements. The different levels of fair value measurements are as follows:· Level 1 – quoted prices (unadjusted) in active markets for identical assets or liabilities;· Level 2 – inputs other than quoted prices included within Level 1 that are observable market data either directly (i.e. as prices) or
indirectly (i.e. derived from observable market data). The valuation techniques that use market parameters as inputs include, but are not limited to, yield curves, volatilities and foreign exchange rates; and
· Level 3 – inputs for the valuation that are not based on observable market data.
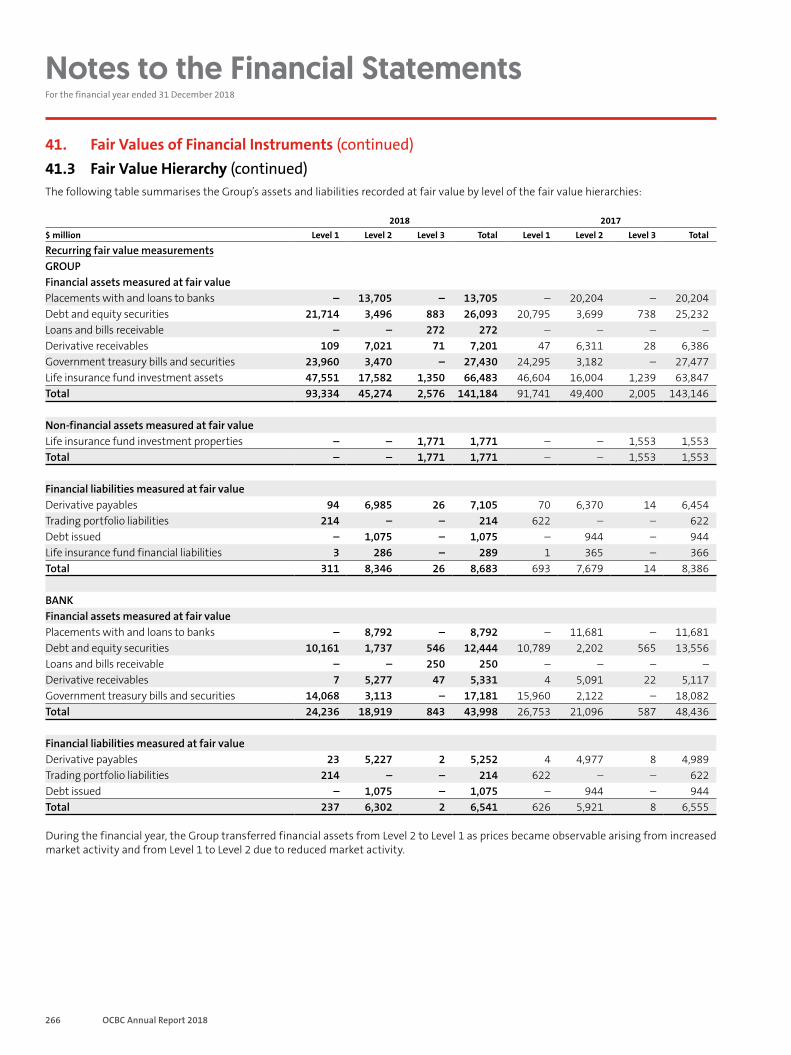
266 OCBC Annual Report 2018
Notes to the Financial Statements For the financial year ended 31 December 2018
41. Fair Values of Financial Instruments (continued)41.3 Fair Value Hierarchy (continued)The following table summarises the Group’s assets and liabilities recorded at fair value by level of the fair value hierarchies:
2018 2017$ million Level 1 Level 2 Level 3 Total Level 1 Level 2 Level 3 Total
Recurring fair value measurementsGROUPFinancial assets measured at fair valuePlacements with and loans to banks – 13,705 – 13,705 – 20,204 – 20,204Debt and equity securities 21,714 3,496 883 26,093 20,795 3,699 738 25,232Loans and bills receivable – – 272 272 – – – –Derivative receivables 109 7,021 71 7,201 47 6,311 28 6,386Government treasury bills and securities 23,960 3,470 – 27,430 24,295 3,182 – 27,477Life insurance fund investment assets 47,551 17,582 1,350 66,483 46,604 16,004 1,239 63,847Total 93,334 45,274 2,576 141,184 91,741 49,400 2,005 143,146
Non-financial assets measured at fair valueLife insurance fund investment properties – – 1,771 1,771 – – 1,553 1,553Total – – 1,771 1,771 – – 1,553 1,553
Financial liabilities measured at fair valueDerivative payables 94 6,985 26 7,105 70 6,370 14 6,454Trading portfolio liabilities 214 – – 214 622 – – 622Debt issued – 1,075 – 1,075 – 944 – 944Life insurance fund financial liabilities 3 286 – 289 1 365 – 366Total 311 8,346 26 8,683 693 7,679 14 8,386
BANKFinancial assets measured at fair valuePlacements with and loans to banks – 8,792 – 8,792 – 11,681 – 11,681Debt and equity securities 10,161 1,737 546 12,444 10,789 2,202 565 13,556Loans and bills receivable – – 250 250 – – – –Derivative receivables 7 5,277 47 5,331 4 5,091 22 5,117Government treasury bills and securities 14,068 3,113 – 17,181 15,960 2,122 – 18,082Total 24,236 18,919 843 43,998 26,753 21,096 587 48,436
Financial liabilities measured at fair valueDerivative payables 23 5,227 2 5,252 4 4,977 8 4,989Trading portfolio liabilities 214 – – 214 622 – – 622Debt issued – 1,075 – 1,075 – 944 – 944Total 237 6,302 2 6,541 626 5,921 8 6,555
During the financial year, the Group transferred financial assets from Level 2 to Level 1 as prices became observable arising from increased market activity and from Level 1 to Level 2 due to reduced market activity.

267Financials
41. Fair Values of Financial Instruments (continued)41.3 Fair Value Hierarchy (continued)Valuation Techniques and Unobservable Inputs for Level 3 Instruments
GROUP$ million
Fair value at 31 December 2018 Classification Valuation techniques Unobservable inputs
Financial assetsDebt securities 71 FVTPL Discounted cash flows Credit spreadsEquity securities 812 FVTPL/FVOCI Net asset value/
MultiplesValue of net asset/
Earnings and multiplesLoans and bills receivable 272 FVTPL Discounted cash flows Credit spreadsDerivative receivables 71 FVTPL Option pricing model/
CDS modelStandard deviation/
Credit spreadsLife insurance fund investment assets 1,350 FVTPL/FVOCI Net asset value Value of net assetTotal 2,576
Financial liabilitiesDerivative payables 26 FVTPL Option pricing model/
CDS modelStandard deviation/
Credit spreadsTotal 26
Management considers that any reasonably possible changes to the unobservable inputs will not result in a significant financial impact.
Movements in Level 3 Financial Assets and Liabilities
2018
GROUP $ million
Debt and equity
securities
Loans and bills
receivableDerivative
receivables
Life insurance fund
investment assets Total
Financial assets measured at fair valueAt 1 January 738 – 28 1,239 2,005Effect of adopting SFRS(I) 9 – 259 – – 259Adjusted balance at 1 January 738 259 28 1,239 2,264Purchases 156 113 3 281 553Settlements/disposals (155) (118) (#) (221) (494)Transfers in to Level 3 (1) 15 18 – 4 37Gains/(losses) recognised in– profit or loss 42 (1) 41 21 103– other comprehensive income 87 1 (1) 26 113At 31 December 883 272 71 1,350 2,576
Unrealised gains/(losses) included in profit or loss for assets held at the end of the period 34 (1) 79 82 194
(1) Relates to transfers from amortised cost to Level 3 due to use of inputs not based on market observable data.(2) # represents amounts less than $0.5 million.
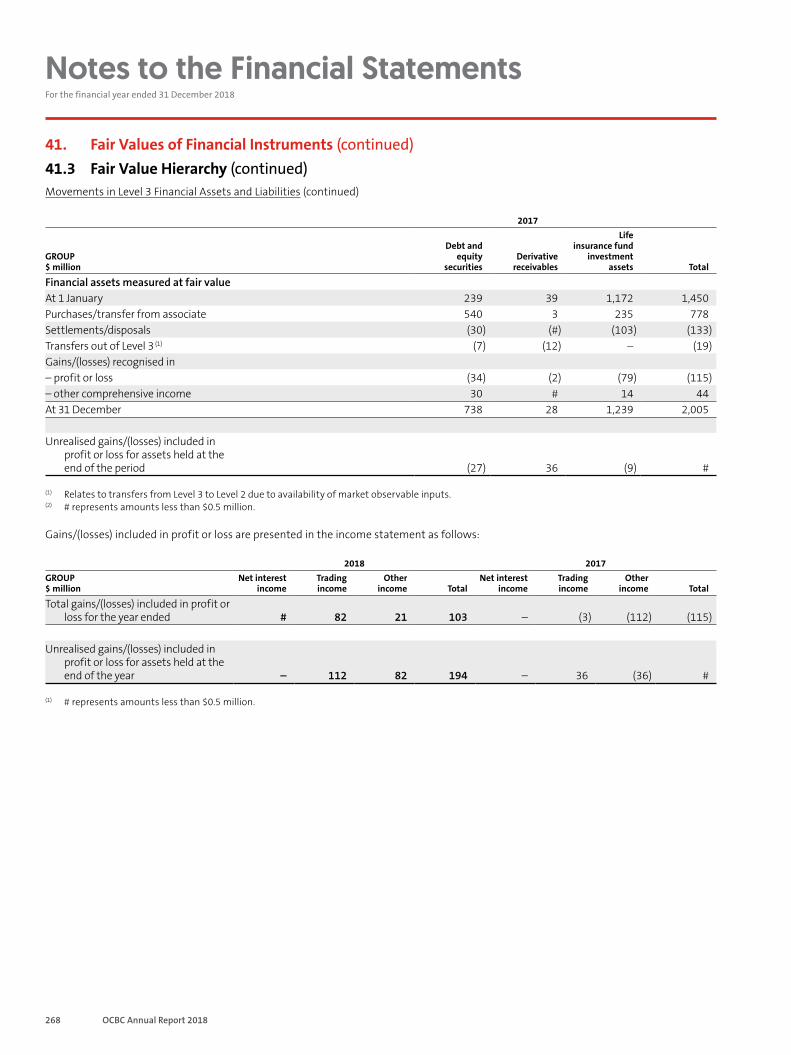
268 OCBC Annual Report 2018
Notes to the Financial Statements For the financial year ended 31 December 2018
41. Fair Values of Financial Instruments (continued)41.3 Fair Value Hierarchy (continued)Movements in Level 3 Financial Assets and Liabilities (continued)
2017
GROUP $ million
Debt and equity
securitiesDerivative
receivables
Life insurance fund
investment assets Total
Financial assets measured at fair valueAt 1 January 239 39 1,172 1,450Purchases/transfer from associate 540 3 235 778Settlements/disposals (30) (#) (103) (133)Transfers out of Level 3 (1) (7) (12) – (19)Gains/(losses) recognised in– profit or loss (34) (2) (79) (115)– other comprehensive income 30 # 14 44At 31 December 738 28 1,239 2,005
Unrealised gains/(losses) included in profit or loss for assets held at the end of the period (27) 36 (9) #
(1) Relates to transfers from Level 3 to Level 2 due to availability of market observable inputs.(2) # represents amounts less than $0.5 million.
Gains/(losses) included in profit or loss are presented in the income statement as follows:
2018 2017GROUP $ million
Net interest income
Trading income
Other income Total
Net interest income
Trading income
Other income Total
Total gains/(losses) included in profit or loss for the year ended # 82 21 103 – (3) (112) (115)
Unrealised gains/(losses) included in profit or loss for assets held at the end of the year – 112 82 194 – 36 (36) #
(1) # represents amounts less than $0.5 million.
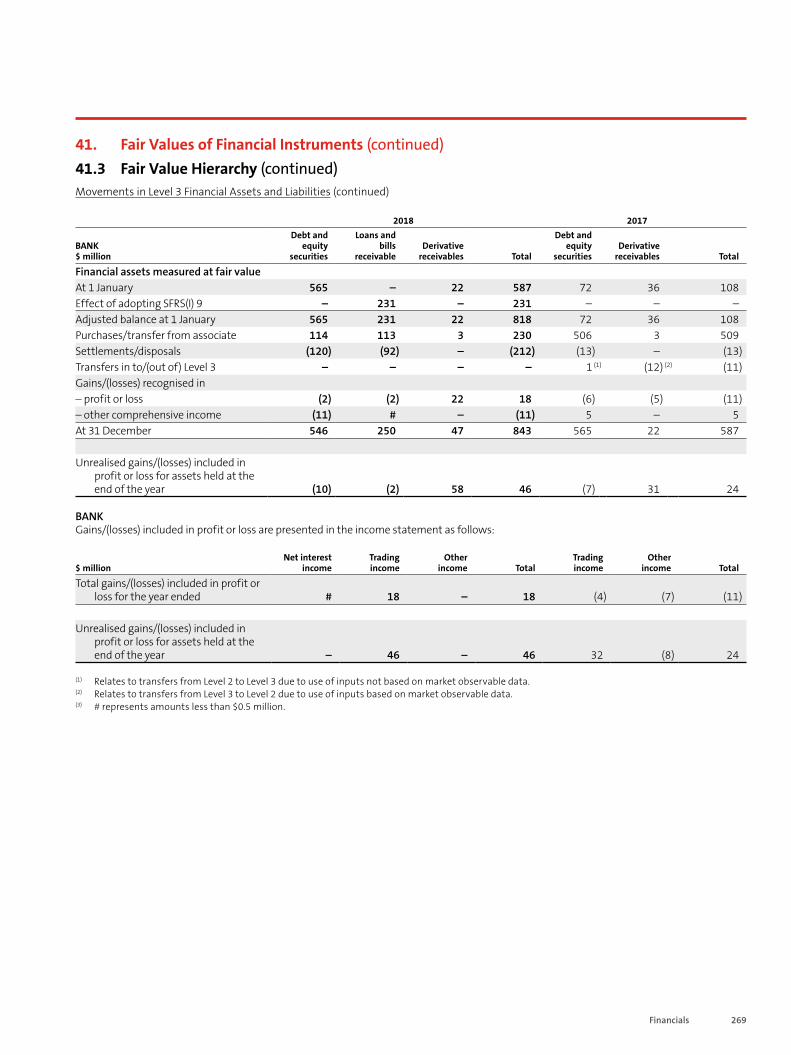
269Financials
41. Fair Values of Financial Instruments (continued)41.3 Fair Value Hierarchy (continued)Movements in Level 3 Financial Assets and Liabilities (continued)
2018 2017
BANK $ million
Debt and equity
securities
Loans and bills
receivableDerivative
receivables Total
Debt and equity
securitiesDerivative
receivables Total
Financial assets measured at fair valueAt 1 January 565 – 22 587 72 36 108Effect of adopting SFRS(I) 9 – 231 – 231 – – –Adjusted balance at 1 January 565 231 22 818 72 36 108Purchases/transfer from associate 114 113 3 230 506 3 509Settlements/disposals (120) (92) – (212) (13) – (13)Transfers in to/(out of) Level 3 – – – – 1 (1) (12) (2) (11)Gains/(losses) recognised in– profit or loss (2) (2) 22 18 (6) (5) (11)– other comprehensive income (11) # – (11) 5 – 5At 31 December 546 250 47 843 565 22 587
Unrealised gains/(losses) included in profit or loss for assets held at the end of the year (10) (2) 58 46 (7) 31 24
BANKGains/(losses) included in profit or loss are presented in the income statement as follows:
$ millionNet interest
incomeTrading income
Other income Total
Trading income
Other income Total
Total gains/(losses) included in profit or loss for the year ended # 18 – 18 (4) (7) (11)
Unrealised gains/(losses) included in profit or loss for assets held at the end of the year – 46 – 46 32 (8) 24
(1) Relates to transfers from Level 2 to Level 3 due to use of inputs not based on market observable data.(2) Relates to transfers from Level 3 to Level 2 due to use of inputs based on market observable data.(3) # represents amounts less than $0.5 million.
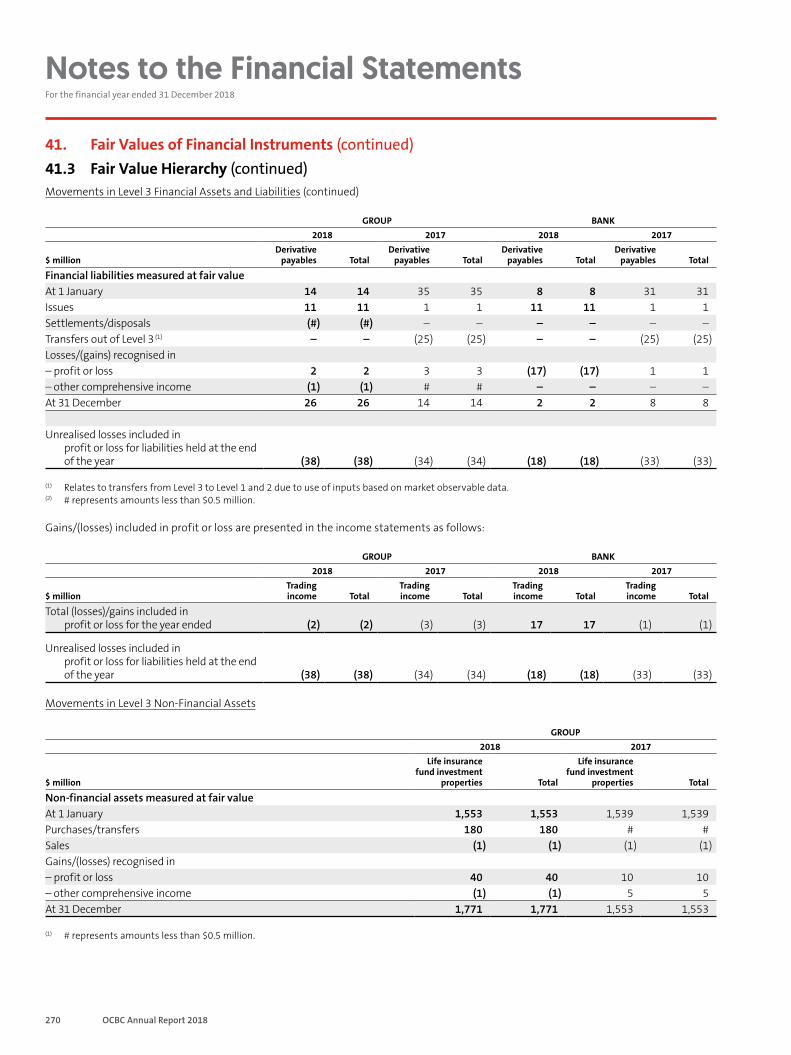
270 OCBC Annual Report 2018
Notes to the Financial Statements For the financial year ended 31 December 2018
41. Fair Values of Financial Instruments (continued)41.3 Fair Value Hierarchy (continued)Movements in Level 3 Financial Assets and Liabilities (continued)
GROUP BANK2018 2017 2018 2017
$ millionDerivative
payables TotalDerivative
payables TotalDerivative
payables TotalDerivative
payables Total
Financial liabilities measured at fair valueAt 1 January 14 14 35 35 8 8 31 31Issues 11 11 1 1 11 11 1 1Settlements/disposals (#) (#) – – – – – –Transfers out of Level 3 (1) – – (25) (25) – – (25) (25)Losses/(gains) recognised in– profit or loss 2 2 3 3 (17) (17) 1 1– other comprehensive income (1) (1) # # – – – –At 31 December 26 26 14 14 2 2 8 8
Unrealised losses included in profit or loss for liabilities held at the end of the year (38) (38) (34) (34) (18) (18) (33) (33)
(1) Relates to transfers from Level 3 to Level 1 and 2 due to use of inputs based on market observable data. (2) # represents amounts less than $0.5 million.
Gains/(losses) included in profit or loss are presented in the income statements as follows:
GROUP BANK2018 2017 2018 2017
$ millionTrading income Total
Trading income Total
Trading income Total
Trading income Total
Total (losses)/gains included in profit or loss for the year ended (2) (2) (3) (3) 17 17 (1) (1)
Unrealised losses included in profit or loss for liabilities held at the end of the year (38) (38) (34) (34) (18) (18) (33) (33)
Movements in Level 3 Non-Financial Assets
GROUP2018 2017
$ million
Life insurance fund investment
properties Total
Life insurance fund investment
properties Total
Non-financial assets measured at fair valueAt 1 January 1,553 1,553 1,539 1,539Purchases/transfers 180 180 # #Sales (1) (1) (1) (1)Gains/(losses) recognised in– profit or loss 40 40 10 10– other comprehensive income (1) (1) 5 5At 31 December 1,771 1,771 1,553 1,553
(1) # represents amounts less than $0.5 million.
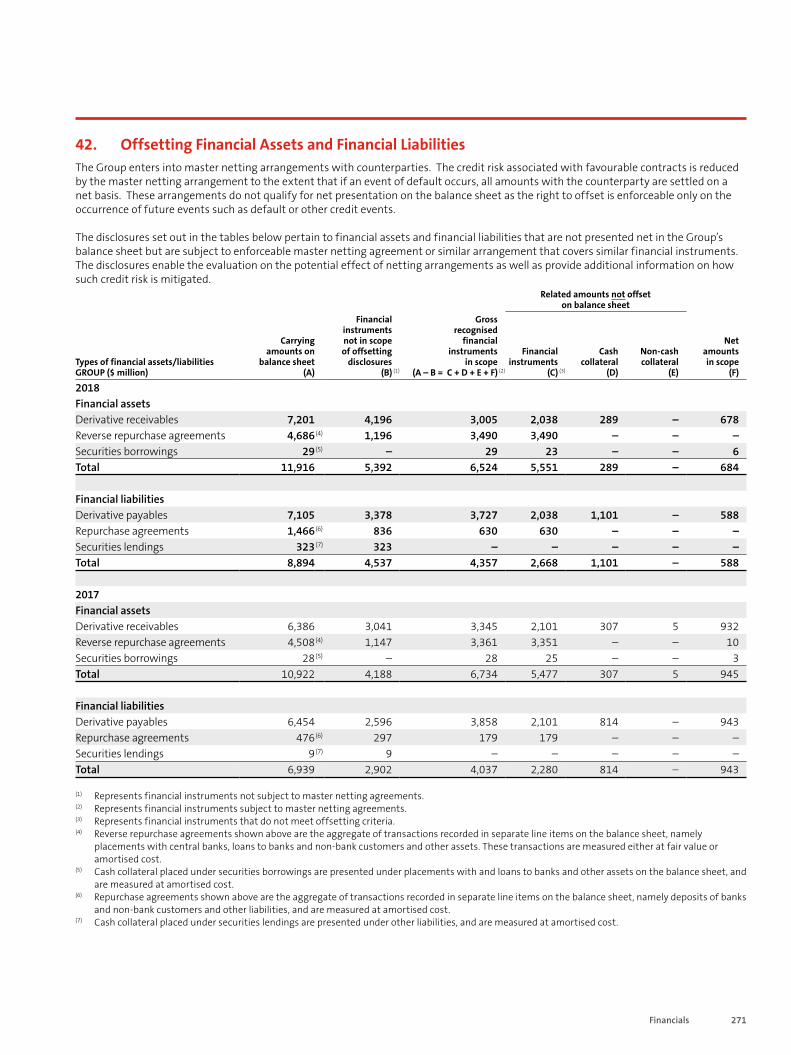
271Financials
42. Offsetting Financial Assets and Financial LiabilitiesThe Group enters into master netting arrangements with counterparties. The credit risk associated with favourable contracts is reduced by the master netting arrangement to the extent that if an event of default occurs, all amounts with the counterparty are settled on a net basis. These arrangements do not qualify for net presentation on the balance sheet as the right to offset is enforceable only on the occurrence of future events such as default or other credit events.
The disclosures set out in the tables below pertain to financial assets and financial liabilities that are not presented net in the Group’s balance sheet but are subject to enforceable master netting agreement or similar arrangement that covers similar financial instruments. The disclosures enable the evaluation on the potential effect of netting arrangements as well as provide additional information on how such credit risk is mitigated.
Related amounts not offset on balance sheet
Types of financial assets/liabilitiesGROUP ($ million)
Carrying amounts on
balance sheet(A)
Financial instruments not in scope of offsetting
disclosures(B) (1)
Gross recognised
financial instruments
in scope(A – B = C + D + E + F) (2)
Financial instruments
(C) (3)
Cash collateral
(D)
Non-cash collateral
(E)
Net amounts in scope
(F)
2018Financial assetsDerivative receivables 7,201 4,196 3,005 2,038 289 – 678Reverse repurchase agreements 4,686 (4) 1,196 3,490 3,490 – – –Securities borrowings 29 (5) – 29 23 – – 6Total 11,916 5,392 6,524 5,551 289 – 684
Financial liabilitiesDerivative payables 7,105 3,378 3,727 2,038 1,101 – 588Repurchase agreements 1,466 (6) 836 630 630 – – –Securities lendings 323 (7) 323 – – – – –Total 8,894 4,537 4,357 2,668 1,101 – 588
2017Financial assetsDerivative receivables 6,386 3,041 3,345 2,101 307 5 932Reverse repurchase agreements 4,508(4) 1,147 3,361 3,351 – – 10Securities borrowings 28(5) – 28 25 – – 3Total 10,922 4,188 6,734 5,477 307 5 945
Financial liabilitiesDerivative payables 6,454 2,596 3,858 2,101 814 – 943Repurchase agreements 476(6) 297 179 179 – – –Securities lendings 9(7) 9 – – – – –Total 6,939 2,902 4,037 2,280 814 – 943
(1) Represents financial instruments not subject to master netting agreements.(2) Represents financial instruments subject to master netting agreements.(3) Represents financial instruments that do not meet offsetting criteria.(4) Reverse repurchase agreements shown above are the aggregate of transactions recorded in separate line items on the balance sheet, namely
placements with central banks, loans to banks and non-bank customers and other assets. These transactions are measured either at fair value or amortised cost.
(5) Cash collateral placed under securities borrowings are presented under placements with and loans to banks and other assets on the balance sheet, and are measured at amortised cost.
(6) Repurchase agreements shown above are the aggregate of transactions recorded in separate line items on the balance sheet, namely deposits of banks and non-bank customers and other liabilities, and are measured at amortised cost.
(7) Cash collateral placed under securities lendings are presented under other liabilities, and are measured at amortised cost.
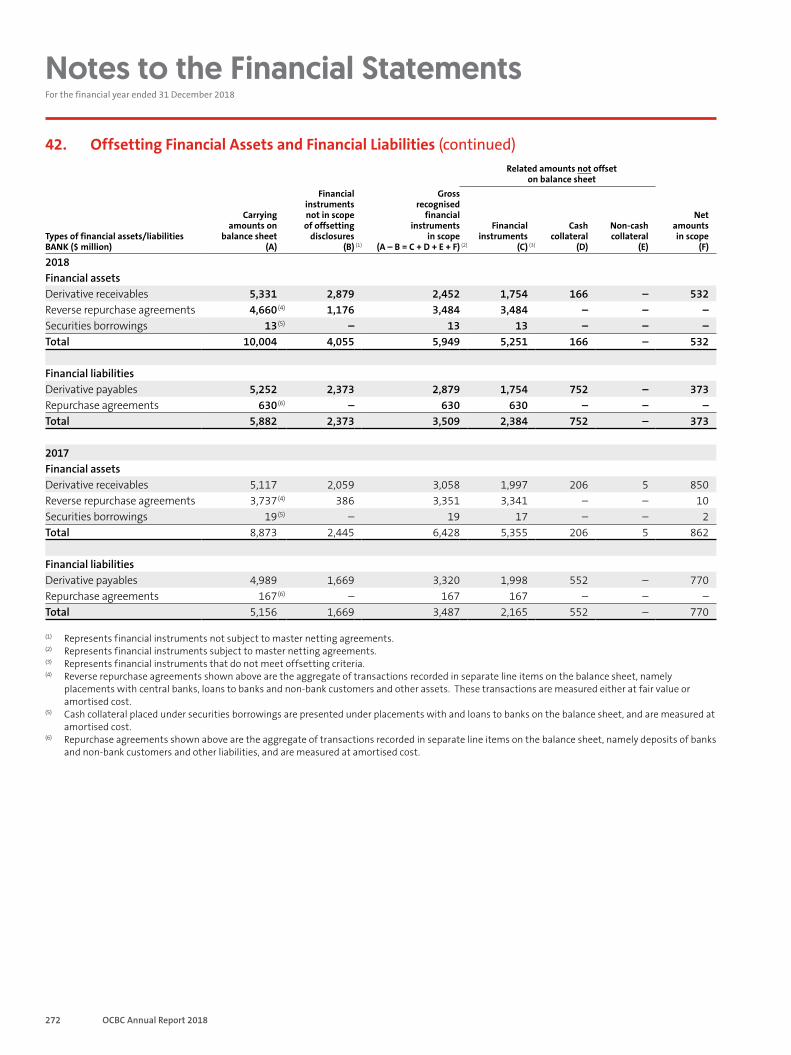
272 OCBC Annual Report 2018
Notes to the Financial Statements For the financial year ended 31 December 2018
42. Offsetting Financial Assets and Financial Liabilities (continued)Related amounts not offset
on balance sheet
Types of financial assets/liabilitiesBANK ($ million)
Carrying amounts on
balance sheet(A)
Financial instruments not in scope of offsetting
disclosures(B) (1)
Gross recognised
financial instruments
in scope(A – B = C + D + E + F) (2)
Financial instruments
(C) (3)
Cash collateral
(D)
Non-cash collateral
(E)
Net amounts in scope
(F)
2018Financial assetsDerivative receivables 5,331 2,879 2,452 1,754 166 – 532Reverse repurchase agreements 4,660 (4) 1,176 3,484 3,484 – – –Securities borrowings 13 (5) – 13 13 – – –Total 10,004 4,055 5,949 5,251 166 – 532
Financial liabilitiesDerivative payables 5,252 2,373 2,879 1,754 752 – 373Repurchase agreements 630 (6) – 630 630 – – –Total 5,882 2,373 3,509 2,384 752 – 373
2017Financial assetsDerivative receivables 5,117 2,059 3,058 1,997 206 5 850Reverse repurchase agreements 3,737(4) 386 3,351 3,341 – – 10Securities borrowings 19(5) – 19 17 – – 2Total 8,873 2,445 6,428 5,355 206 5 862
Financial liabilitiesDerivative payables 4,989 1,669 3,320 1,998 552 – 770Repurchase agreements 167(6) – 167 167 – – –Total 5,156 1,669 3,487 2,165 552 – 770
(1) Represents financial instruments not subject to master netting agreements.(2) Represents financial instruments subject to master netting agreements.(3) Represents financial instruments that do not meet offsetting criteria.(4) Reverse repurchase agreements shown above are the aggregate of transactions recorded in separate line items on the balance sheet, namely
placements with central banks, loans to banks and non-bank customers and other assets. These transactions are measured either at fair value or amortised cost.
(5) Cash collateral placed under securities borrowings are presented under placements with and loans to banks on the balance sheet, and are measured at amortised cost.
(6) Repurchase agreements shown above are the aggregate of transactions recorded in separate line items on the balance sheet, namely deposits of banks and non-bank customers and other liabilities, and are measured at amortised cost.
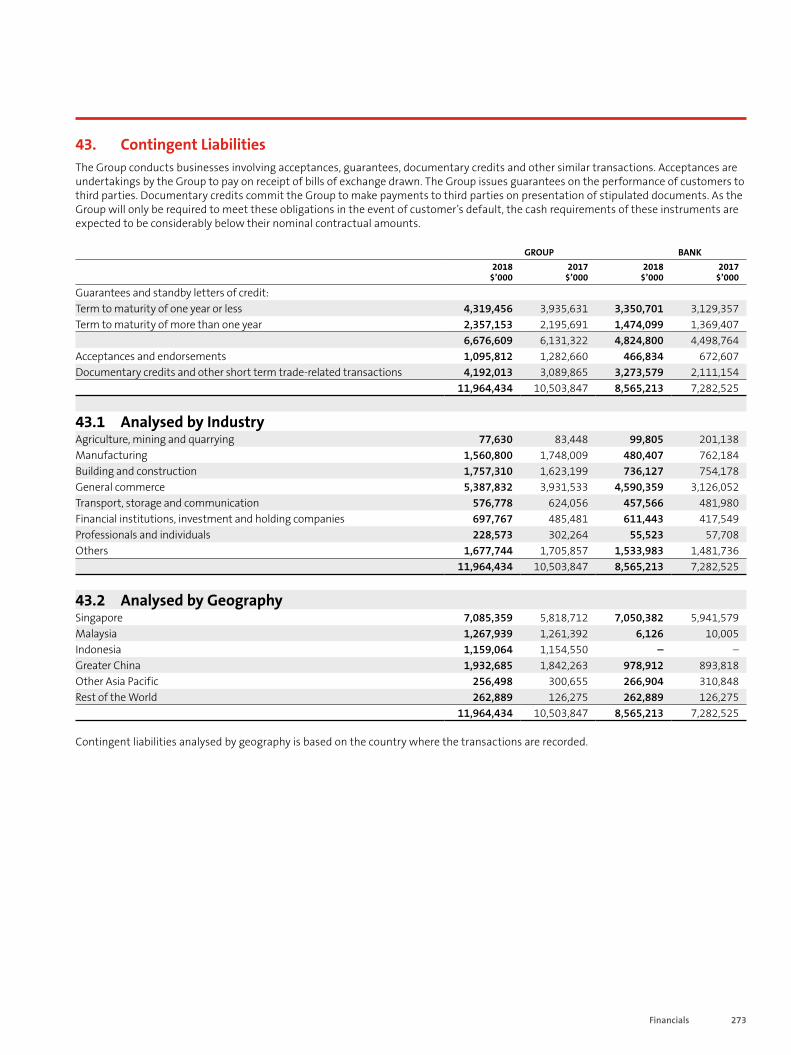
273Financials
43. Contingent LiabilitiesThe Group conducts businesses involving acceptances, guarantees, documentary credits and other similar transactions. Acceptances are undertakings by the Group to pay on receipt of bills of exchange drawn. The Group issues guarantees on the performance of customers to third parties. Documentary credits commit the Group to make payments to third parties on presentation of stipulated documents. As the Group will only be required to meet these obligations in the event of customer’s default, the cash requirements of these instruments are expected to be considerably below their nominal contractual amounts.
GROUP BANK2018
$’0002017
$’0002018
$’0002017
$’000
Guarantees and standby letters of credit:Term to maturity of one year or less 4,319,456 3,935,631 3,350,701 3,129,357Term to maturity of more than one year 2,357,153 2,195,691 1,474,099 1,369,407
6,676,609 6,131,322 4,824,800 4,498,764Acceptances and endorsements 1,095,812 1,282,660 466,834 672,607Documentary credits and other short term trade-related transactions 4,192,013 3,089,865 3,273,579 2,111,154
11,964,434 10,503,847 8,565,213 7,282,525
43.1 Analysed by IndustryAgriculture, mining and quarrying 77,630 83,448 99,805 201,138Manufacturing 1,560,800 1,748,009 480,407 762,184Building and construction 1,757,310 1,623,199 736,127 754,178General commerce 5,387,832 3,931,533 4,590,359 3,126,052Transport, storage and communication 576,778 624,056 457,566 481,980Financial institutions, investment and holding companies 697,767 485,481 611,443 417,549Professionals and individuals 228,573 302,264 55,523 57,708Others 1,677,744 1,705,857 1,533,983 1,481,736
11,964,434 10,503,847 8,565,213 7,282,525
43.2 Analysed by GeographySingapore 7,085,359 5,818,712 7,050,382 5,941,579Malaysia 1,267,939 1,261,392 6,126 10,005Indonesia 1,159,064 1,154,550 – –Greater China 1,932,685 1,842,263 978,912 893,818Other Asia Pacific 256,498 300,655 266,904 310,848Rest of the World 262,889 126,275 262,889 126,275
11,964,434 10,503,847 8,565,213 7,282,525
Contingent liabilities analysed by geography is based on the country where the transactions are recorded.
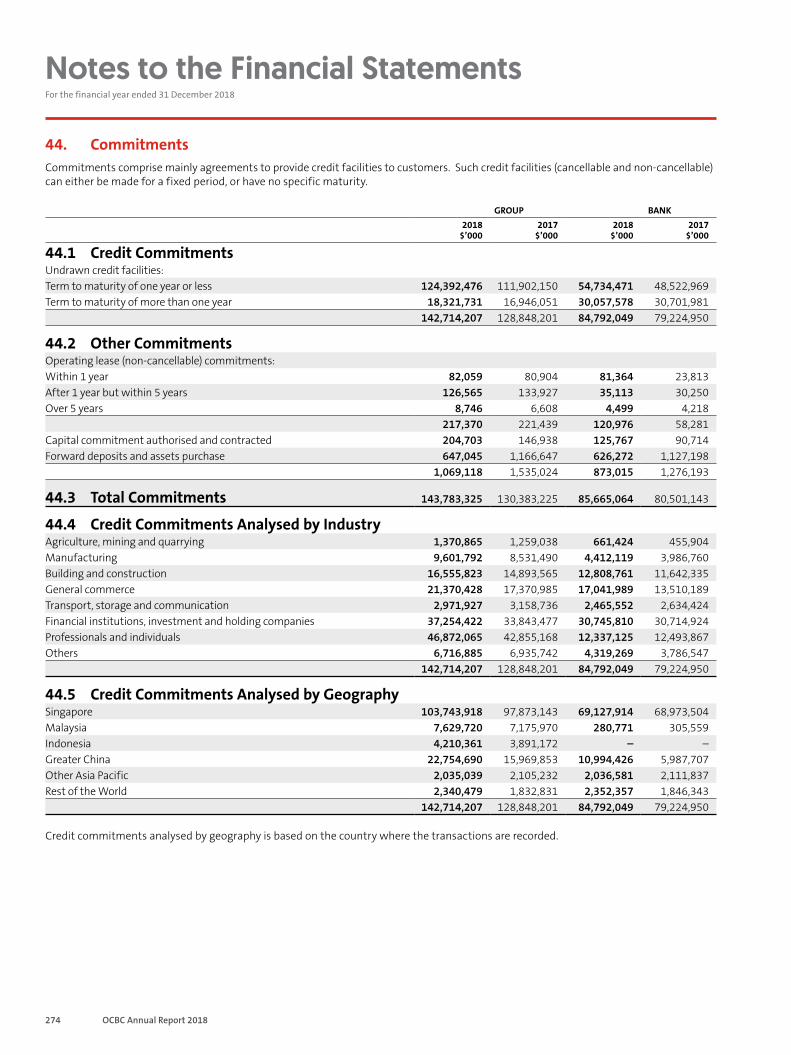
274 OCBC Annual Report 2018
Notes to the Financial Statements For the financial year ended 31 December 2018
44. CommitmentsCommitments comprise mainly agreements to provide credit facilities to customers. Such credit facilities (cancellable and non-cancellable) can either be made for a fixed period, or have no specific maturity.
GROUP BANK2018
$’0002017
$’0002018
$’0002017
$’000
44.1 Credit CommitmentsUndrawn credit facilities:Term to maturity of one year or less 124,392,476 111,902,150 54,734,471 48,522,969Term to maturity of more than one year 18,321,731 16,946,051 30,057,578 30,701,981
142,714,207 128,848,201 84,792,049 79,224,950
44.2 Other CommitmentsOperating lease (non-cancellable) commitments:Within 1 year 82,059 80,904 81,364 23,813After 1 year but within 5 years 126,565 133,927 35,113 30,250Over 5 years 8,746 6,608 4,499 4,218
217,370 221,439 120,976 58,281Capital commitment authorised and contracted 204,703 146,938 125,767 90,714Forward deposits and assets purchase 647,045 1,166,647 626,272 1,127,198
1,069,118 1,535,024 873,015 1,276,193
44.3 Total Commitments 143,783,325 130,383,225 85,665,064 80,501,143
44.4 Credit Commitments Analysed by Industry Agriculture, mining and quarrying 1,370,865 1,259,038 661,424 455,904Manufacturing 9,601,792 8,531,490 4,412,119 3,986,760Building and construction 16,555,823 14,893,565 12,808,761 11,642,335General commerce 21,370,428 17,370,985 17,041,989 13,510,189Transport, storage and communication 2,971,927 3,158,736 2,465,552 2,634,424Financial institutions, investment and holding companies 37,254,422 33,843,477 30,745,810 30,714,924Professionals and individuals 46,872,065 42,855,168 12,337,125 12,493,867Others 6,716,885 6,935,742 4,319,269 3,786,547
142,714,207 128,848,201 84,792,049 79,224,950
44.5 Credit Commitments Analysed by Geography Singapore 103,743,918 97,873,143 69,127,914 68,973,504Malaysia 7,629,720 7,175,970 280,771 305,559Indonesia 4,210,361 3,891,172 – –Greater China 22,754,690 15,969,853 10,994,426 5,987,707Other Asia Pacific 2,035,039 2,105,232 2,036,581 2,111,837Rest of the World 2,340,479 1,832,831 2,352,357 1,846,343
142,714,207 128,848,201 84,792,049 79,224,950
Credit commitments analysed by geography is based on the country where the transactions are recorded.
275Financials
44. Commitments (continued)44.6 Insurance Related Commitments (a) Contribution to the B40 National Protection SchemeOn 9 November 2018, GEH Group announced that its subsidiary, Great Eastern Life Assurance (Malaysia) Berhad (GELM) will make a contribution of MYR2.0 billion (approximately S$659.6 million) to the B40 National Protection Scheme (the Scheme) as part of its corporate social responsibility efforts and in satisfaction of the local shareholding requirements applicable to insurance companies in Malaysia.
(b) Acquisition of PT QBE General Insurance Indonesia by Great Eastern General Insurance LimitedOn 10 December 2018, GEH Group’s subsidiary, Great Eastern General Insurance Limited (GEG), entered into a share purchase agreement to acquire shares in PT QBE General Insurance Indonesia (QBE Indonesia) for a consideration of USD28.0 million (approximately S$38.4 million). The completion of the transaction is currently subject to regulatory and other relevant approvals and is expected to be completed in the first half of 2019. On completion of the transaction, PT Suryasono Sentosa (PTSS), a company registered in Indonesia, will simultaneously acquire 5% of the shares in QBE Indonesia to satisfy local shareholding requirements.
(c) Agreement to Transfer ElderShield PoliciesOn 7 January 2019, the Ministry of Health (MOH) of Singapore issued a press release regarding the agreement with the Eldershield insurers for the Singapore Government to take over administration of the ElderShield scheme in 2021. The Great Eastern Life Assurance Company Limited (GEL), a wholly-owned subsidiary of GEH, has entered into a binding agreement with MOH in respect of the transfer of the ElderShield 300 and/or ElderShield 400 basic policies currently managed by GEL under the existing ElderShield scheme, to MOH (the Transfer).
The above events do not have a material impact on the financial statements of the Group for the financial year ended 31 December 2018 and the Group does not expect them to have a material impact on the financial statements of the Group for the financial year ending 31 December 2019.
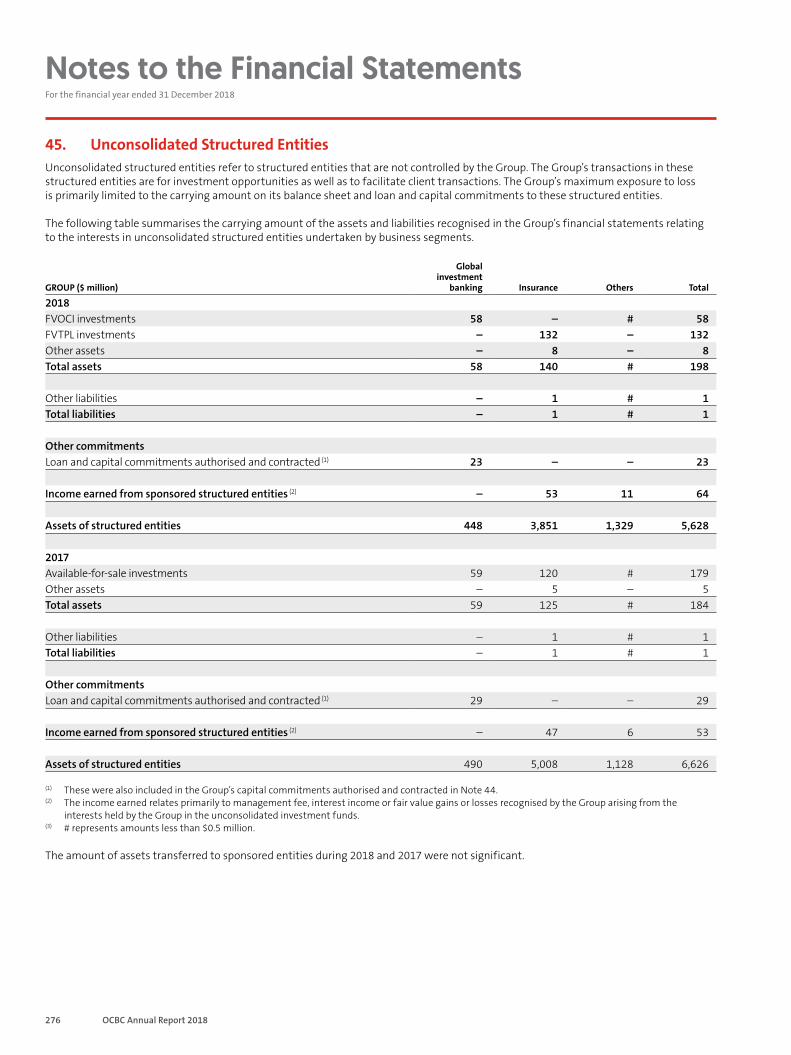
276 OCBC Annual Report 2018
Notes to the Financial Statements For the financial year ended 31 December 2018
45. Unconsolidated Structured EntitiesUnconsolidated structured entities refer to structured entities that are not controlled by the Group. The Group’s transactions in these structured entities are for investment opportunities as well as to facilitate client transactions. The Group’s maximum exposure to loss is primarily limited to the carrying amount on its balance sheet and loan and capital commitments to these structured entities.
The following table summarises the carrying amount of the assets and liabilities recognised in the Group’s financial statements relating to the interests in unconsolidated structured entities undertaken by business segments.
GROUP ($ million)
Global investment
banking Insurance Others Total
2018FVOCI investments 58 – # 58FVTPL investments – 132 – 132Other assets – 8 – 8Total assets 58 140 # 198
Other liabilities – 1 # 1Total liabilities – 1 # 1
Other commitmentsLoan and capital commitments authorised and contracted (1) 23 – – 23
Income earned from sponsored structured entities (2) – 53 11 64
Assets of structured entities 448 3,851 1,329 5,628
2017Available-for-sale investments 59 120 # 179Other assets – 5 – 5Total assets 59 125 # 184
Other liabilities – 1 # 1Total liabilities – 1 # 1
Other commitmentsLoan and capital commitments authorised and contracted (1) 29 – – 29
Income earned from sponsored structured entities (2) – 47 6 53
Assets of structured entities 490 5,008 1,128 6,626
(1) These were also included in the Group’s capital commitments authorised and contracted in Note 44.(2) The income earned relates primarily to management fee, interest income or fair value gains or losses recognised by the Group arising from the
interests held by the Group in the unconsolidated investment funds.(3) # represents amounts less than $0.5 million.
The amount of assets transferred to sponsored entities during 2018 and 2017 were not significant.
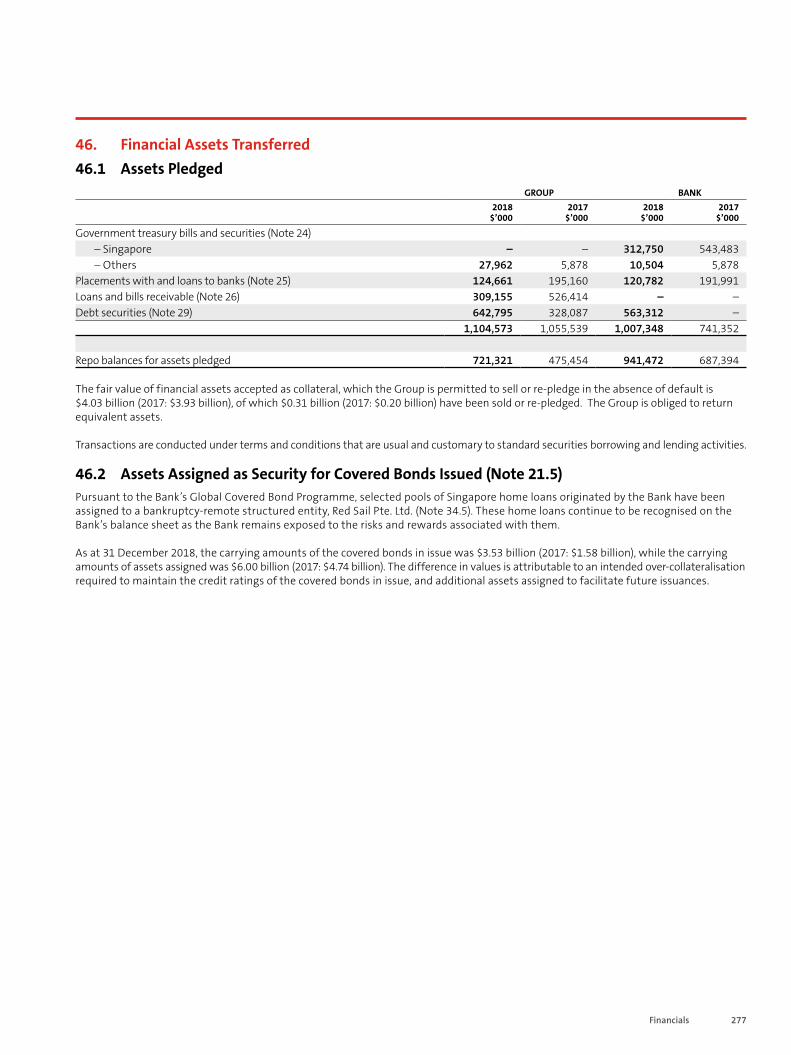
277Financials
46. Financial Assets Transferred 46.1 Assets Pledged
GROUP BANK2018
$’0002017
$’0002018
$’0002017
$’000
Government treasury bills and securities (Note 24)– Singapore – – 312,750 543,483– Others 27,962 5,878 10,504 5,878
Placements with and loans to banks (Note 25) 124,661 195,160 120,782 191,991Loans and bills receivable (Note 26) 309,155 526,414 – –Debt securities (Note 29) 642,795 328,087 563,312 –
1,104,573 1,055,539 1,007,348 741,352
Repo balances for assets pledged 721,321 475,454 941,472 687,394
The fair value of financial assets accepted as collateral, which the Group is permitted to sell or re-pledge in the absence of default is $4.03 billion (2017: $3.93 billion), of which $0.31 billion (2017: $0.20 billion) have been sold or re-pledged. The Group is obliged to return equivalent assets.
Transactions are conducted under terms and conditions that are usual and customary to standard securities borrowing and lending activities.
46.2 Assets Assigned as Security for Covered Bonds Issued (Note 21.5)Pursuant to the Bank’s Global Covered Bond Programme, selected pools of Singapore home loans originated by the Bank have been assigned to a bankruptcy-remote structured entity, Red Sail Pte. Ltd. (Note 34.5). These home loans continue to be recognised on the Bank’s balance sheet as the Bank remains exposed to the risks and rewards associated with them.
As at 31 December 2018, the carrying amounts of the covered bonds in issue was $3.53 billion (2017: $1.58 billion), while the carrying amounts of assets assigned was $6.00 billion (2017: $4.74 billion). The difference in values is attributable to an intended over-collateralisation required to maintain the credit ratings of the covered bonds in issue, and additional assets assigned to facilitate future issuances.

278 OCBC Annual Report 2018
Notes to the Financial Statements For the financial year ended 31 December 2018
47. Assets Held for SaleThe following assets were reclassified as held for sale and are presented at their carrying amount. The Group did not recognise any impairment loss for a write-down of the assets held for sale to fair value less costs to sell.
GROUP BANK2018
$’0002017
$’0002018
$’0002017
$’000
Associates (Note 47.1) – 32,843 – –Investment properties (Note 47.2) 1,831 5,716 – 1,590
1,831 38,559 – 1,590
47.1 AssociatesIn March 2017, the Bank announced that its wholly-owned subsidiary, OCBC Wing Hang Bank Limited (OWHB), entered into a Share Sale Agreement to sell its 33.33% stake comprising 140 million ordinary shares (Sale Shares) in the capital of Hong Kong Life Insurance Limited (Hong Kong Life). The consideration for the Sale Shares is HKD2,366.7 million (approximately S$407.3 million). The completion of the Sale Shares under the Share Sale Agreement was conditional upon regulatory approvals.
In October 2018, the sale was terminated in accordance with the terms of the Share Sale Agreement on the basis that the closing conditions had not been satisfied. In accordance with the terms of the Share Sale Agreement, the deposit (net of advisory fees) of HKD234.3 million (approximately S$40.3 million) had been forfeited in favour of OWHB, and included as other income (Note 7).
The carrying amount of Hong Kong Life was reclassified as associates (Note 33).
47.2 Investment PropertiesThese comprise properties which the Group is disposing of, subject to terms that are usual and customary in the completion of the sale. The transactions are not expected to have a material impact on the Group’s net earnings and net assets for the current financial year.
48. Minimum Lease Rental ReceivableThe future minimum lease rental receivable under non-cancellable operating leases by remaining period to lease expiry is as follows:
GROUP BANK2018
$’0002017
$’0002018
$’0002017
$’000
Within 1 year 48,640 50,365 17,962 18,937After 1 year but within 5 years 36,556 43,643 9,099 17,128Over 5 years – 75 – –
85,196 94,083 27,061 36,065
The Group leases retail, commercial and hotel space to third parties with varying terms including variable rent, escalation clauses and renewal rights.
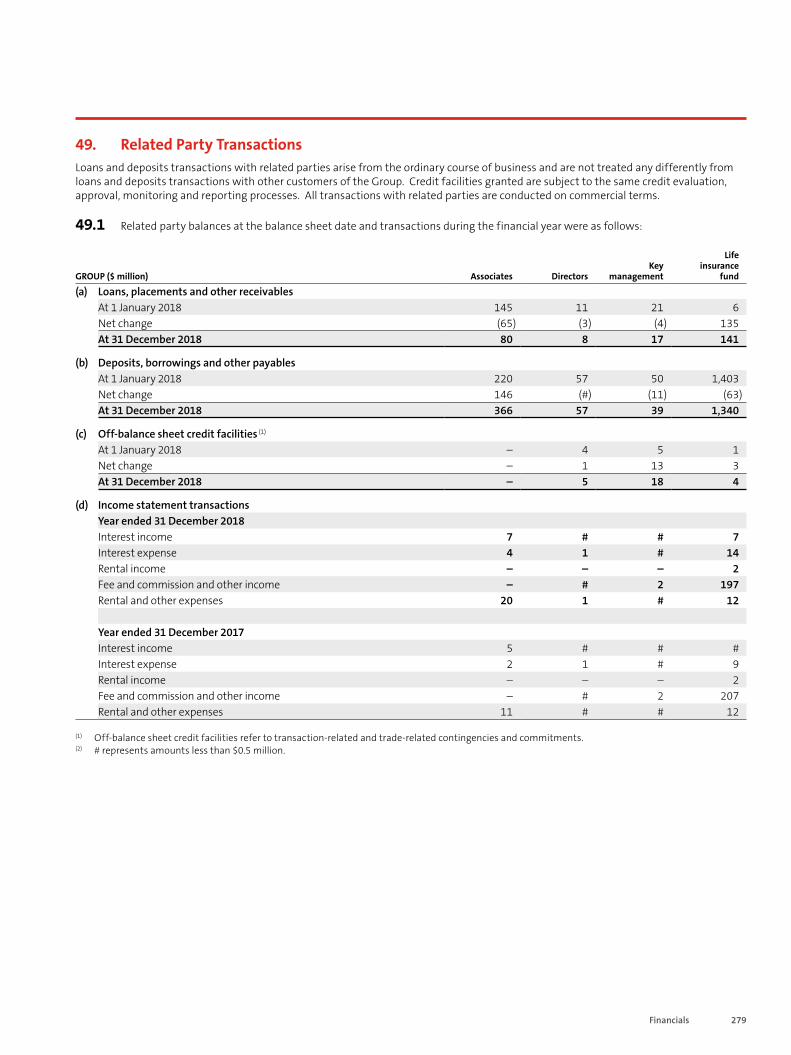
279Financials
49. Related Party TransactionsLoans and deposits transactions with related parties arise from the ordinary course of business and are not treated any differently from loans and deposits transactions with other customers of the Group. Credit facilities granted are subject to the same credit evaluation, approval, monitoring and reporting processes. All transactions with related parties are conducted on commercial terms.
49.1 Related party balances at the balance sheet date and transactions during the financial year were as follows:
GROUP ($ million) Associates DirectorsKey
management
Life insurance
fund
(a) Loans, placements and other receivablesAt 1 January 2018 145 11 21 6Net change (65) (3) (4) 135At 31 December 2018 80 8 17 141
(b) Deposits, borrowings and other payablesAt 1 January 2018 220 57 50 1,403Net change 146 (#) (11) (63)At 31 December 2018 366 57 39 1,340
(c) Off-balance sheet credit facilities (1)
At 1 January 2018 – 4 5 1Net change – 1 13 3At 31 December 2018 – 5 18 4
(d) Income statement transactionsYear ended 31 December 2018Interest income 7 # # 7Interest expense 4 1 # 14Rental income – – – 2Fee and commission and other income – # 2 197Rental and other expenses 20 1 # 12
Year ended 31 December 2017Interest income 5 # # #Interest expense 2 1 # 9Rental income – – – 2Fee and commission and other income – # 2 207Rental and other expenses 11 # # 12
(1) Off-balance sheet credit facilities refer to transaction-related and trade-related contingencies and commitments.(2) # represents amounts less than $0.5 million.
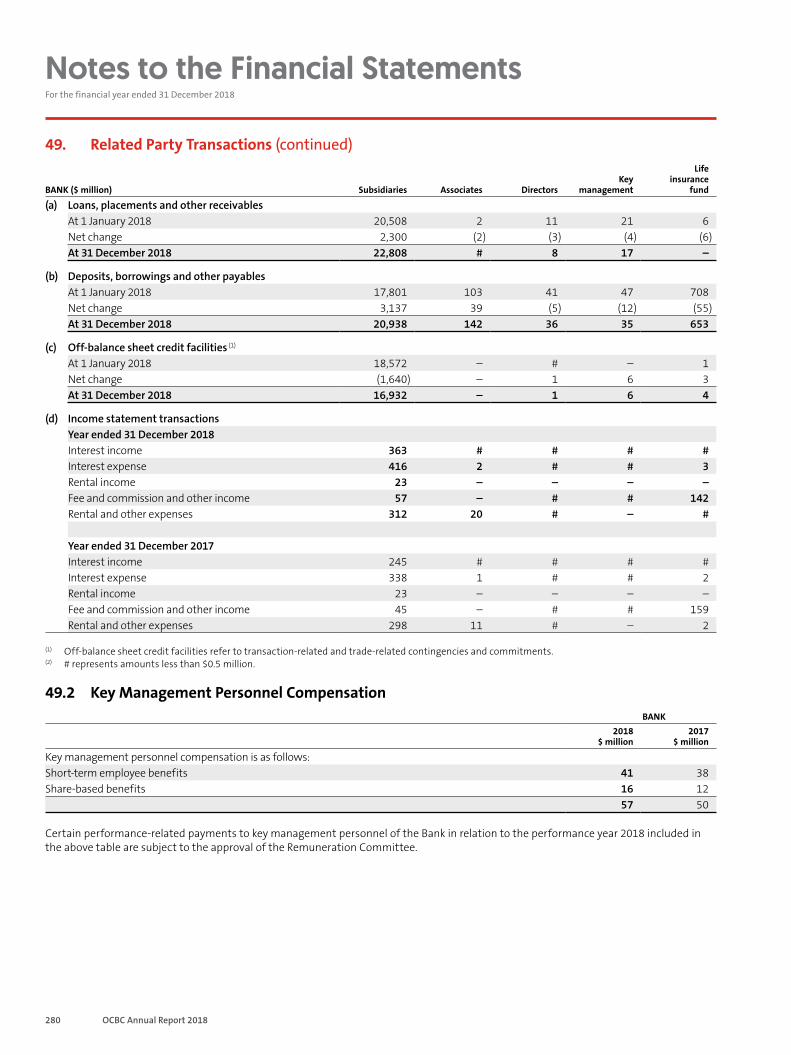
280 OCBC Annual Report 2018
Notes to the Financial Statements For the financial year ended 31 December 2018
49. Related Party Transactions (continued)
BANK ($ million) Subsidiaries Associates DirectorsKey
management
Life insurance
fund
(a) Loans, placements and other receivablesAt 1 January 2018 20,508 2 11 21 6Net change 2,300 (2) (3) (4) (6)At 31 December 2018 22,808 # 8 17 –
(b) Deposits, borrowings and other payablesAt 1 January 2018 17,801 103 41 47 708Net change 3,137 39 (5) (12) (55)At 31 December 2018 20,938 142 36 35 653
(c) Off-balance sheet credit facilities (1)
At 1 January 2018 18,572 – # – 1Net change (1,640) – 1 6 3At 31 December 2018 16,932 – 1 6 4
(d) Income statement transactionsYear ended 31 December 2018Interest income 363 # # # #Interest expense 416 2 # # 3Rental income 23 – – – –Fee and commission and other income 57 – # # 142Rental and other expenses 312 20 # – #
Year ended 31 December 2017Interest income 245 # # # #Interest expense 338 1 # # 2Rental income 23 – – – –Fee and commission and other income 45 – # # 159Rental and other expenses 298 11 # – 2
(1) Off-balance sheet credit facilities refer to transaction-related and trade-related contingencies and commitments.(2) # represents amounts less than $0.5 million.
49.2 Key Management Personnel CompensationBANK
2018$ million
2017$ million
Key management personnel compensation is as follows:Short-term employee benefits 41 38Share-based benefits 16 12
57 50
Certain performance-related payments to key management personnel of the Bank in relation to the performance year 2018 included in the above table are subject to the approval of the Remuneration Committee.
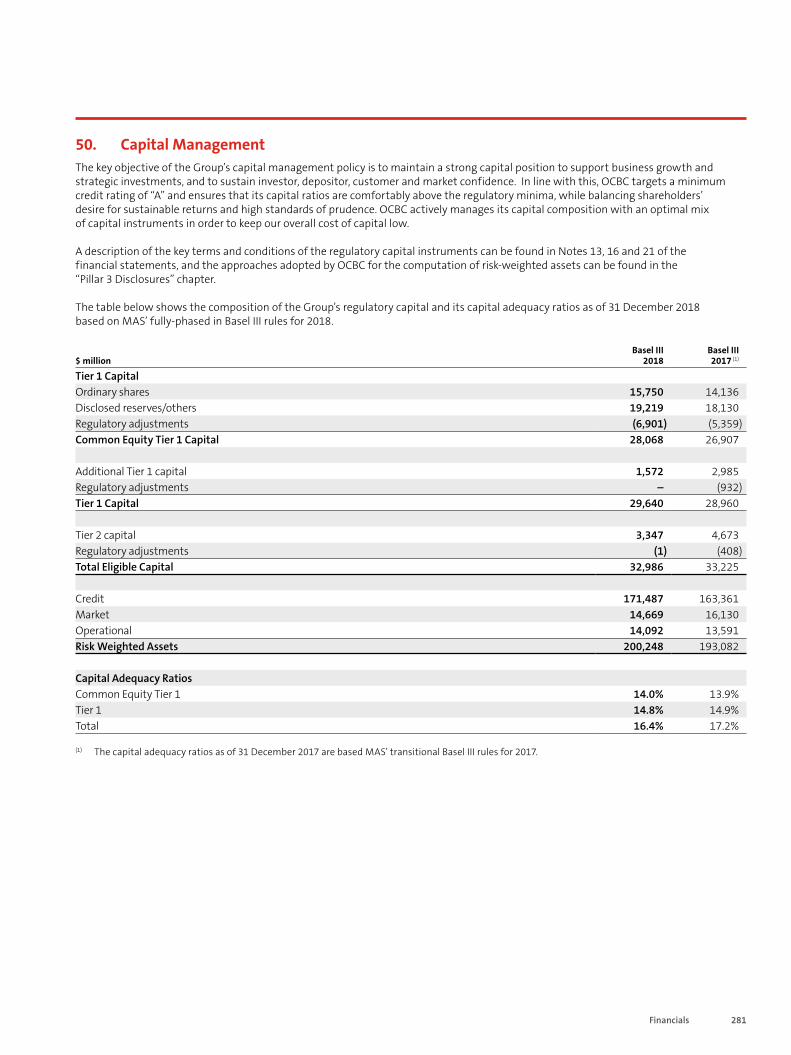
281Financials
50. Capital Management The key objective of the Group’s capital management policy is to maintain a strong capital position to support business growth and strategic investments, and to sustain investor, depositor, customer and market confidence. In line with this, OCBC targets a minimum credit rating of “A” and ensures that its capital ratios are comfortably above the regulatory minima, while balancing shareholders’ desire for sustainable returns and high standards of prudence. OCBC actively manages its capital composition with an optimal mix of capital instruments in order to keep our overall cost of capital low.
A description of the key terms and conditions of the regulatory capital instruments can be found in Notes 13, 16 and 21 of the financial statements, and the approaches adopted by OCBC for the computation of risk-weighted assets can be found in the “Pillar 3 Disclosures” chapter.
The table below shows the composition of the Group’s regulatory capital and its capital adequacy ratios as of 31 December 2018 based on MAS’ fully-phased in Basel III rules for 2018.
$ millionBasel III
2018Basel III2017 (1)
Tier 1 CapitalOrdinary shares 15,750 14,136Disclosed reserves/others 19,219 18,130Regulatory adjustments (6,901) (5,359)Common Equity Tier 1 Capital 28,068 26,907
Additional Tier 1 capital 1,572 2,985Regulatory adjustments – (932)Tier 1 Capital 29,640 28,960
Tier 2 capital 3,347 4,673Regulatory adjustments (1) (408)Total Eligible Capital 32,986 33,225
Credit 171,487 163,361Market 14,669 16,130Operational 14,092 13,591Risk Weighted Assets 200,248 193,082
Capital Adequacy RatiosCommon Equity Tier 1 14.0% 13.9%Tier 1 14.8% 14.9%Total 16.4% 17.2%
(1) The capital adequacy ratios as of 31 December 2017 are based MAS’ transitional Basel III rules for 2017.

282 OCBC Annual Report 2018
Notes to the Financial Statements For the financial year ended 31 December 2018
51. New Accounting Standards and Interpretations As of the balance sheet date, certain new standards, amendments and interpretations to existing accounting standards have been published. The Group has not adopted the following relevant new/revised financial reporting standards and interpretations that have been issued but not yet effective.
SFRS(I) TitleEffective for financial year beginning on or after
SFRS(I) 3, SFRS(I) 11 (Amendments) Previously Held Interest in a Joint Operation 1 January 2019SFRS(I) 9 (Amendments) Prepayment Features with Negative Compensation 1 January 2019SFRS(I) 16 Leases 1 January 2019SFRS(I) 1-12 (Amendments) Income Tax Consequences of Payments on Financial Instruments
Classified as Equity 1 January 2019
SFRS(I) 1-19 (Amendments) Plan Amendment, Curtailment or Settlement 1 January 2019SFRS(I) 1-23 (Amendments) Borrowing Costs Eligible for Capitalisation 1 January 2019SFRS(I) 1-28 (Amendments) Long-term Interests in Associates and Joint Ventures 1 January 2019SFRS(I) INT 23 Uncertainty over Income Tax Treatments 1 January 2019SFRS(I) 17 Insurance Contracts 1 January 2021SFRS(I) 10, SFRS(I) 1-28 (Amendments)
Sale or Contribution of Assets between an Investor and its Associate or Joint Venture
To be determined
Based on the Group’s preliminary analysis, the initial application of the above standards (including their consequential amendments) and interpretations are not expected to have a significant impact on the Group’s financial statements, except for SFRS(I) 17.
(I) SFRS(I) 16 LeasesSFRS(I) 16 introduces a single, on-balance sheet lease accounting model for lessees. A lessee recognises a right-of-use (ROU) asset representing its right to use the underlying asset and a lease liability representing its obligation to make lease payments. There are recognition exemptions for short-term leases and leases of low-value items. Lessor accounting remains similar to the current standard – i.e. lessors continue to classify leases as finance or operating leases. SFRS(I) 16 replaces existing lease accounting guidance, including SFRS(I) 1-17 Leases, SFRS(I) INT 4 Determining whether an Arrangement contains a Lease, SFRS(I) INT 1-15 Operating Leases – Incentives and SFRS(I) INT 1-27 Evaluating the Substance of Transactions Involving the Legal Form of a Lease. The standard is effective for annual periods beginning on or after 1 January 2019, with early adoption permitted.
The Group plans to apply SFRS(I) 16 initially on 1 January 2019, using the modified retrospective approach. Therefore, the cumulative effect of adopting SFRS(I) 16, if any, will be recognised as an adjustment to the opening balance of revenue reserves at 1 January 2019, with no restatement of comparative information. The Group plans to apply the practical expedient to grandfather the definition of a lease on transition. This means that the Group will apply SFRS(I) 16 to all contracts entered into before 1 January 2019 and identify these contracts as leases in accordance with SFRS(I) 1-17 and SFRS(I) INT 4.
The Group expects its existing operating lease arrangements to be recognised as ROU assets with corresponding lease liabilities under SFRS(I) 16. The nature of expenses related to those leases will change as SFRS(I) 16 replaces the straight-line operating lease expense with depreciation charge for ROU assets and interest expense on lease liabilities.
The initial application of the standard is not expected to have a material impact on the Group’s financial statements.
(II) SFRS(I) 17 Insurance ContractsIn May 2017, SFRS(I) 17 was issued, a comprehensive new accounting standard for insurance contracts covering recognition and measurement, presentation and disclosure, which replaces SFRS(I) 4.
SFRS(I) 17 is effective for annual periods beginning on or after 1 January 2021. The Group plans to adopt the new standard on the required effective date and a Project Steering Committee has been formed to oversee the implementation of SFRS(I) 17. The Group expects that the new standard will result in an important change to the accounting policies for insurance contract liabilities of the Group and is likely to have a significant impact on profit and total equity together with the Group’s financial statement presentation and disclosures.
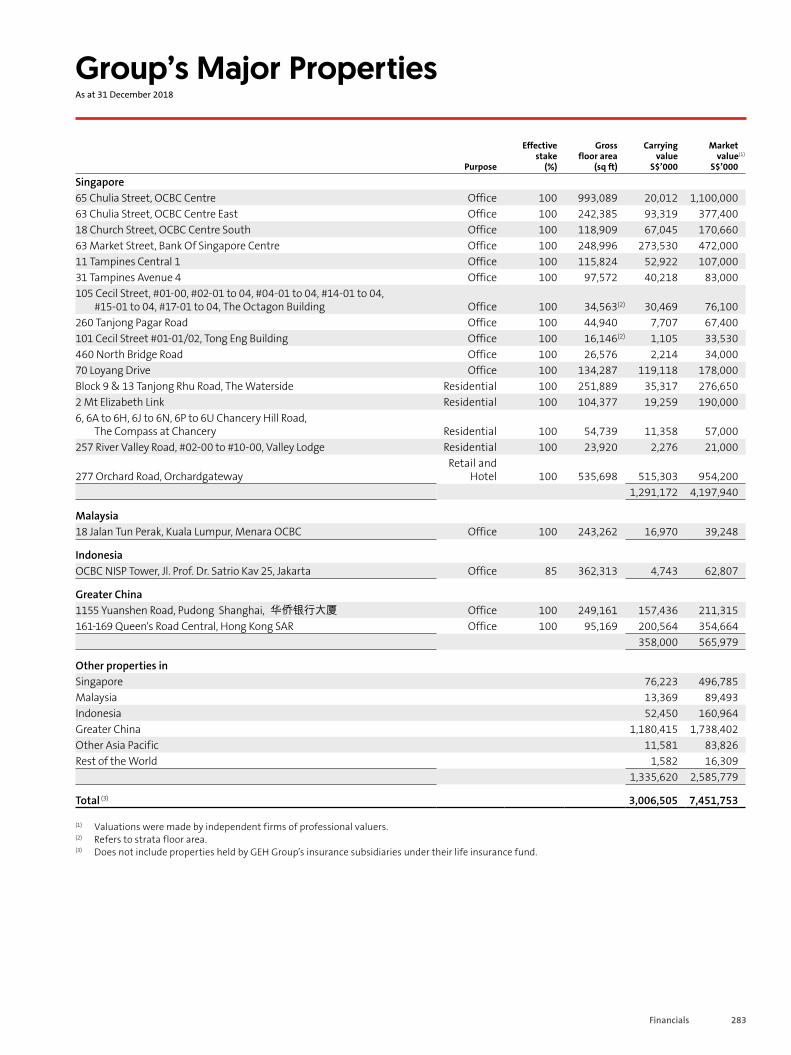
283Financials
Group’s Major Properties As at 31 December 2018
Purpose
Effective stake
(%)
Gross floor area
(sq ft)
Carrying value
S$’000
Market value(1)
S$’000
Singapore65 Chulia Street, OCBC Centre Office 100 993,089 20,012 1,100,00063 Chulia Street, OCBC Centre East Office 100 242,385 93,319 377,40018 Church Street, OCBC Centre South Office 100 118,909 67,045 170,66063 Market Street, Bank Of Singapore Centre Office 100 248,996 273,530 472,00011 Tampines Central 1 Office 100 115,824 52,922 107,00031 Tampines Avenue 4 Office 100 97,572 40,218 83,000105 Cecil Street, #01-00, #02-01 to 04, #04-01 to 04, #14-01 to 04,
#15-01 to 04, #17-01 to 04, The Octagon Building Office 100 34,563(2) 30,469 76,100260 Tanjong Pagar Road Office 100 44,940 7,707 67,400101 Cecil Street #01-01/02, Tong Eng Building Office 100 16,146(2) 1,105 33,530460 North Bridge Road Office 100 26,576 2,214 34,00070 Loyang Drive Office 100 134,287 119,118 178,000Block 9 & 13 Tanjong Rhu Road, The Waterside Residential 100 251,889 35,317 276,6502 Mt Elizabeth Link Residential 100 104,377 19,259 190,0006, 6A to 6H, 6J to 6N, 6P to 6U Chancery Hill Road,
The Compass at Chancery Residential 100 54,739 11,358 57,000257 River Valley Road, #02-00 to #10-00, Valley Lodge Residential 100 23,920 2,276 21,000
277 Orchard Road, OrchardgatewayRetail and
Hotel 100 535,698 515,303 954,2001,291,172 4,197,940
Malaysia18 Jalan Tun Perak, Kuala Lumpur, Menara OCBC Office 100 243,262 16,970 39,248
IndonesiaOCBC NISP Tower, Jl. Prof. Dr. Satrio Kav 25, Jakarta Office 85 362,313 4,743 62,807
Greater China1155 Yuanshen Road, Pudong Shanghai, 华侨银行大厦 Office 100 249,161 157,436 211,315161-169 Queen's Road Central, Hong Kong SAR Office 100 95,169 200,564 354,664
358,000 565,979
Other properties inSingapore 76,223 496,785Malaysia 13,369 89,493Indonesia 52,450 160,964Greater China 1,180,415 1,738,402Other Asia Pacific 11,581 83,826Rest of the World 1,582 16,309
1,335,620 2,585,779
Total (3) 3,006,505 7,451,753
(1) Valuations were made by independent firms of professional valuers.(2) Refers to strata floor area. (3) Does not include properties held by GEH Group’s insurance subsidiaries under their life insurance fund.
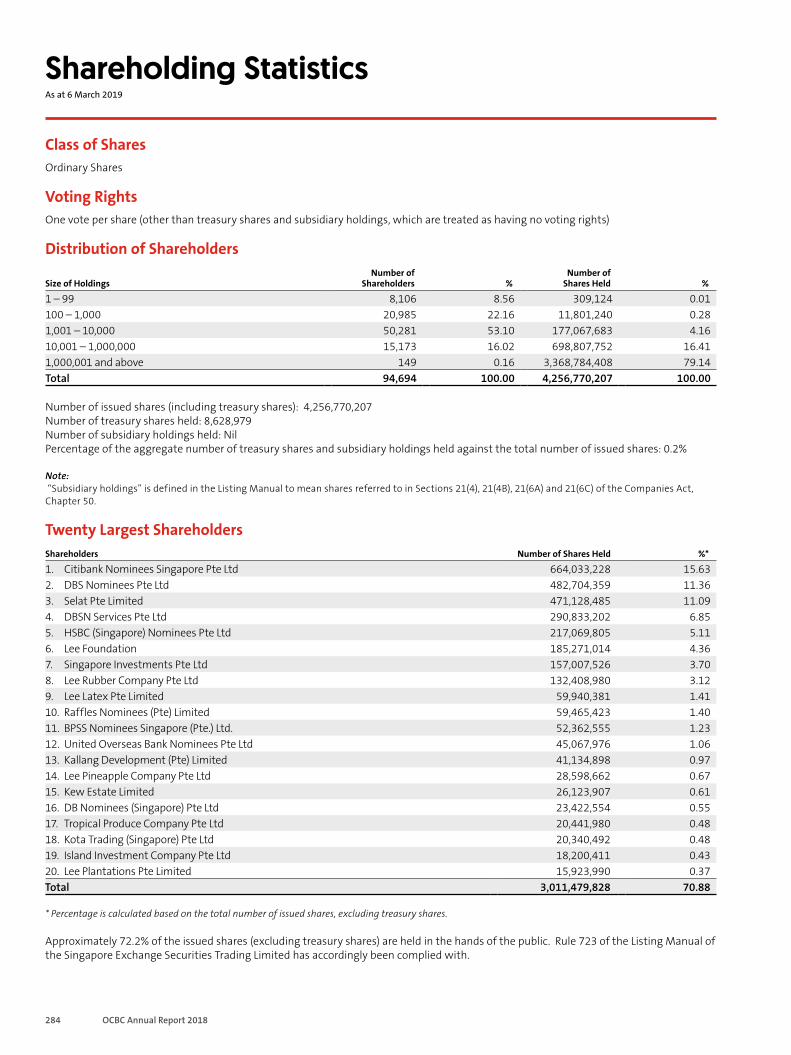
284 OCBC Annual Report 2018
Shareholding StatisticsAs at 6 March 2019
Class of Shares Ordinary Shares
Voting Rights One vote per share (other than treasury shares and subsidiary holdings, which are treated as having no voting rights)
Distribution of Shareholders
Size of HoldingsNumber of
Shareholders %Number of
Shares Held %
1 – 99 8,106 8.56 309,124 0.01100 – 1,000 20,985 22.16 11,801,240 0.281,001 – 10,000 50,281 53.10 177,067,683 4.1610,001 – 1,000,000 15,173 16.02 698,807,752 16.411,000,001 and above 149 0.16 3,368,784,408 79.14Total 94,694 100.00 4,256,770,207 100.00
Number of issued shares (including treasury shares): 4,256,770,207Number of treasury shares held: 8,628,979Number of subsidiary holdings held: NilPercentage of the aggregate number of treasury shares and subsidiary holdings held against the total number of issued shares: 0.2%
Note: “Subsidiary holdings” is defined in the Listing Manual to mean shares referred to in Sections 21(4), 21(4B), 21(6A) and 21(6C) of the Companies Act, Chapter 50.
Twenty Largest Shareholders Shareholders Number of Shares Held %*
1. Citibank Nominees Singapore Pte Ltd 664,033,228 15.632. DBS Nominees Pte Ltd 482,704,359 11.363. Selat Pte Limited 471,128,485 11.094. DBSN Services Pte Ltd 290,833,202 6.855. HSBC (Singapore) Nominees Pte Ltd 217,069,805 5.116. Lee Foundation 185,271,014 4.367. Singapore Investments Pte Ltd 157,007,526 3.708. Lee Rubber Company Pte Ltd 132,408,980 3.129. Lee Latex Pte Limited 59,940,381 1.4110. Raffles Nominees (Pte) Limited 59,465,423 1.4011. BPSS Nominees Singapore (Pte.) Ltd. 52,362,555 1.2312. United Overseas Bank Nominees Pte Ltd 45,067,976 1.0613. Kallang Development (Pte) Limited 41,134,898 0.9714. Lee Pineapple Company Pte Ltd 28,598,662 0.6715. Kew Estate Limited 26,123,907 0.6116. DB Nominees (Singapore) Pte Ltd 23,422,554 0.5517. Tropical Produce Company Pte Ltd 20,441,980 0.4818. Kota Trading (Singapore) Pte Ltd 20,340,492 0.4819. Island Investment Company Pte Ltd 18,200,411 0.4320. Lee Plantations Pte Limited 15,923,990 0.37Total 3,011,479,828 70.88
* Percentage is calculated based on the total number of issued shares, excluding treasury shares.
Approximately 72.2% of the issued shares (excluding treasury shares) are held in the hands of the public. Rule 723 of the Listing Manual of the Singapore Exchange Securities Trading Limited has accordingly been complied with.
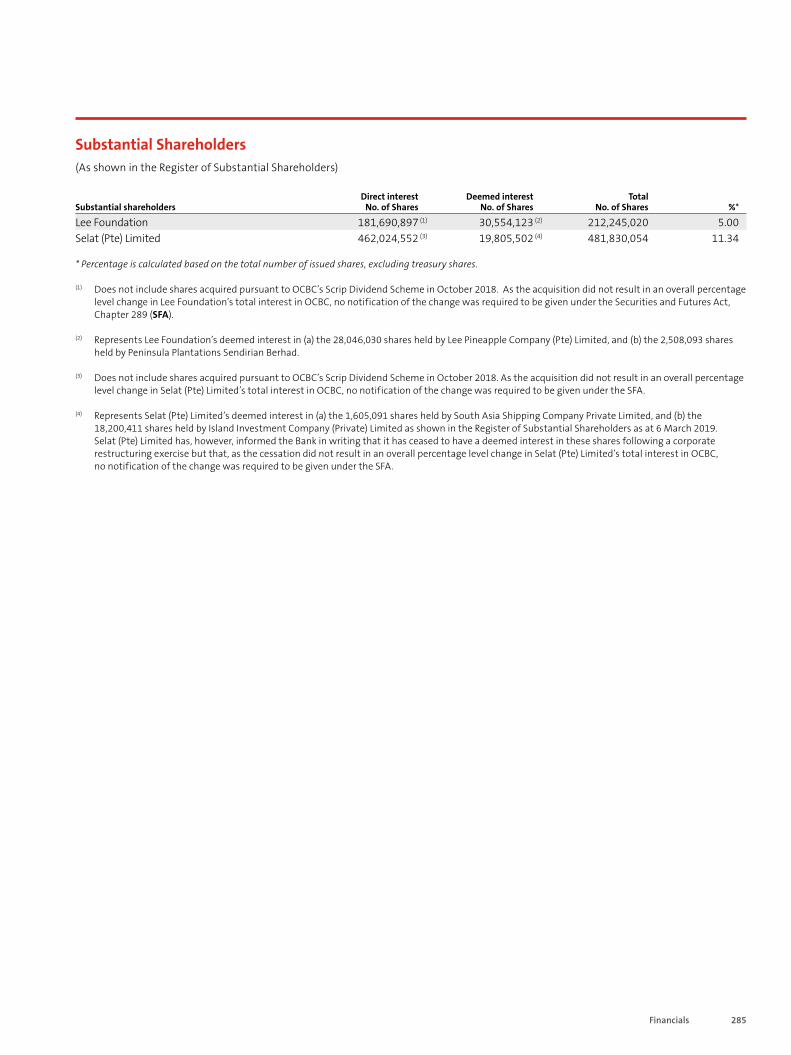
285Financials
Substantial Shareholders (As shown in the Register of Substantial Shareholders)
Substantial shareholdersDirect interest
No. of SharesDeemed interest
No. of SharesTotal
No. of Shares %*
Lee Foundation 181,690,897 (1) 30,554,123 (2) 212,245,020 5.00Selat (Pte) Limited 462,024,552 (3) 19,805,502 (4) 481,830,054 11.34
* Percentage is calculated based on the total number of issued shares, excluding treasury shares.
(1) Does not include shares acquired pursuant to OCBC’s Scrip Dividend Scheme in October 2018. As the acquisition did not result in an overall percentage level change in Lee Foundation’s total interest in OCBC, no notification of the change was required to be given under the Securities and Futures Act, Chapter 289 (SFA).
(2) Represents Lee Foundation’s deemed interest in (a) the 28,046,030 shares held by Lee Pineapple Company (Pte) Limited, and (b) the 2,508,093 shares held by Peninsula Plantations Sendirian Berhad.
(3) Does not include shares acquired pursuant to OCBC’s Scrip Dividend Scheme in October 2018. As the acquisition did not result in an overall percentage level change in Selat (Pte) Limited’s total interest in OCBC, no notification of the change was required to be given under the SFA.
(4) Represents Selat (Pte) Limited’s deemed interest in (a) the 1,605,091 shares held by South Asia Shipping Company Private Limited, and (b) the 18,200,411 shares held by Island Investment Company (Private) Limited as shown in the Register of Substantial Shareholders as at 6 March 2019. Selat (Pte) Limited has, however, informed the Bank in writing that it has ceased to have a deemed interest in these shares following a corporate restructuring exercise but that, as the cessation did not result in an overall percentage level change in Selat (Pte) Limited’s total interest in OCBC, no notification of the change was required to be given under the SFA.
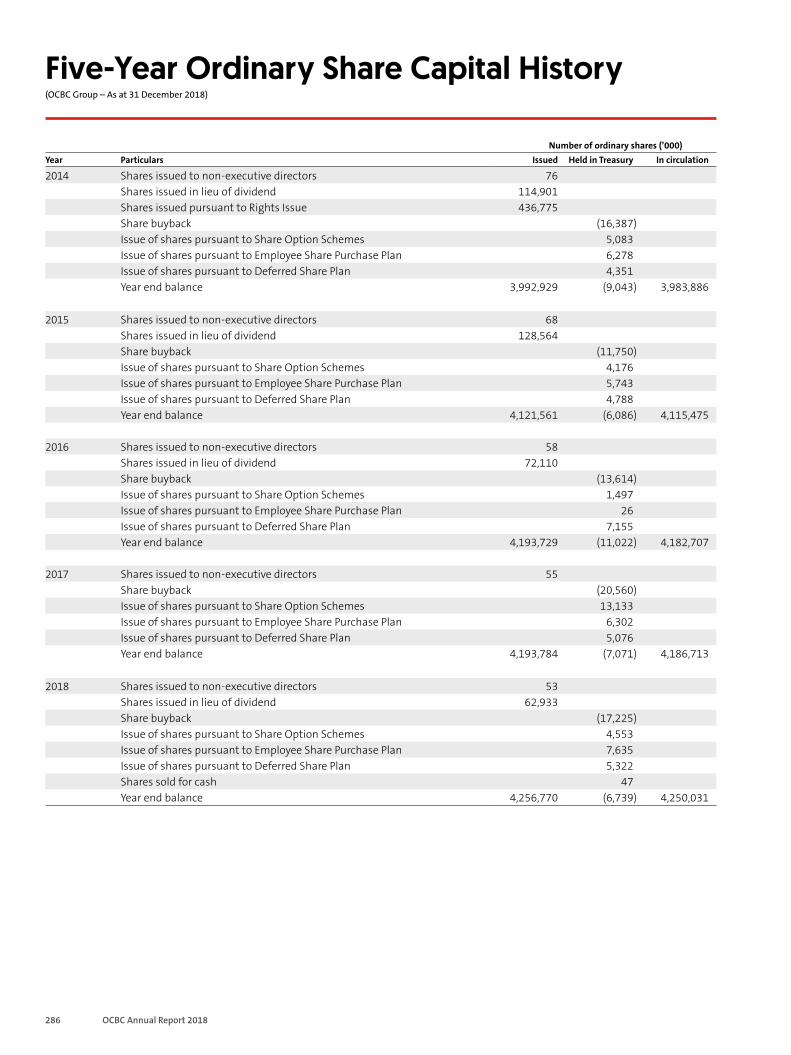
286 OCBC Annual Report 2018
Five-Year Ordinary Share Capital History(OCBC Group – As at 31 December 2018)
Number of ordinary shares (’000)Year Particulars Issued Held in Treasury In circulation
2014 Shares issued to non-executive directors 76 Shares issued in lieu of dividend 114,901 Shares issued pursuant to Rights Issue 436,775 Share buyback (16,387)Issue of shares pursuant to Share Option Schemes 5,083 Issue of shares pursuant to Employee Share Purchase Plan 6,278 Issue of shares pursuant to Deferred Share Plan 4,351 Year end balance 3,992,929 (9,043) 3,983,886
2015 Shares issued to non-executive directors 68 Shares issued in lieu of dividend 128,564 Share buyback (11,750)Issue of shares pursuant to Share Option Schemes 4,176 Issue of shares pursuant to Employee Share Purchase Plan 5,743 Issue of shares pursuant to Deferred Share Plan 4,788 Year end balance 4,121,561 (6,086) 4,115,475
2016 Shares issued to non-executive directors 58 Shares issued in lieu of dividend 72,110 Share buyback (13,614)Issue of shares pursuant to Share Option Schemes 1,497 Issue of shares pursuant to Employee Share Purchase Plan 26 Issue of shares pursuant to Deferred Share Plan 7,155 Year end balance 4,193,729 (11,022) 4,182,707
2017 Shares issued to non-executive directors 55 Share buyback (20,560)Issue of shares pursuant to Share Option Schemes 13,133 Issue of shares pursuant to Employee Share Purchase Plan 6,302 Issue of shares pursuant to Deferred Share Plan 5,076 Year end balance 4,193,784 (7,071) 4,186,713
2018 Shares issued to non-executive directors 53 Shares issued in lieu of dividend 62,933 Share buyback (17,225)Issue of shares pursuant to Share Option Schemes 4,553 Issue of shares pursuant to Employee Share Purchase Plan 7,635 Issue of shares pursuant to Deferred Share Plan 5,322 Shares sold for cash 47 Year end balance 4,256,770 (6,739) 4,250,031
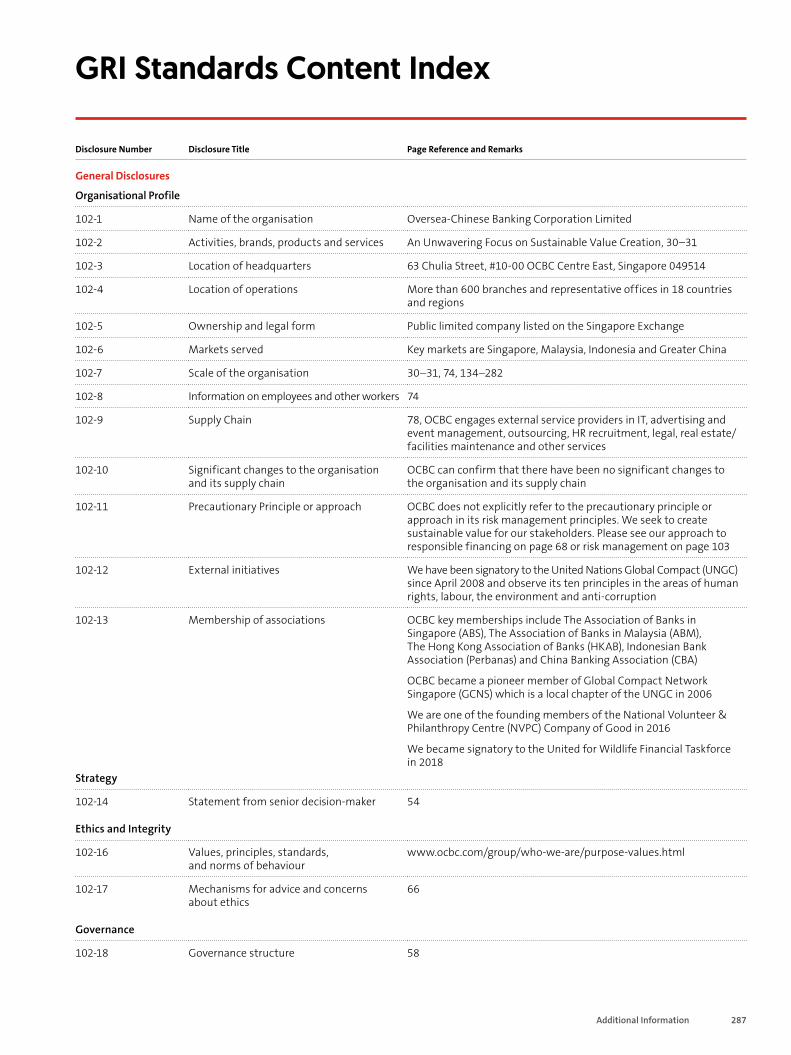
Additional Information 287
GRI Standards Content Index
Disclosure Number Disclosure Title Page Reference and Remarks
General Disclosures
Organisational Profile
102-1 Name of the organisation Oversea-Chinese Banking Corporation Limited
102-2 Activities, brands, products and services An Unwavering Focus on Sustainable Value Creation, 30–31
102-3 Location of headquarters 63 Chulia Street, #10-00 OCBC Centre East, Singapore 049514
102-4 Location of operations More than 600 branches and representative offices in 18 countries and regions
102-5 Ownership and legal form Public limited company listed on the Singapore Exchange
102-6 Markets served Key markets are Singapore, Malaysia, Indonesia and Greater China
102-7 Scale of the organisation 30–31, 74, 134–282
102-8 Information on employees and other workers 74
102-9 Supply Chain 78, OCBC engages external service providers in IT, advertising and event management, outsourcing, HR recruitment, legal, real estate/facilities maintenance and other services
102-10 Significant changes to the organisation and its supply chain
OCBC can confirm that there have been no significant changes to the organisation and its supply chain
102-11 Precautionary Principle or approach OCBC does not explicitly refer to the precautionary principle or approach in its risk management principles. We seek to create sustainable value for our stakeholders. Please see our approach to responsible financing on page 68 or risk management on page 103
102-12 External initiatives We have been signatory to the United Nations Global Compact (UNGC) since April 2008 and observe its ten principles in the areas of human rights, labour, the environment and anti-corruption
102-13 Membership of associations OCBC key memberships include The Association of Banks in Singapore (ABS), The Association of Banks in Malaysia (ABM), The Hong Kong Association of Banks (HKAB), Indonesian Bank Association (Perbanas) and China Banking Association (CBA)
OCBC became a pioneer member of Global Compact Network Singapore (GCNS) which is a local chapter of the UNGC in 2006
We are one of the founding members of the National Volunteer & Philanthropy Centre (NVPC) Company of Good in 2016
We became signatory to the United for Wildlife Financial Taskforce in 2018
Strategy
102-14 Statement from senior decision-maker 54
Ethics and Integrity
102-16 Values, principles, standards, and norms of behaviour
www.ocbc.com/group/who-we-are/purpose-values.html
102-17 Mechanisms for advice and concerns about ethics
66
Governance
102-18 Governance structure 58
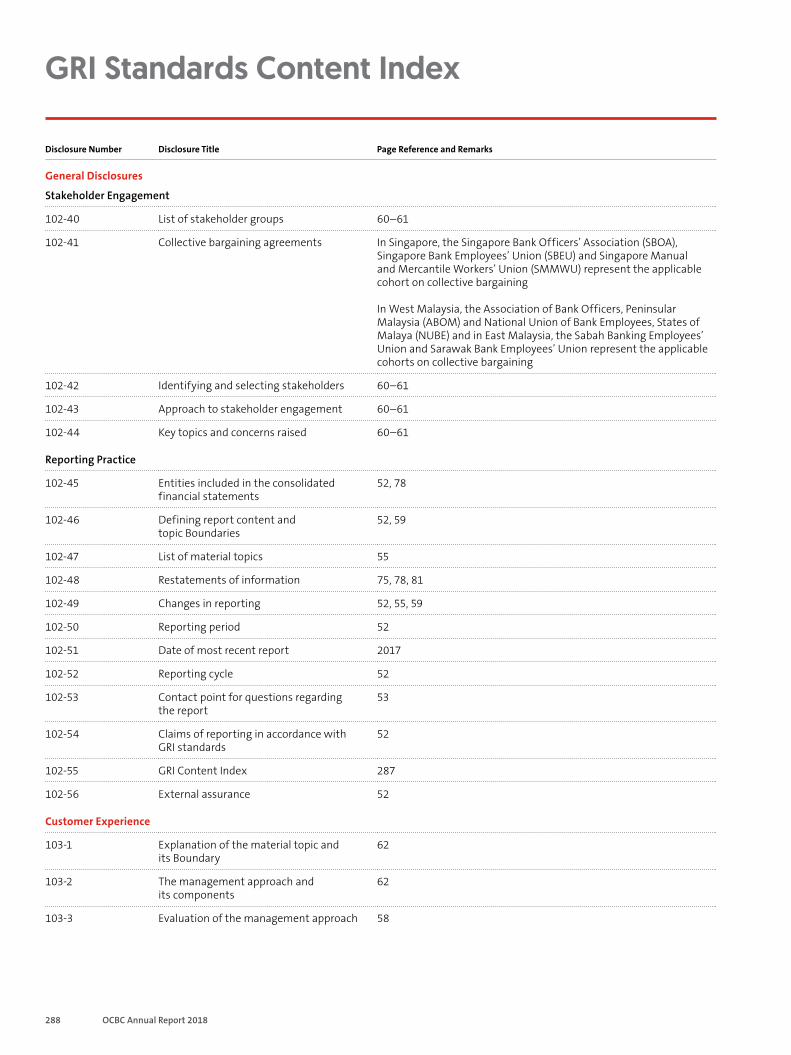
288 OCBC Annual Report 2018
GRI Standards Content Index
Disclosure Number Disclosure Title Page Reference and Remarks
General Disclosures
Stakeholder Engagement
102-40 List of stakeholder groups 60–61
102-41 Collective bargaining agreements In Singapore, the Singapore Bank Officers’ Association (SBOA), Singapore Bank Employees’ Union (SBEU) and Singapore Manual and Mercantile Workers’ Union (SMMWU) represent the applicable cohort on collective bargaining
In West Malaysia, the Association of Bank Officers, Peninsular Malaysia (ABOM) and National Union of Bank Employees, States of Malaya (NUBE) and in East Malaysia, the Sabah Banking Employees’ Union and Sarawak Bank Employees’ Union represent the applicable cohorts on collective bargaining
102-42 Identifying and selecting stakeholders 60–61
102-43 Approach to stakeholder engagement 60–61
102-44 Key topics and concerns raised 60–61
Reporting Practice
102-45 Entities included in the consolidated financial statements
52, 78
102-46 Defining report content and topic Boundaries
52, 59
102-47 List of material topics 55
102-48 Restatements of information 75, 78, 81
102-49 Changes in reporting 52, 55, 59
102-50 Reporting period 52
102-51 Date of most recent report 2017
102-52 Reporting cycle 52
102-53 Contact point for questions regarding the report
53
102-54 Claims of reporting in accordance with GRI standards
52
102-55 GRI Content Index 287
102-56 External assurance 52
Customer Experience
103-1 Explanation of the material topic and its Boundary
62
103-2 The management approach and its components
62
103-3 Evaluation of the management approach 58
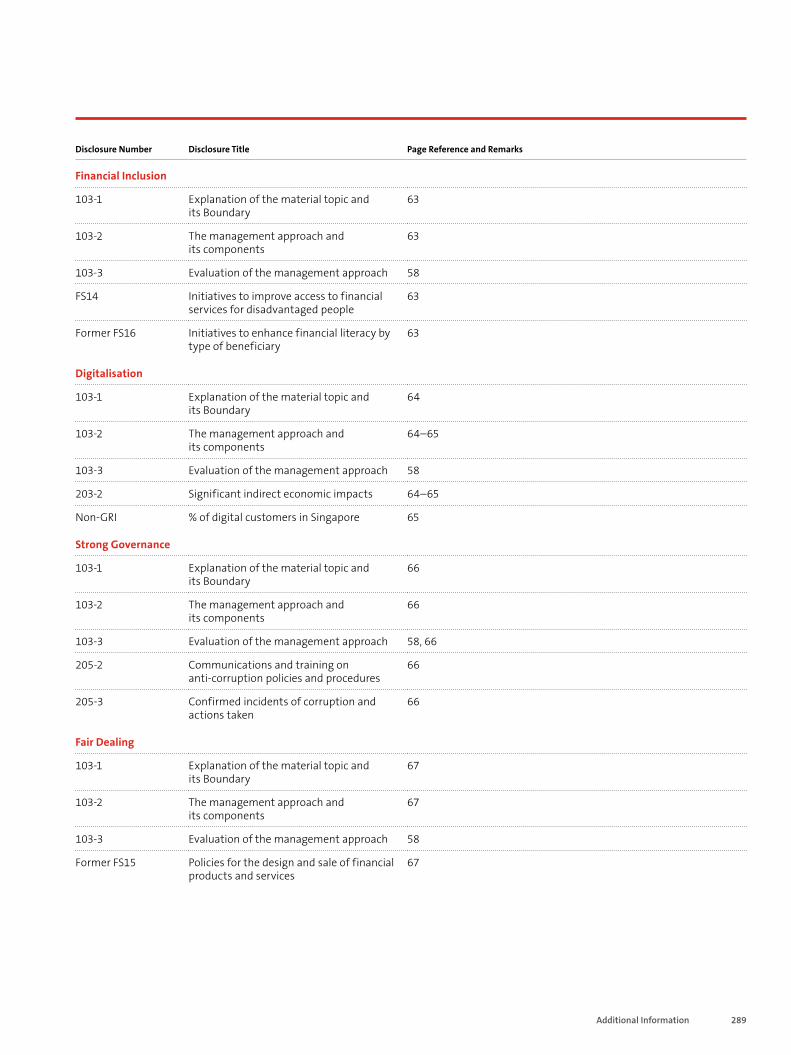
Additional Information 289
Disclosure Number Disclosure Title Page Reference and Remarks
Financial Inclusion
103-1 Explanation of the material topic and its Boundary
63
103-2 The management approach and its components
63
103-3 Evaluation of the management approach 58
FS14 Initiatives to improve access to financial services for disadvantaged people
63
Former FS16 Initiatives to enhance financial literacy by type of beneficiary
63
Digitalisation
103-1 Explanation of the material topic and its Boundary
64
103-2 The management approach and its components
64–65
103-3 Evaluation of the management approach 58
203-2 Significant indirect economic impacts 64–65
Non-GRI % of digital customers in Singapore 65
Strong Governance
103-1 Explanation of the material topic and its Boundary
66
103-2 The management approach and its components
66
103-3 Evaluation of the management approach 58, 66
205-2 Communications and training on anti-corruption policies and procedures
66
205-3 Confirmed incidents of corruption and actions taken
66
Fair Dealing
103-1 Explanation of the material topic and its Boundary
67
103-2 The management approach and its components
67
103-3 Evaluation of the management approach 58
Former FS15 Policies for the design and sale of financial products and services
67
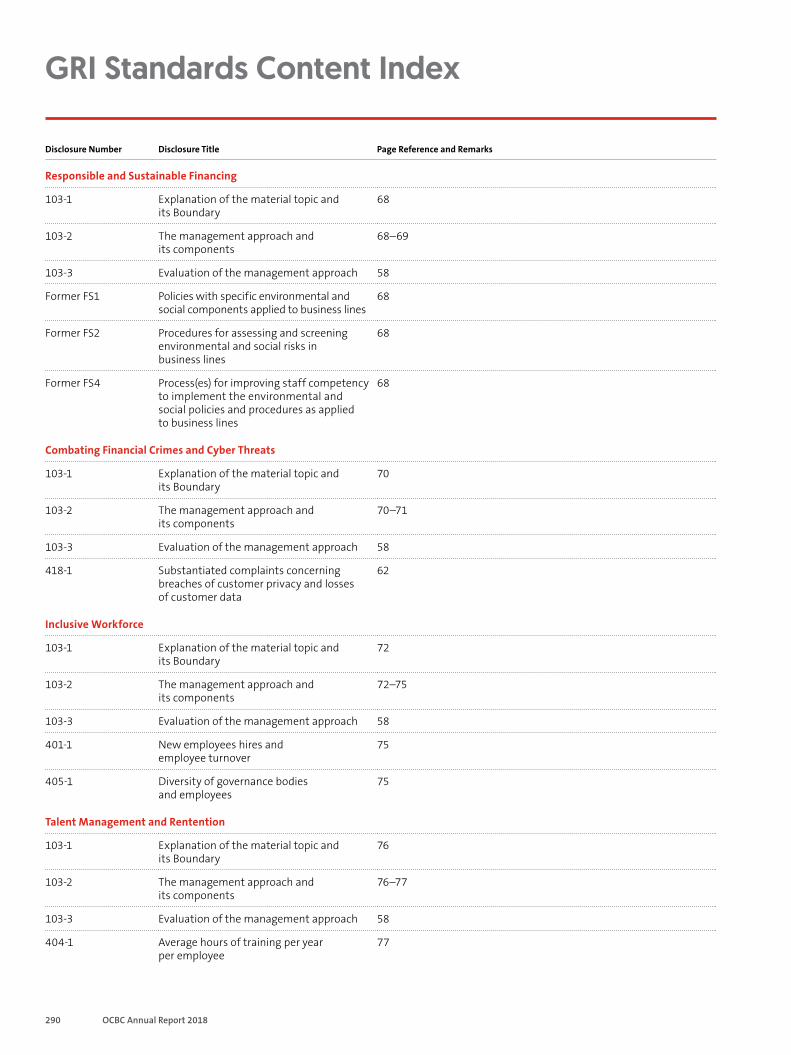
290 OCBC Annual Report 2018
GRI Standards Content Index
Disclosure Number Disclosure Title Page Reference and Remarks
Responsible and Sustainable Financing
103-1 Explanation of the material topic and its Boundary
68
103-2 The management approach and its components
68–69
103-3 Evaluation of the management approach 58
Former FS1 Policies with specific environmental and social components applied to business lines
68
Former FS2 Procedures for assessing and screening environmental and social risks in business lines
68
Former FS4 Process(es) for improving staff competency to implement the environmental and social policies and procedures as applied to business lines
68
Combating Financial Crimes and Cyber Threats
103-1 Explanation of the material topic and its Boundary
70
103-2 The management approach and its components
70–71
103-3 Evaluation of the management approach 58
418-1 Substantiated complaints concerning breaches of customer privacy and losses of customer data
62
Inclusive Workforce
103-1 Explanation of the material topic and its Boundary
72
103-2 The management approach and its components
72–75
103-3 Evaluation of the management approach 58
401-1 New employees hires and employee turnover
75
405-1 Diversity of governance bodies and employees
75
Talent Management and Rentention
103-1 Explanation of the material topic and its Boundary
76
103-2 The management approach and its components
76–77
103-3 Evaluation of the management approach 58
404-1 Average hours of training per year per employee
77
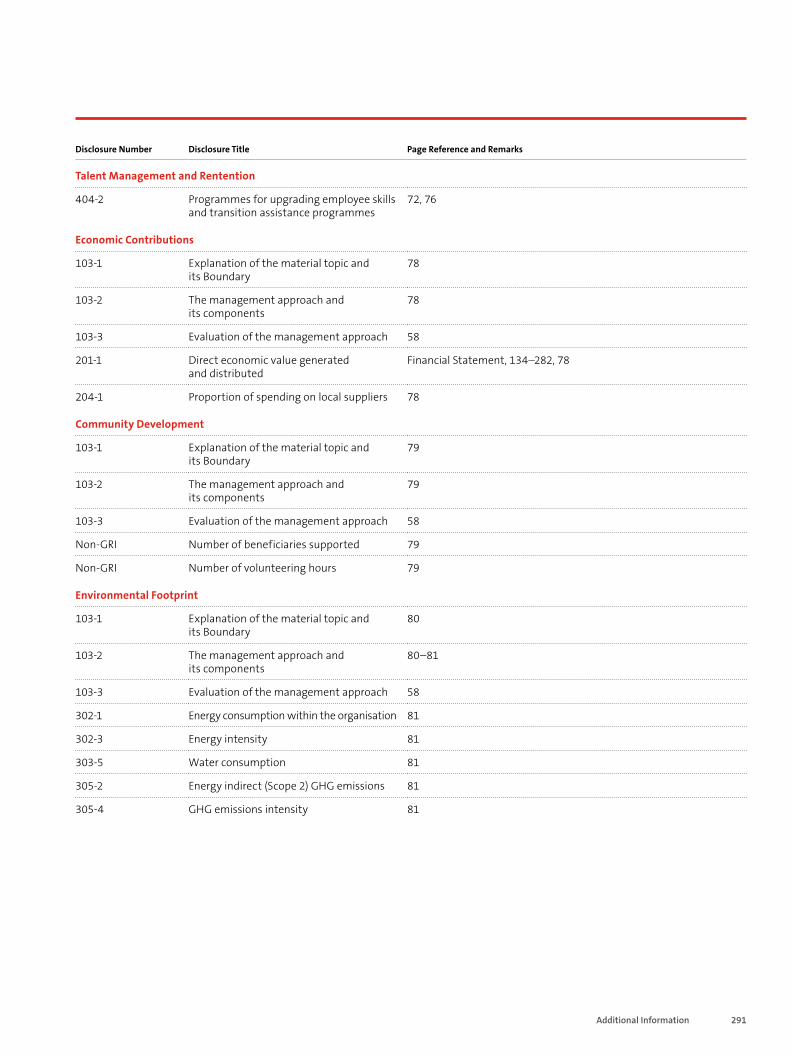
Additional Information 291
Disclosure Number Disclosure Title Page Reference and Remarks
Talent Management and Rentention
404-2 Programmes for upgrading employee skills and transition assistance programmes
72, 76
Economic Contributions
103-1 Explanation of the material topic and its Boundary
78
103-2 The management approach and its components
78
103-3 Evaluation of the management approach 58
201-1 Direct economic value generated and distributed
Financial Statement, 134–282, 78
204-1 Proportion of spending on local suppliers 78
Community Development
103-1 Explanation of the material topic and its Boundary
79
103-2 The management approach and its components
79
103-3 Evaluation of the management approach 58
Non-GRI Number of beneficiaries supported 79
Non-GRI Number of volunteering hours 79
Environmental Footprint
103-1 Explanation of the material topic and its Boundary
80
103-2 The management approach and its components
80–81
103-3 Evaluation of the management approach 58
302-1 Energy consumption within the organisation 81
302-3 Energy intensity 81
303-5 Water consumption 81
305-2 Energy indirect (Scope 2) GHG emissions 81
305-4 GHG emissions intensity 81
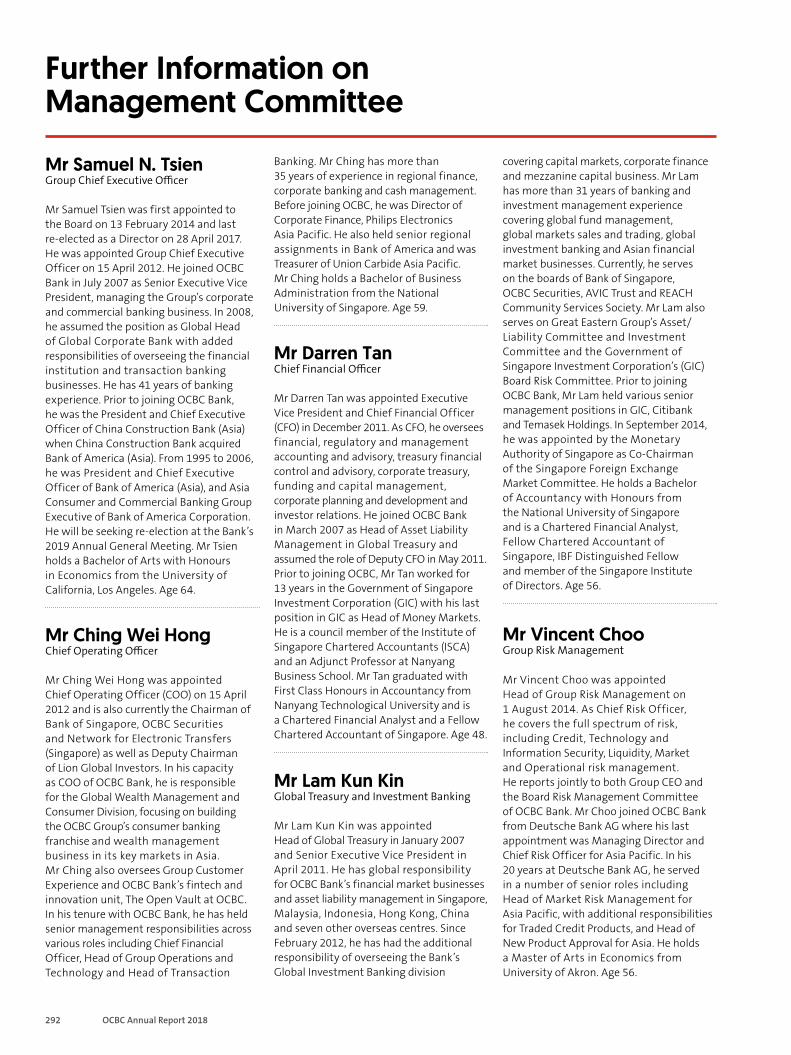
292 OCBC Annual Report 2018
Further Information on Management Committee
Mr Samuel N. Tsien Group Chief Executive Officer
Mr Samuel Tsien was first appointed to the Board on 13 February 2014 and last re-elected as a Director on 28 April 2017. He was appointed Group Chief Executive Officer on 15 April 2012. He joined OCBC Bank in July 2007 as Senior Executive Vice President, managing the Group’s corporate and commercial banking business. In 2008, he assumed the position as Global Head of Global Corporate Bank with added responsibilities of overseeing the financial institution and transaction banking businesses. He has 41 years of banking experience. Prior to joining OCBC Bank, he was the President and Chief Executive Officer of China Construction Bank (Asia) when China Construction Bank acquired Bank of America (Asia). From 1995 to 2006, he was President and Chief Executive Officer of Bank of America (Asia), and Asia Consumer and Commercial Banking Group Executive of Bank of America Corporation. He will be seeking re-election at the Bank’s 2019 Annual General Meeting. Mr Tsien holds a Bachelor of Arts with Honours in Economics from the University of California, Los Angeles. Age 64.
Mr Ching Wei Hong Chief Operating Officer
Mr Ching Wei Hong was appointed Chief Operating Officer (COO) on 15 April 2012 and is also currently the Chairman of Bank of Singapore, OCBC Securities and Network for Electronic Transfers (Singapore) as well as Deputy Chairman of Lion Global Investors. In his capacity as COO of OCBC Bank, he is responsible for the Global Wealth Management and Consumer Division, focusing on building the OCBC Group’s consumer banking franchise and wealth management business in its key markets in Asia. Mr Ching also oversees Group Customer Experience and OCBC Bank’s fintech and innovation unit, The Open Vault at OCBC. In his tenure with OCBC Bank, he has held senior management responsibilities across various roles including Chief Financial Officer, Head of Group Operations and Technology and Head of Transaction
Banking. Mr Ching has more than 35 years of experience in regional finance, corporate banking and cash management. Before joining OCBC, he was Director of Corporate Finance, Philips Electronics Asia Pacific. He also held senior regional assignments in Bank of America and was Treasurer of Union Carbide Asia Pacific. Mr Ching holds a Bachelor of Business Administration from the National University of Singapore. Age 59.
Mr Darren Tan Chief Financial Officer
Mr Darren Tan was appointed Executive Vice President and Chief Financial Officer (CFO) in December 2011. As CFO, he oversees financial, regulatory and management accounting and advisory, treasury financial control and advisory, corporate treasury, funding and capital management, corporate planning and development and investor relations. He joined OCBC Bank in March 2007 as Head of Asset Liability Management in Global Treasury and assumed the role of Deputy CFO in May 2011. Prior to joining OCBC, Mr Tan worked for 13 years in the Government of Singapore Investment Corporation (GIC) with his last position in GIC as Head of Money Markets. He is a council member of the Institute of Singapore Chartered Accountants (ISCA) and an Adjunct Professor at Nanyang Business School. Mr Tan graduated with First Class Honours in Accountancy from Nanyang Technological University and is a Chartered Financial Analyst and a Fellow Chartered Accountant of Singapore. Age 48.
Mr Lam Kun Kin Global Treasury and Investment Banking
Mr Lam Kun Kin was appointed Head of Global Treasury in January 2007 and Senior Executive Vice President in April 2011. He has global responsibility for OCBC Bank’s financial market businesses and asset liability management in Singapore, Malaysia, Indonesia, Hong Kong, China and seven other overseas centres. Since February 2012, he has had the additional responsibility of overseeing the Bank’s Global Investment Banking division
covering capital markets, corporate finance and mezzanine capital business. Mr Lam has more than 31 years of banking and investment management experience covering global fund management, global markets sales and trading, global investment banking and Asian financial market businesses. Currently, he serves on the boards of Bank of Singapore, OCBC Securities, AVIC Trust and REACH Community Services Society. Mr Lam also serves on Great Eastern Group’s Asset/Liability Committee and Investment Committee and the Government of Singapore Investment Corporation’s (GIC) Board Risk Committee. Prior to joining OCBC Bank, Mr Lam held various senior management positions in GIC, Citibank and Temasek Holdings. In September 2014, he was appointed by the Monetary Authority of Singapore as Co-Chairman of the Singapore Foreign Exchange Market Committee. He holds a Bachelor of Accountancy with Honours from the National University of Singapore and is a Chartered Financial Analyst, Fellow Chartered Accountant of Singapore, IBF Distinguished Fellow and member of the Singapore Institute of Directors. Age 56.
Mr Vincent Choo Group Risk Management
Mr Vincent Choo was appointed Head of Group Risk Management on 1 August 2014. As Chief Risk Officer, he covers the full spectrum of risk, including Credit, Technology and Information Security, Liquidity, Market and Operational risk management. He reports jointly to both Group CEO and the Board Risk Management Committee of OCBC Bank. Mr Choo joined OCBC Bank from Deutsche Bank AG where his last appointment was Managing Director and Chief Risk Officer for Asia Pacific. In his 20 years at Deutsche Bank AG, he served in a number of senior roles including Head of Market Risk Management for Asia Pacific, with additional responsibilities for Traded Credit Products, and Head of New Product Approval for Asia. He holds a Master of Arts in Economics from University of Akron. Age 56.

Additional Information 293
Mr Linus Goh Global Commercial Banking
Mr Linus Goh was appointed the Head of Global Commercial Banking in April 2012. In this capacity, he has global responsibility for OCBC Bank’s commercial, institutional and transaction banking businesses. He joined OCBC Bank in April 2004 as Executive Vice President and Head of International, and in August 2008, he assumed responsibility for Global Enterprise Banking and Financial Institutions. Mr Goh has over 30 years of banking experience, including 17 years at Citibank, N.A. Singapore, where he held several senior management positions overseeing corporate banking, financial institutions, e-business and transaction banking. Mr Goh serves as a board member of the Singapore Totalisator Board and of Seeds Capital Private Limited under Enterprise Singapore. He is a member of the Pro-Enterprise Panel under the Ministry of Trade and Industry and the SME Committee under the Singapore Business Federation where he chairs the sub-committee on SME Financing and Cost Competitiveness. Mr Goh holds a Bachelor of Arts (Philosophy) with Honours from the National University of Singapore and is an IBF Distinguished Fellow. Age 56.
Ms Elaine Lam Global Corporate Banking
Ms Elaine Lam was appointed Head of Global Corporate Banking in April 2016. She is responsible for OCBC Bank’s corporate banking business which spans Real Estate, Wholesale Corporate Marketing, Global Commodities Finance as well as the Bank’s corporate banking business in all overseas offices. With more than 20 years of experience in corporate banking, Ms Lam also serves in the Institute of Banking and Finance’s Corporate Banking Workgroup and the Financial Industry Competency Standards’ Corporate Banking Working Group. Ms Lam holds a Bachelor of Accountancy (Honours) from the Nanyang Technological University and is an IBF Fellow (Corporate Banking). Age 47.
Mr Jason Ho Group Human Resources
Mr Jason Ho joined OCBC Bank in January 2013 as Head of Asset Liability Management. He assumed the role of Head of Group Human Resources in July 2015, following his appointment as Deputy Head, effective January 2015. He has more than 30 years of banking experience and has held senior-level positions at KBC Bank, Standard Chartered Bank and Volvo Group Treasury Asia Limited. Mr Ho holds a Bachelor of Business Administration from the National University of Singapore and a Masters in Applied Finance from Macquarie University. He also serves as a Director of the Institute for Human Resource Professionals and is a member of The Institute of Banking & Finance Future-Enabled Skills Workgroup. Age 56.
Mr Lim Khiang Tong Group Operations and Technology
Mr Lim Khiang Tong joined OCBC Bank in September 2000 and took on the role of Head of IT Management in January 2002. He was appointed Executive Vice President and Head of Group Information Technology in December 2007. In May 2010, he assumed the role of Head of Group Operations and Technology. He has more than 28 years of management experience in strategic technology development, information technology and banking operations. This includes driving regional processing operations, strategic technology initiatives and project management. Since August 2016, he has also assumed oversight of the bank’s Quality & Service Excellence and Group Property Management divisions. He holds a Bachelor of Science (Computer Science & Economics) from the National University of Singapore. Age 58.
Mr Dennis Tan Consumer Financial Services Singapore
Mr Dennis Tan was appointed Head of Consumer Financial Services Singapore in November 2012 and Executive Vice
President in April 2013. He oversees OCBC Bank’s consumer banking business in Singapore. Mr Tan joined OCBC Bank in September 2009 as the Head of Branch and Group Premier Banking. Prior to OCBC Bank, he spent 16 years at Citibank Singapore, where he last held the position of Managing Director, Sales and Distribution Head of its Global Consumer Banking division. Mr Tan holds a Bachelor of Science in Business (Honours with Distinction) from Indiana University in the United States of America. Age 50.
Mr Gan Kok Kim Global Investment Banking
Mr Gan Kok Kim was appointed Executive Vice President and Head of Global Investment Banking in February 2012. As the Head of Global Investment Banking, he oversees OCBC Bank’s debt capital markets, corporate finance, merger and acquisition and mezzanine investment businesses. Mr Gan joined OCBC Bank in 2004 as the Head of Treasury at OCBC Bank (Malaysia). In February 2011, he was also appointed Head of International Treasury. In August 2011, he was given the additional role of Head of Asset Liability Management in Singapore and gave up his Malaysian role. Mr Gan has more than 28 years of trading and management experience and has held various positions in Citibank N.A. He holds a Bachelor of Science in Economics from the Massachusetts Institute of Technology. Age 53.
Mr Tan Chor Sen Global Enterprise Banking – International
Mr Tan Chor Sen was appointed the Head of Global Enterprise Banking-International in 2012. In addition to overseeing the growth of the emerging business segment in OCBC Bank’s core markets, he is also in charge of developing cross-border capabilities and business within the region, leveraging the OCBC network and partner banks in the key markets. Mr Tan joined OCBC Bank in 2005 as Head of Emerging Business. He serves as a member of the Capital Markets Workgroup under the Monetary Authority of Singapore.
294 OCBC Annual Report 2018
Further Information on Management Committee
He is a council member of the Singapore-Shandong Business Council and Singapore-Tianjin Economic and Trade Council under Enterprise Singapore. Mr Tan has over 30 years of banking experience where he began his career in Commercial Banking, with postings in Consumer Banking. He later held several positions in Corporate and Offshore Banking. Mr Tan holds a Bachelor of Business Administration from the National University of Singapore and is an IBF Fellow (Corporate Banking). Age 55.
Ms Parwati Surjaudaja President Director and CEO, Bank OCBC NISP
Ms Parwati Surjaudaja was appointed the President Director and CEO of Bank OCBC NISP in December 2008. She joined Bank OCBC NISP as a Director in 1990 and served as a Deputy President Director from 1997. She was appointed President Director and CEO of the bank at end-2008 and was re-elected in 2011, 2014 and 2017 for her current position. She is currently a Board Member of Perbanas and Indonesian Bankers Association. Prior to joining Bank OCBC NISP, Ms Surjaudaja had three years of corporate experience with SGV Utomo – Arthur Andersen. Ms Surjaudaja holds a Master of Business Administration (Accounting) and a Bachelor of Science Cum Laude (Accounting and Finance) from San Francisco State University. Age 54.
Mr Ong Eng Bin CEO, OCBC Bank Malaysia
Mr Ong Eng Bin was appointed Chief Executive Officer of OCBC Malaysia in August 2014 and currently oversees the OCBC Group’s Malaysian franchise. Prior to this appointment, he was its Head of Business Banking, a role he assumed in 2012 with responsibilities covering corporate and commercial, emerging business and transaction banking. He joined the bank as a management trainee in 1988 and was appointed Head of Corporate Banking & Large Corporates in 2000. Mr Ong holds a Bachelor of Accounting & Finance from the University of Manchester. Age 55.
Mr Bahren Shaari CEO, Bank of Singapore
Mr Bahren Shaari was appointed Chief Executive Officer of Bank of Singapore in February 2015. Mr Bahren joined ING Asia Private Bank in 2009 and was a member of the management team that continued to lead after it was acquired by OCBC Bank in 2010 and renamed Bank of Singapore. He was Global Head of Southeast Asia for five years before taking over as CEO. Prior to that, he was a Managing Director at UBS Wealth Management. Mr Bahren is an executive committee member of Singapore’s Private Banking Industry Group which shapes the private banking competency standards. He has been a non-executive and independent director of Singapore Press Holdings since April 2012. Mr Bahren is an alternate member of the Council of Presidential Advisers. He is an IBF Distinguished Fellow and holds a Bachelor of Accountancy degree from the National University of Singapore. Age 56.
Mr Na Wu Beng CEO, OCBC Wing Hang Bank
Mr Na Wu Beng was appointed Chief Executive Officer of OCBC Wing Hang Bank in August 2014. Prior to this appointment, he was Deputy President Director of Bank OCBC NISP for 10 years. There, he was instrumental in driving the corporate banking business and spearheading the collaborative efforts between OCBC Bank and Bank OCBC NISP across different business functions. Mr Na joined OCBC Bank in 1990 as the General Manager of OCBC Bank’s Hong Kong branches. He returned to Singapore in 1999 to take on the role of Head of North Asia overseeing the bank’s operations in Hong Kong, China, Taiwan, Korea and Japan. From 2000 to 2004, before his posting to Bank OCBC NISP, he headed OCBC Bank’s international banking division and was responsible for branches across eight countries. Mr Na was appointed Executive Vice President in 2001. Before joining OCBC Bank, he was at International Bank of Singapore for 11 years, where he was based in Taiwan for seven years. He holds a Bachelor of Arts (Economics) with Honours from Coventry University in the United Kingdom. Age 63.
Ms Kng Hwee Tin CEO, OCBC Wing Hang Bank (China)
Ms Kng Hwee Tin was appointed Executive Director and Chief Executive Officer of OCBC Bank (China) Limited in December 2012, responsible for the bank’s growth strategy in China. The bank was rebranded OCBC Wing Hang Bank (China) Limited in July 2016. Ms Kng has more than 20 years of banking experience spanning a wide spectrum of activities. Prior to this appointment, she was OCBC Bank’s Head of Group Audit overseeing the full spectrum of audit activities for the Bank and its subsidiaries. During her tenure with OCBC Bank, she also held responsibilities in risk management and implemented several key initiatives to further strengthen board governance. She was also instrumental in driving and establishing the Bank’s thrust into serving the wealth needs of the affluent with the OCBC Premier Banking proposition. Ms Kng holds a Master of Business Administration from the National University of Singapore, where she was awarded the Saw Gold Medal in Finance. She completed her Advanced Management Program with Harvard Business School. Age 53.
Mr Tan Wing Ming Regional General Manager for North East Asia
Mr Tan Wing Ming was appointed Regional General Manager of North East Asia and the Chief Executive of OCBC Bank Hong Kong branch since September 2009. In this role, he assumes oversight of the bank’s branches in Hong Kong, Japan, Korea and Taiwan. In November 2016, he was promoted to Executive Vice President. Mr Tan joined OCBC Bank in January 2005 as Senior Vice President and Country Head of OCBC Bank’s operations in China. Following the local incorporation of OCBC Bank in China in July 2007, he was appointed Director and President of OCBC Bank (China) Limited until his current role. Mr Tan had worked for major American and European investment and commercial banks in Singapore for 10 years. He then started and managed his own private business in China for 11 years before joining OCBC Bank. Mr Tan holds a

Additional Information 295
Bachelor of Arts (Economics) with Honours from Georgetown University and a Master of Business Administration (Finance) from the University of Chicago. Age 59.
Ms Goh Chin Yee Group Audit
Ms Goh Chin Yee was appointed Head of Group Audit in March 2013 and Executive Vice President in April 2014. She oversees the full spectrum of internal audit activities for OCBC Bank and its subsidiaries. She reports directly to the Audit Committee and administratively to the Group CEO. Prior to this appointment, Ms Goh has worked in diverse functions in OCBC Group, covering strategic management, investment research, fund management, finance, risk management and treasury business management. Ms Goh holds a Bachelor of Engineering (Civil) with First Class Honours from the National University of Singapore and is a Chartered Financial Analyst. Age 54.
Ms Loretta Yuen Group Legal and Regulatory Compliance
Ms Loretta Yuen was appointed General Counsel and Head of Group Legal and Regulatory Compliance in September 2010 and Executive Vice President in June 2015. She oversees the full spectrum of legal and regulatory risks, including anti-money laundering, across OCBC Bank and its subsidiaries, and provides advice on regulatory risks and legal issues involved in decisions to management, so that management can make informed strategic choices within an acceptable legal and regulatory risk profile. Ms Yuen has over 18 years of legal and regulatory experience in banking and finance. She graduated with Second Class Honours in Law from the National University of Singapore and is an IBF Distinguished Fellow. Age 44.
Mr Melvyn Low Global Transaction Banking
Mr Melvyn Low is an industry veteran with more than 25 years of experience and has held senior positions in sales and product
management, transaction services, cash management, trade, and securities and fund services, including spending 18 years with Citibank N.A., where he was the ASEAN Head of Treasury and Trade Solutions. Mr Low also served as Director of the Singapore Clearing House Association from 2010 to 2013, where he was a key contributor to the G3 (Fast and Secure Transfers or FAST) platform. In conjunction with the National University of Singapore (NUS) Business School, he developed the world’s first full-credit course on transaction banking for undergraduates in 2012. Mr Low is an IBF Distinguished Fellow and holds a Master of Business Administration from the University of British Columbia, Canada. Age 52.
Mr Vincent Soh Group Property Management
Mr Vincent Soh was appointed Head, Group Property Management, and Managing Director of OCBC Property Services Pte Ltd, a wholly-owned subsidiary of OCBC Bank, in June 2004. He is responsible for managing the Group’s real estate portfolio. He has held senior-level positions in the public and private sectors. Mr Soh holds a Master of Science (Property & Maintenance Management) and Master of Public Policy, both from the National University of Singapore. He is also an Associate Member of the Royal Institution of Chartered Surveyors in the United Kingdom. Age 62.
Mr Peter Yeoh Group Secretariat
Mr Peter Yeoh joined OCBC Bank in January 1984. Since joining the Bank, he has held responsibilities in finance, accounting, management information services and strategic projects. He was appointed Company Secretary in August 2002, a role including responsibilities for corporate governance and board affairs. He holds a Bachelor of Commerce from the University of Western Australia, and he is a Member of the Institute of Chartered Accountants in Australia and Institute of Singapore Chartered Accountants. Age 64.
Ms Koh Ching Ching Group Brand and Communications
As the Head of Group Brand and Communications, Ms Koh Ching Ching oversees OCBC Bank’s branding and communications initiatives with the media, employees, customers, shareholders and the general public across its core markets. She has been heading the division since November 2004 and was appointed Executive Vice President in March 2012. Prior to her current role, she led OCBC Bank’s franchise expansion efforts in trade finance in Malaysia. Ms Koh had 16 years of corporate and retail banking experience, having held various senior customer and product positions in local and foreign financial institutions. She graduated with First Class Honours in Business Administration from the National University of Singapore. Age 50.
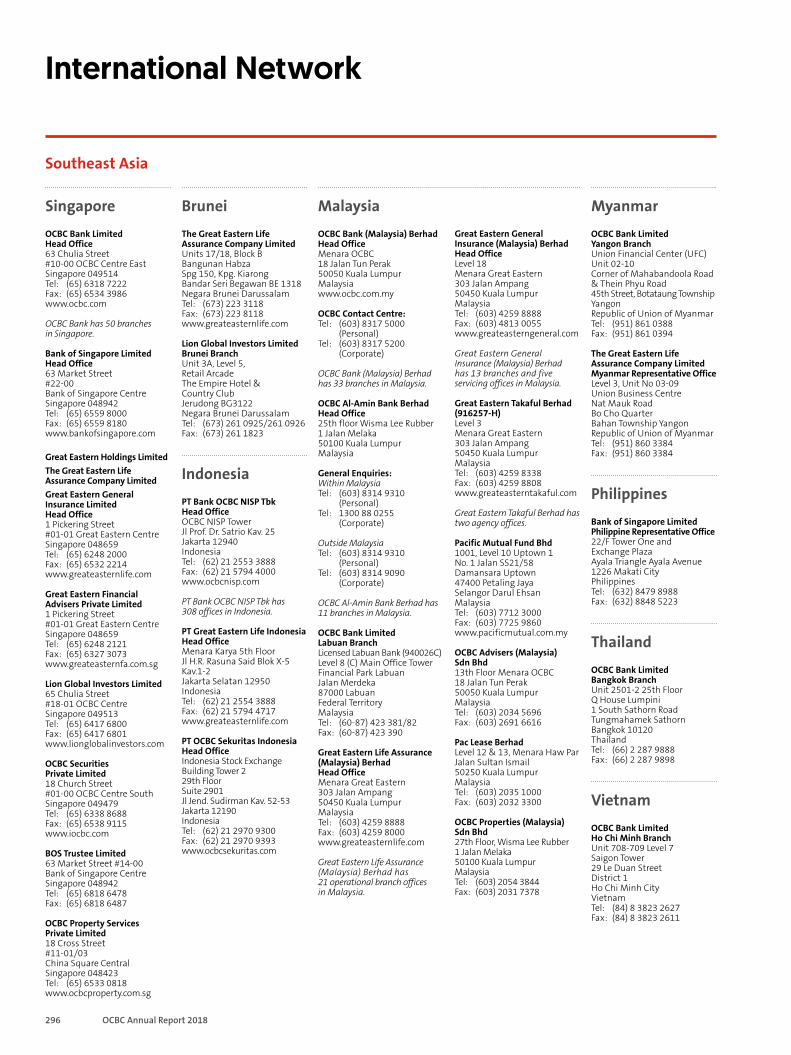
296 OCBC Annual Report 2018
International Network
Southeast Asia
OCBC Bank Limited Head Office 63 Chulia Street #10-00 OCBC Centre East Singapore 049514 Tel: (65) 6318 7222 Fax: (65) 6534 3986 www.ocbc.com
OCBC Bank has 50 branches in Singapore.
Bank of Singapore Limited Head Office 63 Market Street #22-00 Bank of Singapore Centre Singapore 048942 Tel: (65) 6559 8000 Fax: (65) 6559 8180 www.bankofsingapore.com
Great Eastern Holdings Limited The Great Eastern Life Assurance Company Limited Great Eastern General Insurance Limited Head Office 1 Pickering Street #01-01 Great Eastern Centre Singapore 048659 Tel: (65) 6248 2000 Fax: (65) 6532 2214 www.greateasternlife.com
Great Eastern Financial Advisers Private Limited 1 Pickering Street #01-01 Great Eastern Centre Singapore 048659 Tel: (65) 6248 2121 Fax: (65) 6327 3073 www.greateasternfa.com.sg
Lion Global Investors Limited 65 Chulia Street #18-01 OCBC Centre Singapore 049513 Tel: (65) 6417 6800 Fax: (65) 6417 6801 www.lionglobalinvestors.com
OCBC Securities Private Limited 18 Church Street #01-00 OCBC Centre South Singapore 049479 Tel: (65) 6338 8688 Fax: (65) 6538 9115 www.iocbc.com
BOS Trustee Limited 63 Market Street #14-00 Bank of Singapore Centre Singapore 048942 Tel: (65) 6818 6478 Fax: (65) 6818 6487
OCBC Property Services Private Limited 18 Cross Street #11-01/03 China Square Central Singapore 048423 Tel: (65) 6533 0818 www.ocbcproperty.com.sg
Singapore The Great Eastern Life Assurance Company Limited Units 17/18, Block B Bangunan Habza Spg 150, Kpg. Kiarong Bandar Seri Begawan BE 1318 Negara Brunei Darussalam Tel: (673) 223 3118 Fax: (673) 223 8118 www.greateasternlife.com
Lion Global Investors Limited Brunei Branch Unit 3A, Level 5, Retail Arcade The Empire Hotel & Country Club Jerudong BG3122 Negara Brunei Darussalam Tel: (673) 261 0925/261 0926 Fax: (673) 261 1823
Brunei
PT Bank OCBC NISP Tbk Head Office OCBC NISP Tower Jl Prof. Dr. Satrio Kav. 25 Jakarta 12940 Indonesia Tel: (62) 21 2553 3888 Fax: (62) 21 5794 4000 www.ocbcnisp.com
PT Bank OCBC NISP Tbk has 308 offices in Indonesia.
PT Great Eastern Life Indonesia Head Office Menara Karya 5th Floor Jl H.R. Rasuna Said Blok X-5 Kav.1-2 Jakarta Selatan 12950 Indonesia Tel: (62) 21 2554 3888 Fax: (62) 21 5794 4717 www.greateasternlife.com
PT OCBC Sekuritas Indonesia Head Office Indonesia Stock Exchange Building Tower 2 29th Floor Suite 2901 Jl Jend. Sudirman Kav. 52-53 Jakarta 12190 Indonesia Tel: (62) 21 2970 9300 Fax: (62) 21 2970 9393 www.ocbcsekuritas.com
Indonesia
Malaysia OCBC Bank (Malaysia) Berhad Head Office Menara OCBC 18 Jalan Tun Perak 50050 Kuala Lumpur Malaysia www.ocbc.com.my
OCBC Contact Centre: Tel: (603) 8317 5000
(Personal) Tel: (603) 8317 5200
(Corporate)
OCBC Bank (Malaysia) Berhad has 33 branches in Malaysia.
OCBC Al-Amin Bank Berhad Head Office 25th floor Wisma Lee Rubber 1 Jalan Melaka 50100 Kuala Lumpur Malaysia
General Enquiries: Within Malaysia Tel: (603) 8314 9310
(Personal) Tel: 1300 88 0255
(Corporate)
Outside Malaysia Tel: (603) 8314 9310
(Personal) Tel: (603) 8314 9090
(Corporate)
OCBC Al-Amin Bank Berhad has 11 branches in Malaysia.
OCBC Bank Limited Labuan Branch Licensed Labuan Bank (940026C) Level 8 (C) Main Office Tower Financial Park Labuan Jalan Merdeka 87000 Labuan Federal Territory Malaysia Tel: (60-87) 423 381/82 Fax: (60-87) 423 390
Great Eastern Life Assurance (Malaysia) Berhad Head Office Menara Great Eastern 303 Jalan Ampang 50450 Kuala Lumpur Malaysia Tel: (603) 4259 8888 Fax: (603) 4259 8000 www.greateasternlife.com
Great Eastern Life Assurance (Malaysia) Berhad has 21 operational branch offices in Malaysia.
Great Eastern General Insurance (Malaysia) Berhad Head Office Level 18 Menara Great Eastern 303 Jalan Ampang 50450 Kuala Lumpur Malaysia Tel: (603) 4259 8888 Fax: (603) 4813 0055 www.greateasterngeneral.com
Great Eastern General Insurance (Malaysia) Berhad has 13 branches and five servicing offices in Malaysia.
Great Eastern Takaful Berhad (916257-H) Level 3 Menara Great Eastern 303 Jalan Ampang 50450 Kuala Lumpur Malaysia Tel: (603) 4259 8338 Fax: (603) 4259 8808 www.greateasterntakaful.com
Great Eastern Takaful Berhad has two agency offices.
Pacific Mutual Fund Bhd 1001, Level 10 Uptown 1 No. 1 Jalan SS21/58 Damansara Uptown 47400 Petaling Jaya Selangor Darul Ehsan Malaysia Tel: (603) 7712 3000 Fax: (603) 7725 9860 www.pacificmutual.com.my
OCBC Advisers (Malaysia) Sdn Bhd 13th Floor Menara OCBC 18 Jalan Tun Perak 50050 Kuala Lumpur Malaysia Tel: (603) 2034 5696 Fax: (603) 2691 6616
Pac Lease Berhad Level 12 & 13, Menara Haw Par Jalan Sultan Ismail 50250 Kuala Lumpur Malaysia Tel: (603) 2035 1000 Fax: (603) 2032 3300
OCBC Properties (Malaysia) Sdn Bhd 27th Floor, Wisma Lee Rubber 1 Jalan Melaka 50100 Kuala Lumpur Malaysia Tel: (603) 2054 3844 Fax: (603) 2031 7378
OCBC Bank Limited Yangon Branch Union Financial Center (UFC) Unit 02-10 Corner of Mahabandoola Road & Thein Phyu Road 45th Street, Botataung Township Yangon Republic of Union of Myanmar Tel: (951) 861 0388 Fax: (951) 861 0394
The Great Eastern Life Assurance Company Limited Myanmar Representative Office Level 3, Unit No 03-09 Union Business Centre Nat Mauk Road Bo Cho Quarter Bahan Township Yangon Republic of Union of Myanmar Tel: (951) 860 3384 Fax: (951) 860 3384
Myanmar
Bank of Singapore Limited Philippine Representative Office 22/F Tower One and Exchange Plaza Ayala Triangle Ayala Avenue 1226 Makati City Philippines Tel: (632) 8479 8988 Fax: (632) 8848 5223
Philippines
OCBC Bank Limited Bangkok Branch Unit 2501-2 25th Floor Q House Lumpini 1 South Sathorn Road Tungmahamek Sathorn Bangkok 10120 Thailand Tel: (66) 2 287 9888 Fax: (66) 2 287 9898
Thailand
OCBC Bank Limited Ho Chi Minh Branch Unit 708-709 Level 7 Saigon Tower 29 Le Duan Street District 1 Ho Chi Minh City Vietnam Tel: (84) 8 3823 2627 Fax: (84) 8 3823 2611
Vietnam
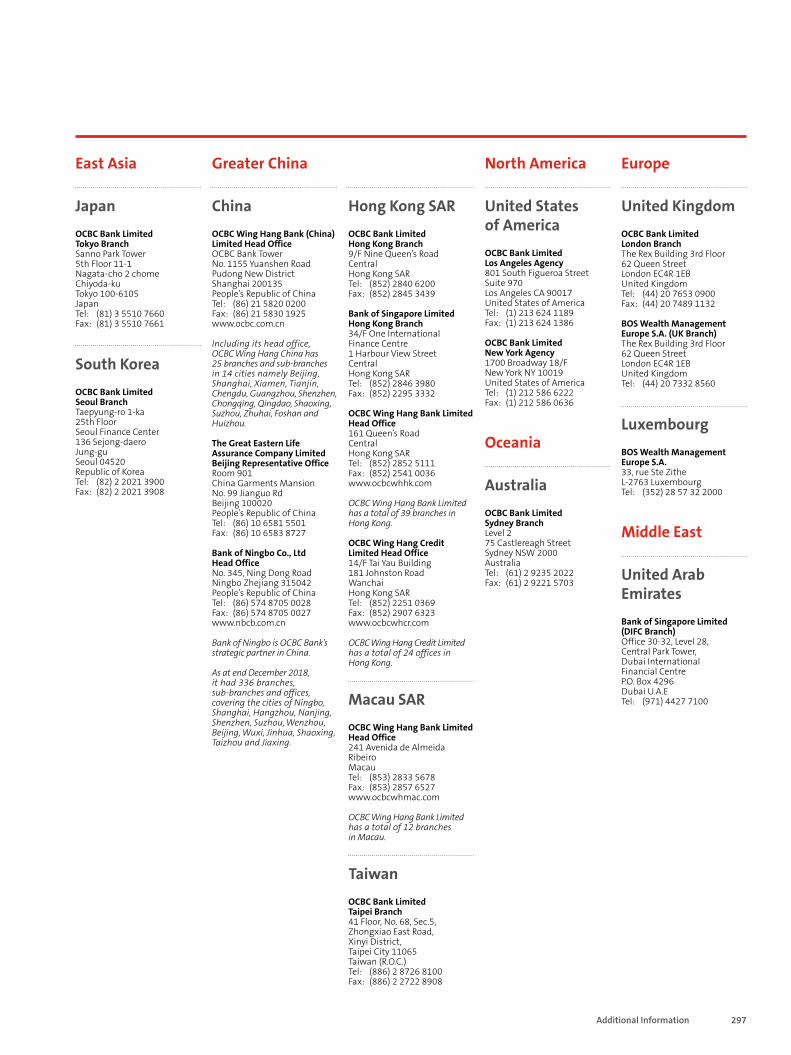
Additional Information 297
East Asia
OCBC Bank Limited Tokyo Branch Sanno Park Tower 5th Floor 11-1 Nagata-cho 2 chome Chiyoda-ku Tokyo 100-6105 Japan Tel: (81) 3 5510 7660 Fax: (81) 3 5510 7661
Japan
OCBC Bank Limited Seoul Branch Taepyung-ro 1-ka 25th Floor Seoul Finance Center 136 Sejong-daero Jung-gu Seoul 04520 Republic of Korea Tel: (82) 2 2021 3900 Fax: (82) 2 2021 3908
South Korea
Greater China
OCBC Wing Hang Bank (China) Limited Head Office OCBC Bank Tower No. 1155 Yuanshen Road Pudong New District Shanghai 200135 People’s Republic of China Tel: (86) 21 5820 0200 Fax: (86) 21 5830 1925 www.ocbc.com.cn
Including its head office, OCBC Wing Hang China has 25 branches and sub-branches in 14 cities namely Beijing, Shanghai, Xiamen, Tianjin, Chengdu, Guangzhou, Shenzhen, Chongqing, Qingdao, Shaoxing, Suzhou, Zhuhai, Foshan and Huizhou.
The Great Eastern Life Assurance Company Limited Beijing Representative Office Room 901 China Garments Mansion No. 99 Jianguo Rd Beijing 100020 People’s Republic of China Tel: (86) 10 6581 5501 Fax: (86) 10 6583 8727
Bank of Ningbo Co., Ltd Head Office No. 345, Ning Dong Road Ningbo Zhejiang 315042 People’s Republic of China Tel: (86) 574 8705 0028 Fax: (86) 574 8705 0027 www.nbcb.com.cn
Bank of Ningbo is OCBC Bank’s strategic partner in China.
As at end December 2018, it had 336 branches, sub-branches and offices, covering the cities of Ningbo, Shanghai, Hangzhou, Nanjing, Shenzhen, Suzhou, Wenzhou, Beijing, Wuxi, Jinhua, Shaoxing, Taizhou and Jiaxing.
China OCBC Bank Limited Hong Kong Branch 9/F Nine Queen’s Road Central Hong Kong SAR Tel: (852) 2840 6200 Fax: (852) 2845 3439
Bank of Singapore Limited Hong Kong Branch 34/F One International Finance Centre 1 Harbour View Street Central Hong Kong SAR Tel: (852) 2846 3980 Fax: (852) 2295 3332
OCBC Wing Hang Bank Limited Head Office 161 Queen’s Road Central Hong Kong SAR Tel: (852) 2852 5111 Fax: (852) 2541 0036 www.ocbcwhhk.com
OCBC Wing Hang Bank Limited has a total of 39 branches in Hong Kong.
OCBC Wing Hang Credit Limited Head Office 14/F Tai Yau Building 181 Johnston Road Wanchai Hong Kong SAR Tel: (852) 2251 0369 Fax: (852) 2907 6323 www.ocbcwhcr.com
OCBC Wing Hang Credit Limited has a total of 24 offices in Hong Kong.
Hong Kong SAR
Taiwan OCBC Bank Limited Taipei Branch 41 Floor, No. 68, Sec.5, Zhongxiao East Road, Xinyi District,Taipei City 11065 Taiwan (R.O.C.) Tel: (886) 2 8726 8100 Fax: (886) 2 2722 8908
OCBC Wing Hang Bank Limited Head Office 241 Avenida de Almeida Ribeiro Macau Tel: (853) 2833 5678 Fax: (853) 2857 6527 www.ocbcwhmac.com
OCBC Wing Hang Bank Limited has a total of 12 branches in Macau.
Macau SAR
North America
United States of America OCBC Bank Limited Los Angeles Agency 801 South Figueroa Street Suite 970 Los Angeles CA 90017 United States of America Tel: (1) 213 624 1189 Fax: (1) 213 624 1386
OCBC Bank Limited New York Agency 1700 Broadway 18/F New York NY 10019 United States of America Tel: (1) 212 586 6222 Fax: (1) 212 586 0636
Oceania
Australia OCBC Bank Limited Sydney Branch Level 2 75 Castlereagh Street Sydney NSW 2000 Australia Tel: (61) 2 9235 2022 Fax: (61) 2 9221 5703
Europe
OCBC Bank Limited London Branch The Rex Building 3rd Floor 62 Queen Street London EC4R 1EB United Kingdom Tel: (44) 20 7653 0900 Fax: (44) 20 7489 1132
BOS Wealth Management Europe S.A. (UK Branch)The Rex Building 3rd Floor 62 Queen Street London EC4R 1EB United Kingdom Tel: (44) 20 7332 8560
United Kingdom
Middle East
Bank of Singapore Limited (DIFC Branch) Office 30-32, Level 28, Central Park Tower, Dubai International Financial Centre P.O. Box 4296 Dubai U.A.E Tel: (971) 4427 7100
United Arab Emirates
BOS Wealth Management Europe S.A. 33, rue Ste Zithe L-2763 Luxembourg Tel: (352) 28 57 32 2000
Luxembourg
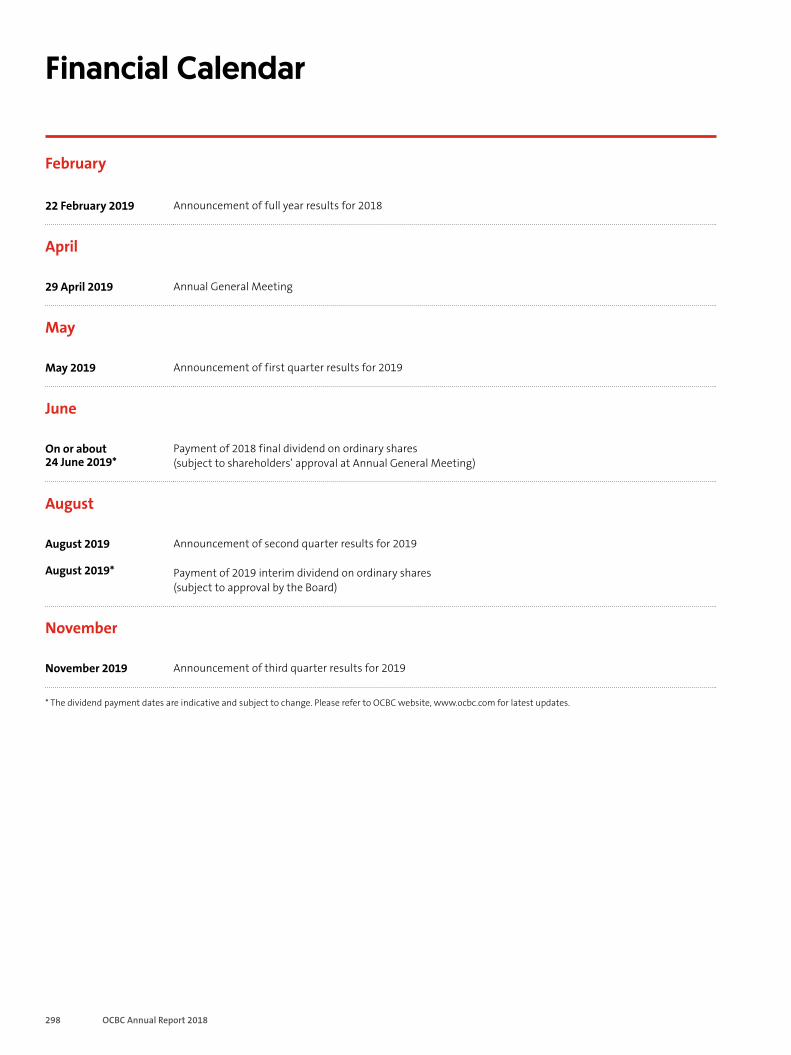
298 OCBC Annual Report 2018
Financial Calendar
February
22 February 2019 Announcement of full year results for 2018
April
29 April 2019 Annual General Meeting
May
May 2019 Announcement of first quarter results for 2019
June
On or about 24 June 2019*
Payment of 2018 final dividend on ordinary shares (subject to shareholders’ approval at Annual General Meeting)
August
August 2019
August 2019*
Announcement of second quarter results for 2019
Payment of 2019 interim dividend on ordinary shares (subject to approval by the Board)
November
November 2019 Announcement of third quarter results for 2019
* The dividend payment dates are indicative and subject to change. Please refer to OCBC website, www.ocbc.com for latest updates.

Additional Information 299
Notice of Annual General Meeting Oversea-Chinese Banking Corporation Limited (Incorporated in Singapore) (Company Reg. No: 193200032W)
NOTICE IS HEREBY GIVEN that the Eighty-Second Annual General Meeting of Oversea-Chinese Banking Corporation Limited (the Bank) will be held at Sands Expo & Convention Centre, Level 4, Roselle and Simpor Ballrooms, 10 Bayfront Avenue, Singapore 018956, on Monday, 29 April 2019 at 2.30 p.m. to transact the following business:
As Routine Business
1 To receive and consider the Directors’ statement and audited financial statements for the financial year ended 31 December 2018 and the report of the Auditors thereon.
2 To re-elect the following Directors retiring by rotation:
(a) Ms Christina Hon Kwee Fong (Christina Ong)
(b) Mr Quah Wee Ghee
(c) Mr Samuel N. Tsien
(d) Mr Tan Ngiap Joo
3 To approve a final one-tier tax exempt dividend of 23 cents per ordinary share, in respect of the financial year ended 31 December 2018.
4 To approve the remuneration of the non-executive Directors of the Bank for the financial year ended 31 December 2018 comprising the following:
(a) Directors’ fees of S$3,070,000 (2017: S$2,979,000).
(b) 6,000 ordinary shares of the Bank for each non-executive Director of the Bank for the financial year ended 31 December 2018 (2017: 6,000 ordinary shares), and for this purpose to pass the following Resolution with or without amendments as an Ordinary Resolution:
That:
(i) pursuant to Article 143 of the Constitution of the Bank, the Directors of the Bank be and are hereby authorised to allot and issue an aggregate of 54,000 ordinary shares of the Bank (the Remuneration Shares) as bonus shares for which no consideration is payable, to The Central Depository (Pte) Limited for the account of:
(1) Mr Ooi Sang Kuang (or for the account of such depository agent as he may direct) in respect of 6,000 Remuneration Shares;
(2) Ms Christina Hon Kwee Fong (Christina Ong) (or for the account of such depository agent as she may direct) in respect of 6,000 Remuneration Shares;
(3) Mr Chua Kim Chiu (or for the account of such depository agent as he may direct) in respect of 6,000 Remuneration Shares;
(4) Mr Lai Teck Poh (or for the account of such depository agent as he may direct) in respect of 6,000 Remuneration Shares;
(5) Dr Lee Tih Shih (or for the account of such depository agent as he may direct) in respect of 6,000 Remuneration Shares;
(6) Mr Pramukti Surjaudaja (or for the account of such depository agent as he may direct) in respect of 6,000 Remuneration Shares;
(7) Mr Quah Wee Ghee (or for the account of such depository agent as he may direct) in respect of 6,000 Remuneration Shares;
(8) Mr Tan Ngiap Joo (or for the account of such depository agent as he may direct) in respect of 6,000 Remuneration Shares; and
(9) Mr Wee Joo Yeow (or for the account of such depository agent as he may direct) in respect of 6,000 Remuneration Shares,

300 OCBC Annual Report 2018
Notice of Annual General Meeting Oversea-Chinese Banking Corporation Limited (Incorporated in Singapore) (Company Reg. No: 193200032W)
as payment in part of their respective non-executive Directors’ remuneration for the financial year ended 31 December 2018, the Remuneration Shares to rank in all respects pari passu with the existing ordinary shares; and
(ii) any Director of the Bank or the Secretary be authorised to do all things necessary or desirable to give effect to the above.
5 To re-appoint KPMG LLP as Auditors of the Bank and to authorise the Directors to fix their remuneration.
As Special Business
To consider and, if thought fit, to pass the following Resolutions which will be proposed as Ordinary Resolutions:
6 That authority be and is hereby given to the Directors of the Bank to:
(I) (i) issue ordinary shares of the Bank (ordinary shares) whether by way of rights, bonus or otherwise; and/or
(ii) make or grant offers, agreements or options (collectively, Instruments) that might or would require ordinary shares to be issued, including but not limited to the creation and issue of (as well as adjustments to) warrants, debentures or other instruments convertible into ordinary shares,
at any time and upon such terms and conditions and for such purposes and to such persons as the Directors may in their absolute discretion deem fit; and
(II) (notwithstanding the authority conferred by this Resolution may have ceased to be in force) issue ordinary shares in pursuance
of any Instrument made or granted by the Directors while this Resolution was in force,
provided that:
(1) the aggregate number of ordinary shares to be issued pursuant to this Resolution (including ordinary shares to be issued in pursuance of Instruments made or granted pursuant to this Resolution) shall not exceed 50 per cent. of the total number of issued ordinary shares of the Bank excluding treasury shares and subsidiary holdings (as calculated in accordance with paragraph (2) below), of which the aggregate number of ordinary shares to be issued other than on a pro rata basis to shareholders of the Bank (including ordinary shares to be issued in pursuance of Instruments made or granted pursuant to this Resolution) shall not exceed 10 per cent. of the total number of issued ordinary shares of the Bank excluding treasury shares and subsidiary holdings (as calculated in accordance with paragraph (2) below);
(2) (subject to such manner of calculation and adjustments as may be prescribed by the Singapore Exchange Securities Trading Limited (the SGX-ST)) for the purpose of determining the aggregate number of ordinary shares that may be issued under paragraph (1) above, the total number of issued ordinary shares of the Bank excluding treasury shares and subsidiary holdings shall be based on the total number of issued ordinary shares of the Bank excluding treasury shares and subsidiary holdings at the time this Resolution is passed, after adjusting for:
(i) new ordinary shares arising from the conversion or exercise of any convertible securities or share options or vesting of share awards which are outstanding or subsisting at the time this Resolution is passed; and
(ii) any subsequent bonus issue, consolidation or subdivision of ordinary shares,
and, in paragraph (1) above and this paragraph (2), “subsidiary holdings” has the meaning given to it in the Listing Manual of the SGX-ST;
(3) in exercising the authority conferred by this Resolution, the Bank shall comply with the provisions of the Listing Manual of the SGX-ST for the time being in force (unless such compliance has been waived by the SGX-ST) and the Constitution for the time being of the Bank; and
(4) (unless revoked or varied by the Bank in General Meeting) the authority conferred by this Resolution shall continue in force until the conclusion of the next Annual General Meeting of the Bank or the date by which the next Annual General Meeting of the Bank is required by law to be held, whichever is the earlier.

Additional Information 301
7 That authority be and is hereby given to the Directors of the Bank to:
(I) allot and issue from time to time such number of ordinary shares of the Bank as may be required to be issued pursuant to the exercise of options under the OCBC Share Option Scheme 2001 (the 2001 Scheme); and/or
(II) grant rights to acquire ordinary shares in accordance with the provisions of the OCBC Employee Share Purchase Plan (the Plan), and allot and issue from time to time such number of ordinary shares of the Bank as may be required to be issued pursuant to the exercise of rights to acquire ordinary shares under the Plan,
provided that the aggregate number of new ordinary shares to be issued pursuant to the 2001 Scheme and the Plan shall not exceed 5 per cent. of the total number of issued ordinary shares of the Bank excluding treasury shares and subsidiary holdings (as defined in the Listing Manual of the Singapore Exchange Securities Trading Limited) from time to time.
8 That authority be and is hereby given to the Directors of the Bank to allot and issue from time to time such number of ordinary shares of the Bank as may be required to be allotted and issued pursuant to the Oversea-Chinese Banking Corporation Limited Scrip Dividend Scheme.
9 That:
(I) for the purposes of Sections 76C and 76E of the Companies Act, Chapter 50 of Singapore (the Companies Act), the exercise by the Directors of the Bank of all the powers of the Bank to purchase or otherwise acquire issued ordinary shares of the Bank (Ordinary Shares) not exceeding in aggregate the Maximum Limit (as hereafter defined), at such price or prices as may be determined by the Directors from time to time up to the Maximum Price (as hereafter defined), whether by way of:
(i) market purchase(s) on the Singapore Exchange Securities Trading Limited (the SGX-ST) and/or any other stock exchange on which the Ordinary Shares may for the time being be listed and quoted (Other Exchange); and/or
(ii) off-market purchase(s) (if effected otherwise than on the SGX-ST or, as the case may be, Other Exchange) in accordance with any equal access scheme(s) as may be determined or formulated by the Directors as they consider fit, which scheme(s) shall satisfy all the conditions prescribed by the Companies Act,
and otherwise in accordance with all other laws and regulations and rules of the SGX-ST or, as the case may be, Other Exchange as may for the time being be applicable, be and is hereby authorised and approved generally and unconditionally (the Share Purchase Mandate);
(II) unless varied or revoked by the Bank in General Meeting, the authority conferred on the Directors of the Bank pursuant to the Share Purchase Mandate may be exercised by the Directors at any time and from time to time during the period commencing from the date of the passing of this Resolution and expiring on the earliest of:
(i) the date on which the next Annual General Meeting of the Bank is held;
(ii) the date by which the next Annual General Meeting of the Bank is required by law to be held; and
(iii) the date on which purchases and acquisitions of Ordinary Shares pursuant to the Share Purchase Mandate are carried out to the full extent mandated;

302 OCBC Annual Report 2018
Notice of Annual General Meeting Oversea-Chinese Banking Corporation Limited (Incorporated in Singapore) (Company Reg. No: 193200032W)
(III) in this Resolution:
“Average Closing Price” means the average of the last dealt prices of an Ordinary Share for the five consecutive market days on which the Ordinary Shares are transacted on the SGX-ST or, as the case may be, Other Exchange immediately preceding the date of market purchase by the Bank or, as the case may be, the date of the making of the offer pursuant to the off-market purchase, and deemed to be adjusted in accordance with the listing rules of the SGX-ST for any corporate action which occurs after the relevant five-day period;
“date of the making of the offer” means the date on which the Bank announces its intention to make an offer for the purchase or acquisition of Ordinary Shares from holders of Ordinary Shares, stating therein the purchase price (which shall not be more than the Maximum Price) for each Ordinary Share and the relevant terms of the equal access scheme for effecting the off-market purchase;
“Maximum Limit” means that number of Ordinary Shares representing 5% of the issued Ordinary Shares as at the date of the passing of this Resolution (excluding treasury shares and subsidiary holdings (as defined in the Listing Manual of the SGX-ST)); and
“Maximum Price” in relation to an Ordinary Share to be purchased or acquired, means the purchase price (excluding brokerage, commission, applicable goods and services tax and other related expenses) which shall not exceed, whether pursuant to a market purchase or an off-market purchase, 105% of the Average Closing Price of the Ordinary Shares; and
(IV) the Directors of the Bank and/or any of them be and are hereby authorised to complete and do all such acts and things (including executing such documents as may be required) as they and/or he may consider expedient or necessary to give effect to the transactions contemplated and/or authorised by this Resolution.
Peter Yeoh Secretary
Singapore 5 April 2019
Notes:
1. A presentation by Management on the Group’s financial performance will commence at 1.30 p.m. and end at 2.15 p.m. prior to the commencement of the Annual General Meeting.
2. (a) A member who is not a relevant intermediary is entitled to appoint not more than two proxies to attend, speak and vote at the Annual General Meeting. Where such member’s form of proxy appoints more than one proxy, the proportion of the shareholding concerned to be represented by each proxy shall be specified in the form of proxy.
(b) A member who is a relevant intermediary is entitled to appoint more than two proxies to attend, speak and vote at the Annual General Meeting, but each proxy must be appointed to exercise the rights attached to a different share or shares held by such member. Where such member’s form of proxy appoints more than two proxies, the number and class of shares in relation to which each proxy has been appointed shall be specified in the form of proxy.
“Relevant intermediary” has the meaning ascribed to it in Section 181 of the Companies Act, Chapter 50 of Singapore.
3. A proxy need not be a member of the Bank.
4. The instrument appointing a proxy or proxies must be deposited at the Share Registration Office of the Bank at M & C Services Private Limited, 112 Robinson Road #05-01, Singapore 068902, not less than 72 hours before the time appointed for holding the Annual General Meeting.
Additional Information 303
Personal Data Privacy:
By submitting an instrument appointing a proxy(ies) and/or representative(s) to attend, speak and vote at the Annual General Meeting and/or any adjournment thereof, a member of the Bank (i) consents to the collection, use and disclosure of the member’s personal data by the Bank (or its agents or service providers) for the purpose of the processing, administration and analysis by the Bank (or its agents or service providers) of proxies and representatives appointed for the Annual General Meeting (including any adjournment thereof) and the preparation and compilation of the attendance lists, minutes and other documents relating to the Annual General Meeting (including any adjournment thereof), and in order for the Bank (or its agents or service providers) to comply with any applicable laws, listing rules, take-over rules, regulations and/or guidelines (collectively, the Purposes), (ii) warrants that where the member discloses the personal data of the member’s proxy(ies) and/or representative(s) to the Bank (or its agents or service providers), the member has obtained the prior consent of such proxy(ies) and/or representative(s) for the collection, use and disclosure by the Bank (or its agents or service providers) of the personal data of such proxy(ies) and/or representative(s) for the Purposes, and (iii) agrees that the member will indemnify the Bank in respect of any penalties, liabilities, claims, demands, losses and damages as a result of the member’s breach of warranty.
Explanatory Notes on Routine and Special Business
Ordinary Resolutions 2(a), (b), (c) and (d)
Resolutions 2(a), (b), (c) and (d) are to re-elect Directors who are retiring by rotation.
Please refer to the “Board of Directors” section on pages 25, 26 and 27 and the “Board Composition and Guidance” section in the Corporate Governance Report on page 86 of the Annual Report 2018 for information on these Directors (including information as set out in Appendix 7.4.1 of the Listing Manual of the Singapore Exchange Securities Trading Limited (SGX-ST)).
Ordinary Resolution 4(a)
Resolution 4(a) is to authorise the payment of S$3,070,000 as Directors’ fees to the non-executive Directors of the Bank for the financial year ended 31 December 2018 (FY 2018). This is higher than the amount of S$2,979,000 paid for the financial year ended 31 December 2017 (FY 2017). In FY 2018, relatively more meetings were held compared to FY 2017 and full year fees will be paid to Directors who joined the Board or Board Committees for only part of FY 2017 and were paid pro-rated fees. Details of the Directors’ fee structure can be found on page 88 of the Annual Report 2018.
Ordinary Resolution 4(b)
Resolution 4(b) is to authorise the Directors to issue ordinary shares of the Bank to the non-executive Directors as part of their remuneration for FY 2018.
The non-executive Directors who are eligible for, and will receive, the award of ordinary shares as part of their remuneration for FY 2018 are Mr Ooi Sang Kuang, Ms Christina Hon Kwee Fong (Christina Ong), Mr Chua Kim Chiu, Mr Lai Teck Poh, Dr Lee Tih Shih, Mr Pramukti Surjaudaja, Mr Quah Wee Ghee, Mr Tan Ngiap Joo and Mr Wee Joo Yeow.
It is proposed that, for FY 2018, 6,000 ordinary shares be issued to each non-executive Director named above (2017: 6,000 ordinary shares). The proposed award of ordinary shares is in addition to the Directors’ fees in cash to be proposed under Resolution 4(a).
The issue of ordinary shares under Resolution 4(b) will be made pursuant to Article 143 of the Constitution of the Bank by way of the issue of bonus shares for which no consideration is payable. Such ordinary shares will, upon issue, rank pari passu with the existing ordinary shares of the Bank. The SGX-ST has given in-principle approval for the listing and quotation of such new ordinary shares. Such approval is subject to (a) compliance with the SGX-ST’s listing requirements, and (b) shareholders’ approval for the issuance of such new ordinary shares in compliance with Listing Rule 804. The SGX-ST’s in-principle approval is not to be taken as an indication of the merits of such new ordinary shares, the Bank and/or its subsidiaries. The SGX-ST assumes no responsibility for the correctness of any of the statements or opinions made in this explanatory note to Resolution 4(b).
The non-executive Directors who will each, subject to shareholders’ approval, be awarded ordinary shares as part of their remuneration for FY 2018, will abstain from voting in respect of, and will procure their associates to abstain from voting in respect of, Resolution 4(b). The Bank will disregard any votes cast by such persons in respect of their shareholdings on Resolution 4(b).
304 OCBC Annual Report 2018
Notice of Annual General Meeting Oversea-Chinese Banking Corporation Limited (Incorporated in Singapore) (Company Reg. No: 193200032W)
Ordinary Resolution 5
Resolution 5 is to re-appoint KPMG LLP as Auditors of the Bank for the financial year ending 31 December 2019 and to authorise the Directors to fix their remuneration.
KPMG LLP have served as the Bank’s external auditors since the financial year ended 31 December 2006. In line with good corporate governance practice, the Audit Committee has nominated PricewaterhouseCoopers LLP for appointment as the Bank’s external auditors in place of KPMG LLP for the financial year ending 31 December 2020. The nomination was made following a tender process based on an established framework for the selection of external auditors. Subject to the requisite approvals, notices, clearances and consents being obtained, the proposed appointment will be presented for shareholders’ approval at the 2020 Annual General Meeting. Please refer to the External Audit section in the Corporate Governance Report on pages 93 and 94 of the Annual Report 2018 for more details.
Ordinary Resolution 6
Resolution 6 is to authorise the Directors from the date of the forthcoming Annual General Meeting until the next Annual General Meeting to issue ordinary shares of the Bank and/or to make or grant instruments (such as warrants or debentures) convertible into ordinary shares (Instruments), and to issue ordinary shares in pursuance of such Instruments, up to a number not exceeding fifty per cent. (50%) of the total number of issued ordinary shares of the Bank excluding treasury shares and subsidiary holdings, with a sub-limit of ten per cent. (10%) for issues other than on a pro rata basis to shareholders of the Bank.
For the purpose of determining the aggregate number of ordinary shares that may be issued, the total number of issued ordinary shares of the Bank excluding treasury shares and subsidiary holdings shall be based on the total number of issued ordinary shares of the Bank excluding treasury shares and subsidiary holdings at the time this Resolution is passed, after adjusting for (1) new ordinary shares arising from the conversion or exercise of any convertible securities or share options or vesting of share awards which are outstanding or subsisting at the time this Resolution is passed, and (2) any subsequent bonus issue, consolidation or subdivision of ordinary shares. For the avoidance of doubt, any consolidation or subdivision of ordinary shares of the Bank will require shareholders’ approval. As at 6 March 2019 (the Latest Practicable Date), the Bank had 8,628,979 treasury shares and no subsidiary holdings.
The Directors will only issue ordinary shares and/or Instruments under this Resolution if they consider it necessary and in the interests of the Bank.
Ordinary Resolution 7
Resolution 7 is to authorise the Directors to (i) allot and issue ordinary shares, in accordance with the provisions of the OCBC Share Option Scheme 2001 (the 2001 Scheme), and/or (ii) grant rights to acquire, and allot and issue, ordinary shares in accordance with the provisions of the OCBC Employee Share Purchase Plan (the Plan). Although the Rules of the 2001 Scheme provide that the aggregate number of new ordinary shares which may be issued pursuant to the 2001 Scheme shall not exceed 10 per cent. (10%) of the total number of issued ordinary shares of the Bank from time to time, and the Rules of the Plan provide that the aggregate number of new ordinary shares which may be issued pursuant to the Plan, when aggregated with the aggregate number of new ordinary shares which may be issued pursuant to the 2001 Scheme, shall not exceed 15 per cent. (15%) of the total number of issued ordinary shares of the Bank from time to time, Resolution 7 provides for a lower limit of 5 per cent. (5%) of the total number of issued ordinary shares of the Bank excluding treasury shares and subsidiary holdings from time to time, as the Bank does not anticipate that it will require a higher limit before the next Annual General Meeting.
Ordinary Resolution 8
Resolution 8 is to authorise the Directors to issue ordinary shares pursuant to the Oversea-Chinese Banking Corporation Limited Scrip Dividend Scheme to members who, in respect of a qualifying dividend, have elected to receive scrip in lieu of the cash amount of that qualifying dividend.

Additional Information 305
Ordinary Resolution 9
Resolution 9 is to renew the mandate to allow the Bank to purchase or otherwise acquire its issued ordinary shares, on the terms and subject to the conditions set out in this Resolution.
The Bank intends to use its internal sources of funds to finance its purchase or acquisition of ordinary shares. The amount of financing required for the Bank to purchase or acquire its ordinary shares, and the impact on the Bank’s financial position, cannot be ascertained as at the date of this Notice as these will depend on whether the ordinary shares are purchased or acquired out of capital or profits of the Bank, the number of ordinary shares purchased or acquired, the price at which such ordinary shares were purchased or acquired and whether the ordinary shares purchased or acquired are held in treasury or cancelled.
Based on the existing issued ordinary shares of the Bank as at the Latest Practicable Date, the purchase by the Bank of 5% of its issued ordinary shares (disregarding the ordinary shares held in treasury) will result in the purchase or acquisition of 212,407,061 ordinary shares.
In the case of both market purchases and off-market purchases by the Bank and assuming that the Bank purchases or acquires the 212,407,061 ordinary shares at the Maximum Price of S$11.71 for one ordinary share (being the price equivalent to 5% above the Average Closing Price of the ordinary shares traded on the SGX-ST for the five consecutive market days immediately preceding the Latest Practicable Date), the maximum amount of funds required for the purchase or acquisition of 212,407,061 ordinary shares is approximately S$2,487.29 million.
The financial effects of the purchase or acquisition of such ordinary shares by the Bank pursuant to the proposed Share Purchase Mandate on the audited financial statements of the Group and the Bank for the financial year ended 31 December 2018 based on these assumptions are set out in paragraph 2.7 of the Bank’s Letter to Shareholders dated 5 April 2019 (the Letter).
Please refer to the Letter for more details.

This page is intentionally left blank.
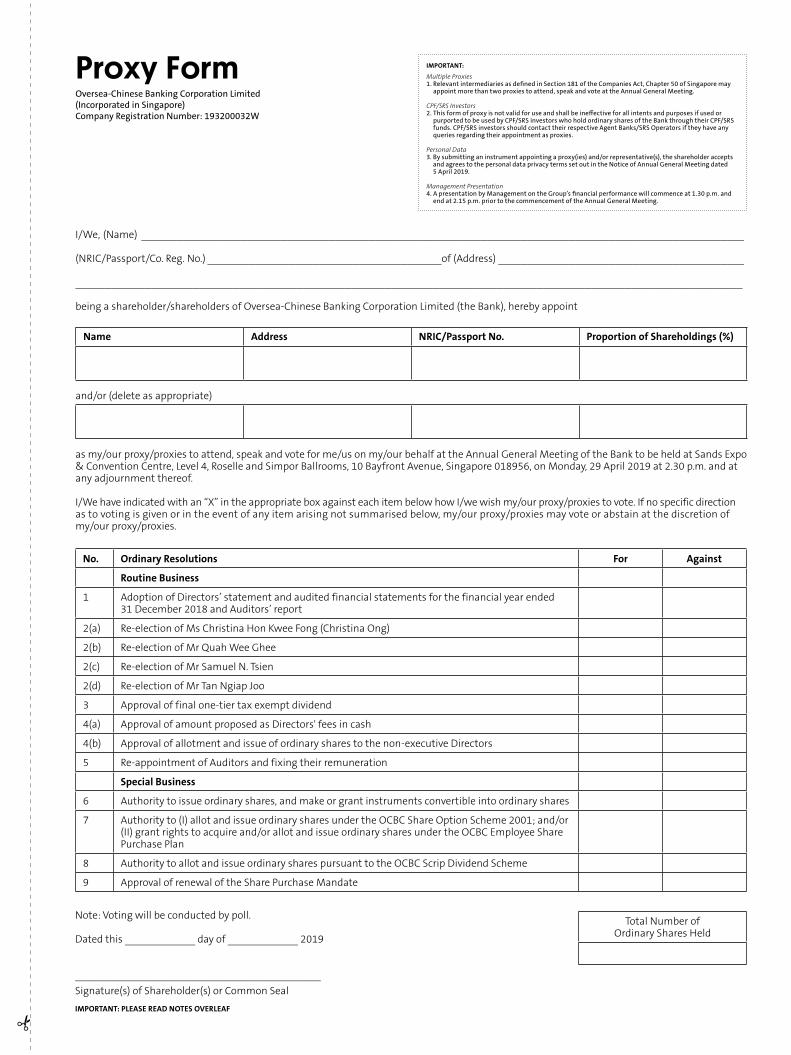
Proxy Form Oversea-Chinese Banking Corporation Limited (Incorporated in Singapore) Company Registration Number: 193200032W
IMPORTANT:
Multiple Proxies 1. Relevant intermediaries as defined in Section 181 of the Companies Act, Chapter 50 of Singapore may
appoint more than two proxies to attend, speak and vote at the Annual General Meeting.
CPF/SRS Investors 2. This form of proxy is not valid for use and shall be ineffective for all intents and purposes if used or
purported to be used by CPF/SRS investors who hold ordinary shares of the Bank through their CPF/SRS funds. CPF/SRS investors should contact their respective Agent Banks/SRS Operators if they have any queries regarding their appointment as proxies.
Personal Data 3. By submitting an instrument appointing a proxy(ies) and/or representative(s), the shareholder accepts
and agrees to the personal data privacy terms set out in the Notice of Annual General Meeting dated 5 April 2019.
Management Presentation 4. A presentation by Management on the Group’s financial performance will commence at 1.30 p.m. and
end at 2.15 p.m. prior to the commencement of the Annual General Meeting.
I/We, (Name) _______________________________________________________________________________________________________
(NRIC/Passport/Co. Reg. No.) ________________________________________of (Address) __________________________________________
__________________________________________________________________________________________________________________
being a shareholder/shareholders of Oversea-Chinese Banking Corporation Limited (the Bank), hereby appoint
Name Address NRIC/Passport No. Proportion of Shareholdings (%)
and/or (delete as appropriate)
as my/our proxy/proxies to attend, speak and vote for me/us on my/our behalf at the Annual General Meeting of the Bank to be held at Sands Expo & Convention Centre, Level 4, Roselle and Simpor Ballrooms, 10 Bayfront Avenue, Singapore 018956, on Monday, 29 April 2019 at 2.30 p.m. and at any adjournment thereof.
I/We have indicated with an “X” in the appropriate box against each item below how I/we wish my/our proxy/proxies to vote. If no specific direction as to voting is given or in the event of any item arising not summarised below, my/our proxy/proxies may vote or abstain at the discretion of my/our proxy/proxies.
No. Ordinary Resolutions For Against
Routine Business
1 Adoption of Directors’ statement and audited financial statements for the financial year ended 31 December 2018 and Auditors’ report
2(a) Re-election of Ms Christina Hon Kwee Fong (Christina Ong)
2(b) Re-election of Mr Quah Wee Ghee
2(c) Re-election of Mr Samuel N. Tsien
2(d) Re-election of Mr Tan Ngiap Joo
3 Approval of final one-tier tax exempt dividend
4(a) Approval of amount proposed as Directors' fees in cash
4(b) Approval of allotment and issue of ordinary shares to the non-executive Directors
5 Re-appointment of Auditors and fixing their remuneration
Special Business
6 Authority to issue ordinary shares, and make or grant instruments convertible into ordinary shares
7 Authority to (I) allot and issue ordinary shares under the OCBC Share Option Scheme 2001; and/or (II) grant rights to acquire and/or allot and issue ordinary shares under the OCBC Employee Share Purchase Plan
8 Authority to allot and issue ordinary shares pursuant to the OCBC Scrip Dividend Scheme
9 Approval of renewal of the Share Purchase Mandate
Note: Voting will be conducted by poll.
Dated this ____________ day of ____________ 2019
__________________________________________Signature(s) of Shareholder(s) or Common Seal
Total Number of Ordinary Shares Held
IMPORTANT: PLEASE READ NOTES OVERLEAF
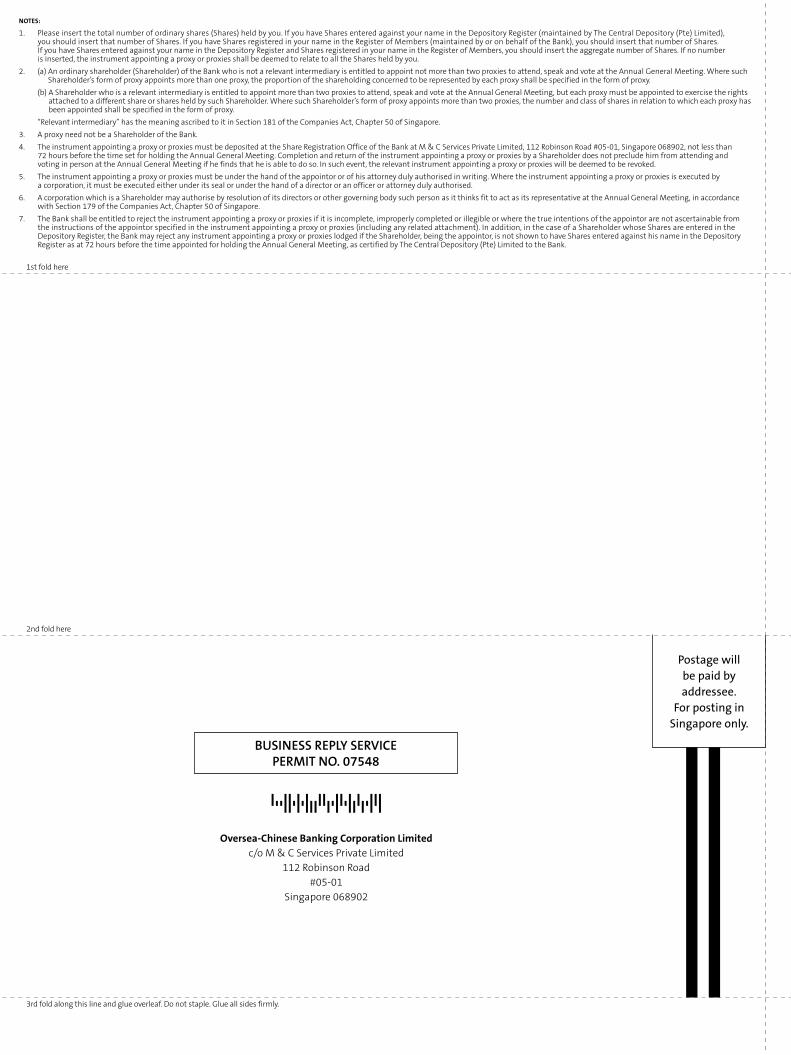
NOTES:
1. Please insert the total number of ordinary shares (Shares) held by you. If you have Shares entered against your name in the Depository Register (maintained by The Central Depository (Pte) Limited), you should insert that number of Shares. If you have Shares registered in your name in the Register of Members (maintained by or on behalf of the Bank), you should insert that number of Shares. If you have Shares entered against your name in the Depository Register and Shares registered in your name in the Register of Members, you should insert the aggregate number of Shares. If no number is inserted, the instrument appointing a proxy or proxies shall be deemed to relate to all the Shares held by you.
2. (a) An ordinary shareholder (Shareholder) of the Bank who is not a relevant intermediary is entitled to appoint not more than two proxies to attend, speak and vote at the Annual General Meeting. Where such Shareholder’s form of proxy appoints more than one proxy, the proportion of the shareholding concerned to be represented by each proxy shall be specified in the form of proxy.
(b) A Shareholder who is a relevant intermediary is entitled to appoint more than two proxies to attend, speak and vote at the Annual General Meeting, but each proxy must be appointed to exercise the rights attached to a different share or shares held by such Shareholder. Where such Shareholder’s form of proxy appoints more than two proxies, the number and class of shares in relation to which each proxy has been appointed shall be specified in the form of proxy.
“Relevant intermediary” has the meaning ascribed to it in Section 181 of the Companies Act, Chapter 50 of Singapore. 3. A proxy need not be a Shareholder of the Bank. 4. The instrument appointing a proxy or proxies must be deposited at the Share Registration Office of the Bank at M & C Services Private Limited, 112 Robinson Road #05-01, Singapore 068902, not less than
72 hours before the time set for holding the Annual General Meeting. Completion and return of the instrument appointing a proxy or proxies by a Shareholder does not preclude him from attending and voting in person at the Annual General Meeting if he finds that he is able to do so. In such event, the relevant instrument appointing a proxy or proxies will be deemed to be revoked.
5. The instrument appointing a proxy or proxies must be under the hand of the appointor or of his attorney duly authorised in writing. Where the instrument appointing a proxy or proxies is executed by a corporation, it must be executed either under its seal or under the hand of a director or an officer or attorney duly authorised.
6. A corporation which is a Shareholder may authorise by resolution of its directors or other governing body such person as it thinks fit to act as its representative at the Annual General Meeting, in accordance with Section 179 of the Companies Act, Chapter 50 of Singapore.
7. The Bank shall be entitled to reject the instrument appointing a proxy or proxies if it is incomplete, improperly completed or illegible or where the true intentions of the appointor are not ascertainable from the instructions of the appointor specified in the instrument appointing a proxy or proxies (including any related attachment). In addition, in the case of a Shareholder whose Shares are entered in the Depository Register, the Bank may reject any instrument appointing a proxy or proxies lodged if the Shareholder, being the appointor, is not shown to have Shares entered against his name in the Depository Register as at 72 hours before the time appointed for holding the Annual General Meeting, as certified by The Central Depository (Pte) Limited to the Bank.
1st fold here
3rd fold along this line and glue overleaf. Do not staple. Glue all sides firmly.
Oversea-Chinese Banking Corporation Limited c/o M & C Services Private Limited
112 Robinson Road #05-01
Singapore 068902
BUSINESS REPLY SERVICE PERMIT NO. 07548
2nd fold here
Postage will be paid by addressee.
For posting in Singapore only.

OCBC Bank is the longest established Singapore bank, formed in 1932 from the merger of three local banks, the oldest of which was founded in 1912. It is now the second largest financial services group in Southeast Asia by assets and one of the world’s most highly-rated banks, with an Aa1 rating from Moody’s. Recognised for its financial strength and stability, OCBC Bank is consistently ranked among the World’s Top 50 Safest Banks by Global Finance and has been named Best Managed Bank in Singapore by The Asian Banker.
OCBC Bank and its subsidiaries offer a broad array of commercial banking, specialist financial and wealth management services, ranging from consumer, corporate, investment, private and transaction banking to treasury, insurance, asset management and stockbroking services.
OCBC Bank’s key markets are Singapore, Malaysia, Indonesia and Greater China. It has more than 570 branches and representative offices in 19 countries and regions. These include over 300 branches and offices in Indonesia under subsidiary Bank OCBC NISP, and more than 100 branches and offices in Hong Kong, China and Macau under OCBC Wing Hang.
OCBC Bank’s private banking services are provided by its wholly-owned subsidiary Bank of Singapore, which operates on a unique open-architecture product platform to source for the best-in-class products to meet its clients’ goals.
OCBC Bank’s insurance subsidiary, Great Eastern Holdings, is the oldest and most established life insurance group in Singapore and Malaysia. Its asset management subsidiary, Lion Global Investors, is one of the largest private sector asset management companies in Southeast Asia.
For more information, please visit www.ocbc.com.
Corporate Profile Corporate Information
Designed by: Sycamore & Co. Printed by: Medialink Printing Services Pte Ltd
Board of DirectorsMr Ooi Sang KuangChairman
Mr Chua Kim ChiuMr Lai Teck PohDr Lee Tih ShihMs Christina OngMr Quah Wee GheeMr Pramukti SurjaudajaMr Tan Ngiap JooMr Samuel N. TsienMr Wee Joo Yeow
Nominating CommitteeMr Tan Ngiap JooChairman
Mr Ooi Sang KuangMr Lai Teck PohDr Lee Tih ShihMr Wee Joo Yeow
Executive CommitteeMr Ooi Sang KuangChairman
Dr Lee Tih ShihMr Quah Wee GheeMr Tan Ngiap JooMr Samuel N. TsienMr Wee Joo Yeow
Audit CommitteeMr Chua Kim ChiuChairman
Mr Lai Teck PohMs Christina OngMr Tan Ngiap Joo
Remuneration CommitteeMr Wee Joo YeowChairman
Mr Ooi Sang KuangMs Christina OngMr Quah Wee GheeMr Tan Ngiap Joo
Risk Management CommitteeMr Lai Teck PohChairman
Mr Ooi Sang KuangMr Chua Kim ChiuMr Pramukti SurjaudajaMr Samuel N. TsienMr Wee Joo Yeow
Ethics and Conduct CommitteeMr Ooi Sang KuangChairman
Dr Lee Tih ShihMs Christina Ong
SecretariesMr Peter YeohMs Sherri Liew
Registered Office63 Chulia Street#10-00 OCBC Centre EastSingapore 049514Tel: (65) 6318 7222 Main Line Fax: (65) 6534 3986Email: [email protected]: www.ocbc.com
Share Registration OfficeM & C Services Private Limited112 Robinson Road #05-01Singapore 068902Tel: (65) 6228 0505
AuditorsKPMG LLP16 Raffles Quay #22-00Hong Leong BuildingSingapore 048581Tel: (65) 6213 3388
Partner in charge of the AuditMr Leong Kok Keong(Year of Appointment: 2016)

Oversea-C
hinese Banking Co
rpo
ration Limited A
nnual Repo
rt 2018
Oversea-Chinese Banking Corporation Limited (Incorporated in Singapore)
Company Registration Number: 193200032W