UNU-WIDER UN DESA workshop on inequalityn-Finn... · Project background • As part of the...
28
Inequality in the developing giants: trends, drivers and policy implications by Carlos Gradín and Finn Tarp UNU-WIDER — UN DESA workshop on inequality UN Headquarters, New York, 6 May 2019
Transcript of UNU-WIDER UN DESA workshop on inequalityn-Finn... · Project background • As part of the...

Inequality in the developing giants:
trends, drivers and policy implications
by Carlos Gradín and Finn Tarp
UNU-WIDER — UN DESA workshop on inequality
UN Headquarters, New York, 6 May 2019

Project background• As part of the activities leading to the formulation of the 2015
Sustainable Development Agenda, UNU-WIDER held a major international conference on “inequality – measurement, trends, impacts, and policies” (on 5-6 September 2014)
https://www.wider.unu.edu/event/inequality-measurement-trends-impacts-and-policies
• The conference included a special session on comparing Brazil and South Africa, and a key message that emerged is that understanding inequalities in emerging economies is essential to identifying global trends of inequality
– And it was noted repeatedly that there are different patterns across countries: no single, simple story applies; policy does indeed matter
2

Project background (cont.)
• In a side-event a broader international effort entitled “inequality in the giants” was discussed with a group of intellectual leaders in the inequality field: what happened?
• Subsequently, UNU-WIDER decided to engage with a group of highly qualified researchers to study inequality in 5 key developing countries within a common framework
• Workstream leaders:
– Brazil (Marcelo Neri)– China (Li Shi)– India (Peter Lanjouw)– Mexico (Nora Lustig)– South Africa (Murray Leibbrandt)
3
40% of the world’s populationin the main regions

Developing giants: context
• They are highly unequal countries:– Large divides among population groups (urban/rural, regions,
ethnicity, gender, etc.)
• They have all undergone large structural economic/political changes over the past 3 decades– Examples of political and economic reforms
• End of apartheid in South Africa• Opening up of the Mexican and Indian economies• China’s (incomplete) transition to a market economy
– We have seen increased tension in existing inequalities
• Are largely dependent on the commodities cycle
• Have expanded and re-designed the public sector
4

Project objectives
• Establish the trend in income inequality and its determinants
• Investigate the role of the labour market
– Earnings inequality and the skill premium
• Assess the impact of improving the estimates of top income shares on inequality
• Identify the redistributive effect of taxes and social benefits
• Address other issues such as spatial inequalities, social mobility and the gender gap
5

Project outputs
• 33 Working Papers (+ research/policy briefs), including:
– 22 country studies– 5 country synthesis papers– 6 framing papers on more general issues
• Edited volume (being finalised)
6
https://www.wider.unu.edu/project/inequality-giants

Framing papers
• From manufacturing-led export growth to a twenty-first century inclusive growth strategy: Explaining the demise of a successful growth model and what to do about it (J.E. Stiglitz)
• What might explain today’s conflicting narratives on global inequality? (M. Ravallion)
• Comparing global inequality of income and wealth (J. Davies & A. Shorrocks)
• Empirical challenges comparing inequality across countries: the case of middle-income countries from the LIS Database (D. Checchi, A. Cupak, J. Gornick, and T. Munzi)
• Economic inequality and subjective wellbeing across the world (A. Clark & C. D’Ambrosio)
• China versus the United States: Different economic models but similarly low levels of socioeconomic mobility (R. van der Weide)
7

Facing data challenges• Results may for example be sensitive to imputations of records with
0 or missing values in surveys
– Confirming downward trend in Brazil before last recession; ruling out declining earnings inequality in Mexico after 2006
• We turned to complementary data sources and methods in the 5 cases – to illustrate:
– Labour shares: National accounts (Mexico)
– Redistribution: Public accounts (Mexico); Tax-benefit microsimulation model (Brazil)
– Earnings inequality: Social security admin data (Brazil)
– Spatial inequalities: Census and satellite data (India)
– Adjusting top incomes (expenditures): Personal income tax tabulations (Brazil); Individual tax records (South Africa); Super-rich lists (China); House price public listings (India)
8

Developing giants: trends
• Heterogenous patterns:
– Increasing inequality in China (until 2008, then declining) and in Indiaafter the structural reforms
– Long and unprecedented decline in inequality is characteristic in Brazilsince the early 1990s, following the commodities boom until the last recession
– Modest progress can be noted in South Africa after the end of apartheid in spite of applying a wide range of redistributive policies
– High persistence in Mexico: N-shape in (1989-1994-2006-2014)
• Many of the developments in living conditions are not reflected in measured income (e.g. access to basic services, freedom, …).
9

10
Brazil

11
China
Between late 1970s and early 2000s, income inequality rose from a low to high level.
China may have turned the corner in the Kuznets inverted U.Increased difficulty of capturing China’s emerging ultra-rich class

12
Mexico

Developing giants: Drivers
• In all cases the labor market plays the most fundamental role in driving inequality trends (ups or downs)
– Importance of how primary income is generated when there are extreme initial inequalities in education and access to productive assets, a highly segmented labor markets (informal, migrants, by race, regions …), etc.
– Returns to skills (education and experience), in a context of expanding education and increasing demand for highly educated workers
• Some evidence of high concentration at top incomes.
13

14
Mexico (earnings)
1) Higher demand for skills (Opening + SBTC) + (falling min. wage + deunionization) → skill premium increased2) Supply of skilled workers outpaced demand→ skill premium fell3) After 2006, less clear, income of all workers fell during the Great Recession, specially for low-skilled workers.
15
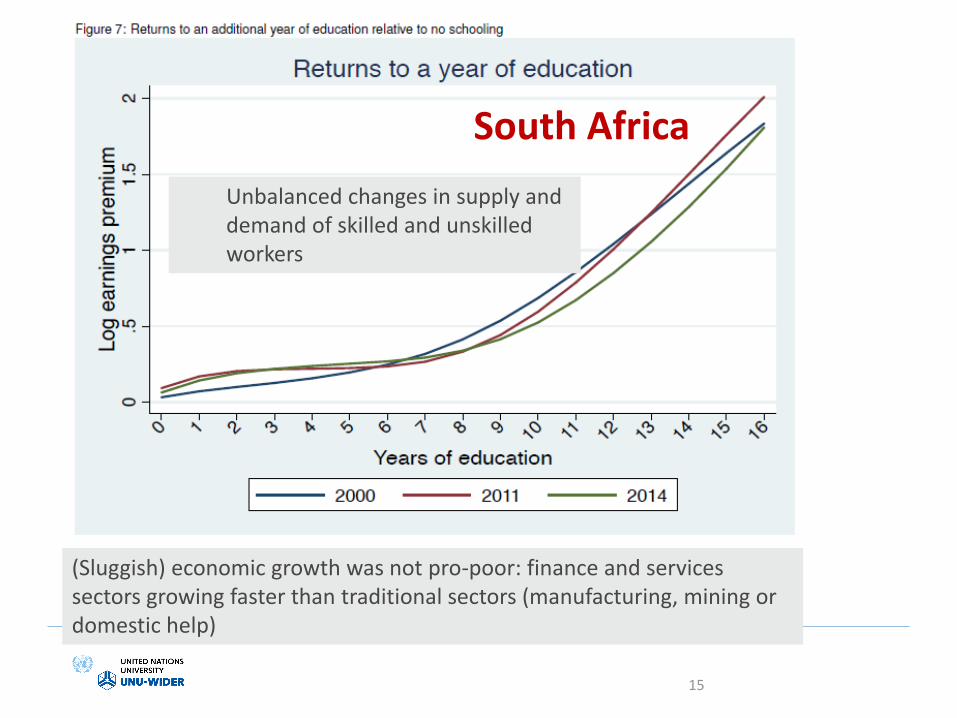
South Africa
(Sluggish) economic growth was not pro-poor: finance and services sectors growing faster than traditional sectors (manufacturing, mining or domestic help)
Unbalanced changes in supply and demand of skilled and unskilled workers

16
Brazil (earnings)

17
Brazil (earnings)
Earnings decompression below p90

18
Brazil (earnings)
But concentration among the very rich

19
Urban China (wages)
• Increasing wage inequality despite important growth among low wages
• After 2007: Highly-paid workers’ wage growth has been limited in SOE (new rules in 2009)

20
Urban China (wages)
Experience more important than education to explain wage inequality in 1988
Education was the single largest contributor (of the much larger level) in 2013.
Large gender gap in earnings and employment

Developing giants: Drivers (cont.)
• Limited redistributive effect of taxes and benefits
– Expansion in the scale of the public sector
– Improvements in design
• More progressive (reducing urban bias, more inclusive of vulnerable groups)
– but some policies are regressive or weakly progressive
• E.g. contributory SS, tax exemptions
– and targeted policies, like CCTs, small scale to significantly reduce inequality
21

South Africa
Implementation of large-scale policies, progressive and well targeted to the poor (diminishing impact over time)
• Access to basic services: housing, electricity or water• Cash transfers (Pensioners, disabled and children)
– Means tested: 50% → Poorest 30%– Increase from 24 to 68% households with government grants
• from 3 to 16% in the share of total income, • largest increase 1993-2008, smaller 2008-14.
• Direct taxes– Borne by richest 30%, except some regressive deductions
22
Gini reduction from 0.73 (market income) to 0.66 (disposable income)+ reduction in horizontal inequalities(by age, locations, race or gender)

Mexico
• Changes in fiscal policy in the 1990s were progressive and pro-poor,
– Increasing social spending and its progressivity correcting strong urban bias (food subsidies): Progresa, Seguro Popular, Adultos Mayores, Apoyos Directos al Campo, basic services, …
– Interrupted after 2008/2010 → sharp decline of net indirect subsidies
• Redistributive effect has declined significantly since 2010 – Less progressive transfers (contributory pension schemes)– Increase in net indirect taxes (replacing oil revenues)
• The fiscal system has a significant redistributive effect on final income inequality,
… but a modest effect on disposable (and consumable) income inequality
23

Developing giants: Policy challenges
• Unequal distribution of capital (human and physical)
• Limited fiscal space (small formal sectors) and the need to keep prudential macroeconomic policies: – Weaker redistributive capacity, vulnerability to recessions
• Potentially regressive effects of addressing legitimate aspirations of the emerging middle class
– Expanding higher education, funding contributory social security programs or complementary private insurance schemes
• Limits of targeted social assistance to reduce high inequality– Unless increase in scale (efficiency might be compromised)– The political effects of a massive targeted redistribution
24

Developing giants: Policy implications
(cont.)
• Improving the distribution of primary income
– Crucial role of education policies– Market regulations that stimulate competition and dynamism
• Reduce opportunities for rent-seeking, corruption• Minimum wage (e.g. Mexico)
– Reducing labor market segmentation: • E.g. China, migration (Hukou system) and incomplete reform of SOE• By gender, …
– Corporate governance• Disproportional concentration of income and wealth at the top
– Wealth inequality:• Access to productive assets (i.e. land)• Taxation
25

Developing giants: Policy implications
(cont.)
• Improving existing redistributive schemes and exploring other territories:
– Increase the redistributive impact of transfers: • By increasing the scale of existing targeted policies.• By extending universality of benefits(fully universal or targeted to most vulnerable groups)
Example UBI in Mexico.
• Redesigning the contributory social security schemes and tax exemptions (private insurance, …)
– To make them less regressive, while still reaching their other goals (Example South Africa).
26
→

Developing giants: Policy implications
(cont.)
• Importance of evidence-based policies (research community can contribute)
– Overcoming the limitations of available data: • surveys combined (ideally integrated) with tax and social security
administrative data (examples of South Africa and Brazil)• National accounts (example of Mexico)• use of big data (example India)• Public listings (example of India or China)
– Assessment of the distributional impact of taxes, benefits and regulations• Balance between redistributive and efficiency goals• Detecting priorities for reform• Evaluating alternatives to each context (example of microsimulation)
27

www.wider.unu.eduHelsinki, Finland
THANKS!