Untapped opportunities for profitable growth - DNB · 1Q 09 2Q 09 3Q 09 4Q 09 1Q 10 2Q 10 3Q 10 4Q...
38
Transcript of Untapped opportunities for profitable growth - DNB · 1Q 09 2Q 09 3Q 09 4Q 09 1Q 10 2Q 10 3Q 10 4Q...

Untapped opportunities for profitable growth
Strong platform in Norway
2

Strong market shares Well positioned in home market – product areas and customer segments
Retail market
28 %
32 %
51 %
29 %
Corporate market
24 %
35 %
26 %
22%
Lending Deposits Policyholders’ funds Mutual fund assets
Lending* Deposits Policyholders’ funds Mutual fund assets
1Q 2011 * = share of lending from credit institutions
3
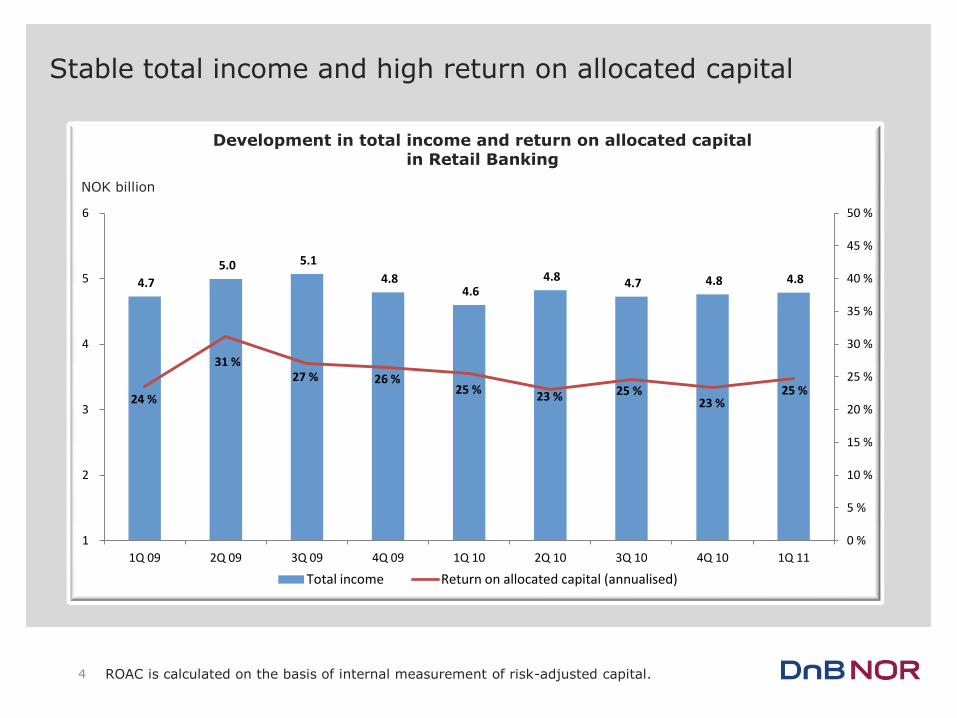
Stable total income and high return on allocated capital
ROAC is calculated on the basis of internal measurement of risk-adjusted capital. 4
4.7
5.0 5.1
4.8 4.6
4.8 4.7 4.8 4.8
24 %
31 % 27 % 26 %
25 % 23 % 25 %
23 % 25 %
0 %
5 %
10 %
15 %
20 %
25 %
30 %
35 %
40 %
45 %
50 %
1
2
3
4
5
6
1Q 09 2Q 09 3Q 09 4Q 09 1Q 10 2Q 10 3Q 10 4Q 10 1Q 11
Total income Return on allocated capital (annualised)
Development in total income and return on allocated capital in Retail Banking
NOK billion

Increasing growth – relatively stable interest spreads
Lending to and deposits from customers. Nominal values, excluding impaired loans. * Volume growth in Retail Banking in the period Jan-May 2011 (annualised)
Development in spreads Volume growth (annualised)
5
1.67% 1.67% 1.61%
1.69% 1.63%
0.42% 0.44% 0.53%
0.37% 0.40%
1.24% 1.26% 1.24% 1.24% 1.21%
1Q 10 2Q 10 3Q 10 4Q 10 1Q 11
Lending spread Deposit spread
Weighted spread
4.9 %
4.2 % 3.7 %
4.2 %
8.0 %
1.2 % 1.1 %
2.3 %
4.2 %
7.7 %
1Q 10 2Q 10 3Q 10 4Q 10 YTD*
Growth lending volumes Growth deposit volumes

Income is well balanced between products and segments
Excluding interest on allocated capital
23%
7%
13%
10% 5%
2%
12%
9%
9%
10% Mortgages lending
Corporate long term lending Consumer finance/ short-term credit Car finance
Investment and equipment finance Autolease/factoring
Other loans
Current account
Demand deposits
Other deposits
6
Net interest income 2010

Improved portfolio quality
Exposure at default (NOK billion) Corporate customers
Exposure at default (NOK billion) Personal banking customers
Low risk Medium risk High risk Low risk Medium risk High risk
7
416
127
45
5
458
132
38
4
PD 0.01% -
0.75 %
PD 0.75% -
2.0%
PD 2.0% - Net non
performing and
net doubtful
commitments
31 Dec 2009 31 March 2011
130
86
44
2
148
89
37
2
PD 0.01% -
0.75 %
PD 0.75% -
2.0%
PD 2.0% - Net non
performing
and net
doubtful
commitments 31 Dec 2009 31 March 2011
PD = Probability at default

Sound asset quality in mortgage loan portfolio in Retail Banking
Mortgage loans (NOK billion)
Mortgage loans based on actual collateral categories 8
397
52 28
430
52 22
Mortgage within 60 per cent of collateral value
Mortgage between 60 and 80 per cent of collateral value
Mortgage above 80 per cent of collateral value
31 Dec 2009 31 March 2011

Actual write-downs on loans significantly below normal levels
Corporate and personal customers - Retail Banking
NOK million
9
207
284
372 362
252
562 556 558 551 545
1Q 2010 2Q 2010 3Q 2010 4Q 2010 1Q 2011
Write-downs on loans and guarantees
Normalized write-downs on loans and guarantees

2.1 million personal
customers
200 000 corporate customers
1 million
insurance policyholders
130 000
non-life insurance
policyholders
600 000
mutual fund customers
400 000
mortgage loan customers
Out of 4 937 000 inhabitants:
Total customer base represents nearly half of the market
10
Estimated 40% of customers uses additional banks
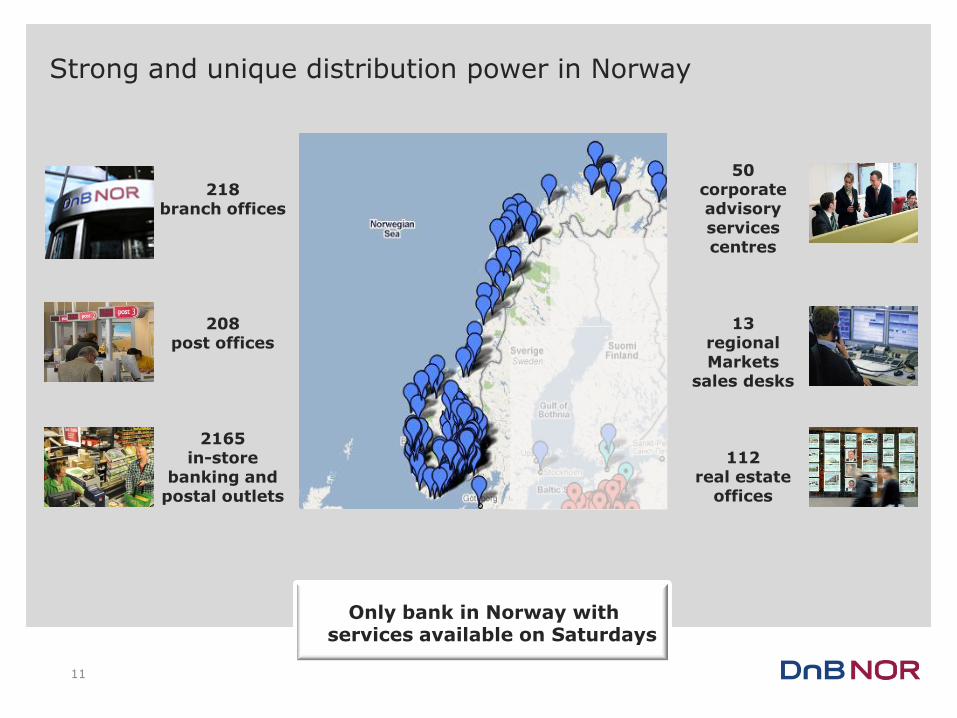
Strong and unique distribution power in Norway
50 corporate advisory services centres
13 regional Markets
sales desks
112 real estate
offices
218
branch offices
208 post offices
2165 in-store
banking and postal outlets
Only bank in Norway with services available on Saturdays
11
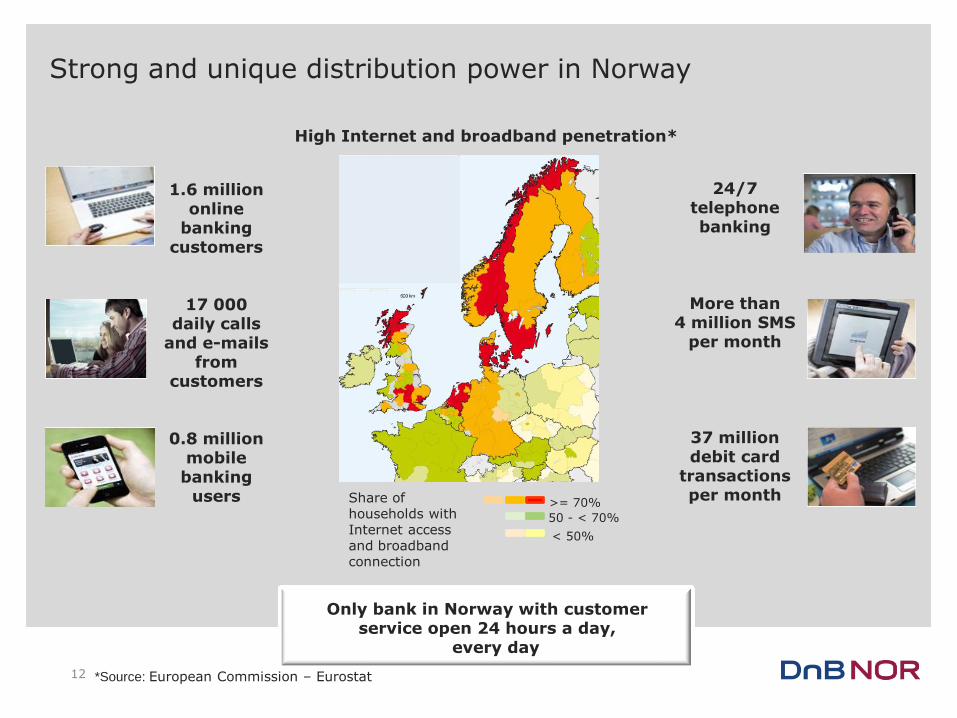
1.6 million
online banking
customers
17 000 daily calls
and e-mails from
customers
0.8 million mobile
banking users
24/7
telephone banking
More than 4 million SMS
per month
37 million debit card
transactions per month Share of
households with Internet access and broadband connection
>= 70%
50 - < 70%
< 50%
High Internet and broadband penetration*
Strong and unique distribution power in Norway
Only bank in Norway with customer service open 24 hours a day,
every day
12 *Source: European Commission – Eurostat

Having satisfied customers leads to long-term profitability
DnB NOR customer satisfaction personal banking customers
RepTrak reputation survey - DnB NOR
56.2
64.2
65.8
2009 2010 2011
62
70
72 73
2008 2009 2010 2011
13

Ambitions in Norway
Stable and high return on equity
Lending growth > national credit growth rate
Low and stable losses
14

Untapped opportunities for profitable growth
Strong platform in Norway
15

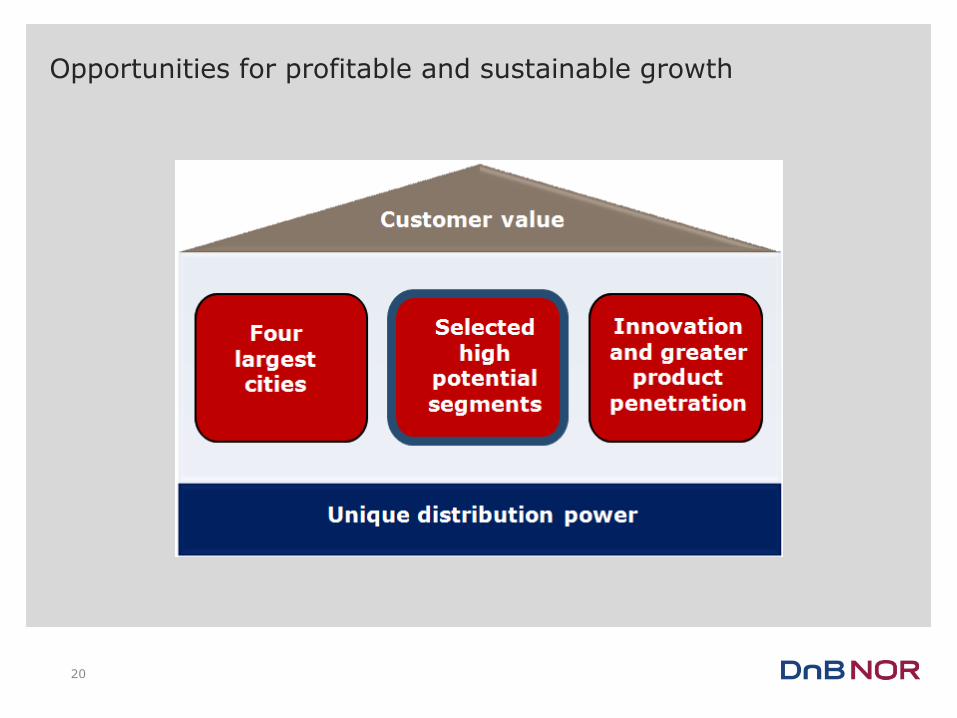
Opportunities for profitable and sustainable growth
16
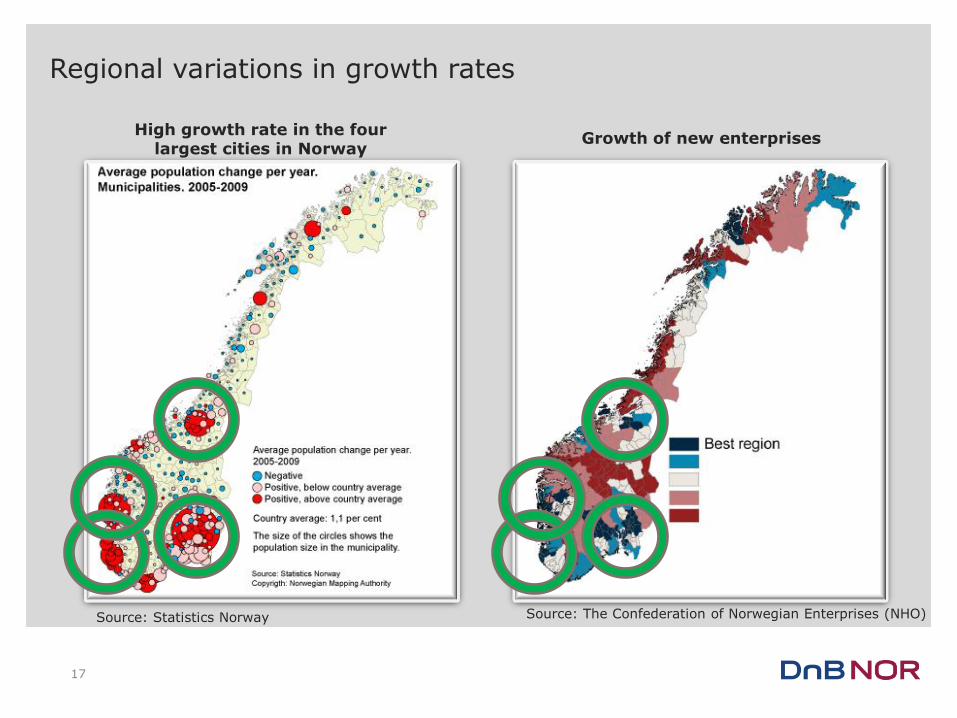
Regional variations in growth rates
Growth of new enterprises High growth rate in the four
largest cities in Norway
Source: Statistics Norway Source: The Confederation of Norwegian Enterprises (NHO)
17

We are well positioned for further growth
Low growth rate
High market share Low market share
High growth rate
Smaller cities East and North
Bergen
West coast
Oslo
Smaller cities West Trondheim Stavanger
18 Source: Statistics Norway – number of citizens

Growth on schedule in the four largest cities
Volume growth in Retail Banking in the period Jan-May 2011 (annualised) Banking market annualised based on 1Q 2011
Lending Deposits
Personal Banking
customers
Corporate customers
19
Banking market = 5.7%
Banking market = 6.4%
Banking market = 9.1%
Banking market = 3.8%
Opportunities for profitable and sustainable growth
20

High focus on selected segments with substantial potential
Young adults:
High net present value
Academics:
High potential segment
Affluent:
Very high potential segment
SME: Business offering
tailored to industry needs
1 2
3 4
21

Population growth among young adults ‒ increasing need for new housing
Source: Statistics Norway /DnB NOR Markets
-20 000
-10 000
0
10 000
20 000
30 000
40 000
50 000
1980 1988 1996 2004 2012 2020 2028 2036 2044 2052 2060
Population 20-34: y/y Completed homes
Highly competitive mortgage loan interest
rates
NOK 33 billion in ‘BLU’ loans
Cross-selling between a number of products
1
Distribution advantages home-university-work
Marketing and sponsorships
22
Development in young population vs completed homes

Exclusive distribution to academics – attractive customer segment with high growth
Best market terms – also for self-employed persons and SMEs
Product range to suit both professional and private
needs
Exclusive distribution agreement with the
Federation of Norwegian Professional Associations
2
Source: Norwegian Professional Associations
128
133
139
126
131
137
144
148
154
2003 2004 2005 2006 2007 2008 2009 2010 2011
Increasing number of members joining the Federation of Norwegian Professional Associations (in 1000)
23

Well positioned to be the natural choice for Norway’s most affluent bank customers
Assets under management – 33% annual growth rate
Proven excellent quality of management of proprietary mutual funds
Wide product range – including non-proprietary products
3
24

The number of newly established enterprises increased over the last 12 months
Corporate and personal needs
Entrepreneurs
Franchises
Academics
Source: Statistics Norway
4
25

Export industries are generating growth in the SME segment 4
Norwegian exports by sector in 2010
50 %
6 %7 %
9 %
28 %
Oil/gas Food/seafood
Shipping Other commodities
Other
Source: The Confederation of Norwegian Enterprises (NHO) Source: Statistics Norway
26

We are the preferred bank for CM solutions in Norway –important driver for stable funding
Products tailored to customer size and
growth
Services available on Saturdays through post
offices
Local and national bank
Source: Large Corporate Banking Survey, Norway
(116) (88)
(110) (91)
(70) (53)
(66) (59)
(48) (39)
(27) (26)
(76) (60)
(73) (63)
(46) (37)
(47) (39)
(34) (22)
(19) (22)
Use bank for domestic cash management
Use bank for overall international cash management
DnB NOR
Bank #2
Bank #3
Bank #4
Bank #5
Bank #6 2010
2009
4
27
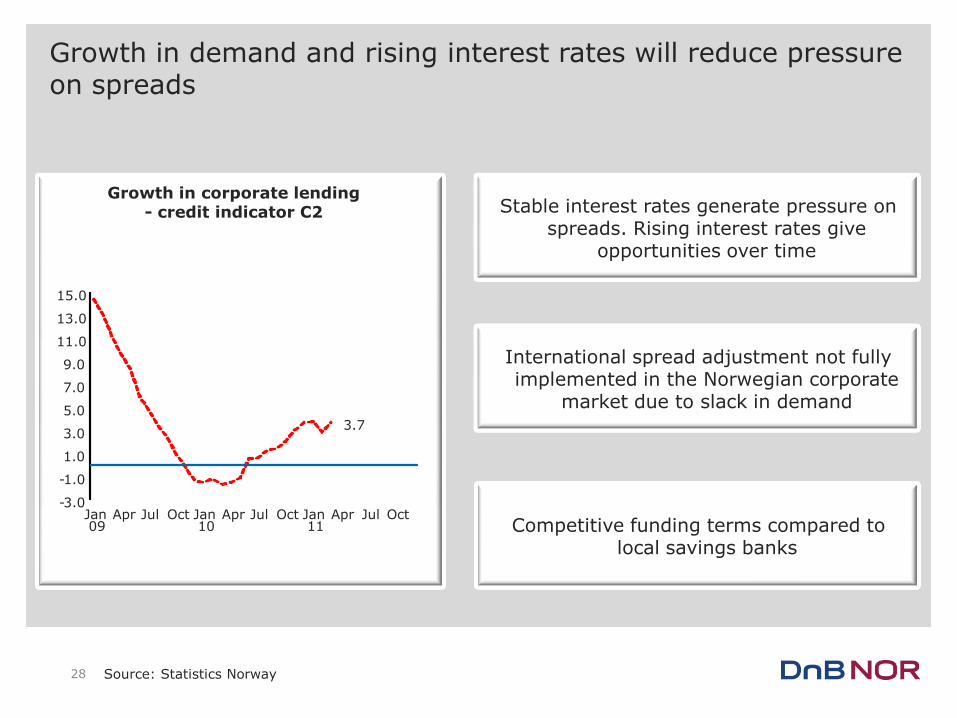
Growth in demand and rising interest rates will reduce pressure on spreads
Stable interest rates generate pressure on spreads. Rising interest rates give
opportunities over time
International spread adjustment not fully implemented in the Norwegian corporate
market due to slack in demand
Competitive funding terms compared to local savings banks
3.7
- 3.0
- 1.0
1.0
3.0
5.0
7.0
9.0
11.0
13.0
15.0
Jan 09
Apr Jul Oct Jan 10
Apr Jul Oct Jan 11
Apr Jul Oct
Growth in corporate lending - credit indicator C2
Source: Statistics Norway 28

Opportunities for profitable and sustainable growth
29
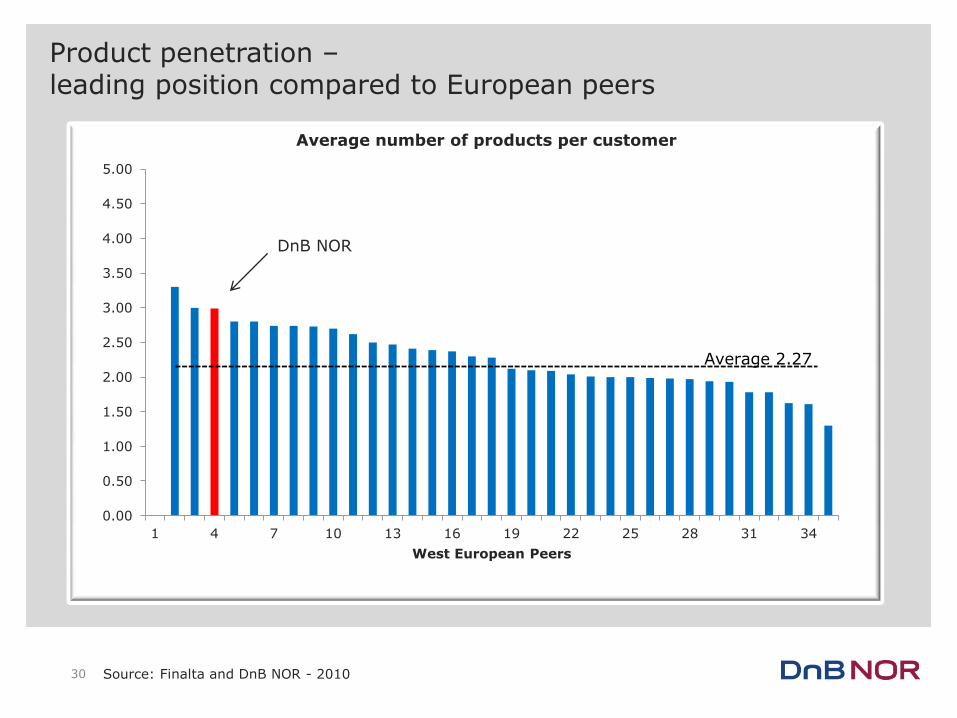
Product penetration – leading position compared to European peers
Source: Finalta and DnB NOR - 2010
0.00
0.50
1.00
1.50
2.00
2.50
3.00
3.50
4.00
4.50
5.00
1 4 7 10 13 16 19 22 25 28 31 34
West European Peers
Average 2.27
DnB NOR
30
Average number of products per customer

Still untapped potential – pricing scheme encourages greater product penetration
0.00
0.50
1.00
1.50
2.00
2.50
3.00
3.50
4.00
4.50
5.00
1 4 7 10 13 16 19 22 25 28 31 34
West European Peers
Average 2.27
DnB NOR
DnB NOR loyalty programme customers
31
Average number of products per customer
Source: Finalta and DnB NOR - 2010

Innovative products increase sales
Find your ”home” app Start-up enterprise app
Buy a car app – easier and more efficient
32

New pension reform requires more private savings
Source: Finance Norway (FNO)
Example: Pension payment for a person born in 1963, 40-year service period,
retirement at 67
Pro-active offering of professional advice and savings solutions
New product range and good track record
Discretionary asset management
More than 45% of top-rated mutual funds (Morningstar)
33
150
155
160
165
170
175
180
185
Former national insurance scheme
New national insurance scheme
NOK 1000
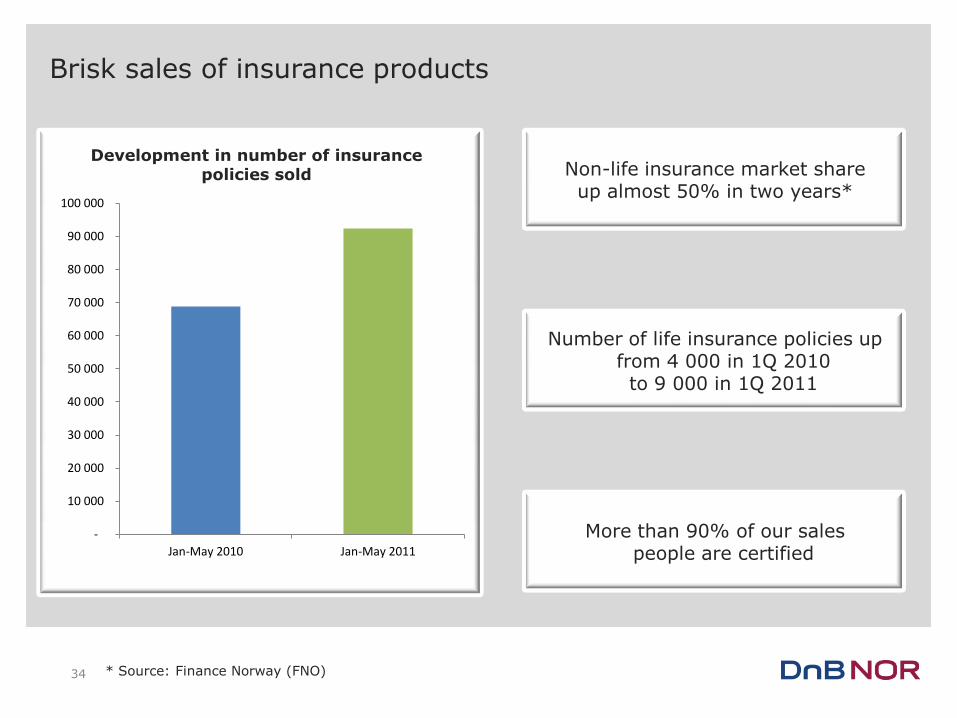
Brisk sales of insurance products
Non-life insurance market share up almost 50% in two years*
Number of life insurance policies up from 4 000 in 1Q 2010 to 9 000 in 1Q 2011
More than 90% of our sales people are certified
Development in number of insurance policies sold
* Source: Finance Norway (FNO) 34
-
10 000
20 000
30 000
40 000
50 000
60 000
70 000
80 000
90 000
100 000
Jan-May 2010 Jan-May 2011
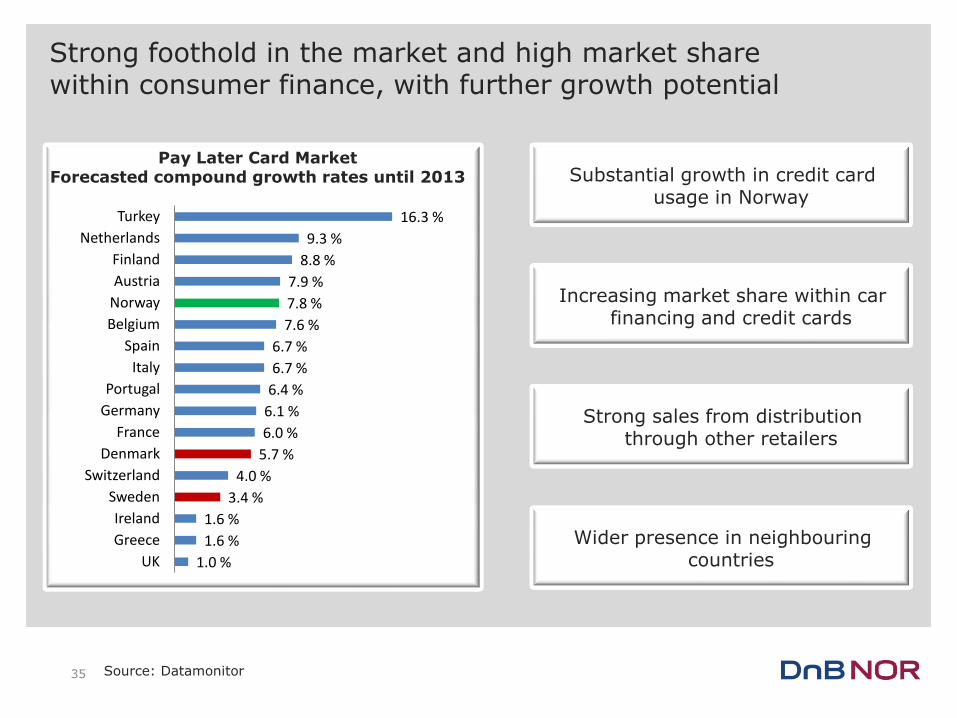
Strong foothold in the market and high market share within consumer finance, with further growth potential
Source: Datamonitor
Pay Later Card Market Forecasted compound growth rates until 2013
1.0 %
1.6 %
1.6 %
3.4 %
4.0 %
5.7 %
6.0 %
6.1 %
6.4 %
6.7 %
6.7 %
7.6 %
7.8 %
7.9 %
8.8 %
9.3 %
16.3 %
UK
Greece
Ireland
Sweden
Switzerland
Denmark
France
Germany
Portugal
Italy
Spain
Belgium
Norway
Austria
Finland
Netherlands
Turkey
Substantial growth in credit card usage in Norway
Increasing market share within car financing and credit cards
Strong sales from distribution through other retailers
Wider presence in neighbouring countries
35

Close integration between real-estate business and home loan sales, with further growth potential
Increase in number of real estate sales through our real estate agents.
Leads to home loan sales six times greater
than actual housing sales: Increasing hit rate on mortgage
leads – 36 000 leads yearly
New projects – cooperation between brokers, private and corporate
sales
Most satisfied and most loyal customers
Front runner in online solutions
Market leader in Norway – strategy for growth
36
3 901
4 096
4 414
5 234
1Q 2008 1Q 2009 1Q 2010 1Q 2011
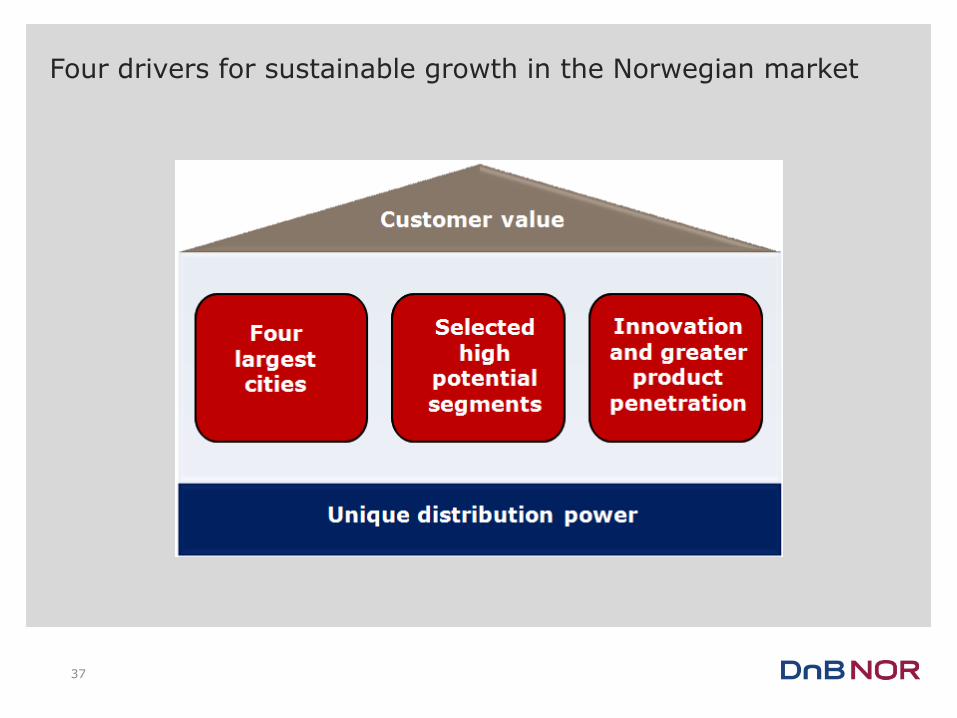
Four drivers for sustainable growth in the Norwegian market
37
38