Data Infosys Capabilites Presentation for State Govt Department
CFD & OPTIMIZATION 2011 - 048An ECCOMAS Thematic Conference
23-25 May 2011, Antalya TURKEY
UNSTRUCTURED MESH CAPABILITES FOR SUPERSONIC WINGDESIGN AT LOW SPEED CONDITIONS
Michele Gaffuri∗, Joel Brezillon∗
∗German Aerospace Center, Institute of Aerodynamics and Flow TechnologyLilienthalplatz 7, D-38108 Braunschweig
e-mail: {michele.gaffuri,joel.brezillon}@dlr.de
Key words: CFD, MDO, Vortex dominated flow, Unstructured mesh, Supersonic wing,High lift devices
Abstract. In this paper the reliability of using unstructured meshes for the CFD simula-tion of the flow over a low aspect-ratio wing in low speed configuration is investigated. It isintended to integrate such mesh strategy in a high-fidelity aerodynamic shape optimizationloop for the design of high lift devices, so particular care is given to the set-up of a suitablemeshing procedure usable in optimization context. Meshes are created using the grid gen-erators Solar and Centaur; the CFD analysis is carried out using the DLR-TAU solver onthe EPISTLE wing-body configuration with drop-nose slat. Results are compared to windtunnel test data and to CFD results obtained on a structured mesh. It is shown that agrid of around 10 million points, if carefully conceived, is able to predict with reasonablygood accuracy the aerodynamic loads and the overall flow features. Some discrepanciesin the detection of vortical flow features are found, but they do not have significant influ-ence on the computed loads. The application of the method at various Reynolds numbersconfirms the importance of the prismatic layer thickness to accurately capture the vorticalflow features.
1

Michele Gaffuri, Joel Brezillon
1 INTRODUCTION
Three dimensional, high fidelity shape optimization of an aircraft at take-off and land-ing conditions sets some challenges to the engineer, especially when designing a supersonicaircraft. In the case of highly swept, thin, low aspect ratio wings the flow is vortex dom-inated and thus highly complex. Computational fluid dynamics (CFD) analysis on thistype of configuration can be carried out using structured hexahedral grids [1] [2] or un-structured hybrid grids, composed with a mix of hexahedral, prismatic and tetrahedralcells. Building a structured, multiblock, hexahedral mesh for a complex geometry thatincludes high lift devices (HLD), control surfaces and nacelles is an extremely time con-suming task. Contrarily, unstructured meshes could provide the necessary flexibility torepresent complex and changing geometries in a reliable and fast way. With this approachhowever, the problem of computational cost arises since for achieving the same accuracyas with structured meshes the number of grid points has to be increased: in the contextof finite volume CFD solvers, the aspect ratio of the tetrahedral cells has to be kept smallin order to ensure a good flow resolution while hexahedra with large aspect ratio can beadvantageously used to discretise the wing surface.
Keeping a reasonable computational cost is also an issue when dealing with vorticalflows, where the vortices may rapidly diffuse when using too coarse tetrahedral meshes.The use of grid adaptation [3] allows the increase of the flow accuracy by refining the meshonly where the flow resolution has to be increased. When doing HLD design however gridadaptation is often problematic for two reasons: firstly the turnaround time for a CFDcomputation may be too high for the design phase, when typically one wants to analyzemany different configurations; secondly when the design process is carried out using anaerodynamic shape optimization framework [4], the optimum may move towards bettergrid adaptation and not towards better aerodynamic performances.
In the present work a systematic study on unstructured meshes is performed in orderto assess their qualities for the design of a delta wing featuring HLD.
Section 2 describes the tools employed in the project, the geometry used for the studyand the available data. Section 3 gives a description of the mesh generation process. Theresulting grids are assessed at several flow conditions in section 4. At the same time theinfluence of several turbulence models is assessed. These results are finally discussed insection 5.
2 TOOLS AND METHODS
2.1 Case study
The analysis is carried out on the EPISTLE [5] wing-body configuration. This super-sonic delta wing concept has a blunt leading edge and includes, in its take-off and landingconfiguration, a long non slotted slat designed by the DLR during the EPISTLE Euro-pean project. Experimental data are available on this configuration at various Reynoldsnumbers and angles of incidence.
2

Michele Gaffuri, Joel Brezillon
A 4.2 million points structured mesh with a C-topology is also available (see left handside of Figure 2). It has been originally built by NLR during the EPISTLE project andwas proven to be fine enough to well capture the flow physics. The C-shape ensuresthat the region downstream of the wing trailing edge is correctly resolved. New CFDcomputations on this mesh are carried out and are considered as reference for the presentanalysis.
2.2 Mesh generation
The guidelines for mesh generation established during the EPISTLE project [6] areused as a first guess for the setup of the grid generation. Two unstructured mesh gener-ators are considered: Centaur [7] and Solar [8]. Both are hybrid mesh generators: theycreate a near field prismatic mesh for the correct capture of the boundary layer and anouter tetrahedral mesh. Main difference between the two is that Centaur creates trian-gular surface meshes while Solar creates quad dominant surface meshes. Accuracy of thesolution, mesh sizes and possibility of automatic mesh generation are used as terms ofthe comparison between the meshing tools used. The created meshes can be consideredO-shaped, since the prismatic layer region completely surrounds the geometry. This is adrawback of the unstructured methodology: creating a C-shaped hybrid grid for a thicktrailing edge wing, although possible, would have required extensive CAD manipulation:this would have been a problem in view of the integration in the optimization process.
2.3 CFD flow solver
Numerical simulations are carried out using the DLR-TAU unstructured finite volumesolver [9]. The Reynolds-averaged Navier-Stokes equations are solved using a second ordercentral space scheme with artificial matrix dissipation and an implicit Euler temporalscheme. The system is solved using the LUSGS method. Three models are used forthe additional turbulence equations: the one equation Spalart-Allmaras model [10] withEdwards modification [11], Menter’s 2 equations SST k-ω model [12] and a ReynoldsStress model based on the Speziale-Sarkar-Gatski model in the field and on the Launder-Reece-Rodi near the walls [13]. Turbulence modelling is especially important for this typeof configurations since it can have an impact on the vortex onset location. On a smoothsurface such as a blunt leading edge wing the vortex development strongly depends on theReynolds number, thus correct estimation of viscous phenomena is capital to correctlyestimate the suction effect of the vortex.
Computations are done on the DLR CASE cluster, a recently updated Linux clustersystem consisting of 640 nodes. Each node is equipped with two 6-cores Intel Xeonprocessors and 24 GB of RAM memory. Most of the computations have been donebefore the update, when the nodes were equipped with two 4-cores Xeon. The DLR-TAUcode runs in parallel on the cluster thanks to an MPI approach. Computations on theunstructured mesh are performed using 8 nodes, while on the structured mesh between 4
3

Michele Gaffuri, Joel Brezillon
and 6 nodes were used, depending on the cluster load.
2.4 Wind tunnel data
The geometry was tested during 2 wind tunnel campaigns. A first campaign wasconducted in the frame of the European project EPISTLE at the ONERA F1 wind tunnelfacility in 2001 . The pressurised wind tunnel (max ambient pressure: 3.4 bar) allowedthe testing with flow parameters similar to the flight conditions: Reynolds numbers upto 22.5 millions were reached, with a Mach number of 0.25. The 1:22 scaled steel modelwas mounted on a three struts device for this test campaign.
For assessing the accuracy of the CFD method at high Reynolds numbers, we use theCFD results on the aforementioned structured mesh, which are validated towards theseWT data.
A second test campaign took place on the same model in 2003 at the DNW-NWBwind tunnel located in Braunschweig, Germany. This time the model was mounted ona rear sting support. Tests have been performed at 2 Reynolds numbers: 5 millions and6.5 millions. In addition to forces and moments data, some oil flow pictures have beengenerated during the tests.
The model is equipped with about 500 pressure sensors. In the present work pressuredata on four wing sections (y1 = 0.241, y2 = 0.361, y3 = 0.582, y4 = 0.806) are used inorder to assess the CFD results.
2.5 Test case conditions
The reference case considered has a Mach number of 0.25, a Reynolds number of22.5 · 106 and an angle of attack of 11.22°. This case is analyzed in detail, but CFDsimulations are also carried out at other conditions - low Reynolds number computations(Re=5 · 106, Re=6.5 · 106) and complete polars at the aforementioned flight conditions- in order to be able to draw more general conclusions. CFD computations are alwaysperformed on the half geometry, taking advantage of the geometry and flow symmetry.
3 UNSTRUCTURED MESH GENERATION
The main idea behind the unstructured mesh generation strategy is the maximizationof the prismatic layer thickness. In fact the accuracy of the prisms is higher then that ofthe tetrahedra, so in the ideal case, we would like to extend the prismatic layer so thatthe vortical flows completely reside in it.
Efforts are made to reduce as much as possible the total number of points used in themesh. A value in the order of 10 million points is considered as the maximum practicalmesh size for the successive design and optimization phases.
4

Michele Gaffuri, Joel Brezillon
3.1 Solar mesh
Mesh generation in BAE Systems’ software Solar (version 14 is used) is setup usingthe Java front-end Raven. The geometry has to be input in IGES format. Preparationsteps include the aggregation of surfaces in zones, the definition of trimmed surfaces, thecreation of the far-field surface and the symmetry plane, and the creation of so calledsources: entities that define the required cell size, as well as the cells’ anisotropy, atselected locations. In practice many sourcing strategies are built-in so one only has tochoose a surface (e.g. the wing surface) and the corresponding sourcing method (”winganisotropic fine”, for example). Nevertheless, as these meshing strategies are developed forconventional (i.e. Airbus/Boeing like) transport aircrafts, the sources have to be modifiedin order to create a good quality mesh for the case at hand.
Surface mesh generation is based on an advancing front technique and creates mainlyquadrilaterals. A structured surface mesh can be created on quadrilateral, untrimmedsurfaces: it is advised to use this feature on the wing trailing edges. From the surfacemesh the prismatic layer is grown with an advancing layer method, with parametersdefined by the user to account for the required flow to be resolved. In this study theprismatic mesh is set as to have a y+ of 1 according to flat plate theory. Finally thetetrahedral outer mesh is created using a constrained Delauney method and connected tothe prismatic zone via a layer of pyramids.
The number of prismatic layers is not selected directly by the user. Instead, basedon the defined first cell height and growth ratio, the number of layers to be generated ischosen so that the cell aspect ratio in the last layer is 1. This has the effect that refiningthe surface grid reduces the total height of the prismatic layer. A trade-off has to be foundbetween spanwise and chordwise resolution on one hand, and prismatic layer height onthe other.
Another critical point is the wing-fuselage intersection. It is known that hybrid gridgenerators have problems in creating the prismatic layer in presence of angles. The totalheight of the prismatic layer is reduced either by reducing the first cell height or bydecreasing the total number of cells (a process called ”chopping”). The end result isthat the first tetrahedral cell at the intersection is too coarse to correctly resolve the flow.During the meshing process using Solar, no surface mesh refinement has been performed atthe intersection, in an effort to keep the prismatic layer thickness as large as possible. Theprice to pay is the low resolution of the tetrahedral mesh near the intersection (Figure 1).
Before being able to use the mesh in a CFD simulation two additional steps are re-quired. First, since Solar can create elements not accepted by the flow solver TAU (namelyelements with hanging faces) the mesh has to be modified to eliminate them by splittingor collapsing cells. A tool (called make conform) exists to perform this action. Secondlythe mesh smoothness can be increased significantly using the DLR-TAU grid tools. Thisprocess takes a couple of minutes but can increase the convergence rate of the CFDcomputation significantly.
5

Michele Gaffuri, Joel Brezillon
(a) Structured mesh (b) Centaur mesh (c) Solar mesh
Figure 1: Mesh slices normal to the longitudinal (x) axis at location x=2m.
It has to be noted that Solar has sometimes trouble when connecting the far-field meshto the prismatic layer (more precisely, to the buffer layer of pyramids and tetrahedrasurrounding the prism layer). This is usually caused by the excessive anisotropy of thesurface mesh. In this case decreasing the anisotropy value of the sources is required to geta valid volume mesh. The price to pay is an increase in the total number of grid points.
After several tests the final mesh used for the study consists of 11.5 million points with33 layers of prismatic cells (Figure 2 right).
Figure 2: Fuselage and wing suction-side surface meshes. From left to right: reference structured mesh,Centaur mesh, Solar mesh.
6
Michele Gaffuri, Joel Brezillon
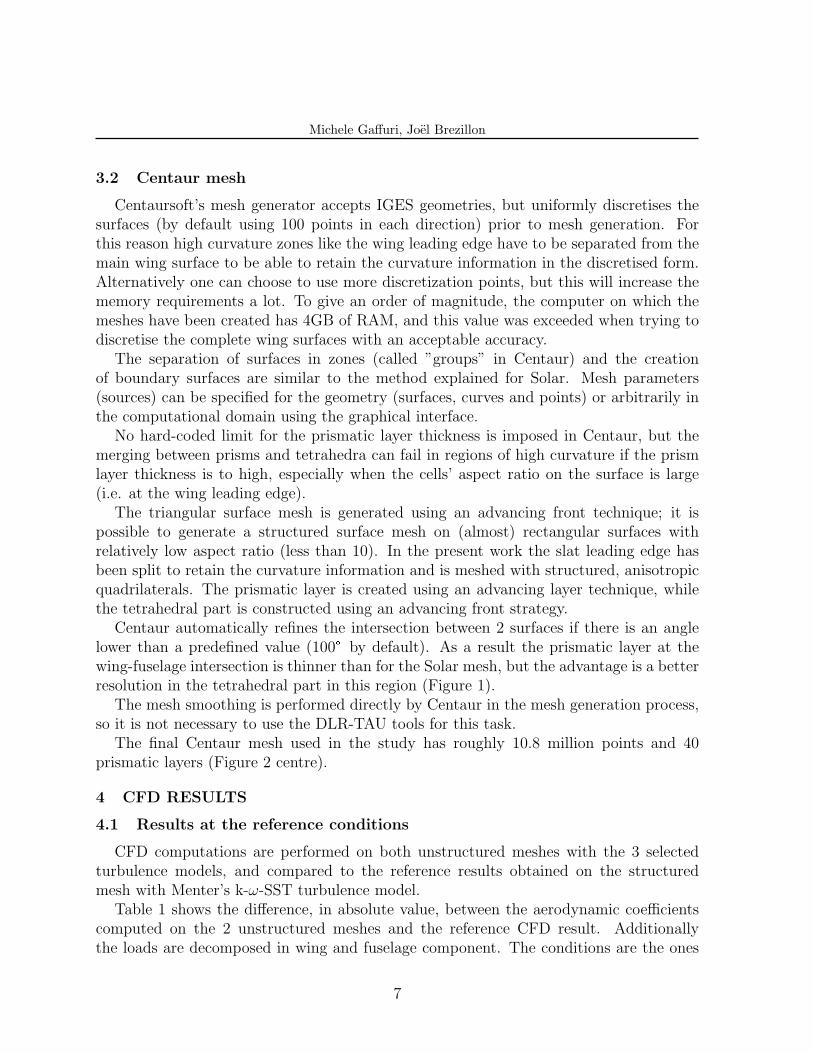
3.2 Centaur mesh
Centaursoft’s mesh generator accepts IGES geometries, but uniformly discretises thesurfaces (by default using 100 points in each direction) prior to mesh generation. Forthis reason high curvature zones like the wing leading edge have to be separated from themain wing surface to be able to retain the curvature information in the discretised form.Alternatively one can choose to use more discretization points, but this will increase thememory requirements a lot. To give an order of magnitude, the computer on which themeshes have been created has 4GB of RAM, and this value was exceeded when trying todiscretise the complete wing surfaces with an acceptable accuracy.
The separation of surfaces in zones (called ”groups” in Centaur) and the creationof boundary surfaces are similar to the method explained for Solar. Mesh parameters(sources) can be specified for the geometry (surfaces, curves and points) or arbitrarily inthe computational domain using the graphical interface.
No hard-coded limit for the prismatic layer thickness is imposed in Centaur, but themerging between prisms and tetrahedra can fail in regions of high curvature if the prismlayer thickness is to high, especially when the cells’ aspect ratio on the surface is large(i.e. at the wing leading edge).
The triangular surface mesh is generated using an advancing front technique; it ispossible to generate a structured surface mesh on (almost) rectangular surfaces withrelatively low aspect ratio (less than 10). In the present work the slat leading edge hasbeen split to retain the curvature information and is meshed with structured, anisotropicquadrilaterals. The prismatic layer is created using an advancing layer technique, whilethe tetrahedral part is constructed using an advancing front strategy.
Centaur automatically refines the intersection between 2 surfaces if there is an anglelower than a predefined value (100° by default). As a result the prismatic layer at thewing-fuselage intersection is thinner than for the Solar mesh, but the advantage is a betterresolution in the tetrahedral part in this region (Figure 1).
The mesh smoothing is performed directly by Centaur in the mesh generation process,so it is not necessary to use the DLR-TAU tools for this task.
The final Centaur mesh used in the study has roughly 10.8 million points and 40prismatic layers (Figure 2 centre).
4 CFD RESULTS
4.1 Results at the reference conditions
CFD computations are performed on both unstructured meshes with the 3 selectedturbulence models, and compared to the reference results obtained on the structuredmesh with Menter’s k-ω-SST turbulence model.
Table 1 shows the difference, in absolute value, between the aerodynamic coefficientscomputed on the 2 unstructured meshes and the reference CFD result. Additionallythe loads are decomposed in wing and fuselage component. The conditions are the ones
7
Michele Gaffuri, Joel Brezillon
Solar CentaurSAE kω RSM SAE kω
W F T W F T W F T W F T W F T
CL [10−4] 6 2 5 1 4 3 8 15 23 23 4 19 7 8 1CD [10−4] 4 0 4 2 1 3 4 4 8 1 1 2 1 2 0CDP [10−4] 3 1 4 3 1 4 4 4 8 1 1 2 1 2 0CDV [10−4] 1 1 1 1 1 0 0 0 0 1 0 1 1 1 2CMy [10−4] 21 3 18 10 9 2 23 24 1 32 2 30 16 1 16
Table 1: Absolute value of the difference between unstructured mesh CFD results and the validated CFDresult on the structured mesh. Re = 22.5 · 106, M = 0.25, α = 11.22o. Column W, F and T referrespectively to the loads on the wing, on the fuselage, and the sum of both components.
Solar CentaurSAE kω RSM SAE kω
CL 0.96 0.97 0.80 0.83 1.01CD 0.71 1.21 1.57 0.86 0.79
CMy 2.00 0.67 1.17 4.00 1.67
Table 2: Difference between unstructured mesh computations and WTT results normalised with thecorresponding deviation of the validated structured mesh result. Re = 22.5 · 106, M = 0.25, α = 11.22o.
taken as reference: Reynolds number 22.5 · 106, Mach number 0.25 and angle of attack11.22°. The RSM computation on the Centaur mesh did not converge, so it is not shownhere. All turbulence models give satisfying results, with the Spalart-Allmaras modelshowing higher discrepancy in terms of wing pitching moment. This suggests a differencein pressure distribution, probably due to differences in the main vortex detection. TheRSM computation on the Solar mesh also experiences large pitching moment discrepanciesboth on the wing and the fuselage. Interestingly these effects compensate so that the totalvalue does not differ much from the reference.
For assessing the overall capabilities of the unstructured meshes, the difference betweenthe loads obtained in the CFD and those measured during the wind tunnel tests are shownin Table 2. In this table values are expressed relative to the difference between WTTand validated CFD, in such a way that a value of 1 expresses a similar accuracy to thestructured mesh results.
From a purely qualitative point of view, the flow physics is correctly captured usingthe unstructured meshes, as can be seen in Figure 3 and 4. Figure 4 in particular usesthe normalised helicity value as a vortex detector. This value is computed as follows:
Hn =−→u · −→ω|−→u | · |−→ω |
(1)
where −→u is the velocity vector and −→ω the vorticity vector. In fact the normalised helicityrepresents the cosine of the angle between helicity and vorticity and thus is a good detectorof vortical flow: in the vortex core the vorticity vector is aligned with the velocity vector,
8

Michele Gaffuri, Joel Brezillon
(a) (b)
(c)
Figure 3: Streamlines illustrating the vortical flow on (a) the structured mesh, (b) the Solar mesh, (c) theCentaur mesh. Some prismatic layer mesh cuts are shown for the unstructured meshes. Re = 22.5 · 106,M = 0.25, α = 11.22o.
Figure 4: Vortical flow topology highlighted by normalised helicity isosurfaces of |Hn| = 0.95 paintedaccording to the pressure value. Re = 22.5 · 106, M = 0.25, α = 11.22o. k-ω-SST turbulence model.From left to right: structured mesh, Solar mesh, Centaur mesh.
resulting in a Hn value of ±1, with the sign depending on the rotation direction.The main vortex, developing at the wing root, and the vortices on the inboard and
outboard slats are all detected. The main vortex, however, seems to be confined in theprismatic layer, and looks more flattened than on the reference result. This behaviouris caused by the dissipative effect of the tetrahedral mesh. Moreover the unstructured
9
Michele Gaffuri, Joel Brezillon
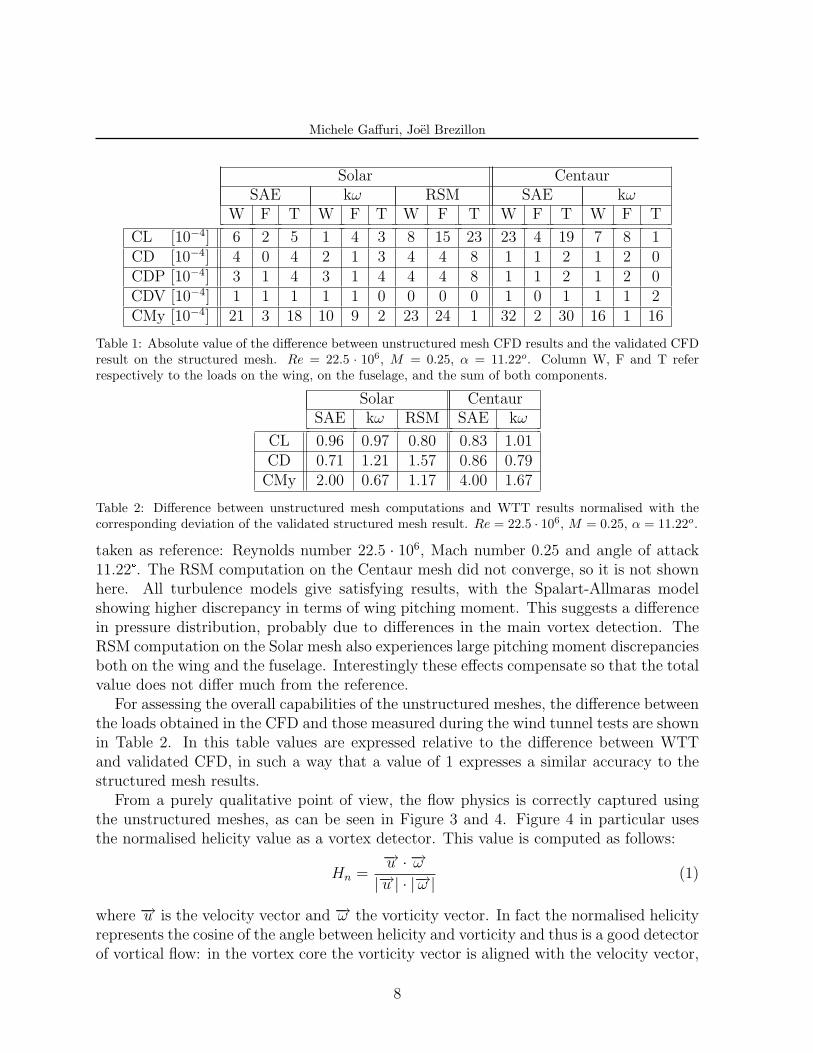
(a) Reference result (b) Solar mesh, SAE (c) Solar mesh, kω
(d) Solar mesh, RSM (e) Centaur mesh, SAE (f) Centaur mesh, kω
Figure 5: Skin friction plots on the suction side of the wing, colours show the pressure coefficient.Re = 22.5 · 106, M = 0.25, α = 11.22o.
meshes cannot track the main vortex in the wake region. The Solar mesh has even troublein keeping track of the vortex in the wing trailing edge region (Figure 4).
Additionally, the unstructured meshes predict a vortical structure developing from theinner end of the outboard slat. This is not seen in the structured mesh. It is difficult tosay if this flow feature is incorrectly predicted by the unstructured meshes, or simply notcaptured by the structured mesh, which is much coarser then the unstructured ones inthe spanwise direction.
In Figure 5, which shows the skin friction lines, it can be seen that the location of themain vortex in all the unstructured mesh simulations seems to differ from the referenceresult. The computation on the Centaur mesh with the k-ω turbulence model seems togive the better prediction in terms of vortex location.
The vortex is stronger in the Solar mesh result with SA model (Figure 6, cut plane 1)
10

Michele Gaffuri, Joel Brezillon
Figure 6: Pressure coefficient distribution on selected iso-y wing sections. Re = 22.5 · 106, M = 0.25,α = 11.22o.
compared to the reference results. The Solar mesh coupled with the k-ω and RSM modelsgive the right vortex intensity, as far as the pressure level on the wing goes. Results onthe Centaur mesh show a weaker vortex which is dissipated to quickly (it is almost notdetected on Figure 6, cut plane 2). Solar results still show the vortex on section 2, albeittoo upstream compared to the reference (for which the vortex crosses section 2 near thetrailing edge).
Suction peaks at the drop-nose slat’s deflection line are overestimated (compared tothe reference result), especially when using the Spalart-Allmaras turbulence model, andare in best agreement with the reference results in the case of the Solar mesh with the k-ωand RSM turbulence models. Discrepancies near the slat leading edge between resultson structured and unstructured mesh could be due to the fact that the unstructuredmeshes are more refined in that region and can capture smaller flow details. Unfortunatelypressure data coming from wind tunnel do not have the required resolution to crosscheckthis result.
On the wing pressure side, where the flow is attached, all meshes and all turbulencemodels are able to get the right pressure distributions. The discrepancies between CFDand WTT on the pressure side (see for instance section 3 in Figure 6) are due to the 3struts mounting system that locally modifies the flow.
4.2 Complete polar
A complete polar has been computed on both unstructured meshes at the referenceflow conditions using the Spalart-Allmaras turbulence model.
11
Michele Gaffuri, Joel Brezillon
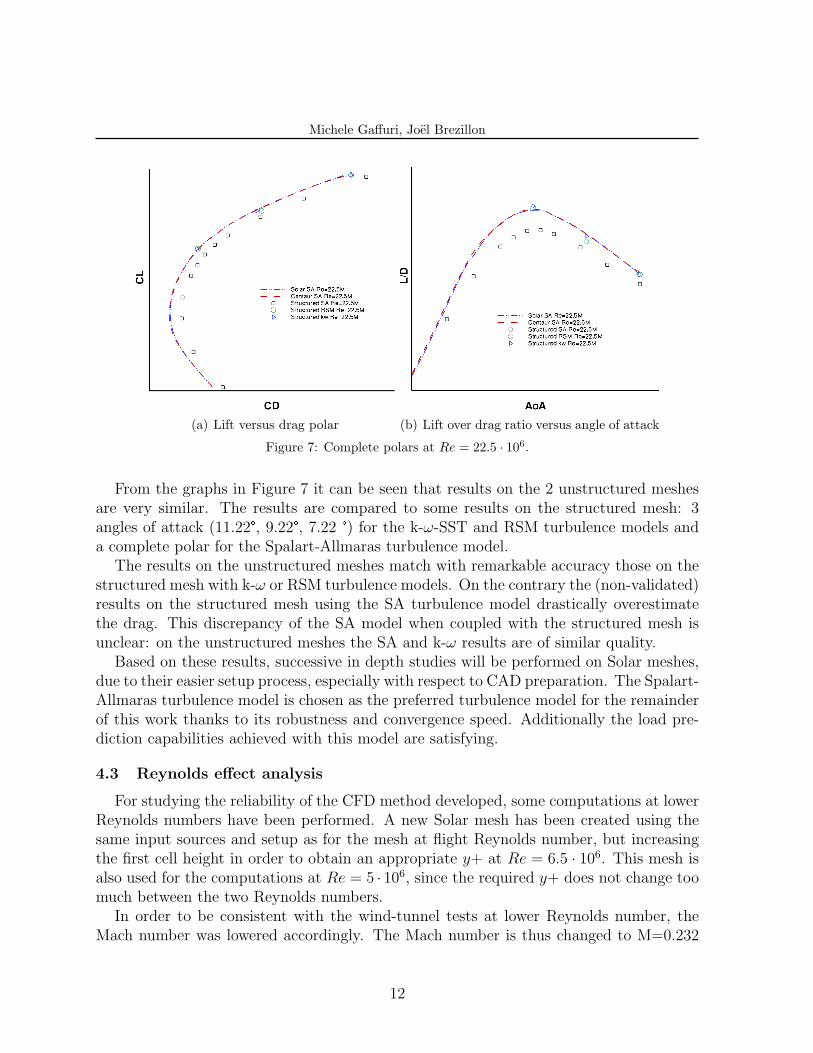
(a) Lift versus drag polar (b) Lift over drag ratio versus angle of attack
Figure 7: Complete polars at Re = 22.5 · 106.
From the graphs in Figure 7 it can be seen that results on the 2 unstructured meshesare very similar. The results are compared to some results on the structured mesh: 3angles of attack (11.22°, 9.22°, 7.22 °) for the k-ω-SST and RSM turbulence models anda complete polar for the Spalart-Allmaras turbulence model.
The results on the unstructured meshes match with remarkable accuracy those on thestructured mesh with k-ω or RSM turbulence models. On the contrary the (non-validated)results on the structured mesh using the SA turbulence model drastically overestimatethe drag. This discrepancy of the SA model when coupled with the structured mesh isunclear: on the unstructured meshes the SA and k-ω results are of similar quality.
Based on these results, successive in depth studies will be performed on Solar meshes,due to their easier setup process, especially with respect to CAD preparation. The Spalart-Allmaras turbulence model is chosen as the preferred turbulence model for the remainderof this work thanks to its robustness and convergence speed. Additionally the load pre-diction capabilities achieved with this model are satisfying.
4.3 Reynolds effect analysis
For studying the reliability of the CFD method developed, some computations at lowerReynolds numbers have been performed. A new Solar mesh has been created using thesame input sources and setup as for the mesh at flight Reynolds number, but increasingthe first cell height in order to obtain an appropriate y+ at Re = 6.5 · 106. This mesh isalso used for the computations at Re = 5 · 106, since the required y+ does not change toomuch between the two Reynolds numbers.
In order to be consistent with the wind-tunnel tests at lower Reynolds number, theMach number was lowered accordingly. The Mach number is thus changed to M=0.232
12
Michele Gaffuri, Joel Brezillon
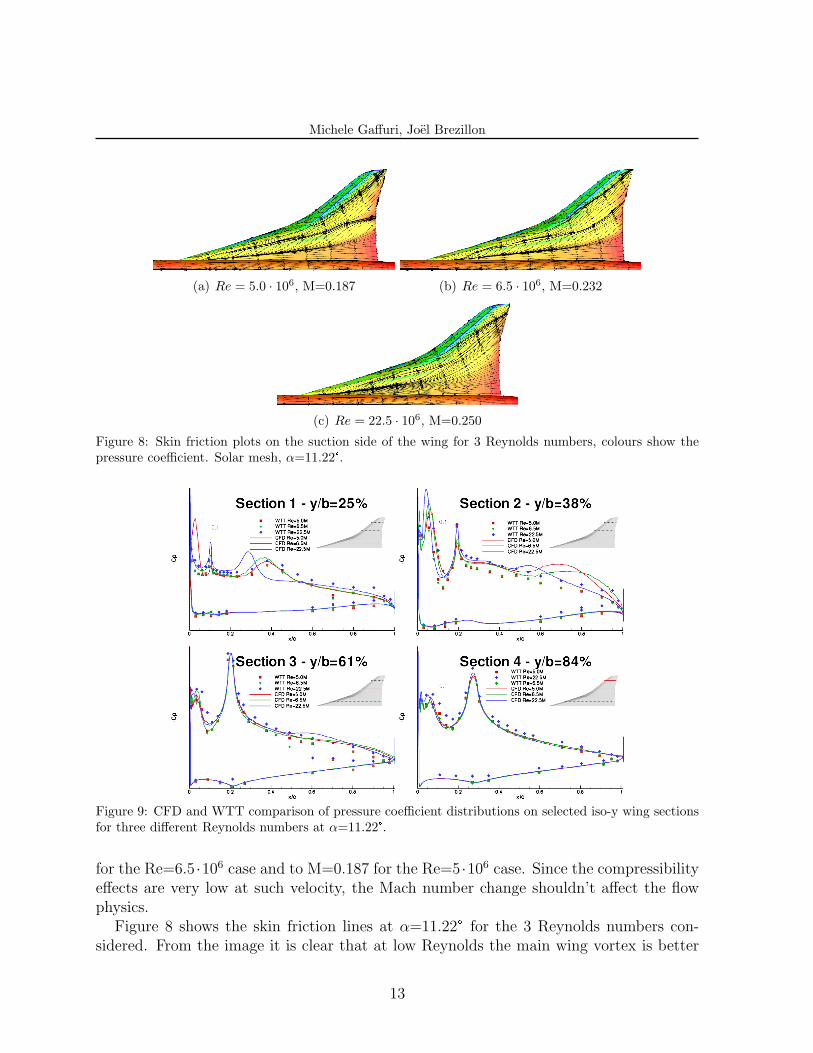
(a) Re = 5.0 · 106, M=0.187 (b) Re = 6.5 · 106, M=0.232
(c) Re = 22.5 · 106, M=0.250
Figure 8: Skin friction plots on the suction side of the wing for 3 Reynolds numbers, colours show thepressure coefficient. Solar mesh, α=11.22°.
Figure 9: CFD and WTT comparison of pressure coefficient distributions on selected iso-y wing sectionsfor three different Reynolds numbers at α=11.22°.
for the Re=6.5 ·106 case and to M=0.187 for the Re=5 ·106 case. Since the compressibilityeffects are very low at such velocity, the Mach number change shouldn’t affect the flowphysics.
Figure 8 shows the skin friction lines at α=11.22° for the 3 Reynolds numbers con-sidered. From the image it is clear that at low Reynolds the main wing vortex is better
13

Michele Gaffuri, Joel Brezillon
Figure 10: WTT and CFD comparison of skin friction lines for the case Re=5 · 106, M=0.187, α=11.22°.
captured. This is due to the increased thickness of the prismatic layer, made possible by alarger first cell height. The improvement can also be observed in the first section of Figure9: the vortex location is well predicted and the suction effect only slightly overestimated.
While in the high Reynolds case the CFD predicts that the main vortex crosses section2 more upstream than in the experiments, at low Reynolds the opposite happens: inthe wind tunnel tests the main vortex exhibits more cross-flow than in the simulation,thus crossing section 2 sooner. A comparison between an oil flow image and a plot ofskin friction lines based on the CFD result is made in Figure 10. The discrepancy in thevortex direction can be clearly seen; nonetheless the overall agreement in the flow physicsis remarkable.
A complete polar has also been computed at these 2 Reynolds numbers. Figure 11(a)shows the lift versus drag polar for all 3 Reynolds numbers studied. These polars arecompared to validated CFD results on the structured mesh and to wind tunnel data forthe low Reynolds number cases. We can see that for the reference conditions considered(that is, at α=11.22°), which correspond to the right end of the CFD curves, the agreementwith the wind tunnel tests is good. In the maximum lift-over-drag ratio region, however,the drag value is underestimated at low Reynolds; this translates to an overestimation ofthe maximum L/D. The discrepancy could be explained by the fact that the 1:22 windtunnel model was developed primarily for use in the ONERA-F1 wind tunnel, which islarger than the DNW-NWB tunnel. As a result in the DNW-NWB facility the effect ofthe wind tunnel walls could have had an impact on the results for some angles of attack.
Structured and unstructured results are very similar, showing that the unstructuredmeshes can reach similar accuracy as the state of the art approach.
14

Michele Gaffuri, Joel Brezillon
(a) Lift versus drag polar (b) Lift over drag ratio versus angle of attack
Figure 11: CFD polars at 3 Reynolds numbers compared to WTT (for low Reynolds) and to structuredmesh results.
5 DISCUSSION
Results outlined in the previous section show that unstructured meshes are suitablefor the computation of vortex dominated flows. In terms of forces and moments, thetwo hybrid meshes tested give results in line with the validated CFD results on thestructured mesh. In comparison to the low Reynolds wind tunnel data, however, the dragis underestimated in all CFD results.
The unstructured meshes are able to capture the main flow features thanks to thegood quality of the prismatic layer. Without grid adaptation however, the vortices tendto quickly dissipate in the tetrahedral region. This is the reason why the prism layerhas to be maximized. The good capturing of the main vortex in the low Reynolds cases,where the prismatic layer is thicker, is a proof of this fact.
The vortices quickly dissipate downstream of the wing, as it is seen in Figure 3 and4. This cannot be avoided without using grid adaptation or an extremely fine mesh.Nevertheless the effect on loads and in particular on drag seems to be low.
Two opposite trends appear in regard to turbulence modelling: when using the struc-tured mesh the Spalart-Allmaras model is too dissipative and predicts higher drags thanthe 2 other models considered. On the unstructured meshes however SA gives as goodresults as the more complex models, especially for the lift and the drag coefficients, onlya relatively small discrepancy for the pitching moment value is observed. All in all, sincethe computations with the SA turbulence model were obtained with the best convergencerate without stability issue, this model is selected to be used in optimization context.
In fact when using the k-ω-SST model the simulation is not completely stable and itis sometimes necessary to start with a simpler and more stable k-ω model (Wilcox modelwas chosen for this) and/or start with an upwind space scheme. The RSM computation
15
Michele Gaffuri, Joel Brezillon
was started from a converged k-ω-SST solution, by setting the turbulence variables in thefield to their free-stream values. This means that k-ω and RSM computations are moretime consuming not only because more equations have to be solved (7 and 12 for k-ωand RSM respectively, compared to 6 for Spalart-Allmaras) but also because they requiresome initialization steps and more iterations to converge.
The selection of the hybrid mesh generators is more difficult. Both mesh generatorstested give similar results, so it is difficult to make a choice based solely on the accuracyof the predicted loads. When considering the mesh generation process, however, some dif-ferences are found. Firstly, Centaur requires more CAD preparation in order to correctlymesh the geometry: the wing leading edge has to be reworked to get panels that canbe meshed using structured quadrilaterals, and to be able to get the right leading edgecurvature in the discretised geometry used for the surface mesh generation. Secondly, thetime required for the complete mesh generation is higher for Centaur (depends on thesettings chosen, but was around 4 hours for this configuration) than for Solar (about 1hour plus the mesh modification and the smoothing, in total around 1 and a half hours).On the other hand Centaur was found more stable than Solar: Solar tends to exit withan error when merging far-field mesh and prism layer if the anisotropy of the surfacequadrilaterals is set too high. Decreasing the anisotropy (thus increasing the mesh size)solves this problem. Finally, it was previously observed during the fourth AIAA CFDDrag Prediction Workshop that the Solar mesh generator is able to generate family ofmeshes with constant high quality [14] which is a key element in optimization context.
Based on these considerations, the next optimization chain will include the automaticmesh generation tool Solar with the CFD computations done using the Spalart-Allmarasturbulence model.
6 CONCLUSIONS
In this paper it has been shown that unstructured, hybrid meshes are suited for thesimulation of complex flow fields like the airflow past a highly swept delta wing at highangle of attack. Even without relying on grid adaptation, like commonly done when usingthis approach, the main flow features are accurately predicted on meshes containing about10 million points. However, a thick prismatic layer is capital for the correct predictionof the vortex strength and position. Finally, aerodynamic loads can be predicted withsimilar accuracy as with the structured mesh.
For building the aerodynamic optimization chain, the Solar mesh generator is found tobe the best candidate and the Spalart-Allmaras is considered as the most suited turbulencemodel for solving the Navier-Stokes equations in a stable and efficient way.
16

Michele Gaffuri, Joel Brezillon
REFERENCES
[1] U. Herrmann, A. Press, C. Newbold, P. Kaurinkoski, C. Artiles, J.V. Muijden, and G.Carrier, Validation of European CFD Codes for SCT low-speed high-lift Computa-tions, In proceedings of the 19th AIAA Applied Aerodynamics Conference, Anaheim,USA (2001).
[2] J. van Muijden and B. Elsenaar. Numerical prediction capabilities and analysis offlow development for a supersonic civil transport at low speed, In proceedings of theCEAS Aerospace Aerodynamics Conference, Cambridge, UK (2002).
[3] M. Widhalm, A. Schutte, T. Alrutz and M. Orlt, Improvement of the Automatic GridAdaptation for Vortex Dominated Flows using Advanced Vortex Indicators with theDLR-TAU Code, Notes on Numerical Fluid Mechanics and Multidisciplinary Design,Springer Vol. 96 (2006).
[4] J. Brezillon, R.P. Dwight and J. Wild, Numerical Aerodynamic Optimisation of3D High-Lift Configurations, 26th Congress Of The International Council Of TheAeronautical Sciences, Anchorage, USA (2008).
[5] U. Herrmann, Low-Speed High-Lift Performance Improvements obtained and vali-dated by the EC-project EPISTLE, In proceedings of the 24th ICAS Conference,Yokohama, Japan (2004).
[6] U. Herrmann, Analysis of numerical prediction capabilities for SCT low-speed high-lift flows, EPISTLE internal report (2001).
[7] CentaurSoft, http://www.centaursoft.com
[8] D. G. Martineau, S. Stokes, S. J. Munday, A. P. Jackson and B. J. Gribben,Anisotropic Hybrid Mesh Generation for Industrial RANS Applications, AIAA-paper2006-534, AIAA Aerospace Conference, Reno, USA (2006).
[9] D. Schwamborn, T. Gerhold and R. Heinrich, The DLR TAU-Code: Recent Applica-tions in Research and Industry, ECCOMAS CFD 2006, Egmond aan Zee, Netherland(2006).
[10] P.R. Spalart and S.R. Allamaras, A One-Equation Turbulence Model for Aerody-namic Flows, AIAA Paper 92-0439 (1992).
[11] J. Edwards and S. Chandra, Comparison of Eddy Viscosity-Transport TurbulenceModels for Three-Dimensional Shock-Separated Flowfields, AIAA Journal of Air-crafts, Vol. 34, No. 4, pp. 756-763 (1996).
[12] F.R. Menter, Two-Equation Eddy Viscosity Turbulence Models for Engineering Ap-plications, AIAA Journal, Vol. 32, pp. 1598-1605 (1998).
17

Michele Gaffuri, Joel Brezillon
[13] B. Eisfeld and O. Brodersen, Advanced Turbulence Modelling and Stress Analysisfor the DLR-F6 Configuration, AIAA-Paper 2005-7727 (2005).
[14] O. Brodersen, S. Crippa, B. Eisfeld, S. Keye and S. Geisbauer, DLR Results fromthe Fourth AIAA CFD Drag Prediction Workshop. AIAA Applied AerodynamicsConference, Chicago, USA (2010).
18
![Supersonic and Hypersonic Flows on 2D Unstructured Context ... · procedure of [10] and their results were compared with their first order accuracy versions and with theoretical results.](https://static.fdocuments.us/doc/165x107/60ce0114a22aca632046bb6e/supersonic-and-hypersonic-flows-on-2d-unstructured-context-procedure-of-10.jpg)