Unsteady overland flow on flat surfaces induced by spatial permeability contrasts
10
Unsteady overland flow on flat surfaces induced by spatial permeability contrasts Sally Thompson a,⇑ , Gabriel Katul a,b , Alexandra Konings a , Luca Ridolfi b a Nicholas School of the Environment, Duke University, Durham, NC 27707, USA b Dipartimento di Idraulica, Trasporti e Infrastrutture Civili, Politecnico di Torino, C.so Duca degli Abruzzi, 24, 10129 Torino, Italy article info Article history: Received 9 February 2011 Received in revised form 30 May 2011 Accepted 31 May 2011 Available online 12 June 2011 Keywords: Arid ecosystems Hydraulics Infiltration Manning’s equation Overland flow Patchy vegetation abstract Lateral redistribution of surface water in patchy arid ecosystems has been hypothesized to contribute to the maintenance of vegetation patches through the provision of a water subsidy from bare sites to veg- etated sites. Such runon–runoff processes occur during Hortonian runoff events on topographically slop- ing ground. Surface flow redistribution may also occur on topographically flat ground if the presence of the vegetation patch creates a contrast in infiltration rate, leading to a free-surface gradient in ponded water. The precise dynamics and the eco-hydrologic role of this process has resisted complete theoretical treatment to date. Here the overland flow equations are modified to account for the presence of vegeta- tion situated over a flat surface. The resulting model is solved numerically to determine whether this mechanism could influence the spatial partitioning of water in patchy arid ecosystems. Assumptions made about infiltration processes and overland flow in existing eco-hydrologic models of patchy and pat- terned arid ecosystems are evaluated in comparison to the solution of the ‘full’ coupled Saint–Venant equations with various infiltration models. The results indicate that the optimization of vegetation spatial patch scales with respect to water redistribution may be determined by the size of the infiltration redis- tribution length L over which the presence of an infiltration contrast perturbs baseline infiltration behavior. Ó 2011 Elsevier Ltd. All rights reserved. 1. Introduction The lateral redistribution of ponded water generated during intense rainstorms plays an important role in the hydrological, biogeochemical and ecological functioning of patchy arid ecosys- tems. For instance, it is broadly accepted that the maintenance of vegetation in patchy arid systems is supported by lateral subsidies of rainfall from bare sites to vegetated ones [1–4]. However, the relative importance of above ground and below ground (via root uptake) water redistribution processes remains unresolved, partic- ularly on flat sites [5–8]. At those flat sites, one working hypothesis is that the combined infiltration contrast and the efficiency of sur- face lateral transport alone can generate sufficient subsidies of water from bare sites to satisfy water demand in vegetated patches [6–8]. The potential energy gradients that drive overland flow can arise either from the topographic slope of the soil surface, or, in the absence of slope, from gradients in the free water surface. The former situation is typically assumed in hydrological routing models, and presumes that on flat terrain hydrological routing col- lapses to a simple one dimensional infiltration problem [9–11]. Redistribution of water in response to a free-surface gradient in the absence of a topographic slope, however, is known to be impor- tant in engineering applications such as irrigation or dam-removal [12,13]. On flat ground, which occurs in several areas with vegeta- tion patterning [8], similar gradients could hypothetically arise during Hortonian runoff generation if a pronounced spatial con- trast in rainfall intensity or infiltration rate create contrasting depths in ponded head through space. These mechanisms persist in the presence of a ground slope but become less important for sustaining lateral flow as the ground slope becomes large com- pared to the free surface gradients. The pronounced contrasts in infiltration rate needed to generate this free-surface contrast can arise in patchily-vegetated arid eco- systems. In many such ecosystems, different soil surface conditions are found in vegetated and bare sites. These differences can result in 10-fold differences in infiltration capacity over relatively short distances (a few meters) [14,15]. Both physical and biological pro- cesses are involved in sustaining these differences. Enhanced bio- logical activity in vegetated sites leads to increased soil macroporosity, often in association with termite activity [16–18]. The presence of the plant canopy and litter layer protect the soil surface from rain splash impacts and prevent the formation of pho- tosynthetic biological soil crusts [19]. By comparison, bare sites are frequently colonized by crust-forming biota, and form physical soil crusts and seals in response to rain splash impact [20–22]. Although individual plants may be associated with shallow mound formation, these mounds are also associated with enhanced infiltration capacities. The proposed redistribution mechanism can still apply, although the routing would need to be amended to account for the microtopographic geometry [23]. 0309-1708/$ - see front matter Ó 2011 Elsevier Ltd. All rights reserved. doi:10.1016/j.advwatres.2011.05.012 ⇑ Corresponding author. E-mail address: [email protected] (S. Thompson). Advances in Water Resources 34 (2011) 1049–1058 Contents lists available at ScienceDirect Advances in Water Resources journal homepage: www.elsevier.com/locate/advwatres
-
Upload
sally-thompson -
Category
Documents
-
view
222 -
download
0
Transcript of Unsteady overland flow on flat surfaces induced by spatial permeability contrasts
Advances in Water Resources 34 (2011) 1049–1058
Contents lists available at ScienceDirect
Advances in Water Resources
journal homepage: www.elsevier .com/ locate/advwatres
Unsteady overland flow on flat surfaces induced by spatial permeability contrasts
Sally Thompson a,⇑, Gabriel Katul a,b, Alexandra Konings a, Luca Ridolfi b
a Nicholas School of the Environment, Duke University, Durham, NC 27707, USAb Dipartimento di Idraulica, Trasporti e Infrastrutture Civili, Politecnico di Torino, C.so Duca degli Abruzzi, 24, 10129 Torino, Italy
a r t i c l e i n f o
Article history:Received 9 February 2011Received in revised form 30 May 2011Accepted 31 May 2011Available online 12 June 2011
Keywords:Arid ecosystemsHydraulicsInfiltrationManning’s equationOverland flowPatchy vegetation
0309-1708/$ - see front matter � 2011 Elsevier Ltd. Adoi:10.1016/j.advwatres.2011.05.012
⇑ Corresponding author.E-mail address: [email protected] (S. Thompson).
a b s t r a c t
Lateral redistribution of surface water in patchy arid ecosystems has been hypothesized to contribute tothe maintenance of vegetation patches through the provision of a water subsidy from bare sites to veg-etated sites. Such runon–runoff processes occur during Hortonian runoff events on topographically slop-ing ground. Surface flow redistribution may also occur on topographically flat ground if the presence ofthe vegetation patch creates a contrast in infiltration rate, leading to a free-surface gradient in pondedwater. The precise dynamics and the eco-hydrologic role of this process has resisted complete theoreticaltreatment to date. Here the overland flow equations are modified to account for the presence of vegeta-tion situated over a flat surface. The resulting model is solved numerically to determine whether thismechanism could influence the spatial partitioning of water in patchy arid ecosystems. Assumptionsmade about infiltration processes and overland flow in existing eco-hydrologic models of patchy and pat-terned arid ecosystems are evaluated in comparison to the solution of the ‘full’ coupled Saint–Venantequations with various infiltration models. The results indicate that the optimization of vegetation spatialpatch scales with respect to water redistribution may be determined by the size of the infiltration redis-tribution length L over which the presence of an infiltration contrast perturbs baseline infiltrationbehavior.
� 2011 Elsevier Ltd. All rights reserved.
1. Introduction [12,13]. On flat ground, which occurs in several areas with vegeta-
The lateral redistribution of ponded water generated duringintense rainstorms plays an important role in the hydrological,biogeochemical and ecological functioning of patchy arid ecosys-tems. For instance, it is broadly accepted that the maintenance ofvegetation in patchy arid systems is supported by lateral subsidiesof rainfall from bare sites to vegetated ones [1–4]. However, therelative importance of above ground and below ground (via rootuptake) water redistribution processes remains unresolved, partic-ularly on flat sites [5–8]. At those flat sites, one working hypothesisis that the combined infiltration contrast and the efficiency of sur-face lateral transport alone can generate sufficient subsidies ofwater from bare sites to satisfy water demand in vegetated patches[6–8].
The potential energy gradients that drive overland flow canarise either from the topographic slope of the soil surface, or, inthe absence of slope, from gradients in the free water surface.The former situation is typically assumed in hydrological routingmodels, and presumes that on flat terrain hydrological routing col-lapses to a simple one dimensional infiltration problem [9–11].Redistribution of water in response to a free-surface gradient inthe absence of a topographic slope, however, is known to be impor-tant in engineering applications such as irrigation or dam-removal
ll rights reserved.
tion patterning [8], similar gradients could hypothetically ariseduring Hortonian runoff generation if a pronounced spatial con-trast in rainfall intensity or infiltration rate create contrastingdepths in ponded head through space. These mechanisms persistin the presence of a ground slope but become less important forsustaining lateral flow as the ground slope becomes large com-pared to the free surface gradients.
The pronounced contrasts in infiltration rate needed to generatethis free-surface contrast can arise in patchily-vegetated arid eco-systems. In many such ecosystems, different soil surface conditionsare found in vegetated and bare sites. These differences can resultin 10-fold differences in infiltration capacity over relatively shortdistances (a few meters) [14,15]. Both physical and biological pro-cesses are involved in sustaining these differences. Enhanced bio-logical activity in vegetated sites leads to increased soilmacroporosity, often in association with termite activity [16–18].The presence of the plant canopy and litter layer protect the soilsurface from rain splash impacts and prevent the formation of pho-tosynthetic biological soil crusts [19]. By comparison, bare sites arefrequently colonized by crust-forming biota, and form physical soilcrusts and seals in response to rain splash impact [20–22].Although individual plants may be associated with shallow moundformation, these mounds are also associated with enhancedinfiltration capacities. The proposed redistribution mechanismcan still apply, although the routing would need to be amendedto account for the microtopographic geometry [23].

1050 S. Thompson et al. / Advances in Water Resources 34 (2011) 1049–1058
The lateral fluxes of water that arise from the contrasts in pondeddepth are a function of the water depth h, its spatial gradients @h/@x,and the hydrodynamic roughness of the ground surface. In patchilyvegetated sites, the spatial contrasts in vegetation also lead to a con-trast in hydrodynamic roughness, which tends to oppose the flow[24]. Thus the lateral redistribution of rainfall from bare sites to veg-etated sites arises from a dynamic interplay of hydrological (infiltra-tion contrasts) and hydraulic (roughness contrasts) processes.
The spatial dynamics of vegetation and their link to water avail-ability in patchy ecosystems with low slopes have been addressedtheoretically by several investigators using partial-differential-equation based models of coupled biomass-water movement[6,8,25,26]. Such simple models reproduce the observed morphol-ogy of patchy vegetation in arid ecosystems. To date, no model hasexplicitly confronted a mechanistic description of the unsteadyhydraulic and hydrological aspects of the flow problems, but haveinstead made two simplifying assumptions:
1. The infiltration rate (fc) could be represented as being linearlydependent upon the depth of ponded water (h); and
2. The overland flow (q) in an arbitrary direction x linearly scaleswith @h/@x.
The first of these assumptions, although non-standard com-pared to conventional infiltration theory, gains support from therole of microtopographic variability and macroporosity in infiltra-tion dynamics. For instance, Dunne et al. [27] showed that wherepoint-scale infiltration capacity was correlated with elevationalong microtopographic profiles, bulk infiltration rates dependedon the depth of inundation. Fox et al. [28] demonstrated an appar-ent depth dependence on infiltration capacity arising due to simi-lar mechanisms in crusted soils. Novak et al. [29] similarly showedthat the effects of crack structures on infiltration dynamics couldbe parameterized by treating the infiltration flux as depth-depen-dent. Both microtopographic variation and macroporosity arelikely to arise in vegetated sites, and this h-dependent infiltrationrepresentation may be reasonable in a first-order analysis. The sec-ond assumption, however, removes the flow-depth nonlinearitiesarising from the shallow-water equations. Its use is primarilybased on mathematical tractability rather than physical reasoning.
Existing theoretical models suggest that redistribution of waterin response to the infiltration contrast on flat terrain may be suffi-cient to sustain the patchy characteristics of arid ecosystems [6,8].However, it is unclear whether these results are biased by theassumptions made about infiltration and hydraulics describedabove. The goal of this work is to assess whether the lateral redistri-bution of water induced by the infiltration contrast can generate suf-ficiently large fluxes of water to meet water demand in thesesystems. The study is facilitated by two recent theoretical develop-ments. The first is a novel representation of flow resistance associ-ated with vegetation canopy density (presented below), and thesecond is a meta-analysis linking above-ground vegetation biomassto the enhancement of infiltration capacity in xeric sites [14]. Theseresults are incorporated into a parameterization of the Saint–Venantequations, and are used to explore the redistribution of water frombare to vegetated sites as driven by variable infiltration rates. Thisexploration is organized around two key research questions:
1. Can contrasts in infiltration rate and surface roughness lead to a lat-eral redistribution of water from bare to vegetated sites? How largeis this redistribution, over what spatial scales does it act, and howsensitive is it to soil, vegetation and storm properties? and
2. How sensitive are the predictions about the lateral redistribu-tion to the assumptions made about infiltration, roughness,and to the choice of hydraulic model used to parameterize theflow?
The theoretical description of the problem is developed first,followed by a report on numerical investigations aimed at address-ing these research questions.
2. Theory
The basic flow equations describing this problem are the Saint–Venant equations, modified to account for the influence of vegeta-tion. The Saint–Venant equations are widely used to describe shal-low overland flows, for which the assumptions that underpin theirderivation, namely that the flow is nearly one-dimensional andthat the momentum equation can be vertically averaged withoutgenerating spurious dispersive terms, are generally valid.
2.1. The Saint–Venant equations
The Saint–Venant equations describe conservation of mass(continuity, (1)) and momentum (2) in a depth-averaged flow asfollows:
@h@tþ @qx
@x¼ cPðtÞ � IðtÞ ð1Þ
@qx
@tþ @
@xq2
x
hþ gh2
2
!þ ghðSf � S0Þ ¼ 0 ð2Þ
In these equations, t is time, x is the spatial coordinate, h is theponded water depth, qx = Vh is the flow rate in the x direction, Vis the depth averaged velocity, g is gravitational acceleration, P(t)is rainfall, I(t) is the infiltration rate, S0 is the ground slope and Sf
is the friction slope. All symbols used in the text are summarizedin Table 1. We ignore the role of interception in changing rainfallfluxes at vegetated sites (c = 1 throughout) given that plant cano-pies in arid systems are generally sparse, displaying functionaladaptations to reduce infiltration losses or to promote the deliveryof rainfall to the soil surface [30,31]. Parameterizations of the fric-tion slope in the momentum equation (2) are commonly obtainedfrom the Darcy–Weisbach equation assuming the flow is locallyuniform, giving:
Sf �f
8gq2
x
h3 ð3Þ
where f is the Darcy–Weisbach friction factor. An expression for fthat accounts for the effects of vegetation on the flow hydraulicsis developed later.
2.2. Approximations to the Saint–Venant equations
Several existing ecohydrological models describing water redis-tribution in arid or semi-arid environments have been proposedthat are driven by simplified versions of the Saint–Venant equa-tions [6,8,25,26]. These simplifications are based on retaining theunsteady contribution in the conservation of mass equation butinvoking a steady-state assumption for the momentum equation(@qx/@t = 0) at small Froude numbers (i.e. q2
x=h� gh2=2) resulting
in:
@
@xgh2
2
!þ ghðSf � S0Þ � 0 ð4Þ
giving Sf � S0 � @h/@x. If Sf is related to qx via the Darcy–Weisbachequation (c.f. Eq. 3) then the momentum equation reduces to:
S0 �@h@x� f
8gq2
x
h3 ð5Þ

Table 1Table of symbols used.
Symbol Definition
a Bare soil infiltration rate, cm/ham Parameter in generalized momentum equationb Momentum absorption coefficientbm Parameter in generalized momentum equationb Exponent of vegetation–infiltration relationCd Drag coefficientd Zero plane displacement (m)f, fturbulent Darcy–Weisbach friction factorfviscous, fb,
fv
For turbulent, laminar, vegetated or bare soil cases
F, Fb, Fv Cumulative infiltration, over bare soil, over vegetation (mm)G(h) Infiltration dependence on ponded depthh Ponded depth (mm)Hc Vegetation canopy height (m)Ic(t) Infiltration capacity (cm/h)k von Karman’s constantk Sensitivity of infiltration capacity to vegetation coverL Infiltration adjustment length (m)lc Adjustment length scale (m)LAI Leaf area indexM Domain size (m)P(t) Precipitation intensity (cm/h)qx Flow rate in the x direction (m3/s)Re Reynold’s numberS0 Topographic slopeSf Friction slopet Time (s)V Bulk (depth averaged) fluid velocity (m/s)x Cartesian coordinate aligned along the longitudinal dimension
(m)zo Momentum roughness length (m)
S. Thompson et al. / Advances in Water Resources 34 (2011) 1049–1058 1051
In almost flat terrain where S0 � @h@x ; qx can be expressed as
qx ¼
ffiffiffiffiffiffi8gf
sham @h
@x
� �bm
ð6Þ
and the conventional ‘rating curve’ or ‘flow-depth’ relationship de-rived solely from Manning’s equation is recovered if am = 3/2 andbm = 1/2. Two other simplifications can be used: (i) am = 0 andbm = 1, a linear-diffusion case where the dependence on h is alllumped into f. This dependence is admittedly weak when h is muchgreater than zo, where zo is the momentum roughness length char-acterizing the bed surface. The linear diffusion assumption recapit-ulates that used in most existing patchy-vegetation models[6,8,25,26]. (ii) am = 3/2 and bm = 1, hereafter referred to as the ‘non-linear-diffusion’ case because it assumes qx / oh/@x via an h-depen-dent diffusivity. This representation provides a balance betweenincluding the full non-linearities of the shallow water equationsand the simpler behavior of the linear diffusion case. Note thatthe assumption that @qx/@t = 0 is questionable under the conditionsof abrupt and intense storms, as might be expected in arid environ-ments, motivating the need to undertake a quantitative comparisonbetween the various flow routing approaches.
2.3. Surface resistance and the Darcy–Weisbach friction factor f
Determining the most important causes of energetic losses inthese shallow flow regimes is non-trivial. In examining similarflow regimes, Roche et al. [32] concluded that ‘although local Rey-nolds number values do not clearly indicate that the flow is turbu-lent . . . head losses . . . are dominated by inertia’ [32, p. 10].Rainsplash will tend to agitate the flow, contributing to a disturbedstate resembling a turbulent regime [33]. Parameterizing frictionallosses associated with laminar flow in shallow overland flow is alsoproblematic, and practical approaches are often based on extrapo-lation of Poiseuille’s equation for laminar flow in pipes, resulting in
f = 64/Re where Re is the Reynold’s Number, Re = hV/m, and m is thekinematic viscosity of water. This extrapolation, however, rarelyperforms well in capturing the relationship between Reynold’snumber, roughness and bulk velocity [34,35] primarily due to thehighly disturbed state of the boundary layer over these roughnesselements. Given the uncertainty regarding the validity of thePoiseuille approximation for these shallow flows, the majority ofthe analysis here is based upon the assumption that the turbulentstresses are the dominant contributor to f and that laminar stressescan be omitted when the turbulent stresses are considered. That is,we make the reasonable assumption that the turbulent intensity ofthe shallow flows is high, even when the bulk velocity is low. Toexplore the implications of this assumption, we also include atreatment in which the turbulent stresses are ignored and onlythe laminar stresses as given by f = 64/Re are included. For the veryshallow depths of flow that arise in this problem, this approxima-tion is likely to induce such large stresses as to render the watervirtually stationary and in many cases reduce the problem to aclose approximation of one dimensional infiltration. Thus, a focuson the turbulent case allows us to explore a limiting scenario withthe maximum water redistribution.
2.3.1. Turbulent flowThe surface resistance f is a nonlinear function of h, and these
functions differ for the case of flow over bare soil versus throughemergent vegetation. In the case of bare soil, the depth dependenceof the Darcy–Weisbach friction factor is the classical 1/7 power law[36–39]. Note that this is a deep layer formulation that assumesthat a momentum roughness height zo < h:ffiffiffi
f8
r� 0:18
zo
h
� �1=7: ð7Þ
In the presence of vegetation, two different regimes must be spec-ified for the cases where the flow depth h exceeds the vegetationcanopy height Hc, and where the canopy is emergent, i.e. h/Hc < 1.For the former case:ffiffiffi
f8
r¼ 2b
lc
Hc1� exp � 1
2b2
Hc
lc
� �� �þ 1
kh
Hc� 1
� �
� �1þ logh� d
zo
� � h�dh�Hc Hc � d
zo
� ��Hc�dk�Hc
" #" #ð8Þ
while for h/Hc < 1,ffiffiffif8
r¼ 2b
lc
hexp � 1
2b2
Hc
lc
� ��1þ exp
12b2
hlc
� �� �; ð9Þ
where dHc¼ 1� 2b3 lc
kHc; zo
Hc¼ 2b3 lc
kHcexp �k
b
h i; b ¼ min 0:135
ffiffiffiffiffiLAIHc
q;0:33
� �and lc ¼ Cd
LAIHc
h i�1. The full derivation of these equations is pre-
sented elsewhere [40].The zero-plane displacement d and momentum roughness
height zo for the vegetation both vary with the geometric proper-ties of the canopy, while b, the momentum absorption coefficientvaries with the leaf area density. The adjustment length lc mea-sures how rapidly the wakes generated by the vegetation dissipateturbulent kinetic energy from the flow. The k is Von Karman’s con-stant, and the Cd is the dimensionless foliage drag coefficient. In allthese formulations, we assumed that the leaf area density wasuniform with height, and was well approximated by the leaf areaindex (LAI) divided by the canopy height (Hc). When the drag forceexerted by the vegetation on the flow is dominated by form –rather than viscous-drag, Cd is constant. In practice, the differentnonlinear dependence of f on h for bare soil (fb) and vegetated(fv) conditions results in two outcomes: (a) fv > fb, and (b) the
1052 S. Thompson et al. / Advances in Water Resources 34 (2011) 1049–1058
dependence of fb on h saturates at much lower values of h thandoes fv.
2.4. Infiltration behavior
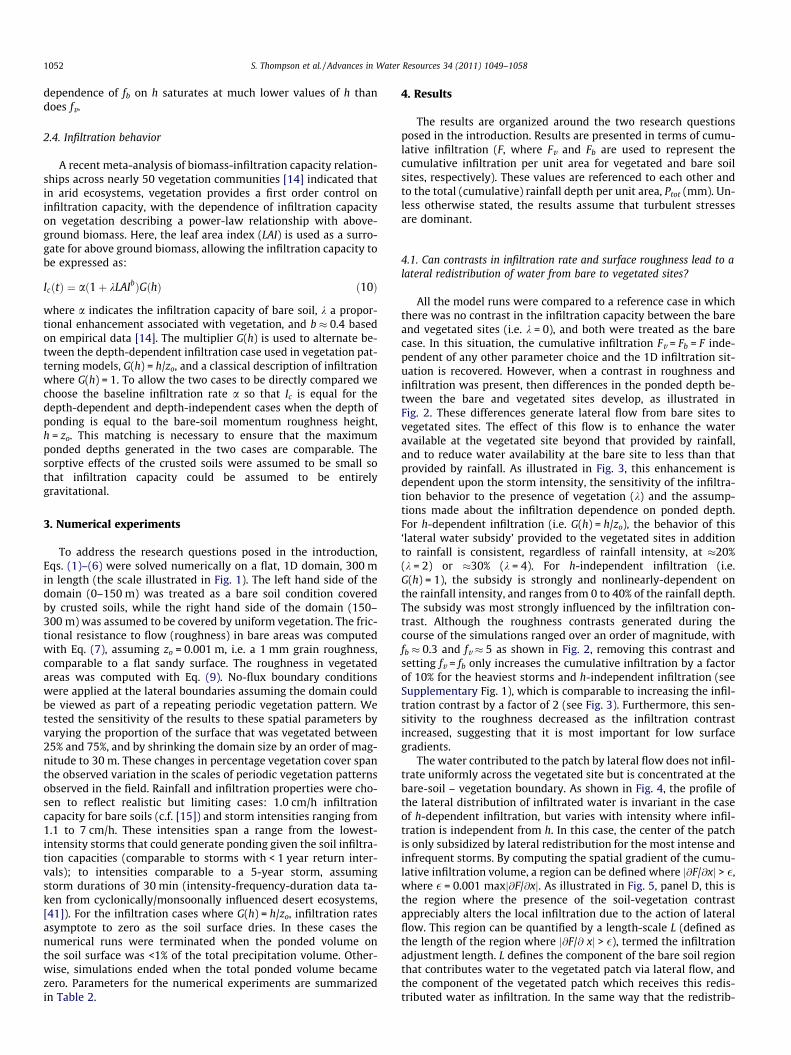
A recent meta-analysis of biomass-infiltration capacity relation-ships across nearly 50 vegetation communities [14] indicated thatin arid ecosystems, vegetation provides a first order control oninfiltration capacity, with the dependence of infiltration capacityon vegetation describing a power-law relationship with above-ground biomass. Here, the leaf area index (LAI) is used as a surro-gate for above ground biomass, allowing the infiltration capacity tobe expressed as:
IcðtÞ ¼ að1þ kLAIbÞGðhÞ ð10Þ
where a indicates the infiltration capacity of bare soil, k a propor-tional enhancement associated with vegetation, and b � 0.4 basedon empirical data [14]. The multiplier G(h) is used to alternate be-tween the depth-dependent infiltration case used in vegetation pat-terning models, G(h) = h/zo, and a classical description of infiltrationwhere G(h) = 1. To allow the two cases to be directly compared wechoose the baseline infiltration rate a so that Ic is equal for thedepth-dependent and depth-independent cases when the depth ofponding is equal to the bare-soil momentum roughness height,h = zo. This matching is necessary to ensure that the maximumponded depths generated in the two cases are comparable. Thesorptive effects of the crusted soils were assumed to be small sothat infiltration capacity could be assumed to be entirelygravitational.
3. Numerical experiments
To address the research questions posed in the introduction,Eqs. (1)–(6) were solved numerically on a flat, 1D domain, 300 min length (the scale illustrated in Fig. 1). The left hand side of thedomain (0–150 m) was treated as a bare soil condition coveredby crusted soils, while the right hand side of the domain (150–300 m) was assumed to be covered by uniform vegetation. The fric-tional resistance to flow (roughness) in bare areas was computedwith Eq. (7), assuming zo = 0.001 m, i.e. a 1 mm grain roughness,comparable to a flat sandy surface. The roughness in vegetatedareas was computed with Eq. (9). No-flux boundary conditionswere applied at the lateral boundaries assuming the domain couldbe viewed as part of a repeating periodic vegetation pattern. Wetested the sensitivity of the results to these spatial parameters byvarying the proportion of the surface that was vegetated between25% and 75%, and by shrinking the domain size by an order of mag-nitude to 30 m. These changes in percentage vegetation cover spanthe observed variation in the scales of periodic vegetation patternsobserved in the field. Rainfall and infiltration properties were cho-sen to reflect realistic but limiting cases: 1.0 cm/h infiltrationcapacity for bare soils (c.f. [15]) and storm intensities ranging from1.1 to 7 cm/h. These intensities span a range from the lowest-intensity storms that could generate ponding given the soil infiltra-tion capacities (comparable to storms with < 1 year return inter-vals); to intensities comparable to a 5-year storm, assumingstorm durations of 30 min (intensity-frequency-duration data ta-ken from cyclonically/monsoonally influenced desert ecosystems,[41]). For the infiltration cases where G(h) = h/zo, infiltration ratesasymptote to zero as the soil surface dries. In these cases thenumerical runs were terminated when the ponded volume onthe soil surface was <1% of the total precipitation volume. Other-wise, simulations ended when the total ponded volume becamezero. Parameters for the numerical experiments are summarizedin Table 2.
4. Results
The results are organized around the two research questionsposed in the introduction. Results are presented in terms of cumu-lative infiltration (F, where Fv and Fb are used to represent thecumulative infiltration per unit area for vegetated and bare soilsites, respectively). These values are referenced to each other andto the total (cumulative) rainfall depth per unit area, Ptot (mm). Un-less otherwise stated, the results assume that turbulent stressesare dominant.
4.1. Can contrasts in infiltration rate and surface roughness lead to alateral redistribution of water from bare to vegetated sites?
All the model runs were compared to a reference case in whichthere was no contrast in the infiltration capacity between the bareand vegetated sites (i.e. k = 0), and both were treated as the barecase. In this situation, the cumulative infiltration Fv = Fb = F inde-pendent of any other parameter choice and the 1D infiltration sit-uation is recovered. However, when a contrast in roughness andinfiltration was present, then differences in the ponded depth be-tween the bare and vegetated sites develop, as illustrated inFig. 2. These differences generate lateral flow from bare sites tovegetated sites. The effect of this flow is to enhance the wateravailable at the vegetated site beyond that provided by rainfall,and to reduce water availability at the bare site to less than thatprovided by rainfall. As illustrated in Fig. 3, this enhancement isdependent upon the storm intensity, the sensitivity of the infiltra-tion behavior to the presence of vegetation (k) and the assump-tions made about the infiltration dependence on ponded depth.For h-dependent infiltration (i.e. G(h) = h/zo), the behavior of this‘lateral water subsidy’ provided to the vegetated sites in additionto rainfall is consistent, regardless of rainfall intensity, at �20%(k = 2) or �30% (k = 4). For h-independent infiltration (i.e.G(h) = 1), the subsidy is strongly and nonlinearly-dependent onthe rainfall intensity, and ranges from 0 to 40% of the rainfall depth.The subsidy was most strongly influenced by the infiltration con-trast. Although the roughness contrasts generated during thecourse of the simulations ranged over an order of magnitude, withfb � 0.3 and fv � 5 as shown in Fig. 2, removing this contrast andsetting fv = fb only increases the cumulative infiltration by a factorof 10% for the heaviest storms and h-independent infiltration (seeSupplementary Fig. 1), which is comparable to increasing the infil-tration contrast by a factor of 2 (see Fig. 3). Furthermore, this sen-sitivity to the roughness decreased as the infiltration contrastincreased, suggesting that it is most important for low surfacegradients.
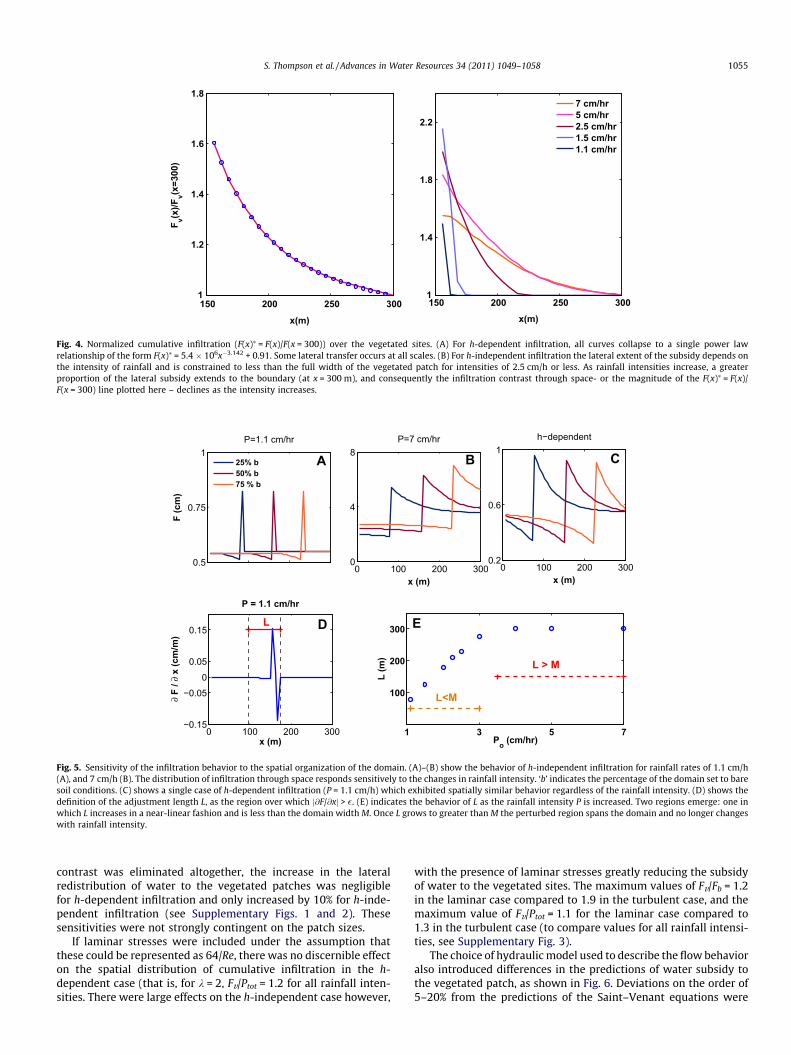
The water contributed to the patch by lateral flow does not infil-trate uniformly across the vegetated site but is concentrated at thebare-soil – vegetation boundary. As shown in Fig. 4, the profile ofthe lateral distribution of infiltrated water is invariant in the caseof h-dependent infiltration, but varies with intensity where infil-tration is independent from h. In this case, the center of the patchis only subsidized by lateral redistribution for the most intense andinfrequent storms. By computing the spatial gradient of the cumu-lative infiltration volume, a region can be defined where j@F/@xj > �,where � = 0.001 maxj@F/@xj. As illustrated in Fig. 5, panel D, this isthe region where the presence of the soil-vegetation contrastappreciably alters the local infiltration due to the action of lateralflow. This region can be quantified by a length-scale L (defined asthe length of the region where j@F/@ xj > �), termed the infiltrationadjustment length. L defines the component of the bare soil regionthat contributes water to the vegetated patch via lateral flow, andthe component of the vegetated patch which receives this redis-tributed water as infiltration. In the same way that the redistrib-

Fig. 1. (A) Runon–runoff dynamics are hypothesized to contribute to the persistence of patchy arid ecosystems such as these found in South-Eastern Niger, 12�19054.9100N,3�10041.7600E. Image from Google Earth. Copyright 2011 Digital Globe. (B) By assuming that infiltration scales linearly with ponded depth, varies with local vegetation cover,and that flow can be approximated by a diffusion equation, simple models reproduce the morphology of observed vegetation patterns. The color scale is proportional to localbiomass density, normalized between 0 (bare soil) and 1 (complete vegetation cover). Source: Example taken from [45].
Table 2Parameters for the model simulations. Where more than one parameter or modelcomponent is listed, the cases were run factorially to explore all combinations ofparameters.
Model component Value(s)
Infiltration model G(h) = h/zo or G(h) = 1Hydraulic model Saint–Venant equations, Mannings equation,
Nonlinear diffusion, Linear diffusionInfiltration contrast k 0 (no contrast), 2, 4Base infiltration rate 1.0 cm/h(a, cm/h)Roughness contrast Laminar f (no contrast, or 64/Re) or(bare soil to vegetated) Turbulent f (no contrast, or Eq. (9))Rainfall intensity (cm/h) 1.1, 1.5, 2.5, 5, 7 cm/hRainfall duration (min) 30Roughness length (zo, mm) 2Drag coefficient (Cd, –) 0.2Canopy height (Hc, m) 0.1 (always greater than ponded depth)Leaf density [m2/m3] 10
S. Thompson et al. / Advances in Water Resources 34 (2011) 1049–1058 1053
uted water is distributed non-uniformly across the vegetatedpatch, it is apparent that the loss of water to the lateral subsidy oc-curs non-uniformly across the bare patch, with the subsidy beingstrongest immediately adjacent to the patch boundary (see Fig. 5).
In practice L for the h-dependent infiltration always extends tothe domain boundary (Fig. 5 Panel C), implying that all of the baresoil area contributes to the lateral flux, and all of the vegetatedpatch receives a lateral subsidy. However, the infiltration adjust-ment length for h-independent infiltration is a function of the rain-fall intensity (Fig. 5 Panels A and B). Where L�M with Mrepresenting the size of the domain, alterations to the spatial con-figuration of vegetation and soil, or to the size of the vegetatedpatch, adjust the importance of the subsidy in trivial ways only.That is, although the ratio of Fv to Ptot increases as the size of thevegetated patch shrinks, this simply reflects that a relatively largerproportion of the vegetated patch is spanned by L (c.f. Fig. 5 panelA). A fixed bare soil area contributes to the lateral fluxes, and afixed vegetated area receives the subsidy, and the Fv to Ptot ratioonly reflects the magnitude of the subsidized area to the wholevegetation patch. However, as P rises, L increases to the pointwhere it spans the domain and interacts with the domain bound-ary (c.f. Fig. 5 panel B). This interaction not only increases the pro-portion of the vegetated patch spanned by L, but also themagnitude of the subsidy to the patch, due to water backing upfrom the no-flow condition at the boundary. Thus the boundarycondition interaction leads to a greater subsidy effect for a 75%
bare area when P = 7 cm/h (Fig. 5 panel B) but not whenP = 1.1 cm/h (Fig. 5 panel A). The flow-boundary interaction is re-flected in the nonlinear dependence of the subsidy on the patchsize for increasing rainfall intensities (Table 3). In the case of h-dependent infiltration, the boundary conditions influence pondedwater redistribution for even the lowest intensity storms. How-ever, these effects are invariant with storm size, meaning thatthe proportional changes in lateral redistribution induced by thepatch area are insensitive to the rainfall intensity (Table 3). Asthe rainfall intensity increases, the infiltration adjustment lengthincreases in a near linear fashion until L �M at which point theboundary conditions interact sensitively with the infiltrationbehavior (see Fig. 5 panel D).
This analysis suggests that the infiltration adjustment length Lis a key length-scale dictating the infiltration behavior in the sys-tems where infiltration behaves in an h-independent fashion. Thesensitivity of L to P appears to be near-linear. As the infiltrationcontrast increases, L grows more slowly with P: L / 105P for k = 2but L / 51P for k = 4. The infiltration adjustment length is insensi-tive to the presence of a roughness contrast in fb and fv. It is how-ever sensitive to the assumptions about the parameterization ofthe stresses, and L is constrained at low Reynolds numbers underthe assumption that f = 64/Re.
The emergence of L as a key length scale determining the redis-tribution of water suggests that adjustments to the spatial scale ofthe domain M could ensure that all the bare soil area contributes tothe lateral flow, and that all the vegetated patch benefits from theredistribution. Assuming L is approximately symmetric across theplant-soil boundary, this optimization would be achieved whenM < L, with the L value derived from the average properties of thestorms that generate lateral flow at any given location. Based onobservations of patchy vegetation, a reasonable ‘lower bound’ onthe patch size is approximately 30 m, compared to the 300 m pre-viously assumed. Re-running the model results suggests that thedegree of subsidy for M = 300 or M = 30 is virtually unchangedfor low intensity storms. As the storm intensity increases lateraltransport for M = 30 is enhanced relative to M = 300, and rainfallsubsidies increase by approximately 15% (h-independent infiltra-tion). The enhancement of infiltration subsidies was damped forthe case of h-dependent infiltration (presumably because theboundary condition influenced water redistribution in both the30 and 300 m domains) with a �3% enhancement of infiltration.
The results discussed above assume that the two-dimensionalform of the patches can be locally approximated as a linear vege-

0 100 200 3000
1.5
3
Distance (m)
Pond
ed d
epth
(cm
)
0
2
4
6
f
0 100 200 3000
0.03
0.06
Distance (m)
Velo
city
(cm
/s)
−0.03
−0.015
0
∂ h
/ ∂ x
(cm
/m)
0 100 200 3000
1.5
3
Pond
ed d
epth
(cm
)
0
2
4
6
f
0 100 200 3000
0.03
0.06
Velo
city
(cm
/s)
−0.03
−0.015
0
∂ h
/ ∂ x
(cm
/m)
BA
C D
hf
V∂h/∂x
Fig. 2. Examples of the computed profiles of ponded water depth, friction factors, the surface water slope and the flow velocities at the end of a 30 min 7 cm/h storm event for(A) and (B) h-dependent infiltration and (C) and (D) h-independent infiltration. Panels (A) and (C) show the ponded depth (blue, left axis) and the friction factors (black dashedlines, right axis). The green bars indicate the vegetated region. Panels (B) and (D) show the flow velocity (with the positive direction being from left to right) (pink, left axis)and the surface water gradients (light blue dashed lines, right axis). Note that the peak flow velocities do not coincide with the maximum surface gradients because of thehigher resistance generated by vegetation. (For interpretation of the references to colour in this figure legend, the reader is referred to the web version of this article.)
1 3 5 71
1.5
2
2.5
F v / F b
P, cm/hr
λ=2, h−dependentλ=4, h−dependentλ=2, h−independentλ=4, h−independent
1 3 5 71
1.1
1.2
1.3
1.4
F v / P to
t
P, cm/hr
Fig. 3. Contrast in cumulative infiltration between bare soil and vegetated sites as a function of the infiltration contrast k, the infiltration behavior (h-dependence orindependence) and the rainfall intensity. (B) Relative enhancement of vegetation water availability over rainfall as a function of infiltration contrast and infiltration behavior.
1054 S. Thompson et al. / Advances in Water Resources 34 (2011) 1049–1058
tated band, a reasonable assumption for ‘labyrinthine’ or ‘gappedmorphologies’ [8]. For isolated, near-circular patches of vegetation,however, the ratio of the patch area to the length of the patch edgeis much smaller. When M = 300, such circular morphology wouldincrease the water availability by �35% or �48% over rainfall foran h-dependent infiltration case (for k = 2 and k = 4), or by as muchas 62% of rainfall depth for h-independent infiltration withP = 7 cm/h and k = 4. The most efficient water transfer scenariowe considered consists of circular patches, occupying 25% of thedomain, with a ‘short’ wavelength of 30 m. Under these conditions,the total lateral subsidy amounts to an additional 110% of the rain-fall received by the patch. This is consistent with the observationsof patchy vegetation forming isolated ‘spot’ patterns in very dry cli-mates [8].
4.2. How sensitive are the predictions about the lateral redistributionto the assumptions made about infiltration, roughness, and to thechoice of hydraulic model used to parameterize the flow?
As illustrated in Fig. 3, the assumptions about infiltrationbehavior were the dominant factor in determining the redistribu-tion of water for cases where it is assumed that the stresses arefully turbulent. Changes in infiltration behavior altered the sensi-tivity of the redistribution to the rainfall intensity, and alteredthe magnitude of the redistribution by factors of up to 100%. Bycomparison, doubling the infiltration sensitivity to the presenceof vegetation (i.e. altering the infiltration contrast by �70% forthe parameters chosen) resulted in only a 10% change in the vol-ume of water infiltrated over the vegetated patch. If the roughness
150 200 250 3001
1.4
1.8
2.2
x(m)
7 cm/hr5 cm/hr2.5 cm/hr1.5 cm/hr1.1 cm/hr
150 200 250 3001
1.2
1.4
1.6
1.8
x(m)
F v(x)/F
v(x=3
00)
Fig. 4. Normalized cumulative infiltration (F(x)⁄ = F(x)/F(x = 300)) over the vegetated sites. (A) For h-dependent infiltration, all curves collapse to a single power lawrelationship of the form F(x)⁄ = 5.4 � 106x�3.142 + 0.91. Some lateral transfer occurs at all scales. (B) For h-independent infiltration the lateral extent of the subsidy depends onthe intensity of rainfall and is constrained to less than the full width of the vegetated patch for intensities of 2.5 cm/h or less. As rainfall intensities increase, a greaterproportion of the lateral subsidy extends to the boundary (at x = 300 m), and consequently the infiltration contrast through space- or the magnitude of the F(x)⁄ = F(x)/F(x = 300) line plotted here – declines as the intensity increases.
0.5
0.75
1P=1.1 cm/hr
F (c
m)
0 100 200 3000.2
0.6
1h−dependent
x (m)0 100 200 300
0
4
8P=7 cm/hr
x (m)
25% b50% b75 % b
0 100 200 300−0.15
−0.050
0.05
0.15
x (m)
∂ F
/ ∂ x
(cm
/m)
P = 1.1 cm/hr
1 3 5 7
100
200
300
Po (cm/hr)
L (m
)
A B C
D E
L > M
L<M
L
Fig. 5. Sensitivity of the infiltration behavior to the spatial organization of the domain. (A)–(B) show the behavior of h-independent infiltration for rainfall rates of 1.1 cm/h(A), and 7 cm/h (B). The distribution of infiltration through space responds sensitively to the changes in rainfall intensity. ‘b’ indicates the percentage of the domain set to baresoil conditions. (C) shows a single case of h-dependent infiltration (P = 1.1 cm/h) which exhibited spatially similar behavior regardless of the rainfall intensity. (D) shows thedefinition of the adjustment length L, as the region over which j@F/@xj > �. (E) indicates the behavior of L as the rainfall intensity P is increased. Two regions emerge: one inwhich L increases in a near-linear fashion and is less than the domain width M. Once L grows to greater than M the perturbed region spans the domain and no longer changeswith rainfall intensity.
S. Thompson et al. / Advances in Water Resources 34 (2011) 1049–1058 1055
contrast was eliminated altogether, the increase in the lateralredistribution of water to the vegetated patches was negligiblefor h-dependent infiltration and only increased by 10% for h-inde-pendent infiltration (see Supplementary Figs. 1 and 2). Thesesensitivities were not strongly contingent on the patch sizes.
If laminar stresses were included under the assumption thatthese could be represented as 64/Re, there was no discernible effecton the spatial distribution of cumulative infiltration in the h-dependent case (that is, for k = 2, Fv/Ptot = 1.2 for all rainfall inten-sities. There were large effects on the h-independent case however,
with the presence of laminar stresses greatly reducing the subsidyof water to the vegetated sites. The maximum values of Fv/Fb = 1.2in the laminar case compared to 1.9 in the turbulent case, and themaximum value of Fv/Ptot = 1.1 for the laminar case compared to1.3 in the turbulent case (to compare values for all rainfall intensi-ties, see Supplementary Fig. 3).
The choice of hydraulic model used to describe the flow behavioralso introduced differences in the predictions of water subsidy tothe vegetated patch, as shown in Fig. 6. Deviations on the order of5–20% from the predictions of the Saint–Venant equations were

Table 3Fv/Ptot reported for five different rainfall intensities and three different patch sizes. ‘b’indicates the bare soil area, and ‘v’ the vegetated area.
P (cm/h) 25:75 b:v 50:50 b:v 75:25 b:v 50:50 b:vM = 300 m M = 300 m M = 300 m M = 30 m
h-Independent infiltration1.1 1.01 1.02 1.12 1.021.5 1.05 1.06 1.24 1.092.5 1.10 1.12 1.42 1.265 1.14 1.23 1.67 1.397 1.15 1.28 1.82 1.41
h-Dependent infiltration1.1 1.21 1.21 1.48 1.241.5 1.21 1.21 1.49 1.252.5 1.21 1.21 1.49 1.255 1.21 1.21 1.49 1.257 1.21 1.21 1.49 1.25
1056 S. Thompson et al. / Advances in Water Resources 34 (2011) 1049–1058
associated with the use of linearized or simplified flow models.These errors are comparable to the magnitude of the enhancementof infiltration in the vegetated sites induced by the soil contrast (c.f.Fig. 3). The exception is the linear diffusion model in combinationwith h-dependent infiltration, which reproduces the predictionsfrom the Saint–Venant equations closely. Coincidentally (and fortu-nately), this is the combination of infiltration and hydraulicassumptions used in the majority of patchy arid ecosystem models[6,8,25,26], suggesting that the choice of a simplified hydraulicmodel is unlikely to have significantly biased the predictions ofthese models in situations where h-dependent infiltration occurs.
5. Discussion and conclusion
The analysis here suggests several broad conclusions: firstlythat on flat sites, the infiltration contrast can induce significant lat-eral transport of water during storm events, secondly that the nat-ure of the infiltration assumptions and infiltration contrast are themost significant controls on this transport, with the hydraulic fac-tors such as surface roughness acting as secondary effects, and fi-nally that the redistribution behavior can be approximated by alengthscale that appears to increase in a near-linear fashion withthe rainfall intensity.
1 3 5 70.8
0.9
1
1.1h dependent
Fv/F
v(SV
E)
P, cm/hr
SVE(λ = 2)Manning(λ = 2)Nonlinear(λ = 2)Linear(λ = 2)
Fig. 6. Cumulative infiltration in the vegetated zone as computed using three simplificatby the complete Saint–Venant equations. Note that where infiltration was proportional tocumulative infiltration in the vegetated sites, while a rating curve or a nonlinear diffusionthe error in each of the models ranges between 5% and 20%.
Applying a simple scale analysis to the steady-state Saint–Ve-nant momentum equation allows us to briefly explore these limita-tions of validity for this analysis. For instance, from the results of thesimulations shown in Fig. 2, the peak magnitude of @h
@x can be esti-mated as approximately 5 mm over 50 m, or a 0.1% slope. Wherebed slopes were much greater than 0.1%, the bed slope terms woulddominate over the free surface gradient and a more conventionalhydraulic analysis should be applied. Therefore, ‘flat’ in this contextis bounded by slopes on the order of 0.1%, or around 0.1�.
The model results have several implications for understandingthe dynamics of water redistribution in patchy arid ecosystems.Firstly, they suggest that even during intense storms on soils witha strong infiltration contrast, the total volume of water redistrib-uted laterally due to the slope produced by the free water surfaceis a relatively small fraction of rainfall. No simulation suggestedmore than a 110% enhancement of water availability (i.e. Fv/Ptot = 2.1) in the vegetated sites, and then only for the largest andleast frequent storms and with bare soil covering 75% of the do-main. This is much smaller than the reported enhancements inwater stored in the soil profile beneath vegetated sites on slopes(up to eight times the volume of annual rainfall as reported byGalle et al. [42] for sloping sites in the Sahel, where redistributioncontributed approximately four times more water to the vegetatedzone annually than did rainfall). The relatively small increases inwater availability introduced in this setting suggest that, withthe possible exception of sites where vegetation grows in verysmall, circular patches, it would be sensible to consider that sur-face redistribution of water operates in conjunction with otherfacilitative processes to sustain vegetation. This is particularlylikely to be true in situations where microtopographic variation ex-ists between bare and vegetated sites, since microtopographic var-iability is likely to impede lateral redistribution, or at least toconfine redistribution strongly to the edges of vegetated mounds.This conclusion broadly supports the likely importance of below-ground processes (i.e. redistribution of infiltrated water acrossthe plant root system) and the plant structural parameters for sus-taining vegetation growth in flat sites as suggested by Lefever et al.[7]. This would also be consistent with the observations of vegeta-tion patterning arising in locations where no infiltration contrast ispresent [5], and raises the possibility that different facilitative pro-cesses may sustain vegetation patches in sloping versus topo-graphically flat sites.
1 3 5 7
0.75
1
1.25h independent
P, cm/hr
ions to the Saint–Venant equations, relative to the cumulative infiltration computedponded depth, the linear diffusion approximation provided an excellent estimate ofapproximation induced 15–20% error. Where infiltration was independent of depth,
S. Thompson et al. / Advances in Water Resources 34 (2011) 1049–1058 1057
The 20–60% increases in water availability attributable to ru-non–runoff mechanisms in sites with approximately 50% plantcover (c.f. Fig. 2), while likely insufficient to fully explain the patch-iness of dryland vegetation, would contribute to the survival andgrowth of vegetation within patches, particularly at the edges.They may, for instance, explain the presence of a zone of annualplant growth often reported at the edge of vegetated patches [4].It is also in this zone that the roughness of the vegetated siteshas its most pronounced effects, particularly for larger stormevents, with increasing roughness tending to isolate the contribu-tion of redistributed water close to the edge of the patch (see Sup-plementary Fig. 2). The importance of the lateral contribution willdepend on the statistics of rainfall and the infiltration properties ata site. For instance, taking 20 years of rainfall statistics from Men-indee, Australia, where vegetated patches form on plains withslopes as low as 0.1%, [43,15] and simply weighting the eventsby frequency, we would predict that on average lateral subsidiescontribute some additional 26% of rainfall – or approximately70 mm/year to the maintenance of these vegetated sites (stormswith intensities of over 1.0 cm/h contributed 98% of all rainfall atthis site).
Secondly, the results suggest that to draw firm conclusionsabout the dynamics of water redistribution in topographically flatsites with contrasting soil properties, two aspects of the hydraulicsmust be better constrained. The first of these relates to the poten-tial links between the depth of ponded water and the dynamics ofinfiltration. Classical infiltration theory suggests that the spatialpartitioning of rainfall would be strongly dependent on stormintensity and the nature of the dominant stresses in the fluid (tur-bulent vs. laminar). If, however, infiltration rates are phenomeno-logically dependent on water depth, reflecting small scalemicrotopographic variations or surface cracking [29,27], thedynamics become relatively independent of rainfall intensity andother hydraulic assumptions. This is because an h-dependence ofthe infiltration behavior means that a pseudo-steady ponded watercondition exists at which the infiltration rate approximately bal-ances the rainfall intensity. The implications of such a pseudo-stea-dy state are that (a) water ponds across the entire profile, (b) thetotal variability in the ponded depth across the range of rainfallintensities tested is constrained: a factor of six variation in com-parison to a �60-fold variation for the h-independent case; and(c) the proportional contrast in ponded depth between the vege-tated and unvegetated sites is independent of the rainfall intensity(at steady state). This convergence to a constant contrast in pondeddepth is the dominant feature of the dynamics of the h-dependentsimulations, causing the rainfall spatial partitioning to be relativelyindependent of assumptions about roughness, laminar or turbulentflow regime, or the imposed rainfall variability. The potential forthe h-dependent infiltration dynamics to reach a steady statemay also explain why the linear diffusion model, which is basedon the assumption of steady-state inertial terms, was able to rea-sonably reproduce the results of the Saint–Venant equations. Bycomparison, the h-independent infiltration is always transient,and often leads to low ponded depths. These low ponded depthssignificantly slow the lateral water flux due to the feedback be-tween depth and flow rate. Consequently the redistribution behav-ior is much more sensitive to assumptions about roughness andflow regime in such a setup, and deviations between the Saint–Ve-nant results and those of the simplified flow models were alwaysobserved.
The sensitivity to the specification of the roughness and flowmotivates the need to further investigate the nature of the stressesopposing lateral flow. As identified above, the assumption that allstresses are laminar results in a very effective inhibition of lateralfluxes for all but the largest storms, and significantly inhibits thecapacity of infiltration contrasts to promote spatial partitioning
of infiltration volumes on flat terrain. Ascertaining the appropriateparameterization of laminar stresses with respect to the ReynoldsNumber is a necessary step to refining estimates of the significanceof overland flow. Considerable uncertainty still prevails in the liter-ature as to the appropriate way to model the stresses in partiallyinundated shallow flow over a rough boundary [34,32,24]. Experi-mental investigations for this specific orientation of bare soil andvegetation are likely to be the most appropriate way forward.
The modeling study suggests that for the purposes of develop-ing water routing models for patchy arid ecosystems, if infiltrationexhibits depth dependence, it may be reasonable to replace thesolution of the full Saint–Venant equations by a linearized diffu-sion model [8,26,6,25] without loss of validity of the solution.However, should conventional h-independent infiltration predom-inate, then neither a rating curve nor diffusive approximations tothe Saint–Venant equations can approximate the water redistribu-tion sufficiently well to resolve the behavior predicted by the fullSaint–Venant solutions.
The results suggest that one control on the redistribution ofwater is the infiltration adjustment length L, a hydraulic lengthscale set by soil and rainfall properties. Where the characteristiclength scale of the vegetation – soil spatial patchiness M greatly ex-ceeds L, lateral redistribution of water from bare sites to vegetatedsites is sub-optimal, since there are parts of the domain that arenot hydraulically influenced by the infiltration capacity contrast.This implies that not all bare soil regions effectively contributewater to the vegetated patch, and portions of the vegetated sitedo not receive water via run-on. Thus L sets a reasonable upperlimit on the spacing of vegetation patches in the landscape. In gen-eral we would anticipate that observed patch spacing would besmaller than L. Again using Menindee as an example, we wouldpredict from the rainfall regime that L would be �150 m, whiletypical repeating units in this area are instead found on scales of�50–100 m [44].
In closing, the numerical experiments performed here suggestthat there are several mechanistic uncertainties regarding thetopographically-flat lateral redistribution problem: the behaviorof infiltration and the description of the dominant stresses in thefluid. These uncertainties are amenable to experimental investiga-tion, either in field or controlled laboratory conditions (given theirphysical nature). Clarifying these uncertainties will contribute tounderstanding the eco-hydrological processes maintaining vegeta-tion growth in patchy arid ecosystems and will facilitate improvedeco-hydrological modeling of these systems.
Acknowledgements
The authors acknowledge support from the NSF through EAR –1013339, the NSF Graduate Fellowship program and the FulbrightItaly distinguished scholars program.
Appendix A. Supplementary data
Supplementary data associated with this article can be found, inthe online version, at doi:10.1016/j.advwatres.2011.05.012.
References
[1] Borgogno F, D’Odorico P, Laio F, Ridolfi L. Mathematical models of vegetationpattern formation in ecohydrology. Rev Geophys 2009:47.
[2] Bromley J, Brouwer J, Barker AP, Gaze SR, Valentin C. The role of surface waterredistribution in an area of patterned vegetation in a semi-arid environment,south-west Niger. J Hydrol 1997;198(1–4):1–29.
[3] Kefi S, Rietkerk M, Alados CL, Pueyo Y, Papanastasis VP, ElAich A, et al. Spatialvegetation patterns and imminent desertification in Mediterranean aridecosystems. Nature 2007;449(7159):U213–5.
1058 S. Thompson et al. / Advances in Water Resources 34 (2011) 1049–1058
[4] Seghieri J, Galle S, Rajot JL, Ehrmann M. Relationships between soil moistureand growth of herbaceous plants in a natural vegetation mosaic in niger. J AridEnviron 1997;36(1):87–102.
[5] Barbier N, Couteron P, Lefever R, Deblauwe V, Lejeune O. Spatial decoupling offacilitation and competition at the origin of gapped vegetation patterns.Ecology 2008;89(6):1521–31.
[6] HilleRisLambers R, Rietkerk M, van den Bosch F, Prins HHT, de Kroon H.Vegetation pattern formation in semi-arid grazing systems. Ecology2001;82(1):50–61.
[7] Lefever R, Barbier N, Couteron P, Lejeune O. Deeply gapped vegetationpatterns: on crown/root allometry, criticality and desertification. J Theor Biol2009;261(2):194–209.
[8] Rietkerk M, Boerlijst MC, van Langevelde F, HilleRisLambers R, van de Koppel J,Kumar L, et al. Self-organization of vegetation in arid ecosystems. Am Nat2002;160(4):524–30.
[9] Fiedler FR, Ramirez JA. A numerical method for simulating discontinuousshallow flow over an infiltrating surface. Int J Numer Methods Fluids2000;32(2):219–40.
[10] Giraldez JV, Woolhiser DA. Analytical integration of the kinematic equation forrunoff on a plane under constant rainfall rate and Smith and Parlangeinfiltration. Water Resour Res 1996;32(11):3385–9.
[11] Philip JR. An infiltration equation with physical significance. Soil Sci1954;77(2):153–7.
[12] Biscarini C, Di Francesco S, Manciola P. CFD modelling approach for dam breakflow studies. Hydrol Earth Syst Sci 2010;14(4):705–18.
[13] Khanna M, Malano HM. Modelling of basin irrigation systems: a review. AgricWater Manage 2006;83(1–2):87–99.
[14] Thompson SE, Harman CJ, Heine P, Katul GG. Vegetation-infiltrationrelationships across climatic and soil type gradients. J Geophys Res Biogeosci2010;115(G02023). doi:10.1029/2009JG001134.
[15] Dunkerley D. Systematic variation of soil infiltration rates within and betweenthe components of the vegetation mosaic in an Australian desert landscape.Hydrol Process 2002;16(1):119–31.
[16] Vanes HM. Evaluation of temporal, spatial and tillage-induced variability forparameterization of soil infiltration. Geoderma 1993;60(1–4):187–99.
[17] Hallett PD, Nunan N, Douglas JT, Young IM. Millimeter-scale spatial variabilityin soil water sorptivity: scale, surface elevation, and subcritical repellencyeffects. Soil Sci Soc Am J 2004;68(2):352–8.
[18] Greene RSB. Soil physical properties of 3 geomorphic zones in a semiaridmulga woodland. Aust J Soil Res 1992;30(1):55–69.
[19] Walsh RPD, Voigt PJ. Vegetation litter: an underestimated variable inhydrology and geomorphology. J Biogeogr 1977;4(3):253–74.
[20] Assouline S, Mualem Y. Modeling the dynamics of soil seal formation: analysisof the effect of soil and rainfall properties. Water Resour Res2000;36(8):2341–9.
[21] Belnap J. The potential roles of biological soil crusts in dryland hydrologiccycles. Hydrol Process 2006;20(15):3159–78.
[22] Philip JR. Infiltration into crusted soils. Water Resour Res 1998;34(8):1919–27.[23] Thompson SE, Katul GG, Porporato A. Role of microtopography in rainfall–
runoff partitioning: an analysis using idealized geometry. Water Resour Res2010;46(W07520). doi:10.1029/2009WR008835.
[24] Poggi D, Krug C, Katul GG. Hydraulic resistance of submerged rigid vegetationderived from first-order closure models. Water Resour Res 2009:45.
[25] Meron E, Gilad E, von Hardenberg J, Shachak M, Zarmi Y. Vegetation patternsalong a rainfall gradient. Chaos Soliton Fract 2004;19(2):367–76.
[26] Yizhaq H, Gilad E, Meron E. Banded vegetation: biological productivity andresilience. Phys A – Statist Mech Appl 2005;356(1):139–44.
[27] Dunne T, Zhang WH, Aubry BF. Effects of rainfall, vegetation andmicrotopography on infiltration and runoff. Water Resour Res1991;27(9):2271–85.
[28] Fox D, Le Bissonais Y, Bruand A. The effect of ponding depth on infiltration in acrusted surface depression. Catena 1998;32(2):87–100. doi:10.1016/S0341-8162(98)00042-3.
[29] Novak V, Simunek J, van Genuchten MT. Infiltration of water into soil withcracks. Journal of Irrigation and Drainage Engineering – ASCE2000;126(1):41–7.
[30] Martinez Meza E, Whitford W. Stemflow, throughfall and channelization ofstemflow by roots in three Chihuahuan desert shrubs. J Arid Environ1996:271–87.
[31] Domingo F, Sanchez G, Moro MJ, Brenner AJ, Puigdefabregas. Measurementand modelling of rainfall interception by three semi-arid canopies. Agric ForestMeteorol 1998;91(3-4):275–92.
[32] Roche N, Daian JF, Lawrence DSL. Hydraulic modeling of runoff over a roughsurface under partial inundation. Water Resour Res 2007;43(W08410).doi:10.1029/2006WR005484.
[33] Brutsaert W. Hydrology: an introduction, vol. 1. Cambridge: CambridgeUniversity Press; 2005.
[34] Lawrence DSL. Hydraulic resistance in overland flow during partial andmarginal surface inundation: experimental observations and modeling. WaterResour Res 2000;36(8):2381–93.
[35] Abrahams AD, Parsons AJ, Luk SH. Resistance to overland flow on deserthillslopes. J Hydrol 1986;88(3–4):343–63.
[36] Blasius H. The law of similarity of frictional processes in fluids. Berlin: Wesen;1913.
[37] Brutsaert W, Yeh GT. A power wind law for turbulent transfer computations.Water Resour Res 1970;6(5):1387–91.
[38] Chen CI. Unified theory on power laws for flow resistance. J Hydraulic Eng –ASCE 1991;117(3):371–89.
[39] Katul GG, Wiberg P, Albertson J, Hornberger G. A mixing layer theory for flowresistance in shallow streams. Water Resour Res 2002;38(11).
[40] Katul G, Poggi D, Ridolfi L. A flow resistance model for assessing the impact ofvegetation on flood routing mechanics. Water Resour Res., in press.
[41] Bureau of Meteorology. Intensity frequency duration curves for Karratha,Western Australia; 2009.
[42] Galle S, Ehrmann M, Peugeot C. Water balance in a banded vegetation pattern– a case study of tiger bush in western Niger. Catena 1999;37(1–2):197–216.
[43] Bureau of Meteorology. Rainfall statistics for Menindee, NSW; 2011.[44] Dunkerley D, Brown KJ. Oblique vegetation banding in the australian arid
zone: implications for theories of pattern evolution and maintenance. J AridEnviron 2002;51:163–81.
[45] Thompson SE, Katul GG, MacMahon S. Role of biomass spread in vegetationpattern formation within arid ecosystems. Water Resour Res2008;44(E10421).