UNSTEADY AERODYNAMICS OF NONSLENDER...
125
UNSTEADY AERODYNAMICS OF NONSLENDER DELTA WINGS I. Gursul*, R. Gordnier**, and M. Visbal** Abstract Unsteady aerodynamics of nonslender delta wings, covering topics of shear layer instabilities, structure of nonslender vortices, breakdown, maneuvering wings, and fluid/structure interactions, are reviewed in this paper. Vortical flows develop at very low angles of attack, and form close to the wing surface. This results in strong interactions with the upper-surface boundary layer and in a pronounced dependence of the flow structure on Reynolds number. Vortex breakdown is observed to be much less abrupt compared to breakdown over slender wings. This results in challenges for the precise determination of vortex breakdown location and the interpretation of flow visualizations. One of the distinct features of nonslender wings is the location of the primary attachment zone outboard of the symmetry plane. Reattachment location correlates with the wing stall process and increased buffeting. Dramatic fluid/structure interactions emerge with increasing wing flexibility and result in substantial lift enhancement in the post-stall region. This recently discovered phenomenon appears to be a feature of nonslender wings. Rigid delta wings undergoing small amplitude oscillations in the post-stall region exhibit many similarities to flexible wings, including reattachment and re-formation of the leading-edge vortices. Unusual self-excited roll oscillations have also been observed for free-to-roll nonslender wings. * University of Bath, Department of Mechanical Engineering, Bath, BA2 7AY, UK ** Air Force Research Laboratory, Wright Patterson Air Force Base, OH 45433, USA 1
-
Upload
duonghuong -
Category
Documents
-
view
219 -
download
0
Transcript of UNSTEADY AERODYNAMICS OF NONSLENDER...

UNSTEADY AERODYNAMICS OF NONSLENDER DELTA WINGS
I. Gursul*, R. Gordnier**, and M. Visbal**
Abstract
Unsteady aerodynamics of nonslender delta wings, covering topics of shear layer instabilities,
structure of nonslender vortices, breakdown, maneuvering wings, and fluid/structure interactions,
are reviewed in this paper. Vortical flows develop at very low angles of attack, and form close to
the wing surface. This results in strong interactions with the upper-surface boundary layer and in
a pronounced dependence of the flow structure on Reynolds number. Vortex breakdown is
observed to be much less abrupt compared to breakdown over slender wings. This results in
challenges for the precise determination of vortex breakdown location and the interpretation of
flow visualizations. One of the distinct features of nonslender wings is the location of the
primary attachment zone outboard of the symmetry plane. Reattachment location correlates with
the wing stall process and increased buffeting. Dramatic fluid/structure interactions emerge with
increasing wing flexibility and result in substantial lift enhancement in the post-stall region. This
recently discovered phenomenon appears to be a feature of nonslender wings. Rigid delta wings
undergoing small amplitude oscillations in the post-stall region exhibit many similarities to
flexible wings, including reattachment and re-formation of the leading-edge vortices. Unusual
self-excited roll oscillations have also been observed for free-to-roll nonslender wings.
* University of Bath, Department of Mechanical Engineering, Bath, BA2 7AY, UK
** Air Force Research Laboratory, Wright Patterson Air Force Base, OH 45433, USA
1

NOMENCLATURE
c root chord length
CL lift coefficient
CN normal force coefficient
CR rolling moment coefficient
Cp pressure coefficient
f frequency
k fluctuating kinetic energy
Re Reynolds number based on chord length
s local semispan
S spectral density
St Strouhal number
t time; thickness of delta wing
T period
u axial velocity
U∞ free stream velocity
v swirl velocity
x chordwise distance
xbd breakdown location
y spanwise distance
z vertical distance above wing surface
φ roll angle; incidence of measurement plane
λ wavelength; dimensionless flexibility parameter
Γ circulation
Λ sweep angle
α angle of attack
δ wing tip displacement
ν kinematic viscosity
ω vorticity
2

CONTENTS
1. Introduction
1.1. Overview
1.2. Aerodynamic forces
2. Structure of nonslender vortical flows
2.1. Vortex structure
2.2. Shear layer instabilities
2.3. Vortex breakdown
2.4. Shear layer reattachment and stall
2.5. Effect of Reynolds number
2.6. Effect of leading edge shape
3. Fluid/structure interactions
3.1. Wings with moderate sweep angle
3.2. Wings with low sweep angle
3.3. Aeroelastic instabilities
4. Lift enhancement on flexible wings
4.1. Effect of wing sweep
4.2. Self-excited antisymmetric vibrations
4.3. Flow reattachment
5. Nonslender delta wings undergoing small amplitude motion
5.1. Periodic roll oscillations
5.2. Periodic pitch oscillations
3
6. Large amplitude maneuver of nonslender delta wings
7. Free-to-roll nonslender wings
7.1. Equilibrium positions at nonzero roll angles
7.2. Self-excited roll oscillations
8. Conclusions
4

1. Introduction
The next generation of unmanned flight vehicles will be highly flexible, will have lower
structural-weight-to-take-off-weight ratios, and will be capable of performing extreme
manuevers at high g. The proposed concepts will incorporate low to moderately swept (35° to
55°) wing planforms. Figure 1 shows some conceptual Unmanned Combat Air Vehicle (UCAV)
designs, which incorporate blended delta wing-body configurations. Similarly, low-aspect ratio
wings with low sweep angles are often used for Micro Air Vehicle (MAV) configurations, as
shown in Figure 1. All these configurations exhibit vortex-dominated flows [1]. At the recent
international “Workshop on Aerodynamic Issues of Unmanned Air Vehicles” [2] it was
recognised that serious aerodynamic, stability and control issues may exist for these
configurations. In most cases, laminar-transitional flows are dominant, and separation, transition
and vortical flows play important roles.
The recent interest in MAVs and UAVs has resulted in a need to further our
understanding of flows over nonslender delta wing configurations. For the purposes of this
review article, a nonslender wing is defined as one with leading-edge sweep equal to or less than
55°. Vortical flow over nonslender delta wings has recently become a topic of increased interest
in the literature. While the flow topology over more slender wings, typically Λ ≥ 65°, has been
extensively studied and is now reasonably well understood [3, 4, 5, 6], the flow over lower
sweep wings has only recently attracted more attention [7].
1.1. Overview
Early work in the field [8] reported that the vortex core was very unsteady and the vortex
breakdown was difficult to identify for sweep angles of 55° and 45°. Wentz and Kohlman [9]
5

indicated that the vortex breakdown was only observed in a region close to the apex for a Λ =
50° wing. Both studies, which were conducted at Reynolds numbers on the order of 106,
concluded that the location of breakdown could not be found for a Λ = 45° wing, indicating that
it was very close to the apex of the wing at small incidences.
Well-defined vortices were visible in low-Reynolds number experiments (Re = 7,000 in
[10] and Re = 8,500 in [11]) over a Λ = 50° swept wing. At these very low Reynolds numbers,
vortices exhibit wake-like axial velocity profiles even upstream of breakdown [11, 12, 13]. The
vortices form close to the surface of the wing [14], and vortex/boundary layer interaction
becomes important [15, 16]. A further consequence of the interaction between the boundary
layer and vortex flows is the sensitivity of non-slender wing flows to the Reynolds number that is
not observed over slender wings [17].
Separated and vortical flows are dominant even at very low incidences. The flows that
occur over nonslender wings have been shown to differ substantially from those documented
over more slender planforms at high angles of attack and Reynolds number. While a slender
wing typically exhibits a coherent primary vortex generated by the rollup of the shear layer
separating from each leading edge, recent computational and experimental studies have
demonstrated that a ‘dual’ primary vortex structure exists over non-slender wings at low
incidence. This vortex structure is a direct result of the proximity of the vortex formation to the
wing surface, and the corresponding interaction with the surface boundary layer.
Evidence [8, 9] suggests that, at high Reynolds numbers, vortex breakdown occurs close
to the apex of the wing even at small incidences. Substantial differences from the breakdown of
slender vortices may exist, and there is evidence of highly unsteady flows over the wing. With
increasing angle of attack, vortex breakdown reaches the apex, and the separated shear layers
6

become the dominant feature of the flow. Much of the existing knowledge on vortex flows is
related to slender wings. A number of unsteady phenomena are known to exist over slender
delta wings, such as vortex wandering [18], helical mode instability [19, 20], shear layer
instabilities [21], vortex interactions [22], and at high incidences vortex shedding [23]. The role
of these instabilities in buffeting of slender wings is well understood [24]. However, very little is
known about the structure and characteristics of unsteady flow phenomena over nonslender
wings.
A unique feature of nonslender vortices is that primary attachment occurs outboard of the
symmetry plane even when vortex breakdown is close to the apex. With increasing incidence
this attachment line moves in-board towards the wing centerline. Just prior to stall, substantial
buffeting is associated with the attachment region. With further increase of angle of attack,
reattachment is no longer observed, corresponding to stall of the wing.
1.2. Aerodynamic forces
There are surprisingly little force data on low-sweep delta wings in the literature.
Compared with more slender planforms, nonslender wings have lower maximum lift coefficient
and also lower stall angle [8]. Figure 2 shows the variation of lift coefficient for delta wings
with various sweep angles in the range of Λ=45° to 76°, adapted from Earnshaw and Lawford’s
data [8]. For the delta wings with low sweep angle, the maximum lift coefficient decreases
considerably, although the slope of the lift curve increases, as expected. Earnshaw and Lawford
[8] measured the lift characteristics of a range of delta wings for Reynolds numbers in the range
0.2 to 0.5 million. However, the wings studied were relatively thick (having a thickness-to-chord
ratio of 6%) and incorporated a slight stream-wise camber; these factors account for the negative
7

zero-lift angle (α0) observed in their data. The slope of the pitching moment coefficient about
the wing’s apex increases in magnitude with decreasing sweep angle [8, 25].
According to Polhamus’ leading-edge suction analogy [26], the vortex lift contribution
becomes a smaller portion of the total lift as the sweep angle decreases. Also, there is no
obvious correlation between the onset of vortex breakdown over nonslender wings and the
change of the lift coefficient [27]. In a comparison of the lift coefficient at α=20° as a function
of sweep angle, it is shown that the lift coefficient remains nearly the same for low sweep delta
wings. Bartlett and Vidal [28] also showed that the lift coefficient at α=20° for four low-aspect
ratio wings with sweep angles 0° to 30° is little affected.
The effect of wing sweep on normal force coefficient is even larger, in particular at high
incidences. For low sweep angles, the normal force coefficient may become larger again after
the initial drop following the stall [8]. Figure 3 shows the difference between the maximum
normal force coefficient at stall and at zero incidence, CN,max-CN,0, as a function of sweep angle
from various sources. It is seen that, for low and high sweep angles, there is a trend of reaching
nearly constant values of maximum attainable force coefficient. While the local maximum for
sweep angle Λ=70° is related to the vortex breakdown phenomenon, it is not clear why there is
an asymptotic value at low sweep angles.
Strong Reynolds number influence [29] for Λ=55° wings, even with sharp leading-edges,
was noted near the stall angle, with earlier stall as the Reynolds number is increased in the range
of Re=0.38 to 2.2*106. As will be discussed later, there is a direct relation between flow
reattachment and stall; this indicates that the Reynolds number has possible effect on
reattachment.
8

2. Structure of nonslender vortical flows
Before describing the distinctive characteristics of the vortex structure for low sweep
delta wings, a brief description of the basic vortical flow features for high sweep wings is
provided. Rockwell [3] and Visbal [4] have discussed extensively the mean and unsteady
vortical flow structure over a 75° sweep delta wing. For a highly swept, sharp-edged delta wing
boundary layer separation occurs at the leading edge and results in the formation of free, three-
dimensional, shear layers that roll into a pair of counter rotating primary vortices. Viewed in a
spanwise plane normal to the wing these vortices appear as a nearly circular region of high
vorticity surrounded by a shear layer or feeding sheet which originates at the leading edge. This
shear layer may exhibit various forms of instability giving rise to vortical sub-structures which
wrap around the leading-edge vortex. The primary vortex interacts with the boundary layer
developing on the upper surface of the wing giving rise to boundary layer separation and the
formation of a secondary vortex of opposite sign vorticity.
As the angle of attack of a delta wing is increased the leading–edge vortices experience a
dramatic flow disruption termed ‘vortex breakdown’ or ‘vortex burst’. For higher sweep delta
wings the breakdown structure consists of a spiral winding opposite to the vortex swirl which
rotates in the swirl direction. Interior to the spiral is a region of reverse axial flow which gives
the characteristic switch from jet-like to wake-like flow from upstream to downstream of
breakdown. The onset of breakdown is very abrupt with the core expanding by approximately a
factor of 3.0. For this reason a location for vortex breakdown can be defined in a very
straightforward manner as the point of maximum upstream penetration of the reversed axial
flow. The fluctuations in the breakdown region due to the rotating spiral structure produce
distinct, dominant peaks in the frequency spectra in the core of the vortex. The time-averaged
9

representation of the spiral breakdown results in single-celled bubbles of reversed axial flow
with both front and aft stagnation points.
2.1. Vortex structure
Coherent leading edge vortices have been visualized experimentally for angles of attack
as low as α=2.5°. Surface oil flow visualizations of a 50° sweep delta wing by Taylor and
Gursul [30] show the distinctive imprint of a leading-edge vortex structure with a primary
attachment line and secondary separation line clearly visible (see Figure 4). Ol and Gharib [11]
have also stated that flow visualizations via dye injection indicate the presence of leading-edge
vortices down to an angle of attack α=2.5°. Experimental measurements [11, 15, 31] and
computational simulations [16] all report that for low angles of attack an elongated separated
flow region exists which lies very close to the upper surface of the wing. A plot of the velocity
profile through the vortex core from the computations of Gordnier and Visbal [16], Figure 5,
indicates a broad wake-like flow. This is consistent with the experimental measurements [12, 13]
which also exhibited wake-like behaviour for low angles of attack.
Computations [16] for a 50° sweep delta wing at α=5° have shown that this elongated
separated flow region at low angles of attack can take on an interesting dual vortex structure,
Figure 6. At upstream locations near the apex, the long, thin shear-layer that emanates from the
leading edge of the delta wing terminates in the formation of the primary vortex. Further
downstream a second vortex, with vorticity of the same sign as the primary vortex, emerges in
the separated shear layer outboard of the primary vortex creating a dual vortex structure. This
second vortex, which is slightly weaker and smaller than the original vortex, arises from the
interaction of the secondary flow with the primary shear layer. As the secondary flow separates
10

from the surface it impinges on the primary shear layer splitting it into the two same sign
vortices. At locations on the downstream half of the wing, the dual vortex structure weakens and
becomes less distinct. This is attributable to the onset of unsteadiness on the aft portion of the
wing.
The existence of this type of dual vortex structure has been confirmed by experimental
PIV measurements [15, 31], Figure 7, albeit for different Reynolds numbers, sweep angle and
angles of attack. Taylor et al [15] observed the dual vortex structure in PIV measurements for a
50° sweep wing at α=7.5° and a Reynolds number Re=8,700, Figure 7b. Sensitivity of this
structure to Reynolds number was noted in these experiments and was also seen in the
computations of Gordnier. This will be discussed in a subsequent section. PIV measurements by
Yaniktepe and Rockwell [31] for a 38.7° sweep delta wing at α=7° angle of attack and
Re=10,000, Figure 7c, showed two individual vorticity concentrations that retain their identity
along the surface of the wing. They report the wavelength between these concentrations to be
λ/s=0.25.
The mean structure of the vortex system changes as the angle of attack of the low sweep
wing increases [16]. The primary vortex increases in both size and strength with the core of the
primary vortex moving away from the surface and inboard on the wing. The axial velocity in the
core of the primary vortex reaches values of twice the freestream velocity by α=15°, Figure 5.
Stereo PIV velocity measurements by Ol and Gharib [11] at a lower Reynolds number,
Re=8,500, indicate a conical flow development of the primary vortex in a region slightly
downstream of the apex and upstream of the vortex breakdown location.
By α=10° a remnant of the dual vortex structure observed at 5° angle of attack remains,
albeit with the primary vortex now being much more prominent than the second primary vortex
11

which stays embedded in the separated shear layer. As the angle of attack is increased further to
α=15°, Figure 8, a vortex structure more reminiscent of those observed for higher sweep delta
wings is recovered. A dual vortex structure can no longer be distinguished and the classic
primary, secondary, and tertiary vortex structure characteristic of the flow over more slender
delta wings (see for instance Visbal [4]) is recovered, Figure 8b. A substantial secondary
separated flow region with axial vorticity of the opposite sign is obtained. Underneath this
secondary flow structure is a region of tertiary flow with vorticity of the same sign as the
primary vortex.
The impact of the vortical flow system above the wing on the surface flow is seen in
Figure 9 for α=15°. Due to the strengthening of the primary vortex above the delta wing, low
values of pressure are obtained under the vortical flow region. The limiting streamlines show a
primary separation at the leading edge, primary attachment line (PA), secondary separation line
(SS) and secondary attachment line (SA). In between the secondary separation and attachment
lines there are tertiary separation (TS) and attachment (TA) lines over a limited axial extent
associated with the tertiary flow observed in Figure 8b. In this case the primary attachment line
(PA) is observed to be outboard of the symmetry plane. Inboard of this attachment line the
limiting streamlines are approximately aligned with the freestream direction. This differs from
what has normally been observed for high sweep delta wings where the attachment line coincides
with the symmetry plane. With increasing angle of attack the primary attachment line moves
inboard and the region between the primary attachment line and the secondary separation line
expands. Experimental oil flow patterns obtained by Taylor and Gursul [30] show a similar
surface streamline pattern, Figure 9.
12

2.2. Shear layer instabilities
The mean vortical flow structure described in the previous section results from an
unsteady vortical flow that becomes progressively more complex with increasing angle of attack.
Figure 10 displays an isosurface of axial vorticity for α=15° from Reference [16] to visualize
this unsteady flow. At upstream locations a series of vortical substructures can be observed in the
outer shear layer that rolls up to form the primary vortex. These vortices form in the shear layer
that emanates from the leading edge. Subsequently, they are shed and convect downstream and
around the primary vortex. These shear-layer features surround a distinct vortex core visible
interior to the shear layer at upstream locations. Downstream this distinct vortex system breaks
up into a collection of very fine scale structures.
In this section we will concentrate on the unsteady flow features upstream of vortex
breakdown. Contours of the axial component of vorticity are plotted at an upstream location in
Figure 11a. One of the vortical structures that form in the shear-layer that emanates from the
leading edge of the delta wing and is subsequently shed can be clearly distinguished in Figure
11a. Accompanying this shear-layer instability is a significant unsteady behavior of the
secondary flow with vorticity of the opposite sign being ejected from the surface and wrapped
into the primary vortex. This eruptive response of the secondary flow, Figure 11a, results from
the interaction of the leading-edge vortex with the surface boundary layer flow. The unsteady
formation and shedding of these vortical structures and their close link to the boundary layer
eruptive behavior induced by the vortex/surface interaction has been described in detail
previously [21, 32, 33, 34] for higher sweep delta wings.
This unsteady behavior of the shear layer and secondary flow leads to a significant
wandering of the vortex core around a mean core location. The vortex core moves in an oval
13

pattern with the same sense of rotation as the swirl of the vortex. This unsteady motion of the
vortex core results in high values of the fluctuating kinetic energy, k, in the vortex core upstream
of vortex breakdown, Figure 11b. High levels of fluctuating kinetic energy are also present in the
shear layer and where the secondary flow eruption process occurs.
Experimental evidence for these types of shear-layer instabilities on low sweep delta
wings [Λ=45° and Λ=60°] was first reported by Gad-el-Hak and Blackwelder [35]. They
observed in flow visualizations at low Reynolds number that the vortex sheet emanating from the
leading edge rolls up periodically into discrete vortical sub-structures. They attributed this
phenomenon to the inviscid Kelvin-Helmholtz type instability of the shear layer. In more recent
experimental measurements for a Λ=38.7° wing, Yavuz et al [36] show regions of average
vorticity exhibiting well-defined concentrations of like sign along the leading edge which are
also distinguishable in instantaneous images of the flow, Figure 12. They state that these features
indicate the existence of a co-rotating pattern of small scale vorticity concentrations.
Measurements of the root-mean square velocity, Figure 12, indicate that substantial fluctuations
occur in this leading edge region. Yavuz et al [36] indicate that further investigation is required
to determine the exact physical origin of these ordered patterns of vorticity observed in the
leading-edge region.
2.3. Vortex breakdown
A common means used to study vortex breakdown over delta wings has been to visualize
streaklines by releasing smoke or dye in the vortex core upstream of vortex breakdown. This
technique has been very successful in displaying the distinctive character of the spiral vortex
breakdown [37, 38] that occur over slender delta wings. For low sweep wings, however,
14

additional challenges in interpreting these streakline visualizations exist due to the nature of the
vortex breakdown flow. Figure 13 compares the experimentally observed streakline visualization
[31] for a Λ=39° wing at α=7° with the numerical equivalent of the streakline visualization for a
Λ=50° wing at α=15°. Both the experiments and computations show very similar structures. The
flow structure observed exhibit distinct differences from the classic flow visualizations of spiral
vortex breakdown for high sweep wings. In each case the streakline initially remains straight.
Yaniktepe and Rockwell [31] then identify three distinct stages in the breakdown process. In
region I small scale undulations of the vortex core filament are evident. Gordnier and Visbal [16]
point out that this spiralling is associated with the vortex core motion driven by the shear layer
instabilities and not with the onset of vortex breakdown. Therefore, the initiation of spiraling of
the streakline may not be used to identify the onset of vortex breakdown. The beginning of
region II marks the location of the onset of vortex breakdown. Region II is characterized by a
small scale bubble or thickening of the vortex filament which is terminated at its downstream
end by a pinch off region where the diameter again becomes small. This is followed in region III
by an abrupt expansion of the breakdown region where the particles are diffused over a broad
area covering the outboard half of the wing.
Both Ol and Gharib [11] and Taylor et al [15] have reported from their flow
visualizations that the vortex breakdown location shows significant fluctuations in the
streamwise direction. For some cases fluctuations of 40% to 50% of the chord of the wing were
observed. This is in contrast to more slender wings where fluctuations of the order of 10% of the
chord length have been reported [39]. Ol and Gharib [11] noted that for certain cases in the
angle of attack range α=12.5° to 17.5° the right and left vortices actually disintegrate and reform
on a quasi-alternating basis. These large scale streamwise excursions of the vortex breakdown
15
location were not observed in the computations of Gordnier and Visbal [16]. This may be
attributable to the symmetry boundary condition imposed in the computations.
The structure of vortex breakdown over a 50° sweep delta wing has been studied in
greater detail both computationally [16] and by PIV measurements [11, 15, 30, 40]. The impact
of vortex breakdown on the mean flow structure at α=15° can be seen in Figures 8a and 9. The
high suction peaks obtained at upstream locations are lost further downstream, Figure 9. This
loss in suction peak corresponds to progressively smaller values of maximum axial vorticity in
the vortex core for downstream locations, Figure 8a. In addition, the core of the primary vortex
becomes more diffuse and increases in size. This change in character of the vortex is seen more
clearly by comparing the mean vortex structure for axial locations upstream and downstream of
breakdown, Figures 8b and c respectively.
The onset of vortex breakdown can be more clearly seen by examining the vortex
structure on a vertical plane through the vortex core. Figure 14 displays contours of the mean
axial velocity for α=5°−15°. At the higher angles of attack, Figures 14a, b, a jet-like velocity is
observed in the core of the vortex for upstream locations. This is similar to vortices over slender
delta wings at angle of attack, which exhibit a strong vortex core jet. To further examine this
behavior the mean axial velocity profiles across the vortex core at x/c=0.3 are plotted in Figure 5.
As noted previously, at the lowest angle of attack, α=5° a broad wake-like flow is obtained
throughout the whole vortex region, Figure 14c. As the angle of attack is increased, jet-like
velocities are obtained with the peak velocity in the core increasing from a value Ucore/U∞=1.48
at α=10° to Ucore/U∞ =1.99 for the 15° case.
Over a limited region in the axial direction a transition from a jet-like to a wake-like flow
occurs for the 10° and 15° cases, Figure 14a, b. This switch from a jet-like to a wake-like flow is
16
indicative of the onset of vortex breakdown (see for instance Rockwell [3] and Visbal [4]). In
neither case is an actual reversal of the mean axial flow achieved as is seen in the more slender
wing case. The onset of breakdown is also much less abrupt for the low sweep case with the
core expanding in a shallow, conical fashion. Due to these features of the low-sweep wing case,
it becomes much more difficult to define an exact location of vortex breakdown as done in the
high sweep case. Instead, by examining Figure 14 a region over which vortex breakdown occurs
can be defined. For α=10° this region extends from x/c=0.49 to x/c=0.7. The vortex breakdown
region is located further upstream for α=15° from x/c=0.4 to x/c=0.54. Although not shown here,
associated with this change from a jet to wake profile is a switch in the sign of azimuthal
vorticity [16] which is also characteristic of vortex breakdown [41].
PIV measurements [30] exhibit the same basic features for the breakdown structure.
Figure 15 compares the computed velocity magnitude with the experimental measurements for
α=15°. Contours of the inplane velocity magnitude are plotted on a plane through the vortex core
that forms an angle φ= 6° with the delta wing surface. The computational results agree well with
the experimental measurements with the vortex breakdown located only slightly further upstream
in the experiment. In both the experiment and computation the switch from jet-like flow
upstream of breakdown to wake-like flow downstream of breakdown can again be clearly seen.
As noted previously the mean vortical flow structure results from a very complex,
unsteady flow. The unsteady structure of vortex breakdown is seen in Figure 16a where the
coherent vortex core upstream of breakdown disintegrates into fine-scale, unsteady structures
downstream. The breakdown of the coherent vortex core into finer scales is also evident in a
plane normal to the vortex core, Figure 11c. At this location the whole vortex system has broken
down into a large number of small, highly unsteady flow features. Only a large region of
17

vortical flow made up of small scale structures can be distinguished with no clear vortex core
discernable. Also a distinct secondary flow region cannot be defined, though pockets of vorticity
of the opposite sign exist. Spectral analysis of the pressure fluctuations at the location noted in
Figure 13 shows a broad frequency distribution ranging from St=0 to St=5.0 with a peak
Strouhal number, St ≈ 2.8. This value is similar to the measurements [31] for a Λ=38.7° sweep
where a St ≈ 3.3 was measured.
In Figure 16b, there is again a switch from a jet-like flow in the core upstream of
breakdown to a wake-like flow in the breakdown region. In contrast to the mean flow, however,
small pockets of reversed axial flow (highlighted by white zero velocity contour lines) exist in
the breakdown region. The resulting levels of fluctuating kinetic energy in the vortex core plane
are seen in Figure 16c. The small-scale unsteady flow features of breakdown result in a broad
region of fluctuating kinetic energy, Figures 11d and 16c. Note that these levels are less than the
values associated with the vortex wandering upstream of breakdown.
2.4. Shear layer reattachment and stall
As noted earlier one of the distinct features of the low sweep flow structure is the
attachment of the shear layer inboard of the symmetry plane. Taylor and Gursul [30] explored in
more detail this reattachment process for a 50° sweep delta wing using PIV measurements in a
plane parallel and very close to the wing surface for α=10° to α=25°. Figure 17 shows the
streamline pattern and the magnitude of the rms velocity near the surface. For α=10° the
footprint of the vortex is bounded by the shear layer attachment line to the inboard side and the
secondary separation line to the outboard side. Increasing incidence moves the primary
reattachment line inboard towards the wing centerline. Figure 18 shows the inboard progression
18

of the attachment line for both wind tunnel and water channel cases [30]. In both cases, the
attachment line moves towards the centerline until it finally reaches the centerline near the onset
of stall α ≈ 22-23°. At the largest angle of attack, α = 25°, the wing has stalled and the
streamline pattern takes the form described in previous research [8] as a ‘whorl’.
At the lower angle of attack, Figure 17, a region of high rms velocity lies underneath the
path of the vortex. Downstream of breakdown this region of high rms velocity kinks and widens.
The maximum velocity fluctuations at α=15° occur just underneath the vortex axis after the point
of breakdown. By α=20° the vortex breakdown has reached the apex and the nature of the
fluctuations changes. The largest fluctuations are now observed near the wing centreline in the
region of the apex and just outboard along the attachment line. This region of large fluctuations
associated with the attachment of the shear layer provides an additional source of buffeting for
nonslender delta wings. This is in agreement with previous findings of Honkan and
Andreopoulos [42] who reported that the shear layer reattachment zone is associated with high-
turbulence activity. By α=25° flow has become completely stalled with very low time-averaged
velocities and velocity fluctuations near the wing surface.
As discussed above, the primary attachment region is characterized by high unsteadiness
at high angles of attack before complete stall takes place. Spectral analysis of the velocity
fluctuations near the surface [30] and of the surface pressure fluctuations [43, 44, 45] showed
dominant frequencies in the range of fc/U∞= 1 to 2 for low sweep wings with Λ=40° and 50°.
2.5. Effect of Reynolds number
Some of the features of the low sweep delta wing flow described here show sensitivity to
Reynolds number, particularly for the lower Reynolds numbers that were investigated. This low
19
Reynolds number range is important for applications related to MAVs. Figure 19 shows the
impact of Reynolds number on the development of the vortical flow and dual vortex structure in
the computations of Gordnier and Visbal [16]. Figures 19a-c present computed solutions for
Reynolds numbers 10,000, 20,000 and 50,000, respectively. The flow at the lowest Reynolds
number, Re=10,000, exhibits a strong viscous influence. Only a thick separated shear layer is
seen with no discernible vortex structure present. As the Reynolds number is increased to
Re=20,000, the influence of viscosity is reduced and a clear dual vortex structure develops.
Increasing Reynolds number to 50,000, results in a further strengthening of these vortices.
Downstream of the present location at this higher Reynolds number, the flow becomes highly
unsteady due to the transitional nature of the separated shear layer.
The influence of viscosity on the vortex structure at very low Reynolds numbers can also
be seen in the measurements [11] for a 50° sweep delta wing at Re=8500. In that study, wake
profiles were measured for all angles of attack (α=5° to α= 20°), including angles for which
vortex breakdown was downstream of the measurement location and a jet-like flow might be
expected (e.g. α=10°). This is in contrast to the computations [16] for a similar 50° sweep wing
with Re=26,000 which showed jet-like velocity profiles through the core of the vortex except at
the lowest angle of attack, α=5°, Figure 5. To investigate this difference a computation was
performed for α=15° and a Reynolds number, Re=8500. The computed velocity profile for this
case, Figure 5, is comparable to the measurements of Ol and Gharib [11] with a shallow wake
associated with the intact primary vortex core. A much more significant wake is associated with
the large secondary flow near y/yle=0.8. These computations indicate that at very low Reynolds
numbers or low angles of attack wake-like flows can exist in the vortex core even upstream of
20

breakdown for low sweep delta wings. At higher angles of attack and more typical Reynolds
number the more standard jet-like flow is recovered.
The primary vortex core location has also shown sensitivity to Reynolds number. Taylor
and Gursul [30] showed that the trajectory of the vortex core shifted inboard towards the
centreline as the Reynolds number is reduced. Figure 20 shows the variation of the spanwise
location of the primary vortex core with Reynolds number. Comparisons of the measurements
are made with other data presented in the literature [10, 11, 16]. At higher Reynolds numbers
(on the order of 30,000) the flow approaches an asymptotic state, with further increases in
Reynolds number resulting in only small variations in the location of the vortex core. There
appears to be a strong dependence of the vortex trajectory on incidence at very low Reynolds
numbers and a degree of scatter exists in the data indicating that the measured results may be
sensitive to small changes in the experimental set-up or measurement technique. At higher
Reynolds numbers this sensitivity of vortex trajectory to angle of attack decreases, which is
consistent with the inviscid theory of Moore and Pullin [46]. All of these results suggest that
care must be taken when trying to extrapolate the vortical flow structure found at very low
Reynolds numbers to higher Reynolds numbers.
The Reynolds number dependence of the multiple vortices and their interactions on a
generic UCAV configuration was reported by Elkhoury and Rockwell [47] for Re ≤ 40,000. It
was shown that the sensitivity of vortex breakdown is much larger at low angles of attack when
the vortex system resides closer to the wing. Furthermore, multiple vortex interactions also
display marked dependence on Reynolds number. This is more apparent a low incidences and
decreases with increasing angle of attack.
21

2.6. Effect of leading edge shape
The basic features of the flow for sharp leading-edges described here are strongly
affected by the leading-edge shape. Realistic configurations will have round leading-edges, and
this affects not only the flow separation characteristics, but also the primary attachment location.
Figure 21 shows the location of the attachment line for various leading-edge shapes [48] for
Λ=50° wings with thickness/chord ratio of 4%. It is seen that for all rounded edges the
reattachment line is more outboard for any given angle of attack, which indicates a delay in the
stall. Indeed, the measured lift coefficients [48] exhibit substantial delays, as shown in Figure
22. At first sight, this seems logical, given that nonslender wings are closer to two-dimensional
airfoils, which are well-known for their sensitivity to flow separation at the leading-edge and
resulting stall. However, in the case of nonslender delta wings, the stall is related to the
reattachment process, although the origin of the separated shear layer is likely to be affected by
the leading-edge separation. For a sweep angle of 45°, Kawazoe et al [49] also showed that the
stall is delayed for rounded leading-edge, and this was due to the primary attachment line
reaching the wing centerline at a larger angle of attack.
Miau et al [10] showed for Λ=50° wings with various leading-edge shapes that the flow
separation and formation of the leading-edge vortices were strongly affected by leading-edge
shape. However, their experiments were conducted at a low Reynolds number (Re=7,000),
where viscous effects are dominant. Force measurements at much higher Reynolds numbers
(shown in Figure 22) indicate that effects in the pre-stall region are small.
For slender wings, the leading-edge profile strongly affects the location of vortex
breakdown, but lift is weakly influenced [50]. While there is virtually no change in stall angle
22

for slender wings, the effect for nonslender wings is substantial. Also, rounded leading-edges
result in generally milder stall.
3. Fluid/structure interactions
The vortical flow over a low sweep delta wing described in the previous section became
increasingly unsteady as the angle of attack of the wing increased. Sources of this unsteadiness
included shear layer instabilities and vortex breakdown. Menke et al [22] have shown that there
are a variety of unsteady phenomena that occur over slender delta wings, Figure 23, and the
characteristic time scales of these phenomena differ by several orders of magnitude. These
highly unsteady vortical flows can lead to buffeting of flexible delta wings due to the fluctuating
loads on the surface of the wing.
3.1. Buffeting of wings with moderate sweep angle
Gray et al [51] have investigated the buffet response of a moderately swept, Λ=60°,
aluminium delta wing over a variety of flow regimes by varying the angle of attack from 0° to
50°. In their experiments both a half-wing and full-wing model were investigated. Gordnier and
Visbal [52] have performed corresponding computational simulations for the half-wing model
using the inviscid Euler equations to simulate the aerodynamics and a finite element von Karman
plate model for the structures.
The buffeting response of the delta wing as indicated by the rms acceleration at the wing
tip is plotted as a function of angle of attack in Figure 24 for both the experiment and the
computations. Good qualitative agreement is seen between the experimentally measured
response and the computations. A number of factors contribute to the quantitative discrepancies
23
in the rms response including, structural damping, wind tunnel wall influences and unsteady
viscous effects not captured by the inviscid Euler computations. As described by Gray et al. [51],
a rapid increase in the buffet response of the wing occurs as vortex breakdown moves over the
wing between α=5° and 22.5°. As the breakdown approaches the apex of the wing the rms
acceleration reaches its maximum values for α=22.5°-27.5°. When the vortex breakdown
reaches the apex of the wing and the onset of wing stall occurs, α=27.5°−40°, the level of
buffeting reduces rapidly.
To better understand the buffeting response of the wing both the mean deflections and the
unsteady fluctuations were studied. Figure 25 shows how the mean wingtip deflection varies as a
function of angle of attack for the computations [52]. The mean deflection continually rises as
angle of attack is increased up to α=35°. At α=40° a drop in the mean deflection occurs. This
decrease in the deflection results from the loss of additional suction from the vortical flow with
the onset of full stall over the wing for α ≥ 35°. The mean deflection of the wing is primarily a
first mode bending (see insert Figure 25). Spectral analysis of the computed wingtip fluctuations
exhibited a dominant peak at St=0.606 or 40.4 Hz which corresponds to the frequency of the first
structural mode.
Spectral analysis of the wingtip acceleration was also carried out for both the experiment
and the computation. Figure 26 displays the experimental [51] spectral analysis which shows
large peaks at the frequencies corresponding to the second and third structural modes with
somewhat smaller peaks at the first and higher modes. The computations showed similar
behaviour albeit with somewhat higher peaks associated with the first structural mode. These
results indicate that most of the energy is in the second and third modes of vibration when vortex
breakdown is over the wing.
24

The reasons for the response of the wing in the second and third structural modes can be
better understood by looking at the spectral analysis of the unsteady pressure fluctuations at an
axial location x/c=0.5, Figure 27. The spectrum is characterized by a broadband frequency range
from St=1.6 to St=3.6 with the maximum amplitude at a frequency St=2.14. These pressure
fluctuations result from the strong interaction of the vortex breakdown with the wing surface and
excite the buffet response of the first three modes of the delta wing. In particular, the
frequencies of the second and third modes lie directly in the broadband frequency range of the
pressure fluctuations giving rise to the additional second and third mode response of the delta
wing.
Gray et al [51] also performed experiments for a full-span delta wing model. The
variation in the rms wingtip acceleration with incidence for the full model was virtually the same
as the half-model with no difference in the rms accelerations of the right and left side. Adoption
of the full model introduces the possibility of exciting antisymmetric modes of vibration. Figure
28 shows the results of the spectral analysis for the full model. In this case the dominant mode is
the second antisymmetric mode with the maximum response again occurring when the vortex
breakdown is over the wing. The dominance of the second antisymmetric mode suggests that the
antisymmetric axial motion of the vortex breakdown location reported by Menke et al [22] for
slender delta wings may also be coupling with the structural motion in this situation.
3.2. Buffeting of wings with low sweep angle
Taylor and Gursul [40] have repeated their experiments for a low sweep wing, Λ=50°.
The variation in the wing tip rms acceleration with angle of attack, Figure 29 is qualitatively
similar to the Λ=60° wing. Buffeting at low levels of incidence is small and similar to the
25

magnitude measured for the 60° sweep wing with the same thickness and span. There is a
moderate increase in the buffeting response up to α ≈ 7°, followed by a significant increase
thereafter. A maximum value of rms acceleration that is slightly lower than the Λ=60° case is
obtained around α=19°. This is followed by a rapid decrease in the vibration of the wingtip for
angles of attack beyond α=21°. This rapid decline in the buffet level is again associated with the
onset of stall.
Taylor and Gursul [40] note that maximum buffeting of the Λ=50° wing occurs prior to
stall in a region where vortex breakdown reaches the apex of the wing. It was pointed out in
Section 2.4, Figure 17, that at an angle of attack α=20° which is in the range where the
maximum buffet is occurring, the largest flow fluctuations are found in the shear layer
reattachment zone. Taylor and Gursul [40] suggest that this unsteadiness associated with the
shear layer reattachment may be an important source of buffeting in this angle of attack range
where vortex breakdown has reached the apex of the wing.
3.3. Aeroelastic instabilities
The previous discussion has focused on the buffeting response of the delta wing due to
the unsteady aerodynamic forces resulting from the vortical flows and vortex breakdown. Delta
wings in general and more specifically low sweep delta wings are also subject to the aeroelastic
instabilities of flutter or limit cycle oscillations (LCO). Doggett and Soistmann [53] investigated
experimentally and analytically the onset of flutter for a range of delta wing sweep angles from
30° to 72°. Their results showed that the flutter speed index decreases with increasing sweep
angle or with an increase in the percentage of the root chord that is clamped.
26

More extensive experimental and analytical investigations of the flutter characteristics of
nonslender delta wings at small angles of attack have been performed by Tang et al [54, 55] and
Attar et al [56-58]. In these investigations a series of aeroelastic models of increasing fidelity in
both the aerodynamics and structures were implemented. In the initial work of Tang et al [54], a
linear vortex lattice model was coupled with a nonlinear von Karman plate model. Attar et al
extended this model by replacing the linear vortex lattice model with a nonlinear vortex lattice
model [56] and by replacing the von Karman model with a high fidelity structural model which
accounts for geometric nonlinearities resulting from large deflections or rotations [58]. These
computations and experiments showed that for the delta wings considered, limit cycle
oscillations (limited amplitude fluctuations) occur after the onset of flutter. It is demonstrated
that the geometric nonlinearity in the structural model is the mechanism for the development of
the limit cycle oscillations for this type of plate like delta wing. Small changes in angle of attack
were shown to have only a limited impact on the flutter speed and frequency [57, 58]. Attar et al
[58] also showed that proper modelling of the geometric nonlinearities for moderate to large
deflections is critical for capturing the correct LCO behaviour.
Gordnier and Melville [59] and Attar and Gordnier [60] have applied an aeroelastic
solver that couples a Navier-Stokes/Euler code with either a von Karman plate model or a high-
fidelity finite element model based on a co-rotational formulation to simulate limit cycle
oscillations of a cropped, Λ=47.8° sweep delta wing. These computations captured the limit
cycle response of the wing observed in the experiments of Schairer and Hand [61]. Structural
nonlinearities were shown to provide the correct nonlinear mechanism for the development of
limit cycle oscillations even in the transonic Mach number range considered in this problem.
Attar and Gordnier [60] also demonstrated the importance of modelling both the fluid and
27
structural problems with high accuracy so that lower fidelity modelling in either discipline does
not cause important physics to be missed resulting in inaccurate solutions to the coupled
fluid/structure system.
4. Lift enhancement on flexible wings
It is seen in the previous section that wing flexibility may couple with vortical flow.
When the flexibility is increased further, it has been found that a nonslender wing with Λ=50°
exhibits lift enhancement [62], which can be regarded as a passive flow control method. This
spectacular enhancement is observed when the wing flexibility reaches a minimum threshold
value. It has been shown that for a wing of thickness, t/c = 0.32% at a Reynolds number, Re =
6.2*105, a region of significant lift enhancement exists in the range of incidences immediately
following the stall. An increase in time-averaged lift coefficient of up to 45%, and a delay in
stall of up to 9° have been observed. Time-averaged drag also increases in this region, resulting
in no noticeable change in lift/drag ratio [63]. Further experiments with various sweep angles
have confirmed that this lift enhancement is always confined to the post-stall region of the rigid
wings [64].
4.1. Effect of wing sweep
Figure 30 shows the variation of lift coefficient for rigid and flexible wings [64] with
sweep angles Λ=40°, 45°, 50°, 55°, and 60°. The wing with Λ=60° can be regarded as a
transition between the slender and nonslender wings. All wings had the same span, but different
chord length (hence different Reynolds numbers, but this is not a factor in the range Re=440,000
– 900,000, as the sensitive range is below 30,000). All the flexible wings had the same thickness
28

(t/s = 0.38%). The parameter λs, the reciprocal of the spanwise bending stiffness of the wing
normalized by the free-stream dynamic pressure, was used to give an indication of the relative
flexibility of the wings, whereby a higher value of λs corresponds to a more flexible wing. The
definition of λs is given by λs=12(1-ν2)ρ∞U∞2s3/Et3, where E is elastic modulus, ν Poisson’s ratio,
s semi-span, and t thickness of the wing. For the conditions in Figure 30, the nondimensional
spanwise bending stiffness was λs = 3.1 for the flexible wings of all sweep angles, compared
with a value of λs = 0.025 for the rigid wings.
Figure 30 shows that the lift enhancement phenomenon is not limited to wings of 50°
leading edge sweep; rather, wing flexibility results in a region of enhanced lift for all wings
except the 60° wing. The magnitude and extent of the lift enhancement region was a function of
sweep angle, with the greatest enhancement being observed over the wing of lowest sweep. The
40° wing improved the maximum lift coefficient by over 40%, and at the point of stall of the
flexible wing, lift coefficient was enhanced by over 50%. As sweep angle was increased the
magnitude of the lift enhancement reduced, with the overall maximum lift coefficient of the 55°
wing increased by just 1%, while the 60° wing experienced an overall reduction in lift. For all
the wings, the nose-down pitching moment measured about the apex underwent a similar
magnitude increase in the lift enhancement region.
Since no lift enhancement was observed for Λ=60°, this feature appears to be limited to
flexible low-sweep wings. A unique feature of the flow structure on nonslender wings is that the
vortex and primary attachment zone are located further outboard from the wing centerline. This
characterstic may be responsible for the increased impact of wing flexibility on the aerodynamic
loading.
29

There is evidence that similar lift enhancement on flexible wings of different shape is
possible for low-aspect ratio wings. Figure 31 shows a MAV with a membrane wing, which
exhibits similar lift enhancement relative to a rigid one [65]. Again, the lift enhancement is
observed in the post-stall region, increasing the maximum lift and delaying the stall. Separated
and vortical flows are common over low-aspect-ratio wings, in particular at low Reynolds
numbers [66]. Tip vortices contribute to lift, and affect the majority of the wing surface [67].
Torres and Mueller [68] present the variation of lift coefficient with angle of attack for flat-plate
wings with an elliptical planform, and show that the AR=1 wing produces monotonically
increasing lift coefficient with incidence, very much like a thin delta wing. Hence, wing
flexibility might be beneficial for a variety of low-aspect ratio wings, not just delta wings.
4.2. Self-excited antisymmetric vibrations
Due to the degree of flexibility employed in these experiments [64], considerable time-
averaged and fluctuating displacements were observed. For the wings of 40°, 50° and 60°
sweep, the variation of mean and peak-to-peak amplitude of wing-tip displacement with
incidence is shown in Figure 32. For the 40° and 50° wings the lift enhancement region was
accompanied by an increase in both the amplitude and, to a lesser extent, mean (time-averaged)
tip deflection. For the 60° wing, which did not experience an increase in lift, no such
discontinuity in the displacement curves was observed. In fact, it is clear that the 60° wing
experiences much less vibrations than the lower sweep wings, although the maximum mean
deflection is greater. Although the wings were designed to have identical values of λs, and
therefore equivalent bending stiffness, the chord lengths of the wings are not equal resulting in a
lower thickness-to-chord ratio for the 60° wing, and this probably accounts for the greater mean
30

deflection for this wing. This result confirms that mean deflection alone does not cause lift
enhancement phenomena. In an earlier experiment [62], a rigid wing model (with 50 degree
sweep angle) was given a spanwise dihedral camber of a form such that its cross-section
approximately corresponded to the time-averaged deformation of the flexible wing during
testing. The results showed that there was no lift enhancement due to static spanwise camber.
All this evidence indicates that vibrations of the leading-edges are essential in delaying stall and
increasing lift.
The fluctuations of the lift force [64] are not much different for the flexible and rigid
wings, indicating that the wing vibrations do not necessarily cause large unsteadiness in lift.
This is not surprising, as the lift enhancement appears to be related to the reattachment process.
This is also important, as it signifies that the lift improvements can be achieved without the
imposing high lift force fluctuations. On the other hand, the fluctuations of the rolling moment
are strongly affected by wing flexibility. Figure 33 shows the variation of root-mean-square
(RMS) of the rolling moment coefficient with incidence for three sweep angles. While there is
virtually zero rolling moment for the rigid wings, for all the wings that experienced a lift
enhancement, a significant increase in RMS rolling moment was observed in the lift
enhancement region for the flexible wing. This is consistent with the initial observations in
Reference 62 in that the wings vibrate in an anti-symmetric mode in the lift-enhancement region.
The resulting unsteady rolling moment has a frequency corresponding to Strouhal number on the
order of unity, which is much higher than the natural frequencies of real aircraft in roll motion.
The dominant frequency of the measured wing tip acceleration, predictions of the natural
frequencies by finite element analysis, and visualization of the wing deformation reveal that
wing vibrations switch to an anti-symmetric structural mode in the lift enhancement region.
31

Simultaneous measurements of both wing tip accelerations were also conducted for a 50° sweep
wing. The spectral characteristics of the wing tip vibrations are summarized in Figure 34, which
shows the variation of cross-spectral amplitude and phase angle between the wing-tip
accelerations as a function of normalized frequency and incidence. Considering first the
variation of cross-spectral amplitude, a dominant peak at St = 0.7 in the lift enhancement region
should be immediately noted. Compared with this peak, other seemingly dominant frequencies
are actually very small; note that the contour scale is logarithmic. Thus, in the region of
enhanced lift, the wing experiences large wing-tip vibrations of a dominant frequency of St =
0.7. Furthermore, the phase map shown in Figure 34 shows that the wing-tip vibrations are out
of phase at this frequency, indicating an anti-symmetric mode shape. Visualization of the
deformation of the leading edge confirmed the mode shape as the second anti-symmetric mode.
The question as to whether or not an anti-symmetric vibration of the wing is a necessary
condition for the production of additional lift is an important one. In order to answer this
question, experiments for a half-wing model were conducted. Figure 35 shows the variation of
wing-tip RMS acceleration with incidence for a half-wing 50° flexible model, and compares this
with the full wing case. It is seen that the half-wing does not exhibit large self-excited vibrations
in the post-stall region. This suggests that anti-symmetric vibration is essential for lift
enhancement.
4.3. Flow reattachment
Self-induced vibrations excite the shear layer by energizing the shed vortices and
promote vortex reformation which is accompanied by the reemergence of the attachment zone.
Figure 36 shows tuft visualizations of the surface flow at α = 27° for the rigid and flexible wings
32

with 50° sweep angle. For the rigid wing, stalled flow is evident and large-scale unsteadiness
was observed in the real-time video footage. For the flexible wing, however, a partially attached
flow is observed. Although the large regions of reversed flow are also observed in this case, the
flow is clearly energized at this incidence. Although flow reversal was still a feature of the flow
towards the leading edges, the flow was much less unsteady.
In addition to the flow visualization with tufts, PIV measurements of the near-surface
flow were undertaken for the rigid 50° wing at α = 27°. Figure 37 shows the streamlines of the
time-averaged flow, calculated from the velocity vectors, which confirms that the flow over the
rigid wing at this high incidence is completely stalled, with maximum velocities near the wing
surface of around u/U∞ = 0.3 in the flow reversal region near the leading edges. The flow
towards the centerline is devoid of the high axial velocities that are associated with shear layer
reattachment. Figure 37 also shows the streamline pattern for the flexible wing at the same
incidence. Contrary to the streamlines over the rigid wing, the flexible wing demonstrates a
symmetrical time-averaged flow. Significant regions of flow reversal are observed over the
wing, with high negative axial velocities peaking at u/U∞ = -0.38. Along the centerline, high
positive axial velocities are observed, peaking at around u/U∞ = 0.67. A node exists on the
centerline at around x/c = 0.2, and all surface streamlines on the wing issue from this node,
indicating that it is a node of attachment.
Figure 37 therefore shows that the flow over the flexible wing is much more coherent
than that over the rigid wing at the same incidence. For the flexible wing, shear layer
reattachment is observed, extending the region of partially attached flow at high incidences. The
main mechanism for lift enhancement is related to the excitation of the shear layer instabilities.
For Λ = 50° wing, the dominant frequency of structural vibration was around St = 0.75, which
33
compares well with the dominant frequencies of the shear layer instabilities [30]. Note that this
range of natural frequencies of shear layer is much lower than those for slender wings [21, 24].
The self-induced vibrations of the wing energize the vortices shed into the shear layer and
promote reattachment to the wing surface, resulting in delayed stall and increased lift. This is
similar to the response of the flow over a backward-facing step to the periodic excitation. It is
well known that, for both laminar and turbulent separation [69], excitation enhances the
formation of vortical structures and substantially reduces reattachment length.
In addition to vibration of a flexible wing (which is a passive method), shear layer
excitation with active control methods may also have substantial effects on the flow. Cipolla and
Rockwell [70] studied the effect of a periodic pitching oscillation on a stalled 45° wing. For
pitching frequencies in the range 0.5 < St < 1.0, the extent of the stall region was decreased
compared to the stationary wing at the same angle of attack (α=30°). For a higher sweep angle,
Gad-el-Hak and Blackwelder [71] studied the effect of periodic tangential blowing along the
leading edge of a 60° delta wing. The results showed that by blowing at a frequency of
approximately half the natural shedding frequency, the cross-flow structure of the primary vortex
could be made to be more organized. Margalit et al [72] investigated the use of oscillatory
blowing along the leading edges of a 60° sweep delta wing. Significantly, lift enhancements of
around 15% were exhibited for forcing frequencies in the range 1.0 < St < 4.0. Further, these lift
enhancements were observed in the post-stall region between α = 35 and 40°. The effect of
shear layer excitation for slender wings [73, 74] is not clear. Recent PIV measurements
involving oscillatory forcing of a 70° wing have shown that forcing of the shear layer in the
region upstream of breakdown had no beneficial effect on the vortex structure, and only served
to alter the trajectory of the primary vortex. However, experiments using periodic blowing have
34

demonstrated lift enhancement over a 70° wing in the range 34° < α < 40° for a forcing
frequency of St = 1.75.
Returning to the shear layer reattachment for flexible delta wings, in the experiments
reported in [62] and [64], there was no evidence of streamwise flow forming within the
reattached region. Figure 38 shows the results of LDV measurements of the chordwise velocity
field in the cross-flow plane at x/c = 0.4 for the (a) rigid and (b) flexible 50° wings at α = 25°.
For the rigid wing, the flow is much more symmetric and coherent than suggested by the PIV
measurements presented earlier for α = 27°. The data show a large region of reversed flow
extending well above the surface of the wing, but a region of high axial velocity remains along
the centerline, albeit at a considerable distance from the wing surface. The chordwise velocity
field over the flexible wing shares many similarities with that of the rigid wing. Again, a region
of reversed flow extending well above the wing surface is evident along with a region of high
axial velocity above the surface near the centerline. However, the region of flow reversal is
reduced in extent and appears flatter than for the rigid wing, while the region of high axial
velocity above the centre-line is larger and extends closer to the wing surface. In general, the
flexible wing exhibits much higher axial velocities towards the wing surface than the rigid wing
does.
With increasing flexibility, there is evidence of a change in the structure of the flow and
streamwise flow develops within the reattached region. The water tunnel experiments [75] show
that, for large values of λs, the leading-edge vortex re-forms and vortex breakdown occurs very
close to the apex, as seen in the flow visualization pictures in Figure 39. This is somewhat
unexpected in that the flexibility not only promotes earlier reattachment but also helps re-
formation of the leading-edge vortices. Corresponding vorticity distributions in a cross-flow
35
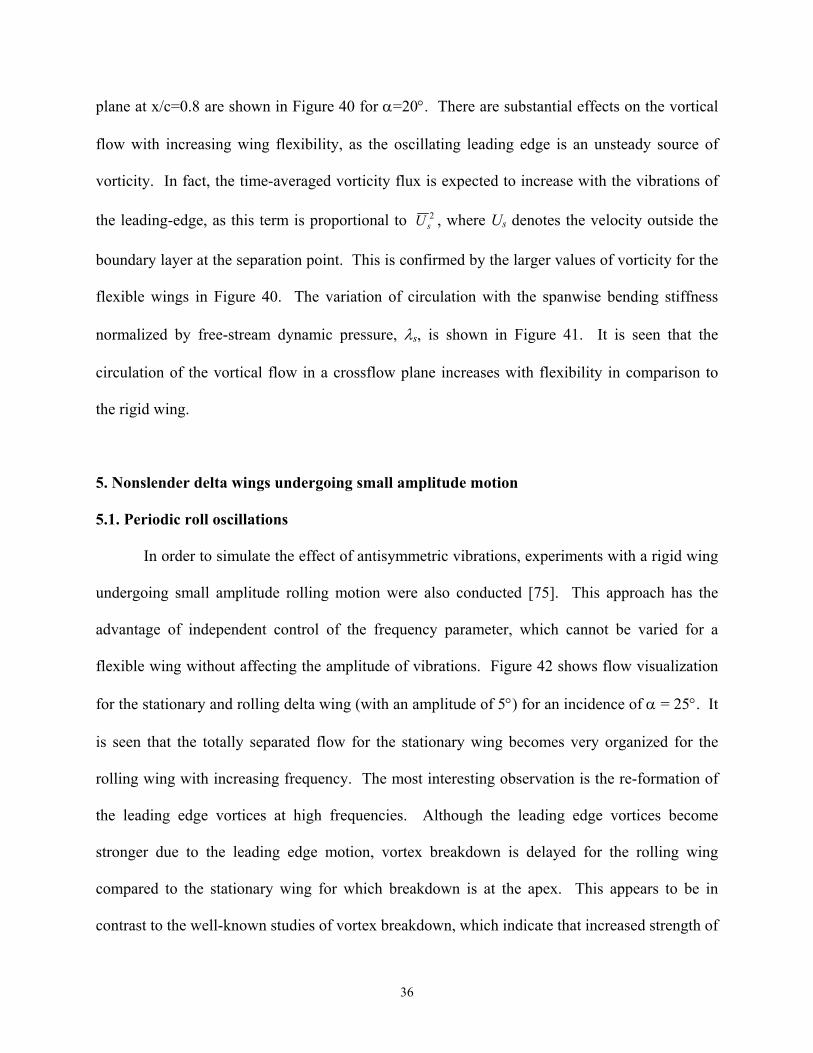
plane at x/c=0.8 are shown in Figure 40 for α=20°. There are substantial effects on the vortical
flow with increasing wing flexibility, as the oscillating leading edge is an unsteady source of
vorticity. In fact, the time-averaged vorticity flux is expected to increase with the vibrations of
the leading-edge, as this term is proportional to 2 sU , where Us denotes the velocity outside the
boundary layer at the separation point. This is confirmed by the larger values of vorticity for the
flexible wings in Figure 40. The variation of circulation with the spanwise bending stiffness
normalized by free-stream dynamic pressure, λs, is shown in Figure 41. It is seen that the
circulation of the vortical flow in a crossflow plane increases with flexibility in comparison to
the rigid wing.
5. Nonslender delta wings undergoing small amplitude motion
5.1. Periodic roll oscillations
In order to simulate the effect of antisymmetric vibrations, experiments with a rigid wing
undergoing small amplitude rolling motion were also conducted [75]. This approach has the
advantage of independent control of the frequency parameter, which cannot be varied for a
flexible wing without affecting the amplitude of vibrations. Figure 42 shows flow visualization
for the stationary and rolling delta wing (with an amplitude of 5°) for an incidence of α = 25°. It
is seen that the totally separated flow for the stationary wing becomes very organized for the
rolling wing with increasing frequency. The most interesting observation is the re-formation of
the leading edge vortices at high frequencies. Although the leading edge vortices become
stronger due to the leading edge motion, vortex breakdown is delayed for the rolling wing
compared to the stationary wing for which breakdown is at the apex. This appears to be in
contrast to the well-known studies of vortex breakdown, which indicate that increased strength of
36

vortices should cause premature, rather than delayed, breakdown. This result suggests that
streamwise pressure gradient might be modified favorably due to the wing motion.
Figure 43 shows the variation of mean breakdown location as a function of dimensionless
frequency for different angles of attack in the range α = 20° to 30° in the post-stall region. It is
seen that, for each incidence in the post-stall region, the breakdown location is zero for the
stationary wing (fc/U∞ = 0). Maximum delay of the vortex breakdown location is achieved in
the range of fc/U∞ = 1 to 2. Again, this range compares well with the dominant frequencies of
the shear layer instabilities [30] for a nonslender wing of Λ = 50°. It was shown in Reference
[75] for α = 25° that, even for a small amplitude of 1°, it is possible to have re-established
leading edge vortices. The optimum dimensionless frequency is also in the same range.
In the case of the rigid wing undergoing small amplitude rolling motion, the
dimensionless frequency fc/U∞ is not only a ratio of time scales of convective time and rolling
motion, but also the ratio of the leading edge velocity and freestream velocity for a given wing.
Figure 43 suggests that increasing velocity of leading edge (with increasing frequency
parameter) does not necessarily delay breakdown location. However, it is expected that the time-
averaged vorticity flux will increase with increasing velocity of the leading edge. This is
confirmed by the vorticity distributions in a cross-flow plane at x/c = 0.80 as shown in Figure 44
for α = 25°. Note that the results shown in this figure are phase-averaged over 30 cycles, and
correspond to zero roll angle as the roll angle changes the sign from negative to positive. This is
the reason for the slight asymmetry, which is the result of the well-known hysteresis effect. It is
seen that larger values of vorticity exist with increasing frequency. The variation of circulation
with the dimensionless frequency is shown in Figure 45. It is seen that the circulation of the
vortical flow in a crossflow plane increases with frequency in comparison to the stationary wing.
37
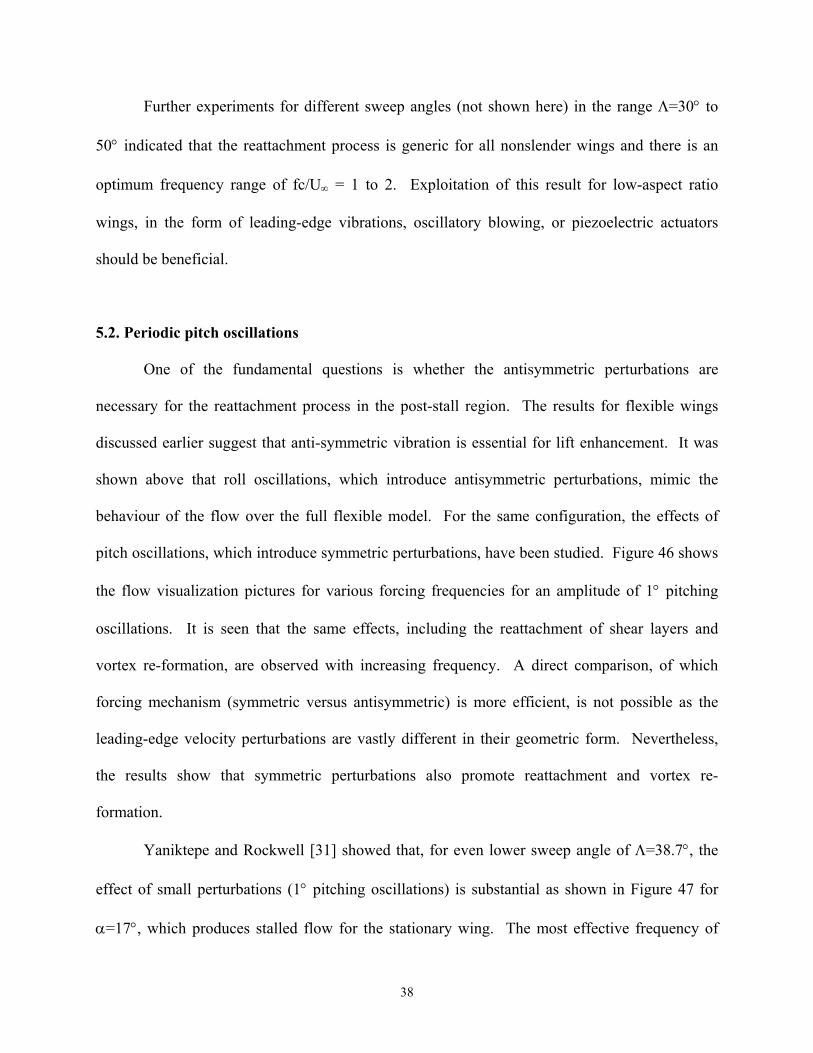
Further experiments for different sweep angles (not shown here) in the range Λ=30° to
50° indicated that the reattachment process is generic for all nonslender wings and there is an
optimum frequency range of fc/U∞ = 1 to 2. Exploitation of this result for low-aspect ratio
wings, in the form of leading-edge vibrations, oscillatory blowing, or piezoelectric actuators
should be beneficial.
5.2. Periodic pitch oscillations
One of the fundamental questions is whether the antisymmetric perturbations are
necessary for the reattachment process in the post-stall region. The results for flexible wings
discussed earlier suggest that anti-symmetric vibration is essential for lift enhancement. It was
shown above that roll oscillations, which introduce antisymmetric perturbations, mimic the
behaviour of the flow over the full flexible model. For the same configuration, the effects of
pitch oscillations, which introduce symmetric perturbations, have been studied. Figure 46 shows
the flow visualization pictures for various forcing frequencies for an amplitude of 1° pitching
oscillations. It is seen that the same effects, including the reattachment of shear layers and
vortex re-formation, are observed with increasing frequency. A direct comparison, of which
forcing mechanism (symmetric versus antisymmetric) is more efficient, is not possible as the
leading-edge velocity perturbations are vastly different in their geometric form. Nevertheless,
the results show that symmetric perturbations also promote reattachment and vortex re-
formation.
Yaniktepe and Rockwell [31] showed that, for even lower sweep angle of Λ=38.7°, the
effect of small perturbations (1° pitching oscillations) is substantial as shown in Figure 47 for
α=17°, which produces stalled flow for the stationary wing. The most effective frequency of
38

excitation (T=0.5) corresponded to the subharmonic of the broadband fluctuations in the region
of the shear layer closest to the leading-edge in this case. The optimum period T=0.5, which
corresponded to fc/U∞=2.06, was also the smallest period of oscillations tested in these
experiments. It is seen that forcing at this frequency produces a flow pattern characteristic of a
typical leading-edge vortex.
For the same wing at a smaller angle of α=10°, the vortex breakdown is over the wing
[36]. In this case, periodic pitching perturbations actually cause vortex breakdown to move
upstream. However, it is still evident that the excitation causes earlier reattachment, as can be
seen from the reattachment line moving outboard in the time-averaged streamline pattern near
the wing surface.
6. Large amplitude maneuver of nonslender delta wings
Although there are a large number of studies on unsteady aerodynamics of maneuvering
slender delta wings [24], very little is known about unsteady aerodynamics of nonslender wings.
Recently, Cummings et al [76] conducted computational simulations and wind tunnel
experiments for a pitching UCAV model. This configuration (Boeing 1301 UCAV, with Λ=50°)
has a leading-edge vortex developing at α = 10°, in spite of the use of a rounded leading-edge. It
was reported that the pitching characteristics are somewhat unusual in that the dynamic lift was
actually much larger than that of the static case even for small incidences around zero angle of
attack. This is in contrast with the results of slender delta wings [77, 78] for which increased
dynamic lift is only observed in the post-stall region and there is virtually no difference between
the static and dynamic cases up to the post-stall region. (The variation of dynamic lift is similar
for slender delta wings and two-dimensional airfoils, although the flow physics are entirely
39

different). This difference for the nonslender UCAV was attributed to the leading-edge vortex in
the dynamic case being stronger than the static case. Further studies are needed to shed light on
this issue.
While the unsteady aerodynamics of rolling slender wings have been studied extensively
(see, for example, [79]), there are not many studies on rolling nonslender wings. Previous
studies on slender wings for static and forced rolling motions have revealed the existence of
critical states [79] and the importance of vortex breakdown location [80, 81]. As the flow
becomes asymmetrical, the strength of the vortex for each half of the wing is different as the
effective sweep angle and incidence varies with the instantaneous roll angle. Experiments
conducted for statically and dynamically rolled wings [82] show that the response of the vortical
flow strongly depends on the angle of attack. For a wing with 50° leading edge sweep and at
angle of attack α = 15°, vortex breakdown was present over the wing at zero roll angle.
However, its variation was little affected at static or dynamic roll angles, as seen in Figure 48.
This insensitivity to roll angle is remarkable, and very much in contrast with slender wing
vortices [83]. Vortex breakdown is highly sensitive to the variations in roll angle for slender
delta wings.
The most drastic effects of roll angle occur around the stall angle. For α = 20°, Figure 49
shows that vortex breakdown is at the apex of the wing at zero roll angle, but a coherent vortex is
formed and breakdown is observed over the wing for large roll angles. Hence, partially attached
flow on one side and completely stalled flow on the other side are simultaneously possible. In
the dynamic case, even for small dimensionless frequencies, there were coherent leading-edge
vortices on both sides of the wing throughout the whole cycle, rather than partially or completely
stalled flow as in the static case. However, the variation of breakdown location over a cycle was
40

much smaller. When the dimensionless frequency of the rolling motion was substantially
increased, the amplitude of cyclic variations in breakdown location decreased. In addition,
hysteresis increased with increasing frequency, and was most noticeable at zero roll angle.
In Figure 50, vorticity in a crossflow plane at 80% of the chord length and at α = 20° at
three instants over a cycle is presented for the quasi-static and dynamic cases (fc/U∞ = 0.15). In
this part of the cycle, the counter-clockwise vortex is much stronger for the dynamic case than
for the static case. There is also evidence of multiple vortices of the same sign of vorticity at
high roll angles in the dynamic case. Circulation of the vortices calculated as a line integral of
velocity using PIV data is shown in Figure 51 for the countrer-clockwise vortex. It is seen that
there is a large hysteresis loop and also the average circulation is higher in the dynamic case. The
largest differences from the static case are observed for increasing roll angles. The increase in
the time-averaged circulation is due to the increase in the time-averaged vorticity flux, which is a
result of the oscillations of the leading edge. Comparison of Figures 49 and 51 shows that the
variations in the breakdown locations are related to the variations in circulation, although the
variations in the latter are relatively larger in the dynamic case. For increasing roll angles, the
counter-clockwise vortex is stronger than for decreasing roll angles, which results in the vortex
breakdown being closer to the apex for increasing roll angles.
7. Free-to-roll nonslender wings
7.1. Equilibrium positions at nonzero roll angles
Jenkins et al [79] showed that a delta wing configuration with 65-degree sweep angle had
multiple stable trim points in roll. In the free-to-roll experiments, the model is released from an
initial roll angle, and then is free to roll. In Figure 52, phase plane (roll rate versus roll angle)
41
trajectories, corresponding to two free-to-roll time histories for the 65 degree wing at α=30°, are
shown. For the initial roll angle φ0=-58.3, the trajectory finds the stable equilibrium point at zero
roll angle, while for φ0=53.1, the final equilibrium position is around φ=21 degrees. The
existence of equilibrium positions at nonzero roll angles was also confirmed at other angles of
attack for this slender delta wing configuration. The measured static rolling moment is around
zero at these nonzero trim angles, and it is believed that asymmetric vortex breakdown is behind
this behaviour.
Recent experiments [48, 84] for a free-to-roll nonslender delta wing with 50° sweep angle
showed that multiple trim positions are possible. Only nonzero roll angles, or a combination of
zero and nonzero roll angles, are possible, depending on the angle of attack. At angles of attack
for which vortex breakdown was over the wing, several equilibrium positions at nonzero roll
angles were found, depending on the initial roll angle. Figure 53 shows the time history of roll
angle for the free-to-roll wing (Λ=50°) for α=15° for the initial roll angle φ0=0° (top) and φ0=45°
(bottom). It is seen that, after the wing is released, new equilibrium roll angles are established (φ
≈ 25° and φ ≈ 35°), depending on the initial roll angle. Negative equilibrium roll angles (mirror
images) are also possible depending on the initial roll angle. It was interesting that zero roll
angle was not an equilibrium position for this angle of attack. The existence of multiple roll
“attractors” is somewhat similar to the observations for a slender wing (Λ=65°) [79]; however,
the main difference is that the zero roll angle is not an attractor for the nonslender wing for pre-
stall incidences. The flow physics behind this observation that zero roll angle is not a stable
position is not clear, but is believed to be associated with reattachment, rather than vortex
breakdown.
42

Around the stall angle for the nonslender wing with rounded leading-edges [48, 84],
simultaneous existence of zero and nonzero trim angles was observed, as shown by two
examples in Figure 54 by varying the initial roll angle. For small initial roll angles, the model
reaches equilibrium around zero roll angle. For larger initial roll angles, a nonzero trim angle is
observed. Just after the stall angle, there is only one trim position at zero roll angle, regardless of
the initial roll angle, as shown in Figure 55 for α=35°. It is interesting that, when there is no
flow reattachment, the only trim position is zero roll angle. This is consistent with the suspected
role of reattachment in the existence of nonzero trim angles for smaller angles of attack. Another
observation is that vortex or shear layer interactions such as vortex shedding do not induce self-
excited roll oscillations, at least in this case.
7.2. Self-excited roll oscillations
Around the stall angle, self-excited roll oscillations (wing rock) [48, 84] are observed as
shown in Figure 56 for a sweep angle of Λ=50°. These oscillations are unusual because not only
are they observed for a nonslender wing, but also because the mean roll angle is nonzero.
Somewhat similar oscillations were observed for an even lower sweep angle in a different
facility [85, 86, 87], as shown in Figure 57 for a sweep angle of Λ=45°. Wing rock has more
typically been observed for slender wings with Λ>75° [88] with corresponding mean roll angle
of zero. Self-excited roll oscillations of nonslender wings with Λ ≤ 50° appear to be more
complex in their aerodynamic origins than slender wing rock. Similarities to and differences
from slender wing rock are discussed in References [89, 90].
In Figure 56, the self-excited roll oscillations are demonstrated for a wing with rounded
leading-edges. The self-excited roll oscillations are also observed for a sharp leading-edge, but
43
are much smaller as shown in Figure 58. Hence, even when the separation point is fixed for the
sharp leading-edge, these oscillations occur. As the amplitude of the motion is amplified for a
round leading-edge, characteristics of flow separation at the leading-edge are a contributing
factor. In both cases, these oscillations are observed around the stall angle, where the
reattachment of asymmetric flows is the most important factor. These initial experiments and
the related ongoing work on nonslender wings suggest that the main cause of these self-excited
oscillations is the separated and vortical flows, which can be very different from those for
slender wings, as discussed earlier. In particular, the flow reattachment is suspected to play an
important role in the unsteady aerodynamics. In Reference [48], tuft visualizations of surface
flow pattern during the self-excited roll motion are presented. For the maximum roll angle, even
the secondary separation line outboard of the reattachment line is visible, exhibiting classical
signatures of the leading-edge vortex on that side. Therefore, reattachment, hysteresis and large
phase lags associated with vortical and separated flows as well as unsteady separation at the
leading-edge might be contributing factors to the observed self-induced roll oscillations. It
should be noted that knowledge of unsteady flows is limited to slender wings [4, 24] and there is
a need to understand unsteady flows over nonslender wings.
It is also interesting that these self-induced oscillations are observed over a small range of
incidence. For a sweep angle of Λ=50°, the mean roll angle and the amplitude of roll oscillations
are shown as a function of incidence in Figure 59 for a wing with rounded leading-edge and 10%
thickness, and a wing with sharp leading-edge and 1.5% thickness. Prior to stall, the mean roll
angle is nonzero and there are virtually no roll oscillations. In a critical and small range of
incidence, the roll oscillations become large. With further increase in incidence, the mean roll
angle becomes zero and the roll oscillations diminish. Comparison with the lift curves shown in
44

Figure 22 indicates that these self-excited roll oscillations occur around the stall angle. Note that
stall occurs earlier for the sharp-edged wing.
8. Conclusions
Flow separation and formation of vortical flow occur at very low angles of attack for
nonslender delta wings. Complete roll-up into a concentrated vortex does not take place at low
angles of attack, and a broad wake-like flow is observed. As the vortical flow forms close to the
wing surface, interactions with boundary layer vorticity may result in a dual vortex structure. As
the angle of attack is increased, the primary vortex gets stronger while moving away from the
surface. The vortex structure then resembles more that of slender wings, with significant axial
flow in the core. Strong Reynolds number effects are observed, in particular for low angles of
attack. Also, the effect of low Reynolds number may result in wake-like flow in the core,
whereas jet-like flow is typical at higher Reynolds numbers.
Formation of shear layer instabilities in the separated flow from the leading-edge, and
their interaction with the secondary flow with vorticity of the opposite sign have close
similarities to those for slender wings. Vortex breakdown and transition from a jet-like to a
wake-like flow at high angles of attack are much less abrupt for nonslender wings, with the core
expanding in a gradual and conical fashion. For very low Reynolds number, even upstream flow
may be wake-like and therefore it is difficult to define vortex breakdown based solely on the
velocity field.
One of the distinct features of nonslender wings is that the primary attachment line occurs
on the surface outboard of the symmetry plane, even when vortex breakdown is near the apex.
The primary attachment line moves inboard with increasing angle of attack, and ultimately
45
reaches the centreline when the wing stalls. Leading-edge shape affects not only the flow
separation characteristics, but also the attachment location. Compared to sharp leading-edges,
the attachment line is more outboard for any given angle of attack for rounded leading-edges and
there is a delay in stall. Compared with slender wings, nonslender delta wings have lower
maximum lift coefficient and also lower stall angle. As the vortex lift contribution becomes a
smaller proportion of the total lift with decreasing sweep angle, there is no obvious correlation
between the onset of vortex breakdown and the change of the lift coefficient.
Flow/structure interactions occur when the frequency of the quasi-periodic oscillations in
the vortex breakdown wake is close to the frequencies of the structural modes of the wing.
Antisymmetric modes are dominant for full wings, indicating possible coupling of vortex/vortex
interactions with the structural motion. At high angles of attack before the stall, the shear layer
reattachment becomes an important source of buffeting. With increasing wing flexibility,
substantial lift increase in the post-stall region is observed, which appears to be a feature of
nonslender wings only. Self-excited antisymmetric vibrations of the wing promote reattachment
of the shear layer, which results in the lift enhancement. These self-excited vibrations are not
observed for a half-model. With increasing wing flexibility, streamwise flow develops within the
reattachment region. Nonslender delta wings undergoing small amplitude roll or pitch
oscillations exhibit many similarities with flexible wings. Totally separated flow over a rigid
wing in the post-stall region becomes reattached and even the re-formation of the leading-edge
vortex is observed with wing oscillations. There is an optimum range of frequencies in the range
of St=1 to 2.
Experiments simulating large amplitude roll maneuvers of nonslender wings revealed that
the response of the vortical flow strongly depends on the angle of attack, with the most drastic
46

effects being observed near the stall angle. Free-to-roll nonslender delta wings may have
multiple trim positions at nonzero roll angles. Self-excited roll oscillations whose mean roll
angle is nonzero are possible in a range of angles of attack, and their amplitude depends on the
leading-edge shape. Both unsteady separation and reattachment might be important in the
development of the self-induced roll oscillations, because these oscillations are also observed for
sharp leading-edges for which the separation lines are fixed.
Acknowledgements
The authors acknowledge the financial support of the Air Force Office of Scientific Research
(AFOSR). The first author is particularly indebted to his colleagues, Dr. G. Taylor and Dr. Z.
Wang, for valuable discussions.
47

REFERENCES
1. Gursul, I., “Vortex Flows on UAVs: Issues and Challenges”, The Aeronautical Journal, vol.
108, No. 1090, December 2004, pp. 597-610.
2. Workshop on Aerodynamic Issues of Unmanned Air Vehicles, 4-5 November 2002, University
of Bath, UK.
3. Rockwell, D., “Three-Dimensional Flow Structure on Delta Wings at High Angle-of-Attack:
Experimental Concepts and Issues”, AIAA 93-0050, 31st AIAA Aerospace Sciences Meeting &
Exhibit, 11-14 January 1993, Reno, NV.
4. Visbal, M. R., “Computational and Physical Aspects of Vortex Breakdown on Delta Wings”,
AIAA 95-0585, 33rd AIAA Aerospace Sciences Meeting & Exhibit, 9-12 January 1995, Reno,
NV.
5. Delery, J. M., “Aspects of Vortex Breakdown”, Progress in Aerospace Sciences, Vol. 30, pp.
1-59, 1994.
6. Délery, J. M., “Physics of Vortical Flows”, J. Aircraft, Vol.29. No. 5, pp. 856-876, 1992.
7. Gursul, I., “Recent Developments in Delta Wing Aerodynamics”, The Aeronautical Journal,
September 2004, pp. 437-452.
48

8. Earnshaw, P. B. and Lawford, J. A., “Low-Speed Wind-Tunnel Experiments on a Series of
Sharp-Edged Delta Wings”, ARC Reports and Memoranda No. 3424, March 1964.
9. Wentz, W.H. and Kohlman, D.L., “Vortex Breakdown on Slender Sharp-Edged Wings”,
Journal of Aircraft, vol. 8, no. 3, March 1971, pp. 156-161.
10. Miau, J.J., Kuo, K.T., Liu, W.H., Hsieh, S.J., Chou, J.H., and Lin, C.K., “Flow
Developments Above 50-Deg Sweep Delta Wings with Different Leading-Edge Profiles”,
Journal of Aircraft, vol. 32, no. 4, July-August 1995, pp. 787-794.
11. Ol, M. V. and Gharib, M., “Leading-Edge Vortex Structure of Nonslender Delta Wings at
Low Reynolds Number”, AIAA Journal, Vol. 41, No. 1, January 2003, pp. 16-26.
12. Ol, M. V., “An Experimental Investigation of Leading Edge Vortices and Passage to Stall of
Nonslender Delta Wings,” Symposium on Advanced Flow Management, RTO AVT-072, May
2001, Paper 2.
13. Ol, M. V., and Gharib, M., “The Passage Toward Stall of Nonslender Delta Wings at Low
Reynolds Number,” AIAA Paper 2001-2843, 31st AIAA Fluid Dynamics Conference and
Exhibit, 11-14 June 2001, Anaheim, CA.
49
14. Gursul, I., Taylor, G., and Wooding, C., “Vortex Flows over Fixed-Wing Micro Air
Vehicles”, AIAA 2002-0698, 40th AIAA Aerospace Sciences Meeting & Exhibit, 14-17 January
2002, Reno, NV.
15. Taylor, G.S., Schnorbus, T., and Gursul, I., “An Investigation of Vortex Flows over Low
Sweep Delta Wings”, AIAA-2003-4021, AIAA Fluid Dynamics Conference, 23-26 June,
Orlando, FL.
16. Gordnier, R. E. and Visbal, M. R., “Higher-Order Compact Difference Scheme Applied to
the Simulation of a Low Sweep Delta Wing Flow”, AIAA 2003-0620, 41st AIAA Aerospace
Sciences Meeting and Exhibit, 6-9 January 2003, Reno, NV.
17. Erickson, G. E., “Water Tunnel Studies of Leading Edge Vortices”, Journal of Aircraft, Vol.
19, No. 6, pp. 442-448, 1982.
18. Menke, M. and Gursul, I., “Unsteady Nature of Leading Edge Vortices”, Physics of Fluids,
Vol. 9, No. 10, 1997, pp. 2960-2966.
19. Gursul, I., “Unsteady Flow Phenomena over Delta Wings at High Angle-of-Attack”, AIAA
Journal, Vol. 32, No. 2, 1994, pp. 225-231.
20. Gursul, I. and Xie, W., “Buffeting Flows over Delta Wings”, AIAA Journal, Vol. 37, No. 1,
1999, pp. 58-65.
50

21. Gordnier, R.E. and Visbal, M.R. “Unsteady vortex structure over a delta wing”, Journal of
Aircraft, vol. 31, no. 1, 1994, pp. 243-248.
22. Menke, M., Yang, H. and Gursul, I., "Experiments on the Unsteady Nature of Vortex
Breakdown over Delta Wings", Experiments in Fluids, vol. 27, 1999, pp. 262-272.
23. Redinoitis, O. K., Stapountzis, H., and Telionis, D. P., “Periodic Vortex Shedding over Delta
Wings”, AIAA Journal, Vol. 31, No. 9, 1993, pp. 1555-1561.
24. Gursul, I., “Review of Unsteady Vortex Flows over Slender Delta Wings”, Journal of
Aircraft, vol. 42, no. 2, March-April 2005, pp. 299-319.
25. Traub, L.W., “Extending Slender Wing Theory to Not So Slender Wings”, Journal of
Aircraft, vol. 40, no. 2, 2003, pp. 399-402.
26. Polhamus, E.C., “Predictions of Vortex-Lift Characteristics by a Leading-Edge Suction
Analogy”, Journal of Aircraft, vol. 8, no. 4, April, 1971, pp. 193-199.
27. Lee, M. and Ho, C.,‘Lift force of delta wings’, App. Mech. Rev., Vol. 43, No. 9, pp. 209-221,
1990.
51
28. Bartlett, G.E. and Vidal, R.J., “Experimental Investigation of Influence of Edge Shape on the
Aerodynamic Characteristics of Low Aspect Ratio Wings at Low Speeds”, Journal of The
Aeronautical Sciences, vol. 22, no. 8, August 1955, pp. 517-533.
29. Huang, X.Z., Mebarki, Y., Benmeddour, A., and Brown ,T., “Experimental and Numarical
Studies of Geometry Effects on UCAV’s Aerodynamics”, AIAA-2004-0403.
30. Taylor, G. and Gursul, I., “Buffeting Flows over a Low Sweep Delta Wing”, AIAA Journal,
vol. 42, no. 9, September 2004, pp. 1737-1745.
31. Yaniktepe, B. and Rockwell, D., “Flow Structure on a Delta Wing of Low Sweep Angle”,
AIAA Journal, vol. 42, no. 3, March 2004, pp. 513-523.
32. Gordnier, R. E. and Visbal, M. R., “Instabilities in the Shear Layer of Delta Wings”, AIAA-
95-2281, 26th Fluid dynamics Conference, June, 1995, San Diego, CA.
33. Visbal, M. R. and Gordnier, R. E., “Origin of the Computed Unsteadiness in the Shear Layer
of Delta Wings”, Journal of Aircraft, vol. 32, no. 5, 1995, pp. 1146-1148.
34. Visbal, M. R. and Gordnier, R. E., “On the structure of the shear Layer emanating from a
Swept Leading Edge at Angle of Attack”, AIAA-2003-4016, 33rd Fluid Dynamics Conference
and Exhibit, June, 2003, Orlando, FL.
52
35. Gad-el-Hak, M. and Blackwelder, R. F., “The Discrete Vortices from a Delta Wing”, Vol.
23, No. 6, June, 1985, pp. 961-962.
36. Yavuz, M. M., Elkhoury, M., and Rockwell, D., “Near-Surface Topology and Flow Structure
on a Delta Wing”, AIAA Journal, Vol. 42, No. 2, pp. 332-340, 2004.
37. Lambourne, N. C. and Bryer, D. W., “The Bursting of Leading-edge Vortices – Some
Observations and Discussion of the Phenomenon”, ARC Reports & Memoranda No. 3282, April,
1961.
38. Visbal, M. R., “Computed Unsteady Structure of Spiral Vortex Breakdown on Delta
Wings”, AIAA-1996-2074, 27th AIAA Fluid Dynamics Conference, June, 1996, New Orleans,
LA.
39. Lowson, M. V., “Some Experiments with Vortex Breakdown”, Journal of the Royal
Aeronautical Society, Vol. 68, May, 1964.
40. Taylor, G. S. and Gursul, I., “Unsteady Vortex Flows and Buffeting of a Low Sweep Delta
Wing”, AIAA-2004-1066, 42nd AIAA Aerospace Sciences Meeting & Exhibit, 5-9 January
2004, Reno, NV.
41. Brown, G. and Lopez, J., “Axisymmetric Vortex Breakdown, part 2. Physical mechanisms”,
Journal of Fluid Mechanics, Vol. 221, 1990, pp. 553-576.
53

42. Honkan, A. and Andreopoulos, J., “Instantaneous Three-Dimensional Vorticity
Measurements in Vortical Flow over a Delta Wing”, AIAA Journal, Vol. 35, No. 10, October
1997, pp. 1612-1620.
43. Lynn, R.J., Gib, J. and Shires, A., “Buffet Tests on a 40 Degree Diamond Wing Planform –
Model M2391”, DERA Report, DERA/MSS4/TR980309/1.0, August 1998.
44. Woods, M.I., “An Investigation of Buffet over Low-Observable Planforms”, PhD Thesis,
University of Bath, 1999.
45. Woods, M.I. and Wood, N.J., “Aerodynamic Characteristics of Lambda Wings”, The
Aeronautical Journal, April 2000, pp. 165-174.
46. Moore, D.W. and Pullin, D.I., “Inviscid Separated Flow over a Non-slender Delta Wing”,
Journal of Fluid Mechanics, vol. 305, 1995, pp. 307-345.
47. Elkhoury, M. and Rockwell, D., “Visualized Vortices on Unmanned Combat Air Vehicle
Planform: Effect of Reynolds Number”, Journal of Aircraft, vol. 41, no. 5, 2004, pp. 1244-1247.
48. McClain, A., “Aerodynamics of Nonslender Delta Wings”, MPhil Thesis, University of Bath,
Department of Mechanical Engineering, March 2004.
54
49. Kawazoe, H., Nakamura, Y., Ono, T., and Ushimaru, Y., “Static and Total Pressure
Distributions around a Thick Delta Wing with Rounded Leading-Edge”, AIAA-94-2321, 25th
AIAA Plasmadynamics and Lasers Confernce, June 20-23, 1994, Colorado Springs, CO.
50. Kegelman, J.T. and Roos, F.W., “Effects of Leading-Edge Shape and Vortex Burst on the
Flowfield of a 70° Sweep Delta Wing”, AIAA Paper No. 89-0086, AIAA 27th Aerospace
Sciences Meeting, Reno, NV, January 1989.
51. Gray, J., Gursul, I. and Butler, R., 2003, “Aeroelastic Response of a Flexible Delta Wing Due
to Unsteady Vortex Flows”, AIAA-2003-1106, 41st Aerospace Sciences Meeting and Exhibit, 6-
9 January, Reno, NV.
52. Gordnier, R.E. and Visbal, M.R., “Computation of the Aeroelastic Response of a Flexible
Delta Wing at High Angles of Attack”, AIAA-2003-1728.
53. Doggett, R. V. and Soistmann, D. L., “Some Low-Speed Flutter Characteristics of Simple
Low-Aspect-Ratio Delta Wing Models”, NASA TM 101547, January, 1989.
54. Tang, D., Henry, J. K., and Dowell, E. H., “Limit Cycle Oscillations of Delta Wing Models
in Low Subsonic Flow”, AIAA Journal, Vol. 37, No. 11, November, 1999.
55. Tang, D. and Dowell, E. H., “Effects of Angle of Attack on Nonlinear Flutter of a Delta
Wing”, AIAA Journal, vol. 39, No. 1, January , 2001.
55

56. Attar, P. J., Dowell, E. H. and Tang, D., “A theoretical and experimental investigation of the
effects of a steady angle of attack on the nonlinear flutter of a delta wing plate model”, Journal
of Fluids and Structures, vol. 17, 2003, pp. 243-259.
57. Attar, P. J., Dowell, E. H. and Tang, D., “Modeling Aerodynamic Nonlinearities for two
Aeroelastic Configurations: Delta Wing and Flapping Flag”, 44th
AIAA/ASME/ASCE/AHS/ASC Structures, Structural Dynamics and Materials Conference,
April, 2003, Norfolk, VA.
58. Attar, P. J., Dowell, E. H. and White, J. R., “Modeling the LCO of a Delta Wing Using a
High Fidelity Structural Model”, AIAA-2004-1692, 45th AIAA/ASME/ASCE/AHS/ASC
Structures, Structural Dynamics and Materials Conference, April, 2004, Palm Springs CA.
59. Gordnier, R.E. and Melville, R., “Numerical Simulation of Limit-Cycle Oscillations of a
Cropped Delta Wing Using the Full Navier-Stokes Equations”, International Journal of
Computational Fluid Dynamics, vol. 14, no. 3, 2001, pp. 211-222.
60. Attar, P. J. and Gordnier, R. E., “Aeroelastic Prediction of the Limit Cycle Oscillations of a
Cropped Delta Wing”, AIAA-2005-1915, 46th AIAA/ASME/ASCE/AHS/ASC Structures,
Structural Dynamics and Materials Conference, April, 2005, Austin, TX.
56

61. Schairer, E. T. and Hand, L. A., “Measurements of Unsteady Aeroelastic Model Deformation
by Stereo Photogrammetry”, AIAA-1997-2217, 15th Applied Aerodynamics Conference, June,
1997, Atlanta, GA.
62. Taylor, G. S. and Gursul I, ‘Lift Enhancement over a Flexible Low Sweep Delta Wing,
AIAA-2004-2618 2nd AIAA Flow Control Conference, 27 June – 1 July 2004, Portland, OR.
63. Gursul, I., Vardaki, E. and Taylor, G., “Flow Control with Wing Flexibility”, 1st Europen
Forum on Flow Control, October 11-14, 2004, Poitiers, France.
64. Taylor, G.S., Kroker, A. and Gursul, I., “Passive Flow Control over Flexible Nonslender
Delta Wings”, AIAA-2005-0865, 43rd Aerospace Sciences Meeting and Exhibit, 10-13 January
2005, Reno, NV.
65. Lian, Y., Shyy, W., Viieru, D., and Zhang, B., “Membrane Wing Aerodynamics for Micro
Air Vehicles”, Progress in Aerospace Sciences, vol. 39, no. 6-7, 2003, pp. 425-465.
66. Pelletier, A. and Mueller, T.J., “Low Reynolds Number Aerodynamics of Low-Aspect-Ratio,
Thin/Flat/Cambered-Plate Wings”, Journal of Aircraft, vol. 37, no. 5, 2000, pp. 825-832.
67. Wooding, C.L. and Gursul, I., 2003, “Unsteady Aerodynamics of Low Aspect Ratio Wings at
Low Reynolds Numbers”, Royal Aeronautical Society Aerospace Aerodynamics Research
Conference, 10-12 June, London.
57

68. Torres, G.E., and Mueller, T.J., “Aerodynamic Characteristics of Low Aspect Ratio Wings at
Low Reynolds Numbers”, Proceedings of the Conference: Fixed, Flapping and Rotary Wing
Vehicles at Very Low Reynolds Numbers, Univ. of Notre Dame, Notre Dame, IN, 5-7 June 2000,
pp. 228-305.
69. Roos, F.W. and Kegelman, J.T., “Control of Coherent Structures in Reattaching Laminar and
Turbulent Shear Layers”, AIAA Journal, vol. 24, no. 12, December 1986, pp. 1956-1963.
70. Cipolla, K. M. and Rockwell, D., “Flow Structure on Stalled Delta Wing Subjected to Small
Amplitude Pitching Oscillations”, AIAA Journal, Vol. 33, No. 7, pp. 1256-1262, July 1995.
71. Gad-el-Hak, M. and Blackwelder, R. F., “Control of the Discrete Vortices from a Delta
Wing”, AIAA Journal, Vol. 25, No. 8, pp. 1042-1049, 1987.
72. Margalit, S., Greenblatt, D., Seifert, A., and Wygnanski, I., “Active Flow Control of a Delta
Wing at High Incidence Using Segmented Piezoelectric Actuators”, AIAA 2002-3270, 1st AIAA
Flow Control Conference, 24-26 June 2002, St. Louis, MO.
73. Siegel, S., McLaughlin, T. E., and Albertson, J. A., “Partial Leading Edge Blowing of a Delta
Wing at High Angles of Attack”, AIAA 2002-3268, 1st AIAA Flow Control Conference, 24-26
June 2002, St. Louis, MO.
58

74. Siegel, S., McLaughlin, T. E., and Morrow, J. A., “PIV Measurements on a Delta Wing with
Periodic Blowing and Suction”, AIAA 2001-2436, 19th AIAA Applied Aerodynamics
Conference, June 2001, Anaheim, CA.
75. Vardaki, E., Gursul, I. And Taylor, G., “Physical Mechanisms of Lift Enhancement for
Flexible Delta Wings”, AIAA-2005-0867, 43rd Aerospace Sciences Meeting and Exhibit, 10-13
January 2005, Reno, NV.
76. Cummings, R. M., Morton, S. A., Siegel, S. G., and Bosscher, S., “Numerical Prediction and
Wind Tunnel Experiment for a Pitching Unmanned Combat Air Vehicle”, AIAA-2003-0417, 41st
Aerospace Sciences Meeting, 6-9 January 2003, Reno, NV.
77. Ashley, H., Katz, J., Jarrah, M.A., and Vaneck, T., “Survey of Research on Unsteady
Aerodynamic Loading of Delta Wings”, Journal of Fluids and Structures, vol. 5, 1991, pp. 363-
390.
78. Soltani, M.R., Bragg, M.B. and Brandon, J.M., “Measurements on an Oscillating 70-Deg
Delta Wing in Subsonic Flow”, Journal of Aircraft, vol. 27, no. 3, March 1990, pp. 211-217.
79. Jenkins, J. E., Myatt, J. H., and Hanff, E. S., “Body-Axis Rolling Motion Critical States of a
65-Degree Delta Wing,” Journal of Aircraft, Vol. 33, No. 2, 1996, pp. 268-278.
59
80. Hanff, E. S., and Huang, X. Z., “Roll-Induced Cross-Loads on a Delta Wing at High
Incidence,” AIAA Paper 91-3223, 9th AIAA Applied Aerodynamics Conference, 23-25
September 1991, Baltimore, MD.
81. Huang, X. Z., and Hanff, E. S., “Prediction of Normal Force on a Delta Wing Rolling at High
Incidence,” AIAA Paper 93-3686, AIAA Atmospheric Flight Mechanics Conference, 9-11
August 1993, Monterey, CA.
82. Vardaki, E. and Gursul, I., “Vortex Flows on a Rolling Nonslender Delta Wing”, AIAA-
2004-4729, 22nd AIAA Applied Aerodynamics Conference, 16-19 August 2004, Providence,
Rhode Island.
83. Gordnier, R.E., “Computation of Vortex Breakdown on a Rolling Delta Wing”, Journal of
Aircraft, vol. 32, no. 3, 1995, pp. 686-688.
84. Hüschler, S., “Wing Rock of Nonslender Delta Wings”, Research Project Report, University
of Bath, June 2003.
85. Ueno, M., Matsuno, T., and Nakamura, Y., “Unsteady Aerodynamics of Rolling Thick Delta
Wing with High Aspect Ratio”, AIAA-98-2520, 16th Applied Aerodynamics Conference, June
15-18, 1998, Albuquerque, NM.
60

86. Matsuno, T., Yokouchi, S., and Nakamura, Y., “The Effect of Leading-Edge Profile on Self-
Induced Oscillations of 45-Degree Delta Wings”, AIAA-2000-4004.
87. Matsuno, T. and Nakamura, T., “Self-induced Roll Oscillation of 45-Degree Delta Wings”,
AIAA-2000-0655, 38th AIAA Aerospace Sciences Meeting and Exhibit, 10-13 January 2000,
Reno, NV.
88. Arena, A.S. and Nelson, R.C., “Experimental Investigations on Limit Cycle Wing Rock of
Slender Wings”, Journal of Aircraft, vol. 31, no. 5, Sept-Oct. 1994, pp. 1148-1155.
89. Ericksson, L.E., “Wing Rock of Nonslender Delta Wings”, Journal of Aircraft, vol. 38, no. 1,
January-February 2001, pp. 36-41.
90. Ericksson, L.E. and Beyers, M.E., “An Analysis of Self-Induced Roll Oscillations of a 45-
Degree Delta Wing”, AIAA-2003-0737.
61

FIGURE CAPTIONS
Figure 1: Current and future Unmanned Combat Air Vehicles and fixed-wing Micro Air
Vehicles.
Figure 2: Variation of lift coefficient with angle of attack [8].
Figure 3: Variation of maximum normal force coefficient as a function of sweep angle from
various sources.
Figure 4: Surface oil flow visualization of the flow over a 50° sweep delta wing at α=2.5°
Figure 5: Mean axial velocity profile through the vortex core at x/c=0.3 for a Λ=50° sweep delta
wing.
Figure 6: Mean vortex structure over a Λ=50° sweep delta wing at α=5° angle of attack showing
development of a dual vortex structure.
Figure 7: Dual vortex structure in a crossflow plane a) computation by Gordnier and Visbal [16],
Λ=50°, α=5° b) PIV measurement by Taylor et al [15] Λ=50°, α=7.5° c) PIV measurement by
Yaniktepe and Rockwell [31] Λ=38.7°, α=7°
Figure 8: Mean vortex structure over a Λ=50° sweep delta wing at α=15° angle of attack
showing vortex structure b) crossplane upstream of breakdown c) crossplane downstream of
breakdown
Figure 9: Λ=50° sweep wing at α=15° Upper – Surface streamline pattern and pressure
coefficient [16], Lower – Surface oilflow pattern [30]
Figure 10: Instantaneous vortex structure over a Λ=50° wing at α=15°
Figure 11: Instantaneous vortex structure on a crossflow plane for a Λ=50° sweep wing at α=15°
a,b) upstream of breakdown and c,d) downstream of breakdown.
62
Figure 12: Shear Layer substructures visible in the PIV measurements of Yavuz et al [36] for a
Λ=38.7° sweep wing on a plane parallel and immediately adjacent to the surface of the wing.
Figure 13: Comparison of dye flow visualization of Yaniktepe and Rockwell [31] and the
computational streakline of Gordnier and Visbal [16].
Figure 14: Mean axial velocity contours on a plane through the vortex core: a) α=15°, b) α=10°,
c) α=5°
Figure 15: Comparison of the velocity magnitude on a plane through the vortex core for a Λ=50°
sweep wing at α=15°. Upper – PIV measurements of Taylor and Gursul [30], Lower –
Computations of Gordnier and Visbal [16]
Figure 16: Instantaneous vortex structure on a plane through the vortex core a) axial vorticity, b)
axial velocity, c) fluctuating kinetic energy.
Figure 17: PIV measurements [30] of the rms velocity and streamline pattern on a plane parallel
and adjacent to the surface of the wing.
Figure 18: Variation of spanwise location of reattachment line with incidence for measurements
in both a wind tunnel and water channel.
Figure 19: Influence of Reynolds number on dual vortex structure a) Re=10,000, b) Re=20,000,
c) Re=50,000
Figure 20: Variation of spanwise location of vortex core with Reynolds number from various
experiments and computations [10, 11, 16, 30].
Figure 21: Location of reattachment line as a function of angle of attack for various leading-edge
shapes, t/c=4%.
Figure 22: Variation of lift coefficient with angle of attack for various leading-edge shapes and
thickness.
63

Figure 23: Spectrum of unsteady flow phenomena over delta wings as a function of
dimensionless frequency.
Figure 24: Variation of wingtip rms acceleration as a function of angle of attack for a Λ=60°
sweep half delta wing model.
Figure 25: Mean wingtip deflection as a function of angle of attack and the mean deflection of a
Λ=60° sweep wing for at α=27.5°.
Figure 26: Three-dimensional spectra as a function of frequency and angle of attack for the
Λ=60° half delta wing model.
Figure 27: Spectral analysis of the pressure fluctuations under the vortex core for α=27.5°
Figure 28: Three-dimensional spectra as a function of frequency and angle of attack for the
Λ=60° full delta wing model.
Figure 29: Variation of wingtip rms acceleration as a function of angle of attack for a Λ=50°
sweep half delta wing model.
Figure 30: Variation of lift coefficient as a function of angle of attack and sweep angle for rigid
and flexible wings.
Figure 31: MAV with membrane wing (top); lift coefficient versus angle of attack (bottom) [65].
Figure 32: Variation of mean and amplitude of wing tip deformation.
Figure 33: Variation of the root-mean-square rolling moment coefficient as a function of angle of
attack.
Figure 34: Contours of cross-spectral amplitude (top) and phase angle (bottom) between the
wing tip accelerations as a function of frequency and incidence.
Figure 35: Variation of root-mean-square wing tip acceleration for 50° half-wing and full-wing
models.
64

Figure 36: Tuft visualisation of surface flow patterns at α=27°.
Figure 37: Time-averaged near surface streamlines for rigid (top) and flexible wings (bottom) at
α=27°, Λ=50°.
Figure 38: Contours of chordwise velocity component for rigid (top) and flexible wings
(bottom), x/c=40%, α=25°, Λ=50°.
Figure 39: Flow visualization for rigid and flexible wings in water tunnel, α = 20°.
Figure 40: Magnitude of vorticity in a cross-flow plane at x/c=0.8 for rigid and flexible wings in
water tunnel experiments, α = 20°.
Figure 41: Variation of normalized circulation with wing flexibility.
Figure 42: Flow visualization for a stationary and small-amplitude (∆φ=5°) rolling wing in water
tunnel experiments.
Figure 43: Variation of mean breakdown location as a function of dimensionless frequency for
different angles of attack in water tunnel experiments.
Figure 44: Magnitude of vorticity in a cross-flow plane at x/c=0.8 for stationary and rolling
wings in water tunnel experiments, α = 25°.
Figure 45: Variation of normalized circulation of vortical flow in a cross-flow plane at x/c=0.8 as
a function of dimensionless frequency in water tunnel experiments, α = 25°.
Figure 46: Flow visualization for a stationary and small amplitude (∆α=1°) pitching wing for
various reduced frequencies fc/U∞, α=25°, Λ=50°.
Figure 47: Effect of small amplitude pitching oscillations on time-averaged velocity and
streamline patterns at x/c=0.8 for α=17°, Λ=38.7° [31].
65

Figure 48: Variation of the vortex breakdown position XBD/c with the roll angle φ for different
cases of the wing motion at α= 15° and for φmax = 30°; a) static case; b) fc/U∞=0.015; c)
fc/U∞=0.15.
Figure 49: Variation of the vortex breakdown position XBD/c with the roll angle φ for different
cases of the wing motion at α = 20° and for φmax = 30°; a) static case; b) fc/U∞=0.015; c)
fc/U∞=0.15.
Figure 50: Comparison of vorticity in a cross-flow plane at x/c=0.8 for the static and dynamic
cases, α=20°.
Figure 51: Variation of circulation for the counter-clockwise vortex over a cycle for the static
and dynamic cases at α=20°.
Figure 52: Phase plane trajectories for two values of initial roll angle, α=30°, Λ=65° [79].
Figure 53: Time histories of roll angle for two values of initial roll angle, α=15°, Λ=50°.
Figure 54: Time histories of roll angle for two values of initial roll angle, α=32.5°, Λ=50°.
Figure 55: Time histories of roll angle for two values of initial roll angle, α=35°, Λ=50°.
Figure 56: Time history of roll angle for α=27.5°, Λ=50°, φ0=10° for rounded leading-edge.
Figure 57: Time history of roll angle for α=30°, Λ=45°, φ0=30° for rounded leading-edge [87].
Figure 58: Time history of roll angle for α=22.5°, Λ=50°, φ0=25° for sharp leading-edge.
Figure 59: Variation of mean (top) and standard deviation (bottom) of roll angle as a function of
angle of attack for sharp and rounded leading-edges.
66

Figure 1: Current and future Unmanned Combat Air Vehicles and fixed-wing Micro Air Vehicles.
67

⊕
⊕
⊕⊕
⊕⊕
⊕
⊕⊕
⊕
⊕
⊕
⊕
⊕⊕
⊕
⊕⊕⊕⊕
⊕
⊕
⊕
⊕
⊕
α [deg]
CL
-10 0 10 20 30 40 50 60
-0.4
-0.2
0
0.2
0.4
0.6
0.8
1
1.2
1.4
1.6
⊕ Λ=70°Λ=76°
Λ=45°Λ=55°Λ=60°Λ=65°
Figure 2: Variation of lift coefficient with angle of attack, adapted from [8].
68

Λ [deg]
CN
,max
-CN
,0
35 40 45 50 55 60 65 70 75 80
0.6
0.8
1
1.2
1.4
1.6
1.8
2
Earnshaw & Lawford 1964Taylor et al.Huang et al.
69
Figure 3: Variation of maximum normal force coefficient as a function of sweep angle from various sources.
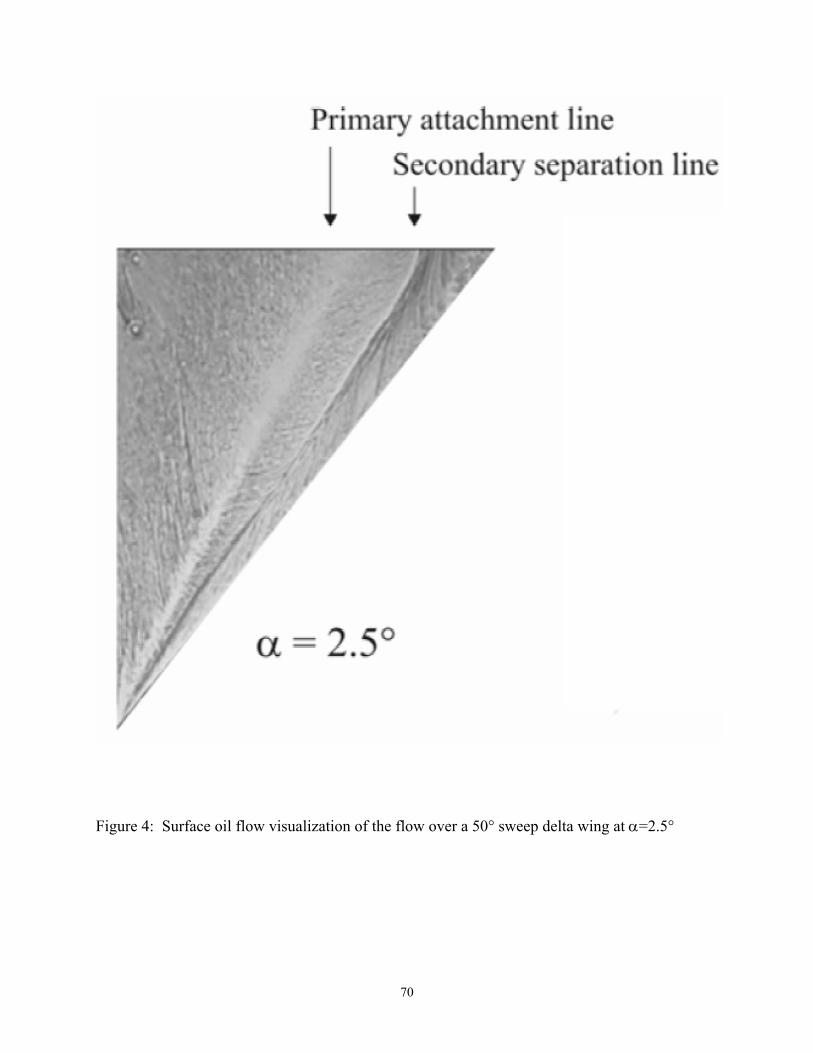
Figure 4: Surface oil flow visualization of the flow over a 50° sweep delta wing at α=2.5°
70
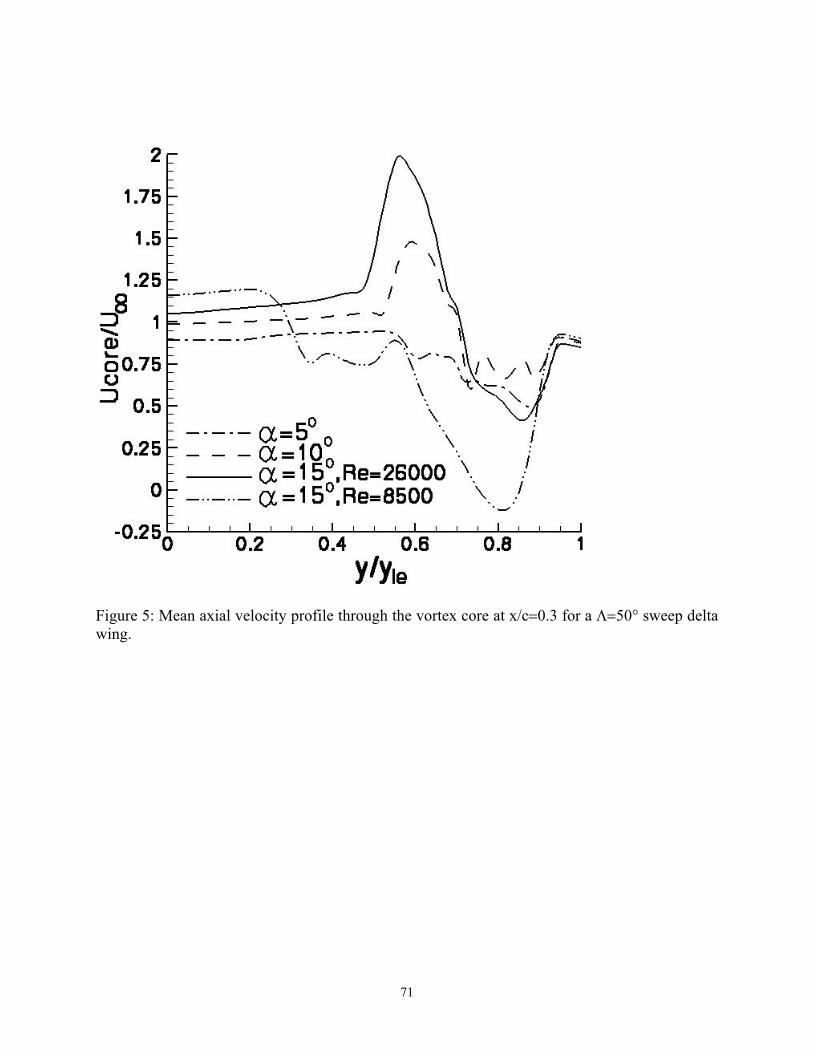
Figure 5: Mean axial velocity profile through the vortex core at x/c=0.3 for a Λ=50° sweep delta wing.
71

Figure 6: Mean vortex structure over a Λ=50° sweep delta wing at α=5° angle of attack showing development of a dual vortex structure.
72

a)
b)
c)
Figure 7: Dual vortex structure in a crossflow plane a) computation by Gordnier and Visbal [16], Λ=50°, α=5° b) PIV measurement by Taylor et al [15] Λ=50°, α=7.5° c) PIV measurement by Yaniktepe and Rockwell [31] Λ=38.7°, α=7°
73

Figure 8: Mean vortex structure over a Λ=50° sweep delta wing at α=15° angle of attack showing vortex structure b) crossplane upstream of breakdown c) crossplane downstream of breakdown
74

Figure 9: Λ=50° sweep wing at α=15° Upper – Surface streamline pattern and pressure coefficient [16], Lower – Surface oilflow pattern [30]
75
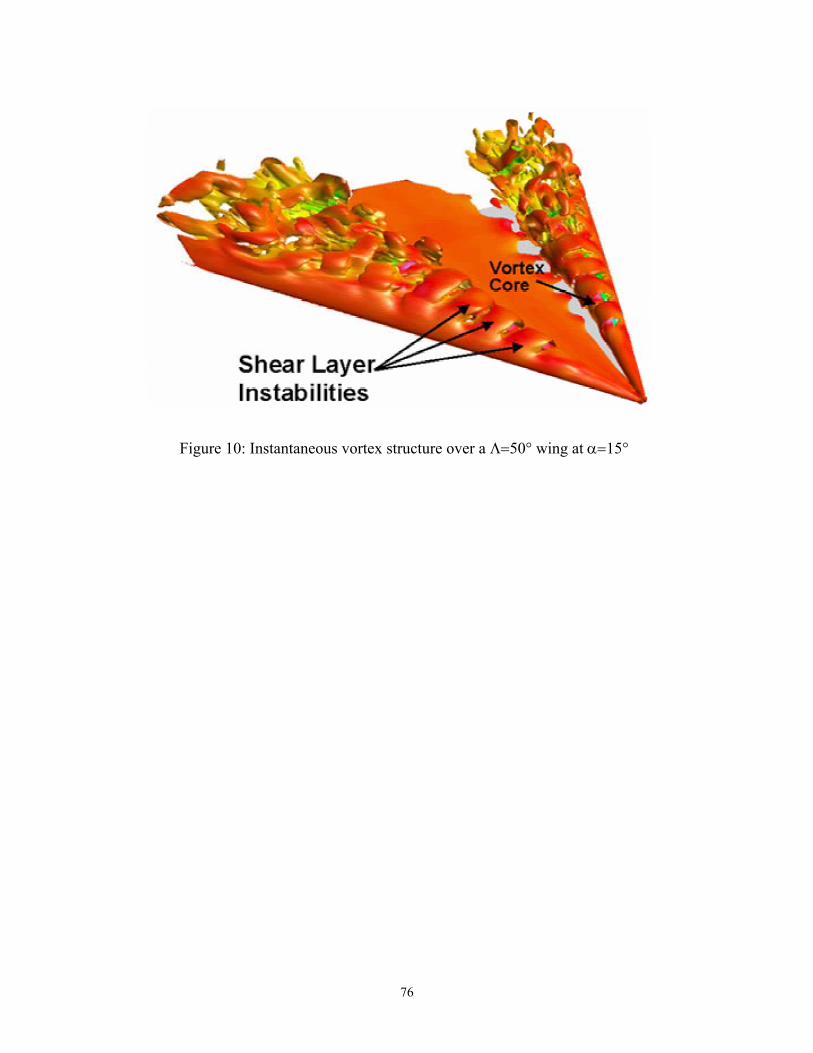
Figure 10: Instantaneous vortex structure over a Λ=50° wing at α=15°
76

Figure 11: Instantaneous vortex structure on a crossflow plane for a Λ=50° sweep wing at α=15° a,b) upstream of breakdown and c,d) downstream of breakdown.
77
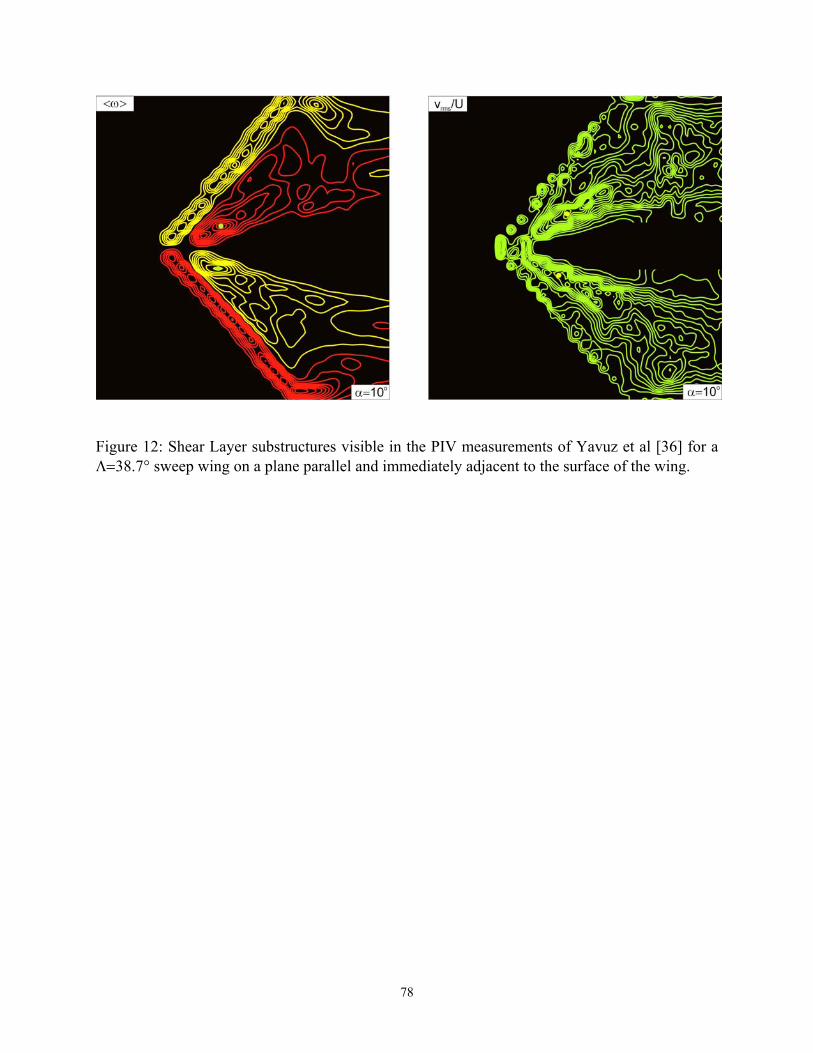
Figure 12: Shear Layer substructures visible in the PIV measurements of Yavuz et al [36] for a Λ=38.7° sweep wing on a plane parallel and immediately adjacent to the surface of the wing.
78

Figure 13: Comparison of dye flow visualization of Yaniktepe and Rockwell [31] and the computational streakline of Gordnier and Visbal [16].
79

Figure 14: Mean axial velocity contours on a plane through the vortex core: a) α=15°, b) α=10°, c) α=5°
80
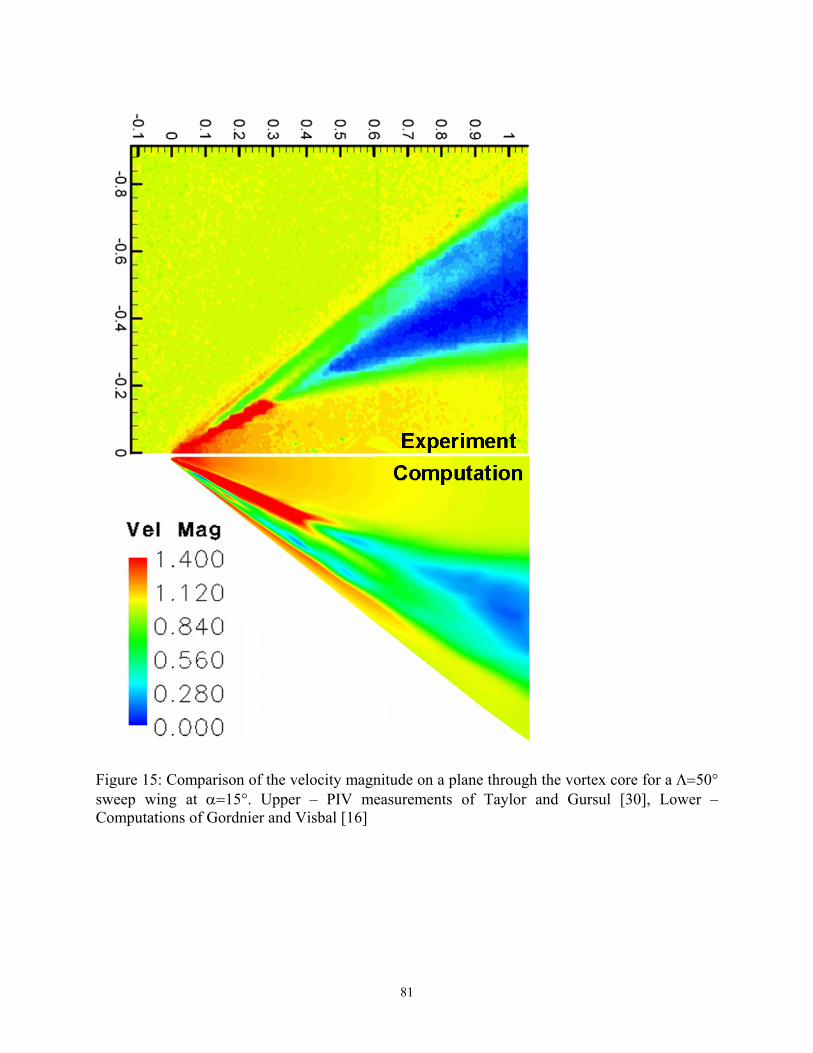
Figure 15: Comparison of the velocity magnitude on a plane through the vortex core for a Λ=50° sweep wing at α=15°. Upper – PIV measurements of Taylor and Gursul [30], Lower – Computations of Gordnier and Visbal [16]
81

Figure 16: Instantaneous vortex structure on a plane through the vortex core a) axial vorticity, b) axial velocity, c) fluctuating kinetic energy.
82

Figure 17: PIV measurements [30] of the rms velocity and streamline pattern on a plane parallel and adjacent to the surface of the wing.
83

Figure 18: Variation of spanwise location of reattachment line with incidence for measurements in both a wind tunnel and water channel.
84

Figure 19: Influence of Reynolds number on dual vortex structure a) Re=10,000, b) Re=20,000, c) Re=50,000
85
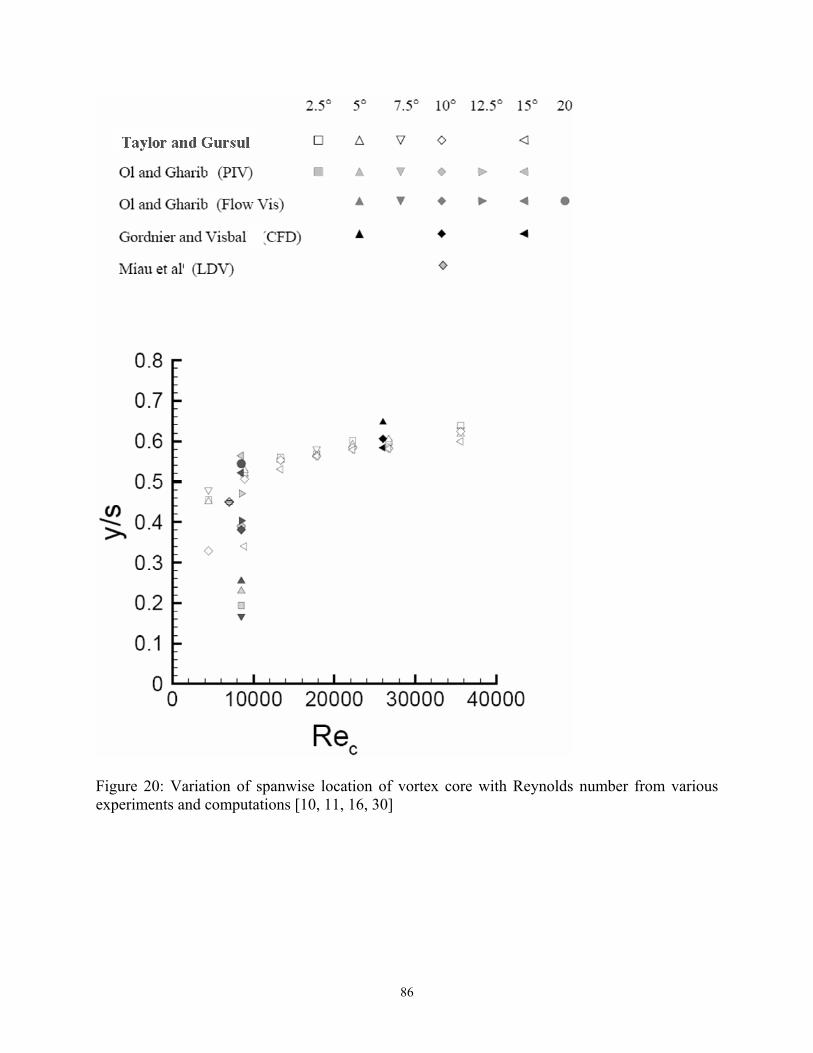
Figure 20: Variation of spanwise location of vortex core with Reynolds number from various experiments and computations [10, 11, 16, 30]
86

y
s
θ
Reattachment line
U∞
y
s
θ
Reattachment line
U∞
0.0
0.1
0.2
0.3
0.4
0.5
0.6
0.7
0.8
0.9
0 5 10 15 20 25 30
Incidence (deg)
y/s
Sharp LESemi-Circular LE2:1 Elliptical LE4:1 Elliptical LE
Figure 21: Location of reattachment line as a function of angle of attack for various leading-edge shapes, t/c=4%.
87
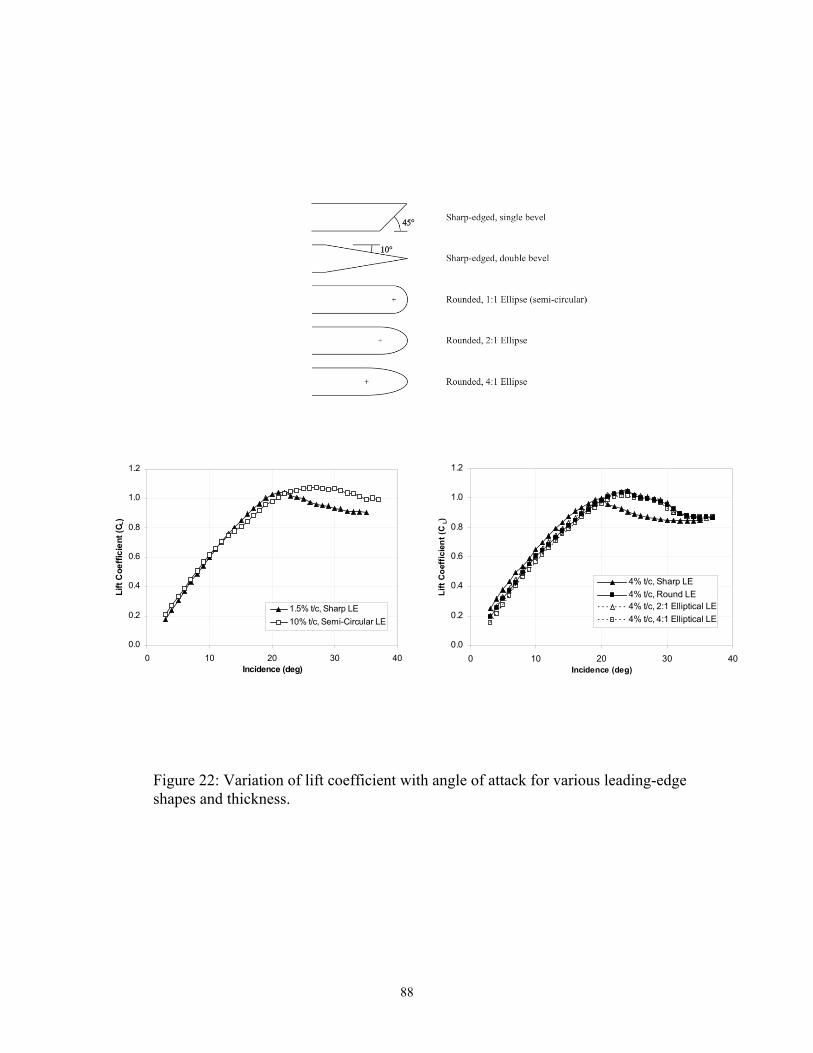
0.0
0.2
0.4
0.6
0.8
1.0
1.2
0 10 20 30 4Incidence (deg)
Lift
Coe
ffici
ent (
C L)
1.5% t/c, Sharp LE10% t/c, Semi-Circular LE
00.0
0.2
0.4
0.6
0.8
1.0
1.2
0 10 20 30Incidence (deg)
Lift
Coe
ffic
ient
(CL)
4% t/c, Sharp LE4% t/c, Round LE4% t/c, 2:1 Elliptical LE4% t/c, 4:1 Elliptical LE
40
Figure 22: Variation of lift coefficient with angle of attack for various leading-edge shapes and thickness.
88
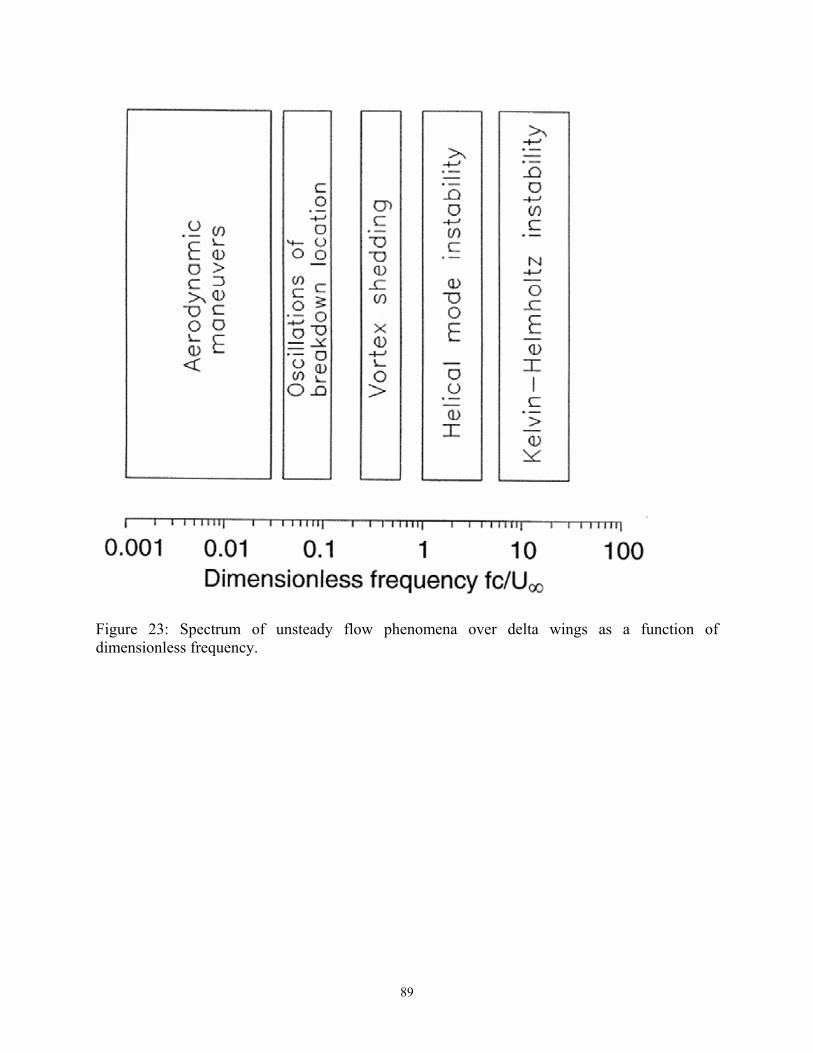
Figure 23: Spectrum of unsteady flow phenomena over delta wings as a function of dimensionless frequency.
89

Figure 24: Variation of wingtip rms acceleration as a function of angle of attack for a Λ=60° sweep half delta wing model.
90

Figure 25: Mean wingtip deflection as a function of angle of attack and the mean deflection of a Λ=60° sweep wing for at α=27.5°.
91

Figure 26: Three-dimensional spectra as a function of frequency and angle of attack for the Λ=60° half delta wing model.
92

Figure 27: Spectral analysis of the pressure fluctuations under the vortex core for α=27.5°
93

Figure 28: Three-dimensional spectra as a function of frequency and angle of attack for the Λ=60° full delta wing model.
94

Figure 29: Variation of wingtip rms acceleration as a function of angle of attack for a Λ=50° sweep half delta wing model.
95

α
CL
0 5 10 15 20 25 30 35 400
0.1
0.2
0.3
0.4
0.5
0.6
0.7
0.8
0.9
1
1.1
1.2
1.3
1.4
1.5
FlexibleRigid
Λ=40°
α
CL
0 5 10 15 20 25 30 35 400
0.1
0.2
0.3
0.4
0.5
0.6
0.7
0.8
0.9
1
1.1
1.2
1.3
1.4
1.5
FlexibleRigid
Λ=45°
α
CL
0 5 10 15 20 25 30 35 400
0.1
0.2
0.3
0.4
0.5
0.6
0.7
0.8
0.9
1
1.1
1.2
1.3
1.4
1.5
FlexibleRigid
Λ=50°
α
CL
0 5 10 15 20 25 30 35 400
0.1
0.2
0.3
0.4
0.5
0.6
0.7
0.8
0.9
1
1.1
1.2
1.3
1.4
1.5
FlexibleRigid
Λ=55°
α
CL
0 5 10 15 20 25 30 35 400
0.1
0.2
0.3
0.4
0.5
0.6
0.7
0.8
0.9
1
1.1
1.2
1.3
1.4
1.5
FlexibleRigid
Λ=60°
Figure 30: Variation of lift coefficient as a function of angle of attack and sweep angle for rigid and flexible wings.
96

97
Figure 31: MAV with membrane wing (top); lift coefficient versus angle of attack (bottom) [65].
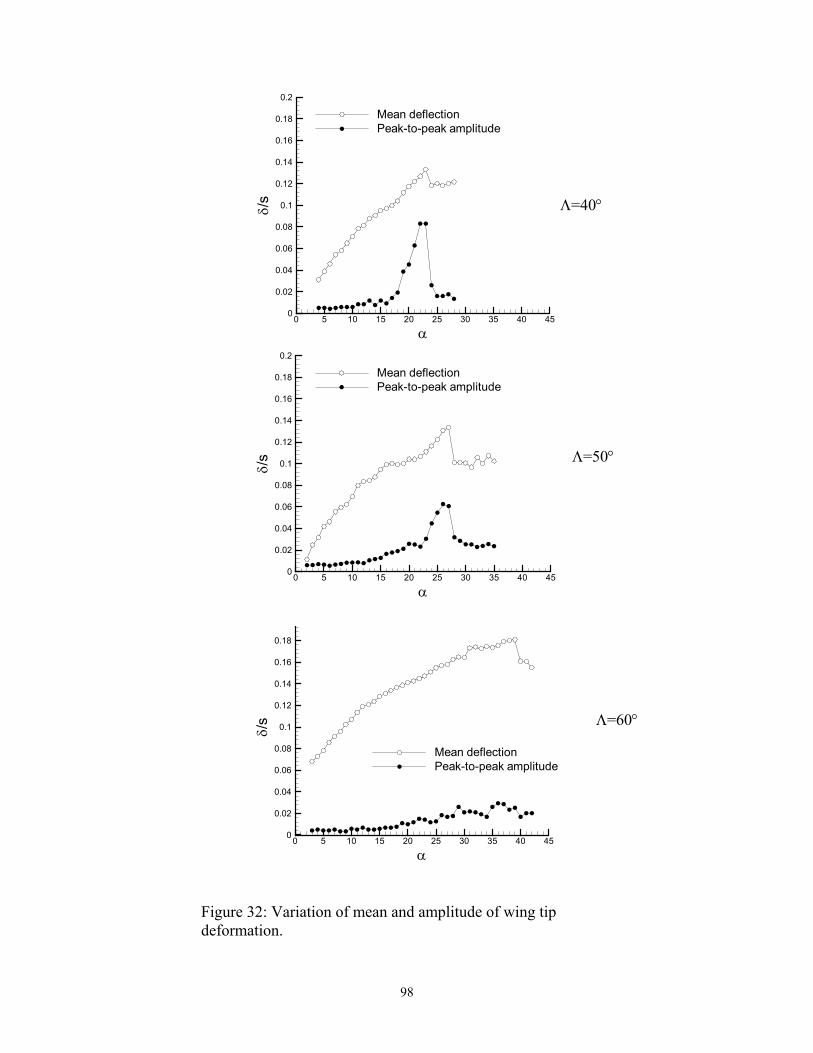
Λ=40°
α
δ/s
0 5 10 15 20 25 30 35 40 450
0.02
0.04
0.06
0.08
0.1
0.12
0.14
0.16
0.18
0.2
Mean deflectionPeak-to-peak amplitude
Λ=50°
Λ=60°
α
δ/s
0 5 10 15 20 25 30 35 40 450
0.02
0.04
0.06
0.08
0.1
0.12
0.14
0.16
0.18
0.2
Mean deflectionPeak-to-peak amplitude
α
δ/s
0 5 10 15 20 25 30 35 40 450
0.02
0.04
0.06
0.08
0.1
0.12
0.14
0.16
0.18
0.2
Mean deflectionPeak-to-peak amplitude
Λ=50°
Figure 32: Variation of mean and amplitude of wing tip deformation.
98
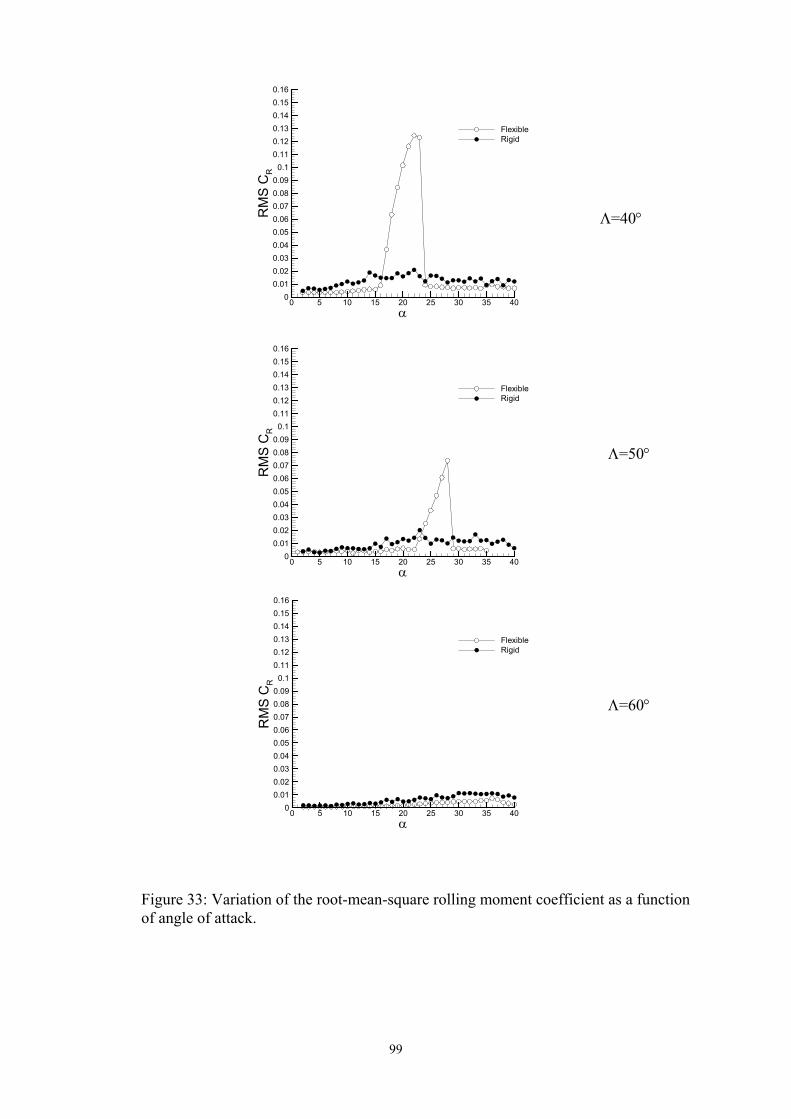
α
RM
SC
R
0 5 10 15 20 25 30 35 400
0.010.020.030.040.050.060.070.080.09
0.10.110.120.130.140.150.16
FlexibleRigid
Λ=40°
α
RM
SC
R
0 5 10 15 20 25 30 35 400
0.010.020.030.040.050.060.070.080.09
0.10.110.120.130.140.150.16
FlexibleRigid
Λ=50°
α
RM
SC
R
0 5 10 15 20 25 30 35 400
0.010.020.030.040.050.060.070.080.09
0.10.110.120.130.140.150.16
FlexibleRigid
Λ=60°
Figure 33: Variation of the root-mean-square rolling moment coefficient as a function of angle of attack.
99

α
fc/U
∞
5 10 15 20 25 30 350
0.5
1
1.5
2
2.5 S1.00E+081.47E+072.15E+063.16E+054.64E+046.81E+031.00E+03
α
fc/U
∞
5 10 15 20 25 30 350
0.5
1
1.5
2
2.5
φ [deg]180.00157.50135.00112.50
90.0067.5045.0022.50
0.00
Figure 34: Contours of cross-spectral amplitude (top) and phase angle (bottom) between the wing tip accelerations as a function of frequency and incidence.
100

α
RM
Sw
ing-
tipac
cele
ratio
n[m
/s2 ]
5 10 15 20 25 30 350
100
200
300
400
500
600
700
800
900
1000
1100
1200
Full wingHalf wing
Figure 35: Variation of root-mean-square wing tip acceleration for 50° half-wing and full-wing models.
101

Rigid wing
Flexible wing
Figure 36: Tuft visualisation of surface flow patterns at α=27°.
102

Figure 37: Time-averaged near surface streamlines for rigid (top) and flexible wings (bottom) at α=27°, Λ=50°.
103

y/s
z/s
-0.2 0 0.2 0.4 0.6 0.8 1 1.2 1.40
0.1
0.2
0.3
0.4
0.5
0.6
0.7
0.8
Flexible Wing
y/s
z/s
-0.2 0 0.2 0.4 0.6 0.8 1 1.2 1.40
0.1
0.2
0.3
0.4
0.5
0.6
0.7
0.8
u/U∞1.41.21.00.80.60.40.20.0
-0.2-0.4
Figure 38: Contours of chordwise velocity component for rigid (top) and flexible wings (bottom), x/c=40%, α=25°, Λ=50°.
104
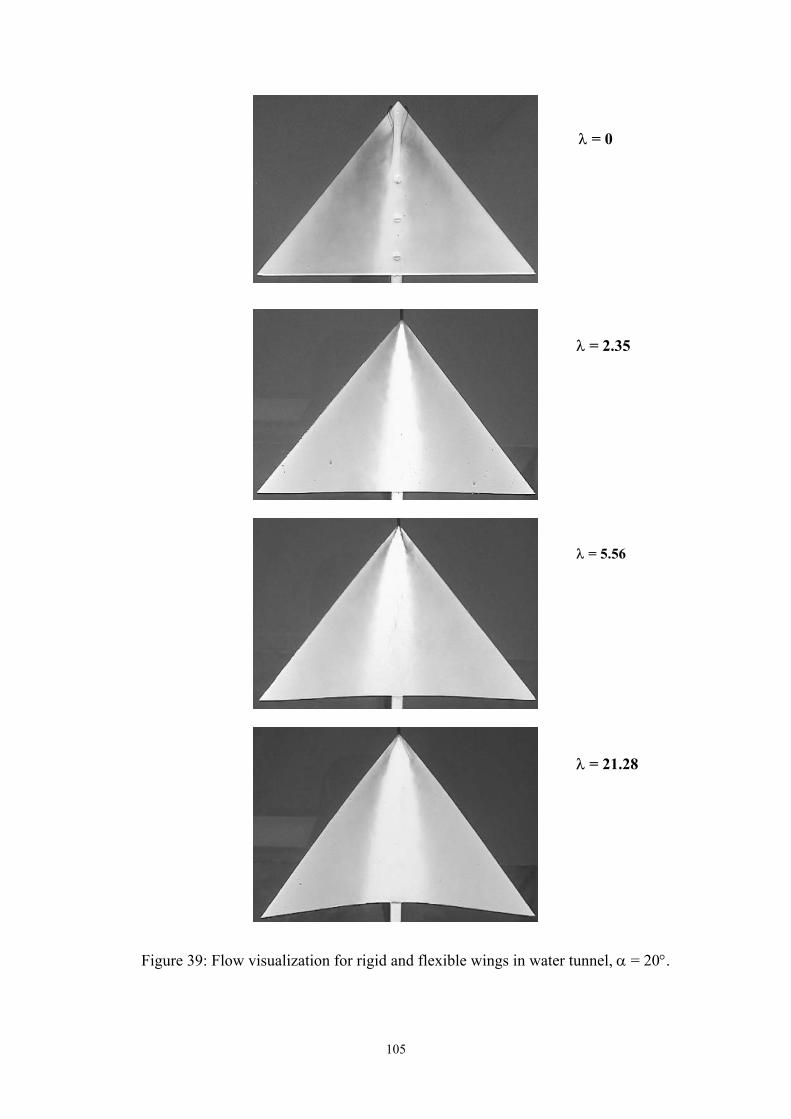
λ = 0
λ = 2.35
Figure 39: Flow visualization for rigid and flexible wings in water
105
λ = 5.56
λ = 21.28tunnel, α = 20°.

z/s
-0.2
0
0.2
0.4
0.6
Figure 40: Mwings in wa
λ = 0
8
y/s-1.2 -1 -0.8 -0.6 -0.4 -0.2 0 0.2 0.4 0.6 0.8 1 1.2
-0.6
-0.4
y/s
z/s
-1.2 -1 -0.8 -0.6 -0.4 -0.2 0 0.2 0.4 0.6 0.8 1 1.2-0.6
-0.4
-0.2
0
0.2
0.4
0.6
z/s
-0.2
0
0.2
0.4
0.6
λ = 21.2
λ = 5.56
y/s-1.2 -1 -0.8 -0.6 -0.4 -0.2 0 0.2 0.4 0.6 0.8 1 1.2
-0.6
-0.4
agnitude of vorticity in a cross-flow plane at x/c=0.8 for rigid and flexible ter tunnel experiments, α = 20°.
106

λ
Γ/U
∞c
0 5 10 15 20 250
0.1
0.2
0.3
0.4
0.5
0.6α = 20 degα = 25 deg
Figure 41: Variation of normalized circulation with wing flexibility.
107

Figure 42: Flwater tunnel
fc/U∞ = 0
fc/U∞ = 0.15fc/U∞ = 0.3
108
ow visualization for a stationary and smexperiments.
all-amplitude (
fc/U∞ = 0.5
fc/U∞ = 0.89
fc/U∞ = 1.78
∆φ=5°) rolling wing in
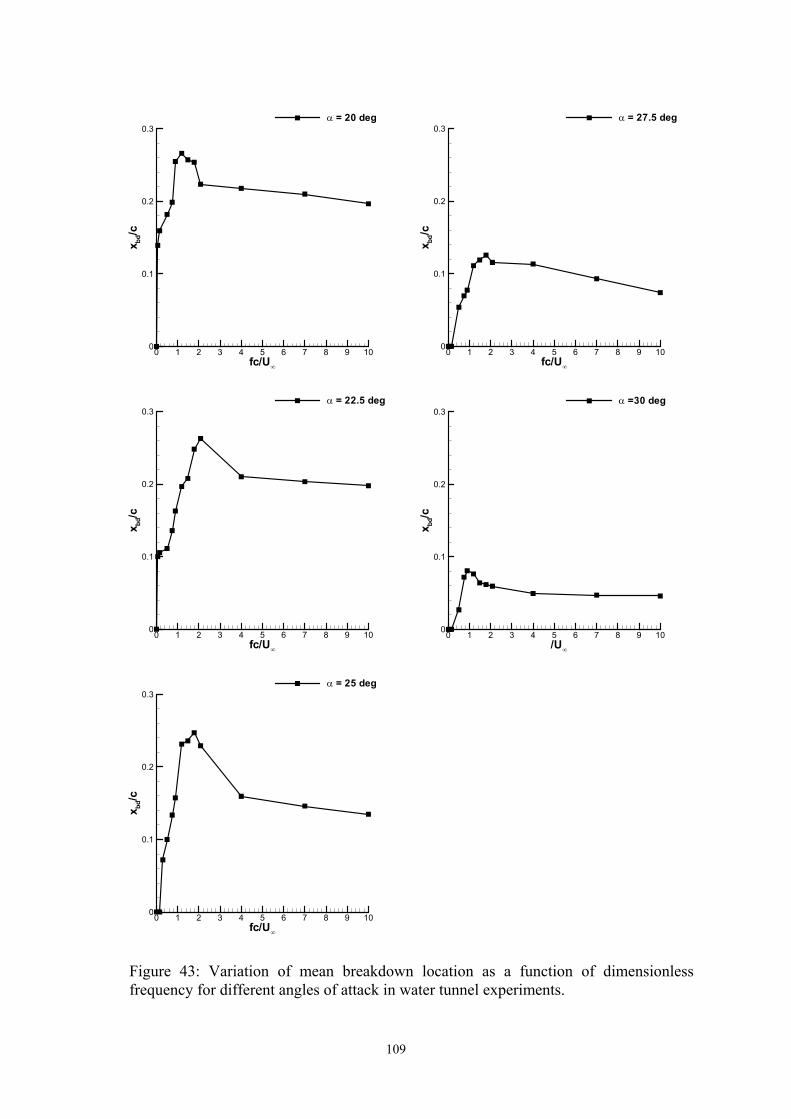
fc/U∞
x bd/c
0 1 2 3 4 5 6 7 8 9 100
0.1
0.2
0.3α = 20 deg
fc/U∞
x bd/c
0 1 2 3 4 5 6 7 8 9 100
0.1
0.2
0.3α = 22.5 deg
fc/U∞
x bd/c
0 1 2 3 4 5 6 7 8 9 100
0.1
0.2
0.3α =30 deg
fc/U∞
x bd/c
0 1 2 3 4 5 6 7 8 9 100
0.1
0.2
0.3α = 27.5 deg
fc/U∞
x bd/c
0 1 2 3 4 5 6 7 8 9 100
0.1
0.2
0.3α = 25 deg
Figure 43: Variation of mean breakdown location as a function of dimensionlessfrequency for different angles of attack in water tunnel experiments.
109
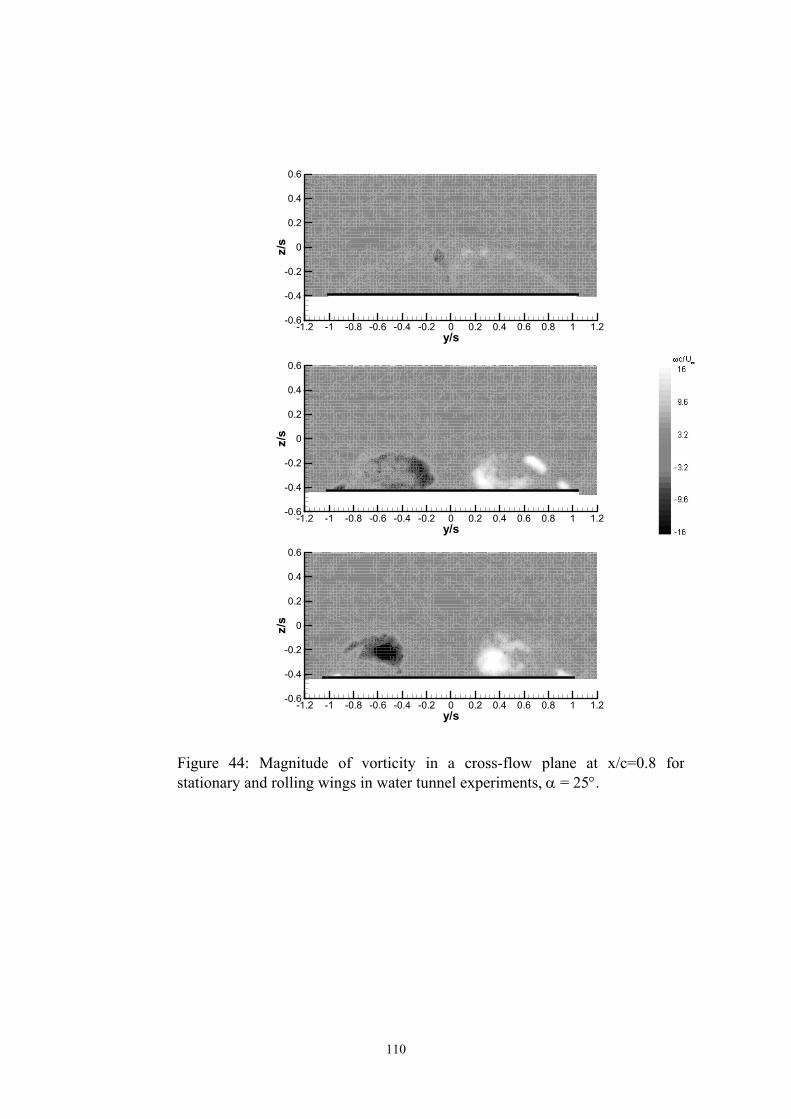
Figure 44: Mastationary and ro
y/s
z/s
-1.2 -1 -0.8 -0.6 -0.4 -0.2 0 0.2 0.4 0.6 0.8 1 1.2-0.6
-0.4
-0.2
0
0.2
0.4
0.6
y/s
z/s
-1.2 -1 -0.8 -0.6 -0.4 -0.2 0 0.2 0.4 0.6 0.8 1 1.2-0.6
-0.4
-0.2
0
0.2
0.4
0.6
y/s
z/s
-1.2 -1 -0.8 -0.6 -0.4 -0.2 0 0.2 0.4 0.6 0.8 1 1.2-0.6
-0.4
-0.2
0
0.2
0.4
0.6
gnitude of vorticity in a cross-flow plane at x/c=0.8 forlling wings in water tunnel experiments, α = 25°.
110

fc/U∞
Γ/U
∞c
0 0.5 1 1.5 2 2.50
0.1
0.2
0.3
0.4
0.5
0.6
0.7
0.8
0.9
1counter-clockwise vortexclockwise vortex
Figure 45: Variation of normalized circulation of vortical flow in a cross-flow plane atx/c=0.8 as a function of dimensionless frequency in water tunnel experiments, α = 25°.
111

fr = 0 fr = 0.5
fr = 0.3 fr = 1.19
Figure 46: Flow visualization for a stationary and small amplitude (∆α=1°) pitching wing for various reduced frequencies fc/U∞, α=25°, Λ=50°.
112
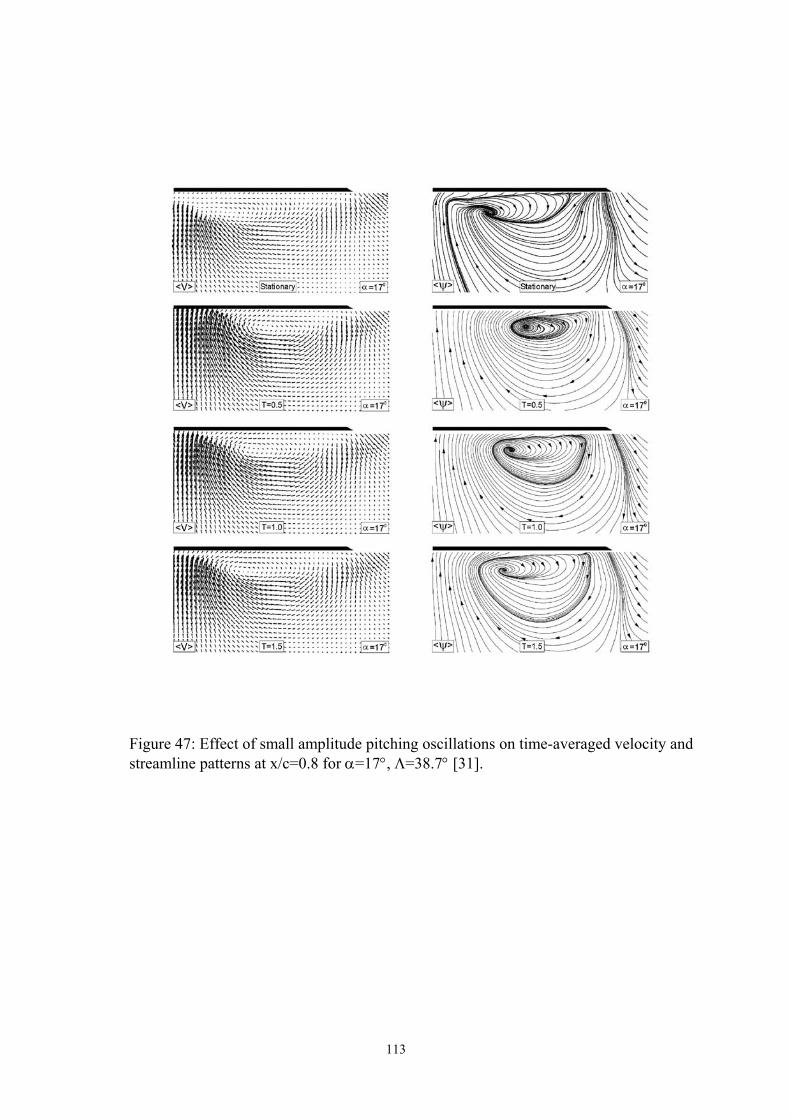
113
Figure 47: Effect of small amplitude pitching oscillations on time-averaged velocity and streamline patterns at x/c=0.8 for α=17°, Λ=38.7° [31].

1clockwise vortexcounter-clockwise vortex
Figure 4cases ofc/U∞=0
fc/U∞=0
a)Roll angle, φ
XB
D/c
-30 -20 -10 0 10 20 300
0.2
0.4
0.6
0.8
1clockwise vortexcounter-clockwise vortex
fc/U∞=0.015b)Roll angle, φ
XB
D/c
-30 -20 -10 0 10 20 300
0.2
0.4
0.6
0.8
1clockwise vortexcounter-clockwise vortex
fc/U∞=0.15c)Roll angle, φ
XB
D/c
-30 -20 -10 0 10 20 300
0.2
0.4
0.6
0.8
8: Variation of the vortex breakdown position XBD/c with the roll angle φ for differentf the wing motion at α= 15° and for φmax = 30°; a) static case; b) fc/U∞=0.015; c).15.
114

1clockwise vortexcounter-clockwise vortex
Figure 4cases ofc/U∞=0
fc/U∞=0
a)Roll angle, φ
XB
D/c
-30 -20 -10 0 10 20 300
0.2
0.4
0.6
0.8
Roll angle, φ
XB
D/c
-30 -20 -10 0 10 20 300
0.2
0.4
0.6
0.8
1clockwise vortexcounter-clockwise vortex
1clockwise vortexcounter-clockwise vortex
b)
fc/U∞=0.15
fc/U∞=0.015
Roll angle, φ
XB
D/c
-30 -20 -10 0 10 20 300
0.2
0.4
0.6
0.8
c)
9: Variation of the vortex breakdown position XBD/c with the roll angle φ for different f the wing motion at α = 20° and for φmax = 30°; a) static case; b) fc/U∞=0.015; c) .15.
115

y/s
z/s
-1.2 -1 -0.8 -0.6 -0.4 -0.2 0 0.2 0.4 0.6 0.8 1 1.2-1.2
-1
-0.8
-0.6
-0.4
-0.2
0
0.2
0.4
0.6
0.8
1
1.2
y/s
z/s
-1.2 -1 -0.8 -0.6 -0.4 -0.2 0 0.2 0.4 0.6 0.8 1 1.2-1.2
-1
-0.8
-0.6
-0.4
-0.2
0
0.2
0.4
0.6
0.8
1
1.2
φ = -20°
y/s
z/s
-1.2 -1 -0.8 -0.6 -0.4 -0.2 0 0.2 0.4 0.6 0.8 1 1.2-1.2
-1
-0.8
-0.6
-0.4
-0.2
0
0.2
0.4
0.6
0.8
1
1.2
y/s
z/s
-1.2 -1 -0.8 -0.6 -0.4 -0.2 0 0.2 0.4 0.6 0.8 1 1.2-1.2
-1
-0.8
-0.6
-0.4
-0.2
0
0.2
0.4
0.6
0.8
1
1.2
φ = -10°
y/s
z/s
-1.2 -1 -0.8 -0.6 -0.4 -0.2 0 0.2 0.4 0.6 0.8 1 1.2-1.2
-1
-0.8
-0.6
-0.4
-0.2
0
0.2
0.4
0.6
0.8
1
1.2
/s 0
0.2
0.4
0.6
0.8
1
1.2
Figure 50: Comparison of vorticitdynamic cases, α=20°.
φ = 0°
fc/U∞ = 0
z
-1.2 -1 -0.8 -0.6 -0.-1.2
-1
-0.8
-0.6
-0.4
-0.2
y in a cross-flow plane at x/c=0.8 for the
116
fc/U∞ = 0.15
y/s4 -0.2 0 0.2 0.4 0.6 0.8 1 1.2
static and
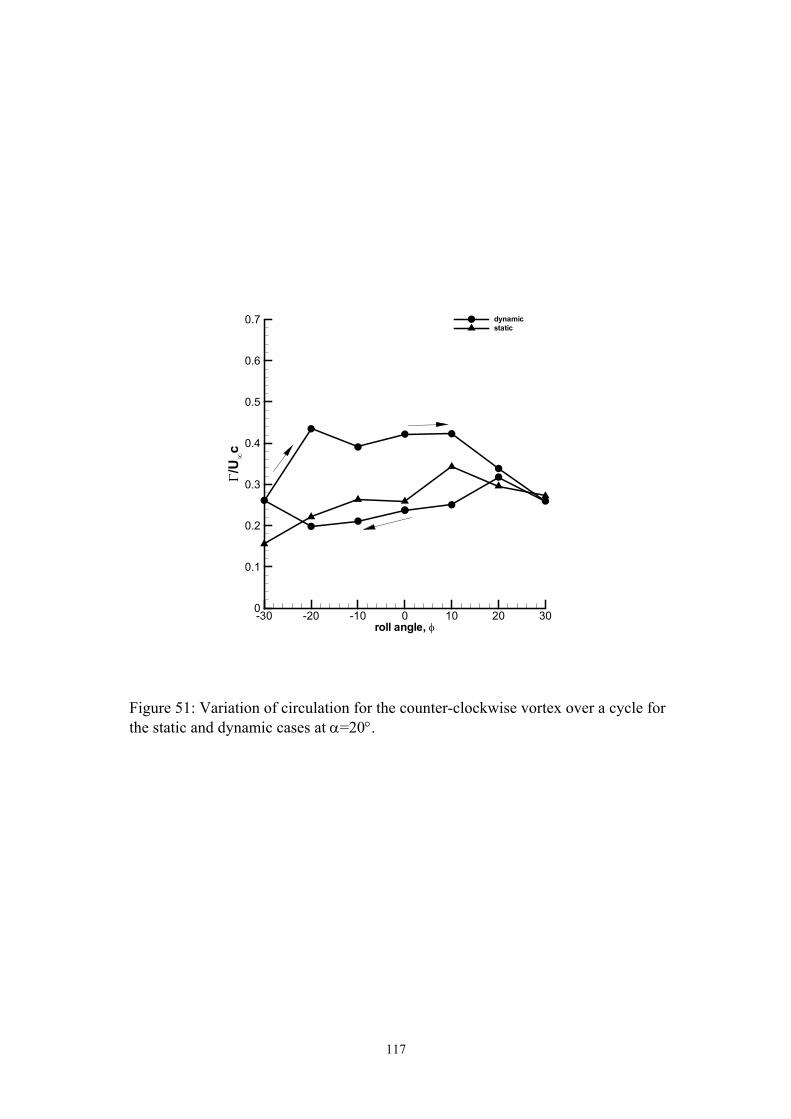
roll angle, φ
Γ/U
∞c
-30 -20 -10 0 10 20 300
0.1
0.2
0.3
0.4
0.5
0.6
0.7 dynamicstatic
Figure 51: Variation of circulation for the counter-clockwise vortex over a cycle for the static and dynamic cases at α=20°.
117

118
Figure 52: Phase plane trajectories for two values of initial roll angle, α=30°, Λ=65° [79].

-10
-5
0
5
10
15
20
25
30
35
40
45
50
55
60
0 5 10 15 20 25 30
Time [s]
Angl
e [°
]
-10
-5
0
5
10
15
20
25
30
35
40
45
50
55
60
0 5 10 15 20 25 30
Time [s]
Angl
e [°
]
Figure 53: Time histories of roll angle for two values of initial roll angle, α=15°, Λ=50°.
119

-10
-5
0
5
10
15
20
25
30
35
40
45
50
55
60
0 5 10 15 20 25 30
Time [s]
Angl
e [°
]
-10
-5
0
5
10
15
20
25
30
35
40
45
50
55
60
0 5 10 15 20 25 30
Time [s]
Angl
e [°
]
Figure 54: Time histories of roll angle for two values of initial roll angle, α=32.5°, Λ=50°.
120
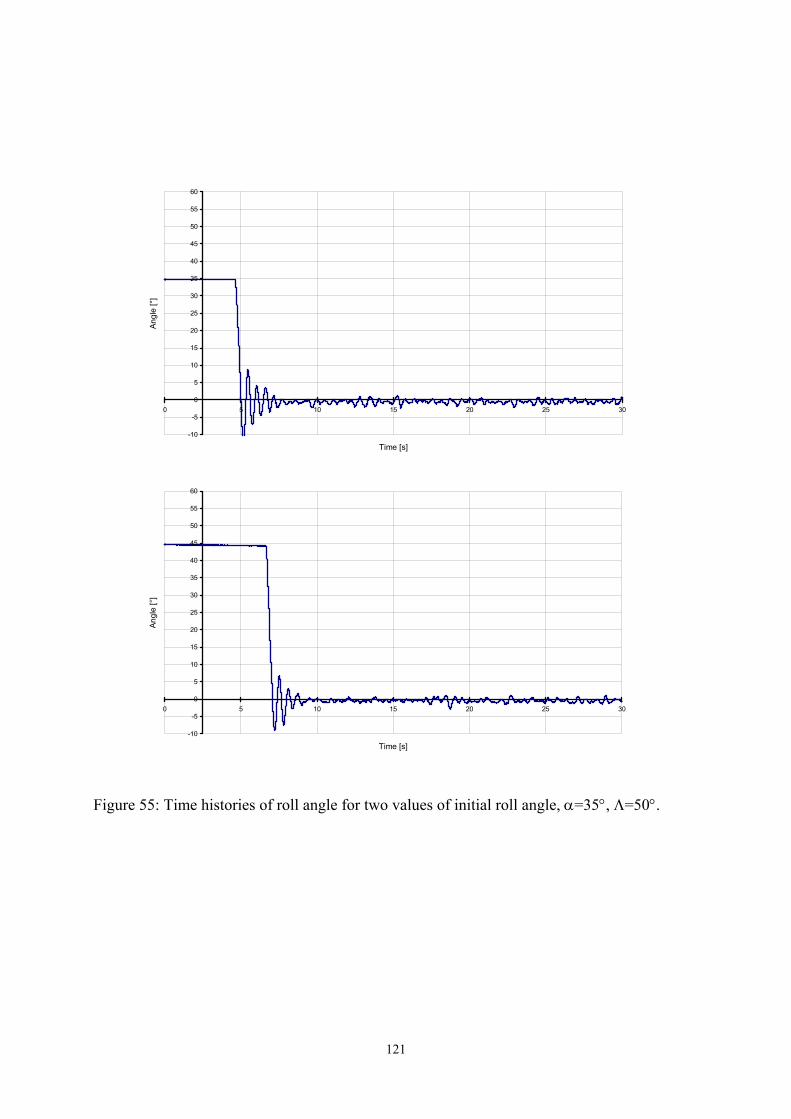
-10
-5
0
5
10
15
20
25
30
35
40
45
50
55
60
0 5 10 15 20 25 30
Time [s]
Angl
e [°
]
-10
-5
0
5
10
15
20
25
30
35
40
45
50
55
60
0 5 10 15 20 25 30
Time [s]
Angl
e [°
]
Figure 55: Time histories of roll angle for two values of initial roll angle, α=35°, Λ=50°.
121

-10
-5
0
5
10
15
20
25
30
35
40
45
50
55
60
0 5 10 15 20 25 30
Time [s]
Angl
e [°
]
Figure 56: Time history of roll angle for α=27.5°, Λ=50°, φ0=10° for rounded leading-edge.
122
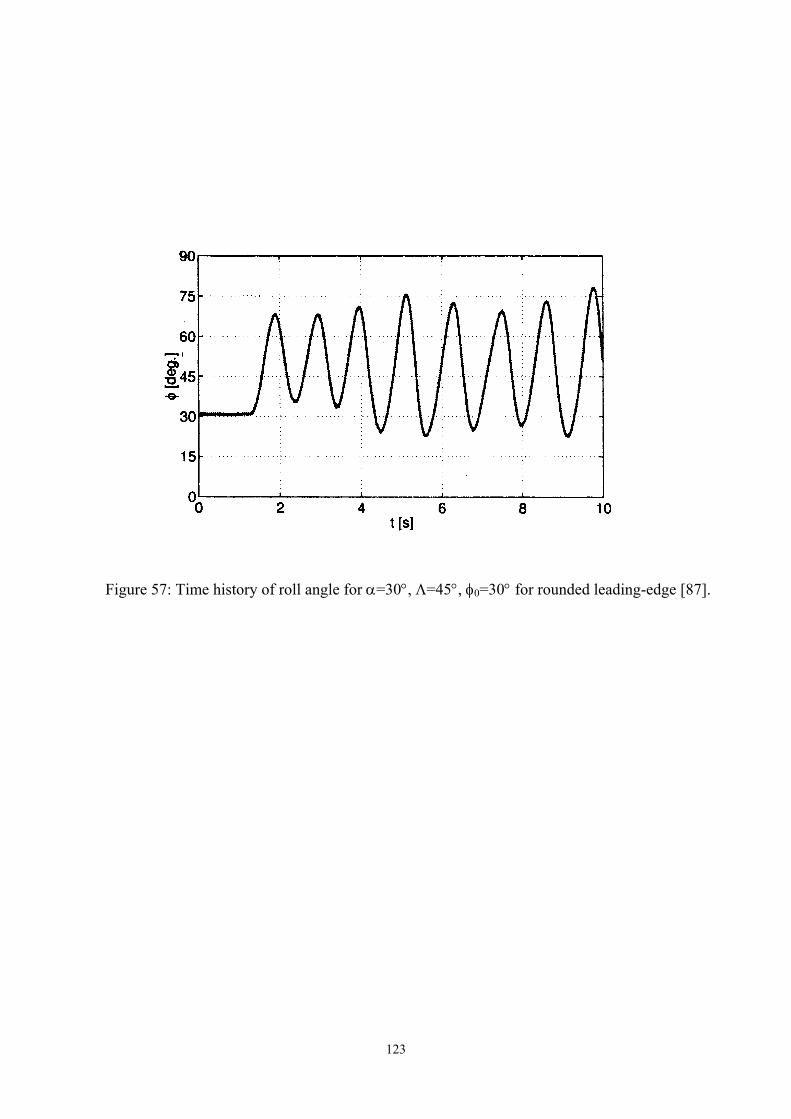
123
Figure 57: Time history of roll angle for α=30°, Λ=45°, φ0=30° for rounded leading-edge [87].

-10
-5
0
5
10
15
20
25
30
35
40
45
50
55
60
0 5 10 15 20 25 30
Time [s]
Angl
e [°
]
Figure 58: Time history of roll angle for α=22.5°, Λ=50°, φ0=25° for sharp leading-edge.
124
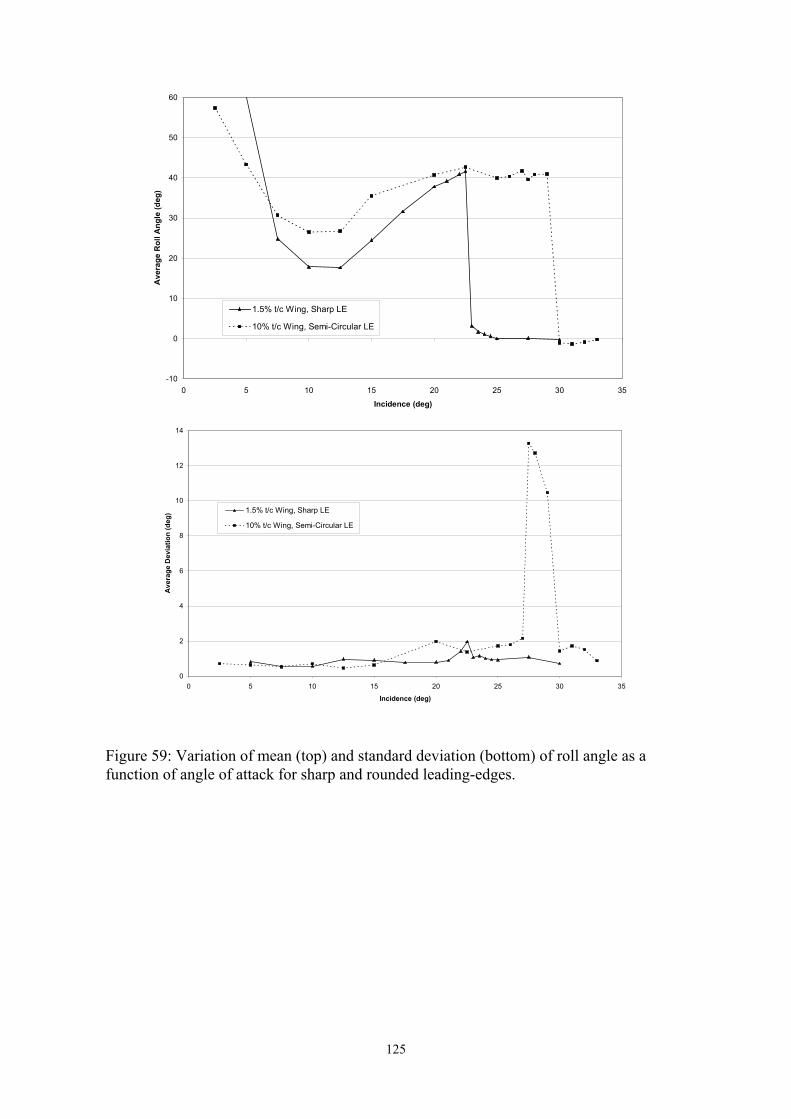
-10
0
10
20
30
40
50
60
0 5 10 15 20 25 30 35
Incidence (deg)
Ave
rage
Rol
l Ang
le (d
eg)
1.5% t/c Wing, Sharp LE
10% t/c Wing, Semi-Circular LE
0
2
4
6
8
10
12
14
0 5 10 15 20 25 30 35
Incidence (deg)
Ave
rage
Dev
iatio
n (d
eg) 1.5% t/c Wing, Sharp LE
10% t/c Wing, Semi-Circular LE
Figure 59: Variation of mean (top) and standard deviation (bottom) of roll angle as a function of angle of attack for sharp and rounded leading-edges.
125