Unraveling in Guessing Games: An Experimental Study...
18
Unraveling in Guessing Games: An Experimental Study Rosemarie Nagel The American Economic Review, Vol. 85, No. 5. (Dec., 1995), pp. 1313-1326. Stable URL: http://links.jstor.org/sici?sici=0002-8282%28199512%2985%3A5%3C1313%3AUIGGAE%3E2.0.CO%3B2-V The American Economic Review is currently published by American Economic Association. Your use of the JSTOR archive indicates your acceptance of JSTOR's Terms and Conditions of Use, available at http://www.jstor.org/about/terms.html. JSTOR's Terms and Conditions of Use provides, in part, that unless you have obtained prior permission, you may not download an entire issue of a journal or multiple copies of articles, and you may use content in the JSTOR archive only for your personal, non-commercial use. Please contact the publisher regarding any further use of this work. Publisher contact information may be obtained at http://www.jstor.org/journals/aea.html. Each copy of any part of a JSTOR transmission must contain the same copyright notice that appears on the screen or printed page of such transmission. The JSTOR Archive is a trusted digital repository providing for long-term preservation and access to leading academic journals and scholarly literature from around the world. The Archive is supported by libraries, scholarly societies, publishers, and foundations. It is an initiative of JSTOR, a not-for-profit organization with a mission to help the scholarly community take advantage of advances in technology. For more information regarding JSTOR, please contact [email protected]. http://www.jstor.org Thu Dec 6 10:08:54 2007
Transcript of Unraveling in Guessing Games: An Experimental Study...

Unraveling in Guessing Games: An Experimental Study
Rosemarie Nagel
The American Economic Review, Vol. 85, No. 5. (Dec., 1995), pp. 1313-1326.
Stable URL:
http://links.jstor.org/sici?sici=0002-8282%28199512%2985%3A5%3C1313%3AUIGGAE%3E2.0.CO%3B2-V
The American Economic Review is currently published by American Economic Association.
Your use of the JSTOR archive indicates your acceptance of JSTOR's Terms and Conditions of Use, available athttp://www.jstor.org/about/terms.html. JSTOR's Terms and Conditions of Use provides, in part, that unless you have obtainedprior permission, you may not download an entire issue of a journal or multiple copies of articles, and you may use content inthe JSTOR archive only for your personal, non-commercial use.
Please contact the publisher regarding any further use of this work. Publisher contact information may be obtained athttp://www.jstor.org/journals/aea.html.
Each copy of any part of a JSTOR transmission must contain the same copyright notice that appears on the screen or printedpage of such transmission.
The JSTOR Archive is a trusted digital repository providing for long-term preservation and access to leading academicjournals and scholarly literature from around the world. The Archive is supported by libraries, scholarly societies, publishers,and foundations. It is an initiative of JSTOR, a not-for-profit organization with a mission to help the scholarly community takeadvantage of advances in technology. For more information regarding JSTOR, please contact [email protected].
http://www.jstor.orgThu Dec 6 10:08:54 2007

Unraveling in Guessing Games: An Experimental Study
Consider the following game: a large num- ber of players have to state simultaneously a number in the closed interval [O. 1001. The winner is the person whose chosen number is closest to the mean of all chosen numbers mul- tiplied by a parameter p, where p is a prede- ternlined positive parameter of the game; p is common knowledge. The payoff to the winner is a fixed amount, which is independent of the stated number and p . If there is a tie, the prize is divided equally among the winners. The other players whose chosen numbers are fur- ther away receive nothing.'
The game is played for four rounds by the same group of players. After each round, all chosen numbers, the mean, p times the mean, the winning numbers, and the payoffs are pre- sented to the subjects. For 0 5 p < 1 , there exists only one Nash equilibrium: all players announce zero. Also for the repeated super- game, all Nash equilibria induce the same an- nouncements and payoffs as in the one-shot game. Thus, game theory predicts an unam- biguous outcome.
The structure of the game is favorable for investigating whether and how a player's men- tal process incorporates the behavior of the other players in conscious reasoning. An ex- planation proposed, for out-of-equilibrium be- havior involves subjects engaging in a finite depth of reasoning on players' beliefs about
" Department of Economics, liniversitat Pompeu Fa- bra. Balmes 132. Barcelona 08008. Spain. Financial sup- port from Deutsche Forschungsgemeinschaft (DFG) through Sonderforschungsbereich 303 and a postdoctoral fellowship from the University of Pittsburgh are grate- fully acknowledged. I thank Reinhard Selten. Dieter Balkenborg. Ken Binmore, John Duffy, Michael Mitzkewitz. Alvin Roth, Karim Sadrieh, Chris Starmer, and two anon- ymous referccs for helpful discussions and comments. I learned about the guessing game in a game-theory class given by Roger Guesnerie. who used the game as a dem- onstration experiment.
' The game is mentioned, for examplc. by HcrvC Moulin (19S6), as an example to explain rationalizability, and by Mario H. Simonsen (1988).
1313
one another. In the simplest case, a player se- lects a strategy at random without forming be- liefs or picks a number that is salient to him (zero-order belief). A somewhat more so-phisticated player forms first-order beliefi~ on the behavior of the other players. He thinks that others select a number at random. and he chooses his best response to this belief. Or he forms second-order beliefi on the first-order beliefs of the others and maybe nth order be- liefs about the ( n - 1 )th order beliefs of the others, but only up to a finite n , called the n- depth of reasoning.
The idea that players employ finite depths of reasoning has been studied by various theorists (see e.g., Kenneth Binmore, 1987, 1988; Reinhard Selten, 199 1 ;Robert Aumann, 1992; Michael Bacharach, 1992; Cristina Bicchieri, 1993; Dale 0. Stahl, 1993). There is also the famous discussion of newspaper competitions by John M. Keynes (1936 p. 156) who describes the mental process of competitors confronted with picking the face that is closest to the mean preference of all competitor^.^ Keynes's game, which he con- sidered a Gedankenexperiment. has p = 1. However, with 17 = 1, one cannot distinguish between different steps of reasoning by actual subjects in an experiment.
There are some experimental studies in which reasoning processes have been analyzed in ways similar to the analysis in this paper. Judith Mehta et al. (1994), who studied be- havior in two-person coordination games, sug- gest that players coordinate by either applying depth of reasonin& of older or by picking a focal point (Thomas C. Schelling, 1964), which they call "Schelling salience." Stahl and paul W. wilson ( 1994) analyzed behavior
in v~~~~~~~~games and that subjects were using depths of reasoning of or- ders 1 or 2 or a Nash-equilibrium strategy.
'This metaphor is frequently mentioned in the mac- roeconomic literature (see e.g., Roman Frydman, 1982).

1314 THE AMERICAN ECONOMIC REVIEW DECEMBER 1995
Both of these papers concentrated on several one-shot games. In my experiments, the deci- sions in first period indicate that depths of reasoning of order 1 and 2 may be playing a significant role. In periods 2-4, for p < 1, I find that the modal depth of reasoning does not increase, although the median choice de-creases over time.' A simple qualitative learn- ing theory based on individual experience is proposed as a better explanation of behavior over time than a model bf increasing depth of reasoning. This is the kind of theory that Selten and Joachim Buchta (1994) call a "learning direction theory," which has been successfully applied in several other studies.
Other games with unique subgame-perfect equilibria that have been explored in the ex- perimental literature include Robert Rosen- thal's ( 1981 ) "centipede game," a market game with ten buyers and one seller studied experimentally by Roth et al. ( 199 1 ) ,a public- goods-provision game studied by Vesna Prasnikar and Roth ( 1992), and the finitely repeated prisoner's dilemma studied experi- mentally by Selten and Rolf Stoecker ( 1986). In the experimental work on the centipede game by Richard McKelvey and Thomas Palfrey ( 1992) and on the prisoner's dilemma supergame, the outcomes are quite different from the Nash equilibrium point in the open- ing rounds, as well as over time. While the outcomes in Roth et al. ( 1991 ), Prasnikar and Roth ( 1992),and my experiments are also far from the equilibrium in the opening round, they approach the equilibrium in subsequent rounds. Learning models have been proposed to explain such phenomena (see e.g., Roth and Ido Erev, 1995 ) .
I. The Game-Theoretic Solutions
For 0 5 p < 1, there exists only one Nash equilibrium at which all players choose O.%ll
'This kind of unraveling is similar to the naturally oc- curring phenomena observed by Alvin E. Roth and Xiaolin Xing (1994) in many markets in which it is important to act just a little earlier in time than the competition. 'Assume that there is an equilibrium at which at least
one player chooses a positive number with positive prob- ability. Let k be the highest number chosen with positive probability. and let m be one of the players who chooses
announcing 0 is also the only strategy com- bination that survives the procedure of infi- nitely repeated simultaneous elimination of weakly dominated ~trategies.~ For p = 1 and more than two players, the game is a coordi- nation game, and there are infinitely many equilibrium points in which all players choose the same number (see Jack Ochs [19951 for a survey). For p > 1 and 2p < M ( M is the number of players), all choosing 0 and all choosing 1 0 0 are the only equilibrium points. Note that for p > 1 there are no dominated ~trategies.~The subgame-perfect equilibrium play (Selten, 1975) does not change for the finitely repeated game.
11. A Model of Boundedly Rational Behavior
In the first period a player has no informa- tion about the behavior of the other players. He has to form expectations about choices of the other players on a different basis than in subsequent periods. In the subsequent periods he gains information about the actual behavior of the others and about his success in earlier periods. Therefore, in the analysis of the data I make a distinction between the first period and the remaining periods.
k with positive probability. Obviously. in this equilibrium p times the mean of the numbers chosen is smaller than k. Therefore. player m can improve his chances of winning by replacing k by a smaller number with the same prob- ability. Therefore no equilibrium exists in which a positive number is chosen with positive probability.
'Numbers in (loop, 1001 are weakly dominated by 100p; in the two-player game, 0 is a weakly dominant strategy. The interpretation of the infinite iteration process might be: it does not harm a rat~onal player to exclude numbers in the interval (100p, 1001. If this player also believes that all other players are rational, he consequently believes that nobody will choose from ( 1 0 0 ~ . 1001, and therefore he excludes (lOOp', 1001; if he thinks that the others believe the same, (loop', 1001 is excluded, and so on. Thus, 0 remains the only nonexcluded strategy based on common knowledge of rationality. If choices were restricted to integers, all choosing 1 is also an equilibrium.
V t is straightforward to show that all choosing 0 and all choosing 100 are equilibria: it does not pay to deviate from 0 (100) if all other players choose 0 (100) and the number of players is sufficiently large. There is no other symmetric equilibrium since with a unilateral small in- crease a player improves his payoff. Also, other asym- metric equilibria or equilibria in mixed strategies cannot exist for analogous reasons, as in the case p < 1 .

1315 VOL. 85 NO. 5 NAGEL: UNRAVELING IN GUESSING GAMES
The model of first-period behavior is as fol- lows: a player is strategic of degree 0 if he chooses the number 50. (This can be inter- preted as the expected choice of a player who chooses randomly from a symmetric distribu- tion or as a salient number a la Schelling [ 1 9 6 0 ] ) .A person is strategic of degree n if he chooses the number 50p1' ,which I will call iteration step n . A person whose behavior is described by n = 1 just makes a naive best reply to random behavior.' However, if he be- lieves that the others also employ this reason- ing process, he will choose a number smaller than 5 0 p , say 5 0 p 2 ,the best reply to all other players using degree-l behavior. A higher value of n indicates more strategic behavior paired with the belief that the other players are also more strategic; the choice converges to the equilibrium play in the limit as n increases.
For periods 2-4, the reasoning process of period 1 can be modified by replacing the ini- tial reference point r = 50 by a reference point based on the information from the preceding period. A natural candidate for such a refer- ence point is the mean of the numbers named in the previous period. With this initial refer- ence point, iteration step 1, which is the prod- uct of p and the mean of the previous period, is similar to Cournot behavior (Antoine A. Cournot, 1838) in the sense of giving a best reply to the strategy choices made by the oth- ers in the previous period (assuming that the behavior of the others does not change from one period to the next) .'
I can also consider "anticipatory learning," in which an increase in iteration steps is ex-
' If the mean choice of the others is 50, the number that really comes nearest t o p times the mean is a little lower since this player's choice also influencesp times the mean. My interpretation of iteration step 1 is comparable to the definition of secondary salience introduced by Mehta et al. (1994) or the level-l type in Stahl and Wilson (1994).
"ctually, Coumot behavior in response to an assumed mean choice Y-,of the other players would not lead to p times the mean. but to
where M is the number of players. However, there is no indication that subjects try to compute this best reply.
pected of the other players. Specifically, one can ask whether, with increasing experience, higher and higher iteration steps will be ob- served. I will show, however, that the modal frequency, polled over all sessions, remains at iteration step 2 in all periods. In Section V-C a quite different adjustment behavior is ex- amined, which does not involve anything similar to the computation of a best reply to expected behavior. Instead of this, a behav- ioral parameter-the adjustment factor-is changed in the direction indicated by the in- dividual experience in the previous period.
111. The Experimental Design
I conducted three sessions with the param- eter p = ' I , (sessions 1 - 3 ) , four sessions with p = 2/, ( 4 - 7 ) , and three sessions with p = '1, ( 8 - lo)." will refer to these as ' I2 , or -1/? sessions, respectively. A subject could partic- ipate in only one session.
The design was the same for all sessions: 15-18 subjects were seated far apart in a large classroom so that communication was not pos- sible. The same group played for four periods; this design was made known in the written in- structions. At each individual's place were an instruction sheet, one response card for each period, and an explanation sheet on which the subjects were invited to give written explana- tions or comments on their choices after each round. The instructions were read aloud, and questions concerning the rules of the game were answered."'
After each round the response cards were collected. All chosen numbers, the mean, and
Moreover, for M between 15 and 18, the number of sub- jects in my experiments, the difference between this best reply and p times the mean is not large. 'I use p = ' I2.because it reduces calculation difficul-
ties. With p = 'I,, I am able to distinguish between the hypothesis that a thought process starts with the reference point 50 and the game-theoretic hypothesis that a rational person will start the iterated elimination of dominated strategies with 100. For p > 1, p = '1, is used to analyze behavior. There are no sessions with p = 1: this game is similar to a coordination game with many equilibria, which has already been studied experimentally (e.g., John Van Huyck et al., 1990).
" 'A copy of the instructions used in the experiment may be obtained from the author upon request.

--
1316 THE AMERICAN ECONOMIC REVIEW DECEMBER I995
the product of p and the mean were written on the blackboard (the anonymity of the players was maintained). The number closest to the optimal number and the resulting payoffs were announced. The prize to the winner of each round was 20 DM (about $13). If there was a tie, the prize was split between those who tied. All other players received nothing.' ' After four rounds, each player received the sum of his gains of each period and an additional fixed amount of 5 DM (approximately $3) for showing up. Each session lasted about 45 minutes, including the instruction period.
IV. The Experimental Results
The raw data can be found in Nagel ( 1993) and are also available from the author upon request. Whereas I use only nonparametric tests in the following sections, Stahl ( 1994) applies parametric tests to these data and con- firms most of the conclusions.
A. First-Period Choices
Figure 1 displays the relative frequencies of all first-period choices for each value of p, separately. The means and medians are also given in the figure. All but four choices are integers. No subject chose 0 in the 2/1 and 'I2 sessions, and only 6 percent chose numbers below 10. In the % sessions, only 10 percent chose 99, 100, or 1. Thus, the sessions with different parameters do not differ significantly with respect to frequencies of equilibrium strategies and choices near the equilibrium strategies. Weakly dominated choices, choices larger than loop, were also chosen infre- quently: in the 'I, sessions, 6 percent of the
I I This all-or-nothing payoff structure might trigger un- reasonable behavior by some subjects which in turn im- pedes quicker convergence. In John Duffy and Nagel (1995), the behavior in p-times-the-median game was studied, in an effort to weaken the influence of outliers. While first round behavior in both the mean- and median- treatments was not significantly different, fourth round choices in p-times-the-median game were slightly lower than those inp-times-the-mean game. Changes in the pay- off structure, for example, negative payoffs to losers, might affect the evolution of behavior on the guessing game in a different way.
median 17 mean 27.05
o , lo
$ $ o,05
0.00 0 10 20 30 40 50 60 70 80 90 100
Chosen Numbers
mean 36.73
Chosen Numbers
median 66 mean 60.12
Chosen Numbers
subjects chose numbers greater than 50 and 8 percent chose 50; in the 2/, sessions, 10 percent of the chosen numbers were greater than 67, and 6 percent were 66 or 67. From these results

1317 VOL. 85 NO. 5 NAGEL: UNRAVELING IN GUESSING GAMES
one might infer that either dominated choices o 35
are consciously eliminated or reference points 0.30
are chosen that preclude dominated choices. For p > 1, dominated strategies do not exist. .$ OZ5 Apart from the similarities just mentioned, 0.20
there are noticeable differences between the f o 1 5distributions of choices in sessions with dif- 2 ferent values of p . When p was increased, the 0.10
mean of the chosen numbers was higher. I can 0.05
reject the null hypothesis that the data from the 'I, and 'I, sessions are drawn from the same 0.00
mtervas
distribution, in favor of the alternative hypoth- 5-7 11-15 21-30 42-50 neighborhood
esis that most of the chosen numbers in the 'I, sessions tend to be smaller, at the 0.001 level of statistical significance, according to a Mann-Whitney U test. The same holds for a test of the data from the '1, sessions against ,g 0.25 those of the 'I7 sessions: the chosen numbers o,min the former tend to be smaller than those in {the latter; the null hypothesis is rejected at the g0.0001 level. This result immediately suggests ,,, that many players do not choose numbers at random but instead are influenced by the pa-
005
rameter p of the game. I also tested whether the data exhibit the 13-1 6 20-25 30-37 45-50 neighborhood
structure suggested by the simple model given in Section 111, that is, talung 50 as an initial reference point and considering several itera- tion steps from this point (50pt ' ) .Figure 1 shows that the data do not correspond exactly ,,,to these iteration steps. However, are the data g concentrated around those numbers? In order OzO
to test this possibility, I specify neighborhood 15
intervals of 50pt',for which n is 0, 1 , 2, . . . . G Intervals between two neighborhood intervals of 50pt'+' and 50p" are called interim inter- vals. I use the geometric mean to determine ,,,
c50 55-61 73-82 93-97 nterm ntervasthe boundaries of adjacent intervals. This ap- 50-54 6B72 83-92 98-100 ns~ghborhoad
culatedroach captures the idea that the steps are cal- by powers of n . The interim intervals FIGURE FREQLIENCIES IN THE2. RELATIVE OF CHOICES
ACCORDINGare on a logarithmic scale approximately as FIRSTPERIOD TO THE INTERVAL CLASSIFICATION POIKTWITH R E F E R E N C ~ 50:
large as the neighborhood intervals, if round- A) SESSIOKS 1-3 ( p = 4-7/,); B) SESSIONS ing effects are ignored." ( p 8- 10 ( p '1,)= 'I,);C) S E S S I ~ K S =
" In general, the neighborhood interval of 50p' has the boundaries 50p" l i J and 50p'- I", rounded to the nearest Figure 2 shows the number of observations integers, since mostly integers were observed. Note that in each of these neighborhood and interim in- -
is bounded from the right side the neighborhood 0 f - 5 0 ~ ~ ' tervals for the respective sessions. ~h~ neigh- by 50 for p < 1 and bounded to the left side by 50 for borhood and interim intervals are stated on the p > I . (The results we present would not change if we had included a right-hand.side neighborhood for < 1, horizontal axis. Note the similarity between or a left-hand-side neighborhood for p > I). Figure 2A and Figure 2B. In the '1' and '1,

1318 THE AMERICAN ECONOMIC REVIEW DECEMBER 1995
sessions, almost 50 percent of the choices are in the neighborhood interval of either iteration step 1 or 2, and there are few observations in the interim interval between them. In all ses- sions only 6-10 percent are at step 3 and higher steps (the aggregation of the two left- hand columns in Figure 2A and Figure 2B [ p = 'I2 and p = 'I,], respectively, and the right-hand column of Figure 2C [p = '/,I). (Choices above 50 in the '1, and sessions and choices below 50 in the 9, sessions are graphed only in aggregate.) The choices are mostly below 50 in the '1, and '1, sessions and mostlv above 50 in the 'I2 sessions: this difference is statistically significant at the 1-percent level, based on the binomial test.
To test whether there are significantly more observations within the neighborhood inter-vals than in the interim intervals I consider only observations between step 0 and step 3. Hence, the expected within-the neighborhood interval under the null hypoth- esis (that choices are randomly distributed be- tween interim and neighborhood intervals) is then the sum of the neighborhood intervals di- vided by the interval between step 0 and step 3. Note that this is a stronger test than taking the entire interval 0- 100. The one-sided bi- nomial test, taking into consideration the pro- portion of observations in the neighborhood intervals, rejects the null hypothesis in favor of the hypothesis that the pooled observations are more concentrated in the neighborhood in- tervals (the null hypothesis is re-jected at the 1-percent level, both for the '1' sessions and for the '1, sessions; it is rejected at the 5- percent level for the '1, sessions).".'"
Note that over all '1, sessions, the optimal choice (given the data) is about 13.5, which
' Since the iterated elimination of dominated strategies starts the reasoning process at 100, I also tested whether that initial reference point would structure the data in a coherent way for the different parameters. For p = '1, all iteration steps collapse into 100; thus spikes cannot be explained. For the '1, sessions the data are not only con- centrated around 100 x (213)". On the other hand, the pat- tern of the /,-session data is similar to the pattern in Figure 3A, except that step rz becomes step rz + I. Hence, 100 is not a plausible initial reference point for most subjects.
' T h e written comments of the subjects also seem to support our model. For details see Nagel (1 993).
belongs to iteration step 2, which is also where we observe the modal choice, with nearly 30 percent of all observations. Over all ses-sions, the optimal choice is about 25, which also belongs to iteration step 2 with about 25 percent of all observations, the second-highest frequency of a neighborhood interval. Thus, many players are observed to be playing ap- proximately optimally, given the behavior of the others.
B . The Behavior in Periods 2, 3, and 4
To provide an impression of the behavior over time, Figures 3-5 show plots of pooled data from sessions with the same p for each period; the plots show the choices of each sub- ject from round t to t + 1. In the '/' and '/?
sessions, 135 out of 144 (3 transition periods X 48 subjects) and 163 out of 201 observations (3 X 67 subjects), respectively, are below the diagonal, which indicates that most subjects decrease their choices over time. In all ses- sions with p < 1, the medians decrease over time (see Table 1 ); this is also true for the means except in the last period of the '1, ses-sions. In the % sessions, the reverse is true: 133 out of 153 observations ( 3 X 5 1 subjects) are above the diagonal and the medians in- crease and are 100 in the third and fourth pe- riods. Thus from round to round, the observed behavior moves in a consistent direction, to- ward an equilibrium. (It is this movement that is reminiscent of the unraveling in time ob- served in many markets by Roth and Xing [I9941.)
In the '1, sessions, more than half of the ob- servations were less than 1 in the fourth round. However, only three out of 48 chose 0. In the
sessions, only one player chose a number less than 1. On the other hand, in the 9, ses-sions, 100 was already the optimal choice in the second period, being chosen by 16 percent of the subjects; and in the third and fourth pe- riod, it was chosen by 59 percent and 68 per- cent, respectively. Thus, for the % sessions I conclude that the behavior of the majority of the subjects can be simply described as the best reply ( 100) to the behavior observed in the previous period. (Some of the subjects who deviated from this behavior argued that they tried to influence the mean [to bring it

1319 VOL. 85 NO. 5 NAGEL: UNRAVELING IN GUESSING GAMES
Choices in First Period Cholces ~n Flrst Perlod
Cholces In Second Period
k '0 10
' 20
, , ,30 40 50 60 70
Choices In Second Perlod
,80
,90
I 100
Cholces In Thlrd Perlod Cholces in Third Period
down again] or wrote that the split prize was best reply in the '1, and 2/3 sessions, given the too small to state the obvious right answer.) actual strategies. Instead the best reply is a
2!, and'!,um in the The adjustment process toward the equilibri- moving target that approaches 0. The adjust-
sessions is quite different ment process is thus more complicated. Com- from that in the 4/3 sessions. Zero is never the paring Figures 3 and 4, one can see that the

1320 THE AMERICAN ECONOMIC REVIEW DECEMBER 1995
100 -
b 70 /'
,+ ' 40I
,
30 /'
20 +
OK Ib io m ~- ~Cholces n Flrst Per~od
~ h io o io 40 ~'0-m Cholces In Second Perlod
choices in '1, sessions converge faster toward period the chosen numbers are significantly (at the 1-0 than those in 'I3 sessions. However, the percent level) below p x r, in six out of seven sessions.
reason might be that the initial distribution is Note that if I had analyzed the data starting from reference
at lower choices in the former sessions than in point "naive best reply of the previous period" @ x r), instead of starting from the mean, step n would become
the latter. Therefore, to investigate whether the step n - 1, and all choices above the naive best reply actual choices decrease faster for p = 'I, than would be aggregated to one category.
for p = 2/,, I define a rate of decrease of the means and medians from period 1 to period 4 within a session by
( 1a) wrncin = (mean),= , - (mean),=
( mean ), = , (median ), = , - (median),=,
( 1b) W,,L'l = (median),= , o ~ o o
The rates of decrease of the single sessions are shown in Table 1 , in the last lines of panels A and B. The rates of decrease of the session medians in the '1, sessions are higher than those in the ,I, sessions, and the difference is statistically significant at the 5-percent level (one-tailed), based on a Mann-Whitney U test. There is no significant difference in the rates of decrease of the means. The median seems more informative than the mean, since the mean may be strongly influenced by a sin- gle deviation to a high number. Thus, I con-clude that the rate of decrease depends on the parameter p .
Analyzing the behavior in the first period, I found some evidence that r = 50 was a plau- sible initial reference point. Below, I classify the data of each of the subsequent periods ac- cording to the reference point r (mean of the previous period) and iteration steps n : rp" . Numbers above the mean are aggregated to ' 6 above mean, _ I " (see Table 2 ) .''
As was the case for the first-period behav- ior, one cannot expect that exactly these steps are chosen. Grouping the data of the subse- quent periods and sessions in the same way as in the first period, namely, in neighborhood intervals of the iteration steps and interim in-
''The chosen numbers tend to be below the mean of the previous period, and the difference is significant at the 5-percent level for all 'I1and 'I, sessions and all periods t = 2-4, according to the binomial test. The same test does not reject the null hypothesis for p times the mean of the previous period, for periods 2 and 3. In the fourth

1321 VOL. 85 NO. 5 NAGEL: UNRAVELING IN GIJESSING GAMES
TABLE1-MEANS A N D MKDIANS 1-4, I'ROM I 4OF PERIODS A N D RATEOF D E ~ R E A S E PERIOD TO PERIOD
Period Mean
1 23.7 2 10.9 3 5.3 4 8.1
Rate of decrease:.' 0.66
B . Sessions w'itlz p = '1;:
Session I
Medlan
17 7 3 2
0.88
Sesslon 2 Session 3
Mean Median Mean Median
33.2 12.1 3.8
13.0
30 10 3.3 0.57
24.2 10.2 2.4 0.4
14 6 2.1 0.33
0.61 0.98 0.98 0.97
Session 4 Sesslon 5 Session 6 Session 7
Perlod Mean Median Mean
1 39.7 33 37.7 2 28.6 29 20.2 3 20.2 14 10.0 4 16.7 10 3 2
Rate of decrease: ' 0.58 0.7 0.92
"ate of decrease w from period 1 to 4 (see formula 1)
tervals between two steps, I find no significant difference between the frequencies of obser- vations in the neighborhood intervals and the frequencies of observations in the interim in- tervals. Note also that as the mean decreases, the interval between two steps becomes rather small.I6 However, I would like to know within which iteration steps the numbers are located in the different periods; therefore, I divide the interval between steps i and i + 1 geometri-cally into two intervals."
Parts A and B of Table 2 Dresent the fre- quencies of observations for each iteration step, pooled over the '1, and 2/3 sessions, re- spectively. I also state the mean area of each iteration step over all sessions, separately for each period. In most sessions and periods, at
'"Most of the subjects just mentioned in their com- ments that the mean will decrease. There were less precise calculations than in the first period.
I' If one normalizes the mean of the previous period to 1, the boundaries of step n are (JY - I", p" "1. As in period 1, step 0 has its right-hand boundary at 1. Table 2 reports the unnonnalized length (called "area") of an iteration step. For example, for p = I/?, in period 2, the area of numbers above the mean is 73, since on average, over all
sessions the mean of the previous period (r) is 27.
Medlan Mean Median Mean Median
35 17 9 3
32.9 20.3 16.7 8.3
28 18 10 8
36 4 26.5 16.7 8.7
33 20 12.5 8
0.91 0.75 0.7 1 0.76 0.76
least 80 percent of the observations remain within the bounds of iteration step 0 and iter- ation step 3, with the modal frequency (30per-cent or more) at iteration step 2 when the previous period's mean is the reference point.Ix In fact, in periods 1-3, the best reply is within step 2 in at least five of the seven sessions. Within the neighborhood of the mean of the previous period (step 0 ) there are only a few observations, and those frequencies decrease in the 2/1 sessions. The frequency of choices' around iteration step 1, corresponding to the Cournot process, also declines to less than 15 percent in the third and fourth periods. The frequencies with more than three steps are be- low 10 percent, except in period 4 of the '/, sessions. I interpret these results to mean that there is no support for the hypothesis of in- creasing depth of reasoning, since there is no tendency for the majority of the subjects to increase the depth of reasoning beyond step
I X This corresponds to what we called the anticipatory learning process in Section 11. Hence, one might infer that a substantial proportion of subjects believe that the aver- age behavior in period r will be around p times the mean of period r - 1.

1322 THE AMERICAN ECONOMIC REVIEW DECEMBER 1995
TABLE2-RELATIVE FREQL~ENCIES OF PERIOIIS ACCORDINGA N D AREAS 2-4 'TO 'THE STEP-MODEL FOR AGGREGA'TEDDATA
Period 2 Period 3 Period 4
Classification Relative frequency Area Relative frequency Area Relative frequency Area
A. Sessions 1-3 jp = 'IZ):
Higher steps 4.2 2.4 4.2 1 .0 20.8 0.3 Step 3 25.0 2.4 12.5 1 .0 22.9 0.3 Step 2 3 1.3 4.9 60.4 2.0 29.2 0.7 Step 1 27.0 9.6 12.5 3.9 14.5 1.4 Step 0 2.1 7.9 4.1 3.2 4.2 1.1 Above mean,-, 10.4 73.0 6.3 88.9 8.3 96.2
All 100.0 100.0 100.0 100.0 100.0 100.0
B. Sessions 4- 7 ( p = '1,):
Higher steps 7.5 8.9 1.5 5.8 7.5 3.8 Step 3 11.9 4.4 17.9 2.9 25.3 1.9 Step 2 31.3 6.7 46.2 4.3 47.8 2.9 Step 1 20.9 10.0 16.4 6.5 10.4 4.3 Step 0 14.9 6.7 7.5 4.4 3.0 2.9 Above mean, , 13.4 63.3 10.5 76.1 6.0 84.1
All 100.0 100.0 100.0 100.0 100.0 100.0
2.19In the next section I describe the observed (ii) he earned nothing in the previous period, behavior from period 2 to period 4 in a differ- because his chosen number was either be-ent way-by a qualitative learning-direction low or above p times the mean (and not theory. This theory might explain why the mo- the closest to it) . dal frequency of depth of reasoning does not increase. Since there are only a few winners in each
period, data on having chosen the winning C. Adjustment Process Due to Individual number are scarce. Therefore, I exclude those
Experience (for p < 1) choices that led to a positive payoff ( 19 out of 144 [ 13 percent] in the '1, sessions and 23 out
So far, I have categorized behavior into of 201 [ 9 percent] in the 2/, sessions) and pro- classes based on the deviation from the mean pose a simple qualitative learning theory for of the previous period. I now analyze individ- the change of behavior after having faced zero ual adjustments due to individual experience. payoffs.20 There are two possible experiences due to pay- For this purpose, I introduce a parameter offs a player obtained: called the adjustment factor:
( i ) the player gained a share or all of the prize in the previous period, because his an- for t = 1
nouncement was closest to the product of ( 2 ) a,,= p and the mean; or Xtr for t = 2, 3, 41"(mean),- I
" I n periods 2 and 3, step 2 is the modal choice in six "Stahl(1994) compares several learning models. I ap-out of seven sessions; in period 4, this holds in four ses- ply only one learning model, a kind of model that has been sions, and in three sessions, the modal choice is step 3, successfully used in different experimental settings (see tied with step 2 or 4. e.g., Selten and Buchta, 1994).
1323 VOL. 85 NO. 5 NAGEL: UNRAVELING IN GUESSING GAMES
where xi, is the number chosen by player i in period t. Hence, a,, is the relative deviation from the mean of the previous period t - 1; the mean is the initial reference point. The adjustment fac- tor for period 1 is the choice in period 1 divided by 50, where 50 is the initial reference point, as mentioned in Subsection IV-A. The retrospec- tive "optimal" adjustment factor in period t is defined as the optimal deviation from the mean of period t - 1 that leads t o p times the mean of period t:
( for t = 1
( 3 ) a,,t.,= { Xopt.r - P X (mean 1,
-
( m e a n ) , , ( m e a n ) , ,
( for t = 2, 3, 4.
The idea of this simple learning-direction theory is that in an ex post reasoning process a player compares his adjustment factor a, with the optimal adjustment factor a,,,,,,. In the next period he most likely adapts in the direction of the optimal adjustment factor. Thus, he reflects which deviation from the previous initial ref- erence point would have been better:
( 4 ) if a, > a,,,,, =, a, + I < a,
if a, < a,,,,,, * a, + > a,.
In words, if he observed that his chosen num- ber was above p-times the mean in the previ- ous period ( i.e., his adjustment factor was higher than the optimal adjustment factor), then he should decrease his rate; if his number was below p times the mean (i.e., his adjust- ment factor was lower than the optimal ad- justment factor), he should increase his adjustment factor.
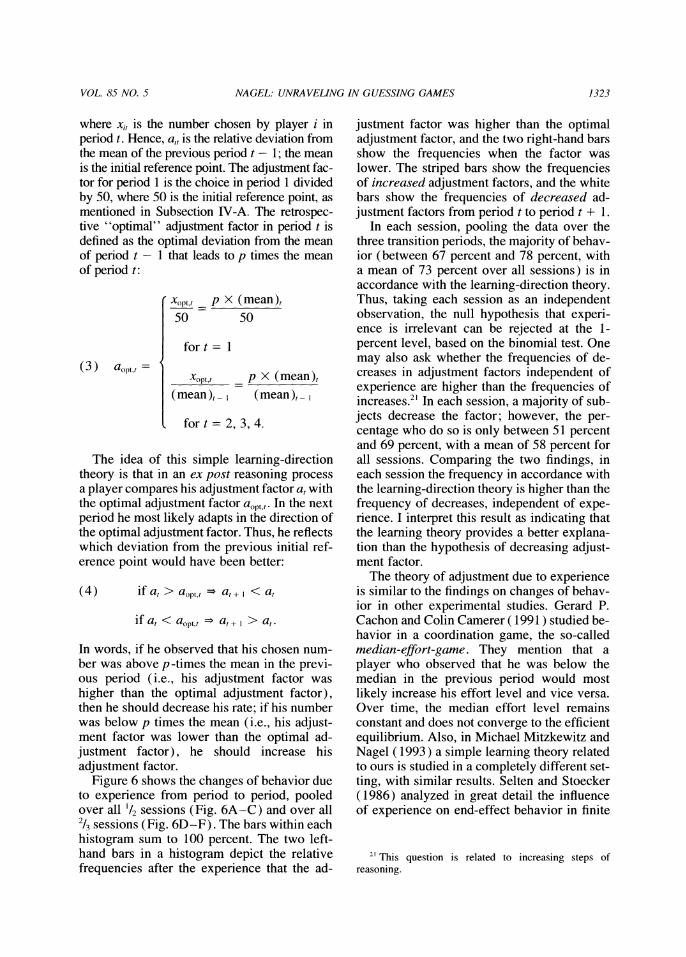
Figure 6 shows the changes of behavior due to experience from period to period, pooled over all '1, sessions (Fig. 6A-C) and over all 'Iisessions (Fig. 6D-F). The bars within each histogram sum to 100 percent. The two left- hand bars in a histogram depict the relative frequencies after the experience that the ad-
justment factor was higher than the optimal adjustment factor, and the two right-hand bars show the frequencies when the factor was lower. The striped bars show the frequencies of increased adjustment factors, and the white bars show the frequencies of decreased ad- justment factors from period t to period t + 1.
In each session, pooling the data over the three transition periods, the majority of behav- ior (between 67 percent and 78 percent, with a mean of 73 percent over all sessions) is in accordance with the learning-direction theory. Thus, taking each session as an independent observation, the null hypothesis that experi- ence is irrelevant can be rejected at the 1-percent level, based on the binomial test. One may also ask whether the frequencies of de- creases in adjustment factors independent of experience are higher than the frequencies of increase^.^' In each session, a majority of sub-
jects decrease the factor; however, the per- centage who do so is only between 5 1 percent and 69 percent, with a mean of 58 percent for all sessions. Comparing the two findings, in each session the frequency in accordance with the learning-direction theory is higher than the frequency of decreases, independent of expe- rience. I interpret this result as indicating that the learning theory provides a better explana- tion than the hypothesis of decreasing adjust- ment factor.
The theory of adjustment due to experience is similar to the findings on changes of behav- ior in other experimental studies. Gerard P. Cachon and Colin Camerer ( 1991) studied be- havior in a coordination game, the so-called median-effort-game. They mention that a player who observed that he was below the median in the previous period would most likely increase his effort level and vice versa. Over time, the median effort level remains constant and does not converge to the efficient equilibrium. Also, in Michael Mitzkewitz and Nagel ( 1993) a simple learning theory related to ours is studied in a completely different set- ting, with similar results. Selten and Stoecker (1986) analyzed in great detail the influence of experience on end-effect behavior in finite
" This question is related to increasing steps of reasoning.

1324 THE AMERICAN ECONOMIC REVIEW DECEMBER J995
Adjustment factor in per~od 1 was Adjustment factor in period 1 was
O 6 E. -7 1 I
Adjustment factor in period 2 was ... Adjustment factor In period 2 was
Adjustment factor in perlod 3 was ... Adjustment factor In period 3 was ..
FIGURE6. RELATIVEFREQLJENCIES IN ADJUSI.MEN.T. DLIE EXPERIENCEOF CHANGES FACTORS TO ~ N D I V I D U A L IN THE
PRECEDING A) p = TRANSITION SECOND B) p = 'I2. FROM SECONDPERIOL): 'I2, FROM FIRSTTO PERIOD; TRANSI.I.ION TO THIRDPERIOD; = '1:. TRANSITION FOUR.~H D) y TRANSITIONC) p PROM T H I R D . I , ~ PERIOD: = 'I3,
FROM FIRSTTOS t i c o ~ ~ E) p FROM SECOND PL..RIOL>;PHRIOD; = ' I7 , TRANSITION TO THIRL) F) y = ' I7 , TRANSITION THIRD PERIOL-)PROV TO FOURTH

1325 VOL. 85 NO. 5 NAGEL: UNRAVELING IN GUESSING GAMES
prisoner's-dilemma supergames. Thus for different games, similar kinds of adjustment processes have been used to explain behavior. However, the dynamics of the behavior can be quite different: in some games there is a con- vergence toward an equilibrium, whereas in others, the adjustment process may not lead to an (efficient) equilibrium.
V. Summary
My analysis of behavior in an abstract game leads me to believe that the structure of the game is favorable for the study of thought pro- cesses of actual players. In the first period the behavior deviates strongly from game- theoretic solutions. Furthermore, the distribu- tion of the chosen numbers over the [O, 1001 interval in sessions with different parameters were significantly different. I have proposed a theory of boundedly rational behavior in which the "depths of reasoning" are of im- portance. The results indicate that, starting from initial reference point 50, iteration steps 1 and 2 play a significant role, that is, most of the observations are in the neighborhood of 50p or 50p2,independent of the parameter p. This result accounts for the difference of the distributions of the chosen numbers for differ- ent parameter values p .
Thus, the theory of boundedly rational be- havior for the first period deviates in several ways from the game-theoretic reasoning :
( i ) I suggested that the "reference point" or starting point for the reasoning process is 50 and not 100. The process is driven by iterative, naive best replies rather than by an elimination of dominated strategies.
(ii) The process of iteration is finite and not infinite.
(iii) I apply the same theory for p > 'I and p < 1, whereas game-theoretic reasoning is different for those parameter sets.
Over time the chosen numbers approach an equilibrium or converge to it. In the 4/3 ses-sions, the choice 100 is the best reply in all periods but the first. In the third and fourth period more than 50 percent of the subjects choose this strategy. In the sessions with p < 1, there is a moving target, which approaches
zero. I apply the theory of first-round behav- ior also to the subsequent periods 2-4, using as the initial reference point the mean of the previous period. I find that the modal choices are around iteration step 2, and the majority of observations remain below step 3. In most sessions, the best reply is within step 2 in periods 1-3. I cannot accept the hypothesis of increasing iteration steps, and I suggest that another explanation of the observed be- havior may be more adequate for periods 2-4. I propose a qualitative learning-direction theory which predicts that a subject tends to increase his adjustment factor in the direction of the optimal adjustment factor if it was below the optimal one and tends to decrease the adjustment factor if it was above the optimal one. A similar kind of simple learning theory has been applied suc- cessfully in other experiments.
REFERENCES
Aumann, Robert. "Irrationality in Game The- ory," in Partha Dasgupta, Douglas Gale, Oliver Hart, and Eric Maskin, eds., Eco-nomic analysis of markets and games. Cambridge, MA: MIT Press, 1992, pp. 214-27.
Bacharach, Michael. "Backward Induction and Beliefs about Oneself." Synthese, June 1992,91(3) ,pp. 247-84.
Bicchieri, Cristina. Rationality and coordina- tion. Cambridge: Cambridge University Press, 1993.
Binmore, Kenneth. "Modeling Rational Play- ers, Part I." Economics and Philosophy, October 1987, 3 , pp. 179-214.
. "Modeling Rational Players, Part 11." Economics and Philosophy, April 1988,4(3) ,pp. 9-55.
Cachon, Gerard P. and Camerer, Colin. "The Sunk Cost Fallacy, Forward Induction, and Behavior in Coordination Games." Work-ing paper, University of Pennsylvania, 1991.
Cournot, Antoine A. "Recherches sur les Prin- cipes MathCmatiques de la ThCorie de Ri- chesses." 1838. Translated by N. T. Bacon, Researches into the mathematical principles of the theory of wealth. London: Hafner, 1960.

1326 THE AMERICAN ECONOMIC REVIEW DECEMBER 1995
Duffy, John and Nagel, Rosemarie. "On the Ro- bustness of Behavior on Experimental Guessing Games." Mimeo, University of Pittsburgh, 1995.
Frydman, Roman. "Towards an Understanding of Market Processes: Individual Expec-tations, Learning, and Convergence to Rational Expectations Equilibrium." Amer-ican Economic Review, September 1982, 72(4), pp. 652-68.
Keynes, John M. The general theory of interest, employment and money. London: Macmil- lan, 1936.
McKelvey, Richard and Palfrey, Thomas. "An Experimental Study of the Centipede Game." Econometrics, July 1992, 60(4) , pp. 803-36.
Mehta, Judith; Starmer, Chris and Sudgen, Robert. "The Nature of Salience: An Ex- perimental Investigation of Pure Coordina- tion Games." American Economic Review, June 1994,84(3), pp. 658-73.
Mitzkewitz, Michael and Nagel, Rosemarie. "Ex-perimental Results on Ultimatum Games with Incomplete Information." Interna-tional Journal of Game Theory, 1993, 22(2) , pp. 171-98.
Moulin, HervC. Game theory for social sci- ences. New York: New York Press, 1986.
Nagel, Rosemarie. "Experimental Results on Interactive, Competitive Guessing." Dis-cussion Paper No. B-236, University of Bonn, 1993.
Ochs, Jack. "Coordination Problems," in John Kagel and Alvin E. Roth, eds., Handbook of experimental economics. Princeton, NJ: Princeton University Press, 1995, pp. 195- 252.
Prasnikar, Vesna and Roth, Alvin E. "Consid-erations of Fairness and Strategy: Experi- mental Data from Sequential Games." Quarterly Journal of Economics, August 1992, 107, pp. 865-88.
Rosenthal, Robert. "Games of Perfect Infor- mation, Predatory Pricing, and the Chain Store Paradox." Journal of Economic The- ory, August 1981, 25(1), pp. 92- 100.
Roth, Alvin E. and Erev, Ido. "Learning in Extensive-Form Games: Experimental Data and Simple Dynamic Models in the Inter- mediate Term." Games and Economic Be- havior, January 1995, 8 ( 1 ), pp. 164-212.
Roth, Alvin E.; Prasnikar, Vesna; Okuno-Fujiwara, Masahiro and Zamir, Shmuel. "Bar-gaining and Market Behavior in Jerusalem, Ljubljana, Pittsburgh, and Tokyo: An Exper- imental Study." American Economic Review, December 1991, 81(5), pp. 1068-95.
Roth, Alvin E. and Xing, Xiaolin. "Jumping the Gun: Imperfections and Institutions Related to the Timing of Market Transactions." American Economic Review, September 1994, 84(4), pp. 992- 1044.
Schelling, Thomas C. The strategy of conJlict. Cam-bridge, MA: Harvard University Press, 1960.
Selten, Reinhard. ' 'Reexamination of the Perfect- ness Concept for Equilibrium Points in Exten- sive Games." International Journal of Game Theory, 1975, 4(1), pp. 25-55.
. "Anticipatory Learning in Two-Person Games," in R. Selten, ed., Game equilibrium models I . Berlin: Springer Ver- lag, 1991, pp. 98-154.
Selten, Reinhard and Buchta, Joachim. "Experimen-tal Sealed Bid First Price Auction with Directly Observed Bid Functions." Discussion Paper No. B-270, University of Bonn, 1994.
Selten, Reinhard and Stoecker, Rolf. "End Behav- ior in Sequences of Finite Prisoner's Dilemma Supergames: A Learning Theory Approach." Journal of Economic Behavior and Organi- zation, March 1986, 7( 1), pp. 47-70.
Simonsen, Mario H. "Rational Expectations, Game Theory, and Inflationary Inertia," in P. W. Anderson, Kenneth J. Arrow, and David Pines, eds., The economy as an evolv- ing complex system, Vol. 5. Redwood City, CA: Addison-Wesley, 1988, pp. 205-41.
Stahl, Dale 0 . "The Evolution of Smart,, Play- ers." Games and Economic Behavior, Oc-tober 1993,5(4), pp. 604-17.
. "Rule Learning in a Guessing Game." Worlilng paper, University of Texas, 1994.
Stahl, Dale 0 . and Wilson, Paul W. "Experimen-tal Evidence on Players' Models of Other Players." Journal of Economic Behavior and Organization, December 1994, 25 (3), pp. 309-27.
Van Huyck, John B.; Battalio, Raymond C. and Beil, Richard 0 . "Tacit Coordination Games, Strategic Uncertainty, and Coordination Failure." American Economic Review, March 1990,80( 1 ),pp. 234-48.

You have printed the following article:
Unraveling in Guessing Games: An Experimental StudyRosemarie NagelThe American Economic Review, Vol. 85, No. 5. (Dec., 1995), pp. 1313-1326.Stable URL:
http://links.jstor.org/sici?sici=0002-8282%28199512%2985%3A5%3C1313%3AUIGGAE%3E2.0.CO%3B2-V
This article references the following linked citations. If you are trying to access articles from anoff-campus location, you may be required to first logon via your library web site to access JSTOR. Pleasevisit your library's website or contact a librarian to learn about options for remote access to JSTOR.
[Footnotes]
2 Towards an Understanding of Market Processes: Individual Expectations, Learning, andConvergence to Rational Expectations EquilibriumRoman FrydmanThe American Economic Review, Vol. 72, No. 4. (Sep., 1982), pp. 652-668.Stable URL:
http://links.jstor.org/sici?sici=0002-8282%28198209%2972%3A4%3C652%3ATAUOMP%3E2.0.CO%3B2-1
3 Jumping the Gun: Imperfections and Institutions Related to the Timing of MarketTransactionsAlvin E. Roth; Xiaolin XingThe American Economic Review, Vol. 84, No. 4. (Sep., 1994), pp. 992-1044.Stable URL:
http://links.jstor.org/sici?sici=0002-8282%28199409%2984%3A4%3C992%3AJTGIAI%3E2.0.CO%3B2-T
7 The Nature of Salience: An Experimental Investigation of Pure Coordination GamesJudith Mehta; Chris Starmer; Robert SugdenThe American Economic Review, Vol. 84, No. 3. (Jun., 1994), pp. 658-673.Stable URL:
http://links.jstor.org/sici?sici=0002-8282%28199406%2984%3A3%3C658%3ATNOSAE%3E2.0.CO%3B2-U
http://www.jstor.org
LINKED CITATIONS- Page 1 of 3 -
NOTE: The reference numbering from the original has been maintained in this citation list.

9 Tacit Coordination Games, Strategic Uncertainty, and Coordination FailureJohn B. Van Huyck; Raymond C. Battalio; Richard O. BeilThe American Economic Review, Vol. 80, No. 1. (Mar., 1990), pp. 234-248.Stable URL:
http://links.jstor.org/sici?sici=0002-8282%28199003%2980%3A1%3C234%3ATCGSUA%3E2.0.CO%3B2-U
References
Towards an Understanding of Market Processes: Individual Expectations, Learning, andConvergence to Rational Expectations EquilibriumRoman FrydmanThe American Economic Review, Vol. 72, No. 4. (Sep., 1982), pp. 652-668.Stable URL:
http://links.jstor.org/sici?sici=0002-8282%28198209%2972%3A4%3C652%3ATAUOMP%3E2.0.CO%3B2-1
An Experimental Study of the Centipede GameRichard D. McKelvey; Thomas R. PalfreyEconometrica, Vol. 60, No. 4. (Jul., 1992), pp. 803-836.Stable URL:
http://links.jstor.org/sici?sici=0012-9682%28199207%2960%3A4%3C803%3AAESOTC%3E2.0.CO%3B2-J
The Nature of Salience: An Experimental Investigation of Pure Coordination GamesJudith Mehta; Chris Starmer; Robert SugdenThe American Economic Review, Vol. 84, No. 3. (Jun., 1994), pp. 658-673.Stable URL:
http://links.jstor.org/sici?sici=0002-8282%28199406%2984%3A3%3C658%3ATNOSAE%3E2.0.CO%3B2-U
Considerations of Fairness and Strategy: Experimental Data From Sequential GamesVesna Prasnikar; Alvin E. RothThe Quarterly Journal of Economics, Vol. 107, No. 3. (Aug., 1992), pp. 865-888.Stable URL:
http://links.jstor.org/sici?sici=0033-5533%28199208%29107%3A3%3C865%3ACOFASE%3E2.0.CO%3B2-U
http://www.jstor.org
LINKED CITATIONS- Page 2 of 3 -
NOTE: The reference numbering from the original has been maintained in this citation list.

Bargaining and Market Behavior in Jerusalem, Ljubljana, Pittsburgh, and Tokyo: AnExperimental StudyAlvin E. Roth; Vesna Prasnikar; Masahiro Okuno-Fujiwara; Shmuel ZamirThe American Economic Review, Vol. 81, No. 5. (Dec., 1991), pp. 1068-1095.Stable URL:
http://links.jstor.org/sici?sici=0002-8282%28199112%2981%3A5%3C1068%3ABAMBIJ%3E2.0.CO%3B2-M
Jumping the Gun: Imperfections and Institutions Related to the Timing of MarketTransactionsAlvin E. Roth; Xiaolin XingThe American Economic Review, Vol. 84, No. 4. (Sep., 1994), pp. 992-1044.Stable URL:
http://links.jstor.org/sici?sici=0002-8282%28199409%2984%3A4%3C992%3AJTGIAI%3E2.0.CO%3B2-T
Tacit Coordination Games, Strategic Uncertainty, and Coordination FailureJohn B. Van Huyck; Raymond C. Battalio; Richard O. BeilThe American Economic Review, Vol. 80, No. 1. (Mar., 1990), pp. 234-248.Stable URL:
http://links.jstor.org/sici?sici=0002-8282%28199003%2980%3A1%3C234%3ATCGSUA%3E2.0.CO%3B2-U
http://www.jstor.org
LINKED CITATIONS- Page 3 of 3 -
NOTE: The reference numbering from the original has been maintained in this citation list.