Unpacking educational inequality in the NT Professor Sven Silburn* & Steve Guthridge**, John...
18
Unpacking educational inequality in the NT Professor Sven Silburn* & Steve Guthridge**, John McKenzie*, Lilly Li** & Shu Li** * Centre for Child Development and Education Menzies School of Health Research, Darwin, NT ** Health Gains Planning NT Department of Health, Darwin, NT
-
Upload
anne-jarvis -
Category
Documents
-
view
213 -
download
0
Transcript of Unpacking educational inequality in the NT Professor Sven Silburn* & Steve Guthridge**, John...

Unpacking educational inequality in the NT
Professor Sven Silburn* & Steve Guthridge**, John McKenzie*, Lilly Li** & Shu Li**
* Centre for Child Development and Education Menzies School of Health Research, Darwin, NT
** Health Gains Planning NT Department of Health, Darwin, NT

AIM
How can existing data be used to enable a more integrated understanding of educational inequality in the NT?

NAPLAN Year 3 Reading (2013)
48% of NT Indigenous students had NAPLAN scoresat or below the national minimum standard in 2013

Progress towards CtG targets:NAPLAN Year 3 reading at or above NMS
20
30
40
50
60
70
80
90
100
2008 2009 2010 2011 2012 2013 2014 2015 2016 2017 2018
% a
t o
r ab
ove
NM
S
On track to meet the CtG Target by 2016
Non-Indigenous (National)
Indigenous (National)
Indigenous (NT)By 2018 the % of NT Indigenous children above NMS will have doubled but this will still be far below the CTG target

1. How important is the current policy focus on attendance?

Students’ attendance history: Children born in the NT 1994-2004 (N=6,448)
% of expected attendance % of expected attendance
Non-Indigenous students Indigenous students

2. How much does “Place” matter in shaping attendance and achievement?

Community socio-demographic differences:% adults speaking English by % with yr 10 ed.
u
n

Relative influence of community factors associated with remote school attendance
Mean weekly household income
% Adults with year 10 education
% population aged < 15 years
Mean number of people per bedroom
% Adults who speak English only
Community remoteness (ARIA)
% Population who are Indigenous
% Community SES (ICSEA)
0.49
0.14
0.11
0.09
0.08
0.05
0.03
0.01

3. How do early childhood development outcomes shape subsequent school
achievement?
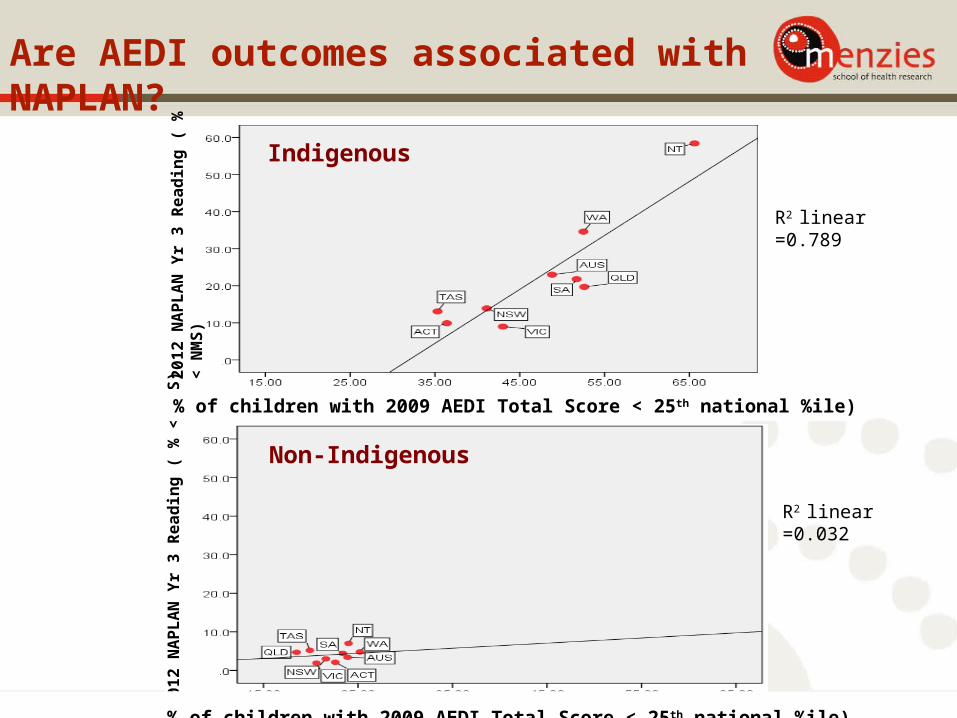
Are AEDI outcomes associated with NAPLAN?
2012
NA
PLA
N Y
r 3 R
eadi
ng (
% <
NM
S)20
12 N
APL
AN
Yr 3
Rea
ding
( %
< N
MS) Indigenous
% of children with 2009 AEDI Total Score < 25th national %ile)
Non-Indigenous
R2 linear =0.789
R2 linear =0.032
% of children with 2009 AEDI Total Score < 25th national %ile)

Relative influence of remote community factors predictive of 2012 NAPLAN reading < NMS
Mean weekly household income
Mean number of people per bedroom
% Adults with year 10 education
Mean school attendance
% Adults who speak English only
% AEDI vulnerable (2009)
% population aged < 15 years
0.45
0.20
0.14
0.10
0.05
0.04
0.02

4. Do early-life health and socio-demographic factors influence NAPLAN outcomes?

Individual child factors associated with Indigenous Yr 3 reading < NMS
Factor Children
N=4,603 (100%)
Crude Odds Ratio
AdjustedOdds Ratio
Primary carer’s education <year 10 2,022 (43.9%) 4.76 2.77
Age of mother at child’s birth <18yr 718 (15.6%) 1.95 1.92
Primary carers education = year 10 1,190 (25.8%) 2.16 1.78
Male gender 2,393 (51.9%) 1.31 1.40
Smoking in pregnancy 1,951 (42.3%) 1.03 1.36
Low birth weight 581 (12.6%) 1.45 1,24
First live birth 1,074 (23.3%) 1.03 1.36
Gestation < 37 weeks 609 (13.2%) 1.55 1.18
Multivariate logistic regression: Crude and adjusted risks for NAPLAN Yr 3 Reading below the National Minimum Standard (NMS)
[NT Early Child Development Data-linkage Demonstration Study: Silburn, Lynch, Guthridge & McKenzie]

Relative importance of perinatal health and socio-demographic factors for Indigenous NAPLAN Yr 3 reading
Population Attributable Risk %
Population Attributable Risk is the reduction in incidence if the whole population were unexposed, comparing with actual exposure pattern.

5. How can we derive a more “holistic” understanding of the key drivers of
educational disadvantage?
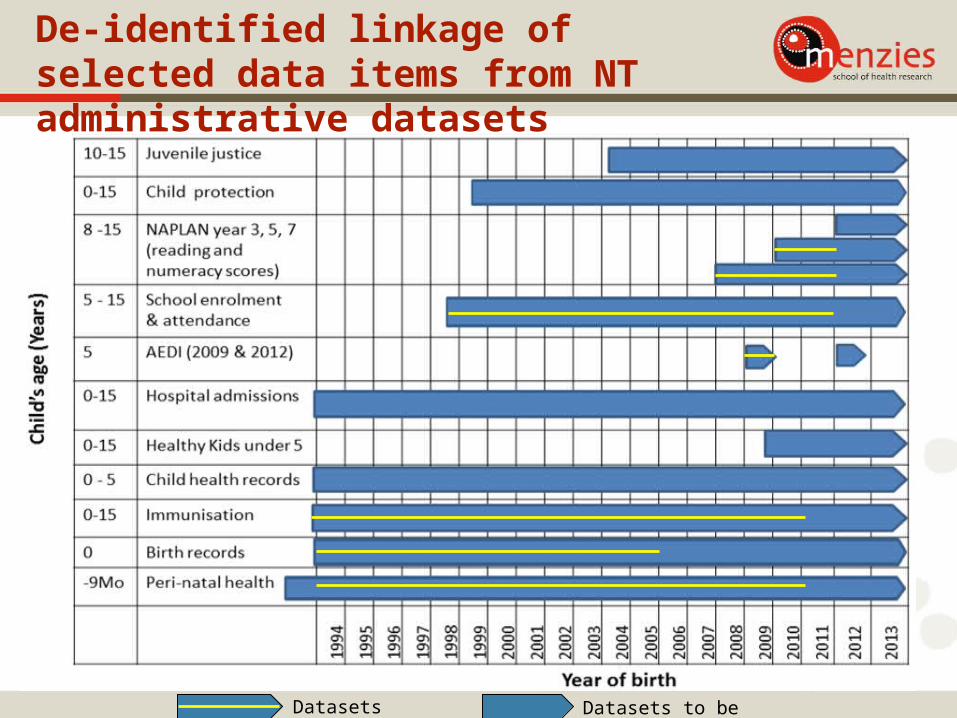
De-identified linkage of selected data items from NT administrative datasets
Datasets already linked Datasets to be linked

Summary
Addressing educational inequality in the NT requires recognition that:
1. School attendance really matters
2. Levels of remoteness vary considerably
3. Community characteristics have significant influence
4. Early-life health & socio-demographic factors also matter
5. Linking child, family, community & school data will assist in identifying key causal pathways and the best leverage points for improving outcomes