Unpacking analyses relying on area-based data: are the assumptions supportable?
12
BioMed Central Page 1 of 12 (page number not for citation purposes) International Journal of Health Geographics Open Access Research Unpacking analyses relying on area-based data: are the assumptions supportable? John Glover* 1 , Diana Rosman 2 and Sarah Tennant 1 Address: 1 Public Health Information Development Unit, The University of Adelaide, South Australia, Australia and 2 Health Information Centre, Department of Health, Royal Street, East Perth, Western Australia, Australia Email: John Glover* - [email protected]; Diana Rosman - [email protected]; Sarah Tennant - [email protected] * Corresponding author Abstract Background: In the absence in the major Australian administrative health record collections of a direct measure of the socioeconomic status of the individual about whom the event is recorded, analysis of the association between the health status, use of health services and socioeconomic status of the population relies an area-based measure of socioeconomic status. This paper explores the reliability of the area of address (at the levels typically available in administrative data collections) as a proxy measure for socioeconomic disadvantage. The Western Australian Data Linkage System was used to show the extent to which hospital inpatient separation rates for residents of Perth vary by socioeconomic status of area of residence, when calculated at various levels of aggregation of area, from smallest (Census Collection District) to largest (postcode areas and Statistical Local Areas). Results are also provided of the reliability, over time, of the address as a measure of socioeconomic status. Results: There is a strong association between the socioeconomic status of the usual address of hospital inpatients at the smallest level in Perth, and weaker associations when the data are aggregated to larger areas. The analysis also shows that a higher proportion of people from the most disadvantaged areas are admitted to hospital than from the most well-off areas (13% more), and that these areas have more separations overall (47% more), as a result of larger numbers of multiple admissions. Of people admitted to hospital more than once in a five year period, four out of five had not moved address by the time of their second episode. Of those who moved, the most movement was within, or between, areas of similar socioeconomic status, with people from the most well off areas being the least likely to have moved. Conclusion: Postcode level and SLA level data provide a reliable, although understated, indication of socioeconomic disadvantage of area. The majority of Perth residents admitted to hospital in Western Australia had the same address when admitted again within five years. Of those who moved address, the majority had moved within, or between, areas of similar socioeconomic status. Access to data about individuals from the Western Australian Data Linkage System shows that more people from disadvantaged areas are admitted to a hospital, and that they have more episodes of hospitalisation. Were data to be available across Australia on a similar basis, it would be possible to undertake research of greater policy- relevance than is currently possible with the existing separations-based national database. Published: 09 December 2004 International Journal of Health Geographics 2004, 3:30 doi:10.1186/1476-072X-3-30 Received: 07 October 2004 Accepted: 09 December 2004 This article is available from: http://www.ij-healthgeographics.com/content/3/1/30 © 2004 Glover et al; licensee BioMed Central Ltd. This is an Open Access article distributed under the terms of the Creative Commons Attribution License (http://creativecommons.org/licenses/by/2.0 ), which permits unrestricted use, distribution, and reproduction in any medium, provided the original work is properly cited.
-
Upload
john-glover -
Category
Documents
-
view
212 -
download
0
Transcript of Unpacking analyses relying on area-based data: are the assumptions supportable?

BioMed Central
International Journal of Health Geographics
ss
Open AcceResearchUnpacking analyses relying on area-based data: are the assumptions supportable?John Glover*1, Diana Rosman2 and Sarah Tennant1Address: 1Public Health Information Development Unit, The University of Adelaide, South Australia, Australia and 2Health Information Centre, Department of Health, Royal Street, East Perth, Western Australia, Australia
Email: John Glover* - [email protected]; Diana Rosman - [email protected]; Sarah Tennant - [email protected]
* Corresponding author
AbstractBackground: In the absence in the major Australian administrative health record collections of a direct measureof the socioeconomic status of the individual about whom the event is recorded, analysis of the associationbetween the health status, use of health services and socioeconomic status of the population relies an area-basedmeasure of socioeconomic status.
This paper explores the reliability of the area of address (at the levels typically available in administrative datacollections) as a proxy measure for socioeconomic disadvantage. The Western Australian Data Linkage Systemwas used to show the extent to which hospital inpatient separation rates for residents of Perth vary bysocioeconomic status of area of residence, when calculated at various levels of aggregation of area, from smallest(Census Collection District) to largest (postcode areas and Statistical Local Areas). Results are also provided ofthe reliability, over time, of the address as a measure of socioeconomic status.
Results: There is a strong association between the socioeconomic status of the usual address of hospitalinpatients at the smallest level in Perth, and weaker associations when the data are aggregated to larger areas.The analysis also shows that a higher proportion of people from the most disadvantaged areas are admitted tohospital than from the most well-off areas (13% more), and that these areas have more separations overall (47%more), as a result of larger numbers of multiple admissions.
Of people admitted to hospital more than once in a five year period, four out of five had not moved address bythe time of their second episode. Of those who moved, the most movement was within, or between, areas ofsimilar socioeconomic status, with people from the most well off areas being the least likely to have moved.
Conclusion: Postcode level and SLA level data provide a reliable, although understated, indication ofsocioeconomic disadvantage of area. The majority of Perth residents admitted to hospital in Western Australiahad the same address when admitted again within five years. Of those who moved address, the majority hadmoved within, or between, areas of similar socioeconomic status.
Access to data about individuals from the Western Australian Data Linkage System shows that more people from disadvantaged areas are admitted to a hospital, and that they have more episodes of hospitalisation. Were data to be available across Australia on a similar basis, it would be possible to undertake research of greater policy-relevance than is currently possible with the existing separations-based national database.
Published: 09 December 2004
International Journal of Health Geographics 2004, 3:30 doi:10.1186/1476-072X-3-30
Received: 07 October 2004Accepted: 09 December 2004
This article is available from: http://www.ij-healthgeographics.com/content/3/1/30
© 2004 Glover et al; licensee BioMed Central Ltd. This is an Open Access article distributed under the terms of the Creative Commons Attribution License (http://creativecommons.org/licenses/by/2.0), which permits unrestricted use, distribution, and reproduction in any medium, provided the original work is properly cited.
Page 1 of 12(page number not for citation purposes)

International Journal of Health Geographics 2004, 3:30 http://www.ij-healthgeographics.com/content/3/1/30
BackgroundThe majority of work in Australia describing the associa-tion between the health status, use of health services andsocioeconomic status of the population uses an area-based measure of socioeconomic status. It is necessary touse a proxy measure (the socioeconomic status of the pop-ulation in the area) because there is no direct measure inthe major administrative health record collections of thesocioeconomic status of the individual about whom theevent is recorded.
However, the application of an area-based measurerequires a number of assumptions, including that peoplewho move do so between, or within, geographic areas ofsimilar socioeconomic status; and that the (often large)areas used in these analyses provide a reliable indicationof the socioeconomic status and health service utilisationof the individuals in the area about whom the event isrecorded. Area level socioeconomic status can also be con-sidered as an independent predictor. For example, anindividual with low socioeconomic status in an area ofhigher socioeconomic status is more likely to have betterhealth outcomes than their counterpart in an area oflower socioeconomic status [1,2]. This aspect is notaddressed in this paper.
In relation to this latter point, Hyndman et al [3] foundthat "Misclassification of individuals to SES groups basedon the basis of postcode caused an underestimation of thetrue relationship between SES and health-related meas-ures. A reduction of this misclassification by using smallerspatial areas, such as CD or census enumeration districts,will provide improved validity in estimating the true rela-tionship." A reduction in strength of correlation withincreasing size of area is consistent with the results of thispaper. In a study of hospitalisations in Michigan, USA,Hofer et al [4] found that 'the impact of socioeconomiccharacteristics on hospitalization rates is consistent whenmeasured by individual or community-level measures'.This is an encouraging finding for those limited to usingarea-based data.
Another limitation of the majority of Australian health-related datasets is that they record events (eg., hospitalinpatient separations, services by general medical practi-tioners), rather than individuals.
The analysis in this report uses the Western AustralianData Linkage System to explore the reliability of area dataas a proxy for socioeconomic disadvantage when analysedfor the relatively large geographic units often used inhealth-related research: it also addresses the limitations ofusing data about events, rather than individuals. It doesthis by examining the extent to which hospital inpatientseparation rates vary, both overall and by socioeconomic
status of area of residence, when calculated at various lev-els of aggregation, from Census Collection District (CD) –the smallest area level for which a measure of socioeco-nomic status is available – to the larger units of postcodeand Statistical Local Area (SLA). Methods applied includethe calculation of correlation coefficients and examina-tion of hospital separation rates by quintile of socioeco-nomic disadvantage of area, separately for events andindividuals.
The report also examines the reliability of the socioeco-nomic status of the address over time, by examining theextent of change in socioeconomic status of area of resi-dence for individuals with repeat hospital episodes over afive year period.
The analysis shows that aggregating data to larger areareduces the gap between the index scores for the most dis-advantaged and least disadvantaged areas, with the great-est impact on the scores for the most disadvantaged areas.This results in an understatement of the extent of disad-vantage in the most disadvantaged areas, as well as anunderstatement in inequality between the most well offand the poorest areas.
ResultsIndividualsOver the five years from 1994 to 1998, a total of 358 948residents of Perth were admitted to a hospital in WesternAustralia on one or more occasion, an average of 71 750individuals admitted per annum. Just over half (53.6%)the individuals admitted were females; 46.4% were males.
The rate of individuals admitted was 16.4% higher forfemales (247.6 separations per 1000 population) than formales, (212.7 separations per 1000 population) (Table1). As can be seen in Figure 1, the rates of males andfemales admitted vary notably by age. For females, thehighest rate is in the 30 to 34 year age group (with a fur-ther three of the five highest female rates between ages 20and 39 years), with the second highest rate in the 80 yearsand over age group. The highest male rate, in the 80 yearsand over age group, is substantially above the next highestmale rates, in the 50 to 69 year age groups.
A total of 358 768 Perth residents had one admission to aWestern Australian hospital over the five years from 1994to 1998, with a further 298 805 people admitted on twoor more occasions (Table 2). The number of people withtwo or more admissions in any period is higher in the ear-lier years, as the more time that passes the greater theopportunity for a second admission. That is, those with afirst admission in 1994 have had more time to record asecond admission than have those with a first admission
Page 2 of 12(page number not for citation purposes)

International Journal of Health Geographics 2004, 3:30 http://www.ij-healthgeographics.com/content/3/1/30
in 1995: thus the greater number with two or more admis-sions in 1994.
Just over half (54.6%) those admitted to hospital had oneadmission over this period, and more than one third(36.0%) had between two and four admissions, togethercomprising 90.6% of those admitted (Table 3).
Females accounted for just over half (53.6%) of thoseadmitted once, compared with 59.7% of those admittedmore than once. For males, the proportions were 46.4%and 40.3%, respectively.
SeparationsThere were 1 665 308 separations of Perth residents fromWestern Australian hospitals, an average of 2.53 separa-tions per person admitted over the five years from 1994 to
Table 1: Perth residents admitted to hospital, by age and sex, at first admission, 1994–98
Rate per 1000
Age Males Females Persons
0–4 185.3 147.2 166.85–9 207.1 168.4 188.310–14 163.5 135.5 149.915–19 201.0 244.4 222.420–24 204.3 288.2 245.625–29 207.8 315.7 261.430–34 212.9 328.1 270.935–39 214.3 282.5 248.840–44 213.4 250.4 232.345–49 214.3 242.4 228.250–54 243.6 270.2 256.555–59 242.6 254.7 248.660–64 252.7 257.5 255.265–69 240.5 241.4 241.070–74 232.2 237.9 235.375–79 237.5 254.8 247.680+ 291.7 283.5 286.2Total 212.7 247.6 230.3
Table 2: Perth residents admitted to hospital, by number of admissions and year of separation, 1994–98
Year Individuals
Oneadmission
Two or moreadmissions
Total
1994 71 566 118 039 189 6051995 68 400 75 830 144 2301996 68 989 52 577 121 5661997 71 917 34 497 106 4141998 77 896 17 862 95 758Total 358 768 298 805 657 573
Table 3: Residents of Perth admitted to hospital, 1994–1998, by number of admissions per person
Admissions per person Number Per cent
1 358 769 54.62–4 236 611 36.05–9 46 377 7.110+ 15 821 2.4Total 657 578 100.0
Perth residents admitted to hospital, by age and sex at first admission, 1994–98Figure 1Perth residents admitted to hospital, by age and sex at first admission, 1994–98. Perth population is at 30 June 1996. Per cent shown is of males and females separately, not for persons.
Page 3 of 12(page number not for citation purposes)

International Journal of Health Geographics 2004, 3:30 http://www.ij-healthgeographics.com/content/3/1/30
1998. Over half (55.1%) of the separations were offemales and 44.9% were of males.
Figure 2 shows the profiles of males and females, by age,for both individuals admitted (as in Figure 1) and separa-tions. For males, the proportion of individuals admitted ishighest at ages 20 to 49 years, dropping away at youngerand older ages, with the latter exhibiting a particularlymarked drop. Total separations for males are generallyhighest at older ages (the highest at ages 70 to 74 years),reflecting the higher number of separations per person.The notable exception is the high proportion of separa-tions in the 0 to 4 year age group. The profile of the pro-portion of females admitted is similar to that for males,although it is somewhat distended at ages 20 to 39 years.The proportion of separations of females at ages 25 to 54years closely follows that for females (individuals)admitted.
The main differences in the profiles of male and femaleseparations are evident at the youngest ages (higher pro-portions of males), from ages 20 to 44 years (higher pro-portions of females) and from 50 to 79 years (higherproportions of males). The ages at which the highest ratesof admissions of individuals and of multiple admissions(the gap between the separations and admitted profiles)occur are clearly visible in the chart.
Unlike the rates for individuals admitted (Table 1, above),the highest rates for separations of both males andfemales occur in the oldest age groups (Table 4). The fivehighest rates for both males and females are in the agegroups 60 to 64 years and over, with male rates higher(and often substantially so) than female rates. Also ofnote is the high rate of separations for females at ages 30to 34 years (1,672.2 admissions per 1000 population):this is the sixth highest rate for females, and is more thantwice the rate for males at the same age (729.5 separationsper 1000 population).
DiscussionEffect of aggregation of areas on disadvantage scoresAs noted, the majority of the analysis by socioeconomicstatus undertaken in the health sector in Australia is areabased, and uses the postcode or SLA as the unit of analysis.This raises the question of the extent to which area basedanalyses at the postcode or SLA level provide a reliableindication of the socioeconomic status and health serviceutilisation of the individuals admitted. This report
Perth residents admitted to hospital and total separations, by age and sex, 1994–98Figure 2Perth residents admitted to hospital and total sepa-rations, by age and sex, 1994–98. Perth population is at 30 June 1996. Per cent shown is of males and females sepa-rately, not for persons.
Table 4: Separations of Perth residents, by age and sex, 1994–98
Rate per 1000
Age Males Females Persons
0–4 989.4 697.9 847.65–9 513.2 379.4 448.010–14 375.3 310.5 343.815–19 443.7 693.4 567.220–24 505.2 1 151.9 823.525–29 630.1 1 562.6 1 093.430–34 729.5 1 672.2 1 203.935–39 747.8 1 411.6 1 083.240–44 780.6 1 175.8 982.245–49 947.6 1 253.0 1 099.050–54 1 289.3 1 528.1 1 405.555–59 1 686.8 1 666.8 1 676.960–64 2 210.8 1 957.6 2 082.665–69 2 859.5 2 356.6 2 598.870–74 3 991.2 2 661.3 3 268.675–79 4 723.2 2 979.7 3 706.780+ 4 823.9 3 086.5 3 667.4Total 1 099.0 1 345.0 1 223.0
Page 4 of 12(page number not for citation purposes)

International Journal of Health Geographics 2004, 3:30 http://www.ij-healthgeographics.com/content/3/1/30
explores the reliability of postcode or SLA level data byexamining the extent to which rates of individuals admit-ted and separations vary when calculated at various levelsof aggregation (CD, postcode and SLA). Ideally, the com-parison would be between the socioeconomic status ofindividuals and of areas; however, the smallest area levelfor which a measure of socioeconomic status is availableis the CD.
Variation in the minimum and maximum Index of Rela-tive Socio-economic Disadvantage (IRSD) scores whencalculated at the CD, postcode and SLA level is strikingand clearly shows the value of the smaller unit in areabased analyses (Table 5). The range at the CD level is froma minimum index score of 532 to a maximum index scoreof 1221, a differential of 2.3 times. When individuals andseparations are analysed by postcode, the range in theIRSD scores is narrower, from 863 to 1168 (a differentialof 1.4). At the SLA level it is slightly lower again (a differ-ential of 1.3). The effect of aggregation to the larger areasis most noticeable in the minimum IRSD score, increasingthe minimum score by 70.5% from the CD level to theSLA level. At the other end of the scale, the maximumscore varies little, dropping by 4.0%. That is, the greatestloss in specificity in the IRSD score is in the most disad-vantaged areas.
Thus, the use of larger area aggregates reduces the gapbetween the index scores for the most disadvantaged andleast disadvantaged areas (thus lessening the extent of ine-quality between these areas), with the greatest impact on
the scores for the most disadvantaged areas (thus under-stating the extent of inequality in these areas). Notably,the difference between the maximum and minimumscores, and the absolute level of the scores, is much lessmarked between the postcode and SLA.
There was a strong association between the IRSD scoresfor CDs and those for postcode of usual address at the firstadmission (a Spearman correlation coefficient of 0.74).The correlations were between CDs grouped to quintilesand postcodes grouped to quintiles, ranked by the IRSD,and not between individual CDs and postcodes. A weakerassociation was found between the quintiles for CDs andthose for SLAs (0.64 for people with one separation and0.63 for people with more than one separation) (Table 6).There was little difference in correlation coefficients forthose who had moved address. Similar Spearman correla-tion coefficients were calculated for raw IRSD scores.
Effect of aggregation of areas on separation ratesData at the CD level for the five years from 1994 to 1998show a variation in rates of individuals admitted from 51442 admissions per 100 000 population in the mostadvantaged areas to 58 130 admissions per 100 000population in the most disadvantaged areas (Table 7).This is a differential of 13%. The differential in separationrates is substantially higher, at 47%, reflecting multipleadmissions.
When data are aggregated to postcode area or SLA, the dif-ferentials in separation rates between Quintile 5 and
Table 5: Range of IRSD scores for area of address of individuals and separations
Variable Median for individuals Minimum Maximum Ratio: Maximum/minimumfor separations
Collection District (1) 1012 532 1221 2.30Postcode (2) 1015 863 1168 1.35Statistical Local Area (3) 1017 907 1174 1.29Ratio of IRSD scores in area (3) to area (1) 1.00 1.70 0.96 ..
Table 6: Spearman correlation coefficients between IRSD of address for individuals (at first discharge) and area level
Variable Area level of first discharge
CD Postcode SLA
Individuals:one separation 1.00 0.74 0.64more than one separation 1.00 0.74 0.63more than one separation & moved address 1.00 0.73 0.62
Page 5 of 12(page number not for citation purposes)

International Journal of Health Geographics 2004, 3:30 http://www.ij-healthgeographics.com/content/3/1/30
Quintile 1 areas are smaller (differentials of 1.23 and1.20, respectively) than at the CD level (a differential of1.47) (Table 7). In the case of postcodes, this is largelybecause of the lower separation rate in Quintile 5 areas(likely to be a result of the process of aggregating CDs),whereas for SLAs it is a combination of a lower separationrate in Quintile 5 areas and a higher rate in Quintile 1areas (likely to be a result of the aggregation process, exac-erbated by the variable size of SLAs – see section titled'Methods, Area' under 'Methods.' The differential in rates
of individuals admitted is the same for data at the SLA andCD level, but higher for postcode areas. These resultsagain reflect the difficulty inherent in producing groups ofapproximately equal populations.
While just over half (54.6%) those admitted to hospitalhad one separation over this period, the proportion variedfrom 56.3% in Quintile 1 to 51.9% in Quintile 5 (Table8). This is as expected, with people from the mostdisadvantaged areas representing a smaller proportion of
Table 7: Residents of Perth admitted to hospital, 1994–1998, by socioeconomic disadvantage of area for selected area levels
Quintile Individuals admitted Separations
CD Postcode SLA CD Postcode SLA
NumberQ1: Least disadvantaged 126 615 123 380 138 127 294 130 303 131 340 294Q2 130 907 123 465 114 244 294 307 326 652 279 537Q3 133 073 126 770 142 107 316 066 328 999 363 908Q4 124 279 128 863 123 199 327 228 328 630 313 879Q5: Most disadvantaged 142 704 155 100 139 901 433 577 377 896 367 690Total 657 578 657 578 657 578 1 665 308 1 665 308 1 665 308
Rate (per 100 000 population)Q1: Least disadvantaged 51 442 48 247 51 950 119 813 120 567 127 986Q2 53 343 48 239 52 235 120 582 129 945 127 810Q3 53 889 48 789 52 656 127 995 126 618 134 841Q4 50 919 51 263 52 564 133 342 128 400 133 920Q5: Most disadvantaged 58 130 61 691 58 491 176 157 147 734 153 728Total 53 547 53 547 53 547 135 607 135 607 135 607Rate ratio: Ratio of rate in Q5 rate in Q1 1.13*** 1.28*** 1.13*** 1.47*** 1.23*** 1.20***
The extent of any inequality is shown by the rate ratio, which expresses the ratio of the rate in Quintile 5 to the rate in Quintile 1; rate ratios indicating differing significantly from 1.0 are shown with * p < 0.05; ** p < 0.01; *** p < 0.001.
Table 8: Number of separations per individual, by socioeconomic disadvantage of area, Perth residents, 1994–1998
Separations per person Quintile 1 Quintile 2 Quintile 3 Quintile 4 Quintile 5 Total
Number1 69 485 69 118 69 960 69 709 80 497 358 7692–4 43 274 43 776 45 566 46 747 57 244 236 6075–9 7 907 7 902 8 449 9 220 12 899 46 37710+ 2 714 2 668 2 793 3 187 4 459 15 821Total 123 380 123 465 126 770 128 863 155 100 657 578
Per cent1 56.3 56.0 55.2 54.1 51.9 54.62–4 35.1 35.5 35.9 36.3 36.9 36.05–9 6.4 6.4 6.7 7.2 8.3 7.110+ 2.2 2.2 2.2 2.5 2.9 2.4Total 100.0 100.0 100.0 100.0 100.0 100.0
Page 6 of 12(page number not for citation purposes)

International Journal of Health Geographics 2004, 3:30 http://www.ij-healthgeographics.com/content/3/1/30
those with one separation and a larger proportion withmore than one separation.
There is a substantial difference in the proportion of thepopulation in Quintiles 5 and 1 having two or more sep-arations (a difference of 38.8%, from a rate of 30 389separations per 100 000 persons in Quintile 5 to 21 897separations per 100 000 persons in Quintile 1): the differ-ential for people having one separation is lower, althoughstill notable at 16.1% (a rate of 32 790 separations per100 000 persons in Quintile 5 and 28 231 separations per100 000 persons in Quintile 1) (Table 9).
The average number of admissions per person for peopleadmitted to hospital on more than one occasion over thefive years to 1998 was 4.4; this varied from 4.2 separationsper person admitted in the least disadvantaged areas to4.7 in the most disadvantaged areas.
Reliability over time of address as a proxy for socioeconomic statusStudies using the address of usual residence as a proxy forsocioeconomic status require two important assumptions.They are that:
• people who move do so within, or between, areas ofsimilar socioeconomic status; and that
• the areas used in an area based analysis (which can varyin size and are quite often large) provide a reliable indica-tion as to the socioeconomic status and use of health serv-ices of the individuals in the area.
Data from the 1996 Census show that 53.5% of Perth'spopulation at the 1996 Census reported that they had adifferent address to that at the previous Census, five yearsearlier [5]. Data were not available to compare the IRSD
of the first and last SLA of address of the Perth populationwho moved. However, almost one quarter (24.0%) ofPerth residents who moved between the 1991 and 1996Censuses moved to an address within the same SLA. Thatis, some 59.3% of the population were in the same SLAafter five years (either moved within the SLA, or did notmove). This is an encouraging statistic for area basedanalyses.
Similarly, almost four out of five people admitted to hos-pital more than once in a five year period had not moved(out of the CD of their address at the first separation) bythe time of their second separation. For example, of the298 809 people admitted to a Perth hospital more thanonce over the five year period 1994 to 1998, over threequarters (78.6%, 64 075 people) had the same address atthe time of the second separation. People were recorded ashaving 'moved' if the CD of their address changedbetween the first and last separation over the period from1994 to 1998. Movement to a different address within aCD was not included.
The following table illustrates, for people with multipleadmissions, the extent of movement by socioeconomicstatus. For this part of the analysis, the CD of first and lastseparation have been allocated to quintiles ofsocioeconomic disadvantage of area, to provide a compar-ison of the extent of movement between different levels ofsocioeconomic status. The construction of the quintiles isdescribed in the section titled 'Methods, Measurement ofsocioeconomic status' under 'Methods.'
Table 10 shows, for people who moved to an address inanother CD, that:
• people from the most well off areas are less likely to havemoved to areas of greatly different socioeconomic status
Table 9: Separations per individual, by socioeconomic disadvantage of area, Perth residents, 1994–1998
Separations per person Quintile 1 Quintile 2 Quintile 3 Quintile 4 Quintile 5 Total Ratio of rates in Q5/Q1
Per cent1 19.4 19.3 19.5 19.4 22.4 100.0 ..2+ 18.0 18.2 19.0 19.8 25.0 100.0 ..Total 18.8 18.8 19.3 19.6 23.6 100.0 ..
Rate per 100 000 population1 28 231 28 165 28 331 28 561 32 790 29 215 1.16***2+ 21 897 22 146 23 006 24 236 30 389 24 332 1.39***Total 50 128 50 311 51 337 52 797 63 180 53 547 1.26***
Average admissions per person with two or more admissionsNumber 4.2 4.1 4.3 4.4 4.7 4.4 1.12***
The extent of any inequality is shown by the rate ratio, which expresses the ratio of the rate in Quintile 5 to the rate in Quintile 1; rate ratios differing significantly from 1.0 are shown with * p < 0.05; ** p < 0.01; *** p < 0.001.
Page 7 of 12(page number not for citation purposes)

International Journal of Health Geographics 2004, 3:30 http://www.ij-healthgeographics.com/content/3/1/30
(ie, changed quintiles) than are those from the most dis-advantaged areas – 40.2% of people in the most advan-taged areas (Quintile 1) remained there, despite movingfrom the CD of their first separation. The proportion inthe most disadvantaged (Quintile 5) areas was a lower30.5%;
• while there is movement right across the socioeconomicprofile, most movement is between adjacent quintiles. Forexample, of the 18 875 people who lived in the most dis-advantaged areas at their first separation (and movedbefore a subsequent admission), 71.2% had moved to aCD in the same or next ranked quintile (Quintiles 5 or 4),with just 4.6% moving to the most advantaged areas. Sim-ilarly, of the 9 537 people in the most well off areas attheir first separation, 63.0% had moved to a CD in thesame or next ranked quintile (Quintiles 1 or 2), with asimilarly low proportion (4.7%) moving to the most dis-advantaged areas;
• the most substantial movement between quintiles wasof people moving from an address rated as Quintile 5 toone rated as Quintile 4 (40.7%); this was marginallyhigher than the proportions moving within Quintiles 4 or1 (40.3% and 40.2%, respectively).
There is a strong association between the quintile of soci-oeconomic disadvantage of area at the first and the lastdischarge when analysed by CD (a correlation coefficientof 0.88) or SLA (a correlation coefficient of 0.89) of usualaddress (Table 11). This supports the earlier finding thatpeople admitted to hospital who had moved between epi-sodes, moved to or within areas of similar socioeconomicstatus. The weaker correlations between CD and SLA (seetable) highlight the loss in specificity of the index scorewhen aggregated to the (larger) SLA level.
ConclusionsThe analysis shows that, for Perth residents admitted tohospital, the use of larger area aggregates reduces the gapbetween the index scores for the most disadvantaged andleast disadvantaged areas, thus understating the extent ofinequality between these areas. The greatest impact ofaggregation of areas is on the scores for the most disad-vantaged areas. This results in an understatement of theextent of disadvantage in the most disadvantaged areas, aswell as an understatement in the extent of inequalitybetween the most well off and the poorest areas.
Further, the analysis shows that a more people from themost disadvantaged areas are admitted to hospital than
Table 10: Residents of Perth admitted to hospital more than once, 1994–1998, who changed address, by socioeconomic disadvantage of area
CD of first separation CD of last separation (%) Total
Quintile 1 Quintile 2 Quintile 3 Quintile 4 Quintile 5 Total Number
Quintile 1 40.2 22.8 16.4 15.9 4.7 100.0 9 537Quintile 2 21.5 24.4 22.9 23.6 7.5 100.0 10 551Quintile 3 12.7 20.3 24.1 32.5 10.5 100.0 11 730Quintile 4 7.8 14.6 22.0 40.3 15.3 100.0 13 298Quintile 5 4.6 9.2 15.0 40.7 30.5 100.0 18 875Total 14.8 16.9 19.6 32.6 16.0 100.0 63,991
Table 11: Correlation coefficients between quintile of socioeconomic disadvantage of area of address of first and last separation, 1994–98
Area of address CD of SLA of
first separation last separation first separation last separation
CD of first separation 1.00 0.88 0.66 0.60CD of last separation 0.88 1.00 0.60 0.65SLA of first separation 0.66 0.60 1.00 0.89SLA of last separation 0.60 0.65 0.89 1.00
Table includes people admitted more than once, who had moved from the CD of their address at their first separation. Area of address shown at various levels of aggregation of areas.
Page 8 of 12(page number not for citation purposes)

International Journal of Health Geographics 2004, 3:30 http://www.ij-healthgeographics.com/content/3/1/30
from the most well-off areas (13% more), and that thesepeople have more separations overall (47% more), as aresult of larger numbers of multiple admissions.
As regards the extent of movement, four out of five peopleadmitted to hospital more than once in a five year periodhad not moved (out of the CD of their address at the firstseparation) by the time of their second separation. Inaddition:
• people from the most well off areas are less likely to havemoved to areas of greatly different socioeconomic statusthan are those from the most disadvantaged areas;
• while there is movement right across the socioeconomicprofile, most movement out of a quintile is to areas inadjacent quintiles; and
• the most substantial movement between quintiles wasof people moving from an address rated as Quintile 5 toan address rated as Quintile 4, although this was onlymarginally higher than the proportions moving withinQuintiles 4 or 1.
In summary, postcode level and SLA level data provide areliable indication of socioeconomic disadvantage ofarea, when compared with CD-level data. That is, the asso-ciation between rates of total separations and individualsadmitted and socioeconomic disadvantage of area evidentat the smallest area level (CD) is also evident in the higherlevel area aggregates of postcode and SLA.
It is reasonable to assume that similar relationships existin other Australian cities, as well as in other health-relatedactivity (eg. visits to general medical practitioners).
Given the widespread use in Australia of area based anal-yses at the postcode and SLA level, and the limitations ofCDs an area level for the analysis of most health datasets,it is important to know that such analyses provide a relia-ble indication of the direction and underlying strength ofthe influence of socioeconomic factors in hospital admis-sions rates.
This is not to imply that the postcode or SLA are the idealareal unit for analysis, nor that data for Collection Districtwould be. The ideal population size for area-level analysisis likely to vary dependent on the number of cases in thedataset under analysis. For datasets with a large number ofcases per capita (eg. services by general medical practition-ers) the number will be smaller than those with a smallnumber of cases per capita (eg. deaths), even with aggre-gation of data over a number of years. May SLAs havemuch larger populations than are necessary to producereliable results; and the populations of most CDs are too
small (see Table 12). HealthWIZ [6], the National SocialHealth Database, comprising among the most widelyavailable small area datasets in Australia, seeks to providehealth service use and health status data for areas withpopulations of approximately 10 000. This is a usefulbenchmark.
It is also clear that data as to socioeconomic position atthe smallest area level possible or, more importantly, ofindividuals, would also be of value. Were data to be avail-able across Australia on a similar basis to that from theWestern Australian Data Linkage System, it would be pos-sible to undertake research of greater policy-relevancethan is currently possible with the existing separations-based national database. Such moves are under consider-ation in several Australian States.
Further, linking data (eg, using probabilistic linkage) forindividuals in the Western Australian Data LinkageSystem to the Australian Bureau of Statistics PopulationCensus has the potential to add considerable value to suchanalyses. For example, it would be possible to examine anindividual's characteristics of education, occupation,labour force status, housing tenure etc., and to moredirectly examine the relationships between the number ofindividuals admitted and total separations and theseimportant socioeconomic variables. Linkage to death reg-istration data would also be valuable in understandingmore about outcomes related to socioeconomic status.This latter example is a possibility under recentlyannounced plans for the ABS to test the linking of 2006Census of Housing and Population data to other datasets,such as deaths registrations, held under their Act. This issimilar to the approach elsewhere, including New Zealand[7]. It is to be hoped that such arrangements can be put inplace in Australia in the near future.
MethodsTerminologyThe report addresses differences in the number of individ-uals admitted and the number of separations theyincurred. These are described as 'individuals', or individu-
Table 12: Number of areas and average population for CDs, postcodes and SLAs in Perth, 1996
Area Number Population
In smallest In largest Average
CD 2,297 15 1 861 535Postal area 105 42 49 551 11 780SLA 37 876 103 736 33 631
Page 9 of 12(page number not for citation purposes)
International Journal of Health Geographics 2004, 3:30 http://www.ij-healthgeographics.com/content/3/1/30
als admitted' and separations (the total number of separa-tions, where an individual may have had one or moreepisodes of hospitalisation over the period of the analy-sis). 'Separation' is the term describing a completed hos-pital episode: it is defined in the section titled 'Glossary,Separation' under 'Glossary.'
Data sourcesDetails of all separations to public and private hospitals inWestern Australia for the five years from 1994 to 1998were extracted from the Western Australian Hospital Mor-bidity Database (HMDS). Any separation records thoughtto belong to the same person had previously been linkedtogether within the Data Linkage System, permitting anal-yses to be performed for both separations and individualpersons. The population used in calculating rates is the1996 Census population.
The analysis has been limited to separations of residentsof Perth, but includes separations occurring at any publicacute or private hospitals in Western Australia.
AreaAreas used in the analysis are the Census Collection Dis-trict (CD), postcode and Statistical Local Area (SLA). SeeGlossary for definitions of CD, postal area and SLA.
The HMDS includes address details for each separationfrom a hospital in Western Australia since 1993. Theseaddresses have been linked to a Western Australian streetaddress database to assign northing and easting points(geo-codes). These points were then assigned to theappropriate 1991 or 1996 CD using the ABS CData96mapping tool. The postcode and SLA of the address werethen determined by allocation of CDs to postcode or SLA.The boundaries for CDs and SLAs are consistent. How-ever, boundaries for CDs and postcodes are not, so CDswere allocated to postcodes on a 'best fit' basis (seeGlossary).
Consequently, comparisons can be made between resultsfor CDs and postcode areas, CDs and SLAs and postcodeareas and SLAs. This is particularly important, as much ofthe area analysis undertaken in the health sector in Aus-tralia uses the postcode or the SLA, as a majority of dataare only available at these area levels, and it is widelyaccepted that the larger the area, the less homogenous thepopulation is likely to be.
There were 2 297 CDs in Perth at the 1996 Census, with105 postcodes and 37 SLAs. The average population sizeat each of these area levels is shown in Table 12; these dataemphasise the variation in size of the areas at each arealevel.
Measurement of socioeconomic statusIn the absence of any direct measure of socioeconomicstatus in the hospital inpatient data, the socioeconomicstatus of the area of the address of the individual admittedis used as a proxy measure. The Index of Relative Socio-Economic Disadvantage (IRSD) is the measure used toprovide the socioeconomic status of the area of theaddress. The IRSD is one of five Socio-Economic Indexesfor Areas (SEIFA) produced by the Australian Bureau ofStatistics (ABS) from data collected at the 1996Population Census. It is calculated at the CD level and canbe produced for other area levels. The postcode and SLAlevel index scores in this report are the populationweighted average of the IRSD scores for the CDs in thepostcode or SLA. This calculation is undertaken for allCDs in the postcode or SLA, not just those for which hos-pital episodes were recorded.
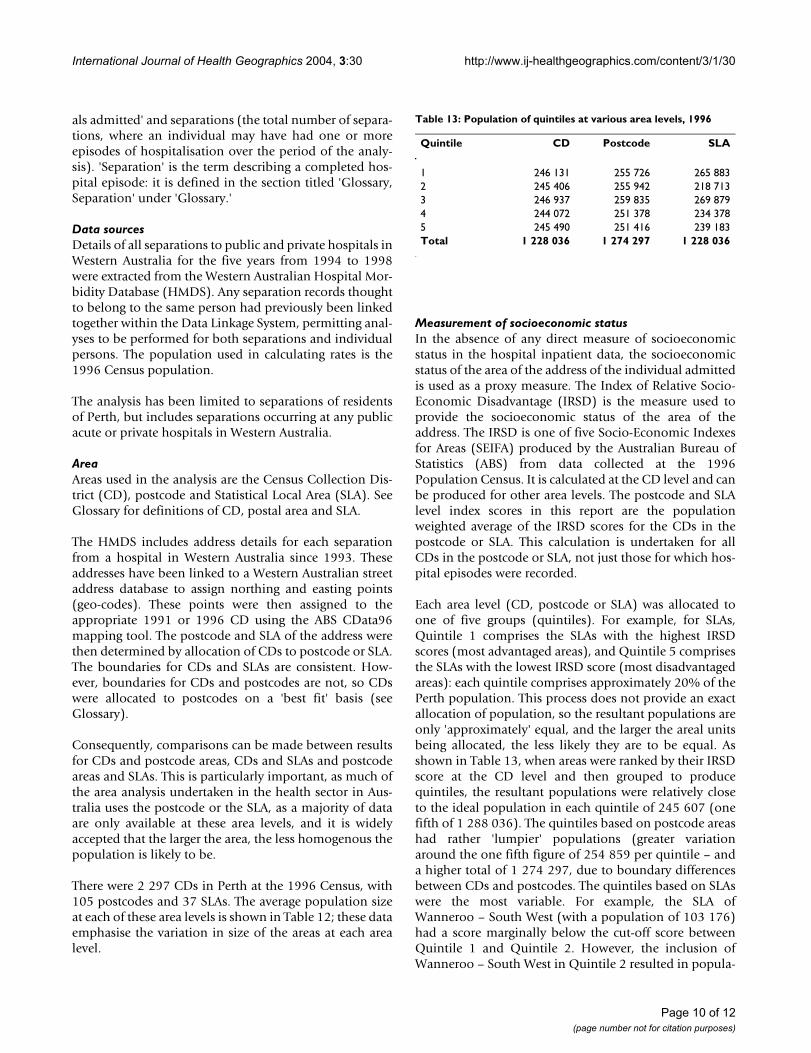
Each area level (CD, postcode or SLA) was allocated toone of five groups (quintiles). For example, for SLAs,Quintile 1 comprises the SLAs with the highest IRSDscores (most advantaged areas), and Quintile 5 comprisesthe SLAs with the lowest IRSD score (most disadvantagedareas): each quintile comprises approximately 20% of thePerth population. This process does not provide an exactallocation of population, so the resultant populations areonly 'approximately' equal, and the larger the areal unitsbeing allocated, the less likely they are to be equal. Asshown in Table 13, when areas were ranked by their IRSDscore at the CD level and then grouped to producequintiles, the resultant populations were relatively closeto the ideal population in each quintile of 245 607 (onefifth of 1 288 036). The quintiles based on postcode areashad rather 'lumpier' populations (greater variationaround the one fifth figure of 254 859 per quintile – anda higher total of 1 274 297, due to boundary differencesbetween CDs and postcodes. The quintiles based on SLAswere the most variable. For example, the SLA ofWanneroo – South West (with a population of 103 176)had a score marginally below the cut-off score betweenQuintile 1 and Quintile 2. However, the inclusion ofWanneroo – South West in Quintile 2 resulted in popula-
Table 13: Population of quintiles at various area levels, 1996
Quintile CD Postcode SLA
1 246 131 255 726 265 8832 245 406 255 942 218 7133 246 937 259 835 269 8794 244 072 251 378 234 3785 245 490 251 416 239 183Total 1 228 036 1 274 297 1 228 036
Page 10 of 12(page number not for citation purposes)

International Journal of Health Geographics 2004, 3:30 http://www.ij-healthgeographics.com/content/3/1/30
tions in Quintile 1 and 2 of 161 707 and 321 889, respec-tively. Moving Wanneroo – South West to Quintile 1 lefta population of 218 713 in Quintile 2 and increased thatin Quintile 1 to 265 883. While these populations are sub-stantially different from the ideal population, they are thebest that can be achieved.
AnalysisThree (different) IRSD scores were added to each hospitalseparation record, based on the CD, postcode or SLA thathad been previously assigned to the address on thatrecord. It should be noted that these IRSD scores wereactually the average score for the particular CD, postcodeor SLA as calculated from 1996 Census data. Quintileranks for each aggregation level were also applied usingpopulation weighting as described above.
For analyses involving multiple admissions, the IRSDvalue used was that for the first separation in the five-yearperiod. These 'first' separations were isolated using theinternal links between separation records for the sameperson and the separation date. Of course, many of these'first' separations could have been preceded by separa-tions occurring before 1994.
Rates are crude rates, per 100 000 population. Ideally thedata would have been standardised (by the indirectmethod). However, access to the source data were limitedand to requested tables, and standardisation was not anoption.
As the data were from a complete enumeration (all admis-sions to hospital), confidence intervals were only calcu-lated for measures of difference (in this case, rate ratios).
The Spearman Rank Correlation has been used in theanalysis to indicate the degree of correlation betweenpairs of variables.
GlossaryCDThe Collection District (CD) is the smallest area level inthe Australian Bureau of Statistics' statistical geographyand is primarily an area used in the five yearly populationcensus.
Index of Relative Socio-Economic DisadvantageThe Index of Relative Socio-Economic Disadvantage(IRSD) is one of five Socio-Economic Indexes for Areasproduced by the Australian Bureau of Statistics at recentpopulation censuses. Produced using Principal Compo-nents Analysis, it summarises information available fromvariables related to education, occupation, income, familystructure, race (the proportion of Indigenous people), eth-nicity (poor proficiency in use of the English language)
and housing. The variables are expressed as percentages ofthe relevant population. The IRSD is available at theCensus Collection District level and was then be calcu-lated for postcodes and SLAs by weighting the CD levelscores by their population. The IRSD is calculated to showthe relativity of areas to the Australian average for the par-ticular set of variables which comprise it; this averagescore is set at 1000. Scores below 1000 indicate areas withrelative disadvantaged populations under this measure,and scores above 1000 indicate areas with relativelyadvantaged populations. The IRSD scores at the CensusCollection District (CD) level have been grouped to postalarea, an area developed by ABS for the presentation ofpopulation counts and other Census data from the five-yearly population censuses to approximate postcodeareas, as the ABS does not collect the postcode at theCensus.
SeparationThe term describing a completed hospital episode is a'separation'. At the time of admission to hospital, the age,sex, address of usual residence and other personal detailsof the patient are recorded. At the end of the episode, atthe time of separation from hospital, details of the epi-sode itself are recorded, including the date, time andmethod of separation (discharge, death or transfer of apatient to another care setting eg. hospital, nursinghome). Consequently, hospital inpatient data collectionsare based on separations.
Postal areaThe postal area is an area developed by ABS for the pres-entation of population counts and other Census datafrom the five-yearly population censuses. It approximatespostcode areas, as the ABS does not collect the AustraliaPost postcode at the Census. Postal areas comprise CensusCollection Districts (CDs) grouped to approximate post-code areas. Where a CD does not fit entirely within a post-code area, it is allocated to the postcode area into whichthe population largely falls. Where a CD covers more thanone postcode area, the total CD population is allocated toone postcode.
The IRSD scores at the Census Collection District (CD)level have been allocated to postal areas as described inthe section titled 'Methods, Index of Relative Socio-Eco-nomic Disadvantage' under 'Methods.'. Similarly, thepostal area of each separation was approximated from theCD of the address.
The term postcode, rather than postal area, is used in thetext, for ease of reading.
PostcodeSee postal area, above.
Page 11 of 12(page number not for citation purposes)

International Journal of Health Geographics 2004, 3:30 http://www.ij-healthgeographics.com/content/3/1/30
Publish with BioMed Central and every scientist can read your work free of charge
"BioMed Central will be the most significant development for disseminating the results of biomedical research in our lifetime."
Sir Paul Nurse, Cancer Research UK
Your research papers will be:
available free of charge to the entire biomedical community
peer reviewed and published immediately upon acceptance
cited in PubMed and archived on PubMed Central
yours — you keep the copyright
Submit your manuscript here:http://www.biomedcentral.com/info/publishing_adv.asp
BioMedcentral
Quintile of socioeconomic disadvantage of areaSee section titled 'Methods, Measurement of socioeco-nomic status' under 'Methods.'
SLAAn SLA in Perth is generally equivalent to a local govern-ment area, with additional codes allocated to local gov-ernment areas split for statistical purposes (mainly localgovernment areas with large populations, split to formSLAs with smaller populations).
AcknowledgementsThe hospital inpatient data on which this analysis was based were drawn from the Western Australian Data Linkage System. The Western Austral-ian Data Linkage System was established in 1995 with three year funding from the Western Australian Lotteries Commission. The system is now jointly funded, managed and staffed by the Department of Health (WA), the University of WA; the Institute for Child Health Research and Curtin Uni-versity of Technology.
Its aim is to link unit records from core Department of Health data collec-tions and other relevant data collections, for the purpose of providing linked data to support health planning, purchasing, evaluation and research.
The data extraction and analysis for this report was undertaken by Diana Rosman, Manager, Data Linkage Unit, Health Information Centre, Depart-ment of Health (Western Australia).
References1. Joshi H, Wiggins R, Bartley M, Mitchell R, Gleave S, Lynch K: Putting
health inequalities on the map: does where you live matter,and why? In In Understanding health inequalities Edited by: Graham H.Buckingham: Open University Press; 2001:143-155.
2. Cesaroni G, Farchi S, Davoli M, Perucci CA: Individual and area-based indicators of socioeconomic status and childhoodasthma. European Respiratory Journal 2003, 22(4):619-24.
3. Hyndman JC, Holman CD, Hockey RL, Donovan RJ, Corti B, Rivera J:Misclassification of social disadvantage based on geographicareas: comparison of postcode and collector's districtanalyses. Int J Epidemiol 1995, 24:165-176.
4. Hofer TP, Wolfe RA, Tedeschi PJ, McMahon LF, Griffith JR: Use ofcommunity versus individual socioeconomic data in predict-ing variation in hospital use. Health Serv Res 1998, 33(2 Pt1):243-59.
5. Australian Bureau of Statistics: 1996 Census Basic CommunityProfile. In Table B01 Selected Characteristics ABS Canberra; 1998.
6. HealthWIZ [http://www.prometheus.com.au/html_control/index_frame.htm]
7. New Zealand Census-Mortality Study [http://www.wnmeds.ac.nz/academic/dph/research/nzcms/]
Page 12 of 12(page number not for citation purposes)
http://www.ncbi.nlm.nih.gov/entrez/query.fcgi?cmd=Retrieve&db=PubMed&dopt=Abstract&list_uids=7797339
http://www.ncbi.nlm.nih.gov/entrez/query.fcgi?cmd=Retrieve&db=PubMed&dopt=Abstract&list_uids=7797339
http://www.ncbi.nlm.nih.gov/entrez/query.fcgi?cmd=Retrieve&db=PubMed&dopt=Abstract&list_uids=7797339
http://www.ncbi.nlm.nih.gov/entrez/query.fcgi?cmd=Retrieve&db=PubMed&dopt=Abstract&list_uids=9618670
http://www.ncbi.nlm.nih.gov/entrez/query.fcgi?cmd=Retrieve&db=PubMed&dopt=Abstract&list_uids=9618670