Unmet Need and the Demand for Family Planning in Uganda
42
UGANDA FURTHER ANALYSIS Unmet Need and the Demand for Family Planning in Uganda Further Analysis of the Uganda Demographic and Health Surveys, 1995-2006
Transcript of Unmet Need and the Demand for Family Planning in Uganda

UGANDA FURTHER ANALYSIS
Unmet Need and the Demand for Family Planning in Uganda
Further Analysis of the Uganda Demographic and Health Surveys, 1995-2006


THE REPUBLIC OF UGANDA
Unmet Need and the Demand for Family Planning in Uganda
Further Analysis of the Uganda Demographic and Health Surveys, 1995-2006
Shane Khan Sarah E.K. Bradley
Joy Fishel Vinod Mishra
August 2008

This report presents findings from a further analysis study undertaken as part of the follow-up to
the 2006 Uganda Demographic and Health Survey (UDHS). Macro International Inc. provided
technical assistance for the project. Funding for the 2006 UDHS and this report was provided by
the U.S. Agency for International Development (USAID) under the terms of Contract No. GPO-
C-00-03-00002-00. Additional financial assistance for the 2006 UDHS was provided by the UK
Department for International Development (DFID), the USAID/Uganda Mission, the President’s
Emergency Plan for AIDS Relief, the Government of Uganda, the Health Partnership Fund, the
United Nations Children’s Fund (UNICEF), the United Nations Population Fund (UNFPA), and
the Government of Japan. The opinions expressed herein are those of the authors and do not
necessarily reflect the views of the USAID.
This report is part of the MEASURE DHS programme, which is designed to collect, analyze, and
disseminate data on fertility, family planning, maternal and child health, nutrition, and
HIV/AIDS.
Additional information about the UDHS can be obtained from the Uganda Bureau of Statistics
(UBOS), Plot 9 Coleville Street, P.O. Box 7186, Kampala, Uganda; Telephone: (256-41)
706000; Fax: (256-41) 237553/230370; Email: [email protected]; Internet: www.ubos.org.
Additional information about the DHS project may be obtained by contacting MEASURE DHS,
Macro International Inc., 11785 Beltsville Drive, Suite 300, Calverton, MD 20705, USA;
Telephone: 301-572-0200; Fax: 301-572-0999; Email: [email protected]; Internet:
http://www.measuredhs.com.
Suggested citation:
Khan, Shane, Sarah E.K. Bradley, Joy Fishel, and Vinod Mishra. 2008. Unmet Need and the
Demand for Family Planning in Uganda: Further Analysis of the Uganda Demographic and
Health Surveys, 1995-2006. Calverton, Maryland, USA: Macro International Inc.
Contents
Tables, Figures, and Maps .................................................................................................. v
Acknowledgements........................................................................................................... vii
Abstract .............................................................................................................................. ix
1 Introduction..................................................................................................................... 1
1.1 Scope of the study ........................................................................................................ 2
2 Data and Methods ........................................................................................................... 4
2.1 Analysis ........................................................................................................................6
2.2 Study limitations........................................................................................................... 6
3 Results............................................................................................................................. 9
4 Conclusions and Recommendations ............................................................................. 25
5 References..................................................................................................................... 27
iii


Tables, Figures, and Maps
Table 1. Percent of women with an unmet need for family planning and the demand for family
planning, by survey year, UDHS 1995-2006..............................................................12 Table 2. Percentage of currently married women with an unmet need for spacing
and for limiting, by urban or rural residence, UDHS 1995-2006 ...............................14 Table 3. Percentage of currently married women with an unmet need for spacing
or limiting, by region, UDHS 1995-2006 ................................................................... 17 Table 4. Differentials in unmet need for family planning among currently married women,
by demographic and other characteristics, UDHS 2006 .............................................19 Table 5. Adjusted effects of selected variables on unmet need for spacing,
limiting and total unmet need among currently married women, UDHS 2006 ..........21 Table 6. Reasons for current nonuse among currently married women with an unmet need,
and intended future nonuse among currently married women with an unmet need
who do not intend to use contraception in the future, UDHS 2006 ............................23 Table 7. Estimated impact of reducing unmet need on fertility among currently
married women, UDHS 2006 .....................................................................................24
Figure 1. Unmet need among currently married women, UDHS 2006........................................ 5 Figure 2. Unmet Need in Uganda, UDHS 1995-2006 ...............................................................10
Map 1. Unmet Need in Uganda, UDHS 1995. ........................................................................ 15 Map 2. Unmet Need in Uganda, UDHS 2000-01 ................................................................... 15 Map 3. Unmet Need in Uganda, UDHS 2006. ........................................................................ 16
v


Acknowledgements
The authors would like to thank Ben Wielgosz for assistance with producing maps and
the reviewers for their comments on the draft. Special thanks are given to the 2006 Uganda
Demographic and Health Survey Technical Working Committee, which provided guidance on
this document, and the United States Agency for International Development, which provided
funding for this project.
vii


Abstract
Uganda is the third fastest growing country in the world. Contraceptive use is low, and
the unmet need for family planning is high. This study examines unmet need in Uganda from
1995 to 2006 using data from three consecutive rounds of the Demographic and Heath Surveys.
The study provides levels, trends, and differentials for unmet need; the factors associated with
unmet need; reasons for contraceptive nonuse; and the likely impact of reducing unmet need. The
results show that unmet need is highest among currently married women, women in rural areas,
and women in the Northern region. Unmet need is increasing among the all-women group,
currently married women, all sexually active women, and never-married sexually active women.
Unmet need remains steady at low levels among never-married women and formerly married
women. Unmet need for spacing is more prevalent than for limiting. Women with an unmet need
for spacing and limiting both tend to have more than two living children. Women with an unmet
need for spacing are more likely to lack employment, live in the Northern region, and not receive
family planning messages in the media while women with an unmet need for limiting, in contrast,
tend to be older and live in rural areas. Total unmet need is associated with higher parity (2 or
more children) and living in the Northern region. Substantial proportions of women do not use,
and do not intend to use, contraception in the future due to the fear of side effects and opposition
from the husband or partner. Based on statistical models, modest declines in unmet need and
increases in contraceptive prevalence in Uganda can substantially reduce the country’s total
fertility rate.
ix


1 Introduction
Uganda has a population of approximately 29.6 million people, of which almost 6 million
are women of reproductive age (15-49 years) (Uganda Bureau of Statistics [UBOS], 2007). The
annual growth rate is approximately 3.2 percent (UBOS, 2006), and the total fertility rate (TFR)
(measured in the 2006 Uganda Demographic and Health Survey [UDHS]) remains high at 6.7
children per woman. As a result, Uganda is the third fastest growing country in the world (United
Nations Population Division [UNPD], 2005).
UDHS results show that only 24 percent of currently married women report current use
of contraception and 41 percent have an unmet need for family planning. Of the countries with a
Demographic and Health Survey (DHS) in the past five years, Uganda has the highest level of
unmet need for family planning among currently married women (Macro International Inc.,
2008a). In 2000-01, the UDHS results showed that approximately two of every five births were
unplanned in the five years preceding the survey (UBOS and ORC Macro, 2001). Using indirect
estimation techniques, the authors of another study found that one in five pregnancies in 2003
ended in an abortion in Uganda (Singh et al., 2005).
Until the mid-1990s, family planning services in Uganda were restricted to married
women accompanied by their husbands or to married women who had their husband’s written
permission to use contraception (Blacker et al., 2005). In 1995, after many other East African
countries had already done so, the Government of Uganda (GOU) created its first national
population policy. The Ugandan Ministry of Finance (MOF) has noted the limited progress of
family planning in Uganda and that Uganda’s traditionally large family sizes ―are now becoming
an impediment to the speed of economic growth and social and structural transformation‖ (MOF,
2004).
Political support for the family planning movement in Uganda appears inconsistent. The
GOU states that it will ―ensure that family planning services are accessible to all those who need
them‖ (MOF, 2004). To ensure access to family planning services, the government has made
several revisions to the 1995 national population policy and included provisions in its poverty
eradication action plan designed to reduce the unmet need for family planning (UDHS, 2006;
MOF, 2004). However, reports from the Ugandan Population Secretariat appear to show that a
growing population could serve as a ―demographic bonus‖ for economic growth (Population
Secretariat, 2006).
The definition of unmet need for family planning was developed and revised over the
past three decades but its basic components have remained essentially unchanged (Westoff, 1978;
Westoff and Pebley, 1981; Westoff and Ochoa, 1991; Westoff, 2006). The concept of unmet need
for family planning is useful for identifying women who may want to use, but are not currently
using, a method of contraception. In the broadest sense, a woman has an unmet need for
contraception if she is not using a method of contraception and wants to wait to have more
children.
The reduction of unmet need has significant outcomes. Studies have found that fulfilling
unmet need helps couples achieve their reproductive intentions and improve broader social,
economic, and developmental measures (Westoff and Bankole, 2002; Casterline and Sinding,
2000; Sedgh et al., 2007). Another study suggests that satisfying unmet need can directly
contribute to reductions in maternal and child mortality—averting an estimated 16,877 maternal
and 1.1 million child deaths worldwide by the year 2015 (U.S. Agency for International
Development (USAID) Health Policy Initiative, 2006).
1

Researchers have identified a number of factors that are related to unmet need and nonuse
of contraception. Higher levels of education among women are associated with higher levels of
contraceptive use, smaller desired family size, and lower levels of unmet need (Lutalo et al.,
2000; Kirk and Pillet, 1998; Kaona et al., 1996; Agyei and Migadde, 1995). One study found that
unmet need for family planning declines with a woman’s educational attainment and work
outside of the home, both measures of female empowerment (Al Riyami et al., 2004). Another
study in Nepal found a significant association between unmet need and gender preference for
male children (Bhandari et al., 2006).
Studies have found that levels of unmet need are highest among the youngest and oldest
women, those who have no children or one child, and those with more than four living children.
These findings highlight two phenomena: high levels of unmet need for spacing among young
women who intend to have more children and high levels of unmet need for limiting among older
women who have reached their desired family size (Mawajdeh, 2007; Korra, 2002). Uganda’s
Ministry of Health (MOH) addressed these needs in its Integrated Reproductive Health
Curriculum by focusing on both women under 20 and premenopausal women over 35 as ―persons
at high-risk who need to be recruited for family planning services‖ (MOH, 2001).
Researchers have identified several reasons why women who do not want to become
pregnant do not use contraceptives. These include little perceived risk of pregnancy, health
concerns about contraceptives and side effects, opposition to use (from husbands, families, and
communities), poor access to and quality of family planning supplies and services, and lack of
information (Ropey et al., 1996; Govindasamy and Boadi, 2000; Westoff, 2001; Drennan, 1998).
One study found that in Uganda’s urban areas, partner opposition to contraception was a
significant cause of unmet need (Wolff et al., 2000). Partner communication about family
planning appears to be associated with increased use and likelihood of future use (Agyei and
Migadde, 1995; Curtis and Westoff, 1996). However, a study in Chad indicated that partner
discussion does not necessarily lead to better knowledge of a partner's contraceptive attitudes and,
therefore, increased spousal discussion may not lead directly to decreases in unmet need (DeRose
et al., 2004).
At the program level, studies have suggested that Uganda’s increasing levels of unmet
need may be attributable to changing fertility intentions—more women want to have a smaller
family or to postpone childbirth—without a similar increase in the supply and availability of
contraceptives (Ashford, 2003; Kaida et al., 2005). More distally, the results of one study
comparing trends in Kenya and Uganda suggested that Uganda’s high level of unmet need may
be due, in part, to slow post-independence economic development and the relatively late start of
the GOU’s efforts to begin promoting family planning through health services (Blacker et al.,
2005).
1.1 Scope of the study
The purpose of this study is to examine levels, differentials, and trends in unmet need and
the demand for family planning among various groups of Ugandan women based on marital
status and sexual activity. The study uses data from three consecutive DHS surveys in Uganda
from 1995, 2000-01, and 2006. The study examines all women; never-married; currently married;
widowed, divorced, or separated (formerly married) women; and all sexually active and never-
married, sexually active women. The study estimates unmet need and its components for all
groups, and for currently married women by urban or rural residence and by region. The study
also explores the effects of various factors on unmet need and reasons for contraceptive nonuse
and intended future nonuse. Finally, the study estimates the potential impact of reducing unmet
2

need on the TFR in Uganda and assesses the programmatic and policy implications of these
findings.
3

2 Data and Methods
Data used in this report are taken from three consecutive rounds of the Uganda
Demographic and Health Surveys (UDHS) conducted in 1995, 2000-01, and 2006. The 1988-89
UDHS was omitted from the analysis because it did not collect some of the key indicators needed
for comparison. The nationally representative DHS surveys collect information from women of
reproductive age (age 15-49). Typically, the DHS surveys use a two-stage sampling method and a
core questionnaire to gather information on population, health, and nutrition issues.
DHS surveys use similar survey methodologies across countries and over time, which
facilitates trend analysis. Detailed information on the DHS survey methodology is available in the
UDHS country reports (Statistics Department [Uganda] and Macro International Inc., 1996;
UBOS and ORC Macro, 2001; UBOS and Macro International Inc., 2007). The samples in the
UDHS are not self-weighting. Therefore, to produce national estimates, the study uses the
individual sample weights provided in the individual data files.
For currently married women, unmet need refers to the percentage of those who are not
currently using a method of family planning and want to stop (further) or postpone childbearing.
Unmet need can be categorized into unmet need for spacing or for limiting. In the broadest sense,
women with an ―unmet need for spacing‖ are not currently using a method of contraception and
want to delay the next birth by at least two years, whereas women with an ―unmet need for
limiting‖ are not currently using a method of contraception and want to stop childbearing.
More specifically, a currently married woman has an unmet need for spacing if she is not
currently using a method, is pregnant or amenorrhoeic and the current pregnancy/last birth was
mistimed, or the current pregnancy/last birth was unwanted, and the woman now wants to wait
before having another child. Similarly, women who are currently married, are not currently using
a method of contraception, are fecund, and want to wait for two or more years before having
another child have an unmet need for spacing.
A currently married woman has an unmet need for limiting if she is not using a method of
contraception, is pregnant or amenorrhoeic, and has an unwanted birth (does not want her current
pregnancy or wants no more children). The unmet need for limiting among currently married
women also includes women who are not using a method, who are not using or are amenorrhoeic,
who are fecund, and who want no more children. Details on unmet need (including unmet need
for spacing and unmet need for limiting) among currently married women are provided in Figure
1. Total unmet need is the sum of unmet need for spacing and for limiting.
The ―total demand‖ is the sum of the total unmet need and total current use. The
percentage of total demand satisfied is calculated by dividing the total current use by the total
demand. The unmet need for modern methods is the sum of total unmet need and the percentage
using traditional methods (Westoff, 2006). The percent of total demand satisfied by modern
methods is calculated by dividing the current use of modern methods by the total demand.
4

Figure 1. Unmet need among currently married women, UDHS 2006
Currently married women who
are not using a method
76%
Pregnant or Amenorrhoeic 43% Not Pregnant or Amenorrhoeic 34%
Intended
20%
Mistimed
17%
Unwanted
6%
Fecund
29%
Infecund
5%
Want Later
8%
Want no more
11%
Want Soon
10%
Need for
Limiting
6%
Need for
Spacing
17%
Need for
Limiting
11%
Need for
Spacing
8%
Total Unmet Need 41%
Note: Only major categories used to define unmet need are shown in the figure.
This analysis uses a different definition of users of the lactational amenorrhoea method
(LAM) than that used in the DHS final reports. The DHS final reports calculate the prevalence of
current use of LAM based solely on the number of women who reported using LAM at the time
of the survey. However, this study defines current users of LAM as women who report LAM use
and who satisfy the following three conditions: being at most six months postpartum, being
amenorrhoeic, and exclusively breastfeeding her child. The study re-categorises women who
report LAM use but do not satisfy these conditions as nonusers of contraception.
In 1995, the UDHS questionnaire did not address LAM use and, consequently, no
changes to contraceptive use and unmet need were necessary. In 2000-01, approximately 3
percent of all women reported using LAM at the time of the survey, but fewer than 20 percent of
these women satisfied the three conditions for LAM use. The study therefore classified less than 1
percent of the women as current LAM users. As a result, the contraceptive prevalence and unmet
need figures presented in this report do not match the figures in the 2000-01 UDHS final report.
In the 2006 UDHS, 0.02 percent of women reported using LAM. Given this small figure, this
study used the reported prevalence figures for contraceptive use and unmet need from the 2006
UDHS report.
This report defines currently married women as women currently in a union or living
with a partner. The term ―sexually active‖ refers to women who have had sexual intercourse in
the past four weeks. Currently working women include those who were working at the time of the
survey or who had worked in the past 12 months. As the DHS surveys do not collect direct
measures of income or expenditure, an index of wealth is created based on the ownership of
household goods and durables (Rutstein and Johnson, 2004). The index divides households into
approximately equal quintiles. The report defines exposure to mass media as having contact with
two or more sources of media, including radio, television, and print media, at least once a week.
5

Women categorised as having partner communication on family planning are women who have
discussed family planning with their partner in the past 12 months. Women who have heard of
family planning on the radio or television or in a newspaper, magazine, video, or film in the past
six months are categorised as having heard of family planning in the media.
2.1 Analysis
The analysis for this study uses both descriptive and multivariate logistic methods. All
analysis is done for women age 15-49. Table 1 categorises women into several groups based on
marital status and sexual activity to identify which women are experiencing changes in unmet
need and its components. The remaining tables include data on currently married women only
because this group has the highest level of unmet need. Table 2 shows unmet need by year and
urban or rural residence, whereas Table 3 shows unmet need by year and geographic region.
Table 4 shows differentials in unmet need.
Two multivariate models are presented in Table 5. The models are designed to explain
the factors associated with unmet need. For the first model, the response variable consists of three
outcomes: the unmet need for spacing (coded as 1), unmet need for limiting (coded as 2), and all
other women (coded as 0). A multinomial multivariate model is used to estimate the effects of
various respondent characteristics on the outcome. Results of this model are presented as relative
risk ratios (RRRs) with p-values. In the second model (also in table 5), the response variable is
dichotomised; women with an unmet need (a combination of spacing and limiting) are coded as 1
and all other women as 0. This model uses a binary logistic regression model to estimate the
effects of respondent characteristics on unmet need. Results are presented as odds ratios (ORs)
with p-values. All tabulations and regression models are estimated using STATA 9.2.
Table 6 presents reasons for current nonuse of contraception and intended nonuse of
contraception in the future. Table 7 provides estimates of the effects of altering unmet need on the
total fertility rate (TFR) of Uganda. Given the high correlation between the contraceptive
prevalence rate (CPR) and TFR, this report estimates a regression equation based on the CPR and
TFR of the 60 developing countries which have most recently conducted a DHS survey. The
outcome of the regression is the TFR, with one intercept, one variable (CPR), and the beta-
coefficient of the CPR variable. The equation used is:
TFR = 6.5020 -0.0561*CPR
Using this equation, the TFR is estimated with five different levels of CPR. Previous
studies have used similar methods (Ross and Frankenberg, 1993). The regression is an estimation
that does not take into account how long each scenario will take to achieve. The estimation
produces plausible changes of TFR with CPR only.
2.2 Study limitations
DHS surveys were conducted in Uganda in 1988-89 (these data were not used in this
study), 1995, 2000-01, and 2006. These surveys used similar sampling methods and survey
instruments to collect data, allowing comparison of indicators over time. However, the
geographic coverage of each survey differs somewhat. The 2006 UDHS was the first survey to
cover the entire country. The districts covered in the 2006 UDHS are as follows (UBOS and
Macro International Inc., 2007):
6
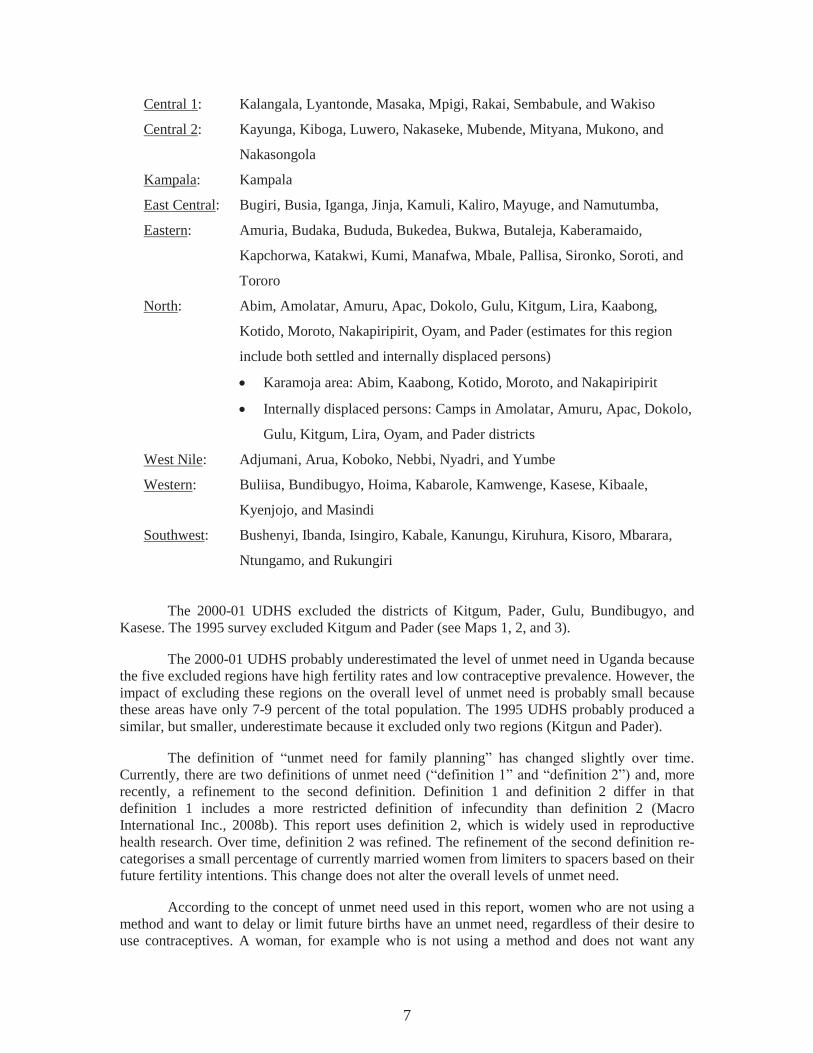
Central 1: Kalangala, Lyantonde, Masaka, Mpigi, Rakai, Sembabule, and Wakiso
Central 2: Kayunga, Kiboga, Luwero, Nakaseke, Mubende, Mityana, Mukono, and
Nakasongola
Kampala: Kampala
East Central: Bugiri, Busia, Iganga, Jinja, Kamuli, Kaliro, Mayuge, and Namutumba,
Eastern: Amuria, Budaka, Bududa, Bukedea, Bukwa, Butaleja, Kaberamaido,
Kapchorwa, Katakwi, Kumi, Manafwa, Mbale, Pallisa, Sironko, Soroti, and
Tororo
North: Abim, Amolatar, Amuru, Apac, Dokolo, Gulu, Kitgum, Lira, Kaabong,
Kotido, Moroto, Nakapiripirit, Oyam, and Pader (estimates for this region
include both settled and internally displaced persons)
Karamoja area: Abim, Kaabong, Kotido, Moroto, and Nakapiripirit
Internally displaced persons: Camps in Amolatar, Amuru, Apac, Dokolo,
Gulu, Kitgum, Lira, Oyam, and Pader districts
West Nile: Adjumani, Arua, Koboko, Nebbi, Nyadri, and Yumbe
Western: Buliisa, Bundibugyo, Hoima, Kabarole, Kamwenge, Kasese, Kibaale,
Kyenjojo, and Masindi
Southwest: Bushenyi, Ibanda, Isingiro, Kabale, Kanungu, Kiruhura, Kisoro, Mbarara,
Ntungamo, and Rukungiri
The 2000-01 UDHS excluded the districts of Kitgum, Pader, Gulu, Bundibugyo, and
Kasese. The 1995 survey excluded Kitgum and Pader (see Maps 1, 2, and 3).
The 2000-01 UDHS probably underestimated the level of unmet need in Uganda because
the five excluded regions have high fertility rates and low contraceptive prevalence. However, the
impact of excluding these regions on the overall level of unmet need is probably small because
these areas have only 7-9 percent of the total population. The 1995 UDHS probably produced a
similar, but smaller, underestimate because it excluded only two regions (Kitgun and Pader).
The definition of ―unmet need for family planning‖ has changed slightly over time.
Currently, there are two definitions of unmet need (―definition 1‖ and ―definition 2‖) and, more
recently, a refinement to the second definition. Definition 1 and definition 2 differ in that
definition 1 includes a more restricted definition of infecundity than definition 2 (Macro
International Inc., 2008b). This report uses definition 2, which is widely used in reproductive
health research. Over time, definition 2 was refined. The refinement of the second definition re-
categorises a small percentage of currently married women from limiters to spacers based on their
future fertility intentions. This change does not alter the overall levels of unmet need.
According to the concept of unmet need used in this report, women who are not using a
method and want to delay or limit future births have an unmet need, regardless of their desire to
use contraceptives. A woman, for example who is not using a method and does not want any
7

children might prefer not to use a method due to the side effects of methods currently available. A
more intuitive concept would be ―unmet demand,‖ which would apply to women who are not
using a method but who would like to use one. The DHS surveys do not collect all of the
information necessary to create this indicator. Specifically, although the surveys collect data on
contraceptive use, they ask women only about their intention to use contraception in the future
and not about their desire to use a method at present. This information can be an area for future
data collection.
The different rates of nonresponse to interviews and specific questions over time could
also bias survey estimates. However, the biases are probably small because the overall
nonresponse rates and the nonresponse rates for variables used in the analysis are low.
8

3 Results
Table 1 shows trends in the components of unmet need for six groups of women: all
women, never-married women, currently married women, formerly married women (widowed,
divorced, or separated), all sexually active women (sexual intercourse in the four weeks
preceding the survey), and never-married, sexually active women.
In 2006, the level of unmet need was highest among currently married women (41
percent) and lowest among never-married women (2 percent) (Table 1). The level of unmet need
has increased steadily over time among all groups of women except never-married women and
formerly married women. The increase was sharpest among currently married women, from 29
percent in 1995 to 41 percent in 2006 (see Figure 2). Among never-married and formerly married
women, unmet need was low in all survey years because the vast majority of these women were
not sexually active and are therefore classified as having ―no need.‖ Among all women, unmet
need increased from 22 percent in 1995 to 27 percent in 2006. The increases in unmet need are
steady and similar among other groups of women. Among currently married women, the increase
is sharper; from 29 percent in 1995 to 41 percent in 2006 (see Figure 2).
9
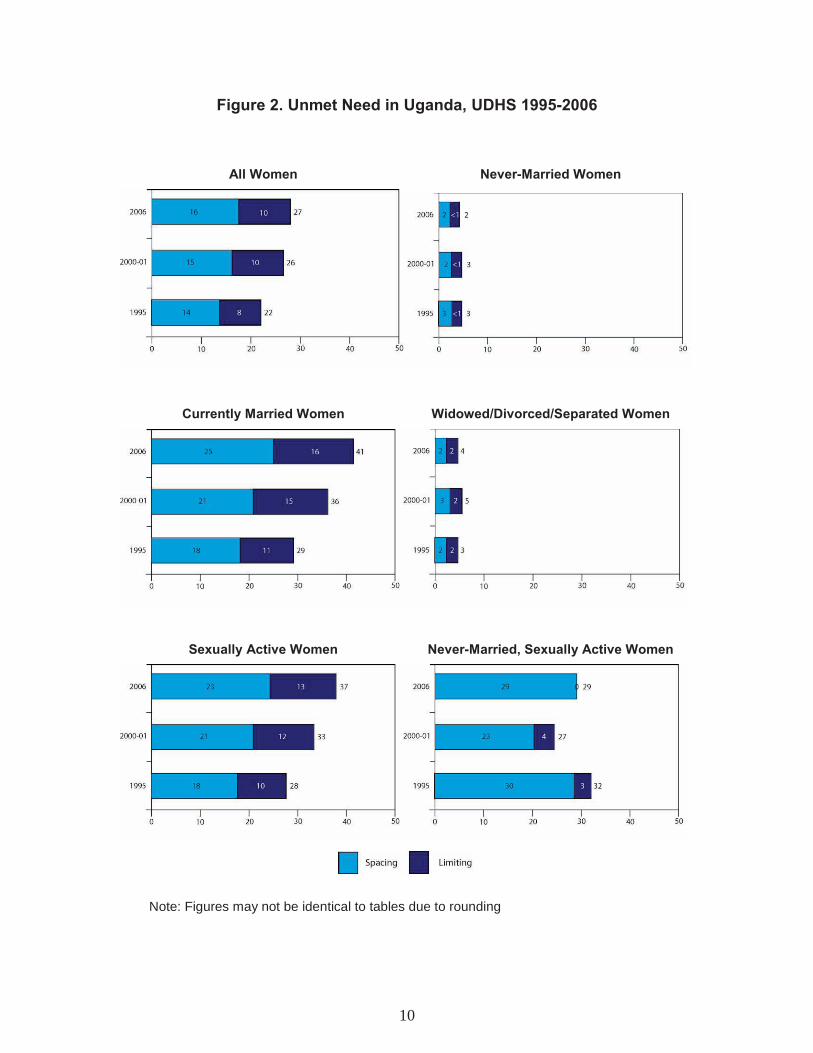
Figure 2. Unmet Need in Uganda, UDHS 1995-2006
All Women Never-Married Women
Currently Married Women Widowed/Divorced/Separated Women
Sexually Active Women Never-Married, Sexually Active Women
Note: Figures may not be identical to tables due to rounding
10

Overall, women in Uganda have a greater unmet need for spacing than limiting, except
for formerly married women, who have similar levels of unmet need for spacing and limiting.
Never-married, sexually active women have the highest level of unmet need for spacing (29
percent), followed by currently married women (25 percent). Unmet need for limiting is highest
among currently married women (16 percent). Unmet need for spacing and limiting increased
among all women, currently married women, and sexually active women between 1995 and 2006.
However, among never-married, sexually active women, unmet need for spacing decreased from
30 percent in 1995 to 23 percent in 2000-01 before climbing again to 29 percent in 2006. Unmet
need for limiting among never-married, sexually-active women increased by 1 percentage point,
from 3 percent in 1995 to 4 percent in 2000-01 and then decreased to less than 1 percent in 2006.
Levels of unmet need for spacing and limiting remained low and unchanged between 1995 and
2006 among never-married and formerly married women.
Contraceptive use is highest among never-married, sexually active women (55 percent),
followed by sexually active women (30 percent), currently married women (24 percent), all
women (20 percent), formerly married women (18 percent), and never-married women (9
percent). Contraceptive use increased from 1995 to 2000-01 among all groups of women and
continued increasing from 2000-01 to 2006 among all groups, except for never-married women
and never-married, sexually active women. Current use of a method declined from 13 percent in
2000-01 to 9 percent in 2006 among never-married women and decreased very slightly from 56
percent to 55 percent among never-married, sexually active women during the same time period.
From 1995 to 2006, levels of contraceptive use for spacing increased among all groups of
women except never-married women and never-married, sexually active women (Table 1).
Current use for spacing increased among never-married women from 8 percent in 1995 to 12
percent in 2000-01 but decreased to 9 percent in 2006. Current use for spacing among never-
married, sexually active women increased from 35 percent in 1995 to 50 percent in 2000-01 and
then increased only very slightly, to 51 percent, in 2006. Trends in the use of a method for
limiting, however, were different from trends in use for spacing. Use for limiting increased
between 1995 and 2006 among all groups except never-married women, whose rate remained
unchanged, and never-married, sexually active women, whose rate declined from 8 percent in
1995 to 4 percent in 2006.
Total demand for family planning is currently above 60 percent among currently married
women (64 percent), all sexually active women (66 percent), and never-married, sexually active
women (84 percent). Over time, total demand for family planning increased steadily among all
groups, except among never-married women, whose rate declined from 16 percent in 2000-01 to
11 percent in 2006.
The percentage of total demand satisfied is less than 50 percent among all women,
currently married women, and sexually active women (Table 1). From 1995 to 2000-01, the
percentage of total demand satisfied increased among all groups of women except currently
married women and formerly married women, among whom it remained constant. The increase
continued through 2006 among all women and sexually active women. From 2000-01 to 2005,
total demand satisfied increased among currently married women and formerly married women
despite an earlier stall. Among the other groups of women, the percentage of total demand
satisfied declined marginally. Among never-married women, for example, total demand satisfied
was 84 percent in 2000-01 and declined to 80 percent by 2006.
11

Table 1. Percent of women with an unmet need for family planning and the demand for family planning, by survey year, UDHS 1995-2006
Percent of total
demand
1 Percent Unmet satisfied Unmet need Current use
of total need for Using a by Total demand modern modern modern
Year Total Spacing Limiting Total Spacing Limiting demand satisfied methods method methods N
All women
1995 21.9 13.9 8.0 13.4 6.7 6.7 35.3 37.9 27.9 7.4 21.0 7,070
2000-01 25.5 15.2 10.3 17.6 9.2 8.4 43.1 40.8 29.1 14.0 32.4 7,246
2006 26.5 16.1 10.3 19.6 10.0 9.6 46.0 42.5 30.6 15.4 33.5 8,531
Never-married women
1995 3.0 2.7 0.3 9.6 8.1 1.5 12.6 76.4 6.4 6.1 48.8 1,105
2000-01 2.6 2.2 0.4 13.4 11.9 1.5 16.0 84.0 4.1 11.8 74.1 1,456
2006 2.3 2.3 0.0 9.1 9.0 0.6 11.4 79.6 3.1 8.3 72.5 2,028
Currently married women
1995 29.0 18.3 10.7 14.8 6.9 7.9 43.9 33.8 36.1 7.8 17.8 5,136
2000-01 36.2 21.4 14.8 19.4 9.1 10.3 55.5 34.8 40.8 14.8 26.6 4,881
2006 40.6 24.5 16.1 23.7 11.0 12.7 64.2 36.9 46.4 17.9 27.8 5,337
Widowed, divorced, or separated women
1995 3.1 1.5 1.6 9.4 3.2 6.2 12.5 75.2 5.9 6.6 53.0 828
2000-01 4.9 2.5 2.4 14.8 5.6 9.2 19.7 75.0 6.8 13.0 65.7 910
2006 3.9 1.9 2.0 18.2 7.2 11.0 22.1 82.3 5.3 16.8 75.9 1,167
All sexually active women
1995 27.8 17.7 10.1 16.5 8.1 8.4 44.3 37.3 34.7 9.5 21.5 4,247
2000-01 33.0 20.6 12.4 23.3 12.1 11.2 56.3 41.4 37.8 18.6 32.9 4,084
2006 36.6 23.3 13.3 29.6 14.9 14.7 66.2 44.7 43.3 22.9 34.6 4,468
Never-married, sexually active women
1995 32.3 29.6 2.7 42.8 34.7 8.1 75.1 57.0 42.5 32.6 43.4 102
2000-01 26.6 22.8 3.8 56.3 49.5 6.7 82.9 67.9 30.9 52.0 62.8 140
2006 29.3 29.2 0.1 54.8 50.9 3.9 84.2 65.1 41.3 42.9 50.9 161
1 Differences in the definition of unmet need between surveys were minor. Between the 1995 and 2000-01 surveys, the definition of
infecundity was expanded to include women who reported a hysterectomy. If a woman was fecund and wanted another birth but was undecided about the timing of the birth or if she was fecund but was undecided about whether she wanted another birth, the 2006 UDHS (but not earlier surveys) categorised her has having an unmet need for spacing. In the 2000-01 and 1995 surveys, a woman's response to the question about whether a pregnancy at this time would be a "problem" (DHS surveys no longer ask this question) was used to identify unmet need for spacing or desire for a birth within the following two years. If a respondent said that a pregnancy would not be a problem in the 2000-01 survey, she was considered to have a desire for a birth in the next two years. In the 1995 survey, if a respondent said that a pregnancy at that time would not be a problem or she would be happy if she became pregnant, she was categorised as having a desire for a birth in the next two years.
12

A separate estimate for the unmet need for modern methods is also shown in Table 1.
Currently married women have the highest level of unmet need for modern methods, 46 percent,
whereas formerly married women (5 percent) and never-married women (3 percent) have the
lowest unmet need for modern methods (Table 1). Over time, unmet need for modern methods
increased steadily among all women, currently married women, and sexually active women.
However, among never-married, sexually active women, unmet need for modern methods
declined from 43 percent in 1995 to 31 percent in 2000-01 and then increased to 41 percent in
2006.
Modern method use ranges from 8 percent among never-married women to 43 percent
among never married, sexually active women (Table 1). However, modern method use is only 18
percent among currently married women. From 1995 to 2006, modern method use increased
progressively among all groups of women, except among never-married women and never-
married, sexually active women, whose rates decreased between 2000-01 and 2006.
The percentage of demand satisfied by modern methods is highest among formerly
married women (76 percent) and lowest among currently married women (28 percent). From
1995 to 2006, the percentage of total demand satisfied by modern methods increased for all
groups of women, except never-married and never-married, sexually active women. These two
groups experienced initial increases from 1995 to 2000-01, followed by declines from 2000-01 to
2006. Among currently married women, the total demand satisfied by modern methods increased
to a greater extent between 1995 and 2000-01 than between 2000-01 and 2006.
Table 2 shows the components of unmet need by year and place of residence. Compared
to urban areas, rural areas have much higher levels of total unmet need, unmet need for spacing,
and unmet need for limiting (Table 2). From 1995 to 2006, the urban-rural differences in total
unmet need and in unmet need for spacing and limiting increased. For example, in 1995, the
urban-rural difference in total unmet need was 2 percentage points, and by 2006, the difference
was 16 percentage points.
Table 2 also shows that current use of a method in urban areas, despite an initial increase
from 1995 to 2000-01, stalled during 2000-01 to 2006. The stall occurred in both spacing and
limiting in urban areas. Increases in current use in rural areas continue. Increases occurred in use
of a method for both spacing and for limiting, but the magnitude of the increases was small. The
percentage of total demand satisfied remained steady in urban areas from 2000-01 to 2006,
whereas it increased marginally in rural areas.
13
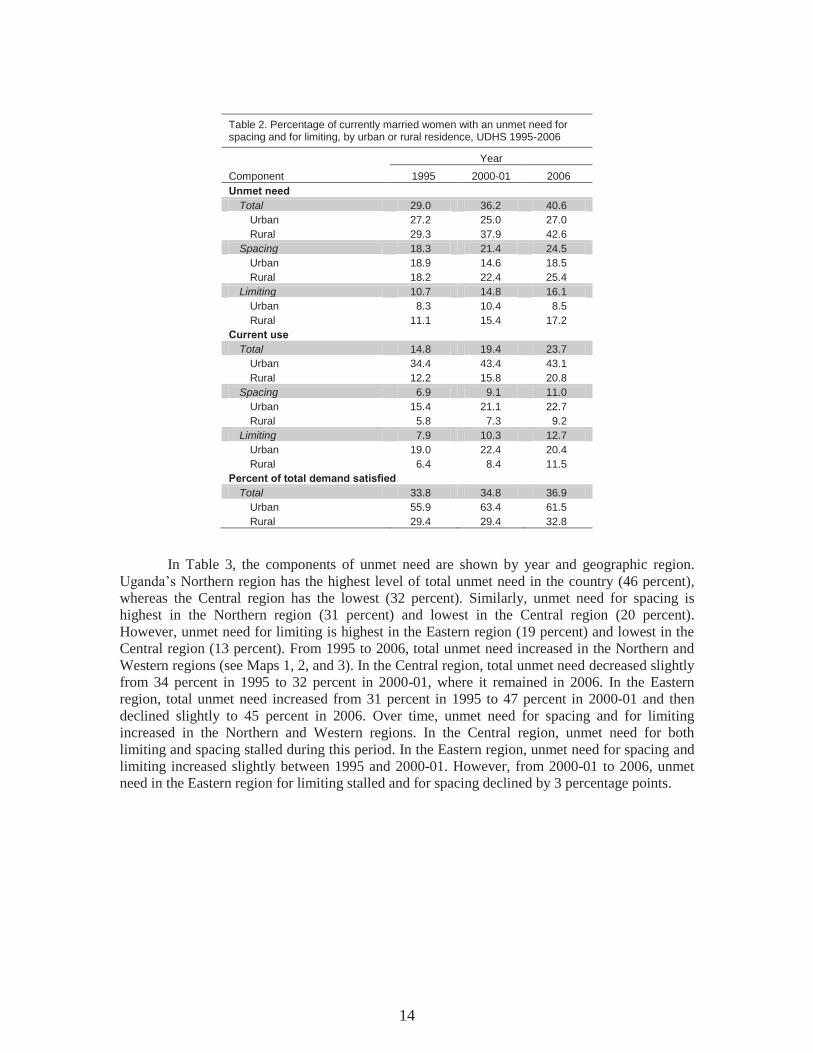
Table 2. Percentage of currently married women with an unmet need for spacing and for limiting, by urban or rural residence, UDHS 1995-2006
Year
Component 1995 2000-01 2006
Unmet need Total 29.0 36.2 40.6
Urban 27.2 25.0 27.0
Rural 29.3 37.9 42.6
Spacing 18.3 21.4 24.5
Urban 18.9 14.6 18.5
Rural 18.2 22.4 25.4
Limiting 10.7 14.8 16.1
Urban 8.3 10.4 8.5
Rural 11.1 15.4 17.2
Current use Total 14.8 19.4 23.7
Urban 34.4 43.4 43.1
Rural 12.2 15.8 20.8
Spacing 6.9 9.1 11.0
Urban 15.4 21.1 22.7
Rural 5.8 7.3 9.2
Limiting 7.9 10.3 12.7
Urban 19.0 22.4 20.4
Rural 6.4 8.4 11.5
Percent of total demand satisfied Total 33.8 34.8 36.9
Urban 55.9 63.4 61.5 Rural 29.4 29.4 32.8
In Table 3, the components of unmet need are shown by year and geographic region.
Uganda’s Northern region has the highest level of total unmet need in the country (46 percent),
whereas the Central region has the lowest (32 percent). Similarly, unmet need for spacing is
highest in the Northern region (31 percent) and lowest in the Central region (20 percent).
However, unmet need for limiting is highest in the Eastern region (19 percent) and lowest in the
Central region (13 percent). From 1995 to 2006, total unmet need increased in the Northern and
Western regions (see Maps 1, 2, and 3). In the Central region, total unmet need decreased slightly
from 34 percent in 1995 to 32 percent in 2000-01, where it remained in 2006. In the Eastern
region, total unmet need increased from 31 percent in 1995 to 47 percent in 2000-01 and then
declined slightly to 45 percent in 2006. Over time, unmet need for spacing and for limiting
increased in the Northern and Western regions. In the Central region, unmet need for both
limiting and spacing stalled during this period. In the Eastern region, unmet need for spacing and
limiting increased slightly between 1995 and 2000-01. However, from 2000-01 to 2006, unmet
need in the Eastern region for limiting stalled and for spacing declined by 3 percentage points.
14

Map 1. Unmet Need in Uganda, UDHS 1995
Map 2. Unmet Need in Uganda, UDHS 2000-01
15

Map 3. Unmet Need in Uganda, UDHS 2006
Current use of any method is highest in the Central region (38 percent), whereas the
Northern region has the lowest level of contraceptive use (12 percent) (Table 3). Contraceptive
use increased in the Central, Eastern, and Western regions between 1995 and 2006. However, in
the Northern region, contraceptive use declined marginally, from 14 percent in 1995 to 12 percent
in 2006. The pattern of use of a method for spacing and limiting by region was similar to the
pattern for total use, except in the Northern region, where use of a method for limiting stagnated
from 2000-01 to 2006. Many of the districts excluded from the 2000-01 survey were in the
Northern region. The inclusion of all Northern districts in the 2006 UDHS may be a factor in any
changes observed in this region between the 2000-01 and 2006 surveys.
16

Table 3. Percentage of currently married women with an unmet need for spacing or limiting, by region, UDHS 1995-2006
Year
Component 1995 2000-01 2006
Unmet need Total 29.0 36.2 40.6
Central 34.4 32.1 32.4
Eastern 30.7 46.7 44.8
Northern 23.1 31.6 46.3
Western 27.3 31.0 38.9
Spacing 18.3 21.4 24.5
Central 20.9 18.8 19.6
Eastern 19.5 28.6 26.0
Northern 16.3 17.3 30.6
Western 16.4 18.3 22.2
Limiting 10.7 14.8 16.1
Central 13.5 13.2 12.8
Eastern 11.3 18.1 18.8
Northern 6.8 14.4 15.7
Western 10.9 12.7 16.8
Current use Total 14.8 19.4 23.7
Central 25.0 33.2 38.0
Eastern 11.3 12.8 21.4
Northern 13.6 12.8 11.6
Western 10.3 16.1 23.4
Spacing 6.9 9.1 11.0
Central 9.9 15.7 17.5
Eastern 5.6 5.7 9.5
Northern 9.3 8.2 5.7
Western 3.6 6.4 11.1
Limiting 7.9 10.3 12.7
Central 15.1 17.5 20.5
Eastern 5.7 7.1 11.9
Northern 4.2 4.6 5.9
Western 6.7 9.7 12.3
Percent of total demand satisfied Total 33.8 34.8 36.9
Central 42.1 50.9 54.0
Eastern 26.9 21.5 32.3
Northern 37.1 28.8 20.0
Western 27.4 34.2 37.5
Note 1: For the 1995 and 2000-2001 UDHS data, the standard definitions of regions used in the final reports.
Note 2: For 2006, Central includes central 1, central 2, Kampala, Eastern includes east central, eastern, North includes: North, West Nile, and West includes Western, Southwest
17

The Central region has the highest level of total demand satisfied (54 percent), followed
by the Western (38 percent), Eastern (32 percent), and Northern regions (20 percent) (Table 3).
The percent of total demand satisfied increased in the Central and Western regions from 1995 to
2006. In the Eastern region, the percent of total demand satisfied declined from 1995 to 2000-01
but had increased by 2006. In the Northern region, the percentage of total demand satisfied
declined from 1995 to 2006.
Table 4 shows the percentage of currently married women with an unmet need for
spacing or for limiting, as well as total unmet need, by selected characteristics. A majority of the
sample consists of women who have had primary or no education (85 percent), live in rural areas
(87 percent), and are currently working (92 percent). About half the women are Catholic, and
only a small percentage has been exposed to mass media on a regular basis. The majority has a
living child. The women in the sample are about evenly distributed in all four regions of Uganda.
Slightly more than half of the women have communicated with their partner about family
planning in the recent past, and a similar proportion have heard of family planning in the media.
18

Table 4. Differentials in unmet need for family planning among currently married women, by demographic and other characteristics, UDHS 2006
Percent with an unmet need:
Characteristic For spacing For limiting Total N
Age 15-19 32.8 1.1 33.8 380
20-24 33.3 2.0 35.3 1,148
25-29 32.5 7.2 39.7 1,136
30-34 26.0 17.1 43.1 993
35-39 16.7 31.4 48.2 734
40-44 6.6 39.8 46.3 538
45-49 3.3 33.3 36.6 408
Education No education 21.6 23.0 44.6 1,315
Primary 26.8 15.5 42.3 3,211
Secondary + 19.8 7.2 27.0 811
Residence Urban 18.5 8.5 27.0 696
Rural 25.4 17.2 42.6 4,641
Religion Catholic 25.3 15.9 41.2 2,333
Protestant 24.7 16.6 41.4 1,782
Muslim 21.7 16.6 38.3 609
Pentecostal, Seventh Day Adventist, other 23.3 14.8 38.1 612
Currently working No 26.4 10.6 37.0 438
Yes 24.3 16.6 40.9 4,899
Household wealth Lowest quintile 28.4 18.1 46.5 1,094
Second quintile 28.9 17.0 45.9 1,144
Middle quintile 26.1 17.6 43.6 1,038
Fourth quintile 23.2 16.6 39.7 1,024
Highest quintile 15.1 11.1 26.2 1,036
Exposure to two or more sources of media
No 25.8 16.9 42.7 4,656
Yes 15.3 10.4 25.7 681
Number of living children 0 15.6 0.0 15.6 332
1-2 28.2 3.3 31.5 1,515
3-4 30.9 10.1 41.0 1,457
5+ 18.6 32.5 51.1 2,033
Region Central 19.6 12.8 32.4 1,283
Eastern 26.0 18.8 44.8 1,376
Northern 30.6 15.7 46.3 1,223
Western 22.2 16.8 38.9 1,455
Partner communication on family planning
No 22.9 16.1 38.9 2,449
Yes 25.8 16.1 42.0 2,888
Heard of family planning in the media
No 27.6 17.9 45.5 2,089
Yes 22.5 14.9 37.4 3,248
Total 24.5 16.1 40.6 5,337
19

In Uganda, currently married women age 15-49 are more likely to have an unmet need
for spacing (25 percent) than for limiting (16 percent) (Table 4). Unmet need for spacing is more
common among women who are younger, live in a rural area, have exposure to fewer sources of
mass media, live in the Northern region, or have not heard of family planning in the media in the
past six months. Unmet need for limiting is positively associated with being older, having a lower
level of education, living in a rural area, currently working, having exposure to fewer sources of
mass media, having higher parity, and not hearing of family planning in the media in the past six
months. Total unmet need is highest among married women age 30-44 and those who have less
education, live in rural areas, are exposed to fewer sources of mass media, have more children,
and have not heard of family planning in the media in the past six months.
Table 5 shows that after controlling for several respondent characteristics, the unmet need
for spacing was significantly higher among women who are of higher parity (3 or more children)
and who live in the Northern region. Unmet need for spacing is significantly lower among
currently married women who are older, are currently working, belong to wealthier households,
and have heard of family planning in the media in the past six months.
20
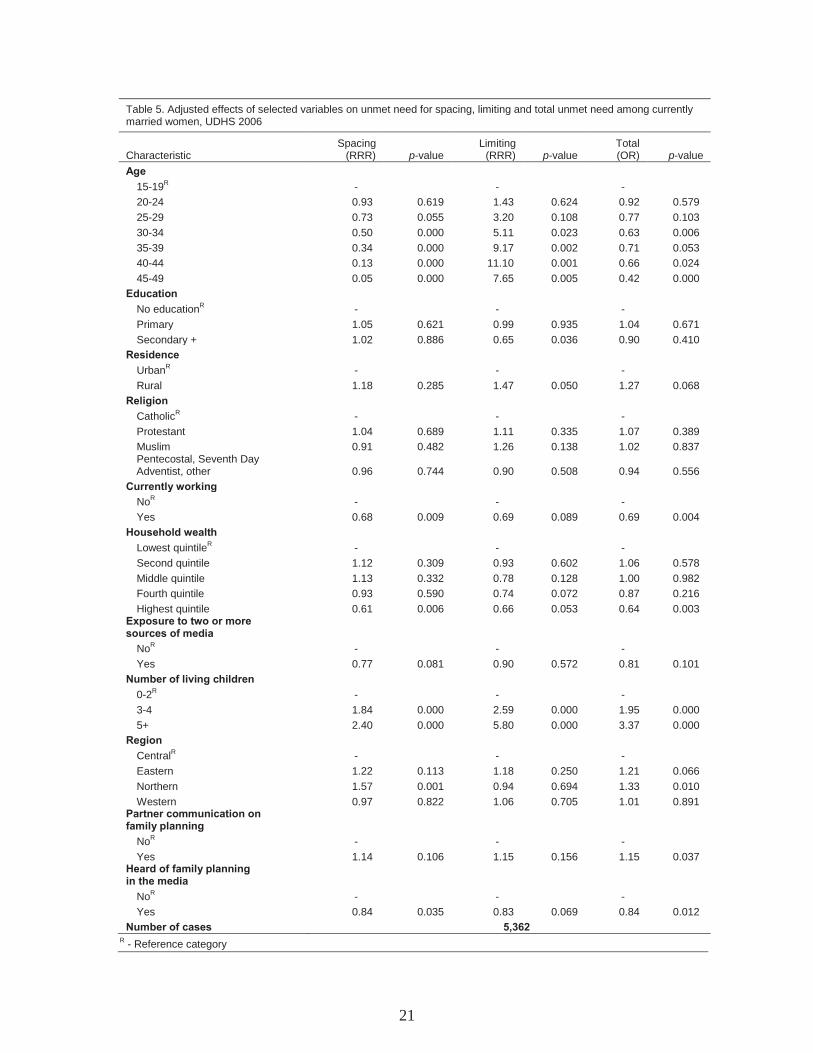
Table 5. Adjusted effects of selected variables on unmet need for spacing, limiting and total unmet need among currently married women, UDHS 2006
Characteristic Spacing
(RRR) p-value Limiting
(RRR) p-value Total (OR) p-value
Age 15-19
R - - -
20-24 0.93 0.619 1.43 0.624 0.92 0.579
25-29 0.73 0.055 3.20 0.108 0.77 0.103
30-34 0.50 0.000 5.11 0.023 0.63 0.006
35-39 0.34 0.000 9.17 0.002 0.71 0.053
40-44 0.13 0.000 11.10 0.001 0.66 0.024
45-49 0.05 0.000 7.65 0.005 0.42 0.000
Education No education
R - - -
Primary 1.05 0.621 0.99 0.935 1.04 0.671
Secondary + 1.02 0.886 0.65 0.036 0.90 0.410
Residence Urban
R - - -
Rural 1.18 0.285 1.47 0.050 1.27 0.068
Religion Catholic
R - - -
Protestant 1.04 0.689 1.11 0.335 1.07 0.389
Muslim 0.91 0.482 1.26 0.138 1.02 0.837 Pentecostal, Seventh Day Adventist, other 0.96 0.744 0.90 0.508 0.94 0.556
Currently working No
R - - -
Yes 0.68 0.009 0.69 0.089 0.69 0.004
Household wealth Lowest quintile
R - - -
Second quintile 1.12 0.309 0.93 0.602 1.06 0.578
Middle quintile 1.13 0.332 0.78 0.128 1.00 0.982
Fourth quintile 0.93 0.590 0.74 0.072 0.87 0.216
Highest quintile 0.61 0.006 0.66 0.053 0.64 0.003 Exposure to two or more sources of media
NoR
- - -
Yes 0.77 0.081 0.90 0.572 0.81 0.101
Number of living children 0-2
R - - -
3-4 1.84 0.000 2.59 0.000 1.95 0.000
5+ 2.40 0.000 5.80 0.000 3.37 0.000
Region Central
R - - -
Eastern 1.22 0.113 1.18 0.250 1.21 0.066
Northern 1.57 0.001 0.94 0.694 1.33 0.010
Western 0.97 0.822 1.06 0.705 1.01 0.891 Partner communication on family planning
NoR
- - -
Yes 1.14 0.106 1.15 0.156 1.15 0.037 Heard of family planning in the media
NoR
- - -
Yes 0.84 0.035 0.83 0.069 0.84 0.012
Number of cases 5,362 R
- Reference category
21

Women who live in rural areas are more likely to have an unmet need for limiting,
whereas place of residence has no significant effect on the unmet need for spacing (Table 5).
Although women who have secondary or greater education have less unmet need for limiting, the
effect of education on unmet need for spacing is not significant. As with the unmet need for
spacing, women who are of high parity (3 or more children) are significantly more likely to have
an unmet need for limiting. Moreover, older women have significantly greater unmet need for
limiting, whereas older age is associated with significantly lower need for spacing.
Overall, women who are age 30-34 or 40 or older are significantly less likely to have an
unmet need for family planning than women age 15-19 (Table 5). Women who are currently
working, those in the highest household wealth quintile, and those who have heard of family
planning in the media are significantly less likely to have an unmet need. In contrast, women who
reside in the Northern region and those who have discussed family planning with their partner
have significantly higher unmet need. Women who have 3 or 4 living children are about twice as
likely as women with 0-2 children to have an unmet need (OR: 1.95, 95% CI: 1.61-2.36), and
those with 5 or more children are more than three times as likely to have an unmet need (OR:
3.37, 95% CI: 2.72-4.18).
With high rates of unmet need in Uganda, it is important to know why few women who
want to delay or avoid a future birth are not using contraception. Among currently women with
an unmet need in Uganda, the most frequently cited reason for not currently using a method is
fear of side effects (29 percent), followed by the woman was breastfeeding (20 percent), or the
woman was having infrequent or no sex (14 percent). A considerable proportion of women (13
percent) also said that they were not using a method because their husband or partner was
opposed to the use of a method.
More than one in three currently married women who have an unmet need and do not
intend to use a method in the future mentioned fear of side effects as the main reason for not
intending to use contraception (Table 6). Thirteen percent said that they would not use a method
in the future because they had infrequent sex or no sex and 12 percent reported that they were
subfecund or infecund.
22

Table 6. Reasons for current nonuse among currently married women with an unmet need, and intended future nonuse among currently married women with an unmet need who do not intend to use contraception in the future, UDHS 2006
Percentage
Reason Current nonuse1
Future nonuse
Fertility related Infrequent sex or no sex 13.5 12.5
Menopausal or had a hysterectomy 0.7 0.6
Subfecund or infecund 4.4 12.0
Wants as many children as possible n/a 2.4
Postpartum amenorrhoeic 7.6 n/a
Breastfeeding 19.8 n/a
Fatalistic 0.6 n/a
Opposition to use Respondent opposed 5.3 8.8
Husband or partner opposed 13.2 5.0
Other opposed 0.3 0.2
Religious prohibition 1.5 3.6
Lack of knowledge Knows of no method 3.8 3.7
Knows of no source 3.9 1.1
Method related Health concerns 12.4 8.0
Fear of side effects 28.8 34.4
Lack of access or access point too far away 1.1 0.0
Costs too much 6.6 1.4
Inconvenient to use 2.3 0.2
Interferes with body's normal processes 4.5 1.0
Other 5.3 4.3
Don't know 0.9 0.9
Total 137.0 100.0
Number 1,515 463
n/a - not available 1Percentages total more than 100 because respondents are allowed to provide multiple
responses.
The study estimated the effect of reducing unmet need and increasing current use on
fertility rates (Table 7). In scenario 1, current levels of unmet need and CPR are the same as in
2006 and the predicted TFR is 5.2 children per woman (this figure differs from the actual TFR of
6.7 because the study used only CPR to estimate the TFR). In scenario 2, if all women with an
unmet need began using a method, the TFR would theoretically fall to 2.9, less than half of the
current TFR.
Scenarios 3, 4, and 5 show that moderate reductions in unmet need can reduce the TFR
substantially. In scenario 3, if unmet need declines by 50 percent and the women who no longer
have an unmet need begin using a method, the resulting TFR would be 4.0. Scenario 4, which is a
more conservative estimation, shows that the TFR would be 4.7 if unmet need declined by 20
percent and these women become contraceptive users. In scenario 5, the most conservative
estimate, unmet need drops by 10 percent (and CPR increases by approximately 4 percentage
points) to produce a TFR of 4.9.
23

2006 Table 7. Estimated impact of reducing unmet need on fertility among currently married women, UDHS
Predicted Adjusted Adjusted TFR from
Current Total unmet current adjusted Scenario TFR demand need use use
Scenario 1: Convert no unmet need 6.7 64.2 40.6 23.7 5.2
to current use
Scenario 2: Convert all unmet need 6.7 64.2 0.0 64.2 2.9
to current use
Scenario 3: Reduce unmet need by 50% and increase current use by 6.7 64.2 20.2 44.0 4.0 50%
Scenario 4: Reduce unmet need by 20% and increase current use by 6.7 64.2 32.4 31.8 4.7 20%
Scenario 5: Reduce unmet need by 10% and increase current use by 6.7 64.2 36.4 27.8 4.9 10%
24
4 Conclusions and Recommendations
This report examines the levels, trends, and differentials in unmet need for family
planning among women in Uganda during 1995-2006. With the exception of formerly married
women and all never-married women, unmet need is high and has increased among all subgroups
of women in Uganda over this period. Currently married women have the highest level of unmet
need. Total contraceptive use increased among all groups of women in recent years, with the
exception of never-married women, whose use declined marginally. Women in Uganda continue
to have a greater unmet need for spacing than for limiting.
Family planning programs need to reach women in rural areas where high levels of unmet
need persist. Programs need to target the Northern and Western regions of the country where
levels of unmet need remain high and have continued to increase throughout the past decade.
The results also underscore that women with an unmet need for spacing and for limiting
are diverse. After the study controlled for respondent characteristics, results indicate that women
with an unmet need for spacing are primarily younger, not working, and of higher parity (3 or
more children); live in the Northern region; and have not heard of family planning in the media.
Unmet need for limiting is associated with older women (similar to the findings of Mawajdeh,
2007; Korra, 2002), women who have 3 or more children, and those who live in rural areas.
Family planning policies should be tailored to address the specific needs of these different groups
of women.
Total unmet need is significantly associated with living in the Northern region and having
three or more children. After controlling for various characteristics, women who are age 30-34
and older than 39 have significantly lower unmet need than women age 15-19. Despite this,
program planners should note that at the population level, unmet need increases with age. Women
who have heard of family planning messages in the media are less likely to have an unmet need,
demonstrating the utility of media messages for reproductive health promotion. Like DeRose
(2004), who found that partner communication about family planning does not necessarily lead to
declines in unmet need, this study finds that partner communication is associated with
significantly higher levels of unmet need.
Family planning programs in Uganda should also plan a response for the substantial
proportions of women who are not using a method and who do not intend to use a method in the
future due to the fear of side effects or opposition from a husband or partner.
The TFR in Uganda is high (6.7). The estimates shown here demonstrate that modest
declines in unmet need and corresponding increases in CPR can substantially reduce Uganda’s
TFR.
25


5 References
Agyei, W.K., and M. Migadde. 1995. Demographic and sociocultural factors influencing
contraceptive use in Uganda. Journal of Biosocial Science 27(1):47-60.
Al Riyami, A., M. Afifi, and R.M. Mabry. 2004. Women's autonomy, education and employment
in Oman and their influence on contraceptive use. Reproductive Health Matters 12(23):144-154.
Ashford, L. 2003. Policy brief. Unmet need for family planning: Recent trends and their
implications for programs. Washington, District of Columbia, USA: Population Reference
Bureau.
Bhandari, G.P., K.C. Premarajan, N. Jha, B.K. Yadav, I.S. Paudel, and S. Nagesh. 2006.
Prevalence and determinants of unmet need for family planning in a district of eastern region of
Nepal. Kathmandu University Medical Journal 4(2): 203-210.
Blacker, J., C. Opiyo, M. Jasseh, A. Sloggett, and J. Ssekamatte-Ssebuliba. 2005. Fertility in
Kenya and Uganda: A comparative study of trends and determinants. Population Studies
(Cambridge) 59(3): 355-373.
Casterline, J., and S.W. Sinding. 2000. Unmet need for family planning in developing countries
and implications for population policy. Population and Development Review 26(4): 691-723.
Curtis, S.L., and C.F. Westoff. 1996. Intention to use contraceptives and subsequent contraceptive
behavior in Morocco. Studies in Family Planning 27(5): 239-250.
DeRose, L.F., F.N. Dodoo, A.C. Ezeh, and T.O. Owuor. 2004. Does discussion of family
planning improve knowledge of partner's attitude toward contraceptives? International Family
Planning Perspectives 30(2): 87-93.
Drennan, M. 1998. Reproductive health: New perspectives on men's participation. Population
Reports. Series J: Family Planning Programs (46): 1-35.
Govindasamy, P., and E. Boadi. 2000. A decade of unmet need for contraception in Ghana:
Programmatic and policy implications. Calverton, Maryland, USA: Macro International Inc. and
National Population Council Secretariat (Ghana).
Kaida, A., W. Kipp, P. Hessel, and J. Konde-Lule. 2005. Male participation in family planning:
Results from a qualitative study in Mpigi District, Uganda. Journal of Biosocial Science 37(3):
269-286.
Kaona, F.A., M.N. Katsivo, H. Ondolo, A.G. Ameerbeg, M.A. Said, X.P. Guma, R.G. Lubanga,
C.K. Mugerwa, F.B. Kinene, J.K. Mati, S.N. Kinoti, and W. Mpanju-Shumbusho. 1996. Factors
that determine utilization of modern contraceptives in East, Central and Southern Africa. African
Journal of Health Sciences 3(4): 133-137.
Kirk, D., and B. Pillet. 1998. Fertility levels, trends, and differentials in sub-Saharan Africa in the
1980s and 1990s. Studies in Family Planning 29(1): 1-22.
Korra, A. 2002. Attitudes toward family planning, and reasons for nonuse among women with
unmet need for family planning in Ethiopia. Calverton, Maryland, USA: ORC Macro.
27

Lutalo, T., M. Kidugavu, M.J. Wawer, D. Serwadda, L.S. Zabin, and R.H. Gray. 2000. Trends
and determinants of contraceptive use in Rakai District, Uganda, 1995-98. Studies in Family
Planning 31(3): 217-227.
Macro International Inc. 2008a. MEASURE DHS STATcompiler. Available at
http://www.measuredhs.com.
Macro International Inc. 2008b. Description of the Demographic and Health Surveys individual
recode. Available at http://www.measuredhs.com.
Mawajdeh, S. 2007.Demographic profile and predictors of unmet need for family planning
among Jordanian women. The Journal of Family Planning and Reproductive Health Care 33(1):
53-56.
Ministry of Finance (MOF) [Uganda], Planning, and Economic Development. 2004. Poverty
eradication action plan (2004/5-2007/8). Kampala, Uganda: Ministry of Finance, Planning and
Economic Development.
Ministry of Health (MOH) [Uganda]. 2001. Integrated reproductive health curriculum: Family
planning module trainee’s handbook. Kampala, Uganda: Ministry of Health, Reproductive Health
Division.
Population Secretariat [Uganda]. 2006. State of Uganda Population Report–2006. Kampala,
Uganda: Population Secretariat.
Ropey, B., J. Ross, and I. Bhushan. 1996. Meeting unmet need: New strategies. Population
Reports. Series J: Family Planning Programs (43): 1-35.
Ross, J.A., and E. Frankenberg. 1993. Findings from two decades of family planning research.
New York, New York, USA: The Population Council.
Rutstein, S., and K. Johnson. 2004. The DHS wealth index. DHS Comparative Reports No. 6.
Calverton, Maryland, USA: Macro International Inc.
Sedgh, G., R. Hussain, A. Bankole, and S. Singh. 2007. Occasional report No. 37. Women with
an unmet need for contraception in developing countries and their reasons for not using a method.
New York, New York, USA: Guttmacher Institute.
Singh, S., E. Prada, F, Mirembe, and C. Kiggundu. 2005. The incidence of induced abortion in
Uganda. International Family Planning Perspectives 31(4): 183-191.
Statistics Department [Uganda] and Macro International Inc. 1996. Uganda Demographic and
Health Survey, 1995. Calverton, Maryland, USA: Statistics Department [Uganda] and Macro
International Inc.
Uganda Bureau of Statistics (UBOS). 2006. 2002 Uganda population and housing census.
Kampala, Uganda: UBOS.
Uganda Bureau of Statistics (UBOS). 2007. Projections of demographic trends in Uganda 2007-
2017 (Volume 1). Kampala, Uganda: UBOS.
Uganda Bureau of Statistics (UBOS) and ORC Macro. 2001. Uganda Demographic and Health
Survey 2000-2001. Calverton, Maryland, USA: UBOS and ORC Macro.
28

Uganda Bureau of Statistics (UBOS) and Macro International Inc. 2007. Uganda Demographic
and Health Survey (UDHS) 2006. Calverton, Maryland, USA: UBOS and Macro International
Inc.
United Nations Population Division (UNPD). 2005. World population prospects: The 2004
revision. New York, New York, USA: United Nations.
U.S. Agency for International Development (USAID) Health Policy Initiative. 2006. Achieving
the MDGs: The contribution of family planning: Uganda. Washington, District of Columbia,
USA: Constella Futures.
Westoff, C.F. 1978. The unmet need for birth control in five Asian countries. Family Planning
Perspectives 10: 173-181.
Westoff, C.F. 2001. Unmet need at the end of the century. DHS Comparative Reports No. 1.
Calverton, Maryland, USA: ORC Macro.
Westoff, C.F. 2006. New estimates of unmet need and the demand for family planning. DHS
Comparative Reports No. 14. Calverton, Maryland, USA: Macro International Inc.
Westoff, C.F., and A. Bankole. 2002. Reproductive preferences in developing countries at the
turn of the century. DHS Comparative Reports No. 2. Calverton, Maryland, USA: ORC Macro.
Westoff, C.F., and L.H. Ochoa. 1991. Unmet need and the demand for family planning. DHS
Comparative Studies No. 5. Columbia, Maryland, USA: Institute for Resource Development.
Westoff, C.F., and A.R. Pebley. 1981. Alternative measures of unmet need for family planning in
developing countries. International Family Planning Perspectives 7(4): 126-136.
Wolff, B., A.K. Blanc, and J. Ssekamatte-Ssebuliba. 2000. The role of couple negotiation in
unmet need for contraception and the decision to stop childbearing in Uganda. Studies in Family
Planning 31(2): 124-137.
29