UNLOCKING THE POWER OF DEMAND RESPONSE...Total benefit of demand reduction in the NEM 2013/14 to...
40
UNLOCKING THE POWER OF DEMAND RESPONSE National Energy Efficiency Conference Melbourne, 20 Nov 2017 Chris Dunstan Research Director UTS Institute for Sustainable Futures
Transcript of UNLOCKING THE POWER OF DEMAND RESPONSE...Total benefit of demand reduction in the NEM 2013/14 to...

UNLOCKING THE POWER OF DEMAND RESPONSENational Energy Efficiency Conference Melbourne, 20 Nov 2017Chris DunstanResearch DirectorUTS Institute for Sustainable Futures

Summary:1. Context: Security, Affordability, Productivity2. Network Opportunity Maps3. Demand Management Incentive Scheme4. Beyond Coal: Alternatives to extending Liddell Power Station

1. Context: Security, Affordability, Productivity
isf.uts.edu.au
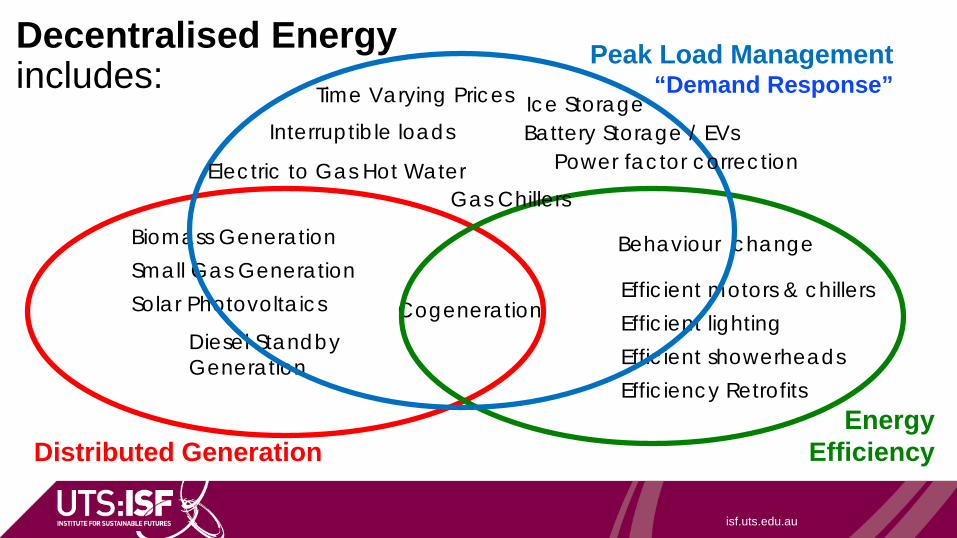
Distributed Generation
Cogeneration
Biomass GenerationSmall Gas GenerationSolar Photovoltaics
Diesel Standby Generation
Energy Efficiency
Efficient motors & chillersEfficient lightingEfficient showerheadsEfficiency Retrofits
Behaviour change
Peak Load Management “Demand Response”
Interruptible loadsPower factor correction
Gas Chillers
Ice Storage
Electric to Gas Hot Water
Time Varying Prices
Battery Storage / EVs
Decentralised Energyincludes:

Forecast Energy Consumption; Decentralised Energy growing
ANNUAL ENERGY FORECAST FOR THE NEM
(AEMO, NEFI, July 2017)
2008 Peak
Rooftop PV
Bldg/Equip EE
Behavioural EE
DE

Generation sources in the NEM
Black Coal
Brown Coal
Gas
HydroWind
Solar
AER, State of the Market 2017

And the RET: Adds another ~12 TWh p.a. of renewable energy by 2021
Note:
+ Small scale solar (6TWh pa)
- Hazelwood (12TWh p.a.)
- Liddell (~8TWh p.a.)

Coal power station retirement: No time to waste
Source: Investor Group on
Climate Change

2. Network Opportunity Maps

The Demand Management Opportunity
$0b
$2b
$4b
$6b
$8b
$10b
$12b
$14b
$16b
Lower Upper
NPV
of a
bsol
ute
bene
fits
Demand reduction case
Efficient pricing
Demand response
Energy efficiency
$4.35b
$11.7b
Total benefit of demand reduction in the NEM 2013/14 to 2022/23
Source: AEMC Power of Choice Review Final Report, 2012

Electricity Networks: location, location, time!
• Networks comprise ~43% power bills (nationally)
• Network costs are highly location & season specific
• Mapping can help identify priority areas for non-network alternatives(Decentralised Energy Resources)
Electricity prices in the NEM (2014-2018)
Source: AEMC, 2015 Residential Electricity Price Trends December 2015, Sydney

1. Where are the most cost-effective opportunities for DE in our grid?
2. How much could DE be worth at these locations?
3. When are the key years and times of constraint?
To answer these questions, we createdNetwork Opportunity Maps
12
Network Opportunity Maps

isf.uts.edu.au
Network Opportunity Maps: a 3-year partnership
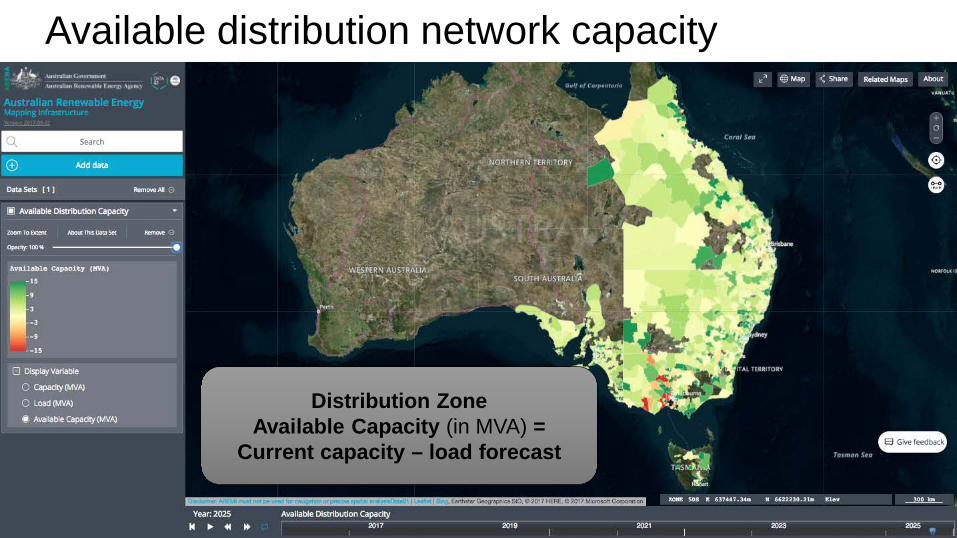
Available distribution network capacity
Distribution Zone Available Capacity (in MVA) =
Current capacity – load forecast

Proposed investment
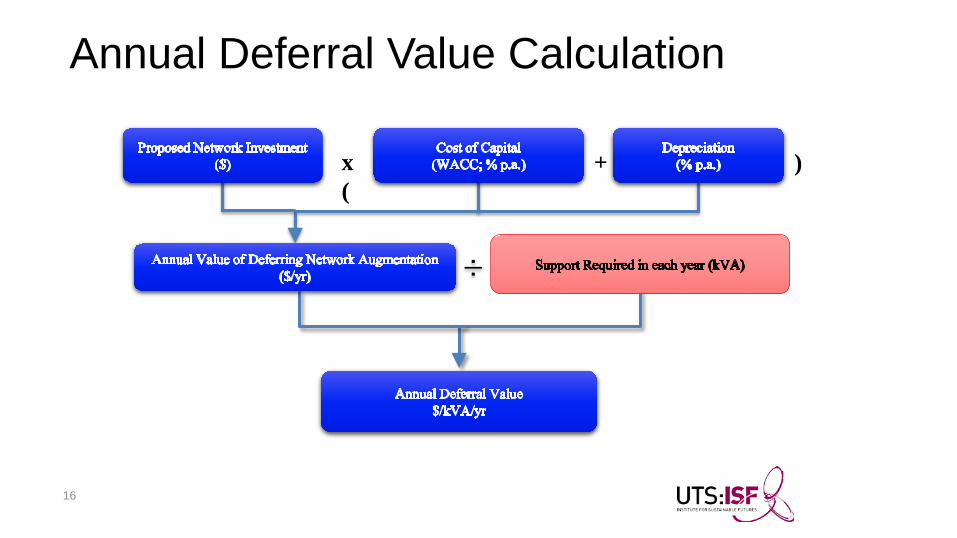
Annual Deferral Value Calculation
16
isf.uts.edu.au
÷
x (
+ )

Annual Deferral Value ($/kVA/yr)
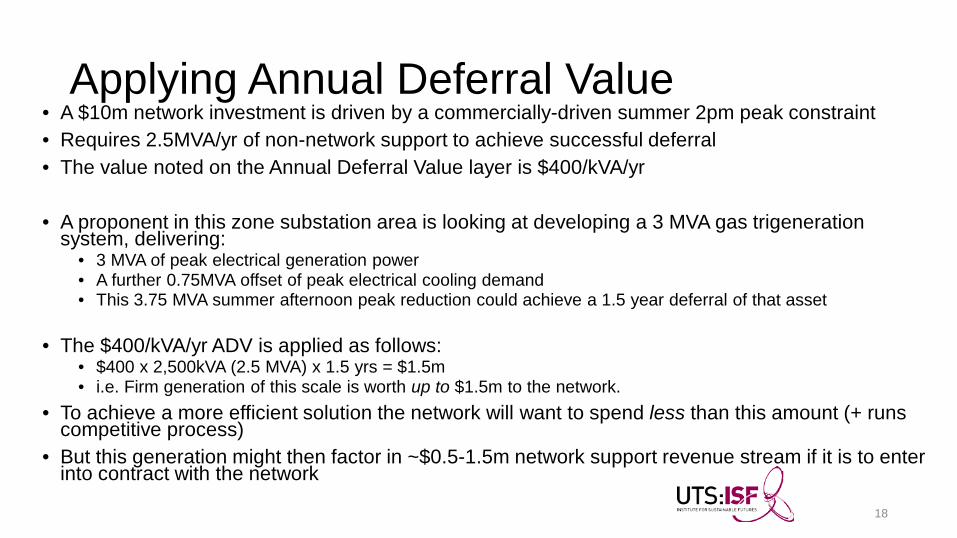
• A $10m network investment is driven by a commercially-driven summer 2pm peak constraint• Requires 2.5MVA/yr of non-network support to achieve successful deferral• The value noted on the Annual Deferral Value layer is $400/kVA/yr
• A proponent in this zone substation area is looking at developing a 3 MVA gas trigenerationsystem, delivering:
• 3 MVA of peak electrical generation power• A further 0.75MVA offset of peak electrical cooling demand• This 3.75 MVA summer afternoon peak reduction could achieve a 1.5 year deferral of that asset
• The $400/kVA/yr ADV is applied as follows:• $400 x 2,500kVA (2.5 MVA) x 1.5 yrs = $1.5m• i.e. Firm generation of this scale is worth up to $1.5m to the network.
• To achieve a more efficient solution the network will want to spend less than this amount (+ runs competitive process)
• But this generation might then factor in ~$0.5-1.5m network support revenue stream if it is to enter into contract with the network
18
Applying Annual Deferral Value
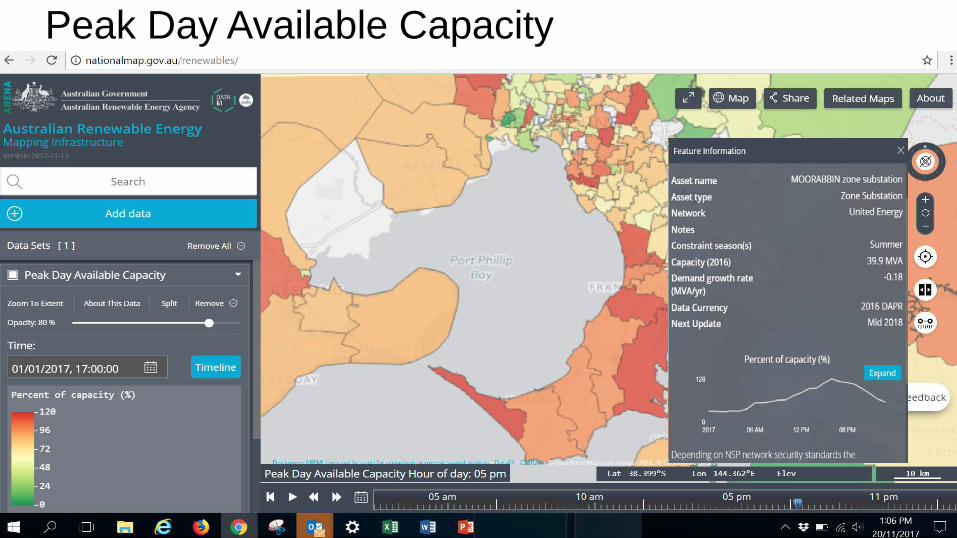
Peak Day Available Capacity

3. Demand Management Incentives Scheme & DM Incentives Review

DM Incentive Scheme:
• Proposed by AEMC: 2012• Rule Change via COAG 2015• Draft Scheme: August 2017• Final Scheme: December 2017
• Due to commence in next regulatory period in each state• NSW, ACT, Tas: July 2019; SA, Qld, July 2020; Vic: Jan 2021• But AER has proposed Rule Change to start across NEM in 2019
isf.uts.edu.au
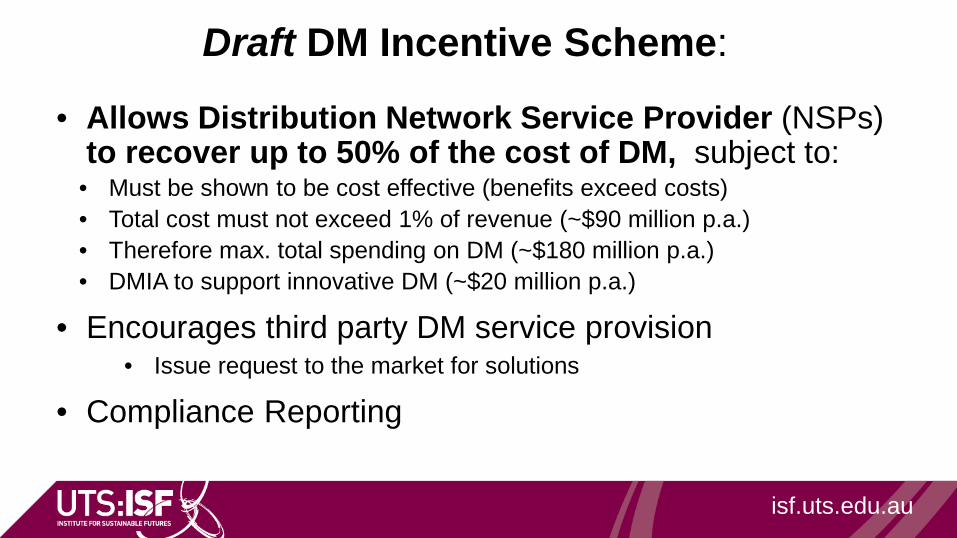
Draft DM Incentive Scheme:
• Allows Distribution Network Service Provider (NSPs)to recover up to 50% of the cost of DM, subject to:
• Must be shown to be cost effective (benefits exceed costs) • Total cost must not exceed 1% of revenue (~$90 million p.a.)• Therefore max. total spending on DM (~$180 million p.a.)• DMIA to support innovative DM (~$20 million p.a.)
• Encourages third party DM service provision• Issue request to the market for solutions
• Compliance Reporting
isf.uts.edu.au
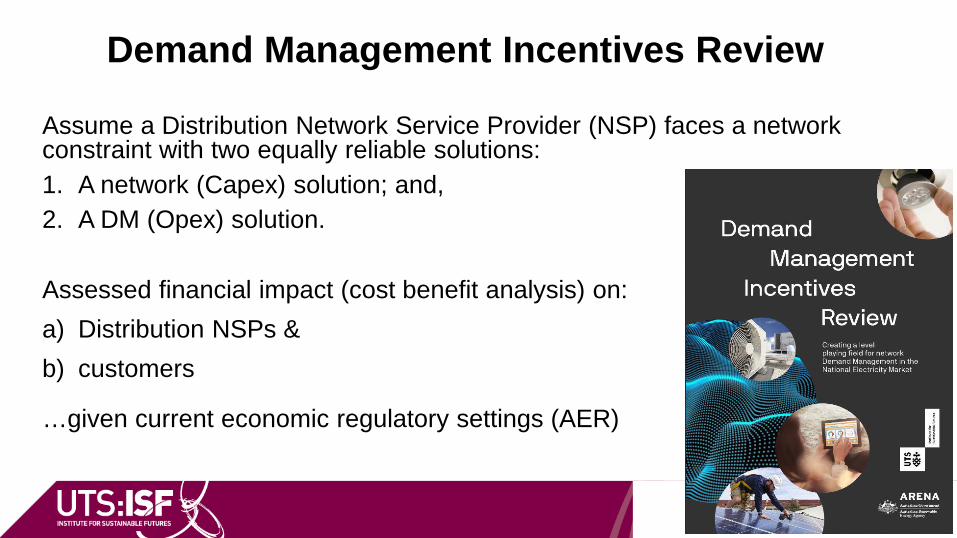
Demand Management Incentives Review
Assume a Distribution Network Service Provider (NSP) faces a network constraint with two equally reliable solutions:1. A network (Capex) solution; and,2. A DM (Opex) solution.
Assessed financial impact (cost benefit analysis) on: a) Distribution NSPs & b) customers
…given current economic regulatory settings (AER)
isf.uts.edu.au

CASES for analysisCase Network Constraint Network Solution DM Solution1 Urban regional high
voltage (HV) cables, reaching end of service life
Retire aging 33kV cables – Replace with 132KV cable
(capacity: 200MWp, cost: $300M)
Large scale energy efficiency and peak load mgt
(capacity: 50MWp, cost: $132/kW/yr, 5 year deferral)
2 Over- and under-voltage on distribution feeder
Install power factor correction, Static VAR Compensation and Distribution Transformer Automatic Tap Changers
(capacity: 0.5MWp, cost: $0.5M)
Peak load mgt, local batteries and network support (incl. from PV inverters)
(capacity: 0.5MWp, cost: $143/kW/yr, 30 year deferral)
3 Distribution zone approaching capacity on urban fringe
New zone substation for new residential estate (capacity: 10MWp, cost: $30M)
Establish minigrid (energy efficiency, load mgt, PV, batteries & diesel back up) for new subdivision; maintain connection to main grid
(capacity: 10MWp, cost: $113/kW/yr, 30 year deferral)
4 Unreliable distribution feeder to community on rural fringe-of-grid
Retire existing feeder - replace like for like
(capacity: 5MWp, cost: $5M)
Establish minigrid (energy efficiency, load mgt, PV, batteries & diesel back up) - keep existing feeder as back up
(capacity: 5MWp, cost: $113/kW/yr, 30 year deferral)
isf.uts.edu.au
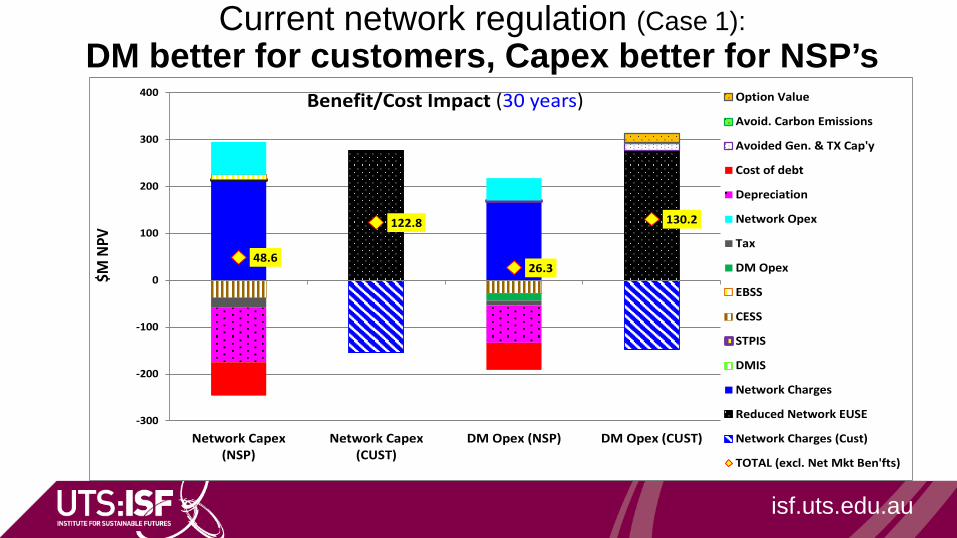
Current network regulation (Case 1): DM better for customers, Capex better for NSP’s
isf.uts.edu.au
48.6
122.8
26.3
130.2
-300
-200
-100
0
100
200
300
400
Network Capex(NSP)
Network Capex(CUST)
DM Opex (NSP) DM Opex (CUST)
$M N
PVBenefit/Cost Impact (30 years) Option Value
Avoid. Carbon Emissions
Avoided Gen. & TX Cap'y
Cost of debt
Depreciation
Network Opex
Tax
DM Opex
EBSS
CESS
STPIS
DMIS
Network Charges
Reduced Network EUSE
Network Charges (Cust)
TOTAL (excl. Net Mkt Ben'fts)

DM Incentives Review conclusions1. There is currently bias in net profit results (and return on equity)
• DM gives lower net profit, but higher customer benefit, than network Capex• Bias not apparent in short term
2. There is currently bias in not allowing NSPs direct DM cost recovery3. Excluding NSPs from accessing a share of “net market benefits” leads
to higher costs for customers
The DM Incentive Scheme is likely to overcome this bias.
isf.uts.edu.au

4. New report released today Beyond Coal: Alternatives to extending the life of Liddell Power Station

SOURCE: Finkel Review 2016 Figure 3.11
The lowest cost resource?

Energy Efficiency
SOURCE: Finkel Review 2016, Figure 3.11 andUS Energy Information Administration
Network cost (indicative)
The lowest cost resource? For energy: Energy Efficiency
$-
$1,000
$2,000
$3,000
$4,000
$5,000
$6,000
$7,000
Cos
t ($m
illio
n pa
)
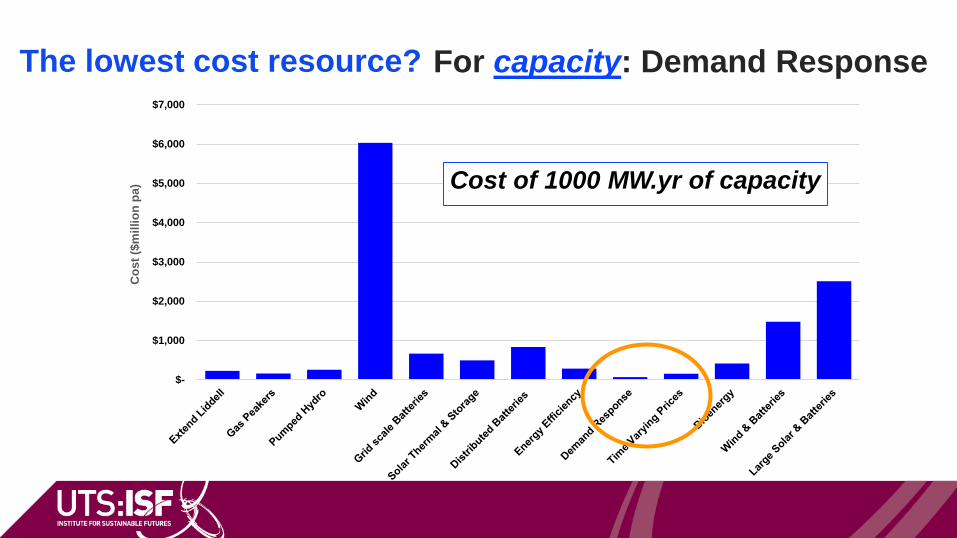
The lowest cost resource? For capacity: Demand Response
Cost of 1000 MW.yr of capacity

New report (out today)- Beyond Coal:Alternatives to extending the life of Liddell Power Station
How to replace Liddell’s
• 1000MW of capacity &
• 8,000 GWh per annum of energy?
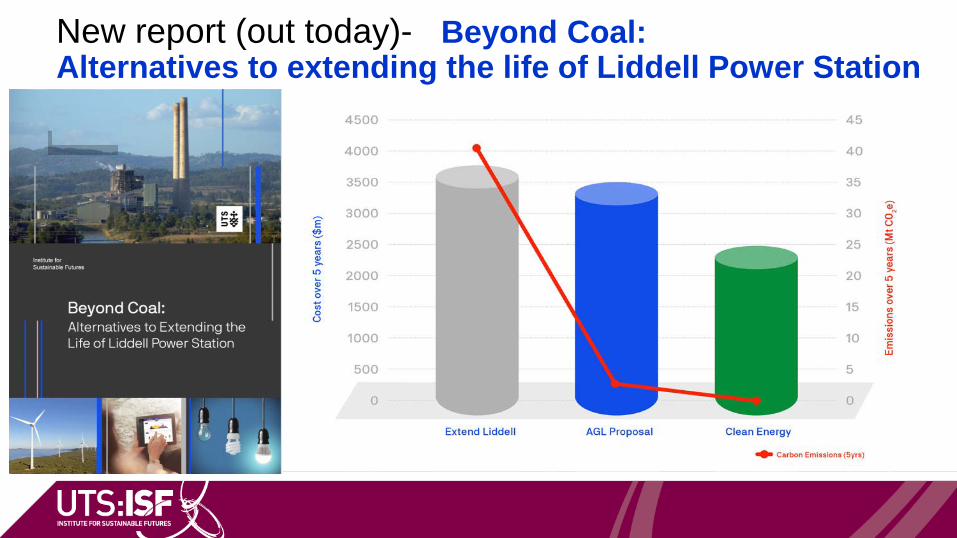
New report (out today)- Beyond Coal:Alternatives to extending the life of Liddell Power Station

New report (out today)- Beyond Coal:Alternatives to extending the life of Liddell Power Station

0
500
1000
1500
2000
2500
3000
3500
4000
Extend Liddell AGL Proposal Clean Energy ExpandedClean Energy
EnergyEfficiency only
Cost
ove
r 5 y
ears
($ m
illio
n)
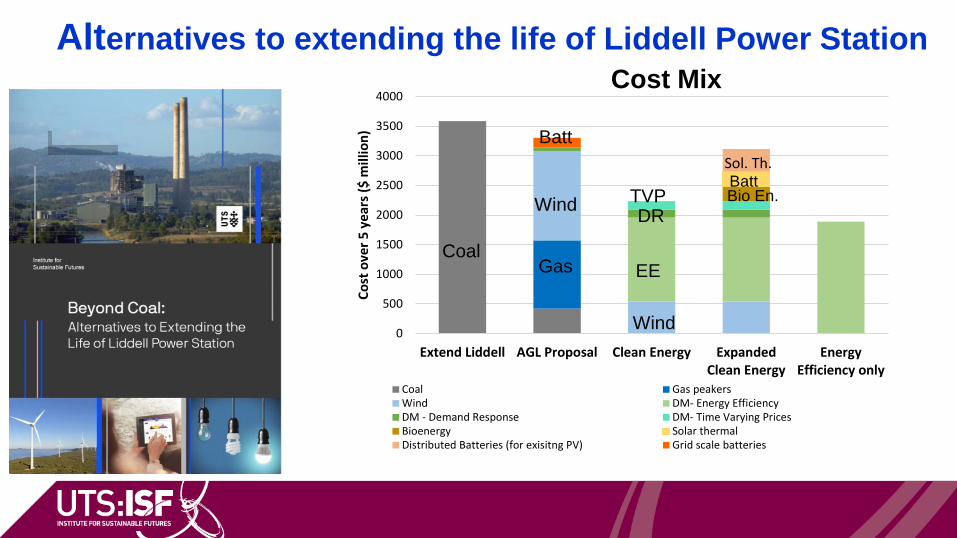
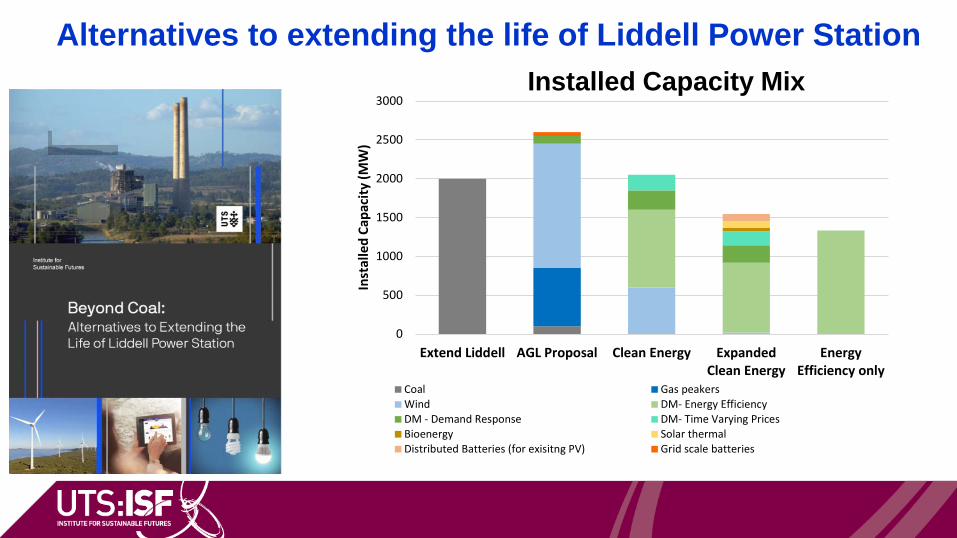
Coal Gas peakersWind DM- Energy EfficiencyDM - Demand Response DM- Time Varying PricesBioenergy Solar thermalDistributed Batteries (for exisitng PV) Grid scale batteries
Alternatives to extending the life of Liddell Power StationCost Mix
0
500
1000
1500
2000
2500
3000
3500
4000
Extend Liddell AGL Proposal Clean Energy ExpandedClean Energy
EnergyEfficiency only
Cost
ove
r 5 y
ears
($ m
illio
n)
Coal Gas peakersWind DM- Energy EfficiencyDM - Demand Response DM- Time Varying PricesBioenergy Solar thermalDistributed Batteries (for exisitng PV) Grid scale batteries
Sol. Th.
Alternatives to extending the life of Liddell Power StationCost Mix
CoalGas
Wind
EE
Batt
Wind
TVPDR
BattBio En.
Alternatives to extending the life of Liddell Power Station
-1000
0
1000
2000
3000
4000
5000
6000
7000
8000
9000
10000
Extend Liddell AGL Proposal Clean Energy ExpandedClean Energy
EnergyEfficiency only
Ener
gy O
utpu
t (G
Wh
pa)
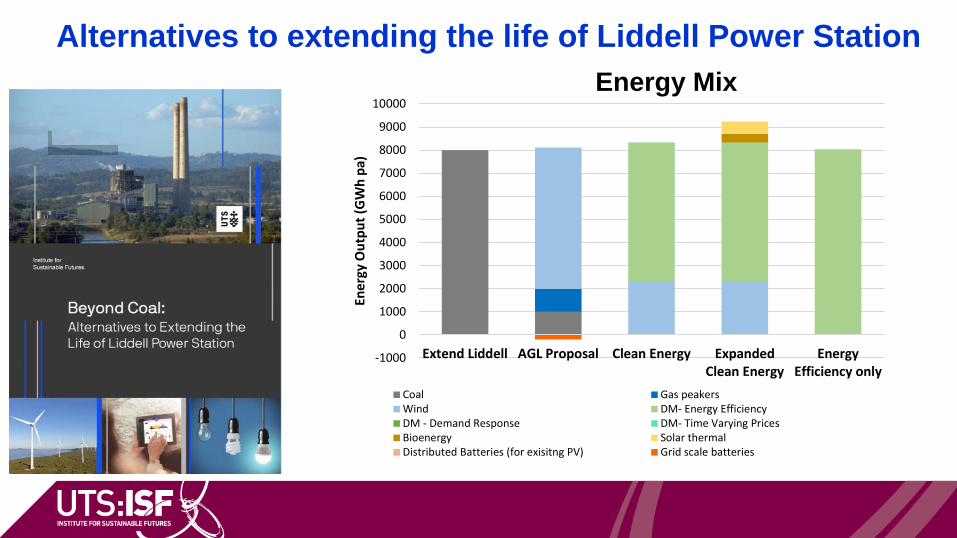
Coal Gas peakersWind DM- Energy EfficiencyDM - Demand Response DM- Time Varying PricesBioenergy Solar thermalDistributed Batteries (for exisitng PV) Grid scale batteries
Energy Mix
0
500
1000
1500
2000
2500
3000
Extend Liddell AGL Proposal Clean Energy ExpandedClean Energy
EnergyEfficiency only
Inst
alle
d Ca
paci
ty (M
W)
Coal Gas peakersWind DM- Energy EfficiencyDM - Demand Response DM- Time Varying PricesBioenergy Solar thermalDistributed Batteries (for exisitng PV) Grid scale batteries
Alternatives to extending the life of Liddell Power StationInstalled Capacity Mix
0
200
400
600
800
1000
1200
1400
1600
1800
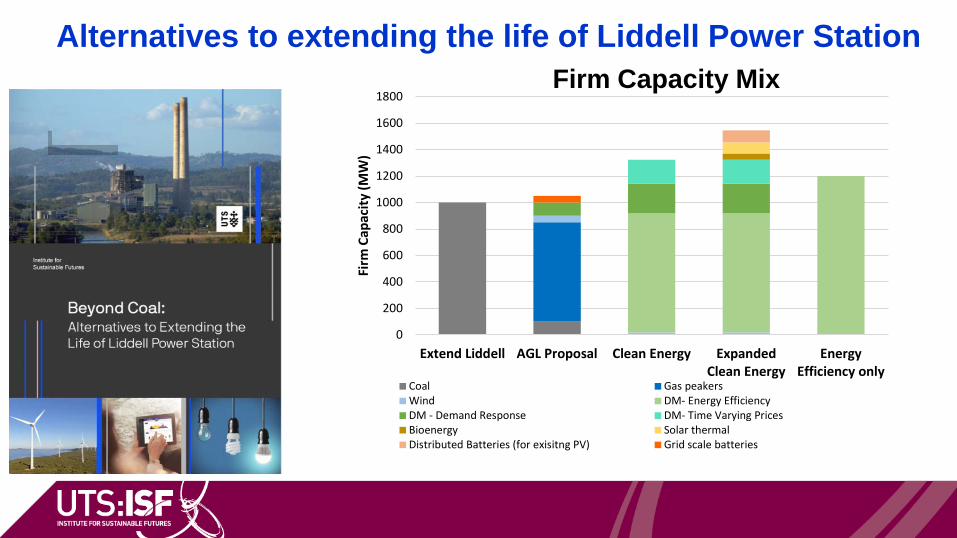
Extend Liddell AGL Proposal Clean Energy ExpandedClean Energy
EnergyEfficiency only
Firm
Cap
acity
(MW
)Coal Gas peakersWind DM- Energy EfficiencyDM - Demand Response DM- Time Varying PricesBioenergy Solar thermalDistributed Batteries (for exisitng PV) Grid scale batteries
Alternatives to extending the life of Liddell Power StationFirm Capacity Mix

Conclusions:• The Future is RED: Renewables, Efficiency and Demand
Response the keys to our energy future.
• We need a holistic approach:• Supply and demand • Generation, networks, retail, energy services• Centralised and decentralised energy• Energy and capacity • Reliability, Affordability, Sustainability • Incentives, Regulation, Information
• “NEG could be the circuit breaker we need”. Discuss.
isf.uts.edu.au