Unlocking the Potential of Emergency Savings Accounts...Unlocking the Potential of Emergency Savings...
23
Insight on the Issues OCTOBER 20 19 AARP PUBLIC POLICY INSTITUTE Unlocking the Potential of Emergency Savings Accounts Executive Summary A consensus is building around the understanding that liquid savings of between a few hundred and a few thousand dollars is a powerful buffer against unexpected financial shocks and their long-term consequences. To shed more light on the role of savings in households’ financial security, AARP analyzed data from a nationally representative survey of US consumers to identify factors related to whether a household has an emergency savings account. The report finds that emergency savings accounts are an underutilized and potentially powerful tool for financial resilience. We find the following: • Fifty-three percent of US households have no emergency savings account. • The emergency savings challenge is widespread and includes 51 percent of people over the age of 50 and people at every income level. • While no single savings goal is right for everyone, people with an emergency savings Catherine S. Harvey AARP Public Policy Institute CONTENTS The Importance of Emergency Savings .......... 2 Emergency Savings in Context ....................... 3 Definition of Emergency Savings .................... 3 Characteristics of Americans without Emergency Savings Accounts ................... 6 How Much Do Households Set Aside for Emergencies? ...................................... 7 Factors Associated with Emergency Savings ... 9 Recommendations ....................................... 14 Acknowledgments........................................ 16 About the US Financial Health Pulse ............ 17 Appendix ...................................................... 19
Transcript of Unlocking the Potential of Emergency Savings Accounts...Unlocking the Potential of Emergency Savings...

Insight on the Issues
OCTOBER 2019
AARP PUBLIC POLICY INSTITUTE
Unlocking the Potential of Emergency Savings Accounts
Executive Summary
A consensus is building around the understanding that liquid savings of between a few hundred and a few thousand dollars is a powerful buffer against unexpected financial shocks and their long-term consequences. To shed more light on the role of savings in households’ financial security, AARP analyzed data from a nationally representative survey of US consumers to identify factors related to whether a household has an emergency savings account.
The report finds that emergency savings accounts are an underutilized and potentially powerful tool for financial resilience. We find the following:
• Fifty-three percent of US households have noemergency savings account.
• The emergency savings challenge is widespreadand includes 51 percent of people over the age of50 and people at every income level.
• While no single savings goal is right foreveryone, people with an emergency savings
Catherine S. HarveyAARP Public Policy Institute
CONTENTS
The Importance of Emergency Savings .......... 2
Emergency Savings in Context ....................... 3
Definition of Emergency Savings .................... 3
Characteristics of Americans without Emergency Savings Accounts ................... 6
How Much Do Households Set Aside for Emergencies? ...................................... 7
Factors Associated with Emergency Savings ...9
Recommendations ....................................... 14
Acknowledgments ........................................ 16
About the US Financial Health Pulse ............ 17
Appendix ...................................................... 19

OCTOBER 2019
2
AARP PUBLIC POLICY INSTITUTE
account tend to feel better prepared to withstand a loss of income.
• People with an emergency savings account are 2.5times more likely to be confident in their long-term financial goals.
• Household income alone does not determinewhether someone has an emergency savingsaccount; structural factors, such as public policies
that limit asset accumulation, and individual behaviors also play a role.
These findings underscore the relationship between emergency savings and short-term and long-term financial security. They provide valuable insights for the design of policies, programs, and products aimed at helping more Americans prepare financially for the unexpected.
Introduction
Despite the United States being in the midst of a prolonged period of economic growth and record-low unemployment, a large share of Americans remain just one surprise event away from financial distress. For the sixth year in a row, the Federal Reserve reports that approximately 40 percent of American households would struggle to cope with a $400 unexpected expense.1
The reality that a car repair, a medical bill, or a temporary reduction in work hours could significantly disrupt a family’s finances has gained widespread attention. Policy makers, employers, financial technology (fintech) companies, and government and nonprofit agencies have crafted—or in some cases rediscovered—solutions to help people prepare for these common financial shocks. Solutions range from higher wages to easy and automatic ways to save, to incentivized savings and lending programs, to mobile insurance applications.
This report focuses on emergency savings accounts as one potential solution to short-term financial fragility. Analyzing the US Financial Health Pulse, a nationally representative survey of US residents ages 18 and older designed by the Financial Health Network in collaboration with the University of Southern California, we find that emergency savings accounts are an underutilized and potentially powerful tool for financial resilience.2
The report defines the population that lacks emergency savings accounts and measures the adequacy of emergency savings. It then identifies the factors that are associated with having an emergency savings account. Finally, it offers recommendations for consumers, policy makers, employers, and others who are seeking to leverage emergency savings accounts as a building block of financial well-being.
The Importance of Emergency Savings
Emergency or precautionary savings is one form of household liquidity. Liquidity refers to financial resources that consumers can quickly deploy to deal with an unexpected financial event. The Federal Reserve considers liquid savings to include balances in checking and savings accounts; cash; prepaid cards; and stocks, bonds, and mutual funds.3
Evidence is growing that liquid savings is especially useful for keeping household finances on track when they encounter a modest financial shock. For example, savings of just $250 to $749 can significantly reduce the likelihood that households will be evicted or need to rely on public benefits.4 In some cases, maintaining modest emergency savings
may be preferable to paying off high-interest debt; even a small amount of savings is associated with a lower likelihood of coming up short for rent, missing a mortgage payment, skipping medical care, or going without food.5
In addition to buffering against financial hardship in the near term, emergency savings can shore up long-term financial security. Savings can provide a safer cushion than unsecured debt and alternative high-cost financial services such as payday loans, which have been shown to keep borrowers indebted for months or years and often lead to default, delinquency, and bankruptcy.6
OCTOBER 2019
3
AARP PUBLIC POLICY INSTITUTE
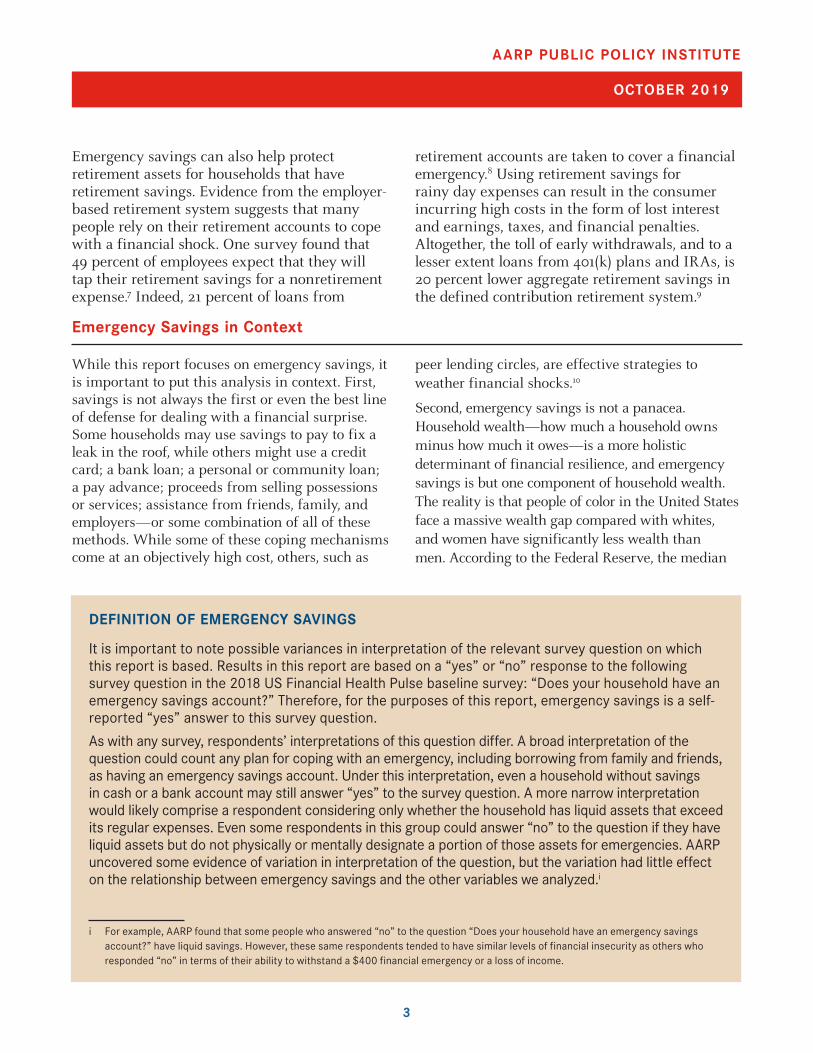
Emergency savings can also help protect retirement assets for households that have retirement savings. Evidence from the employer-based retirement system suggests that many people rely on their retirement accounts to cope with a financial shock. One survey found that 49 percent of employees expect that they will tap their retirement savings for a nonretirement expense.7 Indeed, 21 percent of loans from
retirement accounts are taken to cover a financial emergency.8 Using retirement savings for rainy day expenses can result in the consumer incurring high costs in the form of lost interest and earnings, taxes, and financial penalties. Altogether, the toll of early withdrawals, and to a lesser extent loans from 401(k) plans and IRAs, is 20 percent lower aggregate retirement savings in the defined contribution retirement system.9
Emergency Savings in Context
While this report focuses on emergency savings, it is important to put this analysis in context. First, savings is not always the first or even the best line of defense for dealing with a financial surprise. Some households may use savings to pay to fix a leak in the roof, while others might use a credit card; a bank loan; a personal or community loan; a pay advance; proceeds from selling possessions or services; assistance from friends, family, and employers—or some combination of all of these methods. While some of these coping mechanisms come at an objectively high cost, others, such as
peer lending circles, are effective strategies to weather financial shocks.10
Second, emergency savings is not a panacea. Household wealth—how much a household owns minus how much it owes—is a more holistic determinant of financial resilience, and emergency savings is but one component of household wealth. The reality is that people of color in the United States face a massive wealth gap compared with whites, and women have significantly less wealth than men. According to the Federal Reserve, the median
DEFINITION OF EMERGENCY SAVINGS
i For example, AARP found that some people who answered “no” to the question “Does your household have an emergency savings account?” have liquid savings. However, these same respondents tended to have similar levels of financial insecurity as others who responded “no” in terms of their ability to withstand a $400 financial emergency or a loss of income.
It is important to note possible variances in interpretation of the relevant survey question on which this report is based. Results in this report are based on a “yes” or “no” response to the following survey question in the 2018 US Financial Health Pulse baseline survey: “Does your household have an emergency savings account?” Therefore, for the purposes of this report, emergency savings is a self-reported “yes” answer to this survey question.
As with any survey, respondents’ interpretations of this question differ. A broad interpretation of the question could count any plan for coping with an emergency, including borrowing from family and friends, as having an emergency savings account. Under this interpretation, even a household without savings in cash or a bank account may still answer “yes” to the survey question. A more narrow interpretation would likely comprise a respondent considering only whether the household has liquid assets that exceed its regular expenses. Even some respondents in this group could answer “no” to the question if they have liquid assets but do not physically or mentally designate a portion of those assets for emergencies. AARP uncovered some evidence of variation in interpretation of the question, but the variation had little effect on the relationship between emergency savings and the other variables we analyzed.i

OCTOBER 2019
4
AARP PUBLIC POLICY INSTITUTE
64%
74%
67%
FIG
UR
E 1
.D
emog
rap
hic
s o
f H
ou
seh
old
s w
ith
an
d w
ith
ou
t E
mer
gen
cy S
avin
gs
Has
Em
erge
ncy
Savi
ngs
Acco
unt (
n=2,
163)
No
Emer
genc
y Sa
ving
s Ac
coun
t (n=
2,16
2)
Inco
me
Less
than
$20
,000
$20,
000–
$39,
000
$40,
000–
$59,
000
$60,
000–
$75,
000
$75,
000–
$99,
000
$100
,000
–$14
9,00
0$1
50,0
00 o
r m
ore
Educ
atio
nN
o hi
gh s
choo
l deg
ree
HIg
h sc
hool
deg
ree
Som
e co
llege
, no
degr
eeA
ssoc
iate
deg
ree
Bach
elor
’s de
gree
Mas
ters
deg
ree
or h
ighe
rLa
bor
Stat
usC
urre
ntly
wor
king
Une
mpl
oyed
Retir
edD
isab
led
Oth
er o
r m
ixed
sta
tus
Race
/Et
hnic
ityW
hite
, non
-His
pani
cBl
ack,
non
-His
pani
cH
ispa
nic
Oth
erM
arita
l Sta
tus*
Mar
ried
Div
orce
d or
sep
arat
edW
idow
edN
ever
mar
ried
*Peo
ple
who
are
not
mar
ried
but
livi
ng w
ith a
par
tner
are
incl
uded
in th
e ot
her
cate
gori
es.
Perc
enta
ge d
istr
ibut
ion,
by
age,
inco
me,
edu
catio
n, la
bor
stat
us, r
ace/
ethn
icity
, and
mar
ital s
tatu
s
Sex
Mal
eFe
mal
e
Age
18–2
930
–39
40–4
950
–59
60–6
970
–79
80 a
nd o
lder
Inco
me
Less
than
$20
,000
$20,
000–
$39,
000
$40,
000–
$59,
000
$60,
000–
$75,
000
$75,
000–
$99,
000
$100
,000
–$14
9,00
0$1
50,0
00 o
r mor
e
Educ
atio
nN
o hi
gh s
choo
l deg
ree
Hig
h sc
hool
deg
ree
Som
e co
llege
, no
degr
ee
Asso
ciat
e de
gree
Bach
elor
’s de
gree
Mas
ters
deg
ree
or h
ighe
r
Labo
r St
atus
Cur
rent
ly w
orki
ngU
nem
ploy
edRe
tired
Dis
able
dO
ther
or m
ixed
sta
tus
Race
/Eth
nici
tyW
hite
, non
-hisp
anic
Blac
k, n
on-h
ispa
nic
His
pani
cO
ther
Mar
ital S
tatu
sM
arrie
dD
ivorc
ed o
r sep
arat
edW
idow
edN
ever
mar
ried
52%
48%
8%27
%14
%17
%21
%10
%3% 4%
11%
16%
11%
20%
22%
16%
4%22
%15
% 12%
22%
26%
4%20
%2%
9%
7%11
%8%
11%
4%18
%
46%
54%
15%
23%
18%
19%
16%
8%1%
24%
23%
20%
8%10
%10
%5%
12%
37%
20%
10% 13
%8%
59%
58%
7%
9%11
% 13% 15
% 18%
9%
49%
20%
6%25
%
64%
74% 67
%

OCTOBER 2019
5
AARP PUBLIC POLICY INSTITUTE
6%
6%
16%
6%
4%
4% 5%
0%
53% 59% 49% 59% 56% 48% 48% 37%
Total(n=5,008)
18–29(n=509)
30–39(n=899)
40–49(n=948)
50–59(n=1,081)
60–69(n=995)
70–79(n=471)
80 and older(n=105)
Age
I don’t knowNo
FIGURE 2.Large Segments of American Households at Every Age Lack Emergency Savings Accounts
Survey question: Does your household have an emergency savings account?Unless otherwise noted, results are from bivariate, not regression, analysis.
Percentage of adults with no emergency savings account, including those who don’t know, by age
black family had just $3,600 in household wealth in 2018, the median Latino family had $6,600, and the median white family had $147,000.11 The women’s wealth gap is also wide. Median wealth for single women is $3,210 compared with $10,150 for single men, with greater disparities for women of color.12
The racial wealth gap is the result of generations of exclusionary and discriminatory policies and practices like redlining, predatory lending, and means testing in public benefits programs that has discouraged or penalized the accumulation of assets in communities of color. The women’s wealth gap shares some of these root causes but is also exacerbated by disparities in student loan debt, wages, and caregiving responsibilities that disproportionately affect women. For both groups,
limited opportunities to build wealth in the form of savings, housing, and business ownership means that intergenerational wealth transfers, such as inheritance, are also significantly lower among these groups, putting them at a disadvantage compared with their peers with similar education and income levels.
Acknowledging that these structural factors influence people’s ability to save for emergencies, it is still worth studying emergency savings as a potential proxy indicator of a household’s ability to bounce back from a financial shock and to meet long-term financial goals.

OCTOBER 2019
6
AARP PUBLIC POLICY INSTITUTE
FIGURE 3.Even Many Higher-Income Households Do Not Have an Emergency Savings Account
Total(n=5,015)
Less than $20,000(n=777)
$20,000–$39,000(n=984)
$40,000–$59,000(n=890)
$60,000–$75,000(n=508)
$75,000–$99,000(n=662)
$100,000–$149,000
(n=705)
$150,000or more(n=489)
Household Income*
I don’t knowNo
6%
11%
7%
6%
5%
5% 5%
5%
53% 78% 67% 59% 47% 38% 35% 25%
Survey question: Does your household have an emergency savings account?*Not adjusted for household size.
Characteristics of Americans without Emergency Savings Accounts
According to AARP’s analysis of the US Financial Health Pulse, 53 percent of Americans say their household does not have an emergency savings account.13 It is little surprise, therefore, that the demographic, employment, and financial characteristics of people without emergency savings resemble those of the American population as a whole (see Figure 1). However, some segments of the population are overrepresented. Compared with Americans with emergency savings, people without emergency savings are significantly more likely to14
• Describe their employment status as unemployedor disabled,
• Earn less than $60,000 a year,
• Be between the ages of 18 and 29,
• Be black or Hispanic,
• Not have a college degree, or
• Not be married.
More than half of people over age 50 have no emergency savings account.Large segments of the population at every age lack emergency savings. This includes 51 percent of Americans ages 50 and older who say they have no emergency savings account.15 Emergency savings accounts are less common among the youngest adults (ages 18 to 29), and more common among adults over age 60 (see Figure 2).16 Among these older Americans, emergency savings may
Percentage of adults with no emergency savings account, including those who don’t know, by income

OCTOBER 2019
7
AARP PUBLIC POLICY INSTITUTE
be an especially important buffer against expense volatility, which refers to large swings in spending due to unexpected events such as medical needs. Older adults are more likely to experience a wider range of volatility in their expenses compared with younger adults.17
Americans at all income levels have no emergency savings account.Not surprisingly, the likelihood of having an emergency savings account increases with income.
Nevertheless, significant shares of middle- and high-income Americans have no emergency savings account, while some low-income households do save. For example, one in four Americans earning over $150,000 has no emergency savings account (see Figure 3).
How Much Do Households Set Aside for Emergencies?
Given that American households differ greatly by size, location, and budget, it is impossible to say
how much liquid savings is enough for a household to be financially secure.18 Further, measuring an
Has Emergency Savings Account(n=2,163)*
No Emergency Savings Account(n=2,612)*
$2,000 or more
$400–$1,999
Less than $400
Don’t have this type of assetor don’t know the amount
83%
5%
7%
5%
26%
36%
24%
14%
FIGURE 4.People with an Emergency Savings Account Are More than Twice as Likely to Have $2,000 or More in Liquid Savings
*Sample includes respondents who do not own checking or savings accounts.
Amount saved in cash, checking, and savings accounts, by whether respondent has an emergency savings account

OCTOBER 2019
8
AARP PUBLIC POLICY INSTITUTE
account’s value at a single point in time is not a reliable indicator of a household’s ability to weather a financial shock, as research shows that many families, especially lower-income households, regularly build, deplete, and replenish their liquid savings.19 Nevertheless, anywhere from a few hundred to a couple thousand dollars can mean the difference between a financial setback and a financial crisis.20 The US Federal Reserve considers $400 to be a “modest financial setback.”21 A separate survey by the Pew Charitable Trusts finds that the cost of the typical American household’s most expensive unexpected expense or income loss is $2,000.22
Our analysis finds that Americans who have an emergency savings account are also more likely to have a combined total of at least $2,000 in checking accounts, savings accounts, and cash savings compared with people without emergency savings accounts. Specifically, 83 percent of people with an emergency savings account have at least $2,000 in easily accessible savings, compared with just 36 percent of people without an emergency savings account (see Figure 4). It should be noted that smaller but significant shares of people who report that they have no emergency savings account also meet these savings thresholds. One explanation for this is that households may have
FIGURE 5.People with Emergency Savings Accounts Are Five Times More Likely to Have at Least a Week of Cash on Hand.
Has Emergency Savings Account(n=2,163)
No Emergency Savings Account(n=2,612)
6 months or more
3–5 months
1–2 months
1–3 weeks
Less than 1 week
22%
5%
18%
2%
21%
16%
22%
18%
53%
23%
Survey question: At your current level of spending, how long could you and your household afford to cover expenses, if you had to live off only the money you have readily available, without withdrawing money from retirement accounts or borrowing?
Length of time households could cover expenses with existing money, by whether respondent has an emergency savings account

OCTOBER 2019
9
AARP PUBLIC POLICY INSTITUTE
Less than $40,000household income
22% 91%
53%
87%
55% 68%
86%
44%
65%
36%
$40,000–$59,000 $60,000–$99,000 $100,000 or more
Strongly agree
41% 56%
21% 17% 29% 35%*
Somewhat agree
Neither
Disagree
FIGURE 6.Households that Plan Ahead Financially Are More Likely to Have Three Months of Cash on Hand, Regardless of Income
Percentage of adults with three or more months of financial reserves, by household income and agreement with “My household plans ahead financially”
*Use caution when interpreting due to small sample size.
their liquid savings earmarked for current or very near-term expenses, rather than for emergencies.
Another commonly cited threshold for recommended emergency savings is 3 months of expenses. This rule of thumb is roughly based on a typical spell of unemployment. (In today’s robust labor market, the median duration of unemployment for workers over 20 years old is 8.6 weeks. For workers 55 to 64 years old, it is 10.5 weeks.23) We find that 76 percent of people who
have an emergency savings account say they could maintain current expenses for 3 months or more without drawing from their retirement savings or borrowing.24 Among people without an emergency savings account, only 39 percent could do so. Even more striking is that people without an emergency savings account are nine times more likely to have less than 1 week of cash on hand compared with those with an emergency savings account (see Figure 5).
Factors Associated with Emergency Savings
Income—in particular income that exceeds spending—is an important predictor of whether someone has an emergency savings account; however, our analysis of the US Financial Health Pulse finds that other factors have a stronger
statistical relationship with emergency savings than income.25 The following analysis suggests that income is not the only factor that matters when it comes to saving for the unexpected.26

OCTOBER 2019
10
AARP PUBLIC POLICY INSTITUTE
FIGURE 7.People with Emergency Savings Accounts Are 2.5 Times More Likely to Be Confident in Their Long-Term Goals
Survey question: Thinking about your household’s longer-term financial goals, such as saving for a vacation, starting a business, buying or paying off a home, saving up for education, putting money away for retirement, or making retirement funds last. . . . How confident are you that your household is currently doing what is needed to meet your longer-term goals?
Has Emergency Savings Account
(n=2,163)
No Emergency Savings Account
(n=2,612)
5%
24%
53%61%
Adults who are confident in their longer-term goals, by whether their household has an emergency
savings account
Three Months or More
(n=2,821)
Less Than Three Months
(n=2,189)
59%
17%
FIGURE 8. Having a Financial Cushion Is Associated with Long-Term Financial Confidence
Adults who are confident in their long-term financial goals, by whether they have three months of cash
on hand
Survey questions: Thinking about your household’s longer-term financial goals, such as saving for a vacation, starting a business, buying or paying off a home, saving up for education, putting money away for retirement, or making retirement funds last. . . . How confident are you that your household is currently doing what is needed to meet your longer-term goals? At your current level of spending, how long could you and your household afford to cover expenses if you had to live only off the money you have readily available, without withdrawing money from retirement accounts or borrowing?
It should be noted that any statistical relationship between emergency savings accounts and the other variables does not imply causality. That is, while certain behaviors, financial conditions, and other variables may be related to having an emergency savings account, one does not necessarily cause the other.
Saving for emergencies is linked to long-term financial planning and confidence.Self-reported planning behavior is more strongly related to having an emergency savings account than the level of household income. Figure 6 shows that, at every income level above $40,000, similar shares of households that plan ahead financially have a substantial financial cushion in case of emergency. Conversely, households that do not plan ahead financially are less likely to have a cushion, regardless of income.

OCTOBER 2019
11
AARP PUBLIC POLICY INSTITUTE
I worried whether ourfood would run out before I got money to buy more.
No Emergency Savings Account(n=2,162)
6%
Has Emergency Savings Account (n=2,163)
We had trouble payingour rent or mortgage.
I or someone in my household did not gethealthcare we neededbecause we couldn’t
afford it.
I or someone in my household stopped taking
a medication or tookless than directed due
to the costs.
In the last twelve months . . .
Perc
ent W
ho S
aid
“Oft
en”
or “
Som
etim
es”
36%
5%7%
11%
32%34%
24%
FIGURE 9.People without Emergency Savings Accounts Are Far More Likely to Have Experienced Financial Hardship in the Past Year
Adults who experienced financial hardship in the past year, by whether their household has an emergency savings account
This is not to suggest that a planning mentality on its own is sufficient to build emergency savings; it merely underscores that the relationship between short-term and long-term financial security cannot be ignored. Indeed, people with an emergency savings account are 2.5 times more likely to say they are very or moderately confident that they will meet their long-term financial goals than those without an account (see Figure 7).
Simply having an emergency savings account is not a guarantee of long-term financial security; a more relevant indicator of future financial outcomes is the size of a household’s financial cushion.27 For example, 59 percent of people who have savings to maintain their standard of living for three months or more are also very or moderately confident they can achieve their long-term financial goals. Among those with less than three months of expenses on hand, only 17 percent are confident about the long term (see Figure 8).

OCTOBER 2019
12
AARP PUBLIC POLICY INSTITUTE
Che
ckin
g Ac
coun
t86
%
Do
you
or a
nyon
e in
you
r ho
useh
old
have
any
of t
he fo
llow
ing
finan
cial
ass
ets
or a
ccou
nts?
98%
94%
19%
66%
61%
40%42
%
Adul
ts w
ithou
t Em
erge
ncy
Savi
ngs
Acco
unt (
n=2,
162)
Adul
ts w
ith E
mer
genc
y Sa
ving
s Ac
coun
t (n=
2,16
3)
51%
17%
55%
19%
65%
28%
11%
4%
Savi
ngs
Acco
unt
Empl
oyer
-pro
vide
d Re
tirem
ent A
ccou
nt(e
.g.,
401(
k), 4
03(b
) or
Thrif
t Sav
ings
Pla
n (T
SP))
Empl
oyer
-pro
vide
d Tr
aditi
onal
Pen
sion
or C
ash
Bala
nce
Plan
Indi
vidu
al R
etire
men
t Acc
ount
Not
Pro
vide
d by
an
Empl
oyer
(IRA
, Keo
gh, S
EP, o
r A
ny
Oth
er R
etire
men
t Fun
d)
Oth
er P
erso
nal S
avin
gs o
r In
vest
men
ts s
uch
asM
utua
l Fun
ds, M
oney
Mar
ket A
ccou
nts,
Sto
cks,
Cer
tifica
tes
of D
epos
it, o
r A
nnui
ties,
etc
.
Savi
ngs
in C
ash
Oth
er F
inan
cial
Ass
ets
or A
ccou
nts
Excl
udin
g Re
al E
stat
e or
Hou
sing
FIG
UR
E 1
0.
Ow
ners
hip
of F
inan
cial
Ass
ets
and
Acc
ount
s C
orre
late
s w
ith
Hav
ing
an E
mer
genc
y S
avin
gs A
ccou
nt
Surv
ey q
uest
ion:
Do
you
or a
nyon
e in
you
r ho
useh
old
have
any
of t
he fo
llow
ing
fina
ncia
l ass
ets
or a
ccou
nts?
Perc
enta
ge o
f adu
lts w
ho o
wn
vario
us fi
nanc
ial a
sset
s or
acc
ount
s, b
y w
heth
er th
eir
hous
ehol
d ha
s an
em
erge
ncy
savi
ngs
acco
unt

OCTOBER 2019
13
AARP PUBLIC POLICY INSTITUTE
A tangible financial behavior that illustrates the link between emergency savings and long-term financial confidence is projecting a household’s retirement savings needs. Studies show that retirement confidence increases and people are more likely to save for retirement when they make the effort to calculate how much money they need to retire.28 Our analysis finds that projecting retirement savings needs is more strongly associated with having an emergency savings account than income.
Households with no emergency savings are more likely to experience financial hardship, regardless of their income.The relationship between financial hardship and emergency savings is stronger than that of income and emergency savings, according to AARP’s analysis. Compared with Americans with emergency savings, those without an emergency savings account are
• Six times more likely to have had troublepaying rent or mortgage in the past year,
• Six times more likely to say they worried aboutbeing able to afford food, and
• Three times more likely to forgo needed healthcare or medication due to cost (see Figure 9).
As with all the variables AARP analyzed, while financial hardship and emergency savings accounts have a strong inverse relationship, the direction of the relationship is not clear from the data. Having
emergency savings may have prevented these hardships; conversely, those who experience frequent hardship may be unable to build savings. These hardships point to the major role that structural factors and economic conditions play in a household’s ability to save for emergencies.
People with emergency savings accounts are more likely to use automatic transfers.Another factor that is strongly linked to emergency savings is the use of automatic transfers to move money to savings or investments. People with an emergency savings account are more than twice as likely to use automatic transfers—such as between checking and savings accounts—compared with people without an emergency savings account. Among people whose household has an emergency savings account, 55 percent use automatic transfers, compared with 25 percent of those whose households have no emergency savings account.
Lack of account ownership may be one barrier to saving for emergencies, since the ability to transfer automatically into savings requires access to two or more financial accounts with a transfer feature. People without emergency savings accounts are less likely to own traditional financial products and services (see Figure 10). For instance, 61 percent of people without an emergency savings account have a savings account of some kind, compared with 94 percent of people who say they have an emergency savings account.
WHAT CAN VARIOUS STAKEHOLDERS DO TO HELP MORE AMERICANS SAVE FOR EMERGENCIES?
• Policy makers: Remove barriers toaccumulating liquid assets and createthe conditions that make it easy andrewarding to save for short-term needs.
• Providers of financial services,including financial institutions, fintechcompanies, and service deliveryorganizations: Incorporate behavioraleconomics principles, design safe and
affordable products, services, and tools that respond to the needs of the most vulnerable.
• Employers: Facilitate the automatictransfer of pay to savings accounts.
• Researchers: Further examine therelationship between short-term and long-term financial security and measure theeffectiveness of savings interventions.

OCTOBER 2019
14
AARP PUBLIC POLICY INSTITUTE
Recommendations
Our analysis of the US Financial Health Pulse confirms and builds on the evidence base that emergency savings is a critical component of household financial security. While emergency savings accounts will not be enough to protect households from every type of financial shock or to mitigate the effects of generations of harmful economic policies and practices, AARP’s analysis makes a strong case for the potential of emergency savings accounts to guard against such shocks and to
improve long-term financial confidence. Unlocking this potential for more Americans will require interventions by a range of stakeholders (see textbox).
The following principles are intended to guide stakeholders in the design of policies, programs, and products to help people save for emergencies. The principles draw on AARP’s analysis of the demographic, behavioral, and structural factors that play a role in emergency savings.
1. Savings interventions must respond to the needs of the most vulnerable.
The widespread nature of the emergency savings challenge means that large-scale interventions have the potential to affect millions of people. However, a one-size-fits-all solution may exacerbate the conditions that cause some groups, such as people of color and unmarried people, to be less likely to have an emergency savings account. For that reason, interventions must respond to the unique
circumstances and preferences of Americans who are especially unlikely to have emergency savings. Applying the principle of targeted universalism, which aims to serve everyone by deploying different strategies for different groups, will ensure that savings interventions benefit the most people and do not inadvertently reinforce existing disparities.29
2. Good intentions are necessary but not sufficient.
AARP’s findings may tempt some to conclude that people simply need to adopt a planning mentality in order to save; however, while many people aspire to plan ahead, few follow through on their intentions.30 That is why savings solutions that incorporate behavioral economics principles are more likely to help people save than efforts that rely solely on financial education. For example, there is strong evidence of the power of mental accounting; the very act of designating money for multiple “envelopes” to go toward specific goals—such as education or an emergency—results in higher savings rates.31
Still, such “nudges” alone are unlikely to help consumers overcome major structural barriers that make it difficult to save. Policy makers have an important role to play in removing barriers that prevent people from saving. For example, asset limits in public benefits programs unduly penalize savings among low-income families.32 Raising asset limits or exempting savings from asset tests could create the conditions for savings interventions to succeed.

15
AARP PUBLIC POLICY INSTITUTEAARP PUBLIC POLICY INSTITUTE
OCTOBER 2019
3. Access to safe and affordable financial products is essential.
The disparity in ownership of traditional banking products between people with and without emergency savings underscores the need for financial inclusion as part of the solution to the savings challenge. This is not to say that Americans without bank accounts do not save; on the contrary, people manage money outside the traditional financial system in a variety of creative and complex ways.33 Nevertheless, the ability to set up, maintain, and financially benefit from saving is greatly enhanced by access to safe and affordable financial products.
Policy makers and financial institutions both have a role to play in expanding access to the financial mainstream, especially for communities
of color.34 Banks and credit unions are scarcer in neighborhoods with large concentrations of blacks, Latinos, and Asians, leaving many people to rely on high-cost alternative financial services such as pawn shops and payday lenders to meet their daily financial needs.35 Expanding banking services and removing features that discourage low-balance savings—such as minimum balance requirements, overdraft fees, and ATM fees—could go a long way toward expanding opportunities to save. So could policies to rein in discriminatory banking practices, increase transparency in pricing, and protect consumers from predatory products.36
4. Financial services providers should facilitate greater use of automatic transfers to emergency savings accounts.
Providers of financial products and services—including banks, credit unions, fintech firms, employers, and service delivery organizations—have an opportunity to optimize their offerings to help their existing customers build a liquid savings cushion. AARP’s analysis makes a clear case for the use of automatic transfers as a financial behavior that helps people save for emergencies. This aligns with the broad body of evidence that automation in savings products leads to better financial outcomes.37
One effective way to get more people to automatically transfer money into an emergency savings account is to make it the default. This
behavioral economics principle is widely used in 401(k) retirement plans to regularly route a portion of employees’ pay to their retirement accounts, unless they opt out.38 Automatic enrollment has been shown to greatly increase 401(k) participation rates among employees regardless of income, age, gender, race, and ethnicity.39 Employers and other intermediaries can play a transformational role in leveraging automatic enrollment and other default options that nudge workers to participate. AARP is one of a growing number of researchers, financial institutions, and policy experts that support the use of automatic enrollment into a payroll deduction emergency savings account.40

OCTOBER 2019
16
AARP PUBLIC POLICY INSTITUTE
5. Researchers should measure the effectiveness of interventions.
AARP’s analysis of the US Financial Health Pulse offers a foundation of data and insights for targeting solutions to help more Americans build emergency savings. As important as this analysis is to understanding the scope of the emergency savings challenge, it leaves open many questions for future research. For instance, what are the long-term financial outcomes of people who have emergency savings? What is an appropriate blend of liquid savings and credit for coping with a financial shock?Research is also crucial to understanding the effectiveness of savings interventions in the lives of the people they are designed to reach. Among
the critical indicators of success are whether more people report saving for emergencies, whether they fund a savings account or other liquid savings vehicle, whether and on what they spend that savings, and whether their short- and long-term financial well-being improves. Some of these data will be relatively easy to obtain, while others will require longitudinal studies to track people over time as well as real-time data from their financial accounts to complement survey responses. Given the importance of emergency savings to overall financial security, high-quality measurement and evaluation is worthwhile.
Acknowledgments
The author wishes to thank S. Kathi Brown, senior research advisor at AARP, for her analysis of the US Financial Health Pulse data. Thanks also to AARP colleagues David C. John, Gary Koenig, Carl Levesque, Shen Han Lee, Debra Whitman, Susan Reinhard, and Ramsey Alwin for their input and guidance. Special thanks to the following individuals for their invaluable input and thought partnership on this report and on AARP’s financial security initiative:
• Dedrick Asante-Muhammad, NationalCommunity Reinvestment Coalition
• George Barany, Consumer Federation of America
• Don Baylor Jr., The Annie E. Casey Foundation
• Camille Busette, The Brookings Institution
• Susy Cheston, independent consultant
• Bill Druliner, GreenPath Financial Wellness
• Jessica Fulton, The Joint Center for Political andEconomic Studies
• Theron Guzoto, The Pew Charitable Trusts
• Clinton Key, MDRC
• Greg Levin, BlackRock
• Lori Lucas, Employee Benefit Research Institute
• Annamaria Lusardi, The George WashingtonUniversity School of Business
• Signe-Mary McKernan, Urban Institute
• Genevieve Melford, Aspen Institute
• David Newville, Prosperity Now
• Chandni Ohri, Financial Health Network
• Caroline Ratcliffe, Consumer FinancialProtection Bureau
• Lowell Ricketts, Federal Reserve Bankof St. Louis
• Stephanie Román, UnidosUS
• Rachel Schneider, Aspen Institute
• Nashila Somani-Ladha, Commonwealth
• Rusty Toler, Women’s Institute for a SecureRetirement
• Chex Yu, JPMorgan Chase Institute
• Justine Zinkin, Neighborhood Trust FinancialPartners

OCTOBER 2019
17
AARP PUBLIC POLICY INSTITUTE
1 Board of Governors of the Federal Reserve System, “Report on the Economic Well-Being of U.S. Households in 2018,” Washington, DC, May 2019, https://www.federalreserve.gov/publications/files/2018-report-economic-well-being-us-households-201905.pdf. This percentage has decreased slightly over the life of the survey.
2 AARP analysis of the US Financial Health Pulse uses the 2018 baseline survey results. Thea Garon et al., “U.S. Financial Health Pulse 2018 Baseline Survey Results,” Financial Health Network, Chicago, IL, November 2018, https://s3.amazonaws.com/cfsi-innovation-files-2018/wp-content/uploads/2019/07/10195418/FHN-Pulse_Baseline_SurveyResults-5.10.19.pdf
3 Neil Bhutta and Lisa Dettling, “Money in the Bank? Assessing Families’ Liquid Savings Using the Survey of Consumer Finances,” FEDS Notes, Board of Governors of the Federal Reserve System, Washington, DC, November 19, 2018, https://doi.org/10.17016/2380-7172.2275.
4 Signe-Mary McKernan et al., “Thriving Residents, Thriving Cities: Family Financial Security Matters for Cities,” Urban Institute, Washington, DC, April 21, 2016, https://www.urban.org/research/publication/thriving-residents-thriving-cities-family-financial-security-matters-cities.
5 Emily Gallagher and Jorge Sabat, “Cash on Hand Is Critical for Avoiding Hardship,” Federal Reserve Bank of St. Louis, St. Louis, MO, November 2017, https://www.stlouisfed.org/publications/in-the-balance/2017/cash-on-hand-is-critical-for-avoiding-hardship.
6 Susanna Montezemolo, “The State of Lending in America and Its Impact on U.S. Households,” Center for Responsible Lending, Washington, DC, September 2013, https://www.responsiblelending.org/sites/default/files/uploads/10-payday-loans.pdf.
7 “PwC’s 8th Annual Employee Financial Wellness Survey,” PwC US, published 2019, https://www.pwc.com/us/en/private-company-services/publications/assets/pwc-2019-employee-wellness-survey.pdf.
8 Transamerica Center for Retirement Studies, “19th Annual Transamerica Retirement Survey of Workers,” Los Angeles, CA, May 20, 2019, https://transamericacenter.org/docs/default-source/retirement-survey-of-workers/tcrs2019_sr_what_is_retirement_by_generation.pdf.
9 Alicia H. Munnell and Anthony Webb, “The Impact of Leakages from 401(k)s and IRAs,” Center for Retirement Research at Boston College, Chestnut Hill, MA, February 2015, https://crr.bc.edu/wp-content/uploads/2015/02/wp_2015-2.pdf.
10 See Mission Asset Fund https://missionassetfund.org/impact/
11 Chuck Collins et al., “Ten Solutions to Bridge the Racial Wealth Divide,” Institute for Policy Studies, Washington, DC, April 2018, https://inequality.org/wp-content/uploads/2019/04/Ten-Solutions-to-Bridge-the-Racial-Wealth-Divide-FINAL-.pdf.
12 Mariko Chang, “Women and Wealth: Insights for Grantmakers,” Asset Funders Network, 2015, https://static1.squarespace.com/static/5c50b84131d4df5265e7392d/t/5c54781a8165f5b8546f8a34/1549039642955/AFN_Women_and_Wealth_Brief_2015.pdf.
13 This is consistent with results from other recent surveys, such as the US Financial Capability Survey from FINRA. See https://www.usfinancialcapability.org/downloads/NFCS_2018_Report_Natl_Findings.pdf
14 AARP’s analysis is limited to these individual characteristics as they relate to having an emergency savings account. It stands to reason that people who have two or more of these characteristics may be even less likely to have an emergency savings account compared with their peers; however, such conclusions are beyond the scope of this report.
15 These results are consistent with the general findings of Catherine Harvey and William Shiflett, “Liquid Savings of Working Households Ages 50–64,” AARP Public Policy Institute, Washington, DC, May 2017, https://www.aarp.org/ppi/info-2017/liquid-savings-of-working-households.html.
16 Based on regression analysis.
17 Diana Farrell and Fiona Greig, “Coping with Costs: Big Data on Expense Volatility and Medical Payments,” JPMorgan Chase and Co. Institute, New York, NY, February 2017, https://www.jpmorganchase.com/corporate/institute/report-coping-with-costs.htm.
18 Various measures and indices of income and asset sufficiency take into account family structure, location, and life stage. Insight Center for Community Economic Development, “Measuring Up: Aspirations for Economic Security in the 21st Century,” Oakland, CA, March 2013, http://kresge.org/sites/default/files/Measuring-Up-Economic-Security-in-21st-Century.pdf
ABOUT THE US FINANCIAL HEALTH PULSE
The US Financial Health Pulse is made possible through a founding partnership with Flourish, a venture of The Omidyar Group. Additional support is provided by MetLife Foundation, founding sponsor of the Financial Health Network’s financial health work, and AARP. The University of Southern California Dornsife Center for Economic and Social Research is fielding the study to its online panel, the Understanding America Study. Engineers and data analysts at Plaid are collecting and analyzing transactional and account data from study participants who authorize it.

OCTOBER 2019
18
AARP PUBLIC POLICY INSTITUTE
19 Jonathan Morduch et al., “Emergency Savings,” U.S. Financial Diaries, June 2015, http://www.usfinancialdiaries.org/issue4-emersav; Diana Farrell and Fiona Greig, “Weathering Volatility: Big Data on the Financial Ups and Downs of U.S. Individuals,” JPMorgan Chase and Co. Institute, New York, NY, May 2015, https://www.jpmorganchase.com/corporate/institute/report-weathering-volatility.htm
20 Robert E. Friedman, A Few Thousand Dollars: Sparking Prosperity for Everyone (New York, NY: The New Press, 2018).
21 Board of Governors of the Federal Reserve System, “Report on the Economic Well-Being.”
22 The Pew Charitable Trusts, “The Role of Emergency Savings in Family Financial Security: How Do Families Cope with Financial Shocks?” The Pew Charitable Trusts, Washington, DC, October 2015, https://www.pewtrusts.org/en/research-and-analysis/issue-briefs/2015/10/the-role-of-emergency-savings-in-family-financial-security-how-do-families
23 AARP Public Policy Institute analysis of the Current Population Survey data from the US Department of Labor, Bureau of Labor Statistics. AARP Public Policy Institute, “Employment Data Digest,” AARP Public Policy Institute, Washington, DC, July 2019, https://www.aarp.org/content/dam/aarp/ppi/2019/07/employment-data-digest-june.pdf.
24 AARP does not endorse any specific savings level as a target. The three-month threshold is reported because it is a common rule of thumb among personal finance writers and experts.
25 AARP finds that Americans without an emergency savings account are about twice as likely as those with an emergency savings account (61 percent v. 29 percent, respectively) to spend more than or equal to their income. In fact, for 22 percent of people with no emergency savings account, their spending exceeds their income, compared with just 8 percent of people with an emergency savings account.
26 Based on regression analysis. See appendix for more details.
27 Based on regression analysis. See appendix for more details.
28 Employee Benefit Research Institute and Greenwald and Associates, “The 2019 Retirement Confidence Survey,” EBRI, Washington, DC, April 23, 2019, https://www.ebri.org/docs/default-source/rcs/2019-rcs/2019-rcs-short-report.pdf?sfvrsn=85543f2f_4.
29 John A. Powell, Stephen Menendian, and Wendy Ake, “Targeted Universalism: Policy and Practice,” Haas Institute for a Fair and Inclusive Society, University of California, Berkeley, CA, May 2019, https://haasinstitute.berkeley.edu/targeteduniversalism.
30 David Laibson, “Golden Eggs and Hyperbolic Discounting,” The Quarterly Journal of Economics, May 1997, 112(2): 443-477, https://dash.harvard.edu/bitstream/handle/1/4481499/Laibson_GoldenEggs.pdf?sequence%253D2.
31 Dilip Soman and Amar Cheema, “Earmarking and Partitioning: Increasing Saving by Low-Income Households,” special interdisciplinary issue, Journal of Marketing Research 48 (2011): 14-22.
32 Caroline Ratcliffe et al., “Asset Limits, SNAP Participation, and Financial Stability,” Urban Institute, Washington, DC, June 2016, https://www.urban.org/sites/default/files/2000843-asset-limits-snap-participation-and-financial-stability.pdf.
33 Jonathan Morduch and Rachel Schneider, The Financial Diaries: How American Families Cope in a World of Uncertainty (Princeton, NJ: Princeton University Press, 2017).
34 Emanuel Nieves, Chuck Collins, and Josh Hoxie, “The Ever-Growing Gap: Without Change, African-American and Latino Families Won’t Match White Wealth for Centuries,” Prosperity Now, Washington, DC, August 2016, https://prosperitynow.org/esources/ever-growing-gap-without-change-african-american-and-latino-families-wont-match-white.
35 Christopher Brown, Marisabel Torres, and Rebecca Loya, “The Future of Banking: Overcoming Barriers to Financial Inclusion for Communities of Color,” UnidosUS and PolicyLink, Washington, DC, June 2019, http://publications.unidosus.org/bitstream/handle/123456789/1955/future_of_banking_52419_v3.pdf?sequence=1&isAllowed=y.
36 “AARP Consumer Principles,” AARP, accessed September 2019, https://policybook.aarp.org/policy-book/financial-services-and-consumer-products/aarp-consumer.
37 William G. Gale et al., Automatic: Changing the Way America Saves (Washington, DC: Brookings Institution Press, 2009).
38 For example, 48 percent of Vanguard defined contribution plans used automatic enrollment in 2018. Vanguard, “How America Saves 2019,” https://institutional.vanguard.com/iam/pdf/HAS2019.pdf.
39 Brigitte C. Madrian and Dennis F. Shea, “The Power of Suggestion: Inertia in 401(k) Participation and Savings Behavior,” Quarterly Journal of Economics 116 (November 2001): 1149–87.
40 John Beshears et al., “Building Emergency Savings through Employer-Sponsored Rainy Day Savings Accounts,” Working Paper 26498, National Bureau of Economic Research, Cambridge, MA, November 2019, https://www.nber.org/papers/w26498?utm_campaign=ntwh&utm_medium=email&utm_source=ntwg6; Catherine Harvey, David John, and Kathi Brown, “Saving at Work for a Rainy Day: Perspectives from Employees,” AARP Public Policy Institute, Washington, DC, September 2018, https://www.aarp.org/content/dam/aarp/ppi/2018/09/rainy-day-national-survey.pdf; Joanna Ain, David Newville, and J. Mark Iwry, Saving for Now and Saving for Later: Rainy Day Savings Accounts to Boost Low-Wage Workers’ Financial Security,” Prosperity Now, Washington, DC, June 2018, https://prosperitynow.org/resources/saving-now-and-saving-later.

OCTOBER 2019
19
AARP PUBLIC POLICY INSTITUTE
Appendix
i See Aspen Institute Financial Security Program, Expanding Prosperity Impact Collaborative initiative, http://www.aspenepic.org/epic-issues/income-volatility/.
ii Anqui Chen, “Why Are so Many Households Unable to Cover a $400 Unexpected Expense?” Issue in Brief Number 19-11, Center for Retirement Research, Boston College, Boston, MA, July 2019, https://www.aarp.org/content/dam/aarp/ppi/2019/05/a-look-at-college-costs-across-generations.doi.10.26419-2Fppi.00063.001.pdf.
Summary of Factors Significantly Related to Whether a Household Has an Emergency Savings Account, Based on Regression Analysis All variables are from the 2018 baseline survey of the US Financial Health Pulse.
Strongly associated with having an emergency savings account• Plans ahead financially
• Has calculated amount needed to save forretirement
• Hardship over past 12 months (negative)
• Uses automatic transfers
• Household income
Moderately associated with having an emergency savings account• Spending relative to income (negative)
• Level of education
• Has talked to a financial adviser
• Uses a budget
Weakly associated with having an emergency savings account• Pays bills on time
• Non-Hispanic black (negative)
• Predictable income
• Degree to which debt is unmanageable (negative)
• Separated or divorced (negative)
• Asian or Pacific Islander (negative)
Of particular note are two topics of recent interest to scholars of household finance. First, having predictable income—defined in the survey as being able to predict one’s income for every month of the year—is a weak but significant predictor of having
an emergency savings account. This supports a host of evidence that predictable income is a powerful determinant of financial security (see Explanation of Hardship Score).i
Unmanageable debt is another indicator that has a weak but significant inverse relationship with having an emergency savings account. That is, people who report having a manageable amount of debt are more likely to have an emergency savings account. Recent research on debt and emergency savings delves further into this interaction.ii
Technical Note and Regression OutputsRegression to Determine Variables Associated with Having an Emergency Savings Account Regression analysis was used to determine which demographic, behavioral, and attitudinal variables are most strongly related to having an emergency savings account. The regression analysis included only respondents who answered “yes” or “no” when asked if they have an emergency savings account; people who said “don’t know” were excluded. Because the dependent variable is dichotomous (whether or not someone has an emergency savings account), this was a binomial logistic regression. The regression utilized a stepwise selection method, forward selection (likelihood ratio), to select the demographic, behavioral, and attitudinal variables that are the strongest predictors of the variance in whether each respondent has an emergency savings account. Various iterations of the regression were performed. The set of predictor variables selected by the final regression is listed in Table 3.
All variables were standardized (i.e., converted into z-scores) before being entered into the regression inorder to reduce the effect of each variable’s scale on the size of each regression coefficient. Categorical variables such as marital status, race/ethnicity, and employment status were converted into dummy

OCTOBER 2019
20
AARP PUBLIC POLICY INSTITUTE
TABLE 2
Classification Table
Observed
Predicted
Q117aPercentage
Correct0.00 (no)
1.00 (yes)
Step 15
Q117a (1 = yes, 0 = no)
.00 2105 523 80.1
1.00 518 1542 74.9
Overall Percentage 77.8
TABLE 3.
Significant Predictor Variables
B SE Wald df Sig. Exp(B) Relative Importance
Plans ahead financially 0.503 0.051 96.454 1 0.000 1.654 Very strong
Has calculated amount needed to save for retirement 0.292 0.041 51.349 1 0.000 1.339 Strong
Hardship score* –0.399 0.058 46.970 1 0.000 0.671 Strong
Uses automatic transfers 0.274 0.038 51.845 1 0.000 1.316 Strong
Household income 0.248 0.047 28.420 1 0.000 1.281 Strong
Spending relative to income –0.284 0.044 42.108 1 0.000 0.753 Moderate
Education 0.206 0.042 23.625 1 0.000 1.228 Moderate
Has talked to financial adviser 0.204 0.040 26.536 1 0.000 1.226 Moderate
Uses a budget 0.156 0.039 15.874 1 0.000 1.169 Moderate
Pay bills on time 0.139 0.063 4.853 1 0.028 1.149 Weak
Non-Hispanic black –0.149 0.042 12.898 1 0.000 0.861 Weak
Income unpredictability –0.131 0.051 6.505 1 0.011 0.878 Weak
Degree to which debt is unmanageable –0.125 0.049 6.486 1 0.011 0.883 Weak
Separated/divorced –0.104 0.039 7.064 1 0.008 0.901 Weak
Asian or Hawaiian/Pacific Islander –0.099 0.037 7.264 1 0.007 0.906 Weak
Constant –0.521 0.041 160.445 1 0.000 0.594
TABLE 1.
Model Summary
Step –2 loglikelihood
Cox and Snell
R Square
Nagelkerke R Square
15 4436.806 0.346 0.464
variables first and then those dummy variables were converted into z-scores.
As shown in Table 1, the regression model explains roughly 35 percent to 46 percent of the variance in whether respondents have an emergency savings account. Table 2 reveals that, for 77.8 percent of the respondents, the model correctly predicts whether they have an emergency savings account.
In order to ensure that the regression results would not be distorted by independent variables that may in fact be the same as the dependent variable, we intentionally excluded all variables from the regression analysis that represented specific types of accounts or assets owned by the respondent. Specifically, we intentionally excluded the following variables from the regression: whether the respondent has a checking account, a savings account, an employer-provided retirement account, an individual retirement account

OCTOBER 2019
21
AARP PUBLIC POLICY INSTITUTE
Variables Removed from Regression Model through the Forward Likelihood Ratio Selection Method
• Gender
• Age
• Variability of income
• Frequency of financial struggles while growing up
• How often family discussed financial matters withyou growing up
• Non-Hispanic other
• Non-Hispanic white
• Hispanic
• Full time
• Part time
• Self-employed
• Partner in partnership (as main job)
• Consultant
• Other (as main job)
• Not currently working
• Married or partnered
• Widowed
• Never married
not provided by an employer, an employer-provided pension or cash balance plan, other personal savings or investments, savings in cash, and other financial assets or accounts.
Explanation of Hardship ScoreThe hardship variable in the regression was calculated by adding each respondent’s responses to each of the four hardship questions in the survey questionnaire. Potential scores ranged from 0 to 8 using the point allocation shown below.
In the past 12 months, I worried whether our food would run out before I got money to buy more.• Often (2 points)
• Sometimes (1 point)
• Never (0 points)
In the past 12 months, we had trouble paying our rent or mortgage.• Often (2 points)
• Sometimes (1 point)
• Never (0 points)
In the past 12 months, I or someone in my household did not get health care we needed because we couldn’t afford it.• Often (2 points)
• Sometimes (1 point)
• Never (0 points)
In the past 12 months, I or someone in my household stopped taking a medication or took less than directed due to the costs.• Often (2 points)
• Sometimes (1 point)
• Never (0 points)
Once a hardship score was computed for each respondent, the scores were divided into categories as shown in Table 4..
Regression to Identify Predictors of Confidence in Achieving Long-Term Savings GoalsA stepwise regression was conducted to identify the significant predictors of confidence in achieving long-term savings goals. The regression revealed that the following three variables are most strongly related to confidence in achieving long-term savings goals:
• Amount of liquid savings
• Degree to which debt is unmanageable
• Spending relative to income

OCTOBER 2019
22
AARP PUBLIC POLICY INSTITUTE
TABLE 4.
Hardship Score CategoriesFrequency Percentage Valid Percentage
Valid
No hardship 2,929 58.3 58.3
Hardship score of 1 766 15.2 15.3
Hardship score of 2 447 8.9 8.9
Hardship score of 3 272 5.4 5.4
Hardship score of 4 or more 608 12.1 12.1
Total 5,021 99.9 100.0
Missing System 4 0.1
Total 5,026 100.0
TABLE 5.
Model Summary
Model R R Square Adjusted R Square SE of the Estimate
o.693m 0.480 0.478 1.01411

AARP PUBLIC POLICY INSTITUTE
23
OCTOBER 2019
Insight on the Issues 147, October 2019
© AARP PUBLIC POLICY INSTITUTE 601 E Street, NWWashington DC 20049
Follow us on Twitter @AARPpolicyon facebook.com/AARPpolicywww.aarp.org/ppi
For more reports from the Public Policy Institute, visit http://www.aarp.org/ppi/.
https://doi.org/10.26419/ppi.00084.001
TABLE 6.
Significant Predictor Variables
Unstandardized Coefficients
Standardized Coefficients t Sig.
Collinearity Statistics Relative
ImportanceB SE Beta Tolerance VIF
Liquid savings 0.328 0.013 0.323 24.410 0.000 0.637 1.570 Very strong
Degree to which debt is unmanageable –0.319 0.020 –0.192 -16.130 0.000 0.785 1.274 Strong
Household spending relative to income –0.220 0.016 –0.163 -13.800 0.000 0.800 1.249 Strong
Household income 0.071 0.010 0.098 7.324 0.000 0.615 1.625 Moderate
Household has emergency savings account
0.249 0.036 0.088 6.829 0.000 0.671 1.489 Moderate
Household has IRA not from employer 0.179 0.040 0.059 4.517 0.000 0.649 1.541 Weak
Household has savings in cash 0.176 0.034 0.062 5.123 0.000 0.752 1.330 Weak
Household has employer-provided traditional pension
0.157 0.036 0.050 4.357 0.000 0.830 1.205 Weak
*Age –0.064 0.011 –0.073 -6.059 0.000 0.765 1.307 Weak
*Working full time forsomeone else as mainjob
–0.153 0.034 –0.054 -4.521 0.000 0.766 1.306 Weak
Variability of income –0.076 0.024 –0.034 -3.144 0.002 0.929 1.076 Weak
Household has other personal savings or investments
0.131 0.040 0.044 3.265 0.001 0.600 1.667 Weak
Household has other financial assets or accounts excluding housing/real estate
–0.134 0.060 –0.025 -2.247 0.025 0.935 1.069 Weak
*Although age, working full time for someone else, and having other financial assets have negative Beta values, they are in fact positivelycorrelated with confidence. That is, confidence is higher among those who are older (v. those who are younger) and is also higher amongthose who are working full time (v. others) as well as among those with other financial assets (v. those who don’t have other financial assets).
Variables Removed from Regression Model through Stepwise Method
• Gender: male
• Education
• Income unpredictability
• Has savings account
• Working part time for someone else as main job
• Self-employed or sole proprietor
• Partner in partnership (as main job)
• Consultant or contractor
• “Other” (as main job)