
Unlocking Private Capital to Facilitate Economic Growth...
27
Unlocking Private Capital to Facilitate Economic Growth in Distressed Areas by jared bernstein, center on budget and policy priorities and kevin a. hassett, american enterprise institute april 2015
Transcript of Unlocking Private Capital to Facilitate Economic Growth...
Unlocking Private Capital to Facilitate Economic Growth in Distressed Areas
by jared bernstein, center on budget and policy priorities and kevin a. hassett, american enterprise institute
april 2015
1
In recent months, there has been significant renewed attention
from a broad spectrum of policymakers in addressing the impact
of the uneven economic recovery through geographically focused
economic policies designed to counteract poverty with special
incentives to private investors.
Such polices in the United States date back to the 1970s and 1980s, when
a number received rare bipartisan support and were enacted, with
varying degrees of success. In the aftermath of the Great Recession, long-
term unemployment, slow growth, and a lack of quality employment
opportunities remain an acute problem, and are especially intense
in many specific locales around the U.S. In this paper, we discuss tax
preferences that have been used in the past to motivate investors to invest
in disadvantaged regions of the United States, summarize the evidence
exploring the effectiveness of these measures, and then discuss the
shortcomings of previous policy designs. We finish with a sketch of a new
type of structure that could be far more effective in stimulating economic
growth and facilitating the creation of new jobs in areas of the country
struggling the most.
I. The Uneven Economic Recovery and Problem Of Geographic Disparities
More than five years after the end of the Great Recession, the U.S. is on
the path of slow but steady economic recovery. The unemployment rate
fell to 5.5 percent in February 2015, but a significant number of potential
workers have not re-entered the labor force since the end of the recession
and wage growth remains tepid.1 Last year, the economy finally added
more jobs than were lost during the recession, but a closer look at the
nature of those new jobs reveals that a large share of mid- to high-paying
jobs were replaced by lower-wage positions. At the same time, the stock
market has reached all-time highs, and foreclosure rates have come down.
2
However, while certain areas of the country are doing remarkably well and
nearing or exceeding their pre-recession economic states, the recovery has
been profoundly uneven, with large swaths of the country facing chronic
rates of long-term unemployment and historically low levels of new
investment. Nationally, we see historically low numbers of new business
ventures being established. In addition to the unevenness of the recovery
geographically, the unevenness within different income groups has been
a growing concern for many policymakers.
While much of the popular policy conversation focuses on income disparities
among individuals, geographic disparities are an equally important part
of American life. As of December 2014, for example, the unemployment
rate in Fresno, California was 11 percent, while the unemployment rate
in San Francisco—less than 200 miles away—was five percent. Multiple
other cities in California are currently experiencing elevated levels of
unemployment: El Centro, California had an unemployment rate of 23.1
percent in December 2014, while Merced and Yuba City were at 12.6 and
12.2 percent, respectively. Modesto, California hit 10.5 percent.
Snapshot variations are common, but differences can last a number of
years as well. Yuma, Arizona has had a consistently high unemployment
rate—the last time it was below 20 percent was March 2009, and was at an
incredibly high 25.6 percent in December 2014.
Extremely high unemployment in cities such as Fresno, Yuma, or
Detroit leads to pockets of distressed and traumatized workers who face
plummeting incomes, stalling career progressions, and cracking self-
confidence. In addition to these intuitive tragic effects of unemployment,
research has also identified other negative side effects, the most distressing
of which is an increase in mortality following job loss. Studies have linked
job losses to increases in death rates ,2 suicide rates ,3 and even serious
illnesses such as cancer .4 Another recent study on neighborhood effects
found that growing up in the poorest quartile of neighborhoods versus
the top quartile leads to a lifetime earnings gap as significant as between
a high school and a college graduate.5 More subtle effects have also been
identified; some studies suggest that unemployment leads to a higher
3
likelihood of divorce 6 and lower achievement outcomes for children of
unemployed workers .7 Worst of all, the longer the unemployment spell,
the less likely the possibility of reemployment 8—and by extension the
opportunity to escape these terrible costs—becomes.
Not only have some regions been vastly more successful at generating
jobs than others, but significant regional variation in the quality of
employment growth exists as well. For example, an analysis by The
Atlantic 9 found that Las Vegas, Sacramento, Philadelphia, Buffalo, and
Hartford were among those that lost the most high-wage jobs, while job
growth since the recession in areas like St. Louis, Riverside, New Orleans,
Rochester, New York, Tampa, Columbus, Orlando, and Birmingham was
mostly tied to low-wage jobs. Many workers are underemployed, working
part-time but looking for a full-time job, a problem that may be worse in
distressed communities.
The social costs of living in a high-unemployment area are also compelling.
New generations born into these areas have fewer opportunities due
to a lack of public investment and jobs. Older generations have the
strong social ties to families, friends, and culture that prevent them
from moving away, so instead they remain in areas with stalled or
declining fortunes. Distressed communities, in essence, face very high
transition costs. All the while, better-off cities receive a federal subsidy
from the tax exclusion of state and local taxes from federal taxation.
The difficulty with which unemployed workers relocate—often staying
in place due to social factors even when geographical wage differentials
exist—creates a vicious cycle of persistently high unemployment in the
same places. Distressed communities can be thought of as caught in a
bad equilibrium outcome, where some economic shift has left the city
with declining private activity and a falling tax base. This leads to a drop
off of public investment and infrastructure, making it even more difficult
to attract private capital. In essence, capital liquidity constraints both
drive and are driven by a lack of public infrastructure, resulting in an
equilibrium characterized by decay.
4
The proliferation of severely distressed areas around the country has
been a drag on the overall health of the U.S. economy and the pace of the
economic recovery. Where GDP growth falters in one area, it has an impact
on the U.S. as whole not only by acting as a drag on overall production but
also because distressed areas are potential markets for consumption of
goods produced elsewhere in the U.S. and their weakness has a spillover
effect on other communities. High levels of unemployment in one area
contribute to nationally high levels of unemployment, along with larger
national expenditures on unemployment insurance and other welfare
benefits to those who are out of work. The implications of distressed
communities for the United States as a whole further establishes the case
for new policy prescriptions to combat the weakness of distressed areas.
II. Addressing Geographic Economic Disparities
A federal subsidy for private activity can knock the community out of the
bad equilibrium and help it back on its feet. In response to the view that
circumstances have at times specifically disadvantaged some geographic
areas, a number of programs have been introduced over the years that were
designed to address geographic disparities and provide extra incentives
for investors to focus their efforts where the need is perceived to be the
greatest.
There are solid economic arguments for providing these subsidies. First,
it is a strong empirical regularity that, while economic theory might
predict that individuals should move away from a city or neighborhood in
a downward economic spiral, many chose not to. Thus, the existing social
safety net will provide benefits to such individuals, benefits that will be
quite costly to governments at all levels. Given the high costs of these
benefits, it seems possible that a prudent reform could be a net positive
for the budget. Second, once a downward spiral has begun, an opportune
objective of policymakers would be to create a new equilibrium where
investors decide to return to a distressed area because they expect other
5
investors to return as well. Incentives that are attractive enough could
plausibly upend the “Nash equilibrium” where investors choose not to
invest because all of the other investors have made that choice as well.
Most of the primary federal measures introduced in the past to address
these geographic disparities have expired as of the end of 2014. As many
regions are still struggling with high unemployment, policymakers are
now actively considering the reinstatement of legacy geographic-based
policies and the design of new alternatives in the near future.
Four main types of federal programs for distressed communities with
special tax incentives have existed in the U.S.: empowerment zones (EZ),
renewal communities (RC), enterprise communities (EC), and the New
Market Tax Credit (NMTC). The goals of these programs—first created in
1993 in the case of EZs and ECs, with the addition of RCs and the NMTC
in 2000—have been to alleviate poverty, reduce unemployment, and boost
economic activity in targeted areas. While the enterprise community
and renewal community programs have expired, the tax provisions for
empowerment zones and the NMTC were extended through the end of
2014 and are currently awaiting renewal by Congress—along with dozens
of other temporary tax provisions.
Empowerment Zones, Renewal Communities, and Enterprise CommunitiesDesignation of an area as an EZ, RC, or EC has generally followed after
a nomination from the Secretary of Housing and Urban Development
or the Secretary of Agriculture based on defined characteristics such
as population size, poverty rate, unemployment rate, etc .10 Businesses
in areas that became a part of the program qualified for a number of
credits and tax benefits to incentivize location within the zone or hiring
individuals who live and work within a zone. For instance, if a business
sold a qualified EZ asset it held for more than a year, it could elect to
postpone part or all of the gain from sale if it purchased other qualified
EZ assets within 60 days .11 Another example is the EZ employment credit
of up to $3,000 a year, which provided businesses with an incentive to
hire individuals who live and work in an EZ. A business located in an
6
empowerment zone could also increase its deduction under section 179,
which allows it to deduct all or part of the cost of qualifying property the
year it is placed in service, by up to $35,000.
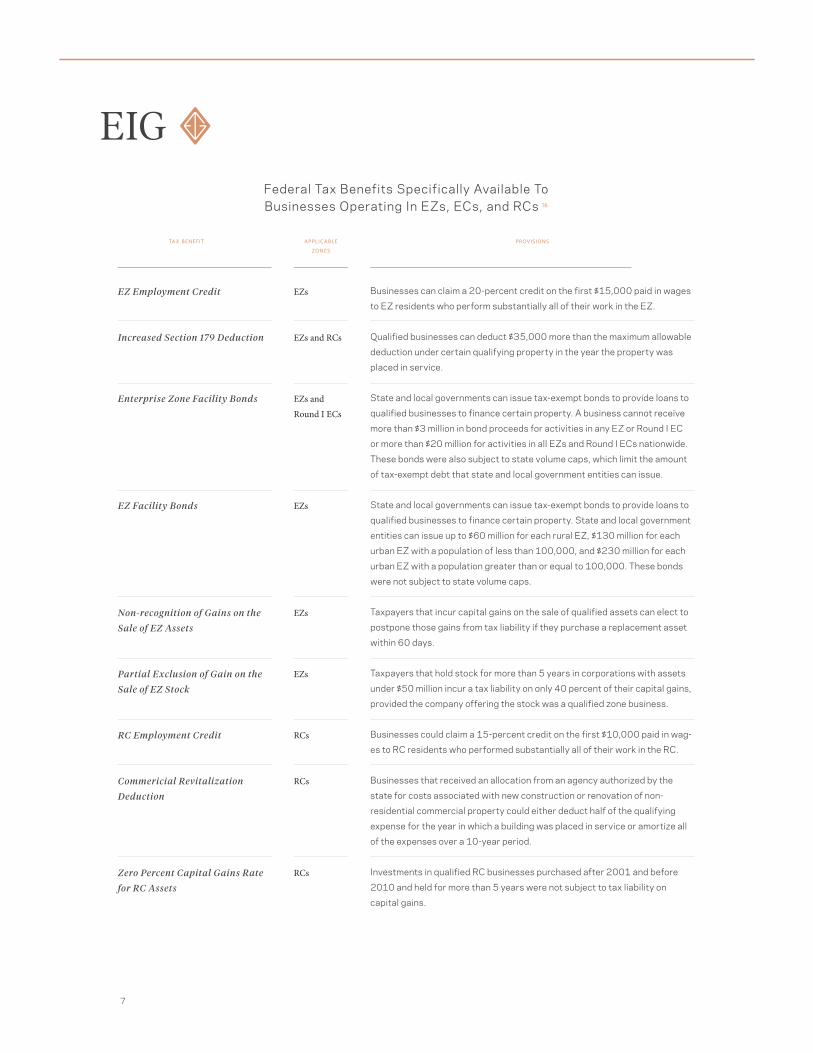
A summary of all the previously available provisions is included on the
following page.12
Unfortunately, research into the effects of these enterprise zone programs
in the U.S. has found at best mixed results, with little consensus in the
literature as to whether they are beneficial. Before instituting a national
enterprise zone program in 1993, numerous state and local programs
existed in the U.S. and were examined in an attempt to get an early
idea of a national program’s potential effectiveness. In 1988, the U.S.
Government Accountability Office (GAO) conducted an analysis of an
enterprise zone program in Maryland that resembled proposed federal
legislation in order to report to Congress on its effectiveness. Although
the GAO found that employment did increase in enterprise zones, they
also extensively interviewed businesses, which reported that the program
was not a significant reason why they increased employment or located
their establishments within an enterprise zone.13 It is an open question, of
course, whether such survey evidence is meaningful.
Since that preliminary assessment, research into the effects of enterprise
zone programs has found similarly mixed results, with some studies
reporting positive effects on the local labor market in zones and others
finding no discernible changes. Soon after the initial GAO report, Barry
Rubin and Margaret Wilder (1989) analyzed state-level urban enterprise
zones and found them to be a cost-effective tool to improve one area’s
comparative advantage against another in an urban setting.14 Subsequent
research by Leslie Papke (1994) found mixed effects of Indiana’s state
program; while unemployment claims in zone-designated areas fell by
19 percent, the value of depreciable personal property within the zones
also fell by 13 percent.15 Contradicting these findings, Marlon Boanet and
William Bogart (1996) reported that in their analysis, New Jersey’s urban
7
EZ Employment Credit
Increased Section 179 Deduction
Enterprise Zone Facility Bonds
EZ Facility Bonds
Non-recognition of Gains on the
Sale of EZ Assets
Partial Exclusion of Gain on the
Sale of EZ Stock
RC Employment Credit
Commericial Revitalization
Deduction
Zero Percent Capital Gains Rate
for RC Assets
ta x benefit
EZs
EZs and RCs
EZs and
Round I ECs
EZs
EZs
EZs
RCs
RCs
RCs
applic able zones
Businesses can claim a 20-percent credit on the first $15,000 paid in wages
to EZ residents who perform substantially all of their work in the EZ.
Qualified businesses can deduct $35,000 more than the maximum allowable
deduction under certain qualifying property in the year the property was
placed in service.
State and local governments can issue tax-exempt bonds to provide loans to
qualified businesses to finance certain property. A business cannot receive
more than $3 million in bond proceeds for activities in any EZ or Round I EC
or more than $20 million for activities in all EZs and Round I ECs nationwide.
These bonds were also subject to state volume caps, which limit the amount
of tax-exempt debt that state and local government entities can issue.
State and local governments can issue tax-exempt bonds to provide loans to
qualified businesses to finance certain property. State and local government
entities can issue up to $60 million for each rural EZ, $130 million for each
urban EZ with a population of less than 100,000, and $230 million for each
urban EZ with a population greater than or equal to 100,000. These bonds
were not subject to state volume caps.
Taxpayers that incur capital gains on the sale of qualified assets can elect to
postpone those gains from tax liability if they purchase a replacement asset
within 60 days.
Taxpayers that hold stock for more than 5 years in corporations with assets
under $50 million incur a tax liability on only 40 percent of their capital gains,
provided the company offering the stock was a qualified zone business.
Businesses could claim a 15-percent credit on the first $10,000 paid in wag-
es to RC residents who performed substantially all of their work in the RC.
Businesses that received an allocation from an agency authorized by the
state for costs associated with new construction or renovation of non-
residential commercial property could either deduct half of the qualifying
expense for the year in which a building was placed in service or amortize all
of the expenses over a 10-year period.
Investments in qualified RC businesses purchased after 2001 and before
2010 and held for more than 5 years were not subject to tax liability on
capital gains.
provisions
Federal Tax Benefits Specifically Available To Businesses Operating In EZs, ECs, and RCs 16
8
program in the 1980s did not have a significant impact on unemployment
or property value in designated zones. 17
Research into state enterprise zone programs in the first decade of this
century also found little impact of the programs on local job markets. In
an evaluation of multiple state enterprise zone programs, Daniele Bondino
and John Engberg (2000) could find no significant impact on employment,
with little difference between the effects of different types of programs or
different amounts of money spent on them. 18 Similarly, Greenbaum and
Engberg (2000) found no evidence that enterprise zone programs in the
six states that they analyzed had an effect on unemployment; although
they found an increase in new business activity within zones, existing
businesses offset this by decreasing their own activity. 19 Analyses of
California’s enterprise zones have found conflicting results. While O’Keefe
(2004) concluded that enterprise zones experienced greater increases in
employment than similar areas that were not given the enterprise zone
designation, 20 Neumark and Kolko (2010) found no effect of the program
on employment, even among lower wage workers. 21 Elvery (2009) reached
similar conclusions in an analysis of California and Florida’s programs,
reporting no evidence that they improved the probability of a worker
residing within the zones finding employment. 22
Though the U.S. federal government enacted its first enterprise zone
program in the form of Empowerment Zones and Enterprise Communities
in 1993, GAO analyses in both 2006 23 and 2010 24 failed to reach a conclusion
about the effectiveness of the two programs due to poor data collection by
the agencies responsible for administering the programs. While some of
the EZs and ECs did experience reductions in poverty and unemployment,
it was not possible in their analysis to tie this to the program. However, a
recent study by Ham, et al. (2011) that analyzed federal enterprise zones
alongside state programs found that federal programs may actually have
a greater impact on labor markets than state programs. 25 Although they
found positive impacts for both levels of programs, they estimated a
higher impact of federal programs on unemployment and poverty rates
within localities. Similarly, a study by Matias Busso, Jesse Gregory, and
Patrick Kline (2013) reviewing the first round of EZs found that an EZ
9
designation substantially increased employment in zone neighborhoods
and generated wage increases for local workers without a corresponding
increase in population or the cost of living. 26
New Markets Tax CreditArguably the most successful of the federal legacy programs for
stimulating investment in distressed areas is the New Markets Tax Credit
(NMTC). The NMTC, which bears some resemblance to the general idea
we propose below, provides individual and institutional investors with a
39 percent tax credit against their federal tax liability for the provision
of loans, investments, and even financial counseling to distressed areas.
The credit is incrementally claimed over a seven-year time period: five
percent in each of the first three years and six percent for each of the
following four years, making this a vehicle that tilts toward quite patient
capital, since the investment must be held for seven years.
The NMTC investments are made through a Community Development
Entity, a private entity that must qualify for the program based on the
unemployment, poverty rates, and low-income levels of the census
tract area that the CDE represents (75 percent of NMTC projects have
been undertaken in communities with poverty rates above 30 percent).
According to the Local Initiative Support Corporation (LISC), an
intermediary for the program, since 2000, $31 billion has been invested in
the program in small businesses, including small manufacturers, charter
schools, health and child care centers, and shopping areas. 27 Interesting,
and germane to our idea discussed next, LISC notes that according to
a GAO study, almost 90 percent of NMTC investors say that but for the
credit, they would not have made the investment.
A 2013 Urban Institute evaluation of early-year NMTC projects came to a
more nuanced conclusion, finding that 64 percent of the projects would
not have happened at the same time and in the same location without
the NMTC, but in only half of those cases did investors claim that the
NMTC was the deciding factor in whether to make the investment at all.28
The same report also found that for every $53 of NMTC investment there
10
was an additional $47 of investment from other sources, including $23 of
investment from public sources.
Although the NMTC is arguably a more streamlined program than the
EC, RC, and EZ programs which involve many disparate components,
its structure still is perhaps overcomplicated, with a 2010 GAO report
concluding that it “could be simplified.” 29 In addition, although it supports
many different types of investments, more than half of investments
through the NMTC are for the development or leasing of real estate as
opposed to operating businesses that can, if they survive, have greater
potential for expansion and job growth. 30 Investors using the NMTC have
favored real estate at least in part because of the structure of the program;
a report from the Federal Reserve Bank of St. Louis pinpoints two reasons
that the program tilts towards real estate: it raises fewer concerns about
compliance with the program’s regulations and location requirements, and
real estate investments have longer time horizons and can therefore use
the tax credit throughout the seven year holding period without worrying
about realizing a return on its capital within that period. 31
The financial structures used by NMTC claimants have become
increasingly complex and guidance from the Department of the Treasury
has failed to keep pace with changes in the program.32 Clear reporting by
NMTC projects is necessary to track the success of the program in creating
new businesses, but, because of inadequate reporting, GAO was unable
to determine how much equity remained in the NMTC projects after the
7-year credit period and the number of NMTC projects that ultimately
failed.
While effective in some areas, the NMTC is not structured to induce the
kind of larger-scale investment that can accelerate the revitalization of
an entire community. The 2013 Urban Institute report found roughly a
third of the projects to be less than $500,000 in size and nearly 80 percent
under $20 million. And, while it may have an effect on marginal sources
of investment—investors who were on the fence about investing in an area
11
but who now would because of extra incentives—it may not be as effective
at attracting new investment. A 2007 GAO report showed that the average
expected return on investment for NMTC projects decreased from 8.2
percent in 2003 towards the start of the program to 6.8 percent in the years
that followed.33 In 2014 the GAO described how NMTC projects typically
take advantage of other public programs to subsidize new investments,
underscoring the difficulty in pinpointing the impact of NMTC alone on
investor behavior.34
III. Weaknesses Of Past ApproachesComplexity and UnderutilizationAs we have shown, the evidence for the benefits of both federal and state
enterprise zone programs has been largely inconclusive with even the
most positive studies rarely showing little more than marginal gains in
the areas covered by the programs. One reason why the evidence may be so
mixed is the underutilization of the provisions available under the various
programs. Existing tax structures are already complex, and adhering to the
additional rules created by the enterprise zone programs is cumbersome.
Enormous resources are required to organize an activity in a manner
that benefits from the positive treatment, and managing a rollover, for
example, within a 60 day window may seem impossible to many investors.
Utilization of all the programs’ provisions has not been tracked
sufficiently as mentioned above, but the available data suggests that
businesses have not been taking advantage of all the available provisions
for a number of different reasons. While the Internal Revenue Service
does collect data on the use of some of the program tax benefits, it
does not do so for all of them, and none of the data can be linked to
the individual communities that claimed the benefits. 35 As a result, the
majority of the available information comes from surveys conducted by
the GAO. The surveys tried to assess the use of EZ and EC tax benefits,
but suffered from low response rates and all of the usual shortcomings
of surveys.
12
On the whole, the surveys do suggest that programs suffered from
underutilization—businesses did not pursue certain benefits due to
their overly complicated nature, lack of clear knowledge about them, or
inability to qualify for all the requirements. 36 For example, respondents to
a GAO survey published in a December 1998 report were asked to explain
their reasons for not claiming the EZ employment credit; of the 3,117 small
urban businesses surveyed about 30 percent did not qualify for the credit
because their employees lived outside of the zone, 40 percent did not know
about the credits, for eight percent the credit was too complicated to use,
and five percent did not have a federal tax liability.
Weak or Misaligned IncentivesThe underutilization is also in part attributable to the weak incentives at
the heart of previous programs, which poorly targeted the goals of increased
employment and investment in distressed communities. Previous efforts
can logically be divided into three categories: employment subsidies,
asset purchase subsidies, and capital investment incentives. However,
none of the specific approaches within these categories appear to be ideal
for encouraging enterprises to relocate to distressed communities and
hire workers in those areas. All three categories failed to provide a direct
incentive either for investing in new companies and small businesses, or for
larger investments in infrastructure and capital-intensive industries such
as manufacturing, both of which are necessary to revitalize distressed areas.
Past programs have relied heavily on employment subsidies to encourage
companies to hire residents of covered areas. Lifting employment is a key
objective of programs that target vulnerable areas, but attracting capital
for the large investments in plants and equipment that are required to
revitalize a city is also necessary, and employment subsidies are a very
indirect method to accomplish that. Even if one assumes that the objective
of the credit is to expand hiring by existing employers, the subsidies that
have been tried to date are fairly weak. First, the credits are generally
small—for example a 20 percent tax credit on the first $15,000 of wages
paid under an EZ amounts for $3,000—and may be too small to encourage
an employer to hire a new employee from a distressed community given
13
training and other indirect labor costs. In addition, since the credits are
usually not refundable, an employer does not receive a benefit unless the
business is profitable, which is frequently not the case, particularly for
startup companies. Because most of the credits from programs like the
federal EZ and RC programs only apply to the first several thousand dollars
of wages paid to employees, they may also distort the hiring decisions
of companies located within the zones; instead of hiring one worker for
$30,000, they may hire two workers for $15,000 in order to twice receive
the enterprise zone credit of 20 percent on the first $15,000 in wages.
Accordingly, the wage subsidies may provide perverse incentives to avoid
advancing workers up a career ladder. Finally, to the extent that wages do
increase, then workers may decide to move to different neighborhoods. In
some designs, firms can lose access to subsidies through such eventualities
that are often beyond direct control.
The second two commonly used policies, asset purchase subsidies and
capital investment incentives, have been targeted at expanding investment
opportunities, another important challenge facing revitalization efforts.
Asset purchase subsidies suffer predominantly from restrictive definitions
that were mentioned above—in order to qualify as an EZ business, the
scope of the business’ operations must satisfy a number of different
criteria. 37 The qualified property clauses also create difficulties in the ease
of application of these provisions. Examples of provisions that suffer from
the problem of overly restrictive definitions include the enterprise zone
tax-exempt facility bonds and the RC commercial revitalization deduction.
Loosening some of these restrictions or adopting a new structure might
prove to be significantly more effective.
Specific investment incentives have also been used with the goal of
increasing investments within a distressed community. The partial
exclusion of the gain on sale of an EZ asset is one example of this type of
policy. The exclusion is 60 percent for an enterprise zone business, higher
than the 50 percent that applies for ordinary qualified business outside
the EZ. 38 It is more tax efficient for a business to invest in flow-through
entities than to utilize this provision, so it is rarely used.
14
The other provision in this category is the exemption for capital gains tax
on qualifying RC business held for more than five years. This incentive
has become mostly outdated with the introduction of the capital gains
exclusion for small business stock held for more than five years by the
Creating Small Business Jobs Act of 2010, which was enacted in September
2010. These two provisions are not identical since the current law only
applies to small businesses, so the gain cannot exceed $10 million or 10
times the taxpayer’s aggregate basis in qualified stock of the corporation
that is disposed of during the taxable year; however, it serves a similar
purpose within the tax code. Targeted efforts to revitalize depressed
areas should be specifically tailored to their needs and simple enough to
use without large obstacles, rather than replicating efforts applied to the
entire country.
Restrictive ScopeIn addition, restrictions on the size of investment that can qualify
discourages large well-capitalized investors from participating, a factor
that makes the switch to the positive Nash equilibrium where investors
return to the distressed area because they are comforted by the safety of
numbers less likely. Such restrictions exacerbate the first-mover problem.
A good candidate for a first-mover would be a large diversified investor that
could spread the risks of such investments broadly, and perhaps invest in
a critical mass of enterprise all at once. If only small investments qualify,
then complex coordination is an essential element of success.
Where public infrastructure is poor, it can be especially difficult to entice
enough first-movers to step in and invest to the point where infrastructure
will improve and tempt other businesses in. While incentives such as the
ones included in the EC, EZ and RC programs may be sufficient to keep
investment going where it has already started, they may be too weak to
convince businesses to make the first move.
Although the NMTC is structured differently from the EC, EZ and RC

15
programs, it too utilizes an organization framework that is not optimal for
many investors. The approval process for the NMTC can be bureaucratic
and compliance cumbersome, creating relatively little draw for interested
investors. The NMTC also requires a seven-year commitment. While
there’s an obvious and positive role for patient capital in this area,
many investors will find that too restrictive, and ultimately much of the
investment through the program over the last decade has been in real
estate. While such investment is often helpful to depressed areas, it is not
the type of job-generating activity that we hope to incentivize through the
alternative vehicle we introduce below.
Interaction with Other ProgramsThe General Accounting Office found that NMTC projects commonly
utilize other sources of public funding: 62 percent of projects initiated
between 2010 and 2012 received funds from federal state, or local public
sources.39 Current Treasury guidance limits the ability of projects to use
the NMTC in combination with the Low-Income Housing Tax Credit,
but there is not specific guidance on its use with other tax programs.40
According to the GAO, the most frequent tax programs paired with the
NMTC were historic tax credits and tax exempt bonds for private nonprofit
education facilities. These other programs will have separate qualification
requirements, and if the viability of certain projects depends on the
combined subsidy of these programs, an additional obstacle could arise
from these other requirements.
Absence of Force MultipliersIn a broader sense as well, previous programs left many potential sources
of investment untapped. There was no structure in place to encourage
investors to exit existing investments, for example, and bring their
realized gains into enterprise zones. There also was not a structured
way to involve intermediary groups, such as banks, private equity, and
venture funds, in investing in enterprise zones, although these groups

16
generally can bring large resources to projects and have the potential
to invest in companies that may thrive within an area. The emphasis
on individual businesses instead of larger structures and institutions
may indeed be part of the reason for the tepid results of enterprise
zone programs.
The checkered results of the studies evaluating previous attempts can be
attributed to misaligned incentives and a weak set of policies, yet economic
theory supports targeted assistance to depressed areas. Given that, and
the significant geographic disparities that are evident in the data since the
Great Recession, alternative designs may well be a preferable policy option
to reinstating the questionable programs of the past. A simpler, targeted
approach may be warranted to have a significant effect on employment
and investment in the given area.
IV. New Model For Attracting Private Investment Is Needed
For political and fiscal reasons, large-scale public sector investment is
unlikely to happen anytime soon, and must be supplemented by private
sector investment to support robust economic growth. Private sector
investors have little current incentive to invest in higher risk ventures
in economically depressed communities, but the return on investment
for doing so may increase if the existing friction could be deferred or
eliminated.
The recovery has been particularly kind to investors in the stock market
since the recession. Since early 2009, the Dow Jones has almost tripled,
rising almost 12,000 points, and in 2013 alone, investors in the S&P 500
saw gains of over $4 trillion. An analysis by the Economic Innovation
Group estimated that the amount of unrealized capital gains held by U.S.
investors stood at roughly $2.26 trillion as of year-end 2014—a significant
17
increase in the five years since the recession. The explosion in unrealized
capital gains and cash holdings presents an opportunity for policies that
create new incentive for private investors to redeploy capital to regions in
need of economic development.
It is beyond the scope of this effort to develop a detailed proposal, an
effort that we leave to future research. However, in this section, we sketch
a new approach to geographically targeted economic policy that could
be far more effective than those tried in the past, and at the same time
appeal to policymakers of every political persuasion. Our key observation
is that existing and prior approaches have not harnessed the power of
intermediaries such as private equity firms, banks, venture capitalists,
mutual funds, and hedge funds. By focusing on often small individual
businesses, policies have implicitly required an unrealistically large
amount of coordination among potential investors, and hence, have failed.
Consider, as an alternative, a structure analogous to that of a venture
capital firm or mutual fund company, but specialized in development
investments in businesses in predetermined locales. These specialized
investment vehicles, which could raise capital from a mix of individual
and institutional investors, would operate in targeted locales, and special
tax provisions that are established for them would apply so long as the
investments stayed within qualified geographic areas. One key advantage
is that they are structured so as to allow partners to pool their resources
and invest in numerous projects at any given time in a highly nimble
fashion.
This structure would be much more attractive than previous designs.
In particular, firms would emerge that would specialize in pooling
investments, but onerous conditions such as the 60-day requirement
would be unnecessary as money could easily sit on the sidelines for longer
periods as the funds seek profitable investment opportunities. This would
help to counteract the first-mover problem described above, in which
any one investor has no hope of shifting an area from an equilibrium of
decay to an equilibrium in which public investment and private enterprise
conspire to spur renewal. By pooling assets, the risk to any one investor
18
is limited. They would also have the capacity to move a high volume of
investments into depressed communities at relatively low cost to the
Federal Government.
A number of important options must be considered when devising the
special tax provisions to be applied to investments in distressed regions.
One key consideration policymakers might weigh heavily is an objective
to make investments into economically depressed communities an easy
and attractive option. There are a number of possible policies that could
potentially have a major effect on such choices. For example, unrealized
capital gains might be rolled over into special funds constrained to invest
in distressed communities, with the capital gains taxed only if the money
is withdrawn from the qualified funds down the road. A similar treatment
could apply to direct investments in enterprises within the qualifying
investment zones. Depending on how generous Congress would like
the incentive to invest to be, the capital gains basis of the unrealized
gain could be adjusted/“stepped up” in some manner as well. The
generosity could be linked to the type of investment, with investments
in infrastructure, for example, receiving more generous treatments. An
alternative or complementary structure would be to treat funds that invest
in distressed communities as 401k investments, allowing individuals to
deduct investment into qualified investment vehicles in the year that they
are made, accumulate gains tax-free, and then pay capital gains tax upon
withdrawal of the funds. Alternatively, a Roth structure could be used
under which individuals would invest post-tax income but accrue gains
that would be tax-free when realized.
While the exact specification of target areas is outside of the scope of
this paper and should receive further research, it is worth noting that,
under a model as described above, the target investment zones could
conceivably be scaled to the size of cities to maximize their potential
impact. Partnership and collaboration between large funds and municipal
governments could be valuable. Clearly, legislation to create these new
investment structures would have to establish a process that identifies
target areas in a transparent and orderly fashion, based on objective
19
economic criteria such as the area’s unemployment rate, foreclosure rate,
labor force participation rate, or even its disaster zone status.
V. ConclusionsA confluence of factors motivates our proposed actions in this area. First,
the geographically uneven nature of the current recovery, along with
the heightened costs to families stuck in weak local economies with
inadequate public and private investments, can usefully be viewed as
both a crisis and an opportunity. Second, as we have noted, a very large
stock of savings in the form of unrealized capital gains has built up in
recent years. Third, policy measures to incentivize private investment in
disadvantaged areas have largely been unsuccessful. The New Market Tax
Credit is a notable exception, but here too, complexities may be restricting
the scope of investments in ways that fail to tap potential growth and jobs.
Over the past two years, these factors have led to renewed interest and
attention from policymakers in developing regional incentives programs
to address the problem of distressed communities. For example, President
Obama has discussed a “Promise Zone” program, while Rand Paul
introduced the idea of “Freedom Zones,” both of which are aimed at
increasing investment in economically weak areas. The NMTC has the
support of a bipartisan, bicameral coalition of legislators calling for it to
be made permanent. These proposals speak to the desire for geographic
preference programs, and show a real and continued interest on the
part of the policy community in addressing issues posed by distressed
communities.
In this paper, we look of the debilitating aspects of the uneven economic
recovery to the overall U.S. economy, and analyze the impact of past
and existing geographically targeted policies designed to encourage
economic development in distressed areas. We find that the success of
such programs has been limited for several major reasons: a mismatch of
20
incentives and goals in many programs; weak and too narrowly targeted
incentive structures that fail to foster sufficient investment to create a
positive equilibrium were sufficient capital enters an area; bureaucratic
requirements that are not offset by small rewards; and finally, a structure
that does not tap all potentially available sources of investment funds.
However, public incentives to attract private sector capital remain
important, and so we have sketched a proposed new structure that could
offer the potential to succeed where past approaches have failed. This
approach will allow for better-targeted incentives to increase investment
in distressed areas, along with a more streamlined process for making
these investments.
In our view, policies promoting the establishment of investment funds
specifically designed to allow all Americans to invest in the restoration of
depressed areas could serve many positive goals. Most importantly, in a
resource-constrained environment, such funds could provide the capital
needed to reshape our most distressed communities by incentivizing those
who have benefited from the American dream to invest in ways that seek
to serve the common good. In addition, one could imagine that it would
become a social norm that, for example, companies and/or individuals
would invest a small fraction of their savings or profits in funds that invest
in distressed communities. If these funds succeed in establishing a new
equilibrium where investors flock to distressed areas because they are
confident that other investors will as well, then the investments will also
have the potential to be highly profitable, which would feed a virtuous cycle.
In doing so, the program would partially address widening inequality and
lack of economic mobility in targeted areas, but do so in a manner that
relies on markets and new enterprise to help the poor. As such, policies
in this area may well become vehicles for aligning the interests of a wide
variety of political stakeholders, garnering the kind of broad bipartisan
support that has become a rarity in the current political climate.
21
About the Authors
Jared Bernstein and Kevin A. Hassett are the Co-chairs of the Economic
Innovation Group’s Economic Advisory Board.
Jared Bernstein is a Senior Fellow at the Center on Budget and Policy
Priorities. From 2009 to 2011, Bernstein was the Chief Economist and
Economic Adviser to Vice President Joe Biden, executive director of the
White House Task Force on the Middle Class, and a member of President
Obama’s economic team. Bernstein’s areas of expertise include federal and
state economic and fiscal policies, income inequality and mobility, trends
in employment and earnings, international comparisons, and the analysis
of financial and housing markets.
Kevin A. Hassett is the State Farm James Q. Wilson Chair in American
Politics and Culture at the American Enterprise Institute (AEI). He is also
a resident scholar and AEI’s director of economic policy studies. Before
joining AEI, Hassett was a senior economist at the Board of Governors of
the Federal Reserve System and an associate professor of economics and
finance at Columbia (University) Business School. He served as a policy
consultant to the U.S. Department of the Treasury during the George H.
W. Bush and Bill Clinton administrations.
22
References
1 Between 2007 and 2015, average hourly wages grew by 4.2 percent in real terms,
or 0.5 percent per year.
2 Daniel Sullivan and Till von Wachter, “Job Displacement and Mortality: An
Analysis Using Administrative Data.” Quarterly Journal of Economics, 2009, 1265-
306. http://www.columbia.edu/~vw2112/papers/sullivan_vonwachter_qje.pdf.
3 Timothy J. Classen and Richard A. Dunn, “The effect of job loss and
unemployment duration on suicide risk in the United States: a new look using
mass-layoffs and unemployment insurance claims.” August 15, 2009.
4 E. Lynge, “Unemployment and Cancer: A Literature Review.” IARC Sci Publ 138
(1997): 343-51. http://www.iarc.fr/en/publications/pdfs-online/epi/sp138/sp138-
chap16.pdf.
5 Douglas S. Massey and Jonathan T. Rothwell, “Geographic Effects on
Intergenerational Income Mobility.” Economic Geography 91, no. 1 (2015): 83-106.
http://onlinelibrary.wiley.com/doi/10.1111/ecge.12072/abstract.
6 Kerwin Kofi Charles and Melvin Stephens Jr., “Job Displacement, Disability, and
Divorce.” National Bureau of Economic Research Working Paper 8578. November
2001. http://www.nber.org/papers/w8578.pdf?new_window=1.
7 Ann Huff Stevens and Jessamyn Schaller, “Short-run effects of Parental Job Loss
on Children’s Academic Achievement.” National Bureau of Economic Research
Working Paper 15480. November 2009. http://www.nber.org/papers/w15480.
pdf?new_window=1.
8 Robert Shimer, “The Probability of Finding a Job.” American Economic Review 98,
no. 2 (2008): 268-73. https://www.aeaweb.org/articles.php?doi=10.1257/aer.98.2.268.
9 Richard Florida, “The Uneven Growth of High and Low-Wage Jobs Across
America.” The Atlantic, September 27, 2013, http://www.theatlanticcities.com/
jobs-and-economy/2013/09/uneven-growth-high-and-low-wage-jobs-across-
america/6937/.
10 See Sections 1391-1393 and Section 1400E for exact criteria and processes.
11 Section 1397B.
12 For a complete summary see IRS Publication 954 or Community Development:
Federal Revitalization Programs Are Being Implemented, but Data on the Use
of Tax Benefits Are Limited. (GAO-04-306) (Washington, DC: U.S. Government
23
Accountability Office, 2004), http://www.gao.gov/assets/250/241656.pdf.
13 Enterprise Zones: Lessons from the Maryland Experiment. (GAO PEMD-89-2)
(Washington, DC: U.S. Government Accountability Office, 1988), http://www.gao.
gov/assets/150/147201.pdf.
14 Barry M. Rubin and Margaret G. Wilder, “Urban Enterprise Zones: Employment
Impacts And Fiscal Incentives.” Journal of the American Planning Association 55,
no. 4 (1989): 418-31.
15 Leslie Papke, “Tax Policy and Urban Development: Evidence from the Indiana
Enterprise Zone Program.” Journal of Public Economics 54, no. 1 (1994): 37-49.
16 Adopted from: Community Development: Federal Revitalization Programs Are
Being Implemented, but Data on the Use of Tax Benefits Are Limited. (GAO-04-306)
(Washington, DC: U.S. Government Accountability Office, 2004), http://www.gao.
gov/assets/250/241656.pdf.
17 Marlon G. Boarneta and William T. Bogart, “Enterprise Zones and Employment:
Evidence from New Jersey.” Journal of Urban Economics 40, no. 2 (1996): 198-215.
18 Daniele Bondonio and John Engberg, “Enterprise Zones and Local Employment:
Evidence from the States’ Programs.” Regional Science and Urban Economics 30,
no. 5 (2000): 519-49.
19 Robert Greenbaum and John Engberg, “An Evaluation Of State Enterprise Zone
Policies.” Review of Policy Research 17, no. 2-3 (2000): 29-45.
20 Suzanne O’Keefe, “Job Creation in California’s Enterprise Zones: A Comparison
Using a Propensity Score Matching Mode.” Journal of Urban Economics
55, no. 1 (2004): 131–150, http://www.sciencedirect.com/science/article/pii/
S0094119003001025.
21 David Neumark and Jed Kolko, “Do Enterprise Zones Create Jobs? Evidence from
California’s Enterprise Zone Program.” Journal of Urban Economics 68, no. 1 (2010):
1-19.
22 Joel A. Elvery, “The Impact of Enterprise Zones on Resident Employment: An
Evaluation of the Enterprise Zone Programs of California and Florida.” Economic
Development Quarterly 23, no. 1 (2009): 44-59.
23 Empowerment Zone and Enterprise community Program: Improvements Occurred
in communities, but the effect of the program is unclear. (GAO 06-727) (Washington,
DC: U.S. Government Accountability Office, 2006), http://www.gao.gov/
assets/260/251626.pdf.
24 Information on Empowerment Zone, Enterprise Community, and Renewal
Community Programs: Briefing for Congressional Addressees. (GAO-10-464R)
24
(Washington, DC: U.S. Government Accountability Office, 2010), http://www.gao.
gov/new.items/d10464r.pdf.
25 John C. Ham, Charles Swenson, Ayşe Imrohoroğlu, and Heonjae Song,
“Government Programs Can Improve Local Labor Markets: Evidence from
State Enterprise Zones, Federal Empowerment Zones and Federal Enterprise
Community.” Journal of Public Economics 95, no. 7-8 (2011): 779-97.
26 Matias Busso, Jesse Gregory, and Patrick Kline, “Assessing the Incidence and
Efficiency of a Prominent Place Based Policy.” American Economic Review 103, no.
2 (2013): 897-947.
27 See: http://lisc.org/docs/resources/policy/Policy_Brief_NMTC.pdf.
28 Martin D. Abravanel, et al., “New Markets Tax Credit (NMTC) Program
Evaluation: Final Report,” Urban Institute, April 2013. http://www.taxpolicycenter.
org/UploadedPDF/412958-new-markets-tax-final.pdf
29 New Markets Tax Credit: The Credit Helps Fund a Variety of Projects in Low-
Income Communities, but Could Be Simplified. (GAO-10-334) (Washington, DC: U.S.
Government Accountability Office Report to Congressional Committees, 2010),
http://www.gao.gov/new.items/d10334.pdf.
30 New Markets Tax Credit Public Data Release: 2003-2011 Summary Report.
(Washington, DC: U.S. Department of the Treasury, 2013). http://www.cdfifund.
gov/docs/2013/NMTC/NMTC%20Data%20Release%20July%201%202013.pdf.
31 Katie Codey, “Can the New Markets Tax Credit Program be Transformed
Through Leverage of its Real Estate Bias?” Bridges, Federal Reserve Bank of St.
Louis, 2011, https://www.stlouisfed.org/publications/bridges/summer-2011/can-
the-new-markets-tax-credit-program-be-transformed-through-leverage-of-its-real-
estate-bias.
32 New Markets Tax Credit: Better Controls and Date are needed to Ensure
Effectiveness. (GAO-14-500) (Washington, DC: U.S. Government Accountability
Office Report to Congressional Committees, 2014), http://www.gao.gov/
assets/670/664717.pdf.
33 Tax Policy: New Markets Tax Credit Appears to Increase Investment by Investors
in Low-Income Communities, but Opportunities Exist to Better Monitor Compliance.
(GAO-07-296) (Washington, DC: U.S. Government Accountability Office Report to
Congressional Committees, 2007), http://www.gao.gov/assets/260/256201.pdf.
34 The 2014 GAO study also raised the possibility of NMTC projects earning
above-market rates of return. An Urban Institute study identified a case where
the NMTC appeared to earn a 24 percent annual rate of return, but the authors
stated that the complexity of the structure made it difficult to captures all non-
25
NMTC funds that may have been invested, which would have lowered the return.
The case study is: Martin D. Abravanel, et al., “New Markets Tax Credit (NMTC)
Program Evaluation: Final Report,” Urban Institute, April 2013.
35 Empowerment Zone and Enterprise Community Program: Improvements Occurred
in Communities, but the Effect of the Program is Unclear. (GAO 06-727) (Washington,
DC: U.S. Government Accountability Office, 2006), http://www.gao.gov/new.items/
d06727.pdf.
36 Ibid.
37 Section 1397C.
38 Section 1202.
39 New Markets Tax Credit: Better Controls and Date are needed to Ensure
Effectiveness. (GAO-14-500) (Washington, DC: U.S. Government Accountability
Office, 2014), http://www.gao.gov/assets/670/664717.pdf.
40 26 U.S.C section 45D(i)(1); Treasury Reg. section 1.45D-1(g)(3).

26
web eig.org email [email protected]
facebook.com/EconomicInnovationGroup
linkedin.com/company/economic-innovation-group
twitter.com/InnovateEconomy
EIG brings together leading entrepreneurs, investors, economists, and policymakers from across the political spectrum to address America’s economic challenges.