UNLOCKING GROWTH AND PROSPERITY Figure 8: Mean score, ... Japan Kazakhstan Korea, Republic of...
60
UNLOCKING GROWTH AND PROSPERITY The Global Rule of Law and Business Dashboard 2017
Transcript of UNLOCKING GROWTH AND PROSPERITY Figure 8: Mean score, ... Japan Kazakhstan Korea, Republic of...
UNLOCKING GROWTH AND PROSPERITYThe Global Rule of Law and Business Dashboard 2017
Copyright © 2017 by the U.S. Chamber of Commerce. All rights reserved. No part of this work, covered by the copyrights herein, may be reproduced or copied in any form or by any means—graphic, electronic, or mechanical, including photocopying, recording, taping, or information and retrieval systems—without the permission of the Chamber.
The U.S. Chamber of Commerce is the world’s largest business federation representing the interests of more than 3 million businesses of all sizes, sectors, and regions, as well as state and local chambers and industry associations.
UNLOCKING GROWTH AND PROSPERITYThe Global Rule of Law and Business Dashboard 2017
2
UNLOCKING GROWTH AND PROSPERITY
CONTENTS
4 List of Abbreviations
5 Executive Summary
11 Introduction
16 Section 1: The Global Rule of Law and Business Dashboard 2017— Results and Impressions
16 1.1 Overall results
19 1.2 Key impressions
21 Section 2: Regional Zoom-in—Comparing Regions on Rule of Law and Business
21 2.1 The Americas
23 2.2 The Middle East
24 2.3 Africa
26 2.4 Europe
28 2.5 Asia
30 2.6 Section summary
31 Section 3: Getting Better or Worse? Comparing Three Editions of the Global Business Rule of Law Dashboard
31 3.1 Then and now: The rule of law in the Americas in 2013 versus 2017
34 3.2 Is the Americas region closing for business?
35 Section 4: Concluding Thoughts
37 Section 5: Annex
37 5.1 Measuring the immeasurable? The rule of law and business
37 5.2 Underlying indices and surveys overview
43 5.3 Dashboard methodolody
46 5.4 Dashboard country coverage
48 5.5 Individual results for underlying indices and surveys
55 Notes
The Global Rule of Law and Business Dashboard 2017
3
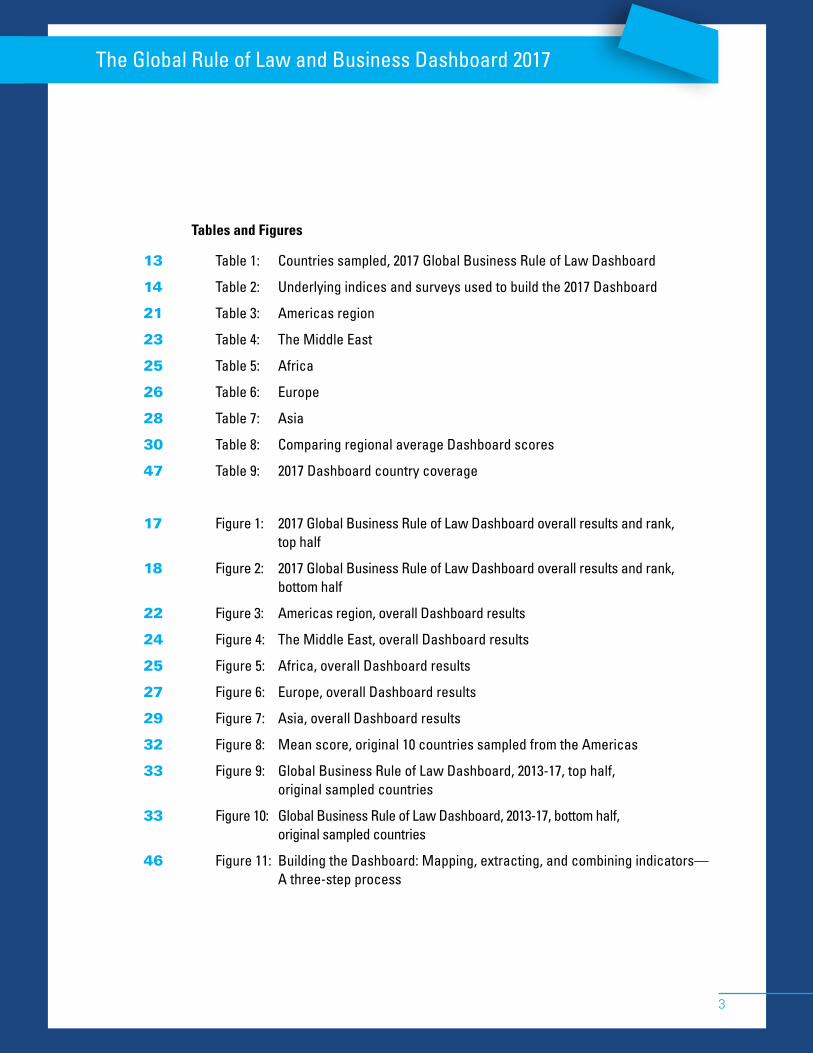
Tables and Figures
13 Table 1: Countries sampled, 2017 Global Business Rule of Law Dashboard
14 Table 2: Underlying indices and surveys used to build the 2017 Dashboard
21 Table 3: Americas region
23 Table 4: The Middle East
25 Table 5: Africa
26 Table 6: Europe
28 Table 7: Asia
30 Table 8: Comparing regional average Dashboard scores
47 Table 9: 2017 Dashboard country coverage
17 Figure 1: 2017 Global Business Rule of Law Dashboard overall results and rank, top half
18 Figure 2: 2017 Global Business Rule of Law Dashboard overall results and rank, bottom half
22 Figure 3: Americas region, overall Dashboard results
24 Figure 4: The Middle East, overall Dashboard results
25 Figure 5: Africa, overall Dashboard results
27 Figure 6: Europe, overall Dashboard results
29 Figure 7: Asia, overall Dashboard results
32 Figure 8: Mean score, original 10 countries sampled from the Americas
33 Figure 9: Global Business Rule of Law Dashboard, 2013-17, top half, original sampled countries
33 Figure 10: Global Business Rule of Law Dashboard, 2013-17, bottom half, original sampled countries
46 Figure 11: Building the Dashboard: Mapping, extracting, and combining indicators— A three-step process
4
UNLOCKING GROWTH AND PROSPERITY
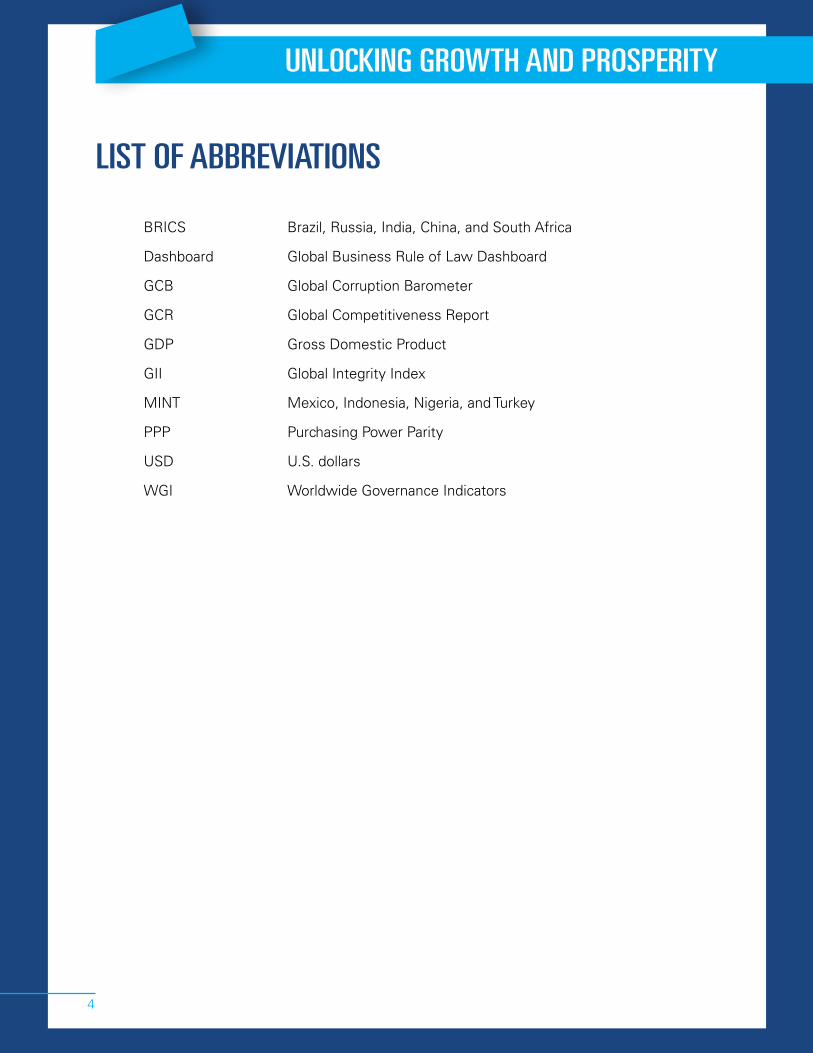
LIST OF ABBREVIATIONS
BRICS Brazil, Russia, India, China, and South Africa
Dashboard Global Business Rule of Law Dashboard
GCB Global Corruption Barometer
GCR Global Competitiveness Report
GDP Gross Domestic Product
GII Global Integrity Index
MINT Mexico, Indonesia, Nigeria, and Turkey
PPP Purchasing Power Parity
USD U.S. dollars
WGI Worldwide Governance Indicators
The Global Rule of Law and Business Dashboard 2017
5
EXECUTIVE SUMMARY
Since 2013 the U.S. Chamber of Commerce, through the development of the Global Business Rule of Law Dashboard (the “Dashboard”), has attempted to bring more attention to the rule of law environment as it relates to business. The following are the key questions the research and development of the Dashboard have sought to answer:
- How is the rule of law for business currently measured in the most heavily used and credible international indices and surveys of legal and regulatory environments?
To what extent do existing international indices and surveys of legal and regulatory environments include specific indicators and measure areas of the rule of law as they relate to business?
- Is it possible to compare a sample of countries by identifying, extracting, and amalgamating relevant indicators from these international indices and surveys into a composite meta-measure of the rule of law as it relates to business?
This marks the third edition of the Dashboard. The ultimate purpose of the Dashboard is to provide users with an easy-to-understand yet statistically credible meta-measure of the rule of law environment as it relates to business. The Dashboard relies on and uses information and research contained in seven internationally accepted and established indices and surveys of the rule of law. It is a compilation and reflection of these existing measures and it relies on the methodological strengths and weaknesses of those underlying indices and surveys.
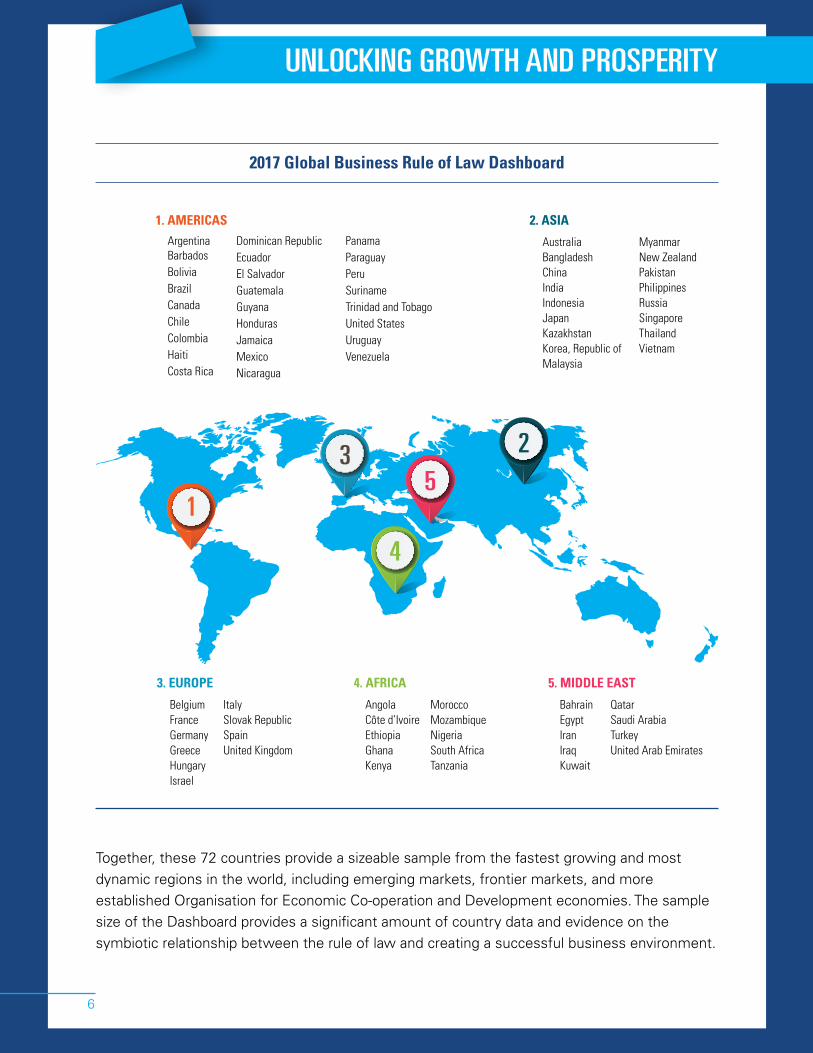
The 2013 Dashboard focused on the Americas region and was applied to a sample of 10 countries: Argentina, Brazil, Canada, Chile, Colombia, Ecuador, Mexico, Nicaragua, U.S., and Venezuela. In 2015 the Dashboard was significantly expanded and 50 new countries were added, bringing the total number of countries sampled to 60. This year an additional 12 countries have been added, bringing the total number of countries sampled and included in the Dashboard to 72. The below table gives an overview of the countries included in the sample, organized on a regional basis.
6
UNLOCKING GROWTH AND PROSPERITY
2017 Global Business Rule of Law Dashboard
2. ASIA
AustraliaBangladeshChinaIndiaIndonesiaJapanKazakhstanKorea, Republic ofMalaysia
MyanmarNew ZealandPakistanPhilippinesRussiaSingaporeThailandVietnam
1. AMERICASArgentinaBarbadosBoliviaBrazilCanadaChileColombiaHaitiCosta Rica
4. AFRICA
AngolaCôte d’IvoireEthiopiaGhanaKenya
MoroccoMozambiqueNigeriaSouth AfricaTanzania
1
35
2
4
Dominican RepublicEcuadorEl SalvadorGuatemalaGuyanaHondurasJamaicaMexicoNicaragua
PanamaParaguayPeruSurinameTrinidad and TobagoUnited StatesUruguayVenezuela
Together, these 72 countries provide a sizeable sample from the fastest growing and most dynamic regions in the world, including emerging markets, frontier markets, and more established Organisation for Economic Co-operation and Development economies. The sample size of the Dashboard provides a significant amount of country data and evidence on the symbiotic relationship between the rule of law and creating a successful business environment.
5. MIDDLE EAST
BahrainEgyptIranIraqKuwait
QatarSaudi ArabiaTurkeyUnited Arab Emirates
3. EUROPE
BelgiumFranceGermanyGreeceHungaryIsrael
ItalySlovak RepublicSpainUnited Kingdom
The Global Rule of Law and Business Dashboard 2017
7
Key findings and overall results
Key findings
The main conclusions of the Dashboard can be grouped into three key findings. Key finding 1: The rule of law for business remains a challenge globally.Of the 72 countries sampled, less than 20% (13 out of 72) achieve a score of or over two-thirds of the available Dashboard score. Instead, more than double the number of countries that achieve two-thirds of the Dashboard’s score (28 out of 72) fail to achieve a score of or over 50%.
Key finding 2: The West is not the best.The assumption that Western democracies will always have the strongest systems of rule of law—generally as well as for business—is not borne out by the evidence. The results of the 2017 Dashboard show that many European countries and EU Member States are lagging behind reforming countries in Asia and beyond. In fact, only five of the top 20 scores were earned by European countries. For example, Greece and the Slovak Republic barely eke out scores over 50%, placing the countries outside the median range of other members of the European Union. Similarly, the scores of Hungary and Italy are outside the top 20. Spain ranks 20th but is behind China, South Africa, and Qatar. Businesses in all these countries face serious challenges. Similarly, both the U.S. and Canada are outside the Dashboard’s top 5, while four of the top 5 countries are from Asia (Singapore, New Zealand, Australia, and Japan).
Key finding 3: Globally, regions are diverging with the Americas, looking like it is being left behind.Regional comparisons reveal that, in most regions, the rule of law and business remains a challenge. The highest regional average (mean) score achieved was 65.02% in Europe. No region achieves an average score over two-thirds of the available score. Still, the relative weakness of the Americas region is striking. For the Americas the average score is 48.03%, compared with Africa and the Middle East, which achieve mean scores of 48.23% and 53.99%, respectively. Outside the U.S. and Canada only three countries in the region achieve a score above 60%: Costa Rica (60%), Chile (63%), and Uruguay (65%). Indeed, what stands out the most is the relatively poor performance of the Americas region as a whole. Here, size does not matter—some of the largest markets in the region do as badly as smaller markets. Brazil, Argentina, and Mexico all fail to achieve 50% of the score. In fact, the vast majority of countries in the Americas do not reach 50% of the total score: 16 countries are under 50%. And if one includes the countries that just reach 50% (Jamaica, Trinidad and Tobago, and Panama all scored 51%), only seven of the 26 countries sampled from the region actually achieve a score above
8
UNLOCKING GROWTH AND PROSPERITY
50%. Similarly, although the country sample size is smaller, comparing over time the Dashboard results for the original 10 countries from the Americas included in the first edition of the Dashboard shows that the situation has not improved. Instead, there has been a steady drop. The average score for the region has dropped from 56.7% in 2013 to 52.07% in 2017. Tellingly, of the 10 countries we can follow from 2013, not one has increased its 2013 score. The best performers have simply stayed the same. Instead, the majority of countries have experienced a significant drop. For example, both the U.S. and Canada have seen their scores fall by 5% and 6%, respectively. Chile has seen the biggest drop of all countries, from 74% in 2013 to 63% in 2017. Chile’s environment for the rule of law and business ranks closer to that of Colombia (53%) than top-ranking Canada (78%). Similarly, Brazil and Mexico have seen their percentage scores drop from 55% and 54%, respectively, in 2013 to 48% in 2017. For the Americas region as a whole, the Dashboard results suggest that socio-economic competitiveness could be much improved for the entire region.
Overall resultsThe results of the 2017 Dashboard are captured in the following tables, with the top and bottom half of the 72 countries sampled in the Dashboard included, respectively.

The Global Rule of Law and Business Dashboard 2017
9
2017 Global Business Rule of Law Dashboard overall results and rank, top half
0.00 0.10 0.20 0.30 0.40 0.50 0.60 0.70 0.80 0.90 1.00
1. Singapore
2. New Zealand
3. Australia
4. Japan
5. Germany
6. United Kingdom
7. Canada
8. U.S.
9. United Arab Emirates
10. Belgium
11. France
12. Korea, Republic of
13. Israel
14. Uruguay
15. Malaysia
16. Qatar
17. South Africa
18. Chile
19. China
20. Spain
21. Bahrain
22. Costa Rica
23. Hungary
24. Italy
25. Saudi Arabia
26. Barbados
27. Morocco
28. India
29. Turkey
30. Ghana
31. Kuwait
32. Kazakhstan
33. Indonesia
34. Vietnam
35. Slovak Republic
36. Colombia
10
UNLOCKING GROWTH AND PROSPERITY
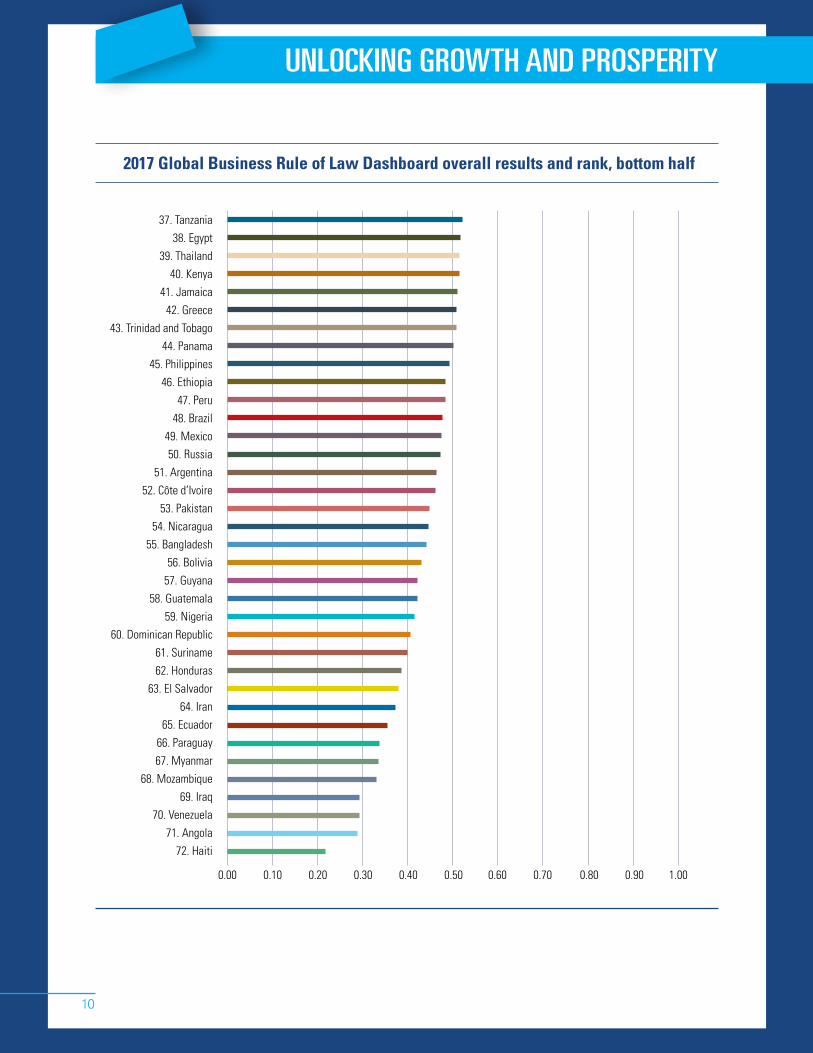
2017 Global Business Rule of Law Dashboard overall results and rank, bottom half
0.00 0.10 0.20 0.30 0.40 0.50 0.60 0.70 0.80 0.90 1.00
37. Tanzania
38. Egypt
39. Thailand
40. Kenya
41. Jamaica
42. Greece
43. Trinidad and Tobago
44. Panama
45. Philippines
46. Ethiopia
47. Peru
48. Brazil
49. Mexico
50. Russia
51. Argentina
52. Côte d’Ivoire
53. Pakistan
54. Nicaragua
55. Bangladesh
56. Bolivia
57. Guyana
58. Guatemala
59. Nigeria
60. Dominican Republic
61. Suriname
62. Honduras
63. El Salvador
64. Iran
65. Ecuador
66. Paraguay
67. Myanmar
68. Mozambique
69. Iraq
70. Venezuela
71. Angola
72. Haiti
The Global Rule of Law and Business Dashboard 2017
11
INTRODUCTION
Strengthening the rule of law is for every country and is in everyone’s interest. It is as essential within countries as it is among the family of nations.
— Ban Ki Moon, Sep. 20121
Free enterprise thrives when the rule of law is promoted and constitutional protections for all are honored.
— Thomas J. Donohue, Jan. 20173
The rule of law is one of the founding principles stemming from the common constitutional traditions of all Member States, and is one of the fundamental values upon which the European Union is based. Respect for the rule of law is a prerequisite for the protection of all fundamental values listed in the Treaties, including democracy and fundamental rights.
— EU Commission2
As a basic principle for social organization, the rule of law has been recognized since ancient Greece. Indeed, Aristotle wrote about the centrality of laws to just government in Politics. And today, whether it be international institutions (including the UN), individual governments, or regional bodies such as the European Union, the rule of law is viewed as the organizing principle for modern democratic governance. Indeed, as the above quote from the EU Commission illustrates, the rule of law is central to the EU’s identity and mandate.
Yet discussions on the rule of law and its importance to economic activity and the world of business are often, if not overlooked, then overshadowed by the more fundamental discussions about the rule of law within the context of human rights and democracy. But without the rule of law, commerce and economic activity is always limited; economic prosperity and free enterprise ultimately relies on the rule of law. Companies and businesses rely on trust and on the mechanisms—judicial, administrative, cultural, and otherwise—that ensure that when trust is broken and disputes arise, adequate remedies are both available and accessible.
12
UNLOCKING GROWTH AND PROSPERITY
Project background
Since 2013 the U.S. Chamber of Commerce, through the development of the Global Business Rule of Law Dashboard (the “Dashboard”), has attempted to bring more attention to the rule of law environment as it relates to business. The following are the key questions that the research and development of the Dashboard have sought to answer:
- How is the rule of law for business currently measured in the most heavily used and credible international indices and surveys of legal and regulatory environments? To what extent do existing international indices and surveys of legal and regulatory environments include indicators and measure areas of the rule of law as they relate to business?
- Is it possible to compare a sample of countries by identifying, extracting, and amalgamating relevant indicators from these international indices and surveys into a composite meta-measure of the rule of law as it relates to business?
This marks the third edition of the Dashboard. The ultimate purpose of the Dashboard is to provide users with an easy-to-understand yet statistically credible meta-measure of the rule of law environment globally as it relates to business.
Country sample
The 2013 Dashboard focused on the Americas region and was applied to a sample of 10 countries: Argentina, Brazil, Canada, Chile, Colombia, Ecuador, Mexico, Nicaragua, U.S., and Venezuela. In 2015 the Dashboard was significantly expanded and 50 new countries were added. This year an additional 12 countries have been added, bringing the total number of countries sampled and included in the Dashboard to 72. Table 1 gives an overview of the countries included in the sample, organized on a regional basis.
The Global Rule of Law and Business Dashboard 2017
13
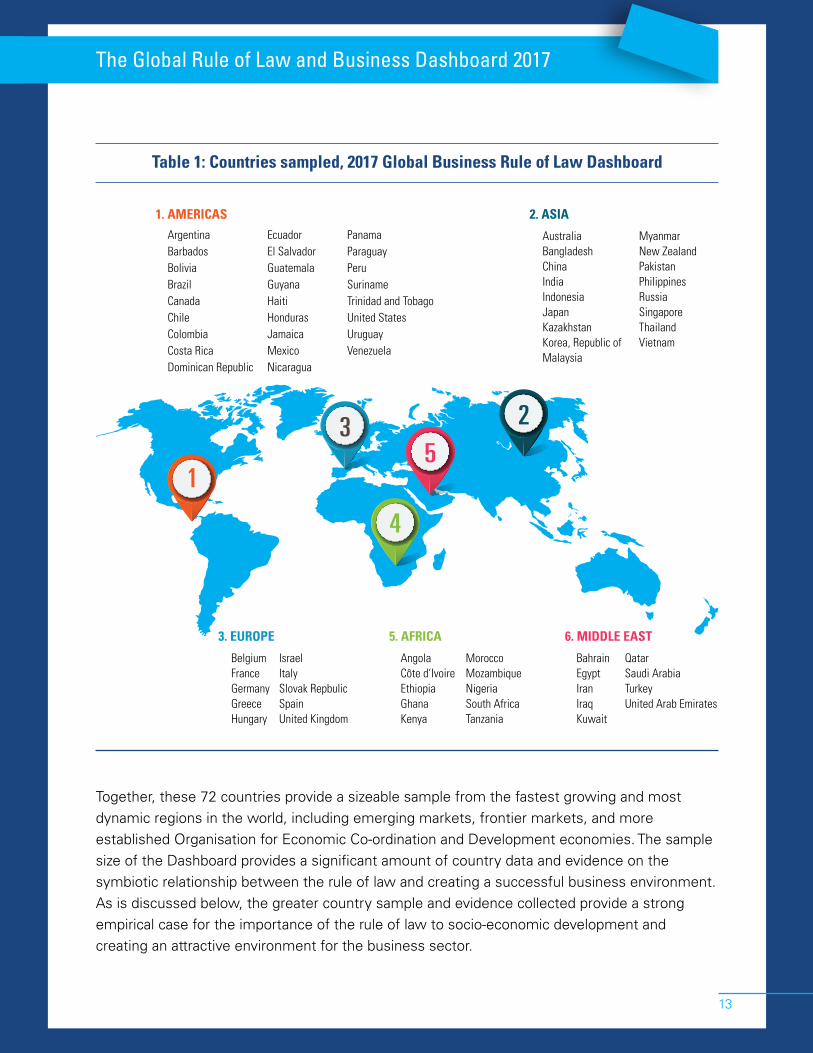
Table 1: Countries sampled, 2017 Global Business Rule of Law Dashboard
2. ASIA
AustraliaBangladeshChinaIndiaIndonesiaJapanKazakhstanKorea, Republic ofMalaysia
MyanmarNew ZealandPakistanPhilippinesRussiaSingaporeThailandVietnam
1. AMERICASArgentinaBarbadosBoliviaBrazilCanadaChileColombiaCosta RicaDominican Republic
EcuadorEl SalvadorGuatemalaGuyanaHaitiHondurasJamaicaMexicoNicaragua
5. AFRICA
AngolaCôte d’IvoireEthiopiaGhanaKenya
MoroccoMozambiqueNigeriaSouth AfricaTanzania
35
2
4
Together, these 72 countries provide a sizeable sample from the fastest growing and most dynamic regions in the world, including emerging markets, frontier markets, and more established Organisation for Economic Co-ordination and Development economies. The sample size of the Dashboard provides a significant amount of country data and evidence on the symbiotic relationship between the rule of law and creating a successful business environment. As is discussed below, the greater country sample and evidence collected provide a strong empirical case for the importance of the rule of law to socio-economic development and creating an attractive environment for the business sector.
PanamaParaguayPeruSurinameTrinidad and TobagoUnited StatesUruguayVenezuela
6. MIDDLE EAST
BahrainEgyptIranIraqKuwait
QatarSaudi ArabiaTurkeyUnited Arab Emirates
3. EUROPE
BelgiumFranceGermanyGreeceHungary
Israel ItalySlovak RepbulicSpainUnited Kingdom
1
14
UNLOCKING GROWTH AND PROSPERITY
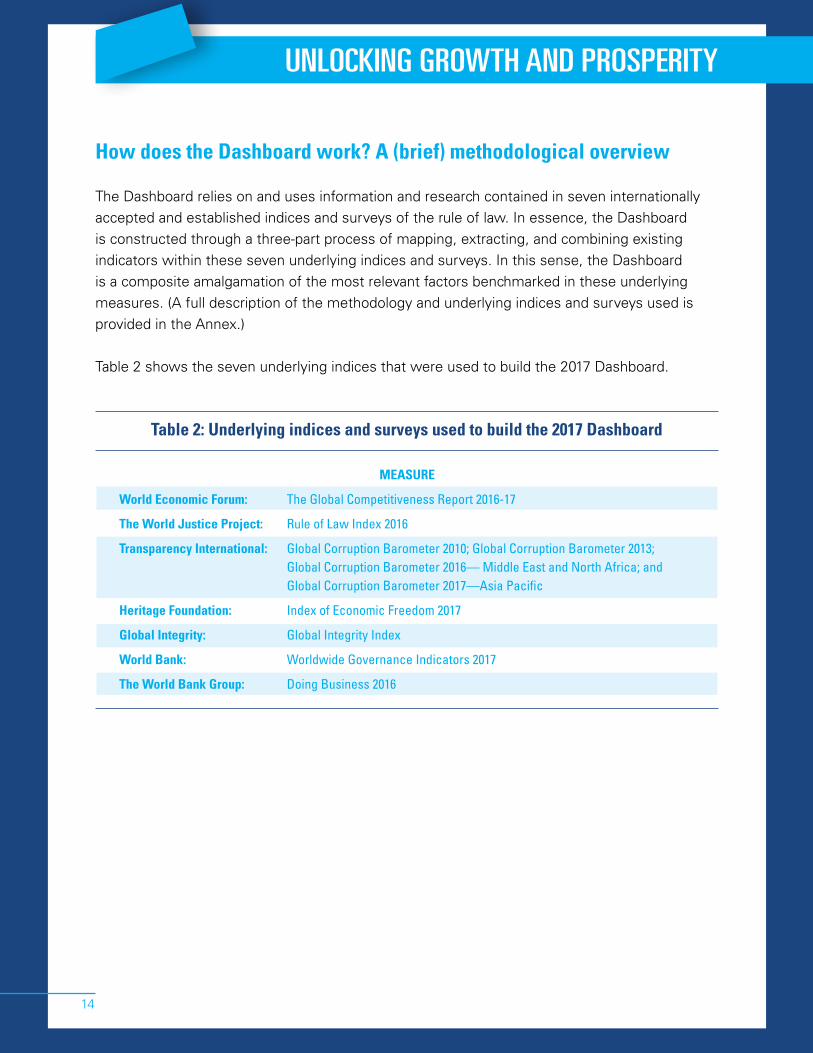
How does the Dashboard work? A (brief) methodological overview
The Dashboard relies on and uses information and research contained in seven internationally accepted and established indices and surveys of the rule of law. In essence, the Dashboard is constructed through a three-part process of mapping, extracting, and combining existing indicators within these seven underlying indices and surveys. In this sense, the Dashboard is a composite amalgamation of the most relevant factors benchmarked in these underlying measures. (A full description of the methodology and underlying indices and surveys used is provided in the Annex.)
Table 2 shows the seven underlying indices that were used to build the 2017 Dashboard.
Table 2: Underlying indices and surveys used to build the 2017 Dashboard
MEASURE
World Economic Forum: The Global Competitiveness Report 2016-17
The World Justice Project: Rule of Law Index 2016
Transparency International: Global Corruption Barometer 2010; Global Corruption Barometer 2013; Global Corruption Barometer 2016— Middle East and North Africa; and Global Corruption Barometer 2017—Asia Pacific
Heritage Foundation: Index of Economic Freedom 2017
Global Integrity: Global Integrity Index
World Bank: Worldwide Governance Indicators 2017
The World Bank Group: Doing Business 2016
The Global Rule of Law and Business Dashboard 2017
15
Report structure
In addition to this Introduction, the report contains four sections.
Section 1 analyzes the results of the 2017 Dashboard. What do the overall—and individual country—results tell us about the state of the rule of law and the business community in 2017?
Section 2 focuses on the regional perspective. Are there stark differences in how regions perform in the Dashboard? Is the rule of law for business stronger or weaker in some regions around the world compared with others?
Section 3 looks at the performance of the Dashboard over time since 2013. Ten countries have been included since 2013, and it is possible to track their respective environments over what is now close to a half decade. Has the rule of law for business improved or weakened? How have individual countries performed over time?
Section 4 provides concluding thoughts and ties together the data, information, and performance review of the preceding sections.
Finally, the Annex provides a full discussion of the methodology of the Dashboard. How has the Dashboard been constructed? Which international indices and surveys does it rely on? The Annex also includes the individual results of the Dashboard for the seven underlying measures.
16
UNLOCKING GROWTH AND PROSPERITY
SECTION 1: THE GLOBAL RULE OF LAW AND BUSINESS DASHBOARD 2017—RESULTS AND IMPRESSIONS
1.1 Overall results
The results of the 2017 Dashboard are captured in Figures 1 and 2, with the top and bottom half of the 72 countries sampled in the Dashboard included, respectively.
The Global Rule of Law and Business Dashboard 2017
17
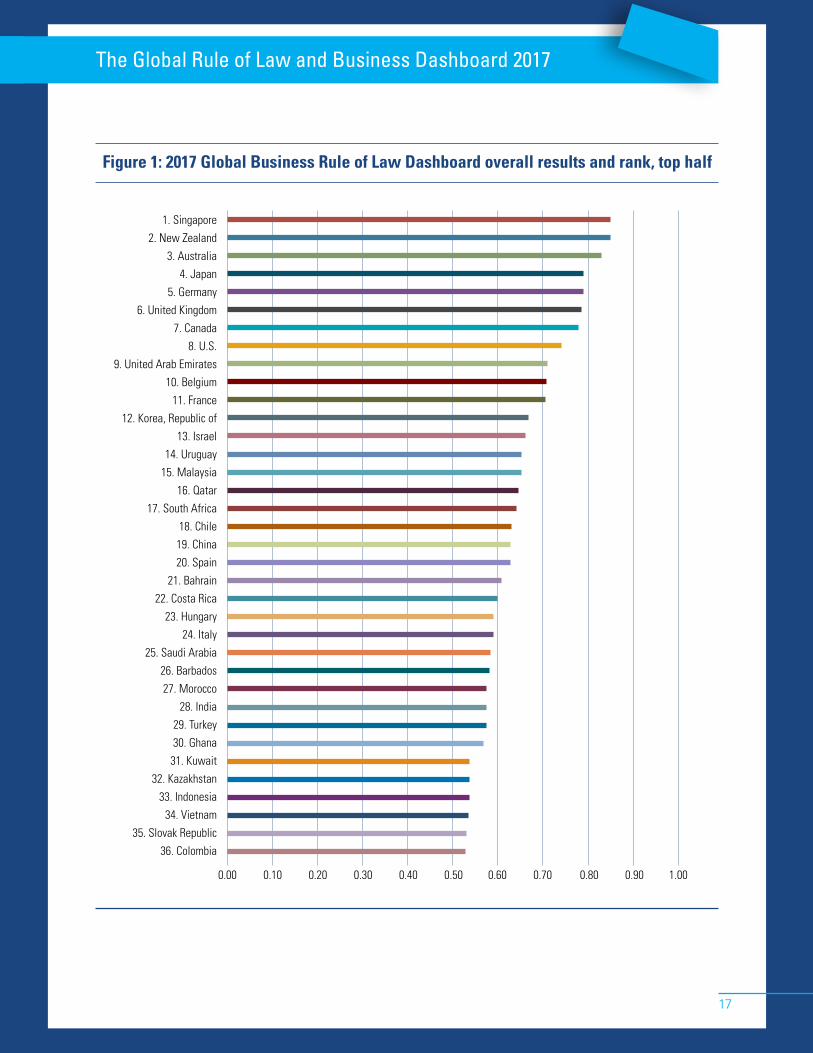
Figure 1: 2017 Global Business Rule of Law Dashboard overall results and rank, top half
0.00 0.10 0.20 0.30 0.40 0.50 0.60 0.70 0.80 0.90 1.00
1. Singapore
2. New Zealand
3. Australia
4. Japan
5. Germany
6. United Kingdom
7. Canada
8. U.S.
9. United Arab Emirates
10. Belgium
11. France
12. Korea, Republic of
13. Israel
14. Uruguay
15. Malaysia
16. Qatar
17. South Africa
18. Chile
19. China
20. Spain
21. Bahrain
22. Costa Rica
23. Hungary
24. Italy
25. Saudi Arabia
26. Barbados
27. Morocco
28. India
29. Turkey
30. Ghana
31. Kuwait
32. Kazakhstan
33. Indonesia
34. Vietnam
35. Slovak Republic
36. Colombia

18
UNLOCKING GROWTH AND PROSPERITY
Figure 2: 2017 Global Business Rule of Law Dashboard overall results and rank, bottom half
0.00 0.10 0.20 0.30 0.40 0.50 0.60 0.70 0.80 0.90 1.00
37. Tanzania
38. Egypt
39. Thailand
40. Kenya
41. Jamaica
42. Greece
43. Trinidad and Tobago
44. Panama
45. Philippines
46. Ethiopia
47. Peru
48. Brazil
49. Mexico
50. Russia
51. Argentina
52. Côte d’Ivoire
53. Pakistan
54. Nicaragua
55. Bangladesh
56. Bolivia
57. Guyana
58. Guatemala
59. Nigeria
60. Dominican Republic
61. Suriname
62. Honduras
63. El Salvador
64. Iran
65. Ecuador
66. Paraguay
67. Myanmar
68. Mozambique
69. Iraq
70. Venezuela
71. Angola
72. Haiti
The Global Rule of Law and Business Dashboard 2017
19
1.2 Key impressions
What stands out from the overall results of the 2017 Dashboard?
Looking at the top 10 countries first, it is clear that from a regional perspective Asia is a real leader in the rule of law for business. Singapore and New Zealand are virtually tied for the top ranking at 85% each, with Australia just behind at 83% of the total possible score. Behind this trio is a drop down to the second tier of countries, including Japan, Germany, and the UK Somewhat surprisingly, the U.S. is quite far behind the global leaders at 74%—more than 10% behind Singapore. In fact, what is striking about the top 10 is the growing diversity. Indeed, representing the strengthening and growth of the business environment in the Middle East, the United Arab Emirates (UAE) is ranked ninth, coming just behind the U.S. at 71% and ahead of Belgium.
Examining the top-half results from a regional perspective, it is clear that many Western European countries—including Italy, Spain, and Hungary—are viewed as facing real challenges when it comes to the rule of law for business. Although EU membership is in many ways a great boon for Member States and guarantees a degree of stability and business attractiveness, it does not compensate for real national challenges. For example, the Slovak Republic ranks 35th, achieving the same score as Colombia and Vietnam.
On the other hand, the results of the Dashboard do not suggest that simply being a fast-growing emerging market is a natural magnet or panacea. Indeed, neither the BRICS (Brazil, Russia, India, China, and South Africa) nor MINT (Mexico, Indonesia, Nigeria, and Turkey) economies come out on top. Of this group of nine large, fast-growing emerging markets, only two—South Africa and China—are ranked in the top 20 of the 2017 Dashboard, in 17th and 19th place and achieving a score of 64% and 63%, respectively. The other six economies rank squarely in the middle or in the bottom half. And for both South Africa and China, their relatively strong performance is driven by their high scores in the Global Integrity Index and Global Corruption Barometer. For example, as mentioned, in the 2017 regional edition of the Global Corruption Barometer for Asia Pacific the perceived rate of corruption for Chinese government institutions is 9%.4 This is ahead of Australia’s 10%, half of Japan’s 18.7%, and less than a sixth of Korea’s perceived rate of 55%. Similarly, South Africa comes out as a top-rated country overall on the Global Integrity Index, whereas on most other measures it is in the bottom half, significantly behind countries such as the U.S. and Canada.
20
UNLOCKING GROWTH AND PROSPERITY
More broadly, it is clear that there is a fairly big middle class: a majority of countries mapped (50%+) place squarely in the middle, with 39 countries achieving a score of between 45% and 65%. Still, this means that only 13 countries, or less than 20% of the sample, achieve a score of 66% or above.
In this respect, it is quite clear that the rule of law and business remains a significant challenge in the vast majority of the countries sampled in the 2017 Dashboard.
This is particularly the case for the countries in the bottom 10 of the Dashboard. These countries face challenges on virtually all aspects of the rule of law and business. As is discussed in the following section, countries from the Americas are well represented in this bottom 10. Of the 10 countries in the bottom, five are from the Americas: Haiti, Venezuela, Paraguay, Ecuador, and El Salvador. These are immediately followed by Honduras, Suriname, and the Dominican Republic, which come in 11th, 12th, and 13th, respectively.
The Global Rule of Law and Business Dashboard 2017
21
SECTION 2: REGIONAL ZOOM-IN—COMPARING REGIONS ON THE RULE OF LAW AND BUSINESS
The large sample of 72 countries from all corners of the globe in the Dashboard allows us to compare different regions of the world vis-à-vis each other. Which regions have the strongest rule of law and business environments? And which are the top-performing countries in each region?
2.1 The Americas
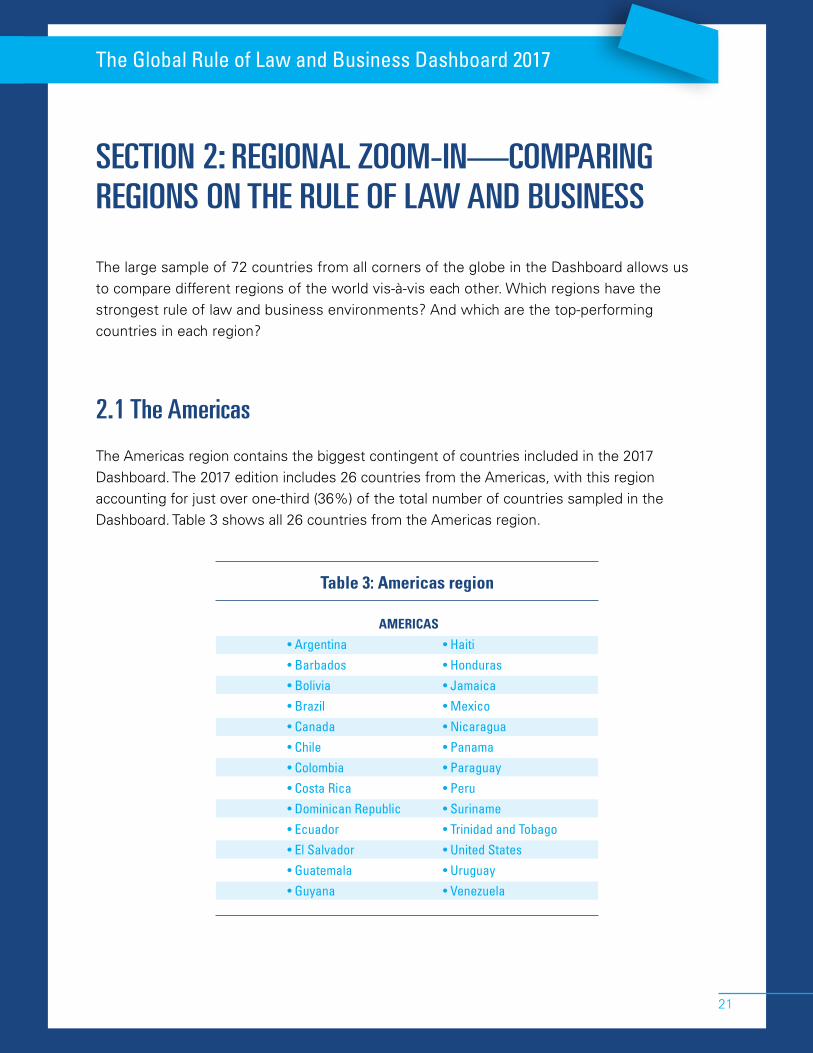
The Americas region contains the biggest contingent of countries included in the 2017 Dashboard. The 2017 edition includes 26 countries from the Americas, with this region accounting for just over one-third (36%) of the total number of countries sampled in the Dashboard. Table 3 shows all 26 countries from the Americas region.
Table 3: Americas region
AMERICAS
• Argentina • Haiti• Barbados • Honduras• Bolivia • Jamaica• Brazil • Mexico• Canada • Nicaragua• Chile • Panama• Colombia • Paraguay• Costa Rica • Peru• Dominican Republic • Suriname• Ecuador • Trinidad and Tobago• El Salvador • United States• Guatemala • Uruguay• Guyana • Venezuela
22
UNLOCKING GROWTH AND PROSPERITY
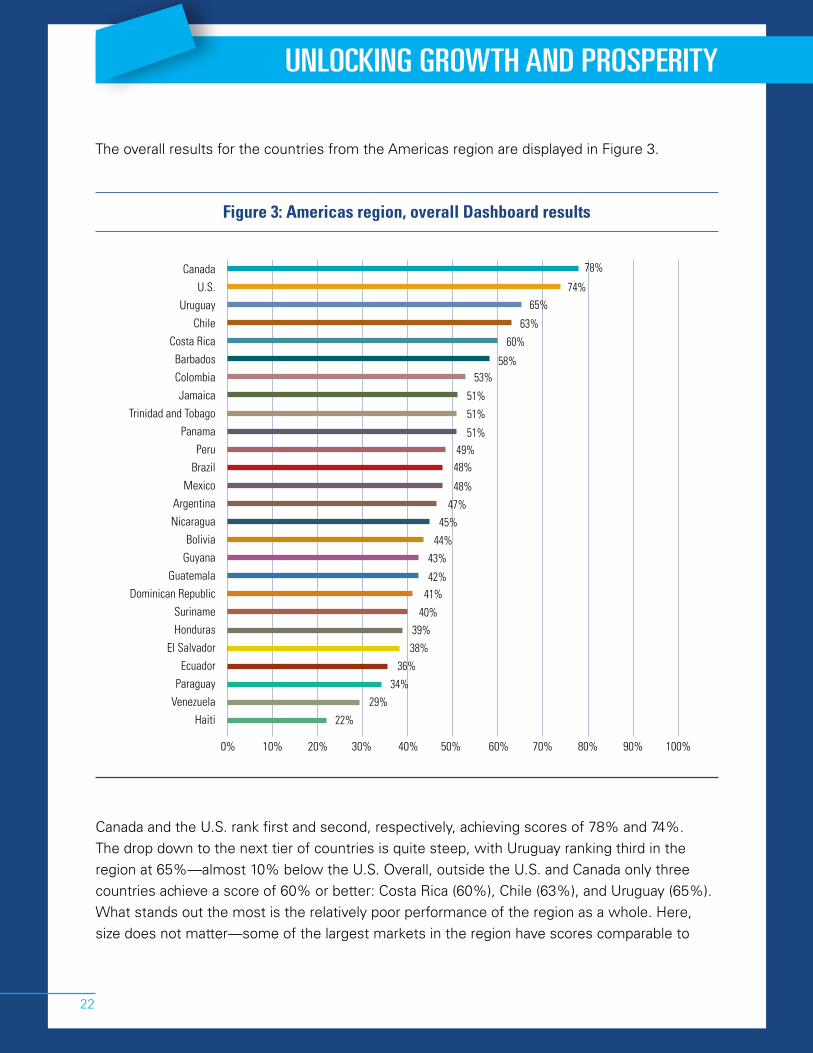
Canada and the U.S. rank first and second, respectively, achieving scores of 78% and 74%. The drop down to the next tier of countries is quite steep, with Uruguay ranking third in the region at 65%—almost 10% below the U.S. Overall, outside the U.S. and Canada only three countries achieve a score of 60% or better: Costa Rica (60%), Chile (63%), and Uruguay (65%). What stands out the most is the relatively poor performance of the region as a whole. Here, size does not matter—some of the largest markets in the region have scores comparable to
The overall results for the countries from the Americas region are displayed in Figure 3.
Figure 3: Americas region, overall Dashboard results
0% 10% 20% 30% 40% 50% 60% 70% 80% 90% 100%
Canada
U.S.
Uruguay
Chile
Costa Rica
Barbados
Colombia
Jamaica
Trinidad and Tobago
Panama
Peru
Brazil
Mexico
Argentina
Nicaragua
Bolivia
Guyana
Guatemala
Dominican Republic
Suriname
Honduras
El Salvador
Ecuador
Paraguay
Venezuela
Haiti
78%
74%65%
63%
60%
58%53%
51%
51%
51%49%
48%
48%
47%45%
44%43%
42%41%
40%39%38%
36%
34%29%
22%
The Global Rule of Law and Business Dashboard 2017
23
smaller markets. Brazil, Argentina, and Mexico all fail to achieve 50% of the score. In fact, the vast majority of countries in the Americas – 16 of the 26 evaluated – do not reach 50% of the total score, and only seven countries achieve a score above 50%. The average (mean) score is 48.03% and the median score is 47.27%.
Clearly, the rule of law for business is challenging in most if not all parts of the Americas. But how does this performance compare with other regions and what does it tell us in relative terms about the Americas and these other regions?
2.2 The Middle East
The Middle East region contains the smallest contingent of countries in the 2017 Dashboard: 9 countries (including Turkey, which could geographically also be included with Europe) account for 12.5% of the total number of countries sampled in the Dashboard. Table 4 shows all nine countries from the Middle East.
Table 4: The Middle East
MIDDLE EAST
• Bahrain• Egypt• Iran• Iraq• Kuwait• Qatar• Saudi Arabia• Turkey• United Arab Emirates
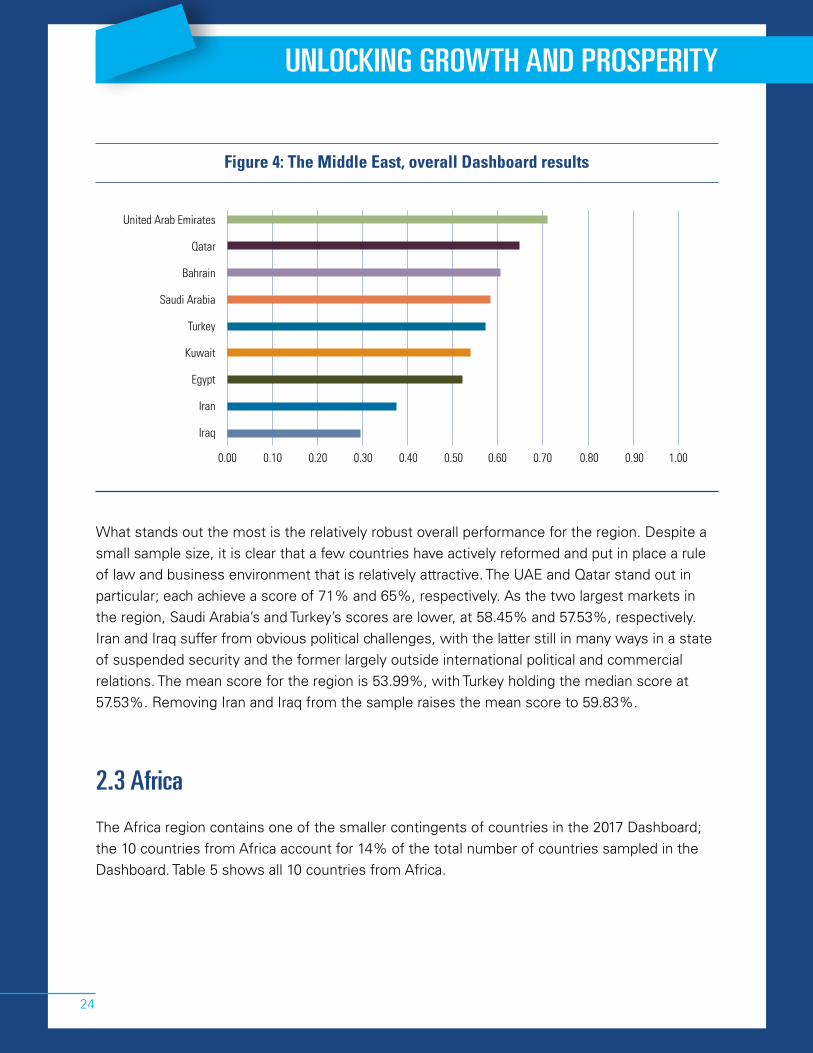
The overall results for the countries from the Middle East are displayed in Figure 4.
24
UNLOCKING GROWTH AND PROSPERITY
What stands out the most is the relatively robust overall performance for the region. Despite a small sample size, it is clear that a few countries have actively reformed and put in place a rule of law and business environment that is relatively attractive. The UAE and Qatar stand out in particular; each achieve a score of 71% and 65%, respectively. As the two largest markets in the region, Saudi Arabia’s and Turkey’s scores are lower, at 58.45% and 57.53%, respectively. Iran and Iraq suffer from obvious political challenges, with the latter still in many ways in a state of suspended security and the former largely outside international political and commercial relations. The mean score for the region is 53.99%, with Turkey holding the median score at 57.53%. Removing Iran and Iraq from the sample raises the mean score to 59.83%.
2.3 Africa
The Africa region contains one of the smaller contingents of countries in the 2017 Dashboard; the 10 countries from Africa account for 14% of the total number of countries sampled in the Dashboard. Table 5 shows all 10 countries from Africa.
Figure 4: The Middle East, overall Dashboard results
0.00 0.10 0.20 0.30 0.40 0.50 0.60 0.70 0.80 0.90 1.00
United Arab Emirates
Qatar
Bahrain
Saudi Arabia
Turkey
Kuwait
Egypt
Iran
Iraq
The Global Rule of Law and Business Dashboard 2017
25
0.00 0.10 0.20 0.30 0.40 0.50 0.60 0.70 0.80 0.90 1.00
South Africa
Morocco
Ghana
Tanzania
Kenya
Ethiopia
Côte d’Ivoire
Nigeria
Mozambique
Angola
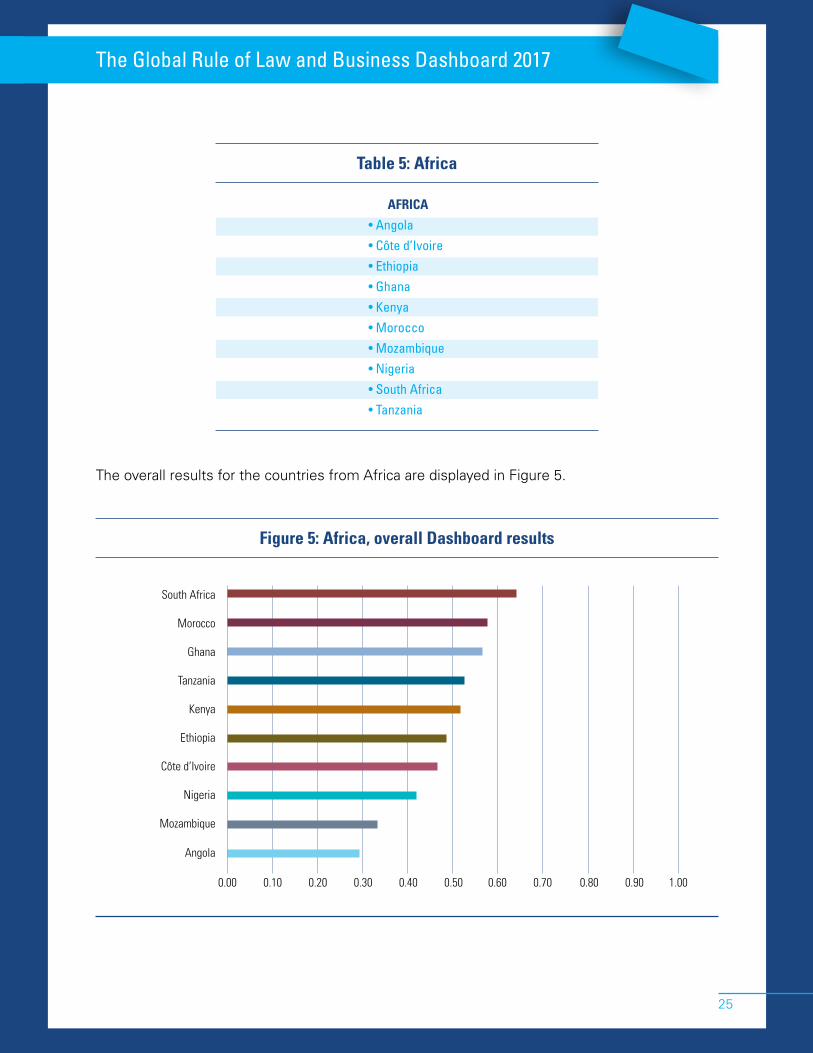
Table 5: Africa
AFRICA
• Angola• Côte d’Ivoire• Ethiopia• Ghana• Kenya• Morocco• Mozambique• Nigeria• South Africa• Tanzania
The overall results for the countries from Africa are displayed in Figure 5.
Figure 5: Africa, overall Dashboard results
26
UNLOCKING GROWTH AND PROSPERITY
The region as a whole underperformed compared to other regions except the Americas. South Africa is the only country that achieves a score above 60% and the two lowest scorers (Angola and Mozambique) are in the bottom 5 for the entire Dashboard. The mean score for the 10 countries sampled from Africa is 48.23%. This is marginally higher than the Americas at 48.03%. And the median score is 50.19%, which is higher than that of the Americas at 47.27%. Still, significant challenges remain. The twenty-point gap in performance between South Africa and Nigeria, the region’s two largest economies, demonstrates there is room for improvement in the rule of law business environment.
2.4 Europe
Europe contains one of the smallest contingents of countries in the 2017 Dashboard.5 The 2017 edition includes 10 countries, which account for 14% of the total number of countries sampled in the Dashboard. Table 6 shows all 10 countries from Europe.
Table 6: Europe
EUROPE
• Belgium• France• Germany• Greece• Hungary• Israel• Italy• Slovak Republic• Spain• United Kingdom
The overall results for the countries from Europe are displayed in Figure 6.
The Global Rule of Law and Business Dashboard 2017
27
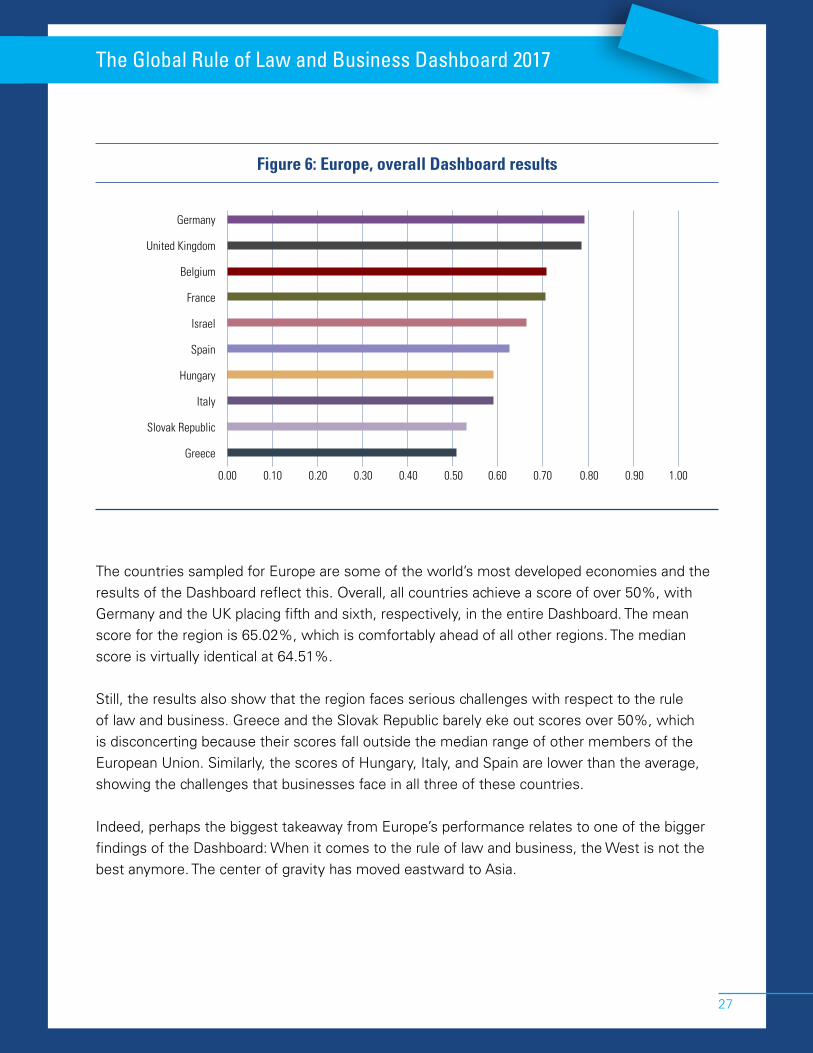
Figure 6: Europe, overall Dashboard results
0.00 0.10 0.20 0.30 0.40 0.50 0.60 0.70 0.80 0.90 1.00
Germany
United Kingdom
Belgium
France
Israel
Spain
Hungary
Italy
Slovak Republic
Greece
The countries sampled for Europe are some of the world’s most developed economies and the results of the Dashboard reflect this. Overall, all countries achieve a score of over 50%, with Germany and the UK placing fifth and sixth, respectively, in the entire Dashboard. The mean score for the region is 65.02%, which is comfortably ahead of all other regions. The median score is virtually identical at 64.51%.
Still, the results also show that the region faces serious challenges with respect to the rule of law and business. Greece and the Slovak Republic barely eke out scores over 50%, which is disconcerting because their scores fall outside the median range of other members of the European Union. Similarly, the scores of Hungary, Italy, and Spain are lower than the average, showing the challenges that businesses face in all three of these countries.
Indeed, perhaps the biggest takeaway from Europe’s performance relates to one of the bigger findings of the Dashboard: When it comes to the rule of law and business, the West is not the best anymore. The center of gravity has moved eastward to Asia.
28
UNLOCKING GROWTH AND PROSPERITY
2.5 Asia
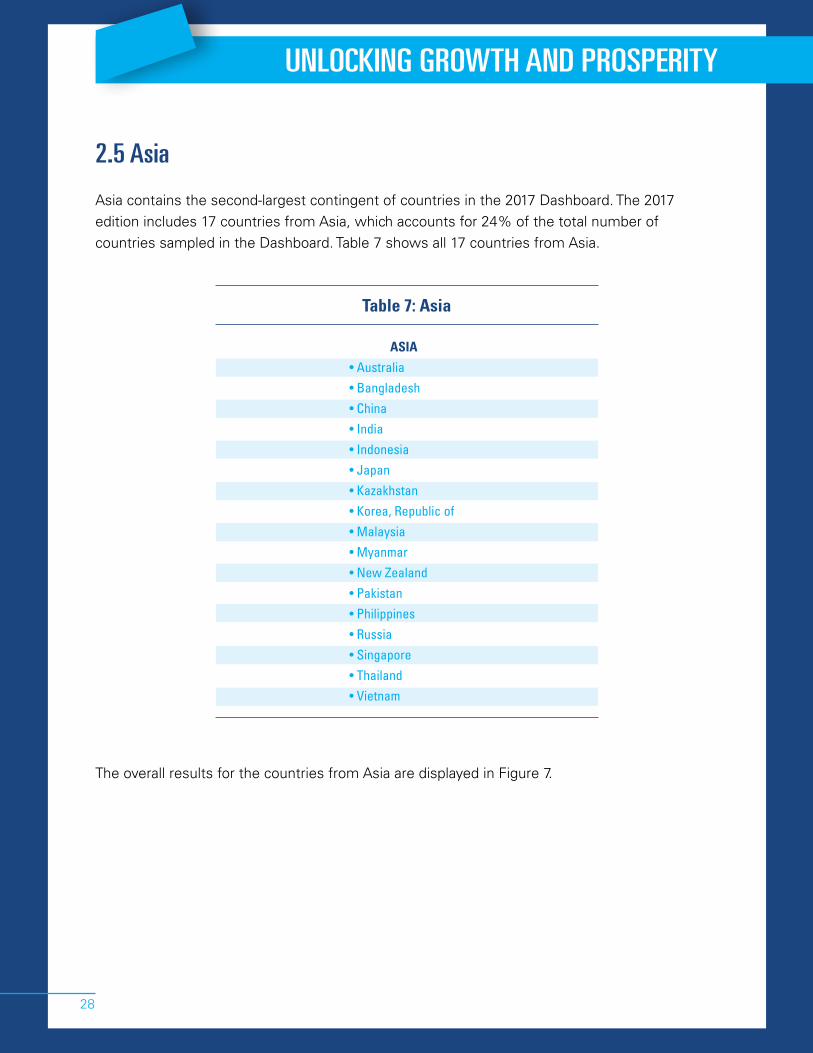
Asia contains the second-largest contingent of countries in the 2017 Dashboard. The 2017 edition includes 17 countries from Asia, which accounts for 24% of the total number of countries sampled in the Dashboard. Table 7 shows all 17 countries from Asia.
Table 7: Asia
ASIA
• Australia• Bangladesh• China• India• Indonesia• Japan• Kazakhstan• Korea, Republic of• Malaysia• Myanmar• New Zealand• Pakistan• Philippines• Russia• Singapore• Thailand• Vietnam
The overall results for the countries from Asia are displayed in Figure 7.
The Global Rule of Law and Business Dashboard 2017
29
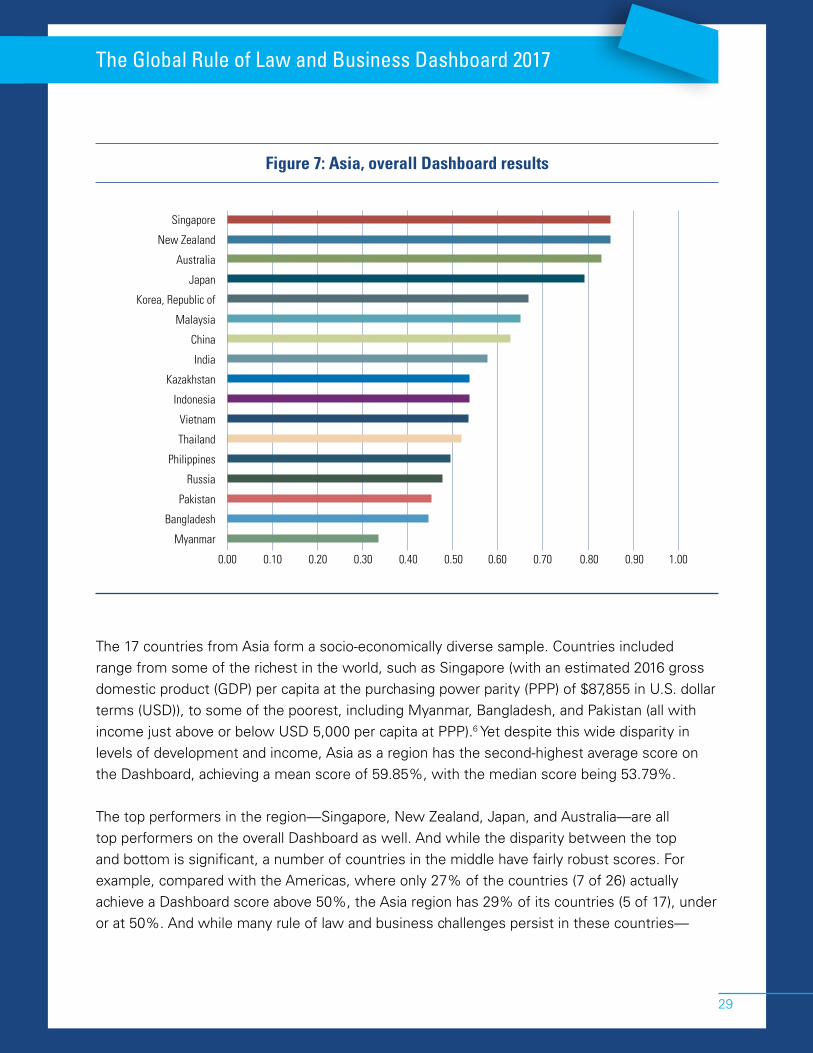
Figure 7: Asia, overall Dashboard results
0.00 0.10 0.20 0.30 0.40 0.50 0.60 0.70 0.80 0.90 1.00
Singapore
New Zealand
Australia
Japan
Korea, Republic of
Malaysia
China
India
Kazakhstan
Indonesia
Vietnam
Thailand
Philippines
Russia
Pakistan
Bangladesh
Myanmar
The 17 countries from Asia form a socio-economically diverse sample. Countries included range from some of the richest in the world, such as Singapore (with an estimated 2016 gross domestic product (GDP) per capita at the purchasing power parity (PPP) of $87,855 in U.S. dollar terms (USD)), to some of the poorest, including Myanmar, Bangladesh, and Pakistan (all with income just above or below USD 5,000 per capita at PPP).6 Yet despite this wide disparity in levels of development and income, Asia as a region has the second-highest average score on the Dashboard, achieving a mean score of 59.85%, with the median score being 53.79%.
The top performers in the region—Singapore, New Zealand, Japan, and Australia—are all top performers on the overall Dashboard as well. And while the disparity between the top and bottom is significant, a number of countries in the middle have fairly robust scores. For example, compared with the Americas, where only 27% of the countries (7 of 26) actually achieve a Dashboard score above 50%, the Asia region has 29% of its countries (5 of 17), under or at 50%. And while many rule of law and business challenges persist in these countries—
30
UNLOCKING GROWTH AND PROSPERITY
particularly in China, India, Indonesia, and Vietnam, where localization policies and increasing levels of protectionism are affecting the rule of law and business—these scores nevertheless reflect the efforts of many countries in the region to reform their respective economies and improve their competitiveness.
2.6 Section summary
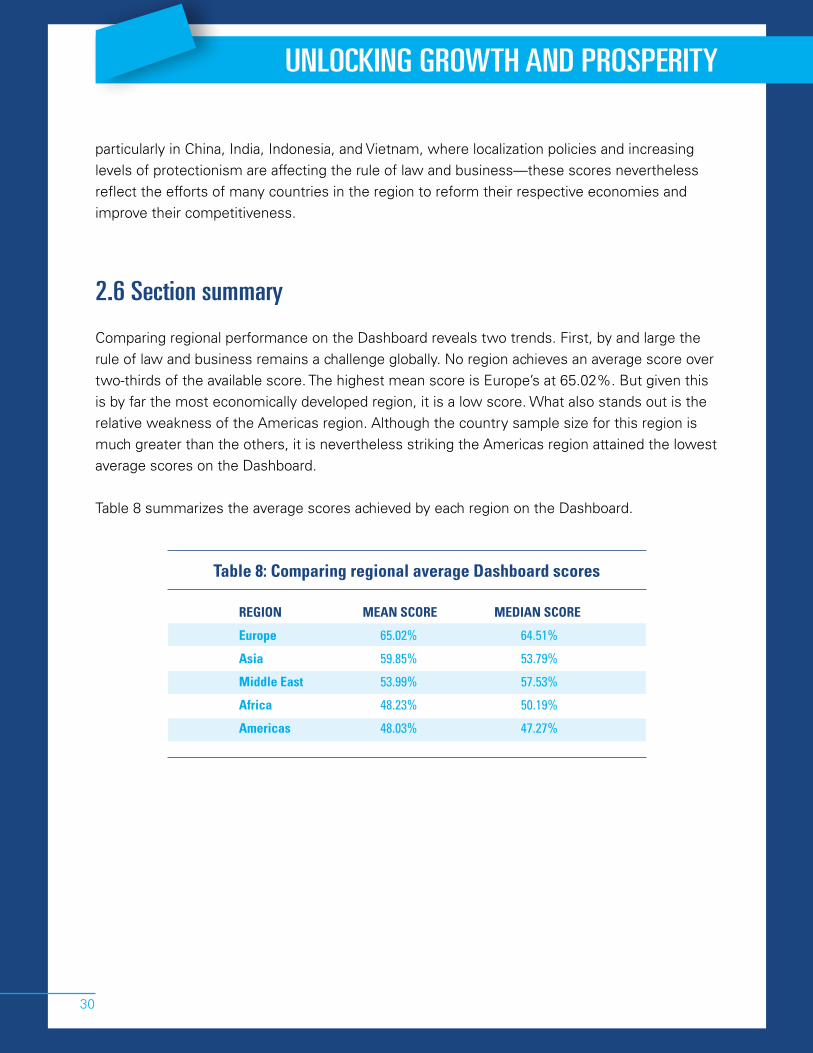
Comparing regional performance on the Dashboard reveals two trends. First, by and large the rule of law and business remains a challenge globally. No region achieves an average score over two-thirds of the available score. The highest mean score is Europe’s at 65.02%. But given this is by far the most economically developed region, it is a low score. What also stands out is the relative weakness of the Americas region. Although the country sample size for this region is much greater than the others, it is nevertheless striking the Americas region attained the lowest average scores on the Dashboard.
Table 8 summarizes the average scores achieved by each region on the Dashboard.
Table 8: Comparing regional average Dashboard scores
REGION MEAN SCORE MEDIAN SCORE
Europe 65.02% 64.51%
Asia 59.85% 53.79%
Middle East 53.99% 57.53%
Africa 48.23% 50.19%
Americas 48.03% 47.27%
The Global Rule of Law and Business Dashboard 2017
31
SECTION 3: GETTING BETTER OR WORSE? COMPARING THREE EDITIONS OF THE GLOBAL BUSINESS RULE OF LAW DASHBOARD
It’s now been four years since the first edition of the Dashboard was launched, and enough time has elapsed to make it possible to examine developments over time and get a sense of whether the rule of law for business has improved or deteriorated. However, given that the Dashboard has grown considerably over the course of the three editions—from 10 countries in 2013 to 60 in 2015 to 72 countries in 2017—it is not possible to make like-for-like comparisons between all editions.
But it is possible to isolate the original 10 countries from the Americas and see what their development tells us about the rule of law and business. Has the environment in these 10 countries improved or deteriorated over the course of the past four years?
3.1 Then and now: The rule of law in the Americas in 2013 versus 2017
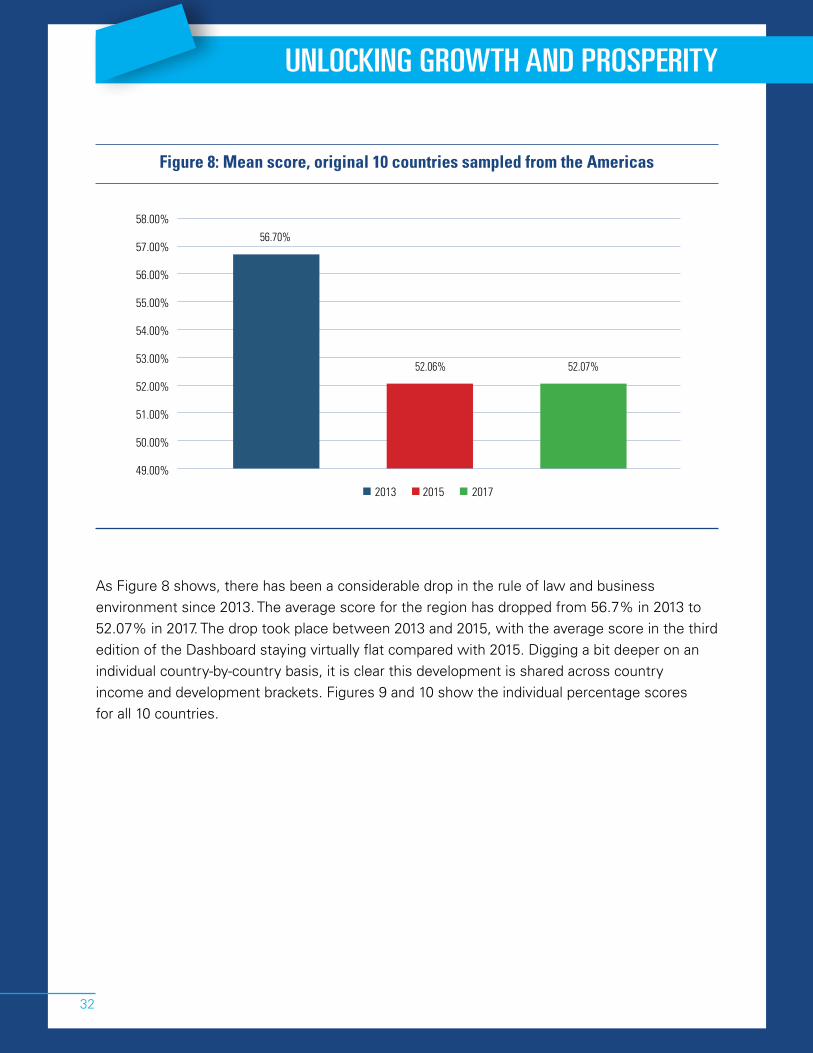
How has the rule of law environment for business changed in the Americas region since 2013? Comparing the average score on the Global Business Rule of Law Dashboard, it is clear that, overall, the environment has deteriorated over the past four years. Figure 8 shows the mean score from 2013 to 2017 for the 10 countries that have been sampled since the first edition of the Dashboard.
32
UNLOCKING GROWTH AND PROSPERITY
Figure 8: Mean score, original 10 countries sampled from the Americas
As Figure 8 shows, there has been a considerable drop in the rule of law and business environment since 2013. The average score for the region has dropped from 56.7% in 2013 to 52.07% in 2017. The drop took place between 2013 and 2015, with the average score in the third edition of the Dashboard staying virtually flat compared with 2015. Digging a bit deeper on an individual country-by-country basis, it is clear this development is shared across country income and development brackets. Figures 9 and 10 show the individual percentage scores for all 10 countries.
2013 2015 2017
58.00%
57.00%
56.00%
55.00%
54.00%
53.00%
52.00%
51.00%
50.00%
49.00%
56.70%
52.06% 52.07%
The Global Rule of Law and Business Dashboard 2017
33
Figure 9: Global Business Rule of Law Dashboard, 2013-17, top half, original sampled countries
2013 2015 2017
2013 2015 2017
Canada U.S. Chile Colombia Brazil
Mexico Argentina Nicaragua Ecuador Venezuela
100%
90%
80%
70%
60%
50%
40%
60%
55%
50%
45%
40%
35%
30%
25%
20%
83%
54%
80%
48%
74%
46%
57%
38%
55%
32%
79%
48%
73%
45%
65%
44%
53%
35%
48%
30%
78%
48%
74%
47%
63%
45%
53%
36%
48%
29%
Figure 10: Global Business Rule of Law Dashboard, 2013-17, bottom half, original sampled countries
34
UNLOCKING GROWTH AND PROSPERITY
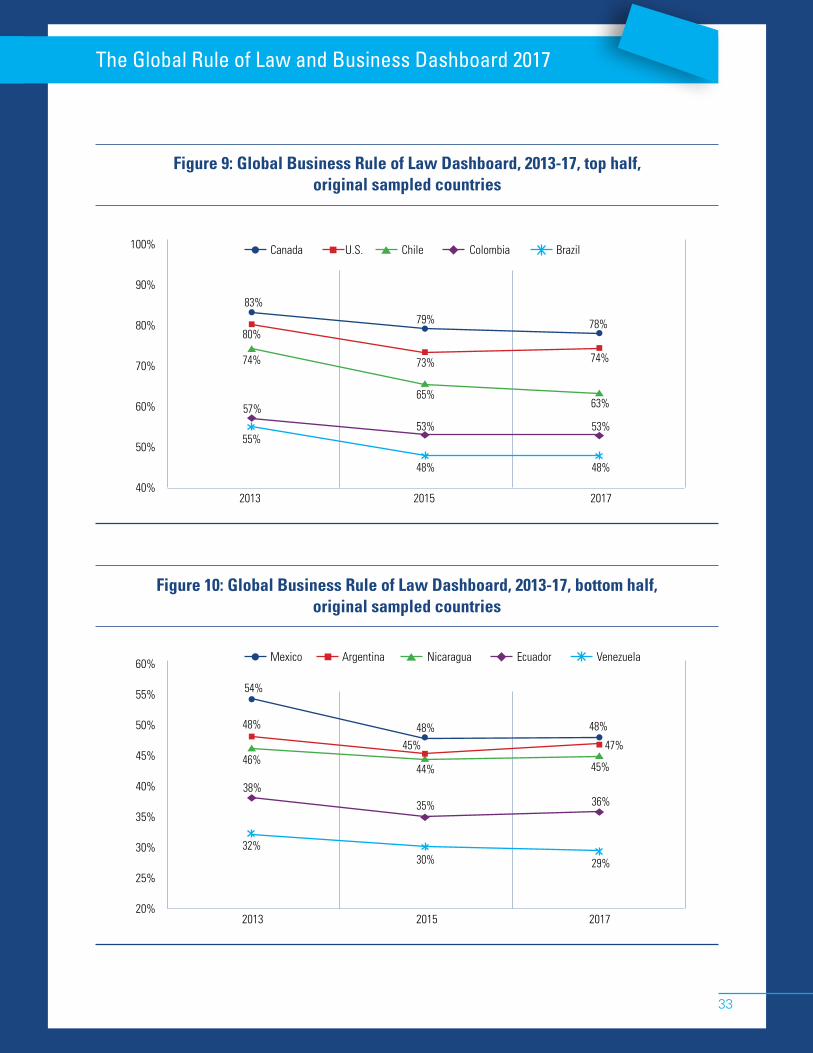
As Figures 9 and 10 show, almost all countries have experienced a significant drop in their Dashboard scores. For example, both the U.S. and Canada have seen their respective scores fall by 5% and 6%, respectively. Chile has seen the biggest drop of all countries, from 74% in 2013 to 63% in 2017. In fact, Chile’s environment for the rule of law and business is now closer to that of Colombia than Canada, which in 2013 was less than 10% behind. Similarly, Brazil and Mexico have seen their percentage scores drop from 55% and 54%, respectively, in 2013 to 48% in 2017.
3.2 Is the Americas region closing for business?
In the preceding section we saw that, when comparing the results of the five different regions covered, the Americas region actually proved to be the most challenging, achieving the lowest mean score of all regions sampled in the 2017 Dashboard. Similarly, although the country sample size is smaller, comparing the Dashboard results over time shows that the situation has not improved. Instead, there has been a steady drop. To some extent, stepping back and looking at major events over the past four years helps explain this. Many countries in the region have been plagued by deep political uncertainty and turmoil. Brazil has been experiencing political turmoil and confronting a series of corruption scandals since late 2015. Similarly, Guatemala was impacted when both the sitting president and vice president were forced out of office in 2015 and criminally charged with corruption. Furthermore, a number of countries—for example, Haiti—have suffered natural disasters and deep economic difficulties coupled with political uncertainty.
Yet it is also clear that this decline is not a fleeting phenomenon or isolated to a handful of countries in the region. Tellingly, of the 10 countries we can follow from 2013, not one increased its 2013 score. The best performers have simply stayed the same.
For the region as a whole, the Dashboard results suggest that socio-economic competitiveness could be much improved for the entire region. With new, or relatively new, governments in place in the U.S. and Argentina, and general elections scheduled for both Mexico and Brazil in 2018, there is room and opportunity for improvement. As the preceding section illustrates, other regions are forging ahead, reforming and creating the kind of conditions where businesses can thrive. There is an apparent and pressing need for the Americas region to act and not risk being left behind.
The Global Rule of Law and Business Dashboard 2017
35
SECTION 4: CONCLUDING THOUGHTS
It has now been four years since the first edition of the Dashboard was launched. The primary purpose of the Dashboard has always been to provide policymakers, governments, and industry with an empirical tool to highlight and understand the particular needs of the business community within a rule of law context. What issues are important to business? What is currently being measured internationally? And what does this tell us about the rule of law and business globally?
The 2017 edition of the Global Business Rule of Law Dashboard builds on the work that has already been done. It has significantly expanded country coverage of the Dashboard from 60 countries to 72. The 2017 edition of the report includes a regional zoom-in—comparing and contrasting regional performances on the Dashboard—as well as a longitudinal comparison for the original 10 countries sampled in the first edition of the Dashboard.
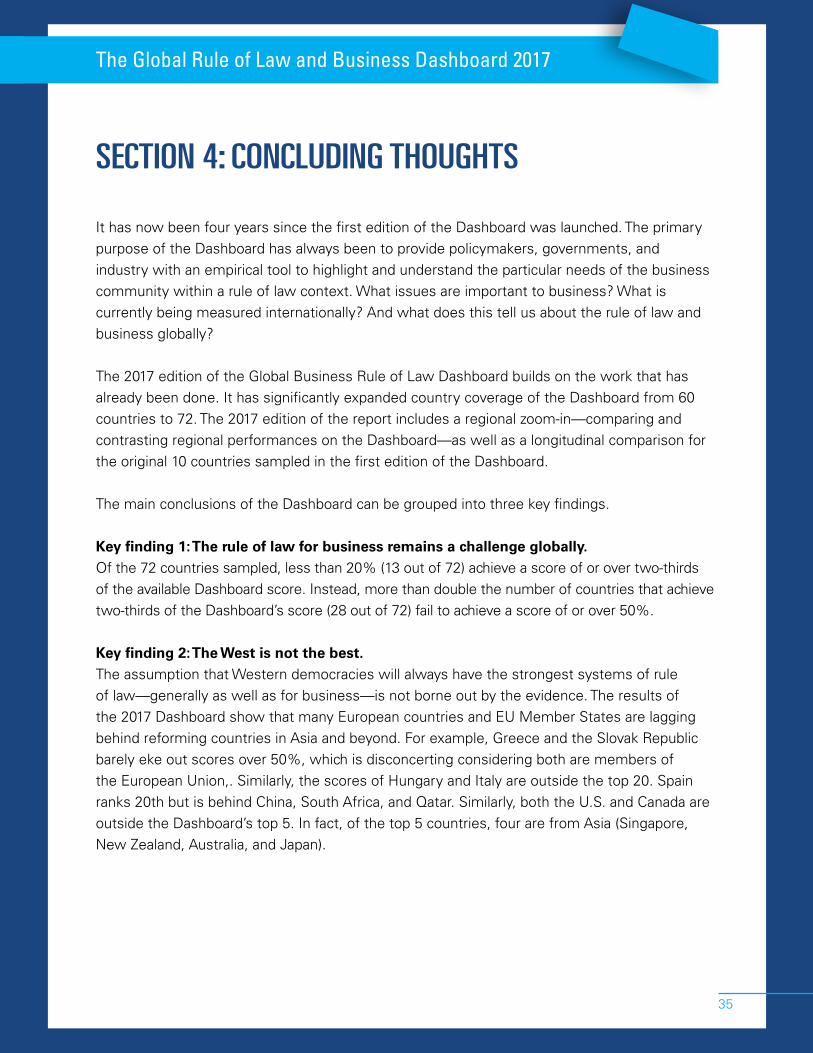
The main conclusions of the Dashboard can be grouped into three key findings. Key finding 1: The rule of law for business remains a challenge globally.Of the 72 countries sampled, less than 20% (13 out of 72) achieve a score of or over two-thirds of the available Dashboard score. Instead, more than double the number of countries that achieve two-thirds of the Dashboard’s score (28 out of 72) fail to achieve a score of or over 50%.
Key finding 2: The West is not the best.The assumption that Western democracies will always have the strongest systems of rule of law—generally as well as for business—is not borne out by the evidence. The results of the 2017 Dashboard show that many European countries and EU Member States are lagging behind reforming countries in Asia and beyond. For example, Greece and the Slovak Republic barely eke out scores over 50%, which is disconcerting considering both are members of the European Union,. Similarly, the scores of Hungary and Italy are outside the top 20. Spain ranks 20th but is behind China, South Africa, and Qatar. Similarly, both the U.S. and Canada are outside the Dashboard’s top 5. In fact, of the top 5 countries, four are from Asia (Singapore, New Zealand, Australia, and Japan).
36
UNLOCKING GROWTH AND PROSPERITY
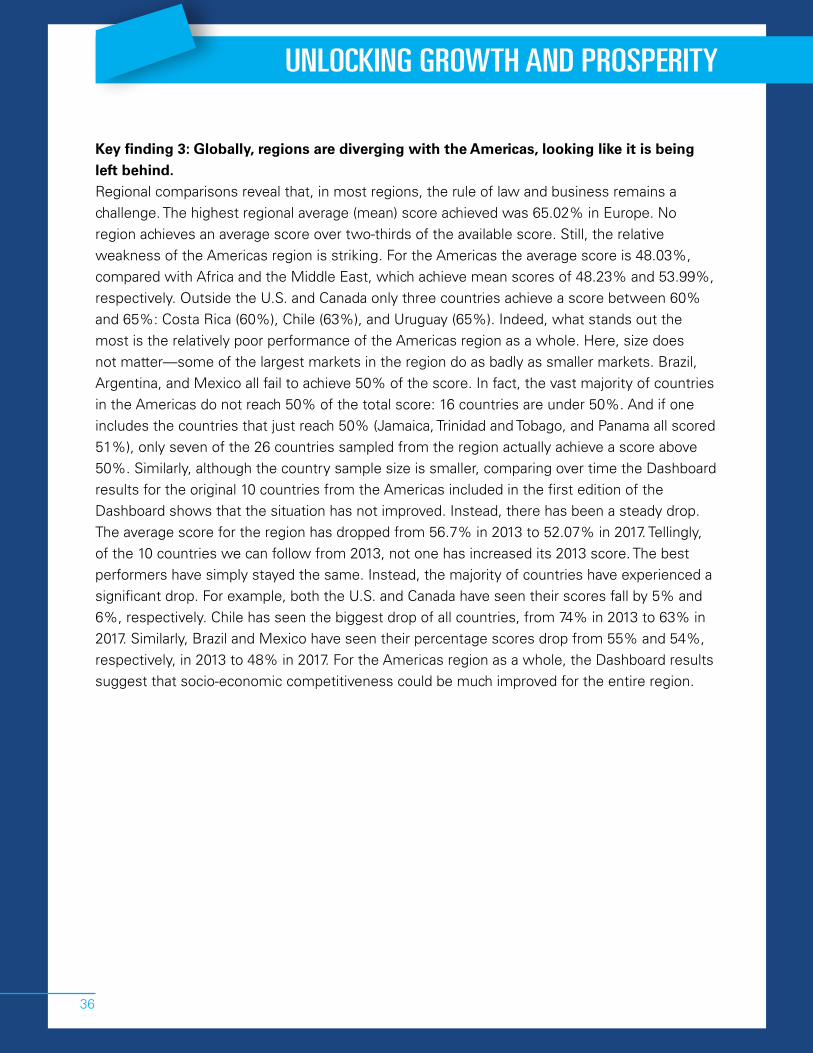
Key finding 3: Globally, regions are diverging with the Americas, looking like it is being left behind.Regional comparisons reveal that, in most regions, the rule of law and business remains a challenge. The highest regional average (mean) score achieved was 65.02% in Europe. No region achieves an average score over two-thirds of the available score. Still, the relative weakness of the Americas region is striking. For the Americas the average score is 48.03%, compared with Africa and the Middle East, which achieve mean scores of 48.23% and 53.99%, respectively. Outside the U.S. and Canada only three countries achieve a score between 60% and 65%: Costa Rica (60%), Chile (63%), and Uruguay (65%). Indeed, what stands out the most is the relatively poor performance of the Americas region as a whole. Here, size does not matter—some of the largest markets in the region do as badly as smaller markets. Brazil, Argentina, and Mexico all fail to achieve 50% of the score. In fact, the vast majority of countries in the Americas do not reach 50% of the total score: 16 countries are under 50%. And if one includes the countries that just reach 50% (Jamaica, Trinidad and Tobago, and Panama all scored 51%), only seven of the 26 countries sampled from the region actually achieve a score above 50%. Similarly, although the country sample size is smaller, comparing over time the Dashboard results for the original 10 countries from the Americas included in the first edition of the Dashboard shows that the situation has not improved. Instead, there has been a steady drop. The average score for the region has dropped from 56.7% in 2013 to 52.07% in 2017. Tellingly, of the 10 countries we can follow from 2013, not one has increased its 2013 score. The best performers have simply stayed the same. Instead, the majority of countries have experienced a significant drop. For example, both the U.S. and Canada have seen their scores fall by 5% and 6%, respectively. Chile has seen the biggest drop of all countries, from 74% in 2013 to 63% in 2017. Similarly, Brazil and Mexico have seen their percentage scores drop from 55% and 54%, respectively, in 2013 to 48% in 2017. For the Americas region as a whole, the Dashboard results suggest that socio-economic competitiveness could be much improved for the entire region.
The Global Rule of Law and Business Dashboard 2017
37
SECTION 5: ANNEX
This Annex explains the methodology of the Global Business Rule of Law Dashboard (“the Dashboard”). It also includes the supporting data and country-by-country results for the indicators extracted for each of the seven underlying measures on which the Dashboard is built.
5.1 Measuring the immeasurable? The rule of law and business
How can we measure the rule of law for business?
Given the growing acknowledgment by the international policy community and key stakeholders of the centrality of the rule of law to socio-economic development, the number of high-quality indices and surveys that try to measure some element of the rule of law is high. Yet it is important to be clear that none of these indices and measures were developed to focus exclusively on the rule of law and business. For example, Transparency International’s Global Corruption Barometer seeks to measure relative rates of perceived corruption around the world. In doing so, it contains survey data that provides a perspective on—the level of corruption experienced in a market, and thus an indicator of the rule of law and business. Similarly, the World Economic Forum’s Global Competitiveness Report seeks to measure economic competitiveness. Of the more than 100 indicators included in the rankings and underlying Global Competitiveness Index, a number relate to the rule of law and business. Indeed, although relatively few indices or surveys focus exclusively on the rule of law (the exception being the World Justice Project’s Rule of Law Index), a number of high-quality and accepted international measures include and incorporate a significant number of business-related rule of law indicators.
5.2 Underlying indices and surveys overview
The Global Competitiveness Report
The World Economic Forum’s Global Competitiveness Report and Global Competitiveness Index are perhaps the world’s most cited and anticipated data on economic development and competitiveness. The Index consists of 12 pillars that measure various aspects of economic competitiveness and development.7 These pillars range from the strength of institutions,
38
UNLOCKING GROWTH AND PROSPERITY
access to and quality of infrastructure, and access to health and primary education, to more advanced metrics such as level of business sophistication and innovation. In total, the 2016-17 report and index include 114 indicators covering 138 economies and are based on survey questions and socio-economic data. The Report utilizes a highly sophisticated weighting system whereby the weight of each pillar for the final country score is dependent on per capita income and thus the overall economic development and sophistication of a given economy. For example, for economies with higher income per capita, greater scoring weight and importance is added to pillars such as innovation.
With regard to the rule of law and indicators relating to the rule of law and business, the Report does not have a separate rule of law category or individual indicators categorized as pertaining to the rule of law. However, it does contain a high number of rule of law and business indicators compared with the other measures mapped. These indicators are included in Pillar 1, “Institutions,” and range from the protection of property rights to the efficiency of the legal framework in place, to the strength of investor protection.
In total, 21 indicators have been extracted from the Global Competitiveness Index and Report and used in the Dashboard.
The World Justice Project: Rule of Law Index 2016
The Rule of Law Index is the most widely used and cited quantitative measure of the rule of law currently in existence. The Index is based on expert and opinion surveys (a general population poll and expert survey), and the latest edition of the Index covers 113 countries.8 The Index consists of 47 rule of law indicators organized around nine conceptual dimensions/factors. These dimensions/factors range from limitations on governmental power to corruption, the availability of fundamental rights, and civil and criminal justice.9
With regard to the rule of law and business indicators, there are a large number of relevant indicators. The Rule of Law Index contains a high percentage of indicators directly relevant to business.
In total, 20 indicators have been mapped and subsequently extracted for the Dashboard as most directly relating to business.10
The Global Rule of Law and Business Dashboard 2017
39
Transparency International: Global Corruption Barometer
The Global Corruption Barometer is one of many projects Transparency International oversees that maps and seeks to measure levels and perceptions of corruption around the world. In addition to the Barometer, projects include the Bribe Payers Index, Corruption Perceptions Index, and Putting Corruption Out of Business Survey.
The Barometer “examines how corruption features in people’s lives around the world … [and] addresses people’s direct experiences with bribery and details their views on corruption in the main institutions in their countries.”11 It is not an index but a general population survey. For the latest (2013) global edition, 114,000 individuals were surveyed in 107 countries.12 The survey consists of 12 questions across the spectrum of perceptions of corruption, people’s direct experiences with corruption, efforts against corruption, and willingness and ability on an individual level to engage against corruption.13
Since 2013 Transparency International has changed its methodology/process for conducting the Global Corruption Barometer. Instead of carrying out one global, universal survey, it is currently carrying out five regional surveys over the course of three years (2014-17). Since 2014, it has published four of these surveys:
- Asia Pacific 2017- Europe and Central Asia 2016- Middle East and North Africa 2016- Africa Survey 2015
The final regional survey, for the Americas, is forthcoming.
With regard to rule of law and business indicators, there is only one relevant indicator or, in this case, survey question (Question 6 in the 2013 global Barometer): “Perceptions of corruption by institution: % that think corrupt or extremely corrupt.”14 For this question, respondents were asked about their perception of corruption in 12 different institutions ranging from political parties, the government, civil service, and the military to the judiciary and the private sector.15 Not all these institutions are directly relevant to the business community, and for the purposes of this report and the building of the Dashboard, perceptions of corruption were mapped and extracted for five institutions as defined by the Barometer:
1. Political parties 2. Parliament/legislature
40
UNLOCKING GROWTH AND PROSPERITY
3. Judiciary 4. Police 5. Public officials/civil servants
In addition to these five, the new post-2013 regional surveys include two additional institutions:
1. Local government councilors2. Tax officials, like ministry of finance officials or local government tax collectors
Heritage Foundation: Index of Economic Freedom 2017
The Index of Economic Freedom measures economic freedom across 12 different components of economic freedom, from property rights to entrepreneurship, grouped into four individual categories or pillars.
With regard to rule of law and business indicators, there are a large number of relevant indicators—a “Rule of Law” category constitutes 25% of the total index. This category contains three components of economic freedom: “Property Rights,” “Judicial Effectiveness,” and “Government Integrity.”
For the purposes of this report and the Dashboard, this entire rule of law category and all three underlying components of economic freedom have been mapped and extracted.16
Global Integrity: Global Integrity Index
The Global Integrity Index (GII) assesses “the existence, effectiveness, and citizen access to key national-level anti-corruption mechanisms used to hold governments accountable.”17 The Index is built on local research and includes a peer review mechanism by both GII central staff and local experts.18 The latest full edition from 2012 covers 31 countries, although more recent country-specific analyses have been released, including the 2013 mapping of Indonesia. The Index consists of over 300 indicators.
With regard to the rule of law and business, the Index contains a large number of relevant indicators. In total, 31 indicators were mapped and extracted from categories and subcategories relating to procurement, business regulations and licenses, anti-corruption legal framework, and judicial impartiality.
The Global Rule of Law and Business Dashboard 2017
41
World Bank: Worldwide Governance Indicators 2016
The purpose of the Worldwide Governance Indicators is described as a “research dataset summarizing the views on the quality of governance provided by a large number of enterprise, citizen, and expert survey respondents in industrial and developing countries.”19 The Indicators are not based on nor do they produce any original research. Instead, they are a composite measure that relies on 30 different underlying data sources on perceptions of governance from surveys, expert assessments, indices, and other measures. They consist of “six dimensions of governance,” one of which is the Rule of Law. This category is not disaggregated into subcategories or defined indicators. Because it is not structurally or methodologically possible to disaggregate and score individual indicators, the entire Rule of Law category used has been mapped and extracted for the Dashboard.
World Bank Group: Doing Business 2017
The World Bank’s Doing Business guides and rankings are perhaps the most practical and widely used measures of ease of doing business by stakeholders around the world. Doing Business examines 11 areas of business regulation primarily for small and medium enterprises.20
Doing Business consists of two distinct and separate measures/scores:
1. “Ease of Doing Business”—which compares and ranks countries relative to one another 2. “Distance to Frontier”—which measures a country’s performance against the best
performance observed across all economies in the sample21
With regard to the rule of law and business, all indicators examined in Doing Business relate to business regulations and could arguably be included in any mapping or extraction exercise. However, given the disaggregation and specificity of scoring methodology and definitions used, it is possible to map and extract four indicators most directly relevant to the rule of law and business:
1. Getting credit 2. Protecting minority investors 3. Enforcing contracts 4. Resolving insolvency
42
UNLOCKING GROWTH AND PROSPERITY
Summary
In sum, while all these seven measures are highly recognized and utilized by policymakers, social scientists, and policy analysts around the world, it is also important to note that, given the differences in methodology, they produce somewhat different results for the indicators extracted, which influences the overall ranking of individual countries within the Dashboard. Specifically, the results of the Global Integrity Index and Global Corruption Barometer are in some cases rather different from the other measures included in the Dashboard. This needs to be accounted for and recognized when taking in the full results of the Dashboard.
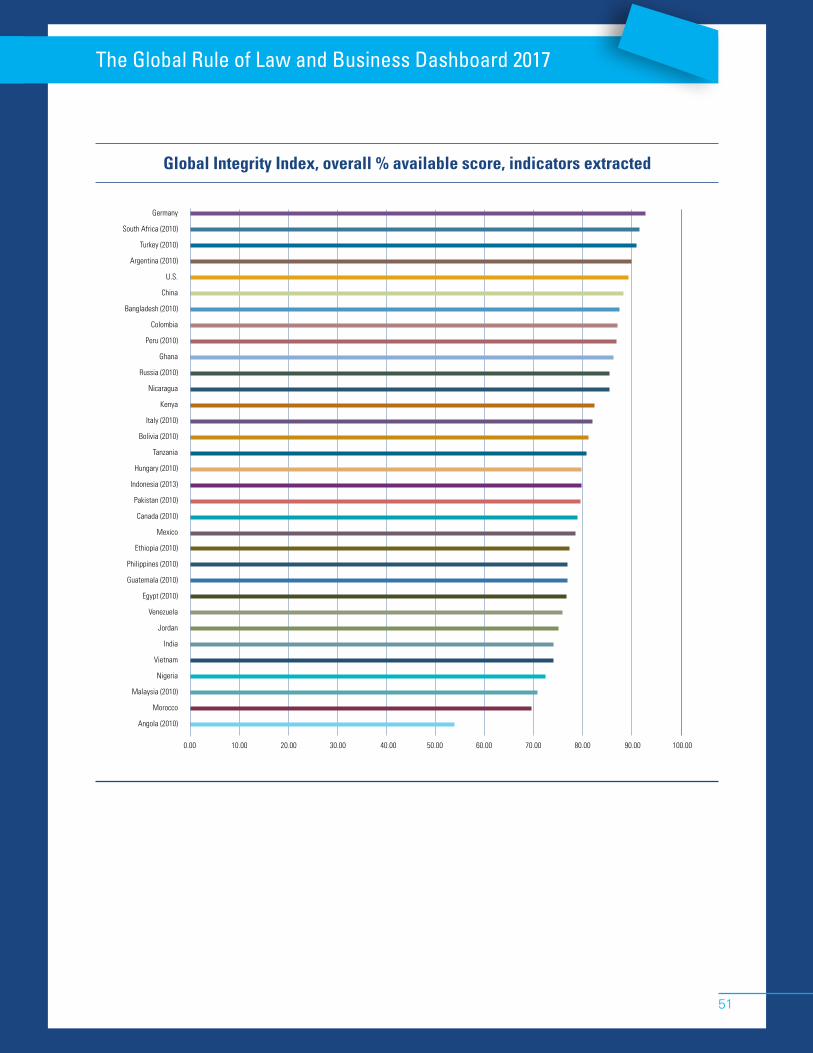
The results from the Global Integrity Index differ quite significantly from the other measures mapped and included in the Dashboard. For example, in Global Integrity Index’s Category 6: Anti-Corruption Legal Framework, Judicial Impartiality, and Law Enforcement Professionalism, countries such as Colombia, China, Ethiopia, Venezuela, and Vietnam receive a score of 96%—virtually the same as Canada, Germany, and the U.S. This can be compared to the scores achieved in the Index of Economic Freedom, where for the indicator “Government Integrity” (which measures rates of official corruption), for example, the same countries achieve scores of 39.63%, 41.63%, 37.64%, 11.59%, and 24.65%, respectively.22 Moreover, it is striking how small the differences are between the countries included in the Index: All but six countries achieve an overall percentage score higher than 70%. Many of these discrepancies can be explained by the Global Integrity Index’s methodology. Most of the questions extracted and relating to the rule of law and business relate to the existence of a law or regulation. Only a relatively small number of questions from the 31 extracted indicators relate to the application of these laws and practical enforcement. Indeed, in the category that includes the highest number of indicators relating to practical application—Category 5: Government Oversight and Controls (Business Regulations and Licenses)—country scores are more aligned with other indices and surveys as well as with the overall Dashboard results.
Similarly, the Global Corruption Barometer also produces some surprising results. For example, in the 2017 regional edition of the Global Corruption Barometer for the Asia Pacific region, the perceived rate of corruption for Chinese government institutions is 9%.23 This is better than Australia at 10%, half of Japan’s 18.7%, and less than a sixth of Korea’s perceived rate of corruption at 55%. Conversely, perceived rates of corruption for many countries one does not associate with particularly high levels of actual governmental corruption (including the U.S.) can be very high. For instance, American public institutions were in the 2013 survey viewed as being corrupt or extremely corrupt by 55.2% of survey respondents.24 This is only a few percentage points behind Nigeria, which has a perceived rate of corruption at 58.43%. To some extent this
The Global Rule of Law and Business Dashboard 2017
43
is not surprising, as the methodological basis for the Barometer is a general population survey and it specifically measures perceived rates of corruption. In that sense the utility and value of the survey as a policy tool lies in being both a proxy for actual rates of corruption and, as important, a reflection of what the general population actually thinks of its public institutions.
Nevertheless, it is worth noting these methodological differences between the seven indices and surveys when taking in the full results of the Dashboard.
5.3 Dashboard methodology The Dashboard is a meta-measure that amalgamates existing indicators from published, high-quality international indices and surveys. Some of the basic methodological characteristics of these underlying indices or surveys were explained in the previous sections. This subsection describes how the Dashboard is actually constructed. It is worth beginning by outlining how indices and surveys are different social scientific tools.
Indices
Indices are highly reliable statistical models that aim to benchmark performance against a predetermined standard, whether it be of an economic, political, legal, scientific, social, or other nature. Significantly, an index is predetermined—the creator of the index determines the best practice or standard, and then evaluates performance vis-à-vis this standard and assigns an overall score. As such, an index constitutes a “top-down” approach to benchmarking the performance of a set of variables, whether it is in a country or otherwise. Different indices are based on varying sets of criteria and methodologies. For example, the three most common types of indices used in academic and international benchmarking exercises are binary, ordinal, and numerical. Binary indices seek to measure or gauge the existence of particular criteria or indicators. Ordinal indices provide a scale or value such as “good,” “average,” or “bad.” Numerical indices, on the other hand, provide a number and imply a mathematical relationship between scores.
Surveys
A highly accepted model in statistics and the social sciences, surveys ask respondents about their specific views and experience of the subject matter or situation under analysis. Surveys seek to examine how a particular input or factor works (or does not work) according to the
44
UNLOCKING GROWTH AND PROSPERITY
person being surveyed. For example, a survey question might ask what is the experience of person x with regard to factor or criteria y. Together, the survey responses provide an overview of trends and perceptions of a set of variables. Surveys can be either general population surveys or targeted surveys, such as surveys of experts.
The two different models can be summarized thus: Indices try to have a consistent measurement of predefined criteria, while surveys try to gauge perceptions.
Each methodology has strengths and limitations that in turn affect the overall strengths and weaknesses of the Dashboard. After all, the Dashboard is simply a sum and reflection of the constituent parts extracted and amalgamated from existing rule of law measures. For example, index scores are only as robust or useful as the assumptions and criteria used to calculate them. Similarly, the manner in which answers to survey questions (expert or otherwise) accurately reflect a given reality ultimately depends on the survey responder as well as the design of the survey instrument and questions.
Building the Dashboard
To create the Dashboard, each of the seven measures used and listed above needs to be deconstructed and its methodology and underlying assumptions understood. This deconstruction includes understanding the statistical model used by the researchers in the original survey or index. Key questions include the following:
• What were the underlying assumptions and predefined subject matter in the surveys and indices?
• What was the overall purpose of the measure in terms of application? • How many countries was the measure applied to? • Was the index or survey designed to be applied to a certain type of country (e.g., low-
income countries) or with a specific policy goal in mind (e.g., the reduction of poverty)? • Did the researchers use an ordinal, numerical, or binary model, or perhaps some
combination, when building an index?
Having asked these basic questions, it is possible to move on to the more complex deconstruction phases; that is, determining the extent to which individual indicators or survey questions from these indices and surveys can be amalgamated and combined into a wider meta-analysis and measure. For example, is it possible, given a particular internal weighting system in an index or survey, to extract potential indicators without disrupting the integrity of the indicator? These methodological determinations must be made before engaging in the next
The Global Rule of Law and Business Dashboard 2017
45
step of the deconstruction process, which involves identifying potential rule of law and business indicators.
Once a measure has been deconstructed and its constituent parts analyzed, it is possible to identify the relevant rule of law indicators that relate to business. Once a suitable set of indicators have been identified, it is then possible to begin the extraction process. Here, it is imperative that any internal weighting system used by the parent index or survey is maintained so that all indicators are extracted in as statistically robust and acceptable fashion as possible.
Once the mapping and extraction process has been repeated for all mapped surveys and indices, one has the raw data and tools needed to begin combining the extracted indicators and building the actual Dashboard. However, prior to combination and incorporation into the Dashboard, all scores from existing indices and surveys must be standardized into a percentage. This ensures that all indicators are combined and treated on a “like-for-like” basis. The overall percentage obtained for each individual parent measure is then combined into an average score for each surveyed country, which provides the Dashboard score or percentage for a given country.
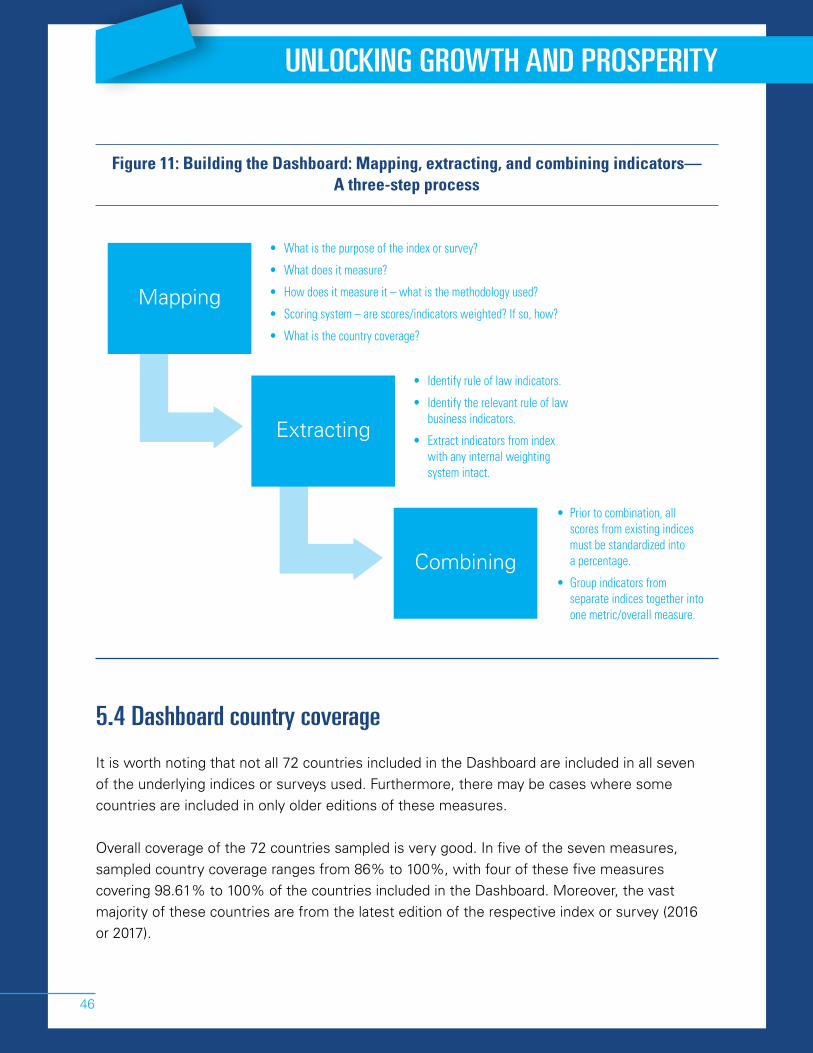
Figure 11 provides an overview of the above described process of mapping, extracting, and combining on which the Dashboard is based.
46
UNLOCKING GROWTH AND PROSPERITY
Figure 11: Building the Dashboard: Mapping, extracting, and combining indicators— A three-step process
• What is the purpose of the index or survey?
• What does it measure?
• How does it measure it – what is the methodology used?
• Scoring system – are scores/indicators weighted? If so, how?
• What is the country coverage?
• Identify rule of law indicators.
• Identify the relevant rule of law business indicators.
• Extract indicators from index with any internal weighting system intact.
• Prior to combination, all scores from existing indices must be standardized into a percentage.
• Group indicators from separate indices together into one metric/overall measure.
Mapping
Extracting
Combining
5.4 Dashboard country coverage
It is worth noting that not all 72 countries included in the Dashboard are included in all seven of the underlying indices or surveys used. Furthermore, there may be cases where some countries are included in only older editions of these measures.
Overall coverage of the 72 countries sampled is very good. In five of the seven measures, sampled country coverage ranges from 86% to 100%, with four of these five measures covering 98.61% to 100% of the countries included in the Dashboard. Moreover, the vast majority of these countries are from the latest edition of the respective index or survey (2016 or 2017).
The Global Rule of Law and Business Dashboard 2017
47
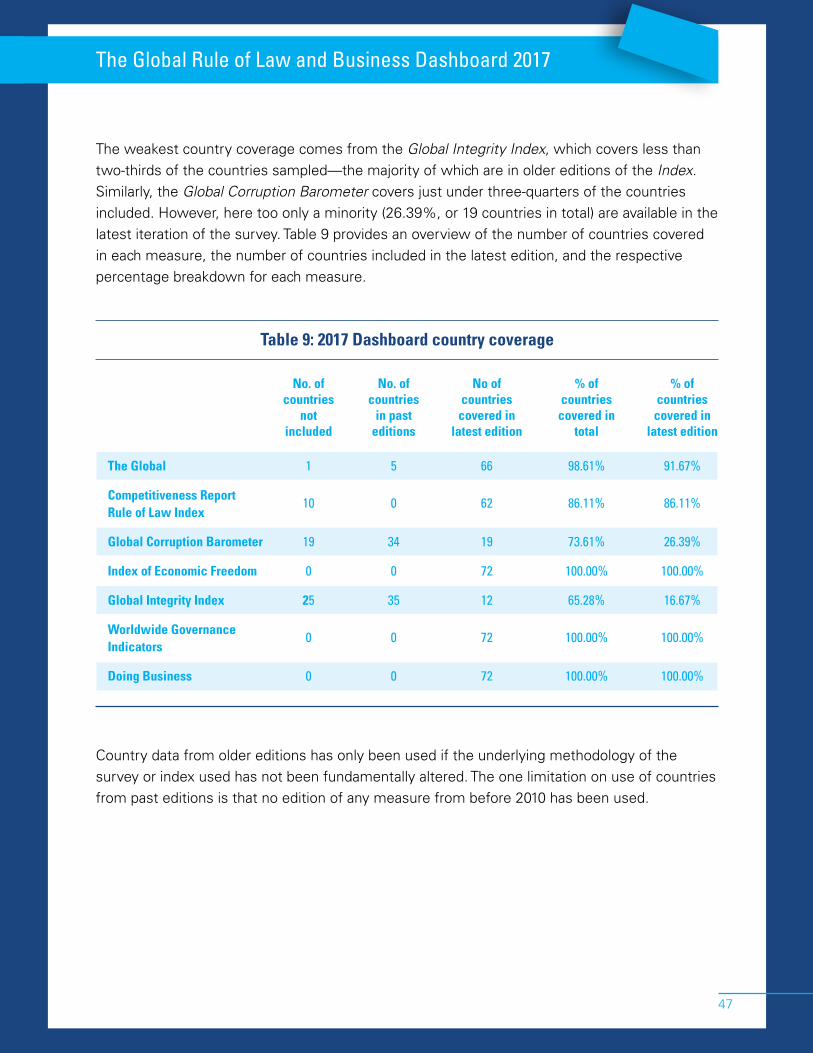
The weakest country coverage comes from the Global Integrity Index, which covers less than two-thirds of the countries sampled—the majority of which are in older editions of the Index. Similarly, the Global Corruption Barometer covers just under three-quarters of the countries included. However, here too only a minority (26.39%, or 19 countries in total) are available in the latest iteration of the survey. Table 9 provides an overview of the number of countries covered in each measure, the number of countries included in the latest edition, and the respective percentage breakdown for each measure.
Table 9: 2017 Dashboard country coverage
No. of No. of No of % of % of countries countries countries countries countries not in past covered in covered in covered in included editions latest edition total latest edition
The Global 1 5 66 98.61% 91.67%
Competitiveness Report Rule of Law Index
10 0 62 86.11% 86.11%
Global Corruption Barometer 19 34 19 73.61% 26.39%
Index of Economic Freedom 0 0 72 100.00% 100.00%
Global Integrity Index 25 35 12 65.28% 16.67%
Worldwide Governance 0 0 72 100.00% 100.00% Indicators
Doing Business 0 0 72 100.00% 100.00%
Country data from older editions has only been used if the underlying methodology of the survey or index used has not been fundamentally altered. The one limitation on use of countries from past editions is that no edition of any measure from before 2010 has been used.
48
UNLOCKING GROWTH AND PROSPERITY
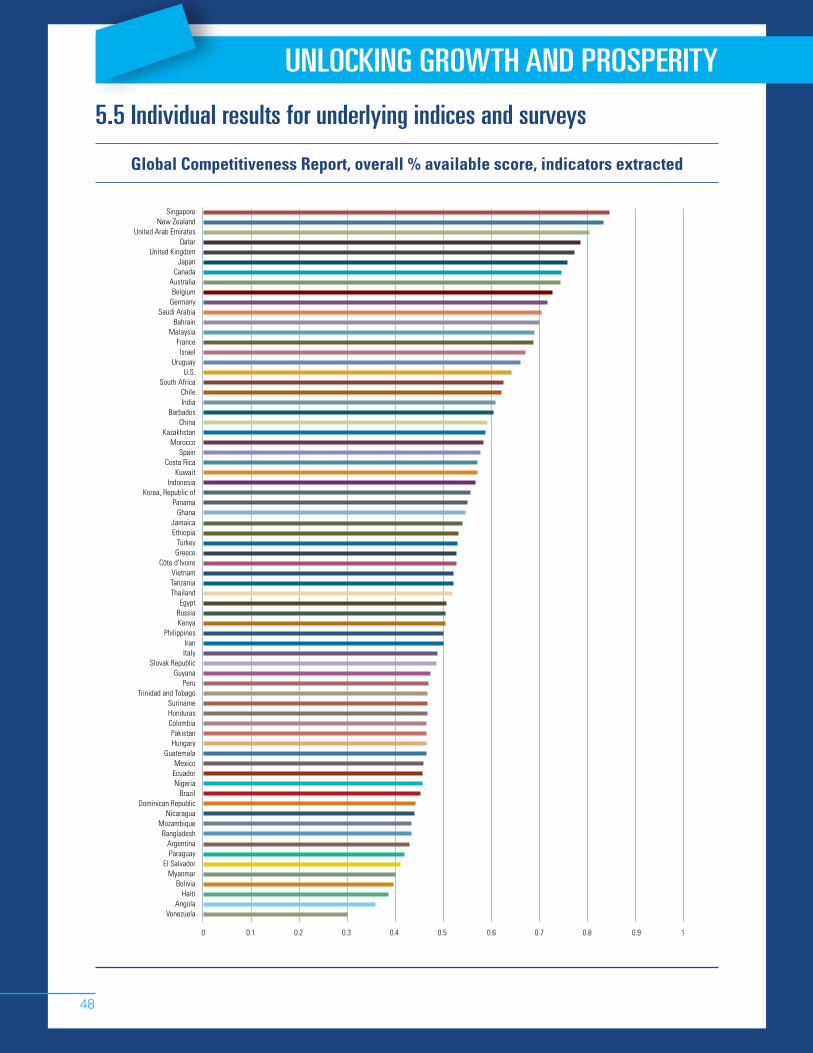
5.5 Individual results for underlying indices and surveys
SingaporeNew Zealand
United Arab EmiratesQatar
United KingdomJapan
CanadaAustraliaBelgium
GermanySaudi Arabia
BahrainMalaysia
FranceIsrael
UruguayU.S.
South AfricaChileIndia
BarbadosChina
KazakhstanMorocco
SpainCosta Rica
KuwaitIndonesia
Korea, Republic ofPanama
GhanaJamaicaEthiopia
TurkeyGreece
Côte d’IvoireVietnamTanzaniaThailand
EgyptRussiaKenya
PhilippinesIranItaly
Slovak RepublicGuyana
PeruTrinidad and Tobago
SurinameHondurasColombiaPakistanHungary
GuatemalaMexicoEcuadorNigeria
BrazilDominican Republic
NicaraguaMozambique
BangladeshArgentinaParaguay
El SalvadorMyanmar
BoliviaHaiti
AngolaVenezuela
0 0.1 0.2 0.3 0.4 0.5 0.6 0.7 0.8 0.9 1
Global Competitiveness Report, overall % available score, indicators extracted
The Global Rule of Law and Business Dashboard 2017
49
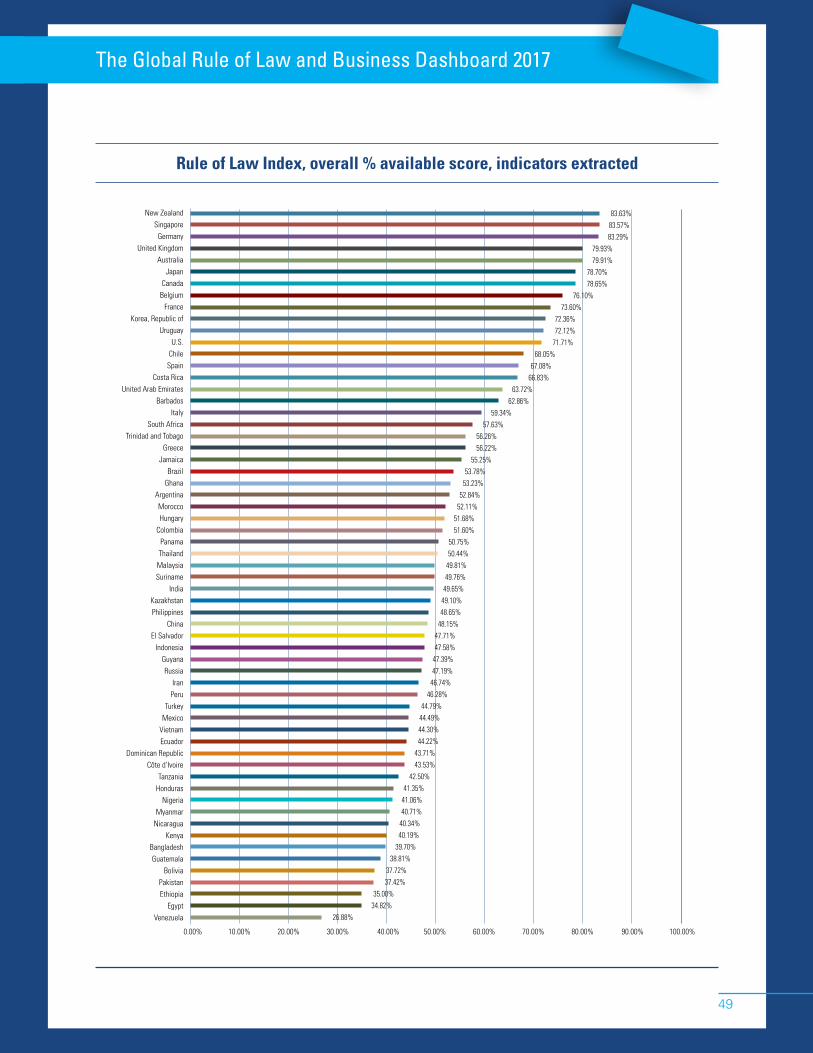
Rule of Law Index, overall % available score, indicators extracted
0.00% 10.00% 20.00% 30.00% 40.00% 50.00% 60.00% 70.00% 80.00% 90.00% 100.00%
New ZealandSingaporeGermany
United KingdomAustralia
JapanCanada
BelgiumFrance
Korea, Republic ofUruguay
U.S.Chile
SpainCosta Rica
United Arab EmiratesBarbados
ItalySouth Africa
Trinidad and TobagoGreece
JamaicaBrazil
GhanaArgentinaMoroccoHungary
ColombiaPanamaThailand
MalaysiaSuriname
IndiaKazakhstanPhilippines
ChinaEl Salvador
IndonesiaGuyanaRussia
IranPeru
TurkeyMexico
VietnamEcuador
Dominican RepublicCôte d’Ivoire
TanzaniaHonduras
NigeriaMyanmar
NicaraguaKenya
BangladeshGuatemala
BoliviaPakistanEthiopia
EgyptVenezuela
83.63%83.57%83.29%
79.93%79.91%
78.70%78.65%
76.10%73.60%
72.36%72.12%
71.71%68.05%
67.08%66.83%
63.72%62.86%
59.34%
52.84%
48.65%
44.30%
40.19%
57.63%
52.11%
48.15%
44.22%
39.70%
56.26%
51.68%
47.71%
43.71%
38.81%
56.22%
51.60%
47.58%
43.53%
37.72%
55.25%
49.76%
46.28%
50.75%
47.39%
42.50%
37.42%
53.78%
49.65%
44.79%
40.71%
50.44%
47.19%
41.35%
35.00%
53.23%
49.10%
44.49%
40.34%
49.81%
46.74%
41.06%
34.82%26.88%
50
UNLOCKING GROWTH AND PROSPERITY
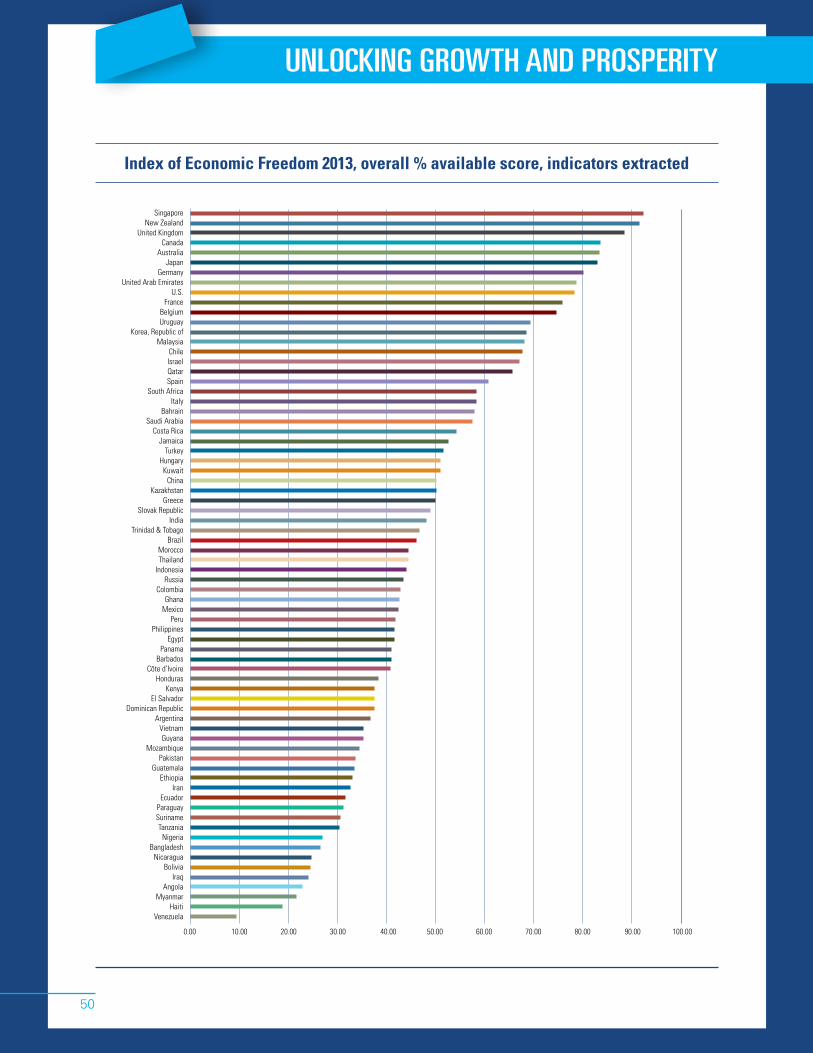
Index of Economic Freedom 2013, overall % available score, indicators extracted
0.00 10.00 20.00 30.00 40.00 50.00 60.00 70.00 80.00 90.00 100.00
Singapore New Zealand
United KingdomCanada
AustraliaJapan
GermanyUnited Arab Emirates
U.S.France
BelgiumUruguay
Korea, Republic ofMalaysia
ChileIsraelQatarSpain
South AfricaItaly
BahrainSaudi Arabia
Costa RicaJamaica
TurkeyHungary
KuwaitChina
KazakhstanGreece
Slovak RepublicIndia
Trinidad & TobagoBrazil
MoroccoThailand
IndonesiaRussia
ColombiaGhana
MexicoPeru
PhilippinesEgypt
PanamaBarbados
Côte d’IvoireHonduras
KenyaEl Salvador
Dominican RepublicArgentina
VietnamGuyana
MozambiquePakistan
GuatemalaEthiopia
IranEcuador
ParaguaySurinameTanzania
NigeriaBangladesh
NicaraguaBolivia
IraqAngola
MyanmarHaiti
Venezuela
The Global Rule of Law and Business Dashboard 2017
51
Global Integrity Index, overall % available score, indicators extracted
0.00 10.00 20.00 30.00 40.00 50.00 60.00 70.00 80.00 90.00 100.00
Germany
South Africa (2010)
Turkey (2010)
Argentina (2010)
U.S.
China
Bangladesh (2010)
Colombia
Peru (2010)
Ghana
Russia (2010)
Nicaragua
Kenya
Italy (2010)
Bolivia (2010)
Tanzania
Hungary (2010)
Indonesia (2013)
Pakistan (2010)
Canada (2010)
Mexico
Ethiopia (2010)
Philippines (2010)
Guatemala (2010)
Egypt (2010)
Venezuela
Jordan
India
Vietnam
Nigeria
Malaysia (2010)
Morocco
Angola (2010)
52
UNLOCKING GROWTH AND PROSPERITY
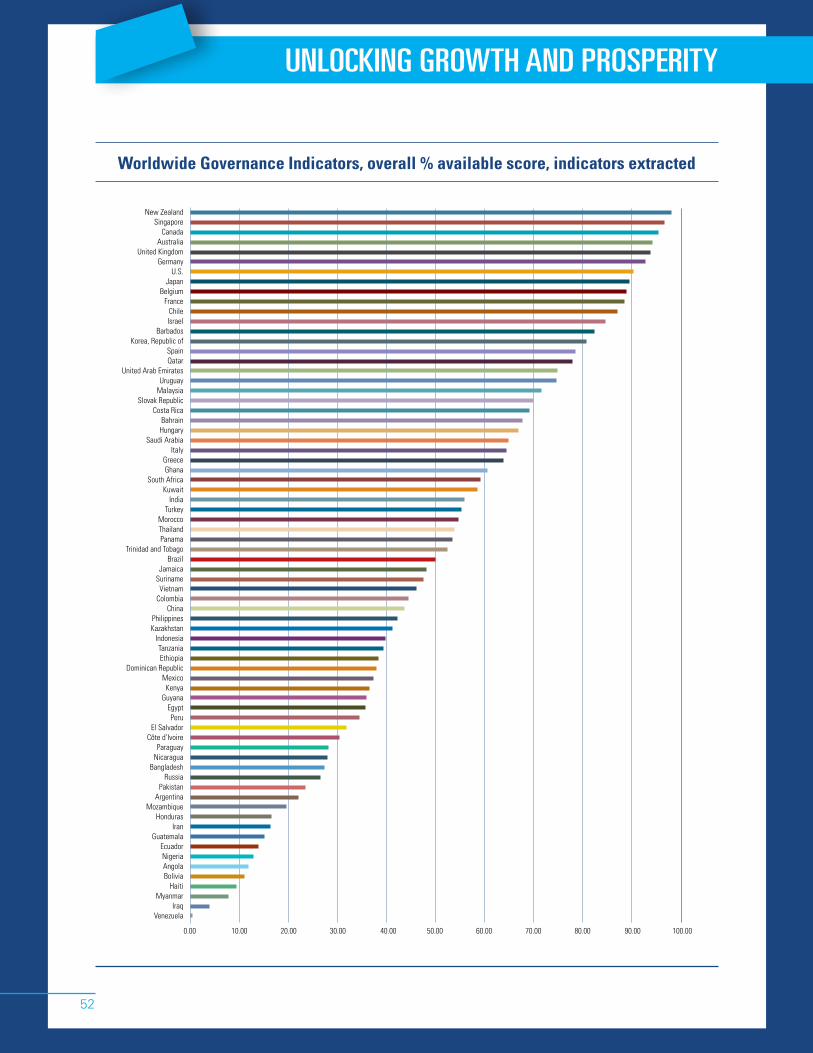
Worldwide Governance Indicators, overall % available score, indicators extracted
0.00 10.00 20.00 30.00 40.00 50.00 60.00 70.00 80.00 90.00 100.00
New ZealandSingapore
CanadaAustralia
United KingdomGermany
U.S.Japan
BelgiumFrance
ChileIsrael
BarbadosKorea, Republic of
SpainQatar
United Arab EmiratesUruguay
MalaysiaSlovak Republic
Costa RicaBahrain
HungarySaudi Arabia
ItalyGreeceGhana
South AfricaKuwait
IndiaTurkey
MoroccoThailandPanama
Trinidad and TobagoBrazil
JamaicaSuriname
VietnamColombia
ChinaPhilippinesKazakhstan
IndonesiaTanzaniaEthiopia
Dominican RepublicMexico
KenyaGuyana
EgyptPeru
El SalvadorCôte d’Ivoire
ParaguayNicaragua
BangladeshRussia
PakistanArgentina
MozambiqueHonduras
IranGuatemala
EcuadorNigeriaAngolaBolivia
HaitiMyanmar
IraqVenezuela

The Global Rule of Law and Business Dashboard 2017
53
Doing Business , overall % available score, indicators extracted
0.00 10.00 20.00 30.00 40.00 50.00 60.00 70.00 80.00 90.00 100.00
New ZealandU.S.
SingaporeKorea, Republic of
AustraliaUnited Kingdom
CanadaGermany
MexicoMalaysia
KazakhstanColombia
SpainIsraelJapanFrance
JamaicaThailandHungary
RussiaBelgium
Slovak RepublicPeru
South AfricaItaly China
ChinaChile
United Arab EmiratesBrazil
KenyaTurkey
GreeceVietnam
ArgentinaPanama
Costa RicaUruguay
Trinidad and TobagoNigeria
TanzaniaIndia
HondurasPakistan
El SalvadorIndonesia
GhanaKuwait
MoroccoBahrain
ParaguayGuyana
PhilippinesNicaragua
EgyptBarbados
GuatemalaCôte d’Ivoire
EcuadorDominican Republic
BoliviaIran
Saudi ArabiaQatar
MozambiqueEthiopia
VenezuelaBangladesh
SurinameIraq
AngolaMyanmar
Haiti
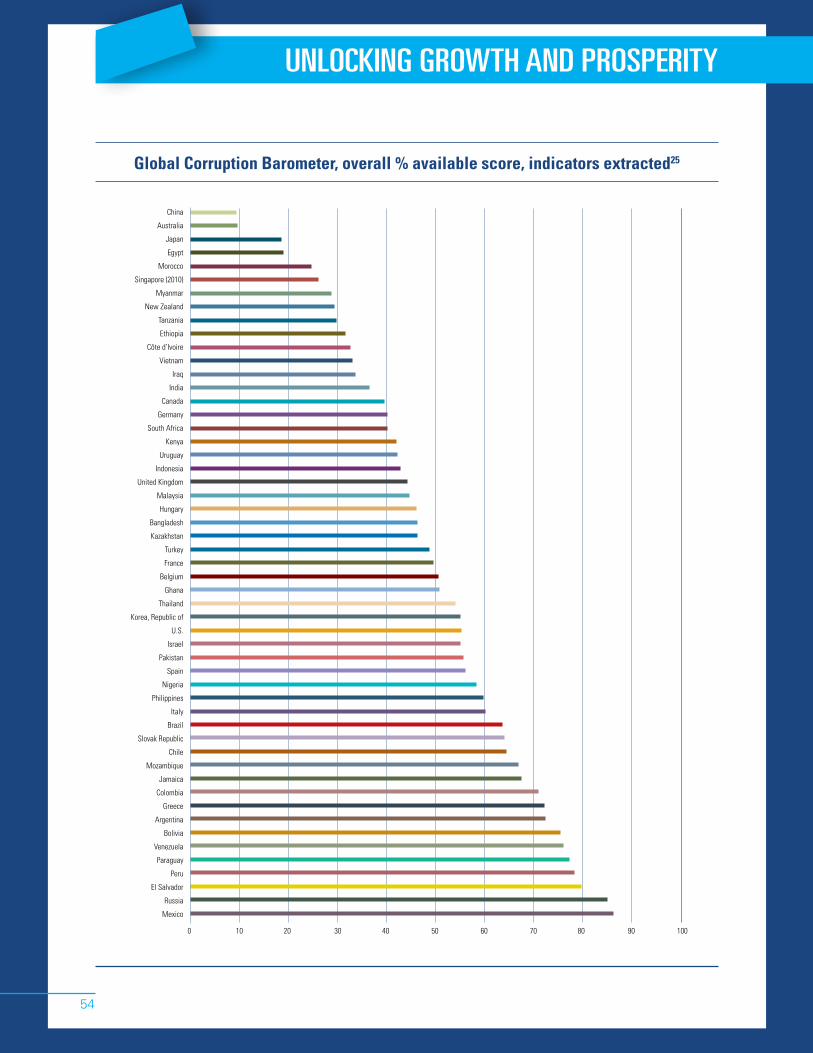
54
UNLOCKING GROWTH AND PROSPERITY
Global Corruption Barometer, overall % available score, indicators extracted25
0 10 20 30 40 50 60 70 80 90 100
China
Australia
Japan
Egypt
Morocco
Singapore (2010)
Myanmar
New Zealand
Tanzania
Ethiopia
Côte d’Ivoire
Vietnam
Iraq
India
Canada
Germany
South Africa
Kenya
Uruguay
Indonesia
United Kingdom
Malaysia
Hungary
Bangladesh
Kazakhstan
Turkey
France
Belgium
Ghana
Thailand
Korea, Republic of
U.S.
Israel
Pakistan
Spain
Nigeria
Philippines
Italy
Brazil
Slovak Republic
Chile
Mozambique
Jamaica
Colombia
Greece
Argentina
Bolivia
Venezuela
Paraguay
Peru
El Salvador
Russia
Mexico
The Global Rule of Law and Business Dashboard 2017
55
NOTES
1 Ban-Ki Moon (2012), Secretary-General’s Remarks to High-Level Meeting of the General Assembly on the Rule of Law, September 24, 2012.
2 EU Commission website, Justice, Effective Justice, Rule of Law weblink: http://ec.europa.eu/justice/effective-justice/rule-of-law/index_en.htm (Accessed July 2017).
3 Thomas J. Donohue (2017), The 2017 State of American Business Address, January 11, 2017, weblink: https://www.uschamber.com/speech/2017-state-american-business-address (Accessed September 2017).
4 Transparency International (2017), Global Corruption Barometer Asia Pacific, Perceptions of corruption, by institution, Question 2, raw data.
5 For the purposes of the Dashboard regional analysis, Israel has been included as part of Europe and not the Middle East. Israel is a member of the OECD and has close legal, economic and commercial ties to Europe.
6 World Bank, data bank, gross domestic producr (GDP) per capita, purchasing power parity (PPP) (current international dollars).
7 K. Schwab et al. (2016), The Global Competitiveness Report 2016–2017: Full Data Edition, World Economic Forum, Geneva.
8 World Justice Project (2016), The World Justice Project: Rule of Law Index 2016, Washington, D.C., p. 4.
9 Ibid. pp. 10-11.
10 Given the nature of the Rule of Law Index, it is arguable that all indicators included in the index are in some manner relevant to the business community. However, for the purposes of this report, focus has been placed on those indicators that are most directly relevant to the world of business.
11 Transparency International (2013), Global Corruption Barometer 2013, Berlin, p. 3.
12 Ibid.
13 Global Corruption Barometer, complete data set 2013 (Accessed June 2017), http://www.transparency.org/gcb2013/in_detail.
14 Ibid.
15 Ibid.
16 In addition to these two components of economic freedom, other components cover areas that are related to the rule of law and business. These components include “Investment Freedom” and “Trade Freedom.” However, these components have not been included in the Dashboard because, although there are measures and data included in each component relevant to a rule of law and business analysis, these are not disaggregated but instead are amalgamated into the wider component. It is thus not possible to extract only those data or part of a component that are most relevant to a rule of law and business analysis. See Heritage Foundation (2017), Index of Economic Freedom, Methodology, pp. 455-68.
17 Global Integrity (2012), Global Integrity Report 2011: Executive Summary, Washington, D.C., p. 3.
18 For a full discussion of the research methodology used, see “The Global Integrity Report: 2011 Methodology White Paper” (Accessed April 2013), http://www.globalintegrity.org/wp-content/uploads/2013/08/2011_GIR_Meth_Whitepaper.pdf.
19 World Bank, Worldwide Governance Indicators, Introduction, (Accessed July 2017), http://info.worldbank.org/governance/wgi/#doc.
20 World Bank Group (2017), Doing Business 2017, Washington, D.C., pp. 13-15.
21 Ibid.
22 Heritage Foundation (2017), Index of Economic Freedom, Government Integrity, raw data.
23 Transparency International (2017), Global Corruption Barometer Asia Pacific, Perceptions of corruption, by institution, Question 2, raw data. Angola, Argentina, Australia, Bahrain, Bangladesh, Barbados, Belgium, Bolivia, Brazil, Canada, Chile, China, Colombia, Costa Rica, Côte d’Ivoire, Dominican Republic, Ecuador, Egypt, El Salvador, Ethiopia, France, Germany, Ghana, Greece, Guatemala, Guyana, Haiti, Honduras, Hungary, India, Indonesia, Iran, Iraq, Israel, Italy, Jamaica, Japan, Kazakhstan, Kenya, Korea, Republic of, Kuwait, Malaysia, Mexico, Morocco, Mozambique, Myanmar, New Zealand, Nicaragua, Nigeria, Pakistan, Panama, Paraguay, Peru, Philippines, Qatar, Russia, Saudi Arabia, Singapore, Slovak Republic, South Africa, Spain, Suriname, Tanzania, Thailand, Trinidad and Tobago, Turkey, United Arab Emirates, United Kingdom, United States, Uruguay, Venezuela, Vietnam.
24 Transparency International (2013), Global Corruption Barometer 2013, Perceptions of corruption, by institution, Question 2, raw data.
25 All countries from 2013 Barometer except 2017 (Australia, Korea, Japan, Indonesia, Thailand, Vietnam, China, India, Pakistan, Myanmar, Malaysia); 2016 (Egypt, Morocco); 2015 (Côte d’Ivoire, Ghana, Kenya, Nigeria, South Africa, Tanzania); 2010 (Singapore).
56
UNLOCKING GROWTH AND PROSPERITY

1615 H Street, NWWashington, DC 20062-2000
www.uschamber.com