Unleashing High Impact Sales Enablement · A value proposition that underscores how the bank is...
25
Unleashing High Impact Sales Enablement Presented by: Joanne Pollitt Principal Executive Advisor: CEB, now Gartner
Transcript of Unleashing High Impact Sales Enablement · A value proposition that underscores how the bank is...
Unleashing High Impact Sales Enablement
Presented by: Joanne Pollitt
Principal Executive Advisor: CEB, now Gartner

Unleashing High Impact Sales Enablement
The Unexpected Support That Best Drives Revenue

SURVEY DEMOGRAPHICS
Responses by Region, Percentage of Respondents
10%
22%
59%
9%
APAC
EMEA
North America
Latin America
15%
35%27%
7%
16%Analyst/Entry Level
Mid-Manager Level
Executive SeniorLevel
Executive Head ofBusiness Function
Head of Line ofBusiness
Responses by Seniority Level, Percentage of Respondents
N = 88.Source: CEB 2018 Commercial Banking Agenda Poll.

2018 COMMERCIAL BANK EXECUTIVE PRIORITIES
1. Delivering on
customer
expectations around products
2. Reducing points
of friction in
buying and service
3. Getting more
operating
efficiency from sales coverage
of commercial banking
executives expect to be
most concerned with growth through new
customers.
28%will focus on
operational efficiency
Three Business
Objectives
Top Concerns
50% 35%
33%
24%
8%
Technology and Products
(35%) will change the most.
Customer Experience
(33%)and Sales Model
(24%)are also expected to
change.
Talent Management (8%) will change the least.
Anticipated
Changes

TOP ECONOMIC CONCERNS
N = 88.Source: CEB 2018 Commercial Banking Agenda Poll.
50%
20%
28%
1%
Growth through NewCustomers
Growth throughExisting Customers
Lower Expensesthrough ImprovedOperational Efficiency
Lower Expensesthrough Cost Cutting
Top Economic Concerns for 2018, Percentage of RespondentsQ: What do you expect your business line’s top economic concern to be for 2018?

CRITICAL OBJECTIVES, BY BUSINESS LINE
N = 88.Source: CEB 2018 Commercial Banking Agenda Poll.
Critical Area Small Business Business Banking Middle Market
Mapping changing customer channel usage and expectations
72% 73% 72%
47% 48% 51%
Pinpointing how the bank can influence customer purchasing
in sales interactions
72% 68% 67%
51% 53% 56%
Utilizing tech partnerships and APIS to transform customer
experience
81% 75% 70%
60% 58% 44%
Scaling Bank supports for RMcustomer quality interactions
79% 78% 72%
49% 52% 56%
Removing RMs’ administrative and compliance burdens
72% 77% 67%
33% 40% 37%
Importance Confidence in Execution

CAN’T JUST HIRE MORE
38%
55% 54%52%
0%
10%
20%
30%
40%
50%
60%
0-2 Years 3-5 Years 6-10 Years More than10 Years
Percentage of RMs Whose Loan Generation is Greater Than the Bank MedianBy Tenure in Seat, North America
Average RM TenureMedian Number of Years in Current Role at Current Bank
2010 20140
3
65 Years
3 Years
N = 1,129.Source: CEB 2014 Sales Force Assessment.
N = 2,884 RMs (2010); 2,702 RMs (2014).Source: CEB 2010 and 2014 Sales Force Assessment.

CAN’T JUST WORK MORE
How Has Time Spent on Non-Client-Facing Work Changed in the Past Two Years?Percent of RMs Responding
Magnitude of Increase in RM Time Spent on Non-Client Facing Work Percent of RMs Responding, Among Those Who Reported an Increase
0%
50%
100%
0%
50%
100%
18%
69%
13%
Less than 20%
20%–50% Increase
Above 50% Increase
22.2% No Change
18.4% Decreased
52.9% Increased
N = 890, 507Source: CEB 2017 RM Sales Environment Readiness Assessment.
“We’ve been doing really well, but we’re like the duck on the water: it looks calm on the surface, but under the
water the feet are moving like crazy.”
Head of Sales Force,
North American Commercial Bank

ALL IN FOR TECHNOLOGY ENABLEMENT
Banks Making Investments in Sales Enablement Technology Now, by Type of TechnologyCommercial Banking Only, Global
0% 50% 100%
56% 35% 9%
54% 42% 4%
53% 42% 5%
52% 37% 11%
52% 42% 6%
51% 40% 9%
51% 38% 11%
50% 42% 8%Sales Content Management
Predictive Lead Analytics
Sales Intelligence
Sales Prospecting
Coaching Tools
Performance Management
Pricing, Configuration, and
Quoting Tools
Pipeline Management, and Forecasting
Making Major Investments/ Replacements Now
Have It, No Planned Change
Not Investing/ Unsure
“We view technology as an enabler, but it isn’t solving the root cause problem – which is a broken sales
process.”Group Vice President, North American Commercial Bank
N = 259.Source: CEB 2017 Financial Services Technology SurveyNote: Total does not equal 100% due to rounding.

CURRENT TOOLS DON’T HELP WITH OUTCOMES
63%
77% 77%
67%
46%
62%58%
66%
CRM Pricing Tools PipelineManagement
Sales Prospecting
Understand Customers Manage the Sales Process
Extent that Tools Fail to Help RMs Better Understand Customers or Manage the Sales Process More EffectivelyPercentage of RMs Neutral or Not Agreeing that the Tool Helps Them
N = 1,269.Source: CEB 2016 Sales Environment Readiness Assessment Survey

UNDERSTANDING SALES ENABLEMENT
50+ questions on team composition,
performance, tools and technology,
enablement supports, sales process,
culture.
24 Institutions
335 Sales Managers
1,651 Relationship Managers
1. Sales Environment Readiness Assessment
2. Qualitative Interviews
45-minute interviews with executives at 26 institutions across all business lines to understand their sales enablement strategies and challenges
Source: CEB Analysis

NEW MANDATE: ENABLE YOUR SALES FORCE
Executives’ Three Approaches to Sales Enablement
Talent Supports Process SupportsCustomer Interaction
Supports
Goal: Hire and Manage Talent
■ Hiring
■ Training
■ Coaching/
■ Incentives
■ Customer-Facing Time
■ Usable CRM
■ Customer Segmentation
■ Market Coverage
■ Leads Identification
■ Sales Process
■ Internal Collaboration
■ Specialists
■ Ethical Sales Culture
■ Commercial Insights
■ Customer
Needs
Understanding
■ Value Proposition
■ Relevant Messaging
■ Differentiated Products
■ Customer Accountability
■ Sales Discretion
Goal: Make Bankers More Efficient
Goal: Fulfill Customer Needs
Source: CEB Analysis

PROCESS AND TALENT ARE THE BIG BETS
Sales Enablement Strategy Prioritization, by Enablement ApproachPercentage of Initiatives, Among Total Initiatives in Sample
Customer Interaction Supports: 18%
Talent Supports: 39%
“We want leaders to focus more on coaching.”
“We are constantly training our people.”
“We’re trying to get new bankers ramped up faster.”
Process Supports: 43%“We’re trying to remove bureaucracy from RMs’ days and save them time.”“Our top priorities are getting a new CRM and improving lead generation capabilities.”
N= 26 InstitutionsSource: CEB Analysis; 2017 Research Interviews with Commercial Banking Executives

WHAT MATTERS MOST
Relative Impact of Improving Sales Enablement Approaches on RM Revenue Goal Achieved Percentage Point Change in RM Revenue Goal Achieved When RMs’ Perception of Bank Effectiveness Increases
N= 962Source: CEB 2017 Sales Environment Readiness Assessment
22.6%
11.0%
Improving Customer Interaction Supports
Improving Customer InteractionSupports
and Process Supports
The results of all other scenarios tested were not statistically significant.

CUSTOMERS WANT OUTCOMES
Traditional Overlap Between What Customers Valued and What Banks Offered
Source: CEB Analysis
Aligned Around Access
Current Disconnect Between What Customers Expect and What Banks Still Offer
Customers Valued: Access
■ Access to local knowledge■ Access to staff who could provide
reliable service support and match
needs to products
■ Access to financing
Banks Offered: Access
■ Access to local staff■ Access to RMs who could offer
reliable service, diagnose needs,
and provide solutions
■ Access to the balance sheet
Disconnect: Outcomes Versus Access
Banks Still Offer:
Access
■ Access to local staff■ Access to RMs who can
offer reliable service,
diagnose needs, and
provide solutions
■ Access to the balance
sheet
Customers Value:
Outcomes
■ Relevant and timely
information to drive
business outcomes
■ On-demand availability to
ensure timely business
outcomes
■ Access to financing on
their terms to deliver
business outcomes

INTERACTION SUPPORTS HELP DRIVE OUTCOMES
How Customer Interaction Supports Help RMs Drive Clients’ Business Outcomes
Source: CEB Analysis
+ +1. Guidance to
Understand Customer
Needs
Key Components of
Support to RMs:
■ A clear understanding of
customers’ basic needs.
■ A value proposition that
underscores how the bank is
uniquely positioned to help
customers achieve business
outcomes.
2. Unique Insight and
Products to Deliver
to Clients
Key Components of
Support to RMs:
■ Commercial insights that
help achieve customers’
business outcomes.
■ Useful messaging or
collateral that can be used
with customers.
■ Differentiated products and
services that help customers
achieve their business
outcomes in ways other
banks cannot.
3. Discretion—and
Accountability—to Tailor the
Interaction to the Client
Key Components of
Support to RMs:
■ Significant discretion on how
to sell.
■ Accountability for ensuring
customers receive the most
appropriate products and
services to meet their needs.
What RMs Need to Help Customers Achieve Outcomes

A NEW GOAL
Executives’ Three Approaches to Sales Enablement
Talent Supports Process SupportsCustomer Interaction
Supports
Goal: Hire and Manage Talent
■ Hiring
■ Training
■ Coaching/
■ Incentives
■ Customer-Facing Time
■ Usable CRM
■ Customer Segmentation
■ Market Coverage
■ Leads Identification
■ Sales Process
■ Internal Collaboration
■ Specialists
■ Ethical Sales Culture
■ Commercial Insights
■ Customer
Needs
Understanding
■ Value Proposition
■ Relevant Messaging
■ Differentiated Products
■ Customer Accountability
■ Sales Discretion
Goal: Make Bankers More Efficient
Goal: Fulfill Customer Needs
Source: CEB Analysis
New Goal: Help Customers Achieve Business Outcomes

PROCESS TO WHAT END: ENABLING OUTCOMES
Selected Process Support and End Goal
Source: CEB Analysis
SupportEnd Goal: Enable
Banker Efficiency
Customer Segmentation
and Market Coverage
Align Bank Resources to Service
Preference
Leads IdentificationIdentify Large Pool of
Prospective Customers
CRM PlatformAccurately Match Product to
Customer Need
End Goal: Enable
Customer Outcomes
Align Bank Resources
to Customer Outcomes
Identify Precise Customer
Segments Whose Outcomes the
Bank Can Deliver On
Accurately Identify Insight That
Drives Customer Outcomes
Specialists and Internal
Collaboration
Deliver Technical and Closing
Support to Drive Purchase of
Diverse Suite of Products
Deliver Specialized Insight and
Solutions Aligned with Client Goals
Ethical Sales CultureEnsure Compliance and Avoid
Mis-Selling
Ensure Accountability for Driving
Customer Outcomes

Appendix: Align Process Supports With Customer Outcomes
A Case Profile of BDC

ADJUST SERVICE MODEL TO MEET CUSTOMER NEEDS
Challenge: Enable RMs to Serve Customers Efficiently
Goal: Grow the bank by 10%
Understand Customers Better
Efficiently Serve Customers Meet
Customer Preferences Streamline
RM Portfolios Provide RMs Insight
Tools
Hire More Bankers Make
Bankers Do More Create
New Branches
Set Aggressive Cross-Sell Goals Expand
Into New Markets
Source: CEB analysis.
Solution: Bifurcate High and Low Touch Customers
—
Prefer more bank
interactions
Source: CEB analysis.
—
Prefer to interact
infrequently
via e-mail
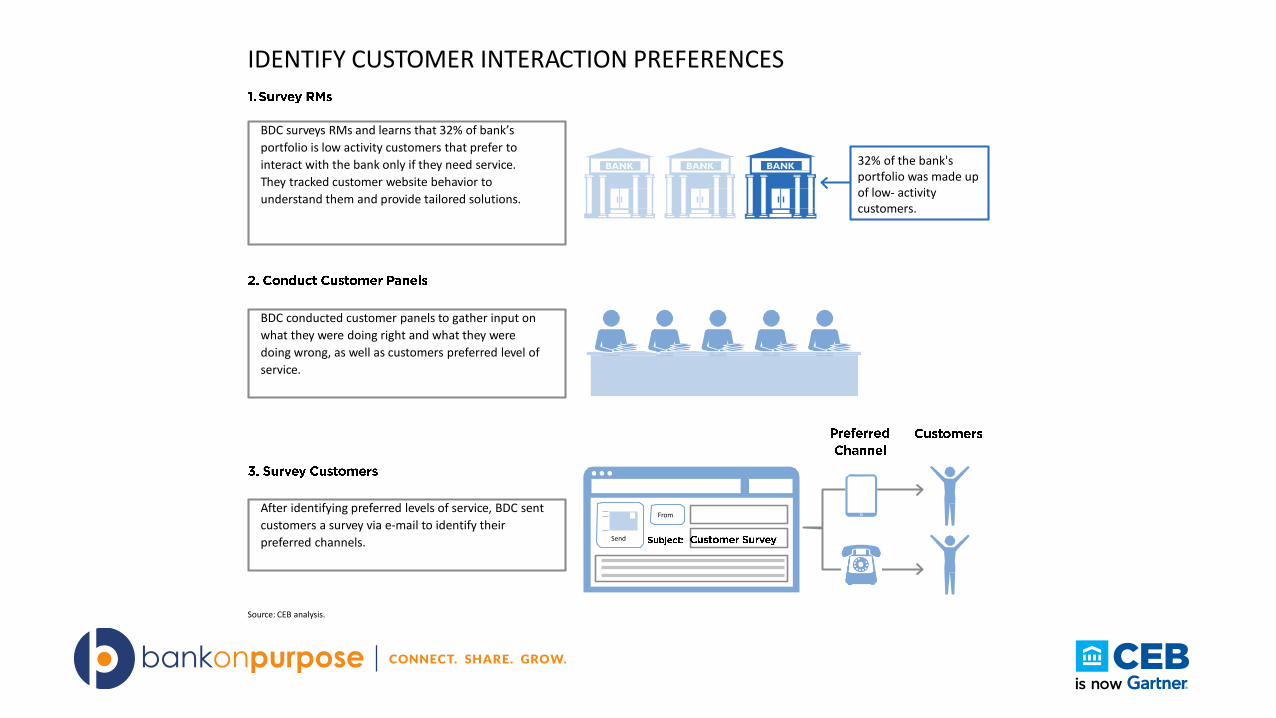
IDENTIFY CUSTOMER INTERACTION PREFERENCES
BDC conducted customer panels to gather input on
what they were doing right and what they were
doing wrong, as well as customers preferred level of
service.
After identifying preferred levels of service, BDC sent
customers a survey via e-mail to identify their
preferred channels. Send
From
BDC surveys RMs and learns that 32% of bank’s
portfolio is low activity customers that prefer to
interact with the bank only if they need service.
They tracked customer website behavior to
understand them and provide tailored solutions.
32% of the bank's portfolio was made up of low- activitycustomers.
Source: CEB analysis.

ALIGN PORTFOLIOS WITH INTERACTION PREFERENCES
Source: CEB analysis.
As customer financing needs change, they are reassigned to another RM portfolio to fit their new needs.
Type of Business: $2 M or Less in Sales Growth
Aspirations: Slow, Steady Number of Products:
1–3
Method of Contact: Phone or E-mail
Frequency of Contact: As Needed Expected
Needs: General Service
Type of Business: Over $2 M in Sales Growth
Aspirations: 15%+ Growth Rate Number of
Products: 3+
Method of Contact: In-Person
Frequency of Contact: Three Annual Meetings
Expected Needs: Customized Insight
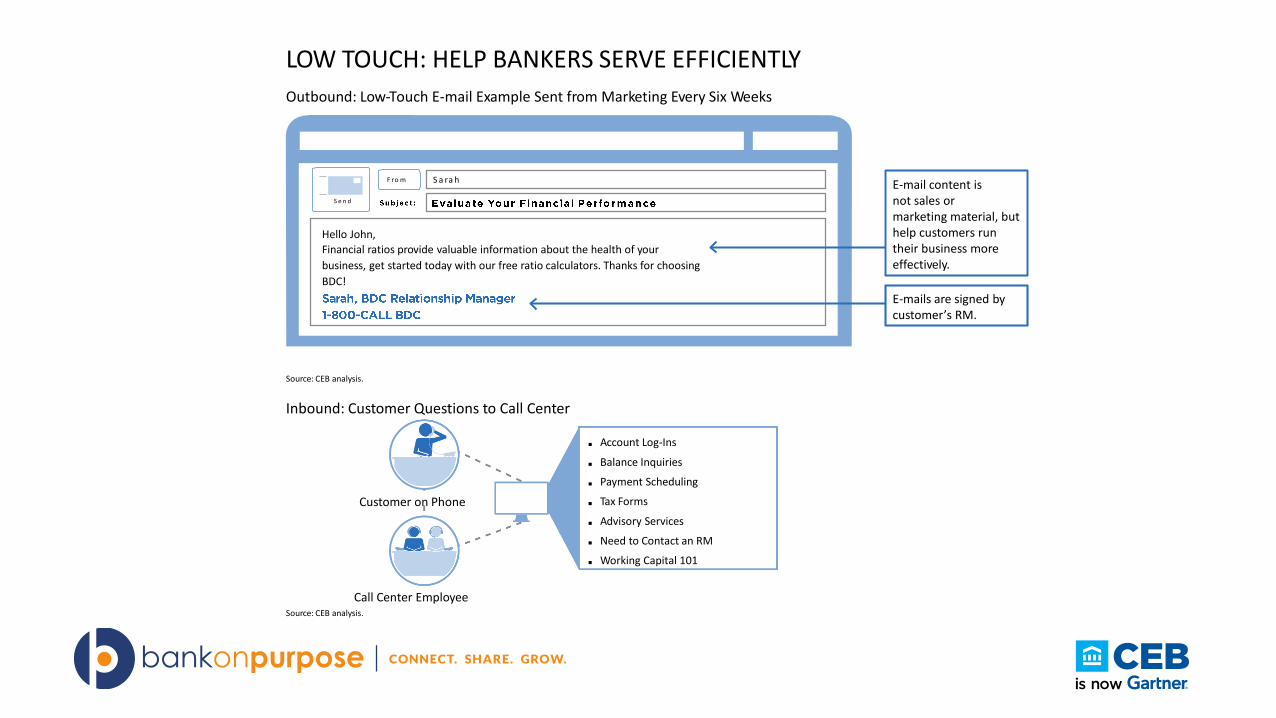
LOW TOUCH: HELP BANKERS SERVE EFFICIENTLY
Outbound: Low-Touch E-mail Example Sent from Marketing Every Six Weeks
Source: CEB analysis.
Inbound: Customer Questions to Call Center
Customer on Phone
Call Center Employee
■ Account Log-Ins
■ Balance Inquiries
■ Payment Scheduling
■ Tax Forms
■ Advisory Services
■ Need to Contact an RM
■ Working Capital 101
F ro m S a ra h
Hello John,
Financial ratios provide valuable information about the health of your
business, get started today with our free ratio calculators. Thanks for choosing
BDC!
E-mails are signed by customer’s RM.
E-mail content is not sales ormarketing material, but help customers run their business more effectively.
Source: CEB analysis.
S e n d

HIGH TOUCH: HELP BANKERS SERVE EFFECTIVELY
RMs Conduct Customer Phone Calls or Site Visits Three Times a YearPre-Meeting: High Touch Customer Meeting Prep
During Meeting: App-Enabled Customized Conversation
■ Spent 0–5 minutes preparing
■ Googled customer information and
industry
■ Customer conversation was
insubstantial and non-business
related
■ Client-led with no insight
■ Spend 20–30 minutes preparing
■ Gather industry information to share with
customer
■ Pull up information on the structure of
customer’s current financing
■ Banker-led with insight
■ Generate preauthorized loan amounts for client in real-time
■ Run personalized business scenarios and compare growth margins in real time in
front of the client
■ Record notes directly into CRM system from iPad to reduce amount of RM time in the
office
■ Provide client proposal right then and there
Notifications
iPad 9:40 AM
Customer Name XXXXXXXXXX XXXXXXXXXX
Source: CEB analysis.

RESULTS
Client satisfaction has grown10 times Customers
reporting to be satisfied or very
satisfied has
jumped from 61% to 71%
12% change in new customer
acquisition
10% growth from 2015 to 2016
Repeat customers have increased,
and attrition has decreased.
High Touch Low Touch
Source: CEB analysis.