Unleashing Collaborative IndustryUnleashing … 1 24 7 212 $XXX6 38 4 ‐ ...
23
Unleashing Collaborative Industry Unleashing Collaborative Industry Unleashing Collaborative Industry Unleashing Collaborative Industry Logistics Opportunities Logistics Opportunities February 2013 1
Transcript of Unleashing Collaborative IndustryUnleashing … 1 24 7 212 $XXX6 38 4 ‐ ...

Unleashing Collaborative IndustryUnleashing Collaborative IndustryUnleashing Collaborative Industry Unleashing Collaborative Industry Logistics OpportunitiesLogistics Opportunities
February 2013
1

Senior Leadership Focus On CollaborationSenior Leadership Focus On Collaboration
Collaboration Beyond Our Four WallsCollaboration Beyond Our Four Walls
Drive Efficiency To Fuel GrowthDrive Efficiency To Fuel Growth
2
Think Of Our Supply Chains As ONEThink Of Our Supply Chains As ONE

Consumer Goods Forum Has Published Future Supply Consumer Goods Forum Has Published Future Supply Chain Studies Focusing On Innovative CollaborationChain Studies Focusing On Innovative Collaboration
3
What Is The Consumer Goods Forum?What Is The Consumer Goods Forum?
h d l b l d kh d l b l d k The Consumer Goods Forum Is A Global Industry NetworkThe Consumer Goods Forum Is A Global Industry Network
The World’s Leading Association Of Retailers & Manufacturers The World’s Leading Association Of Retailers & Manufacturers ggAnd Their Business PartnersAnd Their Business Partners
A Global Organization With Headquarters In Paris And OfficesA Global Organization With Headquarters In Paris And Offices A Global Organization With Headquarters In Paris And Offices A Global Organization With Headquarters In Paris And Offices In Tokyo And WashingtonIn Tokyo And Washington
A Unique Platform To Develop Common Positions On Key A Unique Platform To Develop Common Positions On Key Strategic, Operational And NonStrategic, Operational And Non‐‐competitive Issues Affecting competitive Issues Affecting The Consumer Goods BusinessThe Consumer Goods Business
4
Collaborative Logistics Project OverviewCollaborative Logistics Project Overview
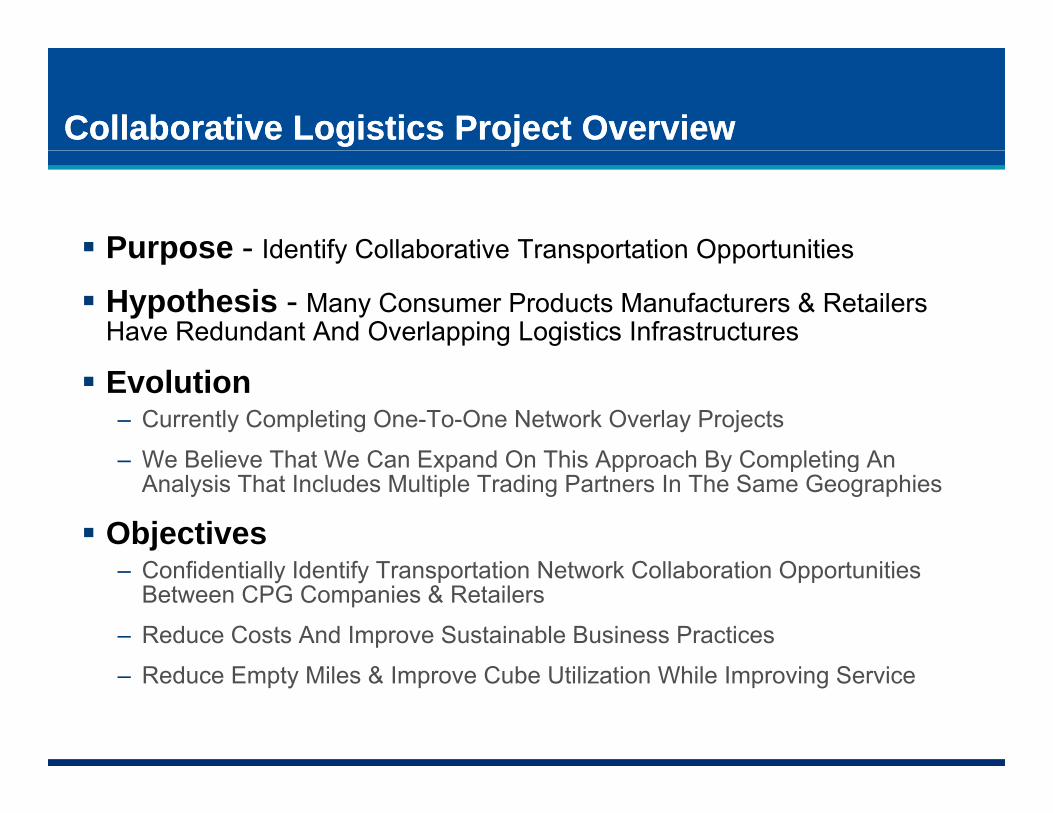
Purpose - Identify Collaborative Transportation OpportunitiesPurpose Identify Collaborative Transportation Opportunities
Hypothesis - Many Consumer Products Manufacturers & Retailers Have Redundant And Overlapping Logistics Infrastructures
Evolution‒ Currently Completing One-To-One Network Overlay Projects
We Believe That We Can Expand On This Approach By Completing An‒ We Believe That We Can Expand On This Approach By Completing An Analysis That Includes Multiple Trading Partners In The Same Geographies
Objectives‒ Confidentially Identify Transportation Network Collaboration Opportunities
Between CPG Companies & Retailers
‒ Reduce Costs And Improve Sustainable Business Practices
5
‒ Reduce Empty Miles & Improve Cube Utilization While Improving Service
Chainalytics & Chainalytics & ExelExel OverviewOverview
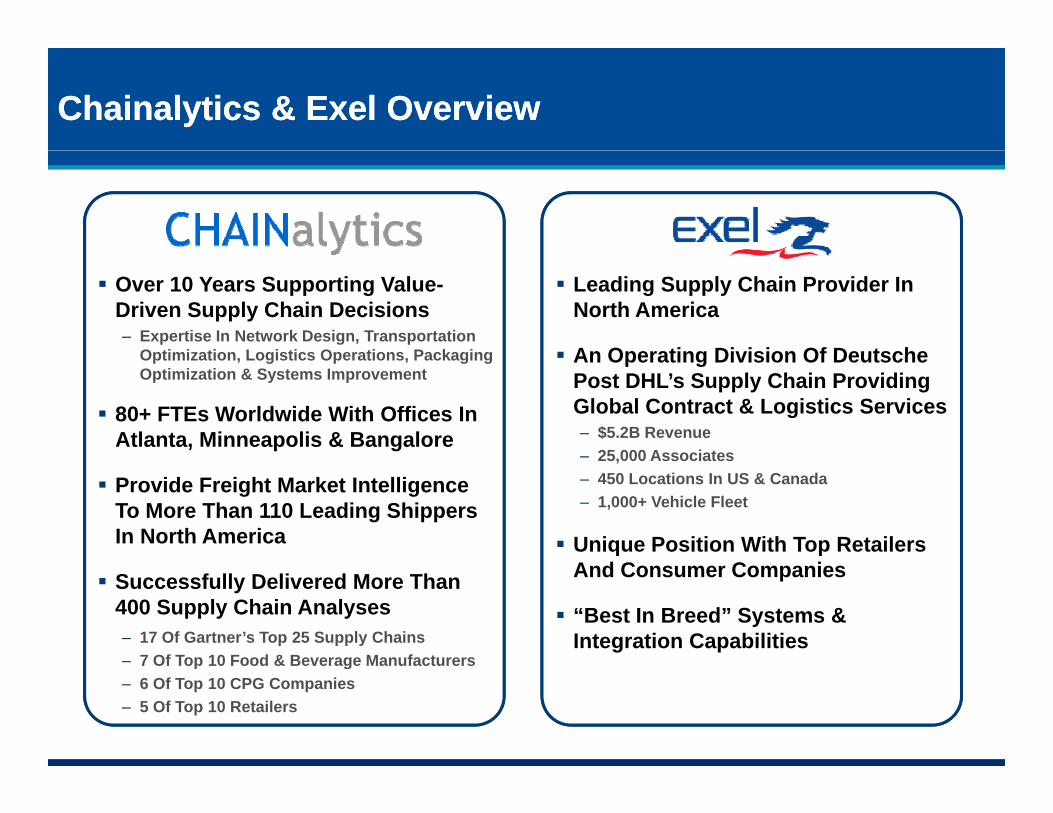
Over 10 Years Supporting Value-Driven Supply Chain Decisions‒ Expertise In Network Design, Transportation
Optimization Logistics Operations Packaging
Leading Supply Chain Provider In North America
An Operating Division Of DeutscheOptimization, Logistics Operations, Packaging Optimization & Systems Improvement
80+ FTEs Worldwide With Offices In Atlanta, Minneapolis & Bangalore
An Operating Division Of Deutsche Post DHL’s Supply Chain Providing Global Contract & Logistics Services‒ $5.2B Revenue‒ 25 000 Associates
Provide Freight Market Intelligence To More Than 110 Leading Shippers In North America
25,000 Associates‒ 450 Locations In US & Canada‒ 1,000+ Vehicle Fleet
Unique Position With Top Retailers
Successfully Delivered More Than 400 Supply Chain Analyses‒ 17 Of Gartner’s Top 25 Supply Chains‒ 7 Of Top 10 Food & Beverage Manufacturers
And Consumer Companies
“Best In Breed” Systems & Integration Capabilities
6
7 Of Top 10 Food & Beverage Manufacturers‒ 6 Of Top 10 CPG Companies‒ 5 Of Top 10 Retailers
Why Are Why Are ChainalyticsChainalytics & & ExelExel Teaming Up?Teaming Up?
Unparalleled Experience & ThoughtSome of Our ClientsSome of Our ClientsSome of Our ClientsSome of Our Clients
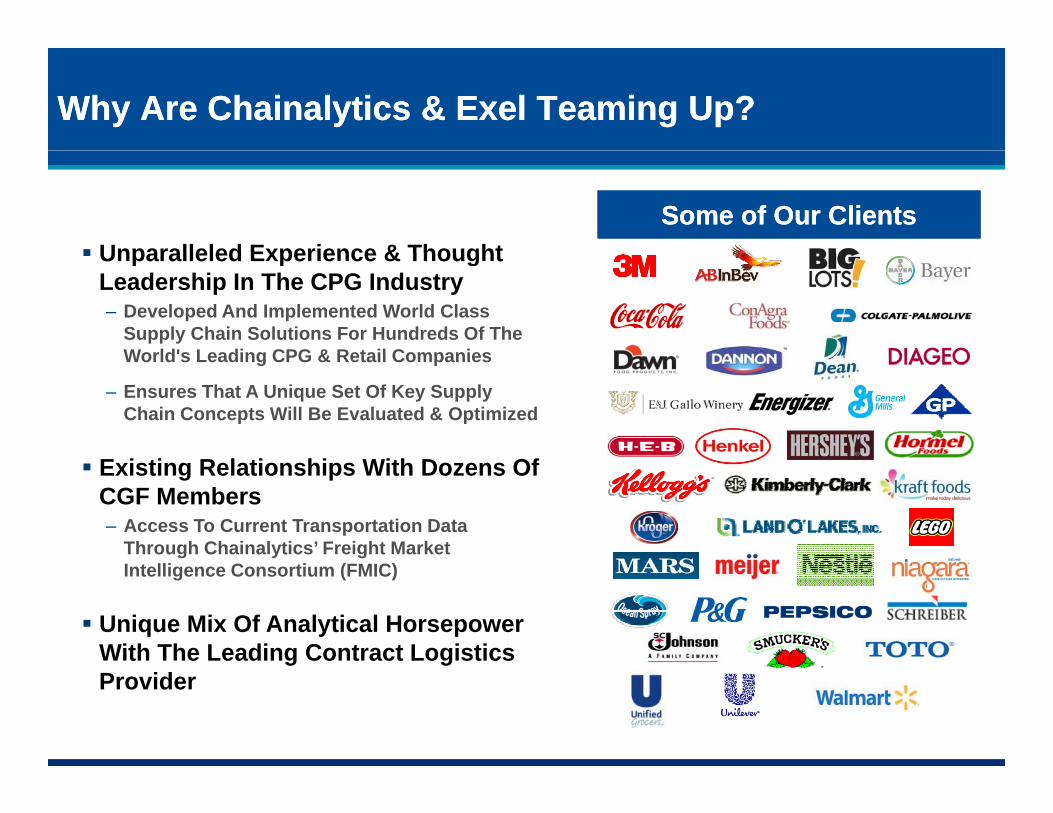
Unparalleled Experience & Thought Leadership In The CPG Industry‒ Developed And Implemented World Class
Supply Chain Solutions For Hundreds Of The World's Leading CPG & Retail CompaniesWorld s Leading CPG & Retail Companies
‒ Ensures That A Unique Set Of Key Supply Chain Concepts Will Be Evaluated & Optimized
Existing Relationships With Dozens Of CGF Members ‒ Access To Current Transportation Data
Through Chainalytics’ Freight Market
Intelligence Consortium (FMIC)
Unique Mix Of Analytical Horsepower With The Leading Contract Logistics
7
g gProvider

Chainalytics Freight Market Intelligence ConsortiumChainalytics Freight Market Intelligence Consortium
Provides Freight Market Intelligence,
SAMPLE COMPANY July 2011 Model - TruckloadModel-Based Benchmarking Consortium
StatisticsAnnual Shipment Volume 189,631 Loads
Estimated Market Cost 277,684,161$ Reported Annual Cost 278,646,063$
Percent Above / Below Market 0 35% AT MARKET
Long Haul Volume
SAMPLE COMPANY July 2011 Model - TruckloadModel-Based Benchmarking Consortium
StatisticsAnnual Shipment Volume 189,631 Loads
Estimated Market Cost 277,684,161$ Reported Annual Cost 278,646,063$
Percent Above / Below Market 0 35% AT MARKET
Long Haul Volume
Provides Freight Market Intelligence, Benchmarking, & Comparative Analysis To Its Members In A Private Forum‒ TL (Dry Van, Temp Control, Flatbed, IM), LTL, Ocean
Percent Above / Below Market 0.35% AT MARKETValue Above / Below Market 961,903$
Load Statistics Number of Loads PercentLoads BELOW Market 92,539 49%
Loads AT Market 36,298 19%Loads ABOVE Market 60,793 32%
Value Statistics Value PercentActual Value BELOW Market 107,842,874$ 39%
Actual Value AT Market 56,186,568$ 20%Actual Value ABOVE Market 114,616,622$ 41%
Statistics Coversheet statistics are based on all-in rates inclusive of fuel.
Long Haul (For loads >=250 miles)Annual Shipment Volume 141,198 loads 411 loads 5,162 loads 42,860 loads
Estimated Market Cost 181,329,901$ 641,763$ 9,794,499$ 85,917,997$ Reported Annual Cost 175,825,353$ 663,384$ 9,701,273$ 92,456,054$
Percent Above / Below Market -3.04% BELOW MARKET 3.37% ABOVE MARKET -0.95% AT MARKET 7.61% ABOVE MARKETValue Above / Below Market (5,504,548)$ 21,621$ (93,227)$ 6,538,057$
Load Statistics Count Percent Count Percent Count Percent Count Percent
Dry Van Temperature-Controlled Flatbed Intermodal
Uses A Model-Based Benchmarking Approach To Normalize The Drivers Which Impact Overall Costs
Load Statistics Count Percent Count Percent Count Percent Count PercentLoads BELOW Market 84,208 60% 164 40% 2,234 43% 5,932 14%
Loads AT Market 28,792 20% 24 6% 1,174 23% 6,311 15%
Loads ABOVE Market 28,198 20% 223 54% 1,754 34% 30,617 71%
Value Statistics Value Percent Value Percent Value Percent Value PercentActual Value BELOW Market 93,798,530$ 53% 202,669$ 31% 3,240,325$ 33% 10,601,350$ 11%
Actual Value AT Market 40,974,129$ 23% 31,813$ 5% 2,346,247$ 24% 12,834,381$ 14%Actual Value ABOVE Market 41,052,694$ 23% 428,902$ 65% 4,114,701$ 42% 69,020,323$ 75%
Comparative Ranking TOP THIRD BOTTOM THIRD MIDDLE THIRD BOTTOM THIRD
Semi-Annual Or Quarterly Updates
Over $18B In TL With Over 90 Shipper ppMembers
8

Market Dynamics are Significant for Shippers 2 Year Review by Mode
2011 20122010
S Ch i l ti FMICSource: Chainalytics FMIC
9
While Transportation rate increases have been relatively low over the past few years, shippers will need to find creative ways to control rate inflation

The The Industry Case For Industry Case For CollaborationCollaboration
Macro demands are straining transportation networksRetailers demand for smaller faster more frequent shipmentsRetailers demand for smaller, faster, more frequent shipments Sustainability (consolidation programs = minimized carbon emissions)Cost reductions (optimized shipping, lower inventories, capital
avoidance) Fluctuating diesel fuel costs
Multi-Company Supply Chain initiatives are needed to address these challenges Peer to peer collaboration is good but slow to unlock value. For later phases of collaboration to be successful an industry-wide
focus must be taken.
10

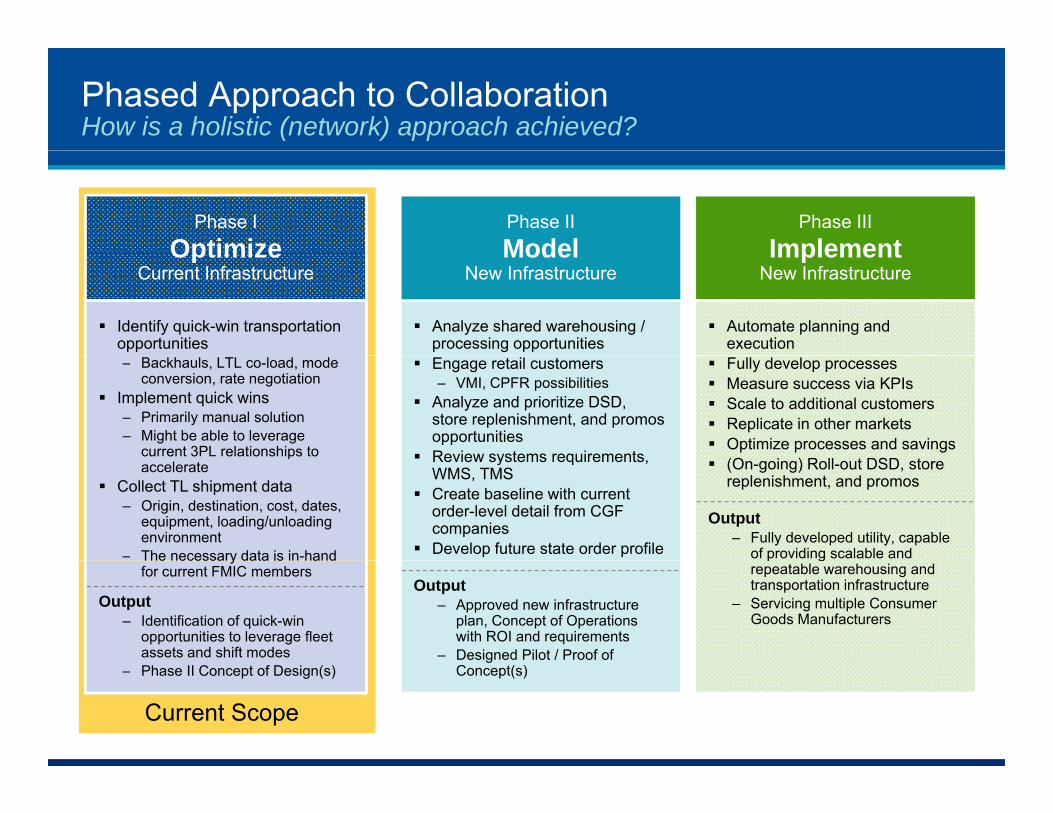
Phased Approach to CollaborationHow is a holistic (network) approach achieved?
Phase IOptimize
Phase IIModel
Phase IIIImplement
Analyze shared warehousing / processing opportunities
Optimize Current Infrastructure
Identify quick-win transportation opportunities
ModelNew Infrastructure
Implement New Infrastructure
Automate planning and execution
Engage retail customers– VMI, CPFR possibilities
Analyze and prioritize DSD, store replenishment, and promos opportunities
Review systems requirements
– Backhauls, LTL co-load, mode conversion, rate negotiation
Implement quick wins– Primarily manual solution– Might be able to leverage
current 3PL relationships to
Fully develop processes Measure success via KPIs Scale to additional customers Replicate in other markets Optimize processes and savings
(O i ) R ll DSD Review systems requirements, WMS, TMS
Create baseline with current order-level detail from CGF companies
Develop future state order profile
paccelerate
Collect TL shipment data– Origin, destination, cost, dates,
equipment, loading/unloading environment
– The necessary data is in-hand
(On-going) Roll-out DSD, store replenishment, and promos
Output– Fully developed utility, capable
of providing scalable and
Output– Approved new infrastructure
plan, Concept of Operations with ROI and requirements
– Designed Pilot / Proof of
The necessary data is in hand for current FMIC members
Output– Identification of quick-win
opportunities to leverage fleet assets and shift modes
p grepeatable warehousing and transportation infrastructure
– Servicing multiple Consumer Goods Manufacturers
11
Concept(s)
Current Scope
– Phase II Concept of Design(s)
Phased Approach to CollaborationHow is a holistic (network) approach achieved?
Phase IOptimize
Phase IIModel
Phase IIIImplement
Analyze shared warehousing / processing opportunities
Optimize Current Infrastructure
Identify quick-win transportation opportunities
ModelNew Infrastructure
Implement New Infrastructure
Automate planning and execution
Engage retail customers– VMI, CPFR possibilities
Analyze and prioritize DSD, store replenishment, and promos opportunities
Review systems requirements
– Backhauls, LTL co-load, mode conversion, rate negotiation
Implement quick wins– Primarily manual solution– Might be able to leverage
current 3PL relationships to
Fully develop processes Measure success via KPIs Scale to additional customers Replicate in other markets Optimize processes and savings
(O i ) R ll DSD Review systems requirements, WMS, TMS
Create baseline with current order-level detail from CGF companies
Develop future state order profile
paccelerate
Collect TL shipment data– Origin, destination, cost, dates,
equipment, loading/unloading environment
– The necessary data is in-hand
(On-going) Roll-out DSD, store replenishment, and promos
Output– Fully developed utility, capable
of providing scalable and
Output– Approved new infrastructure
plan, Concept of Operations with ROI and requirements
– Designed Pilot / Proof of
The necessary data is in hand for current FMIC members
Output– Identification of quick-win
opportunities to leverage fleet assets and shift modes
p grepeatable warehousing and transportation infrastructure
– Servicing multiple Consumer Goods Manufacturers
12
Concept(s)
Current Scope
– Phase II Concept of Design(s)

Phase 1 OpportunitiesPhase 1 Opportunities
Analysis Of Common Lanes & Corresponding Networks‒ Back Hauls/Fleet Utilization‒ Comingled LTL‒ Mode Conversion
Identify “Quick-Win” Transportation Opportunities‒ Identify Quick-Win Transportation Opportunities
Develop Innovative Concepts & Designs (I E Shared Leased 3PL Fleets Etc )(I.E. Shared Leased 3PL Fleets, Etc.)
13
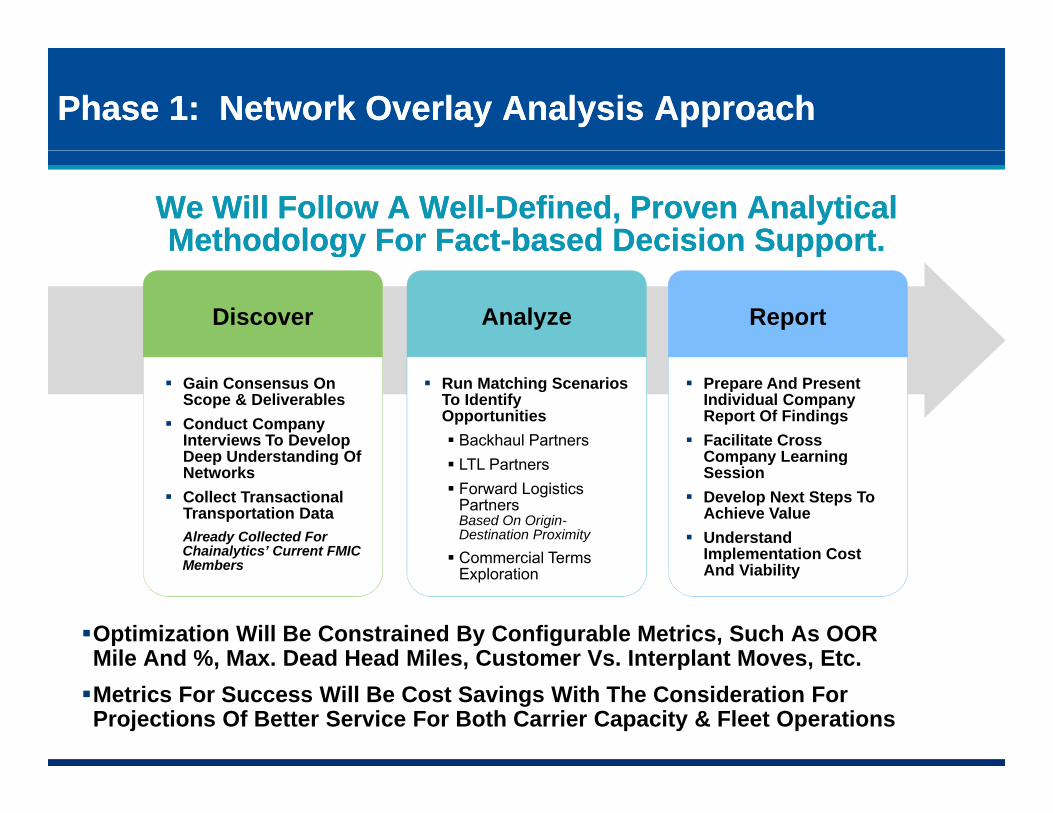
Phase 1: Network Overlay Analysis ApproachPhase 1: Network Overlay Analysis Approach
We Will Follow A WellWe Will Follow A Well--Defined, Proven Analytical Defined, Proven Analytical Methodology For FactMethodology For Fact--based Decision Support.based Decision Support.gygy pppp
Discover Analyze Report
Gain Consensus On Scope & Deliverables
Conduct Company Interviews To Develop Deep Understanding Of
Prepare And Present Individual Company Report Of Findings
Facilitate Cross Company Learning
Run Matching Scenarios To Identify Opportunities Backhaul Partners
Deep Understanding Of Networks
Collect Transactional Transportation Data Already Collected For Chainalytics’ Current FMIC M b
Company Learning Session
Develop Next Steps To Achieve Value
Understand Implementation Cost
LTL Partners Forward Logistics
Partners Based On Origin-Destination Proximity
Commercial Terms
Optimization Will Be Constrained By Configurable Metrics, Such As OOR Mile And %, Max. Dead Head Miles, Customer Vs. Interplant Moves, Etc.
Membersp
And ViabilityCommercial Terms Exploration
14
Mile And %, Max. Dead Head Miles, Customer Vs. Interplant Moves, Etc.Metrics For Success Will Be Cost Savings With The Consideration For Projections Of Better Service For Both Carrier Capacity & Fleet Operations
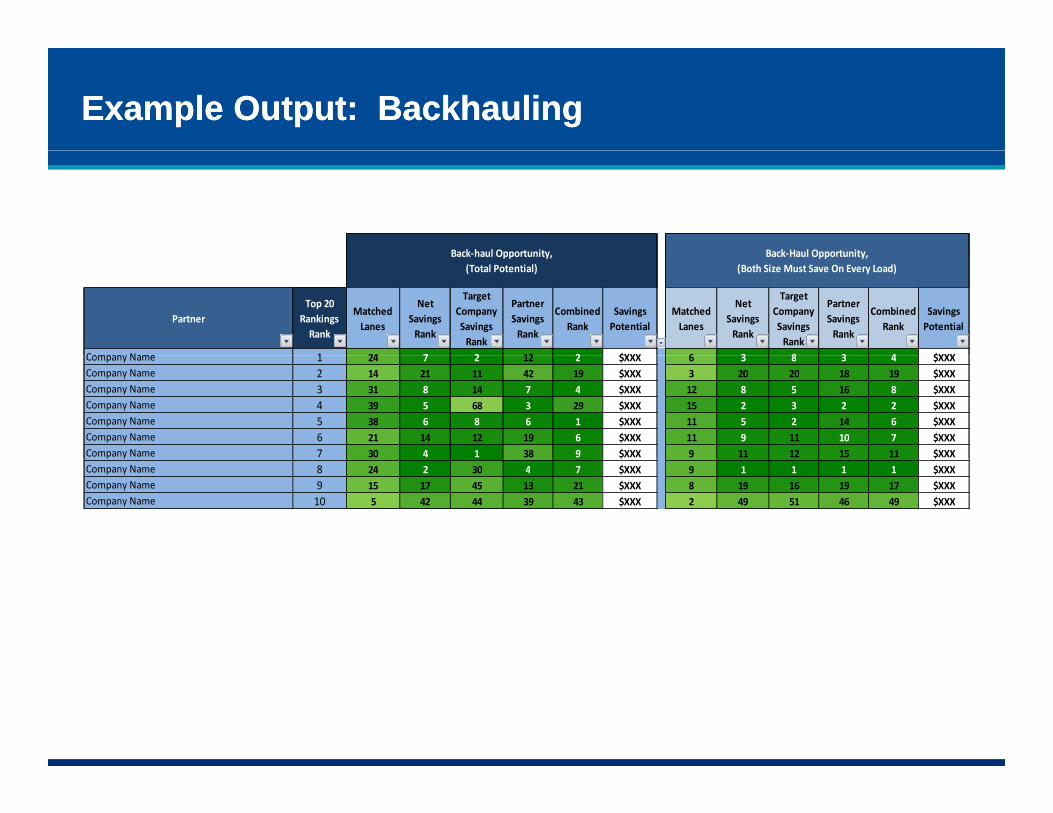
Example Output: BackhaulingExample Output: Backhauling
Back haul Opportunity Back Haul OpportunityBack haul Opportunity Back Haul Opportunity
PartnerTop 20
Rankings Rank
Matched Lanes
Net Savings Rank
Target Company Savings Rank
Partner Savings Rank
Combined Rank
Savings Potential
Matched Lanes
Net Savings Rank
Target Company Savings Rank
Partner Savings Rank
Combined Rank
Savings Potential
Company Name 1 24 7 2 12 2 $XXX 6 3 8 3 4 $XXX
Back‐haul Opportunity, (Total Potential)
Back‐Haul Opportunity, (Both Size Must Save On Every Load)
Company Name 1 24 7 2 12 2 $XXX 6 3 8 3 4 $XXXCompany Name 2 14 21 11 42 19 $XXX 3 20 20 18 19 $XXXCompany Name 3 31 8 14 7 4 $XXX 12 8 5 16 8 $XXXCompany Name 4 39 5 68 3 29 $XXX 15 2 3 2 2 $XXXCompany Name 5 38 6 8 6 1 $XXX 11 5 2 14 6 $XXXCompany Name 6 21 14 12 19 6 $XXX 11 9 11 10 7 $XXXCompany Name 7 30 4 1 38 9 $XXX 9 11 12 15 11 $XXX
Company Name 1 24 7 2 12 2 $XXX 6 3 8 3 4 $XXXCompany Name 2 14 21 11 42 19 $XXX 3 20 20 18 19 $XXXCompany Name 3 31 8 14 7 4 $XXX 12 8 5 16 8 $XXXCompany Name 4 39 5 68 3 29 $XXX 15 2 3 2 2 $XXXCompany Name 5 38 6 8 6 1 $XXX 11 5 2 14 6 $XXXCompany Name 6 21 14 12 19 6 $XXX 11 9 11 10 7 $XXXCompany Name 7 30 4 1 38 9 $XXX 9 11 12 15 11 $XXXp y $ $Company Name 8 24 2 30 4 7 $XXX 9 1 1 1 1 $XXXCompany Name 9 15 17 45 13 21 $XXX 8 19 16 19 17 $XXXCompany Name 10 5 42 44 39 43 $XXX 2 49 51 46 49 $XXX
p y $ $Company Name 8 24 2 30 4 7 $XXX 9 1 1 1 1 $XXXCompany Name 9 15 17 45 13 21 $XXX 8 19 16 19 17 $XXXCompany Name 10 5 42 44 39 43 $XXX 2 49 51 46 49 $XXX
15
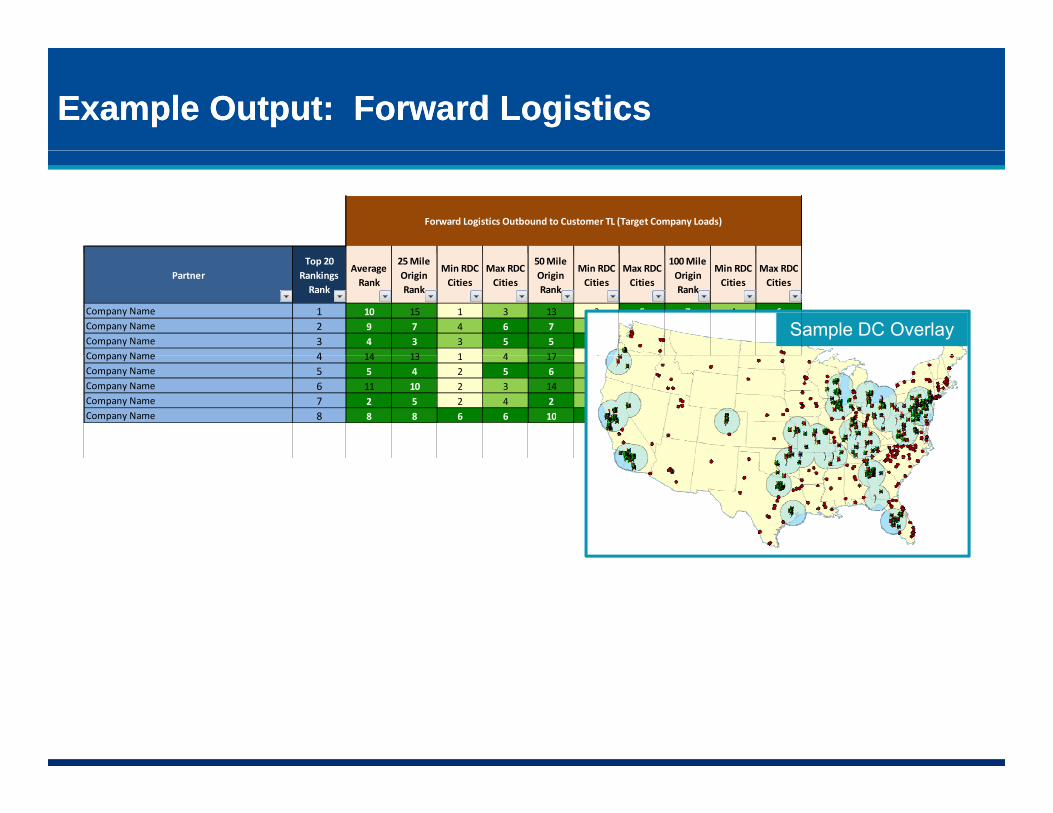
Example Output: Forward LogisticsExample Output: Forward Logistics
Forward Logistics Outbound to Customer TL (Target Company Loads)Forward Logistics Outbound to Customer TL (Target Company Loads)
PartnerTop 20
Rankings Rank
Average Rank
25 Mile Origin Rank
Min RDC Cities
Max RDC Cities
50 Mile Origin Rank
Min RDC Cities
Max RDC Cities
100 Mile Origin Rank
Min RDC Cities
Max RDC Cities
Company Name 1 10 15 1 3 13 2 5 7 4 6Company Name 2 9 7 4 6 7 4 6 11 5 6Company Name 3 4 3 3 5 5 5 5 3 6 6Company Name 4 14 13 1 4 17 2 5 14 5 6
Sample DC OverlayCompany Name 4 14 13 1 4 17 2 5 14 5 6Company Name 5 5 4 2 5 6 4 5 6 6 6Company Name 6 11 10 2 3 14 4 4 15 6 6Company Name 7 2 5 2 4 2 3 5 2 5 6Company Name 8 8 8 6 6 10 6 6 9 6 6
Company Name 4 14 13 1 4 17 2 5 14 5 6Company Name 5 5 4 2 5 6 4 5 6 6 6Company Name 6 11 10 2 3 14 4 4 15 6 6Company Name 7 2 5 2 4 2 3 5 2 5 6Company Name 8 8 8 6 6 10 6 6 9 6 6
16

Summary of DeliverablesSummary of Deliverables
Benefits Case Workbook Containing:g‒ Output From Overlay Analysis Of Common Lanes
& Corresponding Networks‒ “Quick-Win” Transportation OpportunitiesQuick Win Transportation Opportunities‒ Innovative Concepts & Designs
(I.E. Shared Leased 3PL Fleets, Etc.)
Debrief And Wrap-Up Meeting Of Participants To Review Results & Engage In Deeper Discussion About The FindingsAbout The Findings
Roadmap Of Next Steps
17

Project Work Plan: Phase 1Project Work Plan: Phase 1
Step Week 2 3 4 5 6 7 8 9 10
AssessmentProject Mobilization
1
Project MobilizationInterviewsData Validation and Collect Missing DataBuild and Validate Baseline NetworksReview Scenario Run Plan X
AnalysisAnalysisBackhaul, LTL, Mode ConversionRate AnalysisDevelop and Review Initial Thoughts X
ConclusionsIntegrate FeedbackFacilitate Recommendation Review Session XDevelop Imp and Future Phases PlanProgress Reviews ▲ ▲ ▲ ▲ ▲ ▲
Milestones ▲ ▲ ▲ ▲
Assumes 10-20 Participants With Readily-Available Data
Milestones ▲ ▲ ▲ ▲X indicates Sr. Mgt Meeting
potential for delay
18
Assumes 10 20 Participants With Readily Available Data Detailed Plans For Phases 2 & 3 Will Be Developed During Phase 1
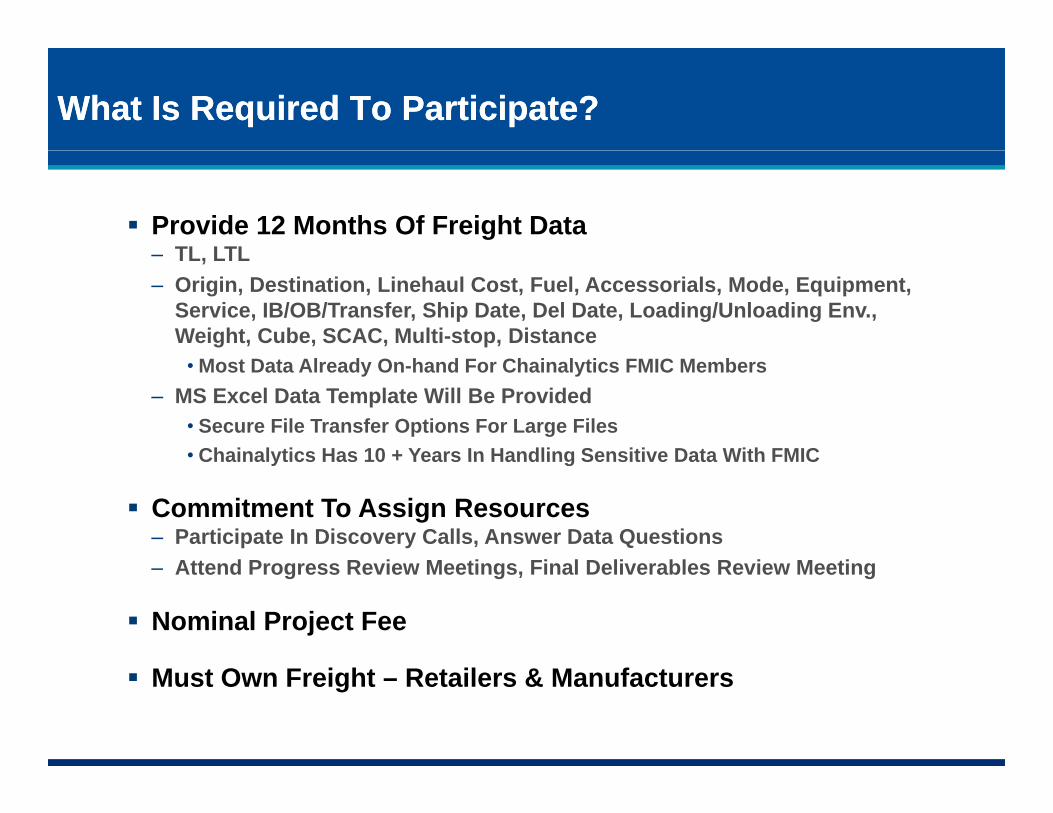
What Is Required To Participate?What Is Required To Participate?
Provide 12 Months Of Freight DataTL LTL‒ TL, LTL
‒ Origin, Destination, Linehaul Cost, Fuel, Accessorials, Mode, Equipment, Service, IB/OB/Transfer, Ship Date, Del Date, Loading/Unloading Env., Weight, Cube, SCAC, Multi-stop, Distance
• Most Data Already On-hand For Chainalytics FMIC Members‒ MS Excel Data Template Will Be Provided
• Secure File Transfer Options For Large Files • Chainalytics Has 10 + Years In Handling Sensitive Data With FMICChainalytics Has 10 + Years In Handling Sensitive Data With FMIC
Commitment To Assign Resources‒ Participate In Discovery Calls, Answer Data Questions
Att d P R i M ti Fi l D li bl R i M ti‒ Attend Progress Review Meetings, Final Deliverables Review Meeting
Nominal Project Fee
19
Must Own Freight – Retailers & Manufacturers

Companies Committed Companies Committed To To Participate Participate To Date…To Date…
20

Project Work Fees: Phase 1Project Work Fees: Phase 1
PhasePhase DurationDuration Professional FeesProfessional Fees
OneOptimize Current
10 - 12 Weeks
$12,500 Fixed Professional Fees For Each FMIC Member Company $17,500 Fixed Professional Fees For Each Non-FMIC Company Current
InfrastructureWeeks $17,500 Fixed Professional Fees For Each Non FMIC Company
Plus Travel Expenses*
21
*Billed at cost, estimated at 15% of professional fees for Phase 1

So Why Should You Consider Participating?So Why Should You Consider Participating?
Cost Effective Way To Get Visibility To Trading Partner & CPG Transportation Opportunities Across The U.S. & Canada
Ability To Identify & Un-Lock Second-Order Transportation Opportunities (i.e. Shared Leased Fleets, Hub, Co-Load)
Demonstrate Value In Phase I To Fuel Industry Interest In Broader Collaboration Opportunities In WarehousingBroader Collaboration Opportunities In Warehousing
Forum To Facilitate & Drive Peer Collaboration
22
Thank You!Mike Hane mhane@chainalytics com 678 384 3581
23
Mike Hane, [email protected], 678-384-3581,Rudy Hagedorn, [email protected]
+49 171 693 5583