Unix Tools and Scripts to Monitor Informix · PDF file · 2006-12-17Unix Tools and...
47
Unix Tools and Scripts to Monitor Informix IDS Lester Knutsen Advanced DataTools Corporation
Transcript of Unix Tools and Scripts to Monitor Informix · PDF file · 2006-12-17Unix Tools and...

Unix Tools and Scripts to Monitor Informix IDS
Lester KnutsenAdvanced DataTools Corporation

2
BackgroundLester Knutsen has been developing database applications with Informix databases since 1983. He is president of Advanced DataTools, an IBM-Informix Consulting, Training, and Tools Partner specializing in data warehouse development, database design, performance tuning, and Informix training and support. Currently, Lester specializes in developing web-enabled data warehouse systems. He provides training and consulting in database design and performance tuning, and is widely known in the Informix community for his extensive experience and teaching skill. Lester is also president of the Washington D.C. Area Informix Users Group, one of the largest and most active Informix user groups, and is one of the founding members of the International Informix Users Group. Lester is also a member of the IBM Gold Consultant program.
3
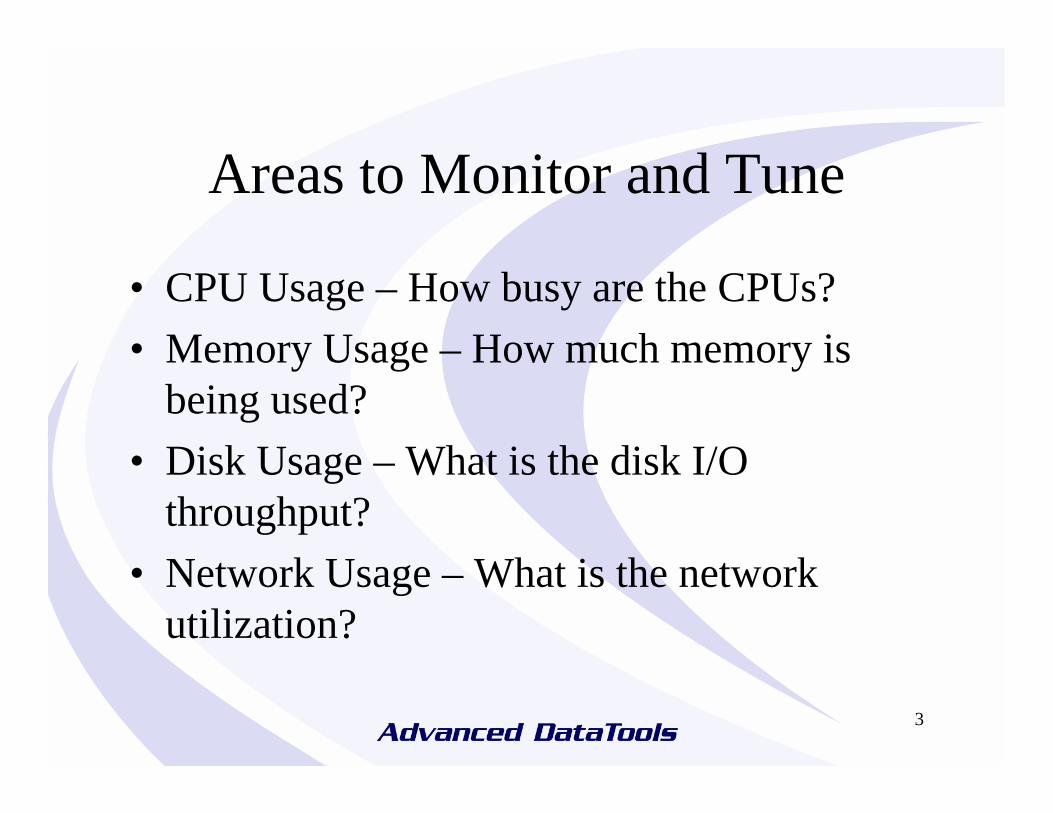
Areas to Monitor and Tune
• CPU Usage – How busy are the CPUs?• Memory Usage – How much memory is
being used?• Disk Usage – What is the disk I/O
throughput?• Network Usage – What is the network
utilization?
4
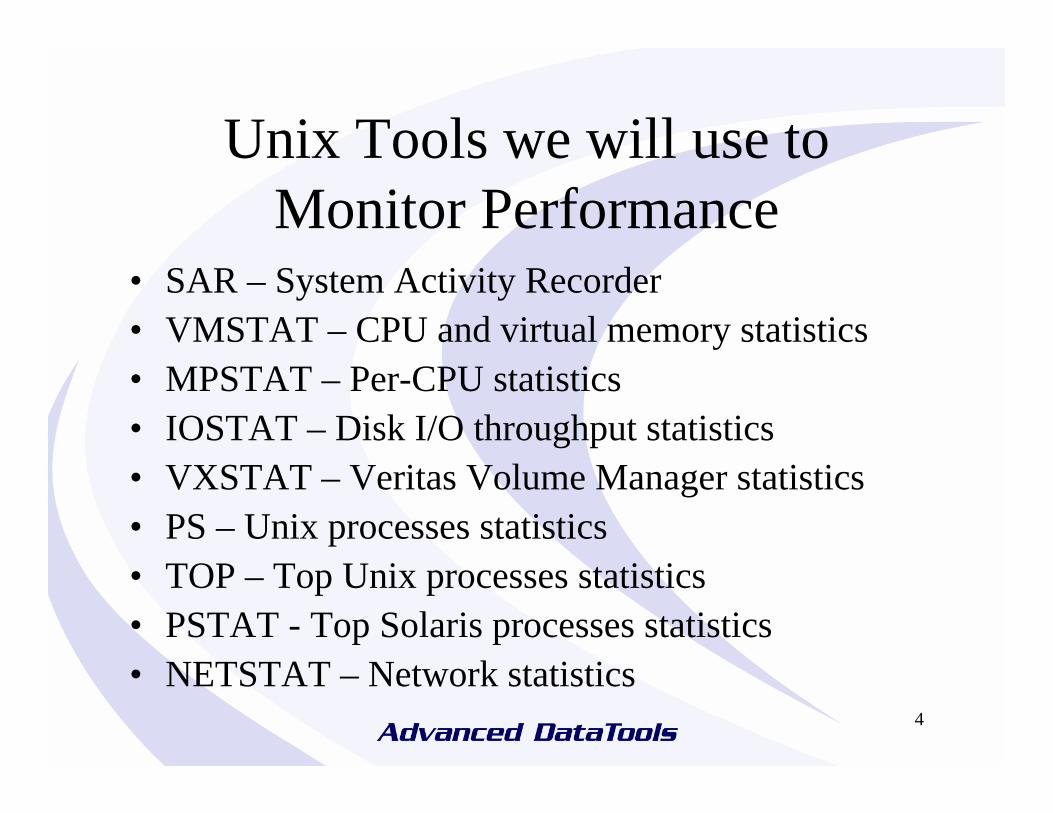
Unix Tools we will use to Monitor Performance
• SAR – System Activity Recorder• VMSTAT – CPU and virtual memory statistics• MPSTAT – Per-CPU statistics• IOSTAT – Disk I/O throughput statistics• VXSTAT – Veritas Volume Manager statistics• PS – Unix processes statistics• TOP – Top Unix processes statistics• PSTAT - Top Solaris processes statistics • NETSTAT – Network statistics
5
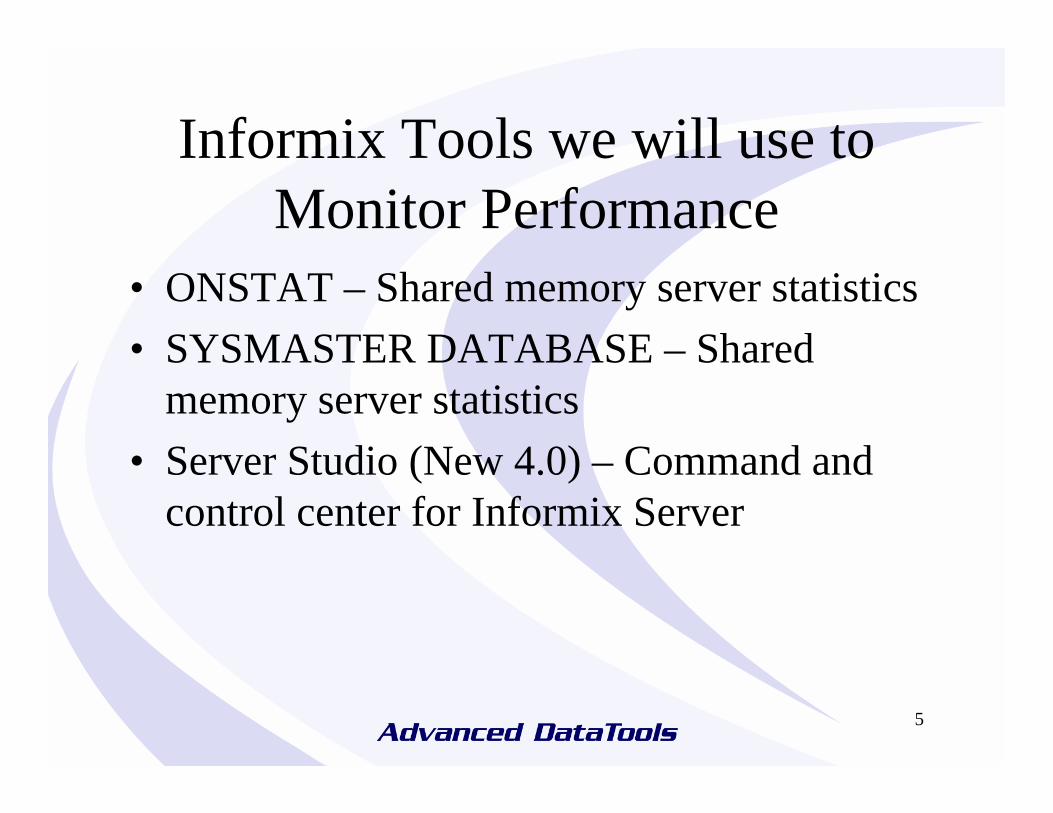
Informix Tools we will use to Monitor Performance
• ONSTAT – Shared memory server statistics• SYSMASTER DATABASE – Shared
memory server statistics• Server Studio (New 4.0) – Command and
control center for Informix Server

6
SAR – System Activity Recorder
• Setup as a cron job to collect statistics and saves them to a file /var/adm/sa/sa??
• Example Cron setup to collect data every 15 minutes:
0,15,30,45 * * * * /usr/lib/sa/sa1
• SAR command displays the data collected• Can also be run in real-time:
sar 5 5

7
SAR Reporting Options-a Report use of file access system routines-b Report buffer activity-c Report system calls-d Report activity for each device (disk or tape drive)-g Report paging activities-k Report kernel memory allocation (KMA) activities-m Report message and semaphore activities-p Report paging activities-q Report average queue length -r Report unused memory pages-u Report CPU utilization (the default)-v Report status of process, i-node, file tables-w Report system swapping and switching activity-y Report TTY device activity-A Report all data. Equivalent to -abcdgkmpqruvwy

8
SAR Collection Options
• -i sec - Select data at intervals as close as possible to sec seconds.
• -s time - Select data later than time in the form hh[:mm]. Default is 08:00.
• -f filename - Use filename as the data source for sar. Default is the current daily data file /var/adm/sa/sadd.
• -o filename - Save samples in file, filename, in binary format.

9
SAR – Default Output
00:00:00 %usr %sys %wio %idle07:00:00 27 3 0 7007:15:02 61 6 0 3307:30:01 47 4 0 4907:45:01 28 3 0 7008:00:00 30 2 0 6808:15:00 50 3 0 4608:30:01 56 3 0 4108:45:00 22 2 0 77

10
VMSTAT – CPU and Memory
• Options:vmstat [ -cipsS ] [ disks ] [ interval [ count ] ]
• Example:
lester@ >vmstat 5 5procs memory page disk faults cpur b w swap free re mf pi po fr de sr s0 s1 s2 s3 in sy cs us sy id0 0 0 4350896 573168 0 0 0 0 0 0 0 0 1 1 7 4294967196 0 0 -5 -1 -1040 0 0 3749680 370888 106 68 0 0 0 0 0 0 0 1 0 237 835 839 9 1 900 0 0 3748784 369728 3 3 0 0 0 0 0 0 0 1 0 233 368 728 25 0 750 0 0 3748816 369760 1 1 0 0 0 0 0 0 0 0 0 233 287 692 25 0 750 0 0 3748816 369760 0 0 0 0 0 0 0 0 0 1 0 226 278 715 9 2 89

11
MPSTAT – Per-CPU Statistics
• Options:mpstat [ -p | -P set ] [ interval [ count ] ]
• Example on a 4 CPU machine:
CPU minf mjf xcal intr ithr csw icsw migr smtx srw syscl usr sys wt idl44 1 0 20 304 200 115 10 19 13 0 60 51 0 0 4945 1 0 16 5 2 240 2 46 10 0 107 5 1 0 9446 0 0 5 6 1 188 4 38 6 0 82 21 0 0 7947 0 0 2 9 1 181 7 39 8 0 69 24 0 0 76
CPU minf mjf xcal intr ithr csw icsw migr smtx srw syscl usr sys wt idl44 1 0 28 303 200 133 8 22 13 0 69 39 0 0 6145 0 0 2 11 2 182 7 38 6 0 78 27 0 0 7246 0 0 4 8 1 191 5 42 7 0 74 9 8 0 8347 0 0 7 12 1 175 9 38 9 0 77 33 0 0 67

12
IOSTAT – Disk I/O Statistics
• Options:iostat [ -cCdDeEImMnpPrstxz ] [ -l n ] [ -T u | d ] [ disk ... ] [ interval [ count ] ]
• Example:iostat 5 5
tty sd0 sd1 sd2 sd3 cputin tout kps tps serv kps tps serv kps tps serv kps tps serv us sy wt id
0 33 0 0 1 58 1 11 20 1 10 38 7 2 5 1 0 940 47 0 0 0 0 0 0 3 0 5 5 3 3 2 1 0 960 16 0 0 0 0 0 0 3 0 4 0 0 0 0 0 0 1000 16 0 0 0 0 0 0 0 0 3 0 0 0 3 0 0 960 16 0 0 0 0 0 0 28 4 7 0 0 0 1 0 0 98

13
VXSTAT – Veritas Volume Manager Statistics
• Part of Veritas Volume Manager• To display disk statistics, use the vxstat -d
command:OPERATIONS BLOCKS AVG TIME(ms)
TYP NAME READ WRITE READ WRITE READ WRITEdm disk01 40473 174045 455898 951379 29.5 35.4dm disk02 32668 16873 470337 351351 35.2 102.9dm disk03 55249 60043 780779 731979 35.3 61.2dm disk04 11909 13745 114508 128605 25.0 30.7

14
PS – Unix Processes Statistics
• Key Options:-e List information about every process now running.-f Generate a full listing. -l Generate a long listing. -P Print the number of the processor to which the process or lwp is
bound.-t term List only process data associated with term. -u uidlist List only process data whose effective user ID number or
login name is given in uidlist. -U uidlist List information for processes whose real user ID numbers
or login names are given in uidlist.

15
PS – Unix Processes Exampleslester@atlas >ps -fu informix | more
UID PID PPID C STIME TTY TIME CMDinformix 416 1 0 Apr 17 ? 0:05 oninit -yvinformix 418 417 0 Apr 17 ? 0:05 oninit -yvinformix 428 1 0 Apr 17 ? 0:11 oninit -yvinformix 4085 3984 0 14:45:38 pts/2 0:00 dbaccessinformix 3984 3966 0 14:44:03 pts/2 0:00 bashinformix 3927 1 0 14:23:31 ? 16:21 oninitinformix 3966 874 0 14:37:34 pts/2 0:00 –ksh
lester@atlas >ps -lu informix | moreF S UID PID PPID C PRI NI ADDR SZ WCHAN TTY TIME CMD8 S 202 416 1 0 41 20 ? 17648 ? ? 0:05 oninitc S 202 418 417 0 41 20 ? 17647 ? ? 0:05 oninit8 S 202 428 1 0 40 20 ? 14792 ? ? 0:11 oninit8 S 202 4085 3984 0 41 20 ? 654 ? pts/2 0:00 dbaccess8 S 202 3984 3966 0 51 20 ? 311 ? pts/2 0:00 bash8 S 202 3927 1 0 41 20 ? 17389 ? ? 16:21 oninit8 S 202 3966 874 0 51 20 ? 236 ? pts/2 0:00 ksh

16
TOP – Top Unix Processeslast pid: 9146; load averages: 1.76, 1.65, 1.61 20:16:10143 processes: 133 sleeping, 3 zombie, 5 stopped, 2 on cpuCPU states: 87.6% idle, 9.9% user, 2.4% kernel, 0.0% iowait, 0.0% swapMemory: 12G real, 1122M free, 3899M swap in use, 8K swap free
PID USERNAME THR PRI NICE SIZE RES STATE TIME CPU COMMAND7928 root 7 58 0 28M 26M sleep 8:36 5.17% dsmc2553 informix 5 30 -10 3625M 2896M cpu17 457.3H 1.58% oninit2549 informix 5 59 -10 3625M 2952M sleep 502.2H 1.23% oninit2551 informix 5 51 -10 3625M 2907M sleep 613.5H 1.19% oninit2555 informix 5 51 -10 3625M 2888M sleep 373.4H 0.92% oninit2539 informix 5 59 -10 3625M 2959M sleep 496.5H 0.80% oninit2550 informix 5 59 -10 3625M 2935M sleep 684.9H 0.70% oninit9145 lester 1 50 0 2544K 2120K cpu16 0:01 0.61% top2552 informix 5 59 -10 3625M 2906M sleep 528.3H 0.59% oninit2554 informix 5 59 -10 3625M 2894M sleep 396.3H 0.52% oninit2329 root 1 58 0 13M 3040K sleep 579:30 0.02% jre9121 root 1 58 0 5112K 2264K sleep 0:00 0.02% bpsched14191 root 1 48 0 5176K 2336K sleep 0:13 0.01% bpsched9114 lester 1 43 0 1648K 1200K sleep 0:00 0.01% ksh9117 root 1 48 0 10M 5808K sleep 0:00 0.01% bprd

17
PSTAT - Top Solaris ProcessesPID USERNAME SIZE RSS STATE PRI NICE TIME CPU PROCESS/NLWP4424 lester 1616K 1424K cpu1 55 0 0:00.00 0.1% prstat/14414 lester 1928K 1264K sleep 41 0 0:00.00 0.1% ksh/1853 nobody 43M 26M sleep 58 0 0:00.03 0.1% java/274412 root 1840K 1328K sleep 54 0 0:00.00 0.0% in.telnetd/1407 informix 143M 1240K sleep 59 -10 0:00.00 0.0% oninit/1405 informix 143M 1576K sleep 59 -10 0:00.00 0.0% oninit/1406 informix 143M 12M sleep 59 -10 0:00.07 0.0% oninit/2762 root 952K 480K sleep 51 0 0:00.00 0.0% readproctitle/1376 root 2352K 1608K sleep 45 0 0:00.00 0.0% caspd/5389 root 1656K 792K sleep 31 0 0:00.00 0.0% cimomboot/1251 root 3040K 2368K sleep 52 0 0:00.00 0.0% nscd/7225 root 3824K 2008K sleep 59 0 0:00.00 0.0% automountd/5379 root 50M 19M sleep 58 0 0:00.00 0.0% caspeng/212339 root 1976K 1264K sleep 48 0 0:00.00 0.0% cron/1257 root 3160K 1016K sleep 58 0 0:00.00 0.0% lpsched/1388 root 1064K 672K sleep 59 0 0:00.00 0.0% utmpd/13527 root 3696K 1960K sleep 58 0 0:00.00 0.0% syslogd/13224 root 2224K 1432K sleep 48 0 0:00.00 0.0% inetd/1404 informix 143M 129M sleep 59 -10 0:00.12 0.0% oninit/2168 root 4608K 2136K sleep 58 0 0:00.03 0.0% skipd/156 root 2232K 1192K sleep 53 0 0:00.00 0.0% syseventd/9
Total: 117 processes, 586 lwps, load averages: 0.02, 0.03, 0.04

18
NETSTAT – Network Statistics
• Options:usage: netstat [-anv] [-f address_family]
netstat [-g | -p | -s] [-n] [-f address_family] [-P protocol]netstat -mnetstat -i [-I interface] [-an] [-f address_family] [interval]netstat -r [-anv] [-f address_family]netstat -M [-ns] [-f address_family]netstat -D [-I interface] [-f address_family]
• Examplelester@atlas >netstat -iName Mtu Net/Dest Address Ipkts Ierrs Opkts Oerrs Collis Queuehme0 1500 atlas.addt.com atlas.addt.com 92751 0 50571 0 0 0lo0 8232 loopback localhost 80430 0 80430 0 0 0

19
CPU Monitoring
• Are the CPUs overloaded?• Factors:
– Number of CPUs– Speed of CPUs (old vs new systems)– Number of process needing CPU time.

20
How Busy are the CPU’s?
• Tools to monitor:– sar –u– vmstat– mpstat– top, prstat
• Performance Guideline - % CPU busy:– < 30 % - Good– 30-60% - Fair– > 60% - Poor

21
SAR – Example
00:00:00 %usr %sys %wio %idle07:00:00 27 3 0 7007:15:02 61 6 0 3307:30:01 47 4 0 4907:45:01 28 3 0 7008:00:00 30 2 0 6808:15:00 50 3 0 4608:30:01 56 3 0 4108:45:00 22 2 0 77 Good
Poor
Fair

22
How many process are waiting to run on the CPUs?
• Tools to monitor Load Average:– sar –q– Uptime
• Performance Guideline – number of waiting processes:– < 2 per CPU – Good– 2-4 per CPU – Fair– > 4 per CPU – Poor
23
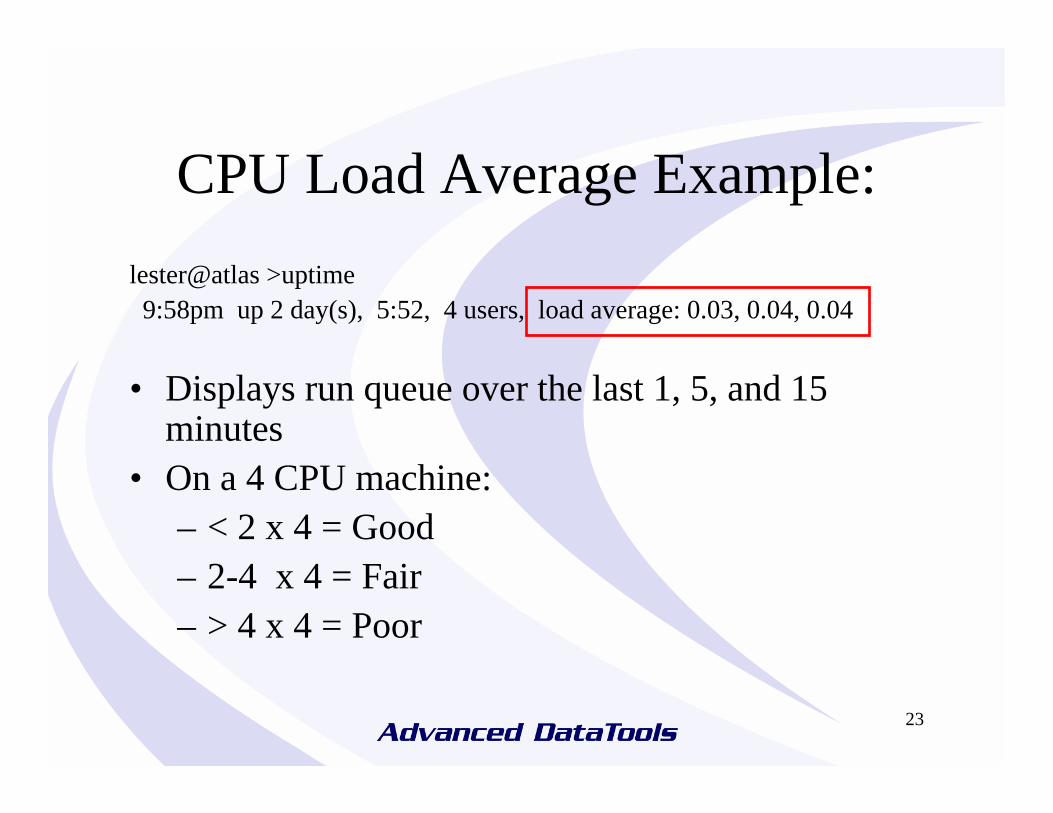
CPU Load Average Example:lester@atlas >uptime9:58pm up 2 day(s), 5:52, 4 users, load average: 0.03, 0.04, 0.04
• Displays run queue over the last 1, 5, and 15 minutes
• On a 4 CPU machine:– < 2 x 4 = Good– 2-4 x 4 = Fair– > 4 x 4 = Poor

24
How many system calls per CPU per second?
• Tools to monitor System Calls:– sar –c– vmstat
• Performance Guideline – number of System Calls per CPU (depends on speed of CPU):– Fast CPU - > 20,000 poor– Medium CPU - > 10,000 poor– Slow CPU - > 2,000 poor

25
System Calls
• Example: sar –c00:00:00 scall/s sread/s swrit/s fork/s exec/s rchar/s wchar/s00:15:00 20606 935 299 2.52 2.06 844574 87166800:30:00 20385 844 243 1.22 0.80 588041 104909400:45:00 16124 1626 812 2.54 1.74 2986193 322228001:00:00 16079 4983 2715 2.90 2.61 1528419 92102901:15:00 8535 1371 478 3.66 3.55 952043 83446301:30:00 12853 3361 535 2.80 2.09 2898274 51551001:45:00 17618 4412 603 1.59 1.37 4723358 441347002:00:01 12697 1544 452 0.67 0.46 2231396 190303802:15:01 13821 2727 572 1.40 1.22 3362608 364403202:30:00 14959 4802 727 1.23 0.94 3710160 293401002:45:00 14583 1581 247 0.71 0.62 1567575 1431916

26
Memory Monitoring• Is memory being over-used or under-used?• Memory shortage causing swapping to disk.• Factors:
– Amount of RAM– 32 bit vs 64 bit OS and applications– 32 bit Informix IDS limited to:
• 3.6 GB on Solaris• 2 GB on AIX• 2 GB on Windows
• One of best Informix IDS performance improvements is adding BUFFERS

27
How much Memory is Used?
• Tools to monitor– top– sar –r– vmstat
• Performance Guidelines– Don’t monitor free memory since a good OS
will use all extra memory as file system cache– Monitor swap space and paging in/outs

28
Memory – Key is to Monitor Paging In/Out
• Monitor vmstat:– pi - kilobytes paged in– po - kilobytes paged out
• Monitor sar –g– pgout/s - page-out requests per second.– ppgout/s - pages paged-out per second.
• Monitor sar –p– pgin/s - page-in requests per second.– ppgin/s - pages paged-in per second.
Out of Memory

29
What Processes are Using the Most Memory?
• Tools to monitor – look at the SIZE column:– top– prstat– ps
• Performance Guideline for Informix:– BUFFERS - number of shared memory buffers– SHMVIRTSIZE - initial virtual shared memory
segment size– SHMADD - size of new shared memory segments– SHMTOTAL – total size of shared memory

30
Monitoring Disks
• Goal is to balance I/O across all disks– Use: sar and iostat
• Find the FAST spot on the disk and locate key chunks there
• Find the optimal disk throughput– Use: pfreadhttp://www.geocities.com/ahammau/informix/pfread.html

31
Disk Throughput
• Example pfread – 2 GB chunks on a 72 GB diskpfread.ksh 1 30 /informixchunks/d4chk14/informixchunks/d4chk14 : 1 concurrent read threads 500 KB/sec./informixchunks/d4chk14 : 2 concurrent read threads 500 KB/sec./informixchunks/d4chk14 : 3 concurrent read threads 750 KB/sec./informixchunks/d4chk14 : 4 concurrent read threads 800 KB/sec./informixchunks/d4chk14 : 5 concurrent read threads 1000 KB/sec./informixchunks/d4chk14 : 6 concurrent read threads 996 KB/sec./informixchunks/d4chk14 : 7 concurrent read threads 1071 KB/sec./informixchunks/d4chk14 : 8 concurrent read threads 1082 KB/sec./informixchunks/d4chk14 : 9 concurrent read threads 1125 KB/sec./informixchunks/d4chk14 : 10 concurrent read threads 500 KB/sec./informixchunks/d4chk14 : 11 concurrent read threads 444 KB/sec./informixchunks/d4chk14 : 12 concurrent read threads 500 KB/sec.
• Best performance is using 9 x 2GB chunks = 18GB of the 72 GB disk

32
Disk Throughput – 36 GB DiskDisk Performance
0100200300400500600700800900
1000
1 3 5 7 9 11 13 15 17
Number of 2GB Chunks Accessed
Performance KB/sec.

33
Disk Layout - The FASTEST location on a disk is where thedisk arm has to move the least to read or write data

34
Monitor Disk I/O with SAR• Report activity for each block device (disk or tape)
– %busy – portion of time device was busy servicing a transfer request – How busy are your disks?
– avque – average number of requests outstanding during that time.– read/s, write/s, blks/s - number of read/write transfers from or to
device, number of bytes transferred in 512-byte units.– avwait - average wait time in milliseconds.– avserv - average service time in milliseconds.
• Example sar –d00:00:00 device %busy avque r+w/s blks/s avwait avserv00:15:00 nfs1 0 0.0 0 0 0.0 0.0
sd7 11 0.7 17 225 0.0 40.2sd7,a 0 0.0 0 0 0.0 0.0sd7,b 0 0.0 0 0 0.0 0.0sd7,c 0 0.0 0 0 0.0 0.0sd7,d 0 0.0 0 0 0.0 0.0sd7,e 11 0.7 17 225 0.0 40.2

35
Map Your Disk Drives
System Bus
Disks
Disks
Disks
Disk Controllers
SWAPRoot Filesystem
ChunkChunk
RootdbsLog DBS
ChunkChunkChunk

36
Create a Disk Layout Spreadsheet
• Controller/ Disk Array• Disk• Logical Volumes or Slices• Chunks, Filesystems, etc…• Tables in Chunks• Compare results from sar -d and onstat -d

37
Disk Performance Spreadsheet
Controller Disk Volume Chunk/Filesystem onstat -d sar -dc1 disk1 d1v1c1 disk1 d1v2c1 disk1 d1v3c1 disk1 d1v4c1 disk2 d2v1c1 disk2 d2v2
Disk Layout PerformanceDisk Performance

38
Monitoring Network
• How measure real output of network interface?– FTP Test – How long does it take to ftp a 2GB
file to your destination? KB per second– Database server cannot send data out any faster
than ftp• Measure network errors and collusions
– Netstat –i

39
Network Errors and Collisions
• Tool to monitor:– netstat –i
• Example output:lester@atlas >netstat -iName Mtu Net/Dest Address Ipkts Ierrs Opkts Oerrs Collis Queuehme0 1500 atlas.addt.com atlas.addt.com 102520 0 51764 0 0 0lo0 8232 loopback localhost 101386 0 101386 0 0 0
• Performance Guideline – no errors or collisions
Check Check

40
Build Your Own Monitoring System
• Provide a baseline of performance information to compare to future problems
• Collect data from:– sysmaster– sar
• Load into a database for review and analysis• Save historical data for future comparisons

41
Data Collection
• Create a cron job to run data collection scripts– Hourly/daily– Weekly– Monthly
• Build a database and load the data

42
Hourly Data Collection
• From sysmaster:lk_sesprof.sql – syssession – User statistics
• From onstat:onstat –g mgm – PDQ statistics
• From Unix:ps –ef – collect user statisticsmpstat 5 5 – collect CPU statistics

43
Daily Data Collection• From sysmaster:
lk_profile.sql – sysprofile – System statisticslk_chkio.sql – syschktab – Chunk I/Olk_dbsfree.sql – sysdbspaces, syschunks – Free spacelk_vpprof.sql – sysvplst – VP statisticslk_tabprof.sql – sysptprof – Table I/O statistics
• From sar:sar –u – CPU statisticssar –b – Buffer statisticssar –c – System callssar –d – Disk I/O statisticssar –q – Run Queue statistics

44
Weekly/Monthly Data Collection
• From sysmaster:lk_tablayout.sql - sysptnext, outer systabnameslk_tabextent.sql - systabnames, sysptnextlk_chkstatus.sql - sysdbspaces, syschunkslk_idsconfig.sql - sysconfig
• Save configuration for future reference

45
Coming Soon – Scripts to Collect Data
• Check: http://www.advancedatatools.com/TechInfo/InformixInfo.html

46
Updated Information
• Scripts and updated presentation at:
www.advancedatatools.com• Washington Area Informix Users group
www.iiug.org/waiug• International Informix Users Group
www.iiug.org