
University of Wisconsin-Madison Institute for Researchon Poverty
66
-:::- University of Wisconsin-Madison Institute for Research on Poverty Discussion Papers Erik Olin Wright Joachim Singelmann THE OF WORK IN AMERICAN CAPITALISM DP #647-81. --- -"--
Transcript of University of Wisconsin-Madison Institute for Researchon Poverty

-:::-
University of Wisconsin-Madison
Institute forResearch onPovertyDiscussion Papers
Erik Olin WrightJoachim Singelmann
THE PROLETARI~~IZATION OFWORK IN AMERICAN CAPITALISM
DP #647-81.
--- -"-- -"----~~----~--"--- ------------~~-----

*The Proletarianization of Work in American Capitalism
Erik Olin WrightDepartment of SociologyUniversity of Wisconsin
Madison, Wisconsin
Joachim SingelmannPopulation Division
United Nations
March 1981
*This paper is a revision of an earlier paper in the Institute forResearch on Poverty Discussion Paper Series, DP-5l9. There were anumber of significant errors in the data calculations in that initialpaper which are corrected here. In addition, the data in the conclusionwere unavailable for the earlier paper. This research was supportedin part by funds granted to the Institute for Research on Poverty at theUniversity of Wisconsin-Madison by the Department of Health and HumanServices pursuant to the provisions of the Economic Opportunity Act of 1964.

, 0
ABSTRACT
This paper attempts to address empirically th~debate between
two opposed images of the transformation of work in contemporary
capitalism. The first, commonly associated with "postindustrial theory",
sees work as becoming more humanized, more autonomous, less routinized;
the second image, associated with Marxist theories of proletarianization,
sees work as becoming more routinized, degraded, with less autonomy and
responsibility. The debate between these two perspectives has largely
been waged at the theoretical level, with at best anecdotal evidence
in sup~o~t of one side or the other. This study uses national data
to make a preliminary assessment of the adequacy of each perspective.
The central analytical strategy is to decompose total changes in the
degree of proletarianization into two components: an industry-shift
effect, which measures the changes in proletarianization due to changes
in the overall sectoral distribution of the labor force across industries,
and a class-composition-shift effect, which measures the changes in
proletarianization due to changes within given sectors. Contrary to
the expectations of postindustrial theory, it is demonstrated that
there is a strong and consistent proletarianization process within
sectors. This proletarianization process is hidden from view because
of the strength of a counteracting process in the industry-shift effect
(i.e., the relatively more rapid expansion of those sectors which were
relatively less proletarianized in the first place). The paper concludes

with a discussion of the likely transformation of the class structure
in the remaining part of the century. The prediction is made that this
counteracting tendency will weaken and thus a clearer process of aggregate
proletarianization should appear in the next decades.

The Proletarianization of Work in American Capitalism
Two radically opposed images have dominated discussions of the
f ' f th 1 b . d d '1' 1trans ormat10ns 0 e a or process 1n a vance cap1ta 1sm. The
first image, typified by the work ,of "postindustrial" theorists such
as Fuchs (1968), Bell (1973), Gartner and Reisman (1974), Richta et al.
(1969) and others, sees the labor process becoming increasingly less
proletarianized, requiring higher and higher proportions of workers
with technical expertise, demanding less mindless routine and more
responsibility and knowledge. For some of these theorists, the central
process underwriting this tendency is the shift from an economy centered
on in~ustrial production to one based on services. Thus, Fuchs (1968)
contrasts industrialization with the service society by arguing that:
Industrialization has alienated the worker from his work,that the individual has no contact with the final fruit ofhis labor and that the transfer from a craft society to oneof mass production has resulted in the loss of personal identification with work • . • [whereas] the direct confrontationbetween consumer and worker that occurs frequently in servicescreates the possibility of a more completely human and satisfactory work experience.
Other theorists have placed greater stress on the emancipatoryeffects
of the technical-scientific revolution within material production itself.
This position has perhaps most eloquently been elaborated by Radovan
Richta and his associates. Automation, Richta argues,
relieves [the worker] of his role as a mere cog in the machinesystem and offers him the position of inspirer, creator, masterof the technological system, able to stand apart from the immediatemanufacturing process . • .
We may assume that the advance of the scientific and technological revolution will first engulf the operative typeof work involving manual machine-minding and later the lesssophisticated regulatory and control activities--in a word,the traditional simple industrial work, insofar as man does

2
not need it and it is enforced by external necessity, or willcut it down to a degree not exceeding people's need for movement. Then, when man stops doing the things that things cando for him, he is offered the prospect of creative activityas the normal occupation through which he can exercise allhis powers--activity imbued with scientific elements, discovery,invention, pioneering and cultivating human powers [Richtaet al. 1969: 112-114].
Although Richta and his associates argue that .such tendencies cannot
reach full realization within the constraints of capitalist social
relations, they nevertheless feel that changes in this direction are
already characteristic of the transformations of work within capitalism
. 2~tself. The result is a trajectory of change that undermines the
material basis of alienation within production by giving workers
progressively greater control over their conditions of work and greater
freedom within work.
The second image of transformations of the labor process is almost
the negative of the first: work is becoming more proletarianized,
technical expertise is being confined to a smaller and smaller proportion
of the labor force, routinization of activity is becoming more and more
pervasive, spreading to technical and even professional occupations,
and responsibilities within work are becoming less meaningful. This
stance is particularly characteristic of Marxist discussions of the
labor process. The argument usually runs something like this: because
the capitalist labor process is a process of exploitation and domination
and not simply a technical process of production, capital is always
faced with the problem of getting workers to work (or, in more technical
terms, of transforming labor power into labor). In the arsenal of

3
strategies of social control available to the capitalist class, one of
the key weapons is the degradation of work, that is, the removal of
skill and discretion from the direct producers. The result is a general
tendency for the proletarianized character of the labor process to be
intensified over time.
This argument has been most clearly laid out in Braverman's Labor
and Monopo1y,Capita1 (1974). Since its publication there has been an
interesting and fruitful debate over various aspects of Braverman's
account, particularly over his tendency to minimize the effectiveness
of workers' resistance to degradation and to ignore various kinds of
countertendencies to the general process of degradation. 3 In spite of
these disagreements over the nuances of Braverman's analysis, however,
there is a general consensus among Marxists about the systematic character
of the tendencies toward intensified proletarianization in advanced
capitalism. Far from undermining the material basis of alienation within
production, the trajectory of changes in the labor process has, if
anything, deepened alienation.
Clearly, the stakes in this debate are considerable at the theoretical,
ideological, and political levels. Theoretically, the two images of the
transformations of work reflect fundamentally different conceptions of
the dynamics of social change. The first account sees change as emanating
from an incremental process of technological change and adaptation; the
second sees change as the result of struggle between antagonistic classes.
At the ideological level, much of the technocratic legitimation
of advanced capitalism revolves around visions of technological liberation

4
and postindustrial humanization. The specific application of this
ideology to the case of work is part of a larger ideological system
in which technology is seen as the solution to social problems and
conflict is seen as irrational and counterproductive.
Finally, at the political level, the specific modalities of Marxist
conceptions of socialist transformation within advanced capitalist
society depend in important ways on the analysis of transformations in
class relations, and the pivotal axis of such transformation is the
problem of proletarianization. While it would be oversimplistic to
claim that a socialist transformation requires ever-increasing levels
of proletarianization, it is certainly the case that the forms of
organization of socialist movements and socialist struggles, and the
nature of the class alliances that would be necessary for a socialist
transformation, depend to a large extent on the proletarianization
process. Lf the postindustrial theorists are correct and advanced
capitalism is witnessing a reverse of the historic process of pro
letarianization, then a fundamental rethinking of socialist strategies
is necessary.
While there has been much energy put into this debate, there has
been remarkably little systematic empirical investigation of the problem.
Most of the debate has been waged through a combination of anecdotal
evidence and formal census statistics. Anecdotal evidence is obviously
inadequate, since within either perspective there is room for counter
examples. Census evidence, as Braverman (1974: 424-449) demonstrates

5
so well in his discussion of the category "semi-skilled," is also almost
useless since the contents of the census categories may themselves change
radically over time. Thus any shift in the population from one census
occupational category to another may be more than compensated for by
changes in the real attributes of the categories themselves. Unless we
know explicitly what real changes are occurring within the census
occupational categories, knowing that a greater proportion of the popu
lation is employed as "clerks" or "technicians" tells us nothing about
the problem of proletarianization.
This paper attempts to present some provisional quantitative data
directly on the problem of proletarianization in ~ontemporary American
society. Our central conclusion is that the data support some of the
main descriptive claims of both Marxist and postindustrial theories,
but that overall they are more consistent with the explanatory logic of
Marxist theory. ~n particular, the data indicate that observed changes
in prolet~rianizatio~ should be understood as the outcome of two processes:
a tendency for positions to be proletarianized within industrial sectors,
and a countertendency for employment to shift from industries that are
relatively highly proletarianized to industries that are relatively less
proletarianized. Until recently, these two. processes have resulted in an
increase of both proletarianized and nonproletarianized positions among
employees in the labor force (at the expense of self-employed positions).
However, and this is the critical punchline of the analysis, there are good reasons

6
to believe that the countertendencies are weakening. It is thus reasonable
to predict that in the decade 1980-1990 we may observe a relative decrease
in unproletarianized employee positions and an increase in proletarianized
positions, i.e., a net proletarianization process.
Those are our basic conclusions. Before we can examine the empirical
material that supports them, it is necessary to define more rigorously
the central concepts and questions that will guide the analysis. In
particular, it is necessary to translate the categories used by the
postindustrial theorists into the same conceptual space used by Marxist
proletarianization theorists. Such a common theoretical terrain is
essential if the two positions are to be operationalized in a way that
makes it possible to assess their relative merits. On the basis of
this common conceptual schema we will then formulate the propositions
of the two theories in terms of a set of empirical expectations about
transformations in the class structure. This will ,be followed by a
discussion of the problems in operationalizing the concepts necessary to
test these divergent expectations, and a presentation of the empirical
results of the investigation.
1. THE CONCEPTUAL SCHEME
Within 11arxist theory, proletarianization is essentially a process
of transformation of the underlying class relations of capitalist societies.
The problem of conceptualizing proletarianization, therefore, is closely
bound up with the problem of conceptualizing the overall class structure

7
of capitalist societies. If that class structure is viewed as a simple,
polarized structure consisting of wage-laborers and capitalists, then
proletarianization is seen as a fairly simpl~ proce~s by which the self-
employed become wage-laborers. On the other hand, if the class structure
is understood as a complex, articulated structure of relations in which
workers and capitalists are defined not by polarization within a one
dimensional class relationship but by a structure of polarizations along
a series of dimensions of class relations, then proletarianization itself
becomes a much more complicated matter.
Since this more complex under'standing of class relations has been
elaborated in detail elsewhere (Wright 1976; 1978a, Chapter 2; 1979a,
Chapters 1 and 2; 1980a,b), we will only 'schematically present it here.4
The specific strategy of decoding the class structure which we will
adopt is based on a distinction between two kinds of locations within a
class structure: basic class locations, and what can be termed contra
dictory locations within class relations. To understand this distinction,
we must first briefly discuss a second kind of distinction: between a
mode of production and a social formation.
A mode of production is defined by a coherent structure of production
relations and forces of production (broadly: technology and other capacities
for the transformation of nature). Concrete societies are always charac
terized by combinations in various ways of different modes of production.5
Even in the United States, the paragon of capitalist societies, the
capitalist mode of production coexists with various kinds of noncapitalist
production relations, in particular simple commodity production (i.e.,

These two classes exist in a relation of perfect polarization.
8
production for the market within which no wage labor is exploited--the
direct producers own and control their immediate means of production).6
The analysis of such concrete combinations of modes of production defines
the social formation.
Now, basic class locations are classes defined within pure modes
of production. In the pure capitalist mode of production there are
only two classes: the bourgeoisie, which controls the flow of resources
into and out of production, controls t.he means of production within
production and controls the labor of others within the labor process,
and the working class, which is excluded from control on each of these
d. . 7:un.ens~ons .
In concrete capitalist social formations, however, the model of a
pure capitalist mode of production is no longer adequate as the basis
for a map of the class structure. In the first place, as mentioned
above, the capitalist mode of production coexists with various kinds
of noncapitalist modes or forms of production. Thus, in American capitalism
we must also include the petty bourgeoisie as a distinctive location in
the class structure (i.e., self-employed producers who own their means
of production and employ no labor of others). Secondly, and in contemporary
capitalism more significantly, there is no longer a perfect polarization
along all of the dimensions of social relations of production that define
the basic classes of the capitalist mode of production. This implies
that certain positions within the class structure may partake of the
relational characteristics of more than one other class. In a sense

9
such positions can be considered simultaneously in two classes. Such
positions will be designated contradictory locations within class relations.
Figure 1 represents the interconnections between the basic class
locations of a capitalist social formation and contradictory locations.
(The spatial metaphor in this figure may be somewhat misleading, since
it suggests that contradictory locations are "between" basic classes
rather than located simultaneously in two classes. Throughout this
discussion it is important not to turn this relational concept into a
gradational one by interpreting the figure too literally.) In many
ways the most important of the contradictory locations illustrated in
this figure are managers and supervisors, the contradictory location
"between" the bourgeoisie and the proletariat. Managers occupy class
locations within which they simultaneously dominate workers and are
dominated by capital. Within the relations of domination/subordination
that define the capitalist mode of production they therefore occupy
both poles of the relationship. Managerial positions are thus simul
taneously bourgeois and proletarian.
Two other contradictory locations are specified in Figure 1. Both
of these are contradictory locations that combine two different structures
of production relations--capitalist production and simple commodity
production. Small employers occupy a contradictory location between the
petty bourgeoisie and the bourgeoisie. Like the petty bourgeoisie they
are direct producers who own their own means of production; like the
bourgeoisie they employ labor power and thus exploit the labor of workers.
Semi-autonomous employees, on the other hand, occupy a contradictory

Capitalist mode ofprodlJGt,on
Simple cort'lm<XlltyprgdlJG lIon
~--------~;=1=-.. l~~~"2~~':~S'_". _: Mana9et'"S and: Petty boIJrgeo<-s.e1I SUpcMfisorS I r----------..~---.J '5emi-olJl.onomousl
- ..'::'O-9!..~~~e.!:s__JProlelariat .
Classes
r- -- -., ContradictOl'"y lOcations'-- - - _.I within class ntlat,OflS
Figure I: The b:lsic c1:lss rcl:ltions of c:lpitalist society.

..
11
location between the petty bourgeoisie and the working class. Like
workers they are wage laborers, dominated by capital (or by state
bureaucratic apparatuses), but like the petty bourgeoisie they have
substantial degrees of real control over' their immediate conditions
of work, over what they produce and how they produce it. A good example
is an engineer or a scientist who, within limits imposed by superiors,
has considerable control over the immediate labor process but is excluded
from any control over the apparatus of production.
Several brief comments on this scheme are necessary to avoid
confusion. First, this is a typology of class structure, not class
formation. That is, it is a strategy for decoding the "empty places"
(Przeworski, 1977) in the class structure, not for specifying the
organized, collective class actors in a particular society. To be
sure, the premise of the analysis of the structure of positions is
that this will facilitate an understanding of the process of class
formation; but the typology itself must not be confused with such an
analysis.
Secondly, as specified in Figure 1, this typology only decodes
the class structure of the economically active labor force. A variety
of locations in the social structure outside of the labor force are
thus ignored: students, children, retired people, housewives, permanently
unemployed, etc. This is not to say that such locations have no class
content, but simply that they are not directly organized within the
structure of the social relations of production. Thus the decoding

12
of the class nature of such positions requires additional theoretical
arguments. For purposes of the analysis of transformations of the class
structure we will limit ourselves to the simpler cases, those positions
directly mapped by production relations,8
Finally, this strategy for decoding the class structure of contemporary
capitalism must be seen as provisional. There are numerous areas of
ambiguity, such as the specification of what is meant by "control over
the immediate labor process" in the definition of the semi-autonomous
location, and it could well happen in the attempt to eliminate such
ambiguities that the basic schema may itself be radically transformed.
Nevertheless, this approach seems to us to be the most developed and
useful map of class structure currently available, and thus we will use
it in this empirical investigation of proletarianization.
2. CONTRASTING EXPECTATIONS OF POSTINDUSTRIAL AND MUL~IST THEORY
Within the framework presented in Figure I, "proletarianization"
designates the complex process by which non-working-class locations are
destroyed or transformed and working-class locations created. The debate
between postindustrial and Marxist conceptions of transformations of the
labor process can then be seen as a set of competing claims about the
relative expansion and contraction of contradictory locations between the
working class and other classes. In general terms, postindustrial theorists
argue that such contradictory locations tend to expand in advanced industrial
societies while the working class tends to contract. Marxist theorists,

,.
13
on the other hand, tend to argue that the semi-autonomous employee class
location will systematically contract, the managerial location will expand
as production becomes more centralized and workers' skills become appropriated
by management, and the working-class location will expand greatly as work
becomes degraded. These expectations are presented in Table 1.
The hypotheses in Table 1 center on overall outcomes for the expansion
and contraction of class locations. The debate between Marxist and
postindustrial theory, however, is as much a debate over the process which
produces these outcomes as it is over the outcomes themselves. To
adjudicate fully between the contending perspectives it would be riecessary
to study directly this process. The data for such an ana.lysis simply
do not exist. Short of that, however, it is possible to disaggregate the
expectations in Table 1 in a way which more closely reflects the differing
accounts of the underlying dynamics at work. We will briefly describe
this strategy of data analysis and then formulate a more refined set
of hypotheses which will more rigorously differentiate between the two
theoretical arguments.
Strategy of Analysis
The strategy for disaggregating the overall expectations of the
theories under consideration involves decomposing aggregate changes in
the class structure into three analytically distinct components: 1. a
component due to changes in the distribution of the population across
economic sectors (referred to as the "industry-shift" component); 2. a

Table 1
Overall Expectations of Marxist and Postindustrial Theories
Locations within theClass Structure
Working class
Semi-autonomous employees
Managers
Marxist Theory
Increase
Decrease
Increase
Postindustrial Theory
Decrease
Increase
Increase

15
component due to changes in the class distribution of the population
within economic sectors (referred to as the "class-shift" component);
3. a component due to simultaneous changes in the distribution of the
population across and within sectors (referred to as an "interaction
shift" component).
The technical details of this strategy are explained in Appendix A.
In less technical terms, perhaps the easiest way of explaining the
strategy is to run through a hypothetical example. Let us suppose that
net of overall labor force population changes, there were one and a half
million more workers in 1970 than in 1960 in the United States. (That
is, after subtracting the number of additional workers that would have
occurred simply from population increase in the labor force, there were
still 1.5 million more workers.) Our task is to decompose this total
net increase of the working class into the three components. This is
done by playing a kind of counter£actual game. The first step is to
ask the following question: How many workers would there have been in
1970 (net of overall population change) if the class structure within
economic sectors had remained unchanged, but the distribution of people
across sectors had changed in the way it actually did? Using these
assumptions, we then add up the expected number of people in each class
in each sector in 1970 and this gives us the expected number of workers,
managers, petty bourgeois, etc., in 1970 as if the only thing that had
changed was the distribution of people across sectors. This would
constitute the industry-shift component for each class. In our example,

16
if the sectors with the lowest concentrations of workers in 1960 happened
to be the sectors which grew the fastest between 1960 and 1970 (e.g.,
education), then there could actually have been a negative industry
shift for workers. Let us say that this negative shift was -300,000
workers. This would mean that net of overall population changes, there
were 300,000 fewer workers in 1970 than in 1960, owing to changes in
the industrial str.ucture, holding the within-sector class distributions
constant.
The second step of the decomposition is to turn the counterfactua1
game on its head and ask: How many workers would there have been in
1970 ~ompared to 1960 if the employment distribution across sectors had
not changed but the class distributions within sectors had changed? This
constitutes the class composition shift for each class. In our example,
if a process of proletarianization occurred within sectors, then the
class composition shift could be quite large and positive for workers
even though those sectors with relatively fewer workers expanded the
most. Let us say that this positive c1ass-composition-shift effect was
1,700,000. This would mean that net of overall changes in the population,
there were 1.7 million more workers in 1970 than in 1960 due to changes
in the class structure within sectors, holding the distribution of the
population across sectors constant.
The interaction-shift effect is mathematically a residual term.
In our example it would be +100,000, since the total of the three
components has to add up to the total net change in workers (1.5 million).

'il
17
Conceptually, the interaction effect represents changes in the class
structure owing to simultaneous movements from one class location within
one sector to another class location in another sector. For example,
in the industrial revolution, one of the pivotal forces changing the
class structure was the simultaneous destruction of petty bourgeois
positions in agriculture and the creation of working-class positions
in manufacturing. This would appear as a large, positive, working
class interaction effect. Since we have no theoretical expectations
about these interaction terms, and since they are quite small in the
data we will be examining compared to the main effects, we will not
give them any systematic discussion, although we will report the results
in our .tables.
This decomposition procedure is performed for each class location.,
The end result is a table in which the industry shift, class ~omposition
shift, interaction shift and total net shift are presented for each
class. This kind of table will be at the heart of the results we will
report. Let us now discuss briefly the expectations implicit in Marxist
and postindustrial theory for each of the cells in this table. 9
Detailed Expectations
Table 2 presents the specific expectations of the two theories
for the industry shifts and class shifts for each of the class categories
we have been discussing. In general only the direction of the expectation
is given, but in a few cases the theories seem to suggest an order of
magnitude as well.

Table 2
Hypothesized Changes in the Class Structure Within Marxist and Postindustrial Theories
Harxist Theory Postindustrial Theory
Class Industry-Shift Class-Composition- Total Industry-Shift Class-Composition TotalLocation Effects Shift Effects Shifts Effects Shift Effects Shifts
Managers/supervisors positive positive positive positive positive positive
Semi-autonomous largeemployees positive negative negative positive positive positive
Workers negative large positive negative negative largepositive negative
Note: No expectations for interaction effects are indicated since neither perspective discusses such effects foradvanced capitalism.

19
\I
1. Small employers and petty bourgeois. Both Marxist and post-
industrial theory would expect an overall decline in both categories
of self-employment, and both theories would predict that there would
be negative industry shifts as well as class shifts. That is, they
would expect that self-employed class locations would decline both
because of the continuing shift of the economy away from those sectors
of production like agriculture within which the petty bourgeoisie is
most concentrated (the negative industry shift) and because of a
continuing destruction of self-employed locations within most sectors
of the economy (the negative class shift). Marxists are more likely
to emphasize the class-shift dynamics, focusing on the ways in which
multinational corporations are systematically entering agricultural
production, fast food restaurants, retail trade and so on, whereas
postindustrial theorists are more likely to emphasize the industry-
shift processes, but the two theoretical perspectives would not differ
in the expected directions of changes in any of cells of the table for
t~ese two classes.
2. Managerial contradictory class location. The two theoretical
perspectives will also generally agree on the detailed expectations for
managers, although for somewhat different reasons. Both will expect
a positive industry shift for managers, but their rationales are likely
to be somewhat different. Marxists will stress the growth of the state
as a source of employment and the tendency for state organizations to
be more heavily bureaucratized than private capitalist organizations.

20
Postindustrial theorists are more likely to emphasize the growth of
services in general and the greater need for personal supervision in
service delivery systems than in manufacturing because of the less
routinized character of the activity.
Similarly in the class shifts for managers, the explanations for
the expected positive shift will differ. Marxists would see the growth
of managerial locations within given industries as the result of two
main processes: First, the increasing concentration and centralization
of capital which results in the greater need for large administrative
10 d d h o. 0 0 f k oIl dapparatuses, ansecon t e cont~nu~ng appropr~at~on 0 s ~ an
control from the direct producers, which requires an expansion of the
agents of social control within production. The dynamics of the
accumulation process and class struggle would thus provide the basic
explanations for the expansion of managerial locations. Postindustrial
theorists, on the other hand, are much more likely to emphasize the
imperatives of technological development. Because production in all
sectors, including services, is based on increasingly sophisticated
technologies ,and communications/informations systems, an increasing
proportion of the labor force has to be involved in the control and
decision-making activities of these technical systems, and this will
tend to increase the proportion of people involved in formal roles of
supervision. Technocratic rationality rather than class conflict would
constitute the basic explanations for increasing concentrations of
managers within different sectors of production.

21
3. Semi-autonomous employee class locations. For the semi-autonomous
employee and working-class locations we come to cases in which the detailed
expectations of Marxist and postindustrial theories differ significantly.
Although both perspectives would expect positive industry-shifts for semi
autonomous employees, for reasons parallel to the expectations for managers,
they would have opposite expectations for the class shifts. Based on
arguments of the degradation of labor, Marxists would expect a systematic
and large decline in semi-autonomous employee locations within given labor
processes. Although it might be the case that the technical qualifications
for various jobs increase, the actual control over the conditions of work
and the activity within work will tend--it is argued--to be eroded as
part of the general strategy of social control by capital (and by man~gers).
Postindustrial theorists, on the other hand, would expect systematic
tendencies for semi-autonomous locations to increase within most sectors
of the economy. As in the case of the positive class shift for managers,
the rationale behind this expectation rests largely on technological
arguments. Sophisticated technologies require less routinization, offer
more possibilities for autonomy and creativity within work, and thus
there should be a relative expansion of nonproletarianized jobs within
the labor process.
As a result of these specific expectations for the decomposed
industry and class shifts, postindustrialists would predict large
positive total shifts for the semi-autonomous employee locations,
whereas Marxists would tend to predict negative shifts.

22
4. Working class. The expectations for the working class are the
inverse of the expectations for the semi-autonomous employee category.
Postindustrial theorists expect systematic deprolet~rianization to occur,
both because of shifts of the population out of the most proletarianized
sectors of the economy (heavy industry especially) and because of tech
nological changes within all sectors. Marxists, on the other hand,
expect the process of degradation of labor to more than counteract
whatever tendencies might exist for the less proletarianized sectors
to grow more rapidly than the more proletarianized ones. A net expansion
of the working class is thus expected.
These hypotheses, it must be emphasized, do not directly tap the
differing theoretical arguments of the underlying processes at work.
By themselves they cannot provide an adequate basis for adjudicating
between accounts of the labor process based on a logic of class struggle
and accounts rooted in arguments of technological determinism. But
they will provide suggestive support for one or the other view, since
in the case of certain specific cells of the table, the two contending
theoretical perspectives would generate opposing empirical expectations.
3. VARIABLES AND DATA
The two central variables in this research are economic sectors
and class structure. All of the statistical analyses in this study
are based on a 37-sector division of the economic structure. This is
a fairly refined disaggregation of the total economic structure, and

23
certainly goes far beyond any simple classification of sectors as
primary, secondary, and tertiary. These 37 sectors have then been
reaggregated into seven more general categories: ~~tractive, trans-
formative, distributive services, business services, professional. 11
services, state-dominated social services, and personal services.
These 37 sectors are listed in Table 3. (All of the calculations used
to decompose changes in the class structure are based on the 37-sector
disaggregation, so the specific manner in which these have been reaggregated
in Table 3 will not affect the results.)
The class structure variable is particularly problematic to
measure adequately, given available data sources. Census data simply
will not do by themselves, since the census is gathered in occupational
rather than class terms, and no simple collapsing of occupational titles
d ' I' . f M '1 . 12can generate an a equate operat~ona ~zat~on 0 arx~st c ass categor~es.
Unfortunately, relatively few social surveys have asked the necessary
kinds of questions to operationalize classes in a rigorous manner. The
data which we have used in this study are derived from a social survey
which does permit some fairly rough estimates of class structure, but
the questions are not· really adequate for a precise operationalization.
Table 4 presents the operational criteria which we have used to
define each class. Since the problems with these operationalizations
have been discussed in some detail elsewhere (Wright 1980b: 183-185),
we will not dwell on them here. There are two main points to note: the
criterion for being a manager is extremely broad, and undoubtedly includes

Table 3
Percentage Distribution of the U.S. Labor Force by Industry Sectorsand Intermediate Industry Groups, 1940-1970
Sectors and Industries 1940 1950 1960 1970
1. EXTRACTIVE 21.3 14.4 8.1 4.51) Agriculture 19.2 12.7 7.0 3:72) Mining 2.1 1.7 1.1 0.8
II. TRANSFORMATIVE 29.8 33.9 35.9 33.13) Construction ---z;:=j """6:2 -W ---s:s4) Food 2.7 2.7 3.1 2.05) Textile 2.6 2.2 3.3 3.06) Metal 2.9 3.6 3.9 3.37) Machinery 2.4 3.7 7.5 8.38) Chemical 1.5 1.7 1.8 1.69) Miscellaneous manufacturing 11.8 12.3 8.7 7.7
10) Utilities 1.2 1.4 1.4 1.4
III. DISTRIBUTIVE SERVICES 20.3 22.4 21.9 ~11) Transportation L;:9 5:3" 4.4 3.912) Communication 0.9 1.2 1.3 1.513) Wholesale 2.7 3.5 3.6 4.114) Retail 11.8 12.3 12.5 12.8
IV. BUSINESS SERVICES 4.7 4.4 6.1 8.015) Banking 1.1 1.1 T:6 2.616) Insurance 1.2 1.4 1.7 1.817) Real estate 1.1 1.0 1.0 1.018) Engineering 0.2 0.3 0.419) Accounting 0.2 0.3 0.420) Miscellaneous business services 1.3a 0.6 1.2 1.8
V. PROFESSIONAL SERVICES N.A. 1.5 1.9 2.721) Legal services N.A. 0.4 0.5 0.522) Medical services N.A. 1.1 1.4 2.2
VI. STATE-SUPPORTED SOCIAL SERVICES ~ 11.3 14.9 19.823) Hospitals 2.3 1:8 2:7 T724) Education 3.5 3.8 5.4 8.625) Welfare 0.9 0.7 1.0 1.226) Nonprofit 0.9 0.3 0.4 0.4
·27) Postal services 0.7 0.8 0.9 1.028) Government 2.6 3.7 4.3 4.629) Miscellaneous social services 0.1 0.2 0.3
VII. PERSONAL SERVICES 14.0 12.7 11.3 10.030) Domestic services 5:3 3.2 3.1 L731) Hotels 1.3 1.0 1.0 1.032) Eating and drinking 2.5 3.0 2.9 3.333) Repair 1.5 1.7 1.4 1.334) Laundry 1.0 1.2 1.0 0.835) Barber and beauty shop 0.8 0.936) Entertainment 0.9 1.0 0.8 0.837) Miscellaneous personal services -l.:.L ..1.:L -9.:..L ~
TOTAL LABOR FORCE 100 100 100 100
Source: Modified from Browning and Singelmann. 1975.
Note: Percentages may not add to 100% because of rounding.
aIncludes legal, engineering and accounting services.
bIncludes medical services.

Table 4
Operational Criteria for Class Locations
1Employers
Petty bourgeoisie
Managers/supervisors
Workers
Self- HaveEmployed Employees
yes yes
yes no
no no
no no
Have 2Subordinates
yes
no
Job Characterizedby "Lot" of Freedom and Decisions
no
Semi-autonomousemployees no no no yes
ISince 80% of all employers in the sample employed fewer than 10 workers, it was not
possible to study a proper capitalist class location. Throughout most of the analysiswhich follows, therefore, I will treat all employers as occupying a contradictory locationbetween the petty bourgeoisie and the capitalist class.
2AII teachers were classified as nonsupervisors regardless of their response to thiscriterion, since many teachers appear to have interpreted the question about supervisionin the survey as referring to students.
3Jobs which the respondent claims are characterized "lot" by both of the followingdescriptions:
(a) "a job that allows a lot of freedom as to how you do your work"(b) "a job that allows you to make a lot of decisions on your own"

26
many nominal supervisors who probably should be classified as workers
or semi-autonomous employees; and (2) the criterion for being a semi
autonomous employee relies heavily on relatively subjective assessments
by respondents of job characteristics. The net effect of these measure
ment problems is that our estimates of the size of both the managerial
and semi-autonomous employee contradictory ~lass locations are probably
somewhat inflated. Thus our estimates of the working class should
probably be considered minimum estimates.
It is of course possible that these problems of adequately opera
tionalizing class could undermine the meaningfulness of the results
which we will report. Our feeling, however, is that the results are
sufficiently striking and so consistent with our general theoretical
expectations that they cannot be simply dismissed as artifacts of these
difficulties. If anything, one might expect such weak measures of
class to scramble the results rather than to strengthen them. In any
event, these are the best data available, and thus for the moment this
operationalization will have to suffice.
Two quite different data s,ources were used in this research: the
Survey of Working Conditions (SWC) carried out by the Survey Research
Center at the University of Michigan in 1969, and the United States
censuses of 1960 and 1970. The SWC contained the questions presented
in Table 4 and provided the basis for operationalization of the class
structure. But the SWC data were available for only one point in time
while the questions we were attempting to answer all concerned structural

27
change over time. The census, of course, contains a great deal of
information gathered at two points of time, but lacks the necessary
questions to operationalize class. The problem, then, was to devise
a strategy for combining these two sets of data so that we could make
reasonable estimates of the class structure in 1960 and 1970. This
estimation procedure is described in detail in Appendix B, and more
briefly below.
Estimating the class structure in 1960 and 1970. On the basis
of the SWC data we were able to construct a three-way table of class-by
occupation-by-economic sector. This meanS that we had estimates of the
class distribution within occupations for each of the 37 economic sectors.
For the 1960 and 1970 censuses we then constructed two-way tables of
occupation-by-economic sector. The procedure was then to use the SWC
table as the basis for apportioning the people within the cells of the
census occupation-by-sector tables into classes. Thus, for example,
if 70% of all craftsmen in the construction industry were workers in
the SWC table, we allocated 70% of the individuals in the corresponding
cells of the 1960 and 1970 census tables into the working class. In
effect we are reallocating people within each of the 37 sectors from
occupational categories~ into class categories on the basis of the
empirical class distributions within occupations in the SWC data. This
procedure enabled us to construct an imputed class distribution within
each economic sector for 1960 and 1970, and by aggregating these
distributions, an overall imputed class distribution for the entire
labor force for the two years.

28
This procedure involves an assumption which, according to the theory
advanced in this paper, is probably incorrect, namely that the class distri
butions within occupations (within economic sectors) remained unchanged
during the decade, and thus such a distribution in 1969 could be used to
estimate the class structure from census data for 1960. If it is the case
that proletarianization occurred within specific occupations, then this
assumption would be wrong. The result would be that we would have under
estimated the working class for 1960, since the distribution used for the
estimates came from the end of the decade (i.e., after a relative proletariani
zation of the 1960 occupational categories had occurred). This means that
our estimates will tend to minimize the possible .expansion of the working
class over the decade. Since this bias works against the basic thrust of
the theoretical arguments we have advanced we feel that the data can still
serve as a provis~onal basis for testing our hypotheses. (See Appendix C
for a discussion of possible biases.)
Because of these problems in estimating the class structure, we felt
that it was not feasible to carry the analysis back in time to the 1950
census. Whatever distortions occurred in imputing the class structure
to 1960 would have been greatly exaggerated for earlier periods. As a
result, the empirical analysis of structural transformations in this research
will be limited to a single decade, 1960-1970.
RESULTS
Before discussing the results of the detailed decomposition of changes
in the class structure it will be instructive to look at the overall changes.

29
These are presented in Table 5. Probably the most striking feature of this
table is the relatively small magnitude of the changes. While some change
did occur--both categories of the self-employed declined, managerial loca
tions expanded the most followed by working-class locations, while semi
autonomous class locations expanded only slightly--the essential shape of
the class structure did not change greatly over the decade. If the analysis
were to stop here, one would probably conclude that there was not much of
interest to explain and the results could hardly bear the burden of entering
the fray of a significant theoretical debate. When we examine the decompo
sition of these changes, however, quite a different story can be told.
Table 6 presents the basic decomposition of changes in the class
structure into the industry-shift component, the class composition-shift
component and the interaction component. Table 7 presents these same
results as percentages of the number of people in each class in 1960.
Before discussing these results a word is needed on how to read th~
tables. The sum of the entries in any column of Table 6 equals zero. Since
each of the entries is net of total population change, the sum of such
shifts must be zero. The sum of the first three entries in any row equals
the fourth entry in the row since the first three entries represent a decom
position of the fourth entry (total net change). Specific entries should
be interpreted in the following way: the employer industry shift of
-331,290 means that net of any changes due to overall population change,
there were this many fewer employers in 1970 than in 1960 because of
changes in the overall industrial structure; the working class class
composition shift of +1,696,402 means that net of population change,
~--- - ~---- ----~--------- ---

Table 5
Changes in the American Class Structure, 1960-1970
1960 1970 1960 1970
Small employers 4,111,014 3,087,226 6.6% 4.4%
Petty bourgeoisie 3,753,212 2,859,979 6.1% 3.7%
Managers 20,293,995 27,291,760 32.7 35.6
Semi-autonomousemployees 6,794,122 8,475,457 10.95 11.05
Workers 27,081,959 34,954,862 43.65 45.6
Total 62,034,302 76,669,284 100% 100%
Note: See Table 4 for operationalizations of class.
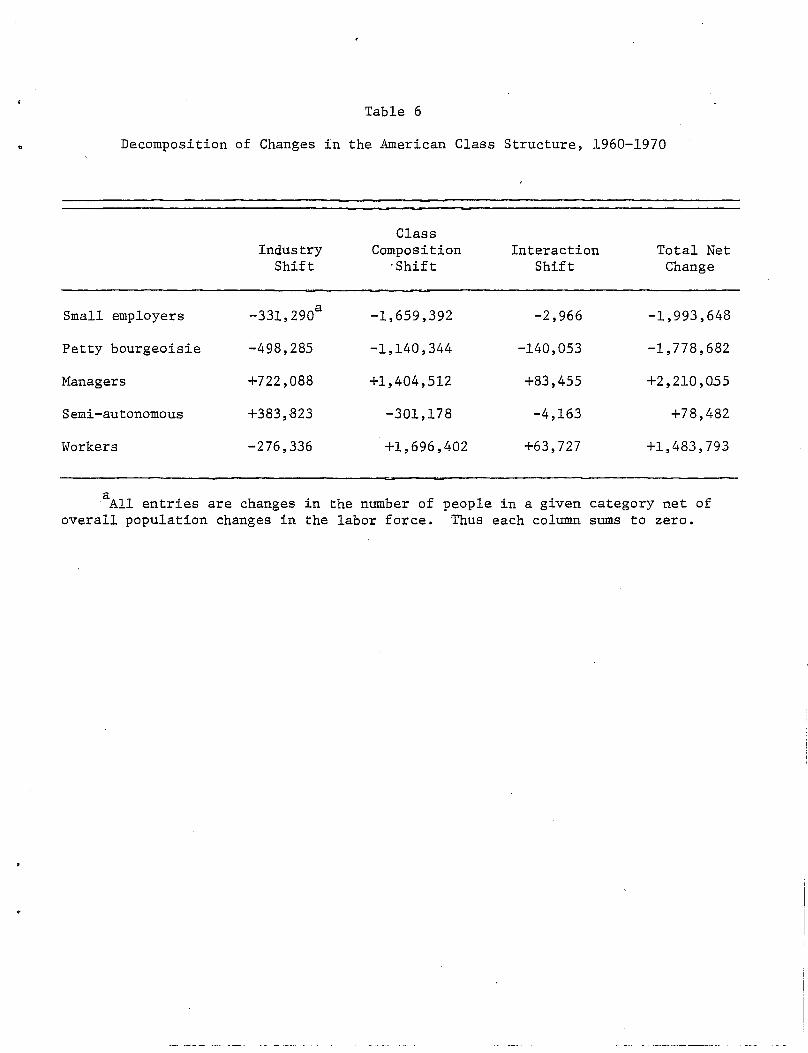
Table 6
Decomposition of Changes in the American Class Structure, 1960-1970
ClassIndustry Composition Interaction Total Net
Shift 'Shift Shift Change
Small employers -331,290a
-1,659,392 -2,966 -1,993,648
Petty bourgeoisie -498,285 -1,140,344 -140,053 -1,778,682
Managers +722,088 +1,404,512 +83,455 +2,210,055
Semi-autonomous +383,823 -301,178 -4,163 +78,482
Workers -276,336 +1,696,402 +63,727 +1,483,793
aA11 entries are changes in the number of people in a given category net ofoverall population changes in the labor force. Thus each column sums to zero.

Table 7
Decomposition of Changes in the American Class Structureas Percentages of 1960 Class Populations
ClassIndustry Composition Interaction Total Net
Shift Shift Shift Change
Small employers _8.l%a -40.4% -.07% -48.5%
Petty bourgeoisie -13.3 -30.4 -3.7 -47.4
Managers +3.6 +6.9 +0.4 +10.9
Semi-autonomous +5.6 -4.4 -.06 +1.3
Workers -1.0 +6.3 +0.2 +5.5
aAll entries are net shifts as a percentage of the 1960 population figures forthe class.
33
there were this many more workers in 1970 due to changes in the class structures
within industries.
In Table 7 the entries in Table 6 have been divided by the 1960
populations of the relevant class categories. The entry of -8.1% for
the employer industry shift thus indicates that net of population changes,
the employer category declined by 8.1% between 1960 and 1970 due to changes
in the industrial structure. The results in Table 7 are thus made relative
to the size of the classes involved.
Now let us examine the results themselves. The results for both
categories of self-employed (small employers and petty bourgeoisie) are
very much as both Marxist and postindustrial theories would expect. Small
employers and the petty bourgeoisie were decimated in the 1960s, both because
of changes in the industrial structure which undermined those sectors within
which these classes were most concentrated, and because of the continuing
process of the destruction of small businesses within most sectors of the
13economy. In a limited way one might want to argue that the fact that the
class shifts are considerably larger than the industry shifts for these two
classes is suggested more by Marxist theory than by postindustrial theory.
In terms of the destruction of small businesses Marxists are more likely
to emphasize the effects of strategies of capital accumulation within
sectors than overall shifts in the industrial structure. 14 However, since
the theoretical predictions in these terms are relatively weak, it seems
more appropriate at this point to see the results as consistent with both
perspectives.

34
The results for the managerial class location are also basically in
line with both theoretical expectations: the managerial location expanded
greatly, owing to changes in the industrial structure and to the expansion
of managerial positions within sectors. The magnitude of the class compo
sition shift, however, is somewhat more consistent with the postindustrial
framework. While Marxists would generally expect an increase in managerial
positions within given industries, the arguments about concentration and
centralization of capital and social control would not suggest such a large
increase in managerial positions attributable to the class composition shift.
These results, therefore, may indicate that at least part of the expansion
of such positions is bound up with the technological changes emphasized
by postindustrial theorists. However, as in the arguments about relative
magnitudes of different shifts for the self-employed, the theoretical
expectations about the relative size of these shifts are relatively under
developed, and thus it is probably safest to see these results as largely
supportive of both theoretical stances.
By far the most interesting results in Tables 6 and 7 occur for the
semi-autonomous employee and working class locations. For these classes
the data are clearly more consistent with the arguments of Marxist theory
than those of postindustrial theory. In the case of semi-autonomous
employees, the industry shift and class shifts are almost of equal magni
tudes but in opposite directions: the change in the overall industrial
structure in the 1960s produced an expansion of this class location by
just under 385,000 positions (an increase of 5.6%) whereas the change

35
in the class structure within industries generated a contraction of just over
300,000 (4.4%). The net result was a modest increase of semi-autonomous
employees of about 80,000 positions between 1960 and 1970. For the working
class, on the other hand, the industry shift produced a decline of just over
275,000 positions (1.0%) while the class composition shift produced an
expansion of nearly 1.7 million (6.3%). Overall, as a result, the working
class expanded by just under 1.S million positions during the decade.
These results are directly contrary to the expectations of post-
industrial theory. The process of proletarianization within given
sectors was large and consistent. This resulted in a substantial expansion
of the working class in the decade, and it largely neutralized the effects
of changes in the industrial structure for the expansion of the semi-
autonomous employee category. Although there was a net expansion of semi-
autonomous locations, as predicted by postindustrial theory and contrary
to the expectations of most Marxist accounts, nevertheless the decomposition
of this net shift is more consistent with the pattern expected within,
Marxist theory.
All of the above results are based on a decomposition of changes in
the overall class structure of the United States. It could be objected that
this is not the most appropriate decomposition for a comparison of the core
expectations of postindustrial and Marxist theories of the labor process,
since those theories are largely focused on changes in wage-earner positions
rather than all positions in the class structure. This objection would
suggest that the decline of self-employed positions (small employers and
-----_. ---------- ----

36
petty bourgeois) should be treated as a kind of exogenous source of labor
supply similar to the entry of housewives into the wage-labor force. In
this line of reasoning, the statistical decomposition of industry shifts
and class-composition shifts should be restricted to the three categories
of wage-earners: managers, semi-autonomous employees and workers. The
results of this alternative strategy are presented in Table 8.
The pattern of net shifts is significantly different in this table,
as would be expected: only managers showed a positive net expansion during
the decade; there was a relative decline of both workers and semi-autonomous
employees. The basic pattern for the decomposition of shifts, however,
remains essentially the same: on the one hand, there was a large negative
industry shift for workers and positive industry shifts for managers and
semi-autonomous employees; on the other, there was a large negative class
composition shift for semi-autonomous employees but a positive shift for
workers and managers. Thus, even if the statistical analysis is restricted
to wage-earners only, the basic structure of the findings is still more
consistent with the general expectations of Marxist theory.
CONCLUSIONS
The data presented in Table 6 do not directly provide a definitive
basis for adjudicating the theoretical debate between Marxist and post
industrial theories. On the one hand, the data do not explicitly tap
the process of transformation as such but only its effects, whereas the
heart of the theoretical debate centers on contending views of the dynamics

Table 8
Decomposition of Changes in Categories of Wage-earners Only, 1960-1970
. ClassIndustry Composition Interaction Total Net
Shift Shift Shift Change
Managers +431,92~a +334,901 +29,983 +796,809(2.1%) (1.7%) (.1%) (3.9%)
Semi-autonomous +326,656 -635,715 -85,592 -394,651employees (4.8%) (-9.4%) (1. 3%) (-5.8%)
Workers -758,581 +300,814 +55,609 -402,158(-2.8%) (+1.1%) (.2%) (-1. 5%)
aA1l entries are changes in the number of people in a given category net ofoverall changes in the population of the wage-labor force (not the total laborforce). Thus each column sums to zero.
bE .. h h h' f d f h 1960ntr~es ~n parent eses are t e s ~ ts expresse as a percentage 0 t epopulation in the particular category.
....._--_.~--_.. _- -~ .~------

38
of social change. On the other hand, like any robust paradigm, post
industrial theory is sufficiently flexible that it can provide post
hoc interpretations of the data in Table 6 consistent with its overall
theoretical framework. The decline of semi-autonomous employees due
to the class composition shift·could be explained, for example, as
the result of a new unity of autonomy and responsibility in advanced
technologies in which managerial locations replace nonmanagerial semi
autonomous locations. Rather than constituting a process of the degra
dation of semi-autonomous class locations, such locations are being
integrated into the authority structure of postindustrial society. At
most, therefore, the results reported in this paper provide only
suggestive support for the Marxist stance in the debate.
Nevertheless, those suggestions are striking: Within given economic
sectors, there was a systematic tendency for those positions with
relatively little control over their labor processes to expand during
the 1960s and for those positions with high levels of autonomy to decline.
This does not imply, of course, that there were no examples of tech-
nological change in specific labor processes which may have enlarged
the scope of autonomy and self-direction within work. But such changes
appear to have been the exception rather than the rule during the decade.
Contrary to the arguments of most postindustrial theorists, therefore,
a continuing process of proletarianization does characterize advanced
capitalism.
The data reported in this study span only a single decade. Both
Marxist and postindustrial theories, however, base their arguments on a

39
much broader time frame. It is entirely possible that the specific
patterns observed in our results are consequences of paculiarities of
the 1960s. It is important, therefore, to attempt at least some specu
lative judgements about the likely trajectory of these transformations
into the future.
In terms of the strategy of analysis presented in Table 6, the
attempt at forecasting future developments amounts to generating a set
of expectations about the changes in the relative magnitudes of the class
and industry shifts for each of the cells in the table. In order to
do this in a reasonable way, it is necessary to perform one further
disaggregation of the data on structural changes. Table 9 disaggregates
the class composition and industry shifts for each of the class categories
into the specific contributions from each of the seven broad economic
sectors. Thus, for example, the table indicates that out of a total
positive industry shift of 383,824 for the semi-autonomous employees,
95,753 can be attributed to the growth of distributive services, 644,596
to the growth of state-dominated services, -226,126 to the decline
of transformative production, and so on. This table can help us assess
the likely impact of future changes in the industrial structure on the
class and industry shifts we have been discussing.
The most striking entry in Table 9 is the tremendous importance of
the growth in the state for the expansion of the semi-autonomous class
location in the 1960s. While the state also contributed to the expansion
of working-class and managerial positions, it had a much larger

Table 9
Disaggregation of Industry Shifts and Class Composition Shiftsinto Contributions by General Economic Sectors
Distribution Producer Professional State PersonalTOTALE
CLASS CATEGORY ExtractiveaTransformative Services Services Services Services Services
Employers
Industry shifth -508,705 (-12.4%)d -49,666 (-1.2) 93,145 (2.3) 33,285 (0.8) 89,202 (2.2) 2,187 (0.1) 9,294 (0.2) -331,287Class shiftC -170,172 (-4.1) -329,463 (-8.0) -755,599 (-18.4) -70,380 (-1. 7) _-84,842 (-2.1) -1,107 (0) -247,826 (-6.0) -1,659,393
Petty bourgeoisie
Industry Shift -1.004.671 (-26.8) -12,649 (-0.3) 8,735 (0.2) 230,179 (6.1) 134,785 (3.6) 57,487 (1.5) 82,346 (2.2) -498,288Class shift -256,770 (-6.8) -180,814 (-4.8) -112,076 (-3.0) -156,795 (-4.2) -164,289 (-4.4) -49,765 (-1.3) -220,088 (-5.9) -1,140,344
Managers
Industry shift -457,407 (-2.2) -716,217 (-3.5) 243,527 (1.2) 761,090 (3.8) 190,309 (0.9) 973,720 (4.8) -273,435 (-1.3) 722,093Class shift 277,524 (+1.4) 359,695 (1.8) 204,484 (1. 0) 31,855 (0.2) 189.145 (0.9) 254,471 (1.2)' 81,877 (0.4) 1,404,514
Semi-autonomous
Industry shift -70,684 (-1.0) -226,126 (-3.3) 95,753 (1.4) 124,986 (1. 8) 40,457 (0.6) 644,596 (9.5) -225,164 (-3.3) 383,824Class shift -8,649 (-0.1) -179,108 (-2.6) 71,530 (1.1) 458 (0.0) -7,189 (-0.1) -182,423 (-2.7) 4,203 (0.1) -301,177
Workers
Industry shift -664,730 (-2.5) -1,293,877 (-4.8) 273.025 (1.0) 758,480 (2.8) 135.375 (0.5) 1,249,649 (4.6) -735,266 (-2.7) -276,334Class shift 158,068 (+0.6) 379,695 (1.2) 586,201 (2.2) 194,859 (0.7) 67,947 (0.2) -21,177 (-.1) +381,585 (1. 4) 1,696,404
a .See Table 3 for classification of industrial sectors into these seven general headings.
bEntries represent the contributions of specific sectors to the total industry-shift for each class.
CEntries represent the contributions of specific sectors to the total class-shift for each class.
dThe figures in parentheses represent the change as a percentage of the 1960 population for each class category. The entry of -12.4% for theemployer industry shift in the extractive sector thus indicates that in the employer class category a net decline of 12.4% was attributable tothe contribution of the extractive sector to the total industry shift for employers.
e Th . i h II IIe entr1es n t e total column correspond to the entries in Table 6 (slight differences are due to rounding).

41
relative impact on the semi-autonomous employee locations. As a pro-
portion of the 1960 population in each class location, the expansion
of state-dominated services generated a 9.5% increase in semi-autonomous
employee locations but only a 4.8% and 4.6% increase in manager and
working-class locations, respectively. On the other hand, the decline
of the transformative sector has had the greatest relative negative
impact on the working class: the number of workers declined by 4.8%
as a result of the decline of transformative industries, whereas manager
and semi-autonomous employee positions declined by only 3.5% and 3.3%
. 1 15respect~ve y.
The question then becomes: what are the likely future trends for
the growth of the state and the decline of transformative industries?
Until the early 1970s there was a general tendency for the state sector
to expand and the transformative sector to decline. Since the mid-
1970s, however, there has been a slight decline in the relative employ-
ment of the state sector, and at least a levelling off in the decline
of the trans formative sector. In 1947, approximately 9.6% of the
civilian labor force was employed directly by government (federal,
state and local combined).16 This figure increased steadily until
1975 when it reached a peak of 17.3%. In the following four years
this figure declined every year, reaching 16.4% in 1979 (the most recent
date for which annual figures are available).17 In the transformative
sector, on the other hand, the peak employment was reached in 1953,
with 34.5% of the employed civilian labor force being employees in

42
transformative industries. With some fluctuations up and down, this
figure declined until 1975 when it reached 26.7%. In the four years
after that the figure has risen slightly each year, reaching 27.3% in
1979.
Are these recent trends likely to persist into the future? Given
the fiscal crisis of the state, the general retrenchment of state programs,
the tax revolt and the call for restraints on state employment by virtually
all major political figures in the United States, it seems likely that
the stagnation and decline in state employment observed in the period
after 1975 will continue into the 1980s and probably beyond. And it
certainly seems quite implausible that we will witness a renewal of
the expansion of state employment characteristic of the 1950s and 1960s
at any time in the foreseeable future.
The fate of the transformative sector is less clear. The movement
of industrial production beyond the borders of the United States may in
fact accelerate in the years to come and thus initiate a further decline
of this sector. However, the political discussions concerning the "re-
industrialization" of America suggest that state policies may be introduced
to counter this tendency for industry to move abroad. If this were to
occur ~t would signal a stabilization of the transformative sector,
and perhaps even a modest expansion.
If these expectations are borne out, it will mean that the negative
industry shift for workers should be reduced in the 1980s, perhaps even
becoming positive if a genuine reindustrialization process should occur.I
The positive industry shift for semi-autonomous employees, on the other

'.
,>
43
hand, should be drastically reduced as the expansion of the state is
halted. Indeed, if state employment were to continue actually to decline
proportionately, we might even witness a negative industry shift for
semi-autonomous employees.
There is less that can be confidently said about likely class
composition shifts. To the extent that capital faces a general stag
nation and crisis of accumulation, it might be expected that there
would be attempts at rationalizing the managerial structure and increasing
the pressures for proletarianization within the labor process. This
could lead to a thinning out of managerial ranks and an increase in the
degradation of semi-autonomous employee locations. Under pressures of
fiscal constraint in the state, we might also expect to see such,
tendencies in state-dominated social services as well, resulting in
a rationalization of state administration and a slowing down in the
proportional growth of managers within the state sector.
There are very little data available which bear on these expectations,
but some very rough indications can be derived from data gathered by
Richard Sobel. 18 Sobel examined a series of social surveys, conducted
in the 1970s, within which questions about being a supervisor were
included. While there are only four data points in his analysis--1970,
1973, 1976, and 1977--they indicate a steady decline in the proportion
of the labor force occupying supervisory positions: from 36.1% in 1970,
to 34.1% in 1973, 31.4% in 1976 and 31.1% in 1977. Because of differences
in sampling designs and the precise form of the questions asked, these
44
data cannot be taken as a strong demonstration of the decline of managerial
locations in the 1970s, but they may at least indicate that the powerful
class composition shift for managers which underwrote their relative
expansion in the 1960s has been significantly reduced.
Taken together, these expectations suggest that the rest of the
century is likely to be characterized by a continuing and perhaps in
tensifying process of proletarianization. The specific balance between
tendencies and counter tendencies mapped,out in Table 6 should therefore
not be seen as immutable, but rather as an historically specific conse
quence of the character of American capitalism in the 1960s. As conditions
of accumulation change, the balance between these opposing tendencies
is likely to change as well. Any serious discussion of transformations
of the labor process, proletarianization, class structure, and similar
problems must attempt to unravel the complexity of these opposing
trajectories of change. On the basis of the most informed speculation
we can make with the available data, it seems likely that in the next
several decades the net result of these trajectories will be an expansion
of the working class, a systematic decline of semi-autonomous employee
positions and a stagnation (and perhaps gradual decline) of managerial
positions. If this turns out to be the case, it will directly contradict
the central thrust of postindustrial theory.

45
. NOTES
lwe will use the term "labor process" to designate the totality
of technical and social aspects of the activity of·~ork.
2It should be noted that Richta and his associates, like most of
the more sophisticated theorists sharing this general position, explicitly
discuss the countertendencies to this process of technological emanci
pation. However, they unambiguously insist that the emancipatory side
of the process is the dominant one in the present era.
3For general Marxist discussions of Braverman's thesis, some of
which are fairly critical of the simple, unilinear story he tells, see
Burawoy (1978, 1979), Friedman (1978), Edwards (1979).
4All Marxists may agree that classes are, in the first instance,
defined within the social relations of production, but there is no
consensus at all about how to define the social relations of production
in capitalist society or about the logic by which those relations
actually determine the class structure. It is important to remember,
therefore, that what follows is not the Marxist theory of class
structure, but one contending Marxist account within an ongoing debate.
For a detailed discussion of the alternative Marxist treatments of
class and class structure, see Wright (1980a). For views which differ
from the one advanced in this paper, see Carchedi (1977), Crompton and
Gubbay (1978), Poulantzas (1975).
5For an analysis of the meaning of combinations of modes of production
in social formations, see Wright (1979b).

46
6Strictly speaking, simple commodity production is not a mode of
~~~~~~~~'---;C~~~-----C---'-~~-"------::----'~-;:-'-~~,",,~~~~--;;-~-'----- ~~'---:-~~~---~~
production but a form of production. The concept of mode of production
is usually restricted to those forms of social organization of production
which are capable of becoming the organizing principle of an entire
society (i.e., becoming the dominant mode of production in a social
formation). Simple commodity production has never been a dominant
structure of production, and there are good theoretical reasons to suspect
that it could not become a dominant mode of production. Thus, in most
Marxist discussions, it is not referred to as a "mode" of production.
7The term "control" is being used as a convenient expression for
the social relations of domination/subordination. Control is not an
attribute of a position but rather a way of characterizing the relation
ship between positions.
8For discussions of how such positions not directly in the labor
force can be analyzed in class terms, see Wright (1979a, pp. 53-54;
1978b; 1980a).
9Neither Marxist nor postindustrial theorists formalize their
conceptions of transformations of the class structure precisely in
terms of the schema of class relations presented in Table 1 or in terms
of the decomposition strategy presented above. The following discussion
relies on drawing out the hypotheses which are implicit in the overall
arguments of each of these theoretical traditions.
lOIn the most recent period of American capitalist development, it
would be expected that the expansion of the productive facilities of

47
multinational corporations in the third world will further intensify
the concentration of managerial locations within the American class
structure. In effect, the global accumulation process in the 1960s
and 1970s has disproportionately increased proletarian class locations
outside of the boundaries of the United States, and it would thus be
expected that managerial-administrative locations within the United
States would tend to expand disproportionately, producing a positive
class shift.
IlThis classification of economic sectors is a slight modification
of the typology developed by Browning and Singelmann (1978). A number
of comments on the typology are necessary. First, the rubric "business
servtces" was referred to as "producer services" in earlier publications.
We have changed the label in order to emphasize the specific role of
these services in servicing capitalist business organizations, rather
than "production" abstracted from its capitalist context. Second, we
have formed a separate sector for "professional services" since the
status of these activities as the most important, traditional "free
professions" gives them a distinctive character for a class analysis.
A good case could be made for including legal services in the business
service category, since the legal profession is so closely tied to
property law, but for the present purposes we will combine them with
the medical profession in the "professional services" category. Finally,
given the dependence of medicine in general on state activity, medical
services could have been placed under state-supported social services.

48
We decided for the present to restrict this state-supported social~~~~~-~~--_.__._---_._-~-_.~------~~--~-
service sector to those activities which are mainly organized directly
by the state. Thus we included hospital services and excluded medical
services (which remain largely private). A broader notion of the state
sector which includes all activities closely tied to the state and state
policy would certainly be worth exploring, but since we are unable to
include such things as the armament and aircraft industries in such
a sector with the present data, we decided that a narrower definition
of the state sector would be better for this project.
l2For a detailed discussion of the relationship between occupational
categories and class categories both theoretically and empirically, see
Wright (1980b: 177-188).
13If we perform an additional disaggregation of the data and
examine the contribution of each of the economic sectors to the overall
industry shift, we see that virtually all of the negative shift for
these two classes can be attributed to the decline of the extractive
sector. The negative shift from this sector alone is -508,705 for
small. employers, and -1,004,671 for the petty bourgeoisie. See Table 9.
l4It is interesting in this context to see in precisely which
sectors the negative class composition shift for these classes was
greatest. For small employers by far the largest negative class was
located within distributive services (-755,599) while for the pure petty
bourgeoisie it was in the extractive sector (-256,770). Both of these
sectors are sectors in which considerable inroads of large-scale corporate

49
capital occurred during the 1960s (retail chains and department stores
within distributive services, and agribusiness within the extractive
sector). See Table 9.
15Th b . f h' .. 1 d . . .e as~c structure 0 t ~s stat~st~ca ecompos~t~on rema~ns
unaltered when we restrict the analysis to wage-earner categories (as
in Table 8): The expansion of the state generated an 8.4% increase in
semi-autonomous employees compared to only 3.9% and 3.8% for managers
and workers respectively, whereas the decline in the transformative
sector led to a 6.6% decrease in the working class compared to only
4.7% and 5.1% decreases for managers and semi-autonomous employees.
l6The figures reported here are derived from data reported by the
U.S. Bureau of Labor Statistics, Employment and Earnings Monthly,
October 1980, Tables B-1 and A-I. The categories used in this source
do not correspond precisely to those used in the rest of this paper in
several respects. First of all, the data for the transformative sector
do not include.utilities (which we did include in that sector) but do
include mining (which we placed in the extractive sector). The data
reported here are what the U.S. Bureau of Labor Statistics refers to as
"good-producing" industries. Secondly, the category "government" in
the Bureau of Labor Statistics data is restricted to employees directly
working for some governmental agency, whereas our "state-dominated
services" sector included all services within which the government
played a predominant role. Thirdly, the only annual time series by
economic sector we could find was for employees only (thus excluding
- - ------- - ------- ------ -- ----

For a discussion of data sources and
50
self-employed people in each sector). For the state sector this
obviously does not greatly affect the results, but it probably does
have some effect on the trends for the trans formative sector since,
presumably, there would have been more self-employed within that sector
in the late 1940s than at present. The percentages reported are thus
the number of employees in a sector divided by the total employed
civilian labor force (i.e., employees and self-employed,.but excluding
unemployed). While these percentages do not correspond precisely to
the rest of this paper, the d~screpancies should not seriously distort
the broad tendencies being discussed in the present context.
17Between 1947 and 1975 the percentage of the civilian labor force
employed by the government increased in every year except 1953, when
it declined from 11.0 in 1952 to 10.9%, and in 1955, when it declined
from 11.21% to 1101%. The four consecutive years of decline from
1975-1979 are thus unprecedented in the post-war period.
l8p 1 ..ersona commun~cat~on.
measurement problems, see Sobel (forthcoming).

51
TECHNICAL APPENDICES
A. The Decomposition of Change in the Class Structure
The basic method used to decompose the changes in the class structure
of u.S. employment is a modified shift-share technique (see Huff, 1967,
and Perloff et al., 1960, for other uses of this approach). In their
study The Emergence of a Service Society, Browning and Singelmann (1975)
adopted this approach with the technique developed by Palmer and Miller
(1949) and Gnanasekaran (1966) to examine the relationship between the
industry structure and the occupational structure. Following their
procedure it is possible to decompose changes in the class structure
into these components: (1) an industry-shift effect; (2) a class
composition-shift effect; and (3) an interaction effect. For our
purposes the industry effect refers to changes in the class structure
that result from a changing industry structure. Since the petty bourgeois,
for example, are strongly concentrated in agriculture, a decline of this
industry is unfavorable to the growth of the petty bourgeoisie, ceteris
paribus. The class composition effect refers to changes in the class
structure that result from a changing class composition within each
industry, independent of changes in the relative size of these industries.
Finally, some changes in the class structure can be attributed neither
to changes in the industry structure nor to a changing class composition
within industries, but rather they result from an interaction of these
two forces or, accordingly, the interaction effect. This procedure is

52
comparable to Kitagawa's (1955) approach of decomposing changes in
rates into different components.
An application of this method is carried out in Appendix Table 1.
Columns 1 and 2 are the actual numbers in each class category in 1960
and 1970, respectively. The figures in col. 3 would have been observed
in 1970 had each class category grown at the same rate as total employ~
ment during the 1960s. In col. 4. we assumed that there were no changes
in the class composition within industries between 1960 and 1970, and
therefore permitted only the industry structure to change as it did.
Thus the actual 1970 employment in each industry was distributed according
to its specific 1960 class composition. The summation of each class
category across the 37 industries results in the figures that are given
in col. 4. Cols. 5 and 6 refer to the actual change and the expected
change, respectively, in each class category.
The key column in this table is that of the net shifts (col. 7)
which indicate the growth of each class category independent of the
growth of total employment. A positive figure indicates a relative
expansion of this class category, whereas a negative figure indicates a
relative decline; the net shifts thus are comparable to the percentage
~igures in Table 1.
Col. 8 gives the growth of workers in each class category. if there
had been only industry shifts but no shifts in the class composition
within industries t with the growth rate of total employment controlled.
We call this the "industry-shift effect." Col. 9 refers to the number
of workers each class category would have gained (or lost) had there

f> 0
APPENDIX TABLE 1
Industry Shift Effect and Changes in the Class Structure of the U.S. Labor Force, 1960-70
Employment Change Change due to In :r.
Class-Compo- Class Compo-Indus try- sition and Industry- sition and
Expected Weighted Shift Interaction- Shift Interaction-Class 1960 1970 1970 1970a Actual Expected Net Effect Shift Effect . Effect Shift Effect
(1) (2) P) (4) (5)m (6)=- (7)= (8) (9)c (10)'" (11)'"(2)-(1) (3)- (1) (5)-(6) (4)-(3) (2)-(4) (8)+ (7) (9)+ (7)
Employers 4,111,014 3,087,226 5,080,874 4,749,584 -1,023,788 969,860 -1,993,648 -331,290 -1,662,358 16.6 83.4
Pettybourgeoisie 3,753,212 2,859,979 4,638,661 4,140,376 - 893,233 885,449 -1,778,682 -498,285 -1,280,397 28.0 72.0
Managers 20,293,995 27,291,760 25,081,705 25,803,793 6,997,765 4,787,710 2,210,055 722,088 1,487,967 ·32.7 67.3
Semi-autonomous 6,794,122 8,475,457 8,396,975 8,780,798 1,681,335 1,602,853 78,482 383,823 - 305,341 489.0 -389.0.
Workers 27,081,959 34,954,862 33,471,069 33,.194,733 7,872,903 6.389,110 1,483,793 -276,336 1,760,129 - 18.6 118.6
TOTAL 62,034,302 76,669,284 76,669,284 76,669,284 14.634,982 14,634,982 -0- -0- -O-
f
Source: 1960 and 1970 census data.
8weighted by 1960 cla~8 COMposition within industries.

54
been no change in the industry structure but only changes in the class
-~--------,----
composition of industries and an interaction between the two. In order
to separate the interaction effect from the class-composition-shift
effect, the standardization was reversed, and this is carried out in
Appendix Table 2. In that table, col. 4 results from the assumption
that there was nO change in the industry structure between 1960 and
1970, and that only the class composition within industries changed as
it did. This procedure now allocates the interaction effect to the
industry-shift effect and thus yields the change in each class category,
controlled for the growth of total employment, that would have occurred
had there been only changes in the class composition within industries
but no shifts in the industry structure (and its interaction). This
change is referred to as the "class-composition-shift effect" and it is
given in Appendix Table 2, col. 8. By subtracting this class-composition-
shift effect from the combined composition-shift and interaction effect
(Appendix Table 1, col. 9), the interaction effect is derived. The
results of both tables in the Appendix are summarized in Table 6.
B. The Method Used to Impute Class Structures Using Census Data
Since there exists no single data set that would permit an empirical
investigation of the relationship between class structure and industry
structure, we had to link two separate data sources and, in that process,
make some rather sweeping assumptions. The two data sources employed
in the .analysis are (1) the 1969 Survey of Working Conditions, SWC

APPENDIX TABLE 2.
Class-Composition-Shift Effect and Changes in the Class Structure of the U.S. Labor Force, 1960-70
Emo10yment Change Change due to In %
. C1ass-Com- Industry- C1ass-Com- Industry-position- Shift and position- Shift and
Expected Weighted Shift Interaction- Shift Interaction-Class 1960 1970 1970 1970a Actual Expected Net Effect Shift Effect Effect Shift Effect
(1) (2) (3) (4) (5)- (6)a (7)- (8) (9)2 (10)- (11)-(2)-(1) (5)-(6) (5)-(6) (4)-(3) (2)-(4) (8) ~(7) (9) 1(7)
Employers 4,l11,vl4 3,081,226 5,080,814 3,421,482 -1,023,188 969,860 -1,993,648 -1,659,392 -344,256 83.2 16.8
Fettybourgeoisie 3,153,212 2,859,919 4,638,661 3,498,317 I - 893,233 885,449 -1,778,682 -1,140,344 -638,338 64.1 35.9
Managers 20,293,995 21,291,160 25,081,705 26,486,217 6,991,165 4,181,710 2,210.055 1,404,512 805,543 63.6 36.4
Semi-autonomous 6,194.122 8,475.457 8,396,915 8,095,797 1,681,335 1,602,853 78.482 - 301,178 379,660 -383.8 483.8
Workers 21,081,959 34,954,862 33,471,069 35,161,471 7,812,903 6,389,110 1,483,793 1,696,402 -212,609 114.3 -14.3
TOTAL 62,034,302 16,669,284 16,669,284 76,669,284 14,634,982 14,634,982 -0- -0- -0-
Source: 1960 and 1910 census data.
aWeighted by 1960 composition within industries.

56
(conducted by the Institute for Social Research, University of Michigan),
and (2) the 1960 and 1970 population censuses. The SWC could not be
used by itself because it waS taken at one point in time only and thus
does not yield any information about changes in the class structure
or the industry structure. The Population Census (PC) reveals changes
in the industry structure but it does not contain any questions about
social class (as defined in this paper). To link the two data sets,
we therefore created identical cross-classifications of 37 industry
categories and 11 occupational categories with the SWC and the two
PC's. The industry and occupational categories represent the total
civilian employment in the Survey and in the censuses (for an elaboration.
of these categories, see Browning and Singelmann, 1978). Using the
SWC, we then specified the class distribution for each industry-specific
occupation. Furthermore, two main assumptions had to be made. First,
it was assumed that there is no difference between the SWC and the PC
in terms of the class composition of each industry-specific occupation.
And second, we assumed that the class composition of industry-specific
occupations did not change between 1960 and 1970. Obviously, the
second assumption is rather qu~stionable, but it was necessitated by
.the nature of the available data (see part C of the Appendix for a
comment on the biases in the findings that result from these assumptions).
Once these assumptions are made, the class composition of each industry
specific occupation as derived from the SWC can then be imputed for
each industry-specific occupation in the two censuses. Finally, by

;
57
aggregating individuals of the same class in each industry, we eliminated
the occupational categories. The result is the class composition of
each industry. Before adding these results across industries to obtain
the class structures for 1960 and 1970, we made one further refinement.
Since the sum of the small employer and the petty bourgeois class
locations has to equal the sum of the census category "self-employed;"
it was possible to partly eliminate the distortion that results from the
assumption about a fixed class composition within industry-specific
occupations. By using the census information about the distribution of
employment among self-employed and employed as parameters, we correctly
estimate the combined class locations of small employers and the petty
bourgeoisie, on the one hand, and the combined class locations of
managers, semi-autonomous employees, and workers, on the other hand.
Specifically, we divided the employment in each industry between the
self-employed and the employed, as given by the census in 1960 and 1970.
The self-employed then were allocated to the small employer and petty
bourgeois class locations in the same proportions as the imputed pro
portions for these two class locations to one another. The same pro
cedure was followed for the employed which were allocated to the class
locations of managers, semi-autonomous employees, and workers. These
adjusted class distributions for each industry were then added to obtain
the overall class structures for 1960 and 1970. Comparing the 1960 and
1970 data, we can identify changes in the class composition within
industries and changes in the overall class structure that resulted
from a different industry structure.

58
c. Possible Biases in the Estimation Procedure
The strategy adopted for estimating changes in the class structure
between 1960 and 1970, and then decomposing those changes into three
different components, involved a number of assumptions which undoubtedly
introduce various distortions. The following distortions seem particularly
important:
1. Overestimation of the semi-autonomous employee category in
1970. The questions available for measuring the semi-autonomous employee
class location in the SWC were limited to subjective questions concerning
"freedom on the job" and "decision-making." While it is probably the
case that most people in genuinely semi-autonomous locations would respond
"a lot" on the subjective questions, it is likely that many people who
lacked real autonomy might also respond on the high end of the subjective
autonomy questions. This would be expected since it is likely that
people answer the question in terms of the expectations of autonomy
relative to some abstract. absolute norm of autonomy. The result would
be that we probably overestimated the 1970 level of autonomous locations.
2. Overestimation of the managerial category in 1970. Since each
person who states that he or she is, even nominally, a supervisor, is
being placed in the supervisor/manager class location, we have undoubtedly
included certain individuals who are mere conduits for information and
lack any real "authority" in the sense of having the capacity to invoke
sanctions on subordinates.

II
59
3. It is more difficult to say whether we have under- or overestimated
the size of semi-autonomous and managerial locations in 1960. If the
Braverman thesis is correct and there has occurred a systematic degrada
tion of work within industry-specific occupations, then our assumption
that occupation-specific class distributions within industries have
remained unchanged would imply that our estimated numbers of the managerial
and semi-autonomous class locations in 1960 are underestimates. However,
since we have reason to believe that, in fact, we overestimated the size
of these class locations in 1970, the actual estimate for 1960 may be
closer to the true distributions than for 1970.
4. Underestimation of the working class in 1970. Since we used
the 1960 and 1970 censuS information on self-employed/employed members
of the labor force to adjust the combined size of the managerial, semi
autonomous, and worker class locations, an overestimation of the mana
gerial and semi-autonomous locations (see #1 and #2 above) in 1970 implies
that we underestimated the size of the working class in 1970.

60
REFERENCES
Bell, D. 1973. Th~£oming of Post IRd~strial Society. New York:
Basic Books.
Braverman, H. 1973. Labor and Mon.£E.0l~CaPital. New York: Monthly
Review Press.
Browning, H. and J. Singelmann. 1975. The Emer£ence of a Service
Society: Demographic and ~ociol£$i£al Aspects of the Sectoral
Transformation of the U.S. Labor Force. Springfield, Mo.: National
Technical Information Service.
1978. "The Transformation of the U.S. Labor Force: The Inter
action of Industry and Occ;upation." Poli~ics &__Society 8: 481-509.
Burawoy, M. 1978. "Toward a Marxist Theory of the Labor Process:
Braverman and Beyond." Politics & Society 8: 247-312.
1979. Manufacturing Co~ent. Chicago: University of Chicago
Press.
Carchedi, G. 1977. On the Economic Identification of Social Classes.
London: Routledge and Kegan Paul.
Crompton, R. and J. Gubbay. 1978. Economy and Class Structure. New
York: St. Martin's Press.
Edwards, R. 1979. Contested Terrain. New York: Basic Books.
Friedman, A. 1977. Industry and Labour. London: McMillan.
Fuchs, V. R. 1968. The Service Economy. New York: National Bureau
of Economic Research.

61
Gartner and Reisman. 1974. The Service Societz and the Consumer
Vanguard. New York: Harper and Row.
Gnanasekaran, K. S. 1966. Interrelations between Industrial and. 5
Occupational Changes in Manpower, United States. 1950-1960.
Analytical and Technical Report No.6. Philadelphia: University
of Pennsylvania, Population Studies Center.
Huff, D. L., and Sperr, 1. A. 1967. "Measures for Determining Dif-
ferential Growth Rates of Markets." Journal of Marketing Research
4: 391-95.
Kitagawa, E. 1955. "Components of a Difference between Two Rates."
Journal of the American Statistical Association 50: 1168-1174.
Palmer, G., and Miller, A. 1949. Indu.strial~nd Occupational Trends
in National Employment. Industrial Research Department, Wharton
School of Finance and Commerce. Philadelphia: University of
Pennsylvania.
Perloff, H., Dunn, E. S., Jr., Lampard, E. E., and Muth. R. F. 1960.
Regions, Resources, and Economic Growth. Baltimore: Johns Hopkins
Press.
Poulantzas, N. 1975. Classes in Contemp£rary CaRitalism. London:
New Left Books.
Przeworski, A. 1977. "From Proletariat into Class,il Politics & Society
7: 343-401.
Richta, R. et al. 1969. Civilization at the Cross Roads. White. ~-
Plains: International Arts and Sciences Press.

62
Singelmann, J. 1978. From Agricultu£e to Services. Beverly Hills,
Calif. : Sage.
Sobel, R. Forthcoming. White Collar Class: Educated Labor Re-evaluated.
Ph.D. Dissertation, School of Education, University of Massachusetts
Amherst.
Wright, E. 1976. "Class Boundaries in Advanced Capitalist Societies."
New Left Review #98, pp. 3-41.
1978a. Class, Crisis a~d~the State. London: New Left Books.
1978b. "Intellectuals and the Working Class." Insurgent
Sociologist 8: 5-18.
1978c. "Race, Class and Income Inequality." American Journal
of Sociology 83: 1368-1397.
1979a. Class Structure and Income Determination. New York:
Academic Press.
1979b. "Capitalism's Futures," Structural Analysis Program,
University of Toronto, Working Paper Series No.7, paper No.3.
1980a. "Varieties of Marxist Conceptions of Class Structure."
Politics & Society 9: 323-370.
1980b. "Class and Occupation." Theory and Society 9: 177-214.