University of Westminster Eprints...
40
University of Westminster Eprints http://eprints.wmin.ac.uk Decommissioning of offshore oil and gas facilities: a comparative assessment of different scenarios. Paul Ekins Robin Vanner Policy Studies Institute James Firebrace JF Consulting This is an electronic version of an article published in Journal of Environmental Management, 79 (4). pp. 420-438, June 2006. The definitive version in the Journal of Environmental Management is available online at: http://www.sciencedirect.com/science/journal/03014797 The Eprints service at the University of Westminster aims to make the research output of the University available to a wider audience. Copyright and Moral Rights remain with the authors and/or copyright owners. Users are permitted to download and/or print one copy for non-commercial private study or research. Further distribution and any use of material from within this archive for profit-making enterprises or for commercial gain is strictly forbidden. Whilst further distribution of specific materials from within this archive is forbidden, you may freely distribute the URL of the University of Westminster Eprints (http://eprints.wmin.ac.uk ). In case of abuse or copyright appearing without permission e-mail [email protected].
Transcript of University of Westminster Eprints...

University of Westminster Eprints http://eprints.wmin.ac.uk Decommissioning of offshore oil and gas facilities: a comparative assessment of different scenarios. Paul Ekins Robin Vanner Policy Studies Institute James Firebrace JF Consulting
This is an electronic version of an article published in Journal of Environmental Management, 79 (4). pp. 420-438, June 2006. The definitive version in the Journal of Environmental Management is available online at: http://www.sciencedirect.com/science/journal/03014797 The Eprints service at the University of Westminster aims to make the research output of the University available to a wider audience. Copyright and Moral Rights remain with the authors and/or copyright owners. Users are permitted to download and/or print one copy for non-commercial private study or research. Further distribution and any use of material from within this archive for profit-making enterprises or for commercial gain is strictly forbidden. Whilst further distribution of specific materials from within this archive is forbidden, you may freely distribute the URL of the University of Westminster Eprints (http://eprints.wmin.ac.uk). In case of abuse or copyright appearing without permission e-mail [email protected].
wattsn
top stamp
wattsn
Middle
wattsn
Bottom
DECOMMISSIONING OF OFFSHORE OIL AND GAS FACILITIES: A COMPARATIVE ASSESSMENT OF DIFFERENT SCENARIOS
A paper for submission to Journal of Environmental Management
Paul Ekins
Corresponding Author: Policy Studies Institute (PSI), 100 Park Village East, London NW1 3SR, UK
Tel. +44 20 7468 2276; Fax. +44 20 7388 0914; mail [email protected]
Robin Vanner PSI
James Firebrace
JF Consulting

1
1 INTRODUCTION
At least since the controversy over the attempted disposal at sea of the Brent Spar structure (see UYSEG 2005 for a simple and objective account of this), the decommissioning of North Sea offshore oil and gas installations has been a matter of intense policy concern. It is likely that many more North Sea structures will need to be decommissioned in the coming years. This paper1 assesses and evaluates various options for decommissioning using a methodology that combines material flow and energy flow analysis, with assessment of the resulting environmental impacts, and value chain analysis. The intention is that this joint focus on economic and environmental factors (and social factors where relevant) will enable the full implications of the different decommissioning options to be properly compared2. Section 2 outlines some of the main features of the assessment methodology to be employed. Section 3 briefly discusses the decommissioning issues and options considered, while Section 4 describes how the assessment was carried out. Section 5 gives the outcomes of the assessment. Section 6 concludes. 2 METHODOLOGY, SCOPE AND SOURCES
Material and energy flow analysis are based on the fundamental principle that neither energy nor matter can be created or destroyed, only changed from one form into another. The analysis involves drawing a conceptual boundary around a system and undertaking an accounting process for energy and/or material flows through the system or across its boundary, balancing inputs, changes in stocks and outputs of a given material, or a flow of energy, over a given timeframe. Materials cross the boundary of the system under consideration and are transformed by a process. Those that stay within the boundary are added to the material stocks of the system. Those that leave the boundary (whether as products or wastes) are subtracted from the material stocks of the system. A mass balance equation expresses the reality that matter cannot be created or destroyed. With regard to energy, typically the process under consideration in the system will use high-grade energy and transform it into low-grade energy which will usually be dissipated across the boundary of the system. Like matter, the amount of energy will be conserved but it will be changed from a high-grade to a low-grade form. Industrial processes typically utilise high-grade energy and raw materials to produce a higher value product, and one or more low-value waste products, often themselves requiring further processing. This further processing (of which decommissioning is an example) itself may
1 The paper is the result of a project funded under the UK Department of Trade and Industry (DTI)’s Sustainable Technologies Initiative LINK Programme, with funding from the Engineering and Physical Sciences Research Council (EPSRC), matched by industry, largely through in-kind contributions in identifying and providing data, case studies and research papers. This research funding and support is gratefully acknowledged. 2 The longer Working Paper, Ekins et al. 2005, from which this paper is derived, goes into far more detail on many of the issues which informed this assessment than there is space for here.

2
produce low-value wastes and involve environmental impacts. Assessment of such processes needs to consider
• The impacts and environmental risks of the waste if left unprocessed; • The value and environmental burden of the input materials used in the processes
and the outputs from it; and • The wider social and distributional implications of these outcomes including the
interests of future generations.
Any perceived net benefit has to be considered in relation to the financial expenditure of the processes and the overall benefits they yield. One aspect to consider in the application of this methodology to decommissioning is that there is potential to recycle the materials comprising the structure. In essence, the two broad decommissioning options are:
• To return the structure to shore and recycle the materials which comprise it, when the material, energy, financial, emission and other implications of dismantling the structure, transporting it to shore and recycling it need to be calculated;
• To leave it in situ, when the analysis needs to include the material, energy and financial implications of so doing, plus the implications of producing the same amount of useful material as recycling it would have done onshore, Not recovering and processing the structure requires that raw material and energy be consumed to replace the materials which would have been recycled if the structure had been brought onshore.
The financial flows involved in any process consist of the financial costs of undertaking the process. There are also various non-financial (social and environmental) issues related to the process’s material and energy flows (see Table 2.1). These issues, which will not necessarily be included in any way in the financial flows associated with material and energy use, need to be addressed explicitly. The approach taken in this study is not to make a valuation of such non-financial outcomes, but to identify and qualitatively assess the importance of them relative to some reference case.
Table 2.1: Issues Addressed in this Assessment of Decommissioning
Assessed quantitatively Assessed qualitatively Material inputs A clear seabed Material endpoints (of the material being decommissioned)
Health and safety of personnel directly involved in the decommissioning process
Total energy requirement (TER) Jobs in the UK Total gaseous emissions Impacts on the marine environment Financial expenditures Conservation of non-renewable resources Impacts of resource extraction Impacts of landfill Impact on the fishing (specifically trawling) industry

3
Impacts on fish (and other marine life) In the discussion of these issues that follows in Section 4, any financial considerations related to the issues are quantified where possible, while the non-financial components are given different symbolic representation. Because of the uncertainties involved in some of the financial calculations (which relate to processes some of which have never actually been carried out), it would have been desirable to give the financial estimates as ranges. Usually, however, this was not possible from the extant sources. It should, therefore, be borne in mind that point financial estimates are not intended to suggest accuracy or levels of uncertainty, but simply reproduce the numbers in the studies consulted. As noted by Greenpeace (2004), which of all the environmental groups has taken most interest in and exerted most influence on the decommissioning issue, any full consideration of decommissioning also needs to take account of broader issues such as “the established international trend against dumping”, “the cumulative damage and the potential precedent that could be set by dumping individual installations on a ‘case-by-case’ basis”, the need for industry to take responsibility for the products it creates, the precautionary principle and the need to protect the environment from harm. Some of these issues will be qualitatively assessed under the headings above. Others will be brought into consideration in the concluding discussion and interpretation of the results of the analysis in Section 5. The analysis of the selected decommissioning options chosen starts after execution of all the required tasks which are common to all decommissioning options (shutdown, well decommissioning and flushing and cleaning of tanks, process equipment and pipelines), and ends for the in-situ options when monitoring and surveying activities begin (i.e. they are not included in the assessment), and after recycling or the transfer of residual waste to a third party for the return-to-shore options. No limit is put on the time period over which the impacts and outcomes of decommissioning are considered relevant for the analysis. There is also no assumption that the impacts of the decommissioning will be confined to the UK or the North Sea. Financially the analysis only looks at the expenditures incurred in decommissioning and makes no quantitative assessment of the wider economic impacts. Figures for the energy requirements of decommissioning of offshore structures are produced by the Institute of Petroleum (IP 2000). This provides a methodological framework for making an assessment of energy use in the absence of case specific figures being available. This framework is used as the starting point for this analysis of decommissioning both for energy (diesel) and its corresponding material flows. Decommissioning of offshore structures in the North Sea is in its relative infancy. Relatively few structures have so far been decommissioned. No large fixed steel structures have so far been decommissioned. It is therefore not surprising that, to date, the great majority of study and analysis of the impacts and different options of decommissioning have been carried out by the industry. In fact, this study would not have been possible had the industry not given access to the project researchers information from industry sources, which had not been previously available. Much of this information comes from recent intensive studies relating to the decommissioning of a large steel structure, which is here called Case Study A, access

4
to which was obtained on a confidential basis from an operating company, which had carried them out as part of the process of preparing the first draft of decommissioning proposals for submission to the UK Department of Trade and Industry (DTI). Two other bodies of work have provided useful material for this study: • Studies relating to the decommissioning of Maureen, a steel-based re-floatable platform
structure. (Phillips UK 1999) • Studies relating to the decommissioning of Ecofisk I, a planned 15-year decommissioning
programme for thirteen steel platform facilities as well a storage tank in the Norwegian North Sea. (ConocoPhillips 1999). For ease of reference in some tables, this has sometimes been called Case Study B.
• The Joint Industry Project (JIP), led by the UK Offshore Operators’ Association (UKOOA), a major programme of research seeking the best way of tackling the historical legacy of accumulated drill cuttings beneath offshore installations in the North Sea (UKOOA 2002).
3 DECOMMISSIONING ISSUES
A typical North Sea ‘large steel’ deep-water structure (Watson, 2001, p.27) consists of: • A ‘topside’, the actual platform above the surface of the sea on which offshore
activities take place. • A ‘jacket’, which supports the topside and is a structure largely of tubular steel, which
may be 140-160m high and weight 12,000-30,000 tonnes. • ‘Footings’, the lowest and heaviest section of the jacket, which are considered
separately for decommissioning purposes. The footings include ‘pile clusters’ to aid piling of the structure into the seabed, and a drilling template, through which the wells are drilled.
• A pile of ‘drill cuttings’, perhaps 5m high on the seabed beneath the platform, consisting of drilled rock particles and drilling fluids arising from drilling the wells.
In addition, there are likely to be pipelines for the export of oil and gas, which may also need to be decommissioned.
3.1 REGULATORY AND ECONOMIC ISSUES
The regulatory framework for the decommissioning of offshore structures in the North Sea is provided by the OSPAR convention. There is currently a presumption under the OSPAR convention that all offshore structures will be entirely brought to shore for decommissioning, with only limited possibilities for derogation. In particular, OSPAR Decision 98/3 (taken in 1998) requires the following: • All topsides of all structures are to be removed and brought to shore for reuse, recycling
or disposal; • All sub-structures or jackets weighing less than 10,000 tonnes must be totally
removed and brought to shore for re-use, recycling or disposal;
5
• For sub-structures weighing over 10,000 tonnes, there is a presumption to remove totally but with the potential of a derogation being agreed on whether the footings might be left in place; and
• Derogation may be considered for the heavy concrete gravity based structures as well as for floating concrete installations and any concrete anchor-base.
At the UK level decommissioning is regulated by the DTI. The DTI’s Guidance Notes for the decommissioning of offshore facilities and pipelines detail how all components of the decommissioning process should be dealt with including drill cutting piles and pipelines (DTI 2001). Any OSPAR derogation requires formal international consultation to be undertaken by the relevant government. The cost of decommissioning all of the structures associated with the UKCS was estimated in 2004 as £9.1 billion by 2030 (UKOOA 2004, p.10). Watson (2001, p.6) estimates that the costs of total removal of the North Sea structures (i.e. also including Norwegian and Dutch structures) may be £13-£20 billion. This illustrates both the high costs and continuing economic uncertainties associated with decommissioning, especially of the large steel structures in deep water, of which there is as yet no experience. Moreover, while the structures may be similar, they are not identical, and differences in detailed design, coupled with differences in the nature and extent of wear and tear over their lifetimes in the harsh North Sea environment, mean that the decommissioning of each one will need to be approached on a fresh basis. Because the tax regime applied to offshore oil and gas operators in the UK sector of the North Sea allows decommissioning expenditures to be offset against tax liability in the normal way, some proportion of the costs can be regarded as effectively public expenditure, because of the tax revenues foregone. This is an important, but little appreciated, distributional implication of decommissioning, which makes decommissioning relevant to public as well as private spending priorities. Tax relief means that the UK governmental contribution to decommissioning offshore structures will be between 30-70% depending on historical levels of Petroleum Revenue Tax (PRT) paid. Based on present cost estimates, the cost to the taxpayer of decommissioning all of the structures on the UKCS associated with oil and gas is estimated to be £4.6 billion in the years 2001-2030 (Kemp et al. 2001, p.31, medium exploration scenario), about 50% of the total cost, and this is the proportion assumed in the rest of this paper. Assessment of the wider fiscal implications of the decommissioning options (for example, considering the sources of alternative tax revenues required due to tax offsets) is beyond the scope of the paper. All those with a financial interest in an oil and gas installation have a residual liability for anything left in-situ. In the event of the ownership being passed on, perhaps to new entrants and smaller operators (DTI 2001, p.34), new owners may be asked to give financial security to old owners, because, in the event of new owners going out of business, liability can revert to former owners. If a party wishes to end their liabilities in the asset, this will only be agreed to by the Government if appropriate external financial security is agreed within the partnership (DTI 2001, Annex F). In addition to formal legal liability, residual materials may be a potential liability in terms of reputation, for a certain time and for the larger oil
6
companies at least. Any residual liability following decommissioning is noted in the assessment but has not been quantified.
3.2 DECOMMISSIONING EXPERIENCE AND OPTIONS
A number of structures of various types have either been decommissioned or have been approved for decommissioning. These include: • Brent Spar –A steel floating storage facility (dismantled onshore); • Maureen – A steel-based re-floatable platform structure (dismantled onshore); • Ekofisk I – A planned 15-year decommissioning programme for thirteen steel platform
facilities as well as a storage tank (platforms removed to shore, tank to be left in situ); • Case Study A – A large steel structure such as that described above (none yet
decommissioned). On the UK Continental Shelf (UKCS) there are 33 large fixed steel structures (DTI 2002, Annex 2A, p.44). Many of these structures will be eligible for derogation under the current OSPAR arrangements and could apply to leave their footings in-situ. While it is not possible to say that the Case Study A structure is in detail representative of all large steel structures, because all have some unique aspects, it is a structure roughly in the middle of the range of weight and water depth for such structures, and does not seem to have any features that would systematically bias the analysis. It has therefore been treated in this paper as broadly representative of large steel structures as a whole, but the results and conclusions should be interpreted with this in mind. The decommissioning options assessed in this paper relate to:
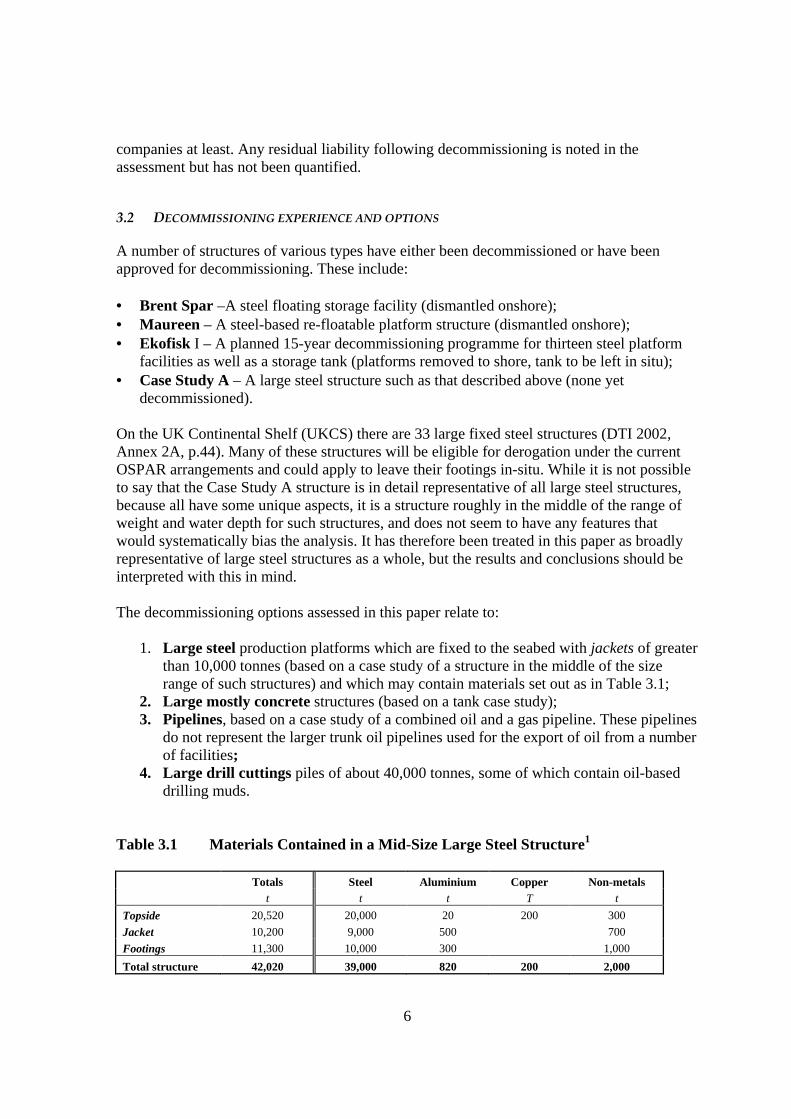
1. Large steel production platforms which are fixed to the seabed with jackets of greater than 10,000 tonnes (based on a case study of a structure in the middle of the size range of such structures) and which may contain materials set out as in Table 3.1;
2. Large mostly concrete structures (based on a tank case study); 3. Pipelines, based on a case study of a combined oil and a gas pipeline. These pipelines
do not represent the larger trunk oil pipelines used for the export of oil from a number of facilities;
4. Large drill cuttings piles of about 40,000 tonnes, some of which contain oil-based drilling muds.
Table 3.1 Materials Contained in a Mid-Size Large Steel Structure1
Totals Steel Aluminium Copper Non-metals t t t T t
Topside 20,520 20,000 20 200 300
Jacket 10,200 9,000 500 700
Footings 11,300 10,000 300 1,000
Total structure 42,020 39,000 820 200 2,000

7
1 It should be noted that the tonnages of materials in such structures will vary and these figures should be regarded as no more than indicative of the kinds of masses involved. The three decommissioning possibilities assessed in more detail below are as follows:
• Leave in situ – Leaving the structure in situ after the cleaning of all hydrocarbons. While leaving individual component parts of the structure (e.g. topside, jacket etc.) can be considered separately, obviously lower components have to be left in situ for this to be considered for a higher component.
• Shallow disposal – Dismantling the structure and depositing it onto the seabed around the site of the operational structure.
• Recovery – The removal and transport to shore, and dismantling and re-processing or landfilling, of all the components of the structure.
There are a number of other decommissioning possibilities, summarised below. Apart from not being legal under current regulations, as discussed above, they have not been analysed further, or separately, in this paper for the reasons given:
• Monitoring – Leaving the structure in situ with a programme of on-going monitoring of the fate of the abandoned structure and associated materials (e.g. pipelines and drill cuttings piles). This possibility is only potentially available for footings over 10,000 tonnes, drill cuttings and pipelines. In fact, appropriate monitoring will need to be carried out for any materials left in situ. It has therefore been considered in the discussion of the options that envisage this, rather than as a separate option.
• Toppling – Doing the minimum required to topple the structure so that it simply lays on its side at the site. There has been no or very little work done on this option relevant to the larger steel structures mainly analysed in this report. If it was discovered to be a technically feasible option for fixed steel structures, toppling would have many similarities to the shallow disposal option but with moderately lower material, energy and financial requirements.
• Deep-sea disposal – Removing the structure for disposal in the deep ocean, where it would be effectively impossible for there to be any further human interaction with the material comprising it. There has been little work done on this option since the OSPAR regulations made it effectively illegal, making it rather difficult to provide accurate analysis of its cost and material basis. In any case, deep-sea disposal seems likely to have a significantly greater total energy requirement than shallow disposal (ERT 1997, p.11, Table 4), without having additional benefits, and it is therefore excluded from further analysis on these grounds.
Table 3.2 presents an overview of the various decommissioning options considered later in this paper. For all of them, the assessment does not include the basic activities – clean up (of hydrocarbons from the structure’s oil and gas systems), well decommissioning and the clearing of debris from the immediate surface of the seabed (i.e. not including the drill cuttings pile) – that are common to all of them. The ‘Leave in situ’ options for the structure (T1, J1, F1, CON1) assume that nothing else is done beyond these activities. Options T2, J2 involve shallow disposal of the structure. T3, J3, F2, and CON2 entail recovery of the structure and its removal to shore for reprocessing or disposal of its constituent materials.

8
Option F2 (recovery of footings) has two possible variants (F2a & F2b) depending on whether • F2a: the drill cuttings are left in place • F2b: the drill cuttings are removed. This is important as the removal of the footings with the drill cuttings left in situ could disrupt the drill cuttings with resulting release of hydrocarbons into the water column. This difference will be apparent in the description of the approach to drill cuttings rather than in the description of F2 itself. ‘Hybrid’ options would be to cut the footings at the level of the drill cuttings, which then might or might not be covered; or to dredge (using a suction dredge) only those cuttings round the footings, so that the footings could then be removed. The dredged cuttings could then be disposed of as discussed below, and the rest left undisturbed, or covered, as desired. Because of lack of data, these options have not been explored in detail, but they will be considered in the relevant place in the conclusions. Table 3.2 Summary of Decommissioning Options
Decommissioning Options
Str
uctu
re ty
pe
Str
uctu
re C
ompo
nent
Leav
e in
situ
Sha
llow
Dis
posa
l
Rec
over
y
Rem
edia
l act
ion
Bur
y pi
pelin
es
Exc
avat
e &
leav
e cu
tting
s
Cov
er c
uttin
gs
Exc
avat
e &
cov
er c
uttin
gs
Re-
inje
ct
cutti
ngs
onsi
te
Re-
inje
ct c
uttin
gs
off-
site
Rem
ove
cutti
ngs
onsh
ore,
tr
eat a
nd la
ndfil
l
Topside T1 T2 T3
Jacket J1 J2 J3 Large fixed steel Footings F1 F2(a, b)
Concrete Tank CON 1 CON 2
Pipelines P1 P2 P3 P4
Drill Cuttings C1 C2 C3 C4 Note: Only unshaded boxes contain options that are considered in detail below, for reasons that are given in
the text Pipelines may be left in situ (P1), recovered and removed to shore (P2), subjected to ‘remedial action’ (P3), which entails carrying out additional activities (which might include a combination of: mechanical trenching, burying with sand or rock, or removal and recovery of selected lengths of pipelines) to ensure long-term integrity of the pipelines (Case Study A, ENV 02, p.16) or buried (P4). These options are all described in more detail in Section 4. With regard to drill cuttings, these may be left in situ (C1), covered (C3, with or without the lowest part of the footings left in situ, as noted above) or removed and treated onshore (C4). One further possible process for their removal is referred to as ‘excavation’. This entails subjecting the drill cuttings pile to a low velocity, high volume flow of water which raises it into suspension. Re-suspended material is dispersed into the surrounding water and carried

9
from the site with the prevailing current or tide and redeposited over a much larger area. Following excavation, the site of the pile may be left (C2) or an attempt could be made to cover the much larger area over which the cuttings have been deposited. However, this latter option is not further considered here, because it would require an impracticable volume of sand and gravel (estimated to be more than 8 million tonnes of sand and gravel combined). Other options for drill cuttings are their re-injection into a well, at the same or a different site. Some information on the re-injection of cuttings is presented below, but it is not one of the options analysed in detail in this report, because it was not assessed in relation to Case Study A and the available data relating to it is therefore not comparable to the data that has been used for the other options. However, it will be assessed more generally as an option where appropriate. T1,2 and J1,2 are not currently permitted under the OSPAR regulatory framework. They are therefore at present only theoretical, rather than available, options for the North Sea and the rest of the OSPAR area. To avoid misunderstanding, therefore, in the rest of this paper the various decommissioning approaches to be analysed will be called ‘scenarios’ rather than options.
3.3 SPECIFIC ISSUES RELATED TO PIPELINES AND DRILL CUTTINGS
3.3.1 Pipelines At present the decommissioning of pipelines is not regulated by the OSPAR Convention. The decommissioning of pipelines is considered case by case based on comparative assessments of all scenarios. Important issues when assessing the decommissioning scenarios for oil and gas pipelines are whether the pipeline is presently trenched or covered, and if so, the status of the coverings and the prospects of the pipelines being uncovered in the future. This is important as exposed pipelines (in addition to other objects on the seabed) can pose a risk to trawling operations. If recovery of pipelines is desired, for smaller pipelines this can be effected relatively easily by reeling them in (AURIS 1995, page 5.12). For less flexible pipelines, they may be cut and made buoyant and towed to shore, or cut and lifted onto a vessel (AURIS 1995, page 5.12). The material, energy and value assessment of decommissioning pipelines is similar in form to the assessment of the decommissioning of main structures. The key difference is that the in-situ scenario may have significant material demands, if the pipeline is to be covered with rocks (scenario P3). A 36” pipeline would need to covered by 0.5 metres of rocks, which would require a pile 3 metres either side and therefore an estimated 4,000 m3 of material per kilometre (AURIS 1995, page 5.14). A further consideration is the relatively dispersed nature of pipelines, and whether the material, energy and value benefits of recovering such dispersed material justifies the material, energy and financial cost associated with such recovery. No energy analysis of the decommissioning of pipelines can be found in the literature. 3.3.2 Drill Cuttings

10
Drill cuttings piles are created by solid waste discharges onto the seabed during well-drilling operations. Historically, the drilling muds used in the drilling process were oil based and therefore the cuttings have hydrocarbon contamination, as well as often containing traces of heavy metals, PCBs and radioactive material from the bed and cap rock. There are an estimated 1.3 million cubic metres of cuttings piles in the North Sea as a whole (Wills 2000, page 59, par 1). Gerrard et al. (1999, p.8) estimate that “the total inventory of hydrocarbons in cuttings piles is similar to the annual input into the North Sea from all sources”. It is estimated that the oil in the 6 largest oil-based mud piles represents 24% of the total mass of oil in piles in the UK. The cuttings piles are highly heterogeneous both in shape and content. The fate of cuttings piles is not currently regulated under OSPAR but is addressed by DTI guidelines on decommissioning. Research into the decommissioning of drill cuttings piles includes a research programme commissioned by UKOOA (UKOOA 2002), which carried out a number of case studies, the most significant of which were around the North West Hutton, Beryl A and Ekofisk 2/4A structures. Gerrard et al. (1999) also investigated as a case study the North West Hutton pile, which, with a volume of 25,225m3 and a mass of 42,126 tonnes, is one of the larger piles. The independent Scientific Review Group (SRG) for the UKOOA (2002) study described its findings thus: “The results indicate that the present effects of existing piles are highly localised, and the spatial extent of the areas affected is a small percentage of the total. The total quantities of hydrocarbons in the piles are substantial (about 150,000 tonnes), but these are largely immobilised and are only being removed very slowly by erosion, degradation and leaching (over several or many decades). The rate of release to the wider environment is therefore small in relation to the amount of hydrocarbons from other sources (e.g. rivers).” (SRG 2002, p.8) The key findings of the UKOOA (2002) study in relation to water column and food chain impacts were broadly reassuring, finding that none of the concentrations of potentially toxic substances (including PAHs metals, endocrine disruptors and NORM [Naturally Occurring Radioactive Material]) appeared likely to result in an adverse effect on biota. However, the SRG for the UKOOA (2002) study was not uncritical of the way this part of the study had been carried out. It considered that “further longer term and/or in situ experiments will be required to resolve the [issue of food chain contamination] satisfactorily” (SRG 2002, p.9). There is a potentially problematic interaction between the decommissioning of footings and the cuttings piles which surround them:
• If it were decided to remove the cuttings piles, this would be technically feasible whether or not the footings were being removed.
• The footings could be accessed and removed by only removing the cuttings immediately around them, thereby avoiding considerable disturbance of the cuttings.
• It would be possible to cut the footings at the level of the cuttings pile, leaving the residual footing in the cuttings pile, which might or might not then be covered, and removing the rest of the footings to shore.

11
These issues are considered in more detail in the decommissioning assessments. The four main decommissioning scenarios considered by UKOOA (2002) were: dredging of the cuttings with offshore processing; dredging of the cuttings with onshore processing; leaving in-situ with monitoring, either with or without covering. The report contained a huge amount of technical detail, which there is no space even to summarise here (some is contained in Ekins et al. 2005), but which has informed the assessment in Section 4 where relevant. The favoured technology for dredging is suction dredging, for which there is little evidence of pollution of the water column beyond the ‘immediate plume’, and no discernible impact at a distance of 100m (UKOOA 2002, Final report, Q.48 p.20). Offshore processing of the resulting slurry may be carried out through re-injection into an existing well or bioremediation. Gerrard et al. (1999. p.10) found re-injection to have the lowest environmental impacts of any disposal scenario, but acknowledged that on a large scale it might be slow, and suffer from logistical difficulties. It might also increase energy use and atmospheric emissions. There are also doubts about the practicality of bioremediation on a large scale (Gerrard et al. 1999, p.9). Moreover, this is a very costly scenario and requires nearly 20 times as much energy as the next most energy intensive scenario, which is onshore treatment of the cuttings (UKOOA 2002). Both re-injection and offshore bioremediation therefore face serious practical constraints at the present time, and are not considered further here. Onshore disposal consists either of the landfilling of solids with minimal processing, or more thorough processing to remove the oil and then either landfilling or using the material as a low-grade construction aggregate. Landfilling offers the cheapest and simplest of the onshore strategies both in terms of energy and cost, but may in the near future be much constrained by the EU Landfill Directive (UKOOA 2002, Task 7, p.25). UKOOA (2002, p.57) concluded that, of the onshore disposal strategies, only landfilling after thorough processing was currently considered a viable option for the future. If left in situ, the cuttings piles may be covered (with an initial layer of sand followed by a gravel filter layer and an outer protective layer of armour stone) to impede leaching of toxic material in the piles. The industry believes this to be a low-risk strategy which could be achieved by developing proven methods of construction and with little or no adverse impact on the marine environment (UKOOA 2002, Task 5b, p.13.5). If left uncovered, according to the Independent Research Group (IRG) reviewing and commenting on the studies of this scenario undertaken for Case Study A, processes of natural recovery at the pile would be slow and confined to small areas, so that the pile area should be considered as being environmentally damaged for the foreseeable future, but that there was no reason to regard this as a significant threat to the wider environment. (IRG 2004, p.9).

12
4 ASSESSING THE DECOMMISSIONING SCENARIOS
4.1 THE REFERENCE SCENARIO
To ensure a sound comparison of the different decommissioning scenarios, it is necessary to compare them with a common reference scenario. The reference scenario chosen for this study is the starting point from which any decommissioning takes place i.e. the structure (comprising the topside, jacket and footings), pipelines and drill cuttings (see T1, J1, F1, CON1, P1, C1 in Table 3.2) have only had a basic clean-up and clearance of the surrounding area. The structure, pipelines and drill cuttings themselves are ‘left in situ’, with no further monitoring or maintenance, and this is how the term ‘leave in situ’ should be understood in what follows. All the other scenarios that leave material in situ would also require this material to be monitored (and occasional remedial action), but because of uncertainties as to what this would entail this has not been estimated here in detail. The cost should be considered as part of the residual financial liability incurred in ‘leave in situ’ scenarios. T1 and J1 are currently against the OSPAR convention and therefore are not being contemplated in practice. Their implications have therefore not been studied in any detail and they are not further considered here. F1 (with the topside and jacket having been removed to the regulated extent), although requiring derogation under OSPAR, clearly is a practicable option, as are CON1, P1 and C1. They are therefore considered in some detail below.
4.2 THE FINANCIAL FLOWS
The financial expenditures required to recover and process a large steel structure considered in this paper are based on early estimates of decommissioning expenditures made for Case Study A. The proportion of the total costs to be allocated to the removal (as opposed to the transport and demolition) of the topside (50%) and jacket (74%) were taken from the experience with the (different) Ekofisk structure (ConocoPhillips 1999). This leads to the estimate, for example, (see Table 4.1) that the shallow disposal of the topside is assumed to cost 50% (£19m) of the total recovery costs (£37m). Despite uncertainties it was not possible to present the numbers as a range, as would have been desirable, and the numbers have been cited as given in the source. This should not be taken to imply that they are either certain or precise. Table 4.1 shows that, compared to the reference scenario, the total costs of recovering and recycling a large steel structure are estimated to be £98m. The cost of the shallow disposal of such a structure would be £42m. The potential savings have to be considered with reference to the value of the recoverable material, as well as any wider benefits derived from recycling the structure. The financial expenditure involved in recovering a large concrete tank is estimated to be £310 million at 2003 prices. The financial expenditures involved in removing the pipelines relating to the large steel structure of Case Study A are a little over £15m, for 26 km of pipelines (there is a total of 9,400 km of pipelines in the North Sea area [DTI 1999, Appendix 11]). The financial expenditures to manage the drill cuttings under the large steel structure of Case Study A

13
range from zero to leave the cuttings in situ, to £39m to recover, process and landfill the cuttings onshore. This compares to the JIP estimate of £60m (UKOOA 2002, p.23, question 65), based on a per tonne cost estimate of £1,500. The drill cuttings pile investigated in Case Study A was large at 40,000 tonnes and therefore the £39m estimate deriving from this case study would suggest either the use of cheaper removal techniques, or considerable economies of scale. Table 4.1 Summary of Financial Expenditures [£2003, million]
Decommissioning scenarios
Structure type Structure
Component
Leav
e in
situ
(r
efer
ence
sce
nario
)
Sha
llow
dis
posa
l
Rec
over
y
Rem
edia
l act
ion
Bur
y pi
pelin
es
Exc
avat
e &
leav
e cu
tting
s
Cov
er c
uttin
gs
Exc
avat
e &
cov
er
cutti
ngs
Re-
inje
ct c
uttin
gs
Rem
ove
cutti
ngs
onsh
ore,
trea
t and
la
ndfil
l
Topside £191 £37
Jacket £231 £31
Footings £0.22 £30 Large fixed steel
Total £42 £98
Concrete Tank £3103
Pipelines Pipelines £15.2 £1.8 £2.5
Drill Cuttings ~40,000 t
No
exp
end
iture
£54 £10.2 £39 Notes: 1 As noted in relation to Table 2.4, the shallow disposal of topsides and jackets is not permitted under the OSPAR Convention 2 Shallow disposal of footings is not further considered here. It is assumed that the footings would be left in situ in a shallow disposal decommissioning scenario. 3 The financial expenditure to reprocess the Ekofisk Tank was estimated to be 3,400 million 1998 Norwegian Kroner respectively (ConocoPhillips 1999, p.137). This was converted into 1998 sterling (@12.50, Norges Bank) and then by use of a UK GDP 1998Q1 – 2003Q1 deflator factor of 114% (ONS) the value of 1998 Kroner can be given in terms of 2003 sterling. This yields an overall conversion factor of 2003£0.0912 per 1998Kr. 4 The financial expenditures for the ‘excavate and leave’ drill cuttings scenario is based on a ship day rate of £38,000 + the cost of aggregates.
4.3 THE MATERIAL AND ENERGY FLOWS
The flow and endpoints of the materials being decommissioned determine the:
1. Overall cost of the decommissioning process; 2. Input materials and energy (and associated emissions), and the values of these,
required in the decommissioning process; and 3. Material processing requirements, and therefore the corresponding energy, emission
and value implications of the onshore processes. The rates of material recovery are derived from the study of Ekofisk (Case Study B). This comprises 13 smaller production platforms which do not have fixed footings like the large steel platforms which are the main focus of analysis here. However, the materials in the footings of large steel structures are of similar composition to those found in the jacket.

14
Therefore the rates of material recovery (for each metal type) found for the jackets of Case Study B have been applied to both the jacket and the footings of large steel structures. The decommissioning of the Ekofisk series of platforms achieved 100% recovery of steel, aluminium, copper and ballast (aggregates). Overall 85% of both plastics and concrete was also recovered. Of electrical materials (such as electrical articles, instruments, cables and telecom equipment) in the topside, only 10% was recovered. No asbestos or marine growth were recovered. In total, 92% of the total material flow was recovered (ConocoPhillips 1999, various tables). These rates of recovery were then applied for the different materials involved in Case Study A, for the two main decommissioning scenarios, Leave in situ and Recovery. In the former case, the material that would have been recovered has to be replaced from other sources. Of the structure of Case Study A 42,500 tonnes (94%) is steel, which can be recycled if the structure is returned to shore. In contrast, if the 40,000 tonnes of cuttings are returned to shore, they all need to be landfilled. Ekins et al. (2005) gives the various estimates, from various sources including IP 2000, of energy and emission factors, and the market values of energy and materials, which have been used in the detailed assessment below. A report by Environment and Technology Ltd. (ERT 1997) using IP figures estimated that the total energy required for the decommissioning scenarios only differed by 14% between them (ERT 1997, p.10). To facilitate the comparison between the scenarios, Table 4.2 sets out a symbolic scheme for the relative energy use and emissions (P), and the rate of materials recovery, for the different decommissioning scenarios (compared to the reference scenario). For relative energy use and emissions, a proportion P greater than 167% of the reference scenario scores - - -, and a P less than 33% scores + + +, with different scores in between as set out in the table. For the rate of materials recovery (RR), this is the proportion of the structure as currently standing which is usefully recovered (i.e. recycled), rather than left in situ or landfilled. A rate of recovery (RR) of more than 85% scores + + +, while one of less than 0.5% scores - - -, with different scores in between as set out in the table. Table 4.2: Symbolic Scheme for Relative Energy Use and Emissions, and the Rate of
Materials Recovery, for the Decommissioning Scenarios
Relative energy use (TER) and emissions
Assessment of the proportion of energy use and emissions in a scenario (P), compared to the reference scenario where: P ≥ 167% - - - 134% ≤ P ≤ 166% - - 101% ≤P ≤133% - P = 100% = 67% ≤P ≤ 99% + 34% ≤ P ≤ 66% + + P ≤ 33% +++
Rate of recovery of materials from present structure
Assessment of the rate of recovery (RR) of materials from the structure as currently standing (i.e. including any marine growth etc.) where: RR ≥ 85% +++ 75% ≤ RR ≤ 85% ++ 51% ≤ RR ≤ 74% + RR = 50% =

15
25% ≤ RR ≤49% - 0.5% ≤ RR ≤ 24% - - RR ≤0.5% - - -
4.4 ASSESSMENT SCHEME FOR NON-FINANCIAL OUTCOMES
As noted in Section 2, there are a number of outcomes from the decommissioning process which are not fully captured by the flow of materials and energy, and the corresponding financial flows. This section defines and explains the methods used to assess each of these non-financial outcomes in turn, and describes how the outcome is assessed in relation to the different decommissioning scenarios. Again, where relevant a symbolic scoring system as been used, ranging from +++ for a very positive impact to - - - for a very negative impact. 4.4.1 Clear seabed There may be value in achieving a clear seabed, which goes beyond the financial implications or the use value of a cleared seabed. The value arises from a desire for a marine environment unmarked by industrial activities, although the achievement of this desire is problematic because the marine environment has been affected for many years by industrial activities apart from oil and gas extraction, including shipping, marine aggregates extraction, trawling and onshore discharges of chemicals. This means that even if the seabed were to cleared of materials relating to the operations of the offshore oil and gas industry, it would still be very far from being in a condition that was unaffected by human activities. The assessment identifies three possible states of the seabed following decommissioning:
1. Clear of all oil-and-gas related material Clear 2. Any oil-and-gas related material is out of sight and inaccessible Covered 3. Oil-and-gas related material is exposed in the marine environment Not clear
The reference scenario (T1, J1, F1, P1, C1) obviously does not leave a clear seabed. The shallow disposal of any part of the structure (T2, J2) also does not leave a clear seabed. The removal of the structure to shore (T3, J3, F2a,b) would leave a clear seabed as far as the structure was concerned. For the pipelines and cuttings, a clear seabed would only be achieved by their removal to shore (P2, C2). The same is true for a concrete structure (CON2). Clearing the seabed of structures, pipelines and drill cuttings would require financial expenditures and might give rise to environmental impacts, such as extra energy use and air emissions, disruption to the seabed, removal of structures that were providing habitats to organisms (such as cold-water coral), or opening up to trawling areas currently protected by exclusion zones. These issues are relevant to the desirability of a ‘clear seabed’, although their relative importance will differ for different stakeholders. A ‘clear seabed’ assessment for a scenario does not therefore necessarily imply that the scenario has delivered net environmental benefits. 4.4.2 Health and safety

16
The decommissioning of offshore structures poses significant health and safety challenges, even for an industry accustomed to managing high-risk offshore operations. Estimates are made on the statistical probability of serious and fatal accidents occurring during the decommissioning process. For example, the Ekofisk I planning process estimated that the Potential Loss of Life (PLL) of decommissioning the structure (all 13 jackets and the tank) was 8% (i.e. there was an 8% probability of a fatal accident) for the largely in-situ option, and 29% for the total removal decommissioning option (ConocoPhillips 1999, p.19). The standard approach to industrial risk management, as set out for example in reports from the Health and Safety Executive (e.g. HSE 2001) and further explored in relation to the oil and gas sector in UKOOA (1999), is tolerant of the exposure of workers to low-level risks over long periods. Such risks tend to be considered a normal outcome of industrial activity. Far greater efforts are taken to avoid high-level, short-term risks. It is for this reason that the assessment of this issue here has put an emphasis on the two relatively high-risk activities associated with decommissioning scenarios that seek to return structures and associated materials to shore, which have been assessed as follows:
• Raising of large structures - - • Divers cutting at depth - - -
4.4.3 Jobs in the UK Clearly the more expensive scenarios would provide more direct employment. Some of this employment could be in the UK, and, if it were in areas currently affected by unemployment, it could make a significant impact on economic and social conditions in those areas. However, the assessment of the total net impact on jobs in the UK is complex. The key issues involved are the degree to which the decommissioning contracts would be captured by UK companies; the degree to which the material processing would be carried out in the UK; and the degree to which any money not spent on decommissioning would stimulate economic activity and therefore jobs elsewhere in the economy.
An overall assessment of the proportion of employment captured within Norway by the decommissioning of the entire Ekofisk field (ConocoPhillips 1999) estimated that Norway would capture between 36% and 52% of expenditure if all structures were returned to shore and recycled. In broad terms, the UK and Norway are comparable in respect of this issue, as they are an approximately equal distance from many of the structures and have a similar-sized oil and gas infrastructure. However, such an estimate does not represent the more complex assessment of issues related to the net impact on employment as outlined above, which have not been assessed here. 4.4.4 Impacts on the marine environment Following clean-up, the mere presence of a structure in the sea should not cause significant negative impacts on the marine environment.

17
Operations to recover or monitor offshore structures will have some impacts on the marine environment, though impacts from monitoring are likely to be very small and are not considered further. Other pollution impacts are assessed according to the following scheme.
• Involves additional minor or short-term impacts or disruption of the marine environment -
(examples are concentrations of marine vessels under anchorage and working, and impacts from covering or suction dredging cuttings piles)
• Involves continued sterility of seabed occupied by cuttings piles, or localised disruption of ecosystems, larger fish or marine mammals but not major or long-term physical damage - - (examples include leaving uncovered cuttings piles in situ, and any significant underwater activity or disruption of the seabed or loss of corals on decommissioned structures)
• Involves significant impacts on large marine organisms or ecosystems, in extent or duration - - -
(examples include extensive disruption of cuttings piles or the use of explosives underwater)
In respect of the reference scenario, in the normal course of events, and with the exception of the drill cuttings piles, the impacts on the marine environment of leaving material offshore will be small. The cuttings piles would render the relevant area of the seabed sterile for many centuries, but would very gradually biodegrade, and some material would leach out into the environment. The overall impact of this is assessed as medium (‘- -‘). All the other decommissioning scenarios (for the structure and pipelines) cause a greater impact on the marine environment than the reference scenarios, because:
• The shallow disposal of the topside (T2) and jacket (J2) would disturb the cuttings pile. Their removal would give rise to localised disturbances to the environment and the loss of corals on the decommissioned structures (‘- -‘).
• The removal of the footings with the cuttings in situ (F2a) could scatter up to 100% of the cuttings over a wide area, with an impact assessed as ‘- - -‘. The impacts would be less, and the same as for the jacket (‘- -‘), if the cuttings were removed with the footings (F2b).
• For the pipelines all the non-reference scenarios involve some damage to the marine environment, but it is localised and not long term (‘- -‘).
For the drill cuttings, covering them (C3) would encourage the re-establishment of a healthy seabed community, with only short-term environmental disturbance, and is therefore assessed as ‘-‘, or positive (‘+’) compared to the reference scenario. Removing the cuttings (C4) with a suction dredge would also only cause short-term impacts, and is also assessed as ‘-‘, or positive (‘+’) compared to the reference scenario. The excavation scenario (C2) involves significant environmental damage, possibly resulting in a surface oil slick, with an impact on seabirds and sea mammals, and the smothering of benthic organisms over a wide area. To reflect this, C2 is assessed as ‘- - -‘, or ‘- (- -)’ compared to the reference scenario.

18
4.4.5 Conservation of stocks of non-renewable resources With typically 90% by large steel structures consisting of steel, much of them could be recycled if returned to shore. Any of this material left in situ (and therefore not recovered) would have to be replaced by the extraction and processing of raw material; in the case of steel this is mostly iron ore and coal. Iron is one of the commonest metals in the Earth’s crust. Of far more potential concern in respect of sustainable development is the availability, price and carbon content of the energy that is required to extract and process it. The loss of non-renewable resources in a decommissioning scenario may be expressed in terms of a ‘resource stock ratio’ (RSR) of the (useful) material recovered in a scenario, less the mass of fuel required to recover it, to the initial mass of material: RSR = The RSR would therefore be 100% if all the material being considered in a scenario were to be recovered without the need for any fuel use. Assessment of the resource stock ratio (RSR), the recovered useful material, less the input fuel use, as a percentage of the total material in the structure where: RSR ≥ 67% + + + 66% ≥ RSR ≥ 34% + + 33% ≥ RSR ≥ 1% + RSR = 0% = -1% ≥ RSR ≥ -33% - -34% ≥ RSR ≥ -66% - - -67% ≥ RSR - - - (The negative percentages will apply to those scenarios (e.g. return of drill cuttings to shore for landfilling) which use a mass of input fuel which is greater than the mass of useful material they recover.) 4.4.6 Impacts of resource extraction The environmental impact associated with the extraction of material resources varies depending on the material and the method of extraction. An important indicator of environmental impact is the extraction multiplier (the total amount of material which has to be moved to extract a tonne of material). For aluminium the EM is 3 tonnes per tonne (t/t); for copper it is 450 t/t (Ayres & Ayres 2002, Table A1, p.13). Assessment of the impacts of resource extraction will be through the extraction multiplier (EM), the ratio of the mass of the total material moved to the mass of the end product extracted: EM ≥ 1.67 - - - 1.66 ≥ EM ≥ 1.34 - - 1.33 ≥ EM ≥ 1.01 - EM = 1.0 = 0.99 ≥ EM ≥ 0.67 + 0.66 ≥ EM ≥ 34 + + 0.34 ≥ EM + + + 4.4.7 Impacts of landfill
Useful material recovered – (mass of input fuel use in recovery) Starting mass of material

19
The two different types of impacts from landfilling waste are the direct social and environmental impacts and the loss of void space, which is in some ways equivalent to the loss of non-renewable resources. The key environmental impacts from landfill sites are leaching, landfill gas (from biodegradable matter as it degrades) and the impact of lorry movements. In this study, the non-financial outcome of landfilling is taken to be influenced by three factors: the amount of waste to be landfilled; whether the waste arising is biodegradable or inert; and whether some part of the waste is classed as hazardous. The Landfill Impact Factor in the box below takes into account in an additive way the loss to society of void space and of landfilled materials (MT), and the environmental impacts of biodegradable and hazardous wastes (MB, MH). It may be noted that this equation implies that tonne for tonne, the loss of void and resources, biodegradability and whether the waste stream is hazardous are weighted equally. This is obviously a fairly crude assumption about the relative social disbenefits arising from these different impacts of landfill. It would be possible to change this assumption in sensitivity analysis if it seemed likely that landfill impacts of a particular kind were of importance in a particular decommissioning scenario. Landfill impact factor (LIF) = Σ [M T + MB + MH] Where: MT = Total mass of waste being landfilled in tonnes; MB = Mass of biodegradable waste being landfilled; MH = Mass of hazardous waste being landfilled
The assessment according to the landfill impact factor is as follows: EM ≥ 1.67 - - - 1.66 ≥ EM ≥ 1.34 - - 1.33 ≥ EM ≥ 1.01 - 100 < LIF < 1000 - 1000 ≤ LIF <5000 - - LIF ≥ 5000 - - - The total landfill impact of removing the structure and pipelines to shore is relatively small, with 2,173 tonnes of material landfilled in all, with a total Landfill Impact Factor (LIF) of 3,439. For drill cuttings it is a very different story. The nearly 40,000 tonnes of cuttings has an LIF of more than 115,000, considerably more than that which the 80,000 tonnes of concrete would have if it were to be brought ashore. 4.4.8 Impacts on the fishing industry The trawling industry in the North Sea would prefer all the materials from the oil and gas industry to be removed by decommissioning, leaving a clear seabed. For this assessment, it seems important to include two impacts on the trawler fishing industry: the risk of snagging and the desire of fishermen for the return of current exclusion zones to fishing use. The assessment scheme that has been used is:
• The risk of snagging: o For the inconvenience of loss of gear
(with the potential to be compensated by the industry) - o For the risk to crew -
• The return of fishing grounds after the removal (or making safe) of the structure or cuttings pile (relative to the reference scenario) +
Although it may appear that this assessment is putting equal weighting on the incidence of loss of fishing gear and loss of life, this is not the case as by no means would all incidents of

20
loss of fishing gear through snagging lead to the loss of life. Risks are calculated by the multiplication of the consequence of a particular risk event occurring by the probability of that consequence actually occurring. The probability of the loss of life from a snagging incident is very low compared to the probability of loss of fishing gear. 4.4.9 Impacts on fish stocks and other marine life INSERTED PARA.There is some evidence that at present oil and gas structures act as refuges for fish and habitat for cold-water coral. This effect would obviously cease if the structure were to be removed and fishing in the area were to be resumed (there is currently a 500m radius fishing exclusion zone around structures). However, if left in-situ, the footings could pose a hazard to trawler fishing, and this would probably prevent extensive trawling activities around the in situ footings. In the absence of the footings the cuttings piles are more likely to be disturbed by trawler fishing activities. The implications of disturbing the cuttings piles would be the potential release of oil-based contamination into the marine environment. These issues are assessed in more detail in Ekins et al. 1995. The benefits to fish stocks from the decommissioning scenarios which leave various materials in situ have been assessed as follows:
• Non-trawler area with little enclosed space + • In-situ footings or shallow deposit of topside + + • Jacket left in the marine environment + + +
4.5 SUMMARY OF THE ASSESSMENT SCHEME FOR NON-FINANCIAL OUTCOMES
Table 4.3 summarises the various symbols which give the assessments of the material and energy flows, and other non-financial outcomes, which have been explained above. It must be stressed that in any overall assessment of the scenarios, there can be no addition of the + and - signs across the different issues, because they are incommensurable. Table 4.3: Summary of Proposed Assessment Scheme for Non-Financial Outcomes Non-financial outcome Proposed assessment Assessment score
Relative energy use (TER) and emissions
Proportion of energy use and emissions in a scenario (P), compared to the reference scenario where: P ≥ 167% - - - 134% ≤ P ≤ 166% - - 101% ≤P ≤133% - P = 100% = 67% ≤P ≤ 99% + 34% ≤ P ≤ 66% + + P ≤ 33% +++
Rate of recovery of materials from present structure
Rate of recovery (RR) of materials from the structure as currently standing where: RR ≥ 85% +++ 75% ≤ RR ≤ 85% ++ 51% ≤ RR ≤ 74% + RR = 50% =

21
25% ≤ RR ≤49% - 0.5% ≤ RR ≤ 24% - - RR ≤0.5% - - -
A clear seabed Seabed clear of all oil-and-gas related material Clear Any oil-and-gas related material is out of site and inaccessible Covered Oil-and-gas related material is exposed in the marine environment Not clear
Health and safety Raising of large structures - - Divers cutting at depth - - -
Jobs in the UK No assessment in the summary outcomes matrices
Impacts on the marine environment
Additional minor or short-term impacts - Localised disruption of ecosystems or components of them - - Significant impacts on ecosystems or components of them - - -
Conservation of stocks of non-renewable resources
Where RSR is relative loss of non-renewable resources: RSR ≥ 67% + + + 66% ≥ RSR ≥ 34% + + 33% ≥ RSR ≥ 1% + RSR = 0% = -1% ≥ RSR ≥ -33% - -34% ≥ RSR ≥ -66% - - -67% ≥ RSR - - -
Impacts of resource extraction
Impacts of resource extraction; extraction multiplier (EM) is the ratio of the mass of the total material moved to the mass of the end product extracted: EM ≥ 1.67 - - - 1.66 ≥ EM ≥ 1.34 - - 1.33 ≥ EM ≥ 1.01 - EM = 1.0 = 0.99 ≥ EM ≥ 0.67 + 0.66 ≥ EM ≥ 34 + + 0.34 ≥ EM + + +
Impact of landfill
Where Landfill impact factor (LIF) = Σ [MT + MB + MH]: 100 < LIF < 1000 - 1000 ≤ LIF <5000 - - LIF ≥ 5000 - - -
Impacts on the fishing industry
Risk of loss of gear - Risk to crew - Return of fishing grounds +
Impacts on fish stocks (and other marine life).
Non-trawler area with little enclosed space + In-situ footings or shallow deposit of topside + + Jacket left in the marine environment + + +

22
5 OUTCOMES FROM THE ASSESSMENT
The Annex (Section 8) summarises the outcomes of the different decommissioning scenarios in terms of their material flows, energy flows, financial expenditures and non-financial issues. The next section compares these scenarios according to the assessment scheme described in Section 4. Table 5.1 gives an overview of this assessment. Were a scenario to be adopted by society, then the additional expenditure relative to the reference scenario (the net cost in Table 5.1) would give an implicit valuation of the net non-financial benefits yielded by that scenario. This is discussed below for each of the decommissioning outcomes. These results derive from a few case studies (especially Case Study A), and there is little other detailed information about North Sea decommissioning in the public domain. However, Ekins et al. 2005 shows that there is no reason for thinking that, to a first approximation at least, these case studies do not present a reasonable point of departure for the broad comparison of outcomes that has been carried out; but interpretation of the results should bear the limited evidence base in mind.

23
Table 5.1: Overview of Non-financial Outcomes from Decommissioning Scenarios and Associated Net Expenditures (cost), Compared with Reference Scenario
Scenario TER CO2 NOx SO2 Clear
seabed Residual financial liability
Health &
safety
Marine impacts
Stock of resources
Resource extraction
Land-fill
Fishing industry
Fish stocks1
Net cost, £m (50% UK taxpayer)
T2 - - - - - - - - - Not clear Yes = - - - = - - ++ 18.6 (9.3) T3 - - - - - - Clear No = - - +++ +++ - + = 30.4 (15.2) J2 - - - - - - - - - Not clear Yes - - - - - = - - = 23.0 (11.5) J3 + - - - - - - Clear No - - - - ++ +++ - - + - - - 27.7 (13.8) F2a + - - - - - - Not clear Yes - - - - - - +++ +++ - - ++ - - 26.5 (13.3) F2b + - - - - - - Clear No - - - - - +++ +++ - - ++ - - 26.5 (13.3) T2,J2,F1 - - - - - - Not clear Yes - - - - - - = - - ++ 41.6 (20.8) T3,J3,F2 + - - - - - Clear No - - - - - - +++ +++ - - + - - - 84.6 (42.3) CON2 - - - - - - - - - - - - Clear No - - - - +++ +++ - - - + - - - 286.7
(143.4) P2 - - - - - - - - - Clear No = - - ++ +++ - ++ = 19.9 (10.0) P3 - - - - - - - Not clear Yes = - - - - = ++ = 1.0 (0.5) P4 - - - - - - - - - Covered Yes = - - - - = ++ = 25 (12.5) C2 - - - - - - - - - - - - Not clear Yes = - - (-) - - (- -)2 = = = 5.1 (2.6) C3 - - - - - - - - - - - - Covered Yes = - - +2 = + + 10.3 (5.1) C4 - - - - - - - - - - - - Clear No = - - - +2 - - - + + 38.8 (19.4) 1 Also includes some other aspects of marine biodiversity 2 Compared with the C1 impact of ‘- -‘ Key to Scenarios All 1 scenarios are reference scenarios Leave in situ T: Topside T2 Removal and shallow disposal; T3 Return and reprocess on shore (applicable to all structures) J: Jacket J2 Removal and shallow disposal J3 Return and reprocess on shore (applicable to large steel structures) F: Footings F2a Remove with cuttings left in situ F2b Remove with cuttings taken to shore (applicable to large steel structures) CON: Mostly concrete structure CON2 Return and reprocess onshore (applicable to concrete structures) P: Pipelines P2 Remove and reprocess onshore P3 Leave in situ with remedial action P4 Trench and bury C: Drill cuttings C2 Excavate and leave C3 Cover and leave C4 Remove and treat onshore

24
5.1 OVERVIEW OF DECOMMISSIONING ASSESSMENTS AND IMPLICIT VALUATIONS
5.1.1 Total energy requirement (TER)
Taking account of the energy needed to replace materials left in situ makes a difference. Indeed, it is decisive in terms of net energy use for both J3 and F2, which remove the jacket and footings respectively to shore and which use less energy than the reference scenario (because of not having to replace from virgin sources the metals recovered from offshore). 5.1.2 Air emissions
Air emissions from all the scenarios are worse than in the reference case. This is because offshore diesel use is emission-intensive (especially of NOx), so that even those scenarios (J3, F2) which use less energy than the reference, produce more emissions. 5.1.3 Clear seabed and resource conservation
There is a clear correlation between the scenarios that produce a clear seabed and those that produce positive results in terms of conservation of the stock of non-renewable resources and resource extraction. This is not surprising, as much of the material removed to shore is recyclable metals. The exception is C4, because the drill cuttings contain very little useful material for recycling (the data was not available to the project to assess the possibility of converting the drill cuttings into an inert construction material). On the other hand, the scenarios that produce a clear seabed also tend to be associated with negative environmental impacts from landfilling, which can be considerable (especially CON2 and C4, as evaluated). 5.1.4 Impact on the marine environment
Compared to the reference, and with the exception of the drill cuttings, all the scenarios have a negative impact on the marine environment, and with some (F2a, C2) this is pronounced. This is because most of the structural material and the pipelines are inert. Leaving it in situ therefore has few implications for the marine environment. Removing it to shore, however, involves extensive industrial activities offshore that can cause environmental disturbance, though in most cases these are only of medium or small scale and are short-lived. The drill cuttings piles are different, because of their long-term ecological sterility and slow leakage of contaminants (with the potential for faster leakage if disturbed) if left in situ uncovered (C1). Both covering (C3) and removal (C4) are assessed as being relatively positive (compared to the reference scenario) for the marine environment. Excavation (C2) is worse, and is likely to be unacceptable on environmental grounds alone. 5.1.5 UK Employment
No conclusions have been drawn about whether the decommissioning scenarios will provide net employment in the UK. This is not because there is any doubt as to whether decommissioning will employ people in itself. Obviously any major programme of expenditure will directly generate jobs. One issue is that, with an international activity like decommissioning, there is no knowing in advance what proportion of these jobs will be in the UK. The other issue is that the net employment effect of decommissioning will depend not only on the number jobs it directly generates, but the comparison of that number with the number of jobs that would be created by the

25
likely alternative use of decommissioning expenditures (in both the private and public sectors, if some decommissioning expenditures represent foregone tax payments), if decommissioning were not to be carried out. There is no way of knowing what this alternative use of the money might be, nor, in the case of private expenditures, whether they would be spent in the UK. Speculation on these matters has been avoided. 5.1.6 Costly scenarios
Easily the most expensive scenario is CON2, the return to shore of a large, mainly concrete structure. The resources reclaimed are overwhelmingly concrete and ballast, which are not scarce non-renewable resources, although the impacts associated with their extraction can be considerable. This provides the first opportunity for an implicit valuation of a decommissioning outcome. The net environmental benefits of this scenario are a clear seabed, the reclamation of nearly 1mt of materials (920 kt of which were aggregates) and the avoidance of the environmental costs of their extraction, net of the extra air emissions, impacts on the marine environment and fish stocks, and significant extra landfilling involved. While valuations of these environmental impacts may vary between stakeholder groups, it is by no means certain that the net environmental benefits are positive. Other non-financial impacts are a small benefit to the fishing industry and a worse outcome on health and safety. If society were to choose CON2, it would be equivalent to saying that overall it considered these net benefits to be worth £287m in total, and £143m in terms of public expenditure. The next most expensive single scenario is C4, the return of cuttings to shore. This would deliver a clear seabed, with the re-establishment of an ecosystem, in place of the largely sterile and contaminated drill cuttings pile. There would also be a small benefit to fish stocks in terms of the removal of a possible source of toxic contamination. There would also be a benefit to the fishing industry in opening up new grounds to trawling (a development which would certainly remove the direct benefit of this scenario to fish stocks). The environmental costs of this scenario, compared to the reference scenario, are substantial: large scale energy use and air emissions, and maximum negative scores in terms of landfill and resource extraction. Some stakeholders may feel that the achievement of a clear and regenerating seabed is worth both these environmental impacts and the nearly £40m it would cost in the case of this one cuttings pile. Clearing the UKCS of cuttings piles would be likely to cost nearer £2bn (detailed calculation in Ekins et al. 2005). Others might feel that the seabed gain is outweighed by the other environmental and the financial costs, that the money, including the roughly 50% of expenditure that would come from the UK taxpayer, could be better spent. 5.1.7 Covering pipelines
The benefits of covering pipelines (P4) go entirely to the fishing industry, there are a number of negative environmental impacts and it is relatively expensive. P2 is slightly worse in terms of SO2 emissions and landfill, but has clear advantages in terms of resource extraction and the stock of non-renewable resources, achieves a clear seabed and is 20% cheaper. P2 on this assessment therefore seems superior to P4 both environmentally and financially (though it should be remembered that the Case Study A structure to which it applies may not be representative of pipelines around other structures, which may be smaller in diameter and therefore less costly to cover).

26
5.1.8 Decommissioning the structure
A final set of comparisons can be made in respect of the components of the large steel structures, between those scenarios which envisage their removal to shore (T3, J3, F2a,b) and those that do not (the reference scenarios T1, J1, F1 and the shallow disposal scenarios, T2, J2). The pattern of relative benefits between these scenarios is quite clear. Those that involve removal to shore achieve a clear seabed, conserve the stock of resources and reduce the resource extraction to produce from virgin sources the material that has been recovered. They also benefit the fishing industry. For the jacket and footings the removal scenarios (J3, F2a,b) also conserve energy, although they have more emissions, because of the high relative emission intensity of offshore diesel use. On the negative side, their health and safety implications, and their impacts on the marine environment and in terms of landfill are worse than the in-situ scenarios, which also benefit fish (except for T3) rather than the fishing industry. The removal scenarios are, not surprisingly, more expensive, by £20-30m compared to the reference scenarios, but by much less (only £4.7m between J2 and J3) compared with shallow disposal. Moreover, all the in-situ scenarios involve some degree of monitoring, which, as noted above, is a cost and has a small environmental impact which have not been included in the assessment. A financial (though unquantified) benefit of all the clear seabed scenarios, as far as the industry is concerned, is that they extinguish any residual financial liability. It may well be that the industry would be prepared to pay its share (on average around half) of the cost of the removal scenarios in order to be free of any future liability. Whether this consideration counts as much for the UK taxpayer, who may prefer to live with the liability while it is not proving problematic, and put the taxation revenues to another use, is another matter. 5.1.9 Deciding on Drill Cuttings Piles
As noted earlier, it is only in respect of the drill cuttings piles that the reference scenario (C1) may result in a significant negative effect on the marine environment. Excavation (C2) will have an even greater negative effect on the marine environment and is not likely to be seriously considered on these grounds alone. Both C3 (covering) and removal (C4) have been assessed as having a positive effect on the marine environment compared with C1. The major environmental impact associated with C3 is the very large quantity of aggregates (166,000t) that is required. This produces a large negative impact in terms of resource extraction. It may also be noted that this material is not included in the definition of the ‘resource stock ratio’ (RSR, see Section 3.4.5), according to which the entry under ‘Stock of resources’ in the summary outcome matrices is calculated. Had it been so, then C3 would have scored a ‘- - -‘ in this category as well. The small benefit of C3 to fish stocks would, as with C4, be swiftly removed by the fact that it would open up the area to the fishing industry. C3 has clear environmental benefits over, for example, C2, because the cuttings are covered rather than excavated (blown away). Its marine environmental benefits are comparable to that of C4 (removal); it uses less fuel and has no landfill implications, but requires far more aggregates; it is also less than a third of the cost of C4. The implicit valuations in relation to the drill cuttings scenarios may therefore be summarised as follows: C1: this would place a value of less than £10m on the net C3 environmental benefits, and less
than £39m on the net C4 environmental benefits C3: this would imply that the C3 seabed benefits (compared to C1) less the negative impacts of
the extra fuel use and aggregates extraction were worth at least £10m C4: this would imply that the C4 seabed benefits (compared to C1) less the negative impacts of
the extra fuel use and landfill were worth at least £39m

27
The independent Scientific Review Group (SRG) of the UKOOA JIP advocated a case-by-case approach for each drill cuttings pile: “We support the conclusion that the most suitable options are removal, covering, and leaving in place to allow natural degradation, and that the balance of advantage between these will depend on the specific characteristics and the environment of individual cuttings piles.” (SRG 2002, p.4) 6 CONCLUSIONS
6.1 CONCLUSIONS FROM THE ASSESSMENT
There are many differences in preferences, priorities and perceptions related to decommissioning, which is one of the reasons why any attempt to give unique money values to the different impacts and outcomes is likely to be unsatisfactory, and why there is unlikely to be a full social consensus on the ‘best’ decommissioning scenario. Watson (2004) has expressed the opinion that there are at least seven different kinds of consideration which will influence the attitude to decommissioning of different stakeholders: technical feasibility, safety, cost, environmental impacts, the regulatory framework, reputation and the political environment. As noted in Section 2, Greenpeace, which is certainly the environmental group that has exerted most influence on the UK decommissioning debate and on decommissioning policy tends to stress the need to reinforce the international trend against dumping and the need for the industry to take responsibility for its products (Greenpeace 2004). It considers that full removal of all materials to shore is technically feasible, and that risks to personnel in the activities involved can be mitigated. This contrasts with those in the industry who consider that the limited decommissioning experience to date has shown that significant technical difficulties remain (Watson 2001, p.28) and, of course, dangerous activities remain potentially dangerous whatever risk mitigation measures are taken, and accidents happen. In any case, driving risks down to very low levels, in a context of considerable technical uncertainty in the first place, is bound to increase costs, perhaps very substantially, above the already uncertain estimates that have been quoted here. These costs will, as noted extensively above, be shared between the industry and the UK taxpayer (due to foregone tax revenues). The industry is likely to be concerned about these costs, but this will not be the only consideration, and it might well be prepared to pay its (half) share of the costs of the removal scenarios, in order to remove any question of future liability, to protect its reputation and not to be seen to challenge the current regulatory framework. The Government (and taxpayer) may have a different view as to whether this is the best use of public money. The environmental outcomes from the various decommissioning scenarios are mixed. No scenario can be said to be definitively superior from an environmental point of view. The total removal scenarios can only be justified environmentally if a relatively high value (though differing for different scenarios) is put on a clear seabed, benefits to the fishing industry, the conservation of the stock of resources and the impacts of resource extraction (although the last two considerations do not apply to drill cuttings), and a relatively low value is put on fish (for all the scenarios), energy

28
use and air emissions (for the concrete structure and drill cuttings), impacts on the marine environment (for all the removal scenarios except drill cuttings) and landfill (especially for the drill cuttings). It is not clear that this would be the relative valuation accorded to these issues either by the range of environmental groups concerned about the marine environment, or by society more widely. It is also not clear what action might be most in line with the precautionary principle, which Greenpeace has said needs to be taken into account. Avoiding the negative environmental impacts from the removal scenarios may be as important in this regard as achieving a clear seabed and recycling metals none of which can be regarded as scarce. The evidence presented above suggests the following broad conclusions Topsides, Jackets and Footings of large steel structures For the topside, all parties seem agreed that removal to shore (T3) is the only scenario worthy of serious consideration, and the assessment shows this to have fewer environmental trade-offs than some other removal scenarios. It still involves expenditure of some £30m (£15m from the taxpayer) for a single large steel structure, £12m more than the shallow disposal scenario (T2). For the jacket, the same arguments seem to apply, except that the difference in cost between the removal (J3) and shallow disposal (J2) scenarios is significantly less. As has been noted, both the reference (T1, J1) and shallow disposal (T2, J2) scenarios are illegal under the current DTI regulations deriving from the OSPAR 1998 Decision. This assessment shows the implementation of these regulations to be far from cheap, for the industry or the UK taxpayer, but, although mixed environmentally, the regulations are at least not obviously counter-productive, and they implement the desire articulated by Greenpeace (which may well have support more widely among the UK and European public) that industry should clean up after itself and take responsibility for its products. The footings are a different matter, largely because of their difficulty of removal, causing both environmental impacts and safety concerns, the former of which are complicated by the footings’ interaction with drill cuttings. The major impact of leaving them in situ is on the fishing industry. Large concrete structures Unlike the large steel structure, there are strong arguments, environmental and financial, for not removing large concrete structures to shore (CON2), and few environmental arguments for doing so. The taxpayer expenditure alone on this scenario (£143m) would not seem to be justified by the benefits that would result3. Drill cuttings piles The situation with drill cuttings is the most complex of the components of decommissioning studied, as has been clearly shown by the assessment and implicit valuation above. Excavation (C2) may be rejected on environmental grounds, but both the removal (C4) and covering (C3) scenarios also have significant environmental impacts of their own, and require substantial expenditures from both the industry and the taxpayer. On the basis of the information and technologies currently available, this study suggests that a very high value would have to be put on a clear seabed, and a low value on the negative environmental impacts of the alternatives, for the
3 This was the view also taken by the Norwegian Parliament in 2002, when it approved the ConocoPhillips plan for decommissioning Ekofisk, involving the in-situ disposal of the large Ekofisk tank, which was the subject of the financial calculations above. The plan also entails the removal of the 14 steel topsides of the Ekofisk complex (including that of the tank), and the leaving in situ of the buried pipelines and drill cuttings (ConocoPhillips 2002)

29
preferred scenario not to be leaving the cuttings in place, with a monitoring programme to keep their condition and any pollution from them under review. Pipelines For pipelines the situation is similar to that for footings. Recovering them (P2) clears the seabed, conserves resources and reduces the impacts of resource extraction, but with some environmental impacts, and at a cost of £20m (a figure which Ekins et al. 2005 shows to be specific to Case Study A and which therefore may not be representative). The main beneficiaries of this expenditure, as with clearing footings, would be the fishing industry. Covering the pipelines (P4) is even more expensive and has little environmental justification over removal. Leaving them, with remedial action to make them safe for fishing if necessary, would be the preferred scenario, unless a very high value was put on a clear seabed and the resources the pipelines comprise. Monitoring material left in situ As noted above, all scenarios with material left in situ would require monitoring, the financial and (small) environmental implications of which need to be added to the relevant scenarios. This monitoring, and the financial implications of any remedial action which it revealed to be necessary, would, in the first instance, be the responsibility of the industry, in view of the ongoing liability for materials left in situ which it would retain. It was outside the scope of this project to investigate the institutional design of any monitoring programme (for example, who should take the decisions about the frequency of monitoring, or what conditions would trigger a requirement for remedial work on, perhaps, the drill cuttings piles). However, the very existence of such a monitoring programme raises the possibility of this monitoring being combined with marine monitoring for other purposes, which in turn broadens the scope of consideration beyond decommissioning.
6.2 PUTTING DECOMMISSIONING INTO A WIDER CONTEXT
Decommissioning is not the only activity in the marine context with environmental implications. Indeed, according to OSPAR, the offshore oil and gas industry is not responsible for any of the six human pressures on the marine environment to which it gives a Class A (highest impact) grading (three of the six pressures come from fishing [removal of target species, seabed disturbance, effects of discards and mortality of non-target species], two of them are trace organic contaminants from land and shipping, and one is inputs of nutrients from land) (OSPAR 2000, Table 6.1, p.113). In this context, any decommissioning scenario that preserves areas from fishing (as the oil and gas structures have done) seems likely to have additional environmental benefit (as noted above). Put another way, if a seabed clear of drilling materials resulting from decommissioning means that trawling again takes place over the area, the seabed will very soon become clear of most marine environmental interest as well. One response to marine environmental degradation, and the loss of fish stocks, has been proposals to establish marine protected areas (MPAs, RCEP 2004, Gell & Roberts, forthcoming). OSPAR itself is currently engaged in efforts “to complete by 2010 a joint network of well-managed marine protected areas that, together with the Natura 2000 network, is ecologically coherent.” (OSPAR 2003, para.11). MPAs established to conserve or rebuild fish stocks would need to be substantially larger than those currently being considered for nature conservation purposes. However, were these larger MPA to include the current sites of oil and gas installations, this would remove the risk of any drill cuttings piles left in situ being disturbed by trawling operations, with a consequent

30
release of pollution, and would permit any covering of these piles, to enable ecosystem regeneration on the seabed, to be far less robust. The present simultaneous concern with both decommissioning and MPAs would seem to open up a significant opportunity for marine environmental protection that embraces both issues. One of the factors that militate against MPAs is the expense of monitoring them. Monitoring is necessary both to ensure that their status and regulations (e.g. no fishing) are being observed, as well as to determine scientifically whether protecting the area is having the desired environmental results. It is here that the potential synergies with some decommissioning scenarios exist. It has been noted above that, in respect of footings, pipelines and drill cuttings at least, the net environmental benefit of removing all materials to shore is uncertain, while the cost is very large. If these materials were to be left offshore, they would need monitoring. This monitoring would be paid for by the industry as part of the decommissioning scenario. If the area to be monitored was included in an MPA, it could be a relatively simple task to devise a scheme whereby the monitoring also included scientific work and surveillance of MPAs. The potential problem of in-situ decommissioning scenarios, in relation to interfering with fishing gear, would then also not arise, because fishing boats would be excluded from the relevant areas. In time, it might even be that the reef effects created by the shallow disposal of structures would, in the context of a MPA, make this scenario more publicly acceptable for jackets or topsides, provided that some of the monies saved over their removal to shore were also channelled into monitoring or other marine environmental protection activity related to the MPA. It has been noted above that one of the issues relating to in-situ decommissioning scenarios, which makes them unattractive to the industry, is that they involve residual financial liability for the materials left offshore. It may be that, in addition to making a contribution to monitoring, the industry would be prepared to contribute to a marine environmental protection fund, to reduce or share this liability with the Government, which would provide even more resources for marine environmental protection. There can be little doubt, on the basis of the evidence in the assessment above, that using these resources for direct marine environmental protection, especially if this was related to MPAs, would yield far more environmental benefit than the removal of thousands of tonnes of non-scarce materials to shore. The serious consideration of such a proposal would require the various parts of OSPAR (those relating to decommissioning and MPAs) to start bringing these issues together with a view to finding joint solutions to decommissioning and the wider protection of the marine environment. Then there is the added difficulty that fishing is outside the remit of OSPAR altogether, and is handled in the North Sea area by the European Commission, through the Common Fisheries Policy, for EU Member States, and by individual countries otherwise. This introduces great institutional complexity into any potential discussions about a strategy that involves conserving fish as well as the marine environment. However, it should also be noted that such discussions are already taking place in the context of attempts to agree at the EU level a Marine Thematic Strategy, which, among other things, is proposing the establishment by 2010 of Eco-Region Marine Environmental Protection Plans (European Commission 2004). It would seem highly desirable that out of these discussions emerge an effective mechanism to look at such overlapping issues as the possible relationship between decommissioning outcomes and MPAs. The difficulties of establishing such a mechanism should not be underestimated. The reason for attempting to overcome them is that utilising resources from the offshore oil and gas industry that

31
were made available for marine environmental protection as part of a package that combined decommissioning with MPAs for habitat protection and the regeneration of fish stocks could transform the prospects for marine environmental conservation. It is hoped that this paper will make a contribution to discussion of these issues. 7 REFERENCES
1. AURIS Environmental August 1995, An assessment of the environmental impacts of
decommissioning options for oil and gas installations in the north sea, Report produced for UKOOA.
2. Ayres, R. & Ayres, L. 2002 A Handbook of Industrial Ecology: Material flows due to mining
and urbanization, Ian Douglas and Nigel Lawson, Edward Elgar, Cheltenham UK, 351-364. 3. ConocoPhillips 1999, Ekofisk I disposal:Impact Assessment Environmental and Societal
Impacts, Phillips Petroleum Company Norway 22 October 1999 - http://phillips.netpower.no/index.asp?iLangId=1
4. ConocoPhillips 2002 ‘Parliament approves in-place disposal of Ekofisk Tank’, Epoke, Information on the Ekofisk I Cessation project, www.phillips.no/cessation, No.12, October, http://phillips.netpower.no/FileArchive/86/Epoke%20okt%20e2002.pdf
5. Cordah 2000, Determination of the Physical Characteristics of Cuttings Piles, using Existing
Survey Data and Drilling Information, R & D Programme 1.1, A Report for the UKOOA Drill Cuttings Joint Industry Project, Phase one report, January 2000.
6. DTI (Department of Trade and Industry) 1999 Oil and Gas Resources of the United Kingdom
1999, Department of Trade and Industry 1999, Electronic Publication by Data by Design Ltd 1999 - http://www.dbd-data.co.uk/bb1999/
7. DTI (Department of Trade and Industry) 2001, Offshore Decommissioning Unit Department
for Trade and Industry, August 2001, Guidance Notes for Industry: Decommissioning of offshore installations and pipelines under the Petroleum Act 1998, http://www.og.dti.gov.uk/regulation/guidance/decommission.htm
8. DTI (Department of Trade and Industry) 2002, Energy – its impact on the environment and
society, Annex 2A: Decommissioning of offshore oil and gas installations, pp. 43-64. Department of Trade and Industry. http://www.dti.gov.uk/energy/environment/energy_impact/impact_booklet.pdf
9. DTI (Department of Trade and Industry) 2003 Digest of UK Energy Statistics (DUKES),
Generation. Fuel used in generation, DUKES Table 5.4, http://www.dti.gov.uk/energy/inform/energy_stats/electricity/dukes5_4.xls
10. Ekins, P. 2000, Economic Growth and Environmental Sustainability: The Prospects for Green
Growth, Routledge, London and New York

32
11. Ekins, P., Vanner, R. & Firebrace, J. 2005 Decommissioning Scenarios: A Comparative
Assessment Using Flow Analysis, PSI Working Paper, Policy Studies Institute, London, www.psi.org.uk
12. Enviros 2000 Local Authority Waste Management Costs Study, Enviros Aspinwall Scottish
Executive Central Research Unit 2000 - http://www.scotland.gov.uk/cru/documents/lawm-05.asp
13. European Commission 2004 ‘The European Marine Strategy: Meeting of the Working Group
on Strategic Goals and Objectives (SGO)’, document SGO (2) 04/4/1, May, European Commission, Brussels
14. ERT (Environment and Technology Ltd.) 1997, Decommissioning of offshore Structures –
Energy use consideration: Final Report, Environment & Technology Ltd (ERT 97/016). 15. Gell, F. & Roberts, C. forthcoming ‘Benefits Beyond Boundaries: the Fishery Effects of
Marine Reserves’, Trends in Ecology and Evolution 16. Gerrard, S., Grant, A., Marsh, R. & London, C. 1999 Drill Cuttings Piles in the North Sea:
Management Options During Platform Decommissioning, Research Report No.31, Centre for Environmental Risk, University of East Anglia
17. Greenpeace 2004 ‘The Role of Science in Abandonment Policy’,
http://archive.greenpeace.org/dumping/noticeboard/reports/sciencerole.html, consulted 2.3.04 18. HSE (Health and Safety Executive) 2001 Reducing risk, protecting people; HSE’s decision
making process, Copyright Unit, Her Majesty’s Stationery Office, London 19. IP (Institute of Petroleum) 2000, Guidelines for the Calculation of Estimates of Energy use and
Gaseous Emissions in the Decommissioning of offshore structures, The Institute of Petroleum, February 2000 ISBN 0 8593 255 3.
20. IRG (Independent Review Group, Shepherd, J.G., Wilkinson, W.B., Bakke, T., Cowling, M.,
Dover, W., Rullkotter, J.) 2004 ‘Report of the Independent Review Group (IRG)’, Case Study A Decommissioning Project, April, http://www.bp.com/liveassets/bp_internet/globalbp/STAGING/global_assets/downloads/S/Scotland_N_W_H_IRG_Final_Report_26_April_2004_1.pdf
21. Kemp, G. & Stephen. L. 2001 Economic aspects of Field Decommissioning in the UKCS,
North Sea Occasional Paper No. 81, May, University of Aberdeen Department of Economics, Aberdeen
22. OSPAR 1992, The Convention for the Protection of the Marine Environment of the North-East
Atlantic, September, http://www.ospar.org/eng/html/welcome.html 23. OSPAR 2000 Quality Status Report 2000: Region II Greater North Sea, OSPAR Commission,
London

33
24. OSPAR 2003 ‘Bremen Statement’, following the Ministerial Meeting of the OSPAR Commission, Bremen, June 25th, http://www.ospar.org/eng/html/welcome.html
25. Phillips UK 1999, Maureen Decommissioning Programme, Section 2, Executive Summary,
http://www.phillips66.com/maureen/decommprog/pdfs/sect02.pdf 26. RCEP (Royal Commission on Environmental Pollution) 2004 Turning the Tide: Assessing the
Impact of Fisheries on the Marine Environment, 25th Report, Cm 6392, December, The Stationery Office, London
27. SRG (Scientific Review Group) 2002 ‘Final Report of the Scientific Review Group’, UKOOA
Drill Cuttings Initiative, January, available on CD as described under UKOOA 2002, UKOOA, London
28. UKOOA (UK Offshore Operators Association) 1999, Industry guidelines on: A framework for
risk related decision support, issue No. 1, May, UKOOA, London
29. UKOOA (UK Offshore Operators Association) 2002, UKOOA Drill Cuttings Initiative: Final Report, – Joint Industry Project (JIP), Research and Development Phases 1 and 2, 2000, CD re-released in 2002, UKOOA, London http://www.oilandgas.org.uk/issues/drillcuttings/pdfs/finalreport.pdf, also see UKOOA website at, http://www.ukooa.co.uk/issues/decommissioning/links.htm
30. UKOOA (UK Offshore Operators Association) 2004, Maximising Britain’s Oil and Gas
Resource, UKOOA Economic Report 2004, UKOOA, London 31. UYSEG (University of York Science Education Group) 2005 ‘The End of Brent Spar’
http://www.uyseg.org/risked/pages/spar/spar_index.htm, accessed January 2005 32. Watson, T. 2001 ‘The Environment and the Decommissioning of Offshore Installations’, MA
Dissertation, Greenwich Maritime Institute, University of Greenwich, London 33. Watson, T. 2004 Personal communication, February 25th 34. Wills, J. 2000 Muddied Waters: A Survey of Offshore Oilfield Drilling Wastes and Disposal
Techniques to Reduce the Ecological Impact of Sea Dumping, for Ekologicheskaya Vahkta Sakhalina (Sakhalin Environment Watch), 25th May 2000 - http://www.alaskaforum.org/other/muddiedwaters.pdf
34
8 ANNEX: SUMMARY OUTCOMES FOR DIFFERENT ELEMENTS IN DECOMMISSIONING
8.1.1 Topside of Large Steel Structure
The reference scenario for the topside (T1) of a large steel structure is to leave it in situ. This involves abandoning 20,520 tonnes (t) of materials, of which 20,271t have to be replaced, with an energy use of 12,523 toe, with associated emissions of CO2, NOx and SO2 as shown in the table. The non-financial outcomes are the reference against which the other scenarios are compared. The cost of T1 is taken to be £0, but there is an unquantified residual financial liability to the owners for the structure and other materials left in situ. Scenario T2 (removal and shallow disposal of the topside) leaves the same amount of material from the structure in the sea, but requires 3,790t of diesel and 1,188t heavy fuel oil (to provide power to run the topside during the decommissioning process), and 1,200t of temporary steel, as well as 5,060 toe of energy, to carry it out. The 1,200t temporary steel (which is left in the sea) is added to the material which has to be replaced on shore, so more energy is required for recycling. The TER has increased by 5,776 toe (46%) over T1, with proportionately higher associated air emissions. The seabed is not clear (as it was not in T1), and the outcomes for health and safety, marine impacts, conservation and extraction of resources and the fishing industry are all more negative than in T1. The landfill outcome is the same, and fish stocks are likely to have benefited (because the topside was not previously acting as a reef). The additional expenditure of this scenario is £18.6m (£9.3m to UK taxpayer), and the financial liability to the owner for the materials and structure left in the sea remains. Scenario T3 (removal to shore and reprocessing of topside) uses 7,071t (7,279 toe) more diesel fuel than T1 and 1,188 tonnes (1,152 toe) more heavy fuel oil, but saves 7,839 toe by recovering, rather than having to replace, the material. 244t of material (211t of which is active waste) needs to be landfilled in non-hazardous landfill facilities, at a cost of £6,888. There is an additional 5 tonnes of hazardous waste consisting of such material as LSA (low specific activity) radioactive material, PCBs and an estimated 4 tonnes of asbestos which would need to be dealt with by specialist contractors and disposal firms. Cost estimates for managing these waste streams are not available from Case Study A, and would be difficult to predict with any level of certainty without more certain knowledge of how it will be managed, but there is no residual financial liability to the owners for any of this landfilled material. The TER includes electricity used in onshore dismantling of the topside, which is not included in the material inputs column. Therefore, as noted above, the TER in this and the other matrices does not necessarily equal the sum of the energy inputs across the row of the matrix. Of the other non-financial outcomes relative to T1, T3 produces a clear seabed, and clear benefits in terms of the conservation and extraction of resources, and to the trawling fishing industry. However, T3 is clearly worse than T1 in respect of fish stocks, and seems marginally worse in terms of landfill and impacts on the marine environment. The additional expenditure of T3 is £30.4m (£15.2m to UK taxpayer). 8.1.2 Jacket of Large Steel Structure
The reference scenario for the jacket (J1) of a large steel structure is to leave it in situ. This involves abandoning 9,500t of steel and aluminium, all of which has to be replaced, with an energy use of 7,942 toe, with associated emissions of CO2, NOx and SO2 as shown in the table. The non-financial outcomes are the reference against which the other scenarios are compared. The

35
cost of J1 is taken to be £0, but there is an unquantified residual financial liability to the owners for the structure and other materials left in situ. Scenario J2 (removal and shallow disposal of the jacket) leaves the same amount of material from the structure in the sea, but requires 3,122t of diesel and temporary steel and 2,600 toe of energy, to carry it out. The 600t temporary steel (which is left in the sea) is added to the material which has to be replaced on shore, so more energy (358 toe) is required for recycling. The TER has increased by 2,958 toe toe (37%) over J1, with air emissions increased by an even greater proportion, because of the relative emission intensity of the diesel. The seabed is not clear (as it was not in J1), and the outcomes for health and safety, marine impacts, conservation and extraction of resources and the fishing industry are all more negative than in J1. The landfill outcome, and that for fish stocks, are the same. The additional expenditure of this scenario is £23m (£11.5m to UK taxpayer), and the financial liability to the owner for the materials and structure left in the sea remains. Scenario J3 (removal to shore and reprocessing of the jacket) uses 4,339t more materials and 3,852 toe more energy than J1 in the removal, but saves 5,699 toe by recovering, rather than having to replace, the steel and aluminium. 700t of material (marine growth) needs to be landfilled, at a cost of £21,000, but there is no residual financial liability to the owners. The TER of J3 is only 80% that of J1, but it produces more air emissions, because the emission intensity of offshore diesel use is higher than that of onshore refining. Of the other non-financial outcomes relative to J1, J3 produces a clear seabed, and clear benefits in terms of the conservation and extraction of resources, and to the fishing industry. However, J3 is clearly worse than J1 in respect of health and safety, fish stocks, landfill and impacts on the marine environment. The additional expenditure of J3 is £27.7m (£13.8m to UK taxpayer). 8.1.3 Footings of Large Steel Structure
The reference scenario for the footings (F1) of a large steel structure is to leave them in situ. This involves abandoning 10,300t of steel and aluminium, all of which has to be replaced, with an energy use of 7,512 toe, with associated emissions of CO2, NOx and SO2 as shown in the table. It may be noted that the replacement of the materials for the footings requires less energy than for the jacket (J1), despite the greater quantity of materials involved, because the footings contain less energy-intensive aluminium. The non-financial outcomes are the reference against which the other scenarios are compared. The cost of F1 is taken to be £0, but there is an unquantified residual financial liability to the owners for the footings left in situ. Scenario F2a (removal of the footings but leaving the drill cuttings in situ, with no distinction made between cutting the footings at the level of the cuttings and removing them entirely) requires 4,201t of diesel and temporary steel and 3,608 toe of energy to recover the materials, but saves 5,104 toe by recovering, rather than having to replace, the steel and aluminium. 1,000t of material (cement grout and marine growth) needs to be landfilled, at a cost of £21,550, but there is no residual financial liability (for the footings, though that for drill cuttings will remain) to the owners. The TER of F2a is only 85% that of F1, but it produces more air emissions. Of the other non-financial outcomes relative to F1, F2a does not produce a clear seabed (because the cuttings are left in situ), and is clearly worse than F1 in terms of health and safety, impacts on the marine environment, landfill and fish stocks. However, F2a is clearly better than F1 in terms of the conservation and extraction of resources, and in respect of the fishing industry. The additional expenditure of F2a is £26.5m (£13.3m to UK taxpayer).

36
The material and energy outcomes of Scenario F2b (removal of the footings and the drill cuttings to shore) are taken to be the same as F2a, the extra materials and energy required to remove the cuttings being assigned to the cuttings decommissioning scenario. A difference between F2b and F2a is that in F2b there is no residual financial liability to the owners for either the footings or drill cuttings. The TER of F2b is the same as that of F2a. The other non-financial outcomes of F2b are similar to F2a, except that now there is a clear seabed (the fate of the cuttings is considered under the cuttings decommissioning scenario), and more benefits to the fishing industry. The additional expenditure of F2b is the same as that of F2a. 8.1.4 Entire Large Steel Structure
The reference scenario for the entire large steel structure is to leave it in situ, combining the three in situ references scenarios for the individual components of the structure (T1, J1, F1). This involves abandoning over 40,000t of metals, all of which has to be replaced, with an energy use of 27,976 toe, with associated emissions of CO2, NOx and SO2 as shown in the table. The non-financial outcomes are the reference against which the other scenarios are compared. The cost of this reference scenario for the whole structure is taken to be £0, but there is an unquantified residual financial liability to the owners for the structure (and any other materials left in situ). The next whole-structure scenario to be considered is the removal and shallow disposal of the topside and jacket (T2, J2), while leaving the footings in situ (F1). This leaves the same amount of material from the structure in the sea, but requires 9,300t of diesel and temporary steel and 7,760 toe of energy, to carry it out. The 1,800t temporary steel (which is left in the sea) is added to the material which has to be replaced on shore, so more energy is required for recycling. The TER has increased by 8,734 toe (31%) over the whole-structure reference scenario, with proportionately higher associated air emissions. The seabed is not clear (as it was not in the reference scenario), and all the other non-financial outcomes are worse than in the reference scenario, except for landfill, which is the same, and fish stocks, which benefit from the reef effects of the shallow disposal. The additional expenditure of this scenario is £41.6m (£20.8m to UK taxpayer), and the financial liability to the owner for the materials and structure left in the sea remains. Removal of the whole structure to shore for reprocessing (T3, J3, F2a,b) uses 17,998t more materials and 15,896 toe more energy than the whole-structure reference scenario (TI, J1, F1), but saves 18,642 toe by recovering, rather than having to replace, the metals. 1,949t of material (the sum of that from T3, J3, F2a,b) needs to be landfilled, at a cost of £49,348, but there is no residual financial liability to the owners. The TER of this scenario is only 94% that of the whole-structure reference scenario, but it produces more air emissions. Of the other non-financial outcomes relative to this reference, this scenario produces a clear seabed, and clear benefits in terms of the conservation and extraction of resources. It is also positive for the fishing industry. However, the scenario is clearly worse than the reference in respect of health and safety, fish stocks, landfill and impacts on the marine environment. The additional expenditure of the scenario is £84.6m (£42.3m to UK taxpayer). 8.1.5 Mostly Concrete Structure
The reference scenario (CON1) for the mostly concrete structure is to leave it in situ. This involves abandoning over 1mt of materials, 46,134t of which are metals, while the rest is ballast and concrete. Most of this has to be replaced onshore, with an energy use of 30,649 toe, with

37
associated emissions of CO2, NOx and SO2 as shown in the table. The non-financial outcomes are the reference against which the other scenarios are compared. The cost of this reference scenario for the whole structure is taken to be £0, but there is an unquantified residual financial liability to the owners for the structure (and other materials left in situ). The scenario CON2 entails removing the structure to shore for reprocessing. This uses 61,204t (63,005 toe) more diesel fuel than CON1, but saves 20,718 toe by recovering, rather than having to replace, the materials. 83,700t of material (80,000t of which is concrete, the rest being marine growth) needs to be landfilled, at a cost of £1.47m, but there is no residual financial liability to the owners. The TER of CON2 is 189% more than that of CON1, and air emissions are also much greater (though less than proportionately), due to the high energy requirement of recovering the materials. Of the other non-financial outcomes relative to this reference, CON2 produces a clear seabed, and clear benefits in terms of the conservation and extraction of resources. It is also positive for the fishing industry. However, the scenario is clearly worse than CON1 in respect of health and safety, fish stocks, landfill and impacts on the marine environment. The additional expenditure of the scenario is £286.7m (£143.4m to UK taxpayer). 8.1.6 Pipelines
The reference scenario for pipelines (P1) is to leave them in situ with no remedial action. This involves abandoning 5,351t of materials, 5,127t of which have to be replaced onshore, with an energy use of 2,386 toe, with associated emissions of CO2, NOx and SO2 as shown in the table. The non-financial outcomes are the reference against which the other scenarios are compared. The cost of this reference scenario for the whole structure is taken to be £0, but there is an unquantified residual financial liability to the owners for the materials left in situ. The scenario P2 entails removing the pipelines to shore for reprocessing. This uses 2,046t (2,107 toe) more diesel fuel than P1, but saves 1,578 toe by recovering, rather than having to replace, the materials. 224t of concrete needs to be landfilled, at a cost of £3,808, but there is no residual financial liability to the owners. The TER of P2 is 28% more than that of P1, but air emissions, especially of NOx, are proportionately much higher than this, because of the NOx intensity of burning the diesel. Of the other non-financial outcomes relative to P1, P2 produces a clear seabed, and clear benefits in terms of the conservation and extraction of resources. It is also positive for the fishing industry, and no worse than P1 for health and safety and fish stocks. There is a small negative outcome in respect of landfill and impacts on the marine environment. The additional expenditure of the scenario is £19.9m (£10m to UK taxpayer). The scenario P3 entails leaving the pipelines in situ with remedial action. This uses only 259t (267 toe) more diesel fuel than P1, but leaves the same amount of material in the sea, and the same amount to be replaced, and leaves residual financial liability for owners. The TER of P3 is 11% more than that of P1, but extra NOx are again proportionately much higher than this (though less than in P2). Of the other non-financial outcomes relative to P1, P3 is only an improvement in respect of the fishing industry, is the same in respect of health and safety, fish stocks and landfill, and is worse in respect of natural resources and the marine environment. The additional expenditure of P3 is £1m (£½m to UK taxpayer). The scenario P4 entails trenching and burying the pipelines. It is very similar to P3, leaves the same amount of material in the sea, and the same amount to be replaced, although the pipelines are now covered, and leaves residual financial liability for owners. It uses 920t (947 toe) more diesel

38
fuel than P1. Its TER is 40% more than that of P1, with higher emissions, with extra NOx again proportionately much more increased. Air emissions are also greater than P3, though less than P2. The other non-financial outcomes are the same as for P3. The additional expenditure of P4 is £25m (£12.5m to UK taxpayer). 8.1.7 Drill Cuttings
The reference scenario for drill cuttings (C1) is to leave them in situ with no covering. This involves abandoning 40,000t of materials, but the great majority of these are waste materials, and only 1,413t of recoverable waste oil (contained in the cuttings) have to be replaced onshore. There is no energy use or air emissions in C1. The non-financial outcomes are the reference against which the other scenarios are compared. This is the only reference scenario which is given a negative impact on the marine environment (‘- -‘), because of the long-term ecological sterility of the cuttings pile and the continuous low-level leaching of contaminants from it.The cost of this reference scenario for the whole structure is taken to be £0, but there is an unquantified residual financial liability to the owners for the materials left in situ. The scenario C2 entails excavating and leaving the cuttings. This uses only 772t (794 toe) more diesel fuel than P1, but leaves the same amount of material in the sea, and leaves residual financial liability for owners. The TER and air emissions of C2 are obviously higher than the zero in this category of C1. Of the other non-financial outcomes relative to C1, C2 is the same in respect of health and safety, landfill, the fishing industry and fish stocks, but worse in respect of natural resources and the marine environment. The additional expenditure of C2 is £5.1m (£2.6m to UK taxpayer). The scenario C3 entails covering and leaving the cuttings (with or without the base of the footings left in place). This uses 4,004t (4,122 toe) more diesel fuel than C1, and about 166,000t of sand and gravel. The same amount of material is left in the sea, and the same amount has to be replaced as in C1, although the cuttings are now covered, perhaps reducing the financial liability for owners. C3 produces far more air emissions than the zero emissions of C1, but also nearly six times the CO2, and higher other air emissions, than C2. Of the other non-financial outcomes relative to C1, C3 is the same in respect of health and safety and landfill, better in respect of the fishing industry, fish stocks and the marine environment, but worse in respect of natural resources, with especially high resource extraction impacts because of the amount of sand and gravel used. The additional expenditure of C3 is £10.3m (£5.1m to UK taxpayer). The scenario C4 entails removing the cuttings to shore for reprocessing. This uses 9,073t (9,340 toe) more diesel fuel than C1, which is partially offset by the 1,413t (1,370 toe) of recovered oil. 38,587t of material needs to be landfilled, at a cost of £655,984, but there is no residual financial liability to the owners. The TER of C4 is 8,036 toe more than that of C1, with correspondingly high air emissions. Energy use is nearly twice, and air emissions are more than twice, those of C3. Of the other non-financial outcomes relative to C1, C4 produces a clear seabed, and benefits in respect of the fishing industry, fish stocks and the marine environment. It is the same for health and safety. However, it is very much worse than C1 in terms of landfill (assuming the cuttings cannot be processed into an inert construction material), and also negative in terms of resource extraction, and resource conservation (because of the extra diesel use). The additional expenditure of the scenario is £38.9m (£19.4m to UK taxpayer).