University of Washington Seattle, WA 98195 School of ...
78
FISHERIES RESEARCH INSTITUTE School of Fisheries University of Washington Seattle, WA 98195 HYDROACOUSTIC SURVEY OF FISH IN LAKES KOOTENAY, OKANAGAN AND SKAHA by Richard Thorne and David Marino Final Report to Ministry of Environment, Fisheries Branch Province of British Columbia Approved Submitted April 18, 1986 _________________ Director FRI-UW-8604 March 1986
Transcript of University of Washington Seattle, WA 98195 School of ...

FISHERIES RESEARCH INSTITUTESchool of Fisheries
University of WashingtonSeattle, WA 98195
HYDROACOUSTIC SURVEY OF FISH IN LAKESKOOTENAY, OKANAGAN AND SKAHA
by
Richard Thorne and David Marino
Final Report
to
Ministry of Environment, Fisheries BranchProvince of British Columbia
Approved
Submitted April 18, 1986 _________________
Director
FRI-UW-8604March 1986

TABLE OF CONTENTS
List of Tables iiiList of Figures iv
INTRODUCTION 1MATERIALS AND METHODS 1
Data Acquisition Equipment 1Survey Design 2Data Processing 3Target Strength Analysis 4
RESULTS 4
Kootenay Lake Population Estimates 4Lake Okanagan Population Estimates 5Skaha Lake Population Estimates 8Target Strength Measurements 8
RECOMMENDATIONS AND CONCLUSIONS 21LITERATURE CITED 24APPENDICES 25
11

LIST OF TABLES
Table Page
1. Density and population estimates from Kootenay Lake 6
2. Density and population estimates from Okanagan Lake 7
3. Population estimate and fish densities in variousdepth and section of transect 1, Skaha Lake 9
4. Densities and population estimate in various depths,transect areas 2-4, Skaha Lake 10
5. Partition of Skaha Lake estimates into variouscomponents 11
6. Distribution of mean target strengths in various depthand lakes 20
Appendix 1A. Kootenay Lake echoes and densities by depth andtransect 26
Appendix lB. Kootenay mean densities and variances bytransect 33
Appendix 1C. Duration in beam measurements, Kootenay Lake 34
Appendix 2A. Okanagan Lake echoes and densities by depth andtransect 35
Appendix 2B. Okanagan mean densities and variances bytransect 42
Appendix 2C. Duration in beam measurements, Okanagan Lake 43
Appendix 3. Okanagan Lake 1985 echogram count analysis 44
Appendix 4. Mean target strength, by echo, and frequencyhistogram for each depth interval for Kootenay andOkanagan lakes 46
Appendix 5. Examples of target strength analysis forKootenay Lake 55
iii

LIST OF FIGURES
Fig Page
1A. Kootenay Lake target strength histogram for depthinterval 10-20 meters 12
lB. Kootenay Lake target strength histogram for depthinterval 20-30 meters 13
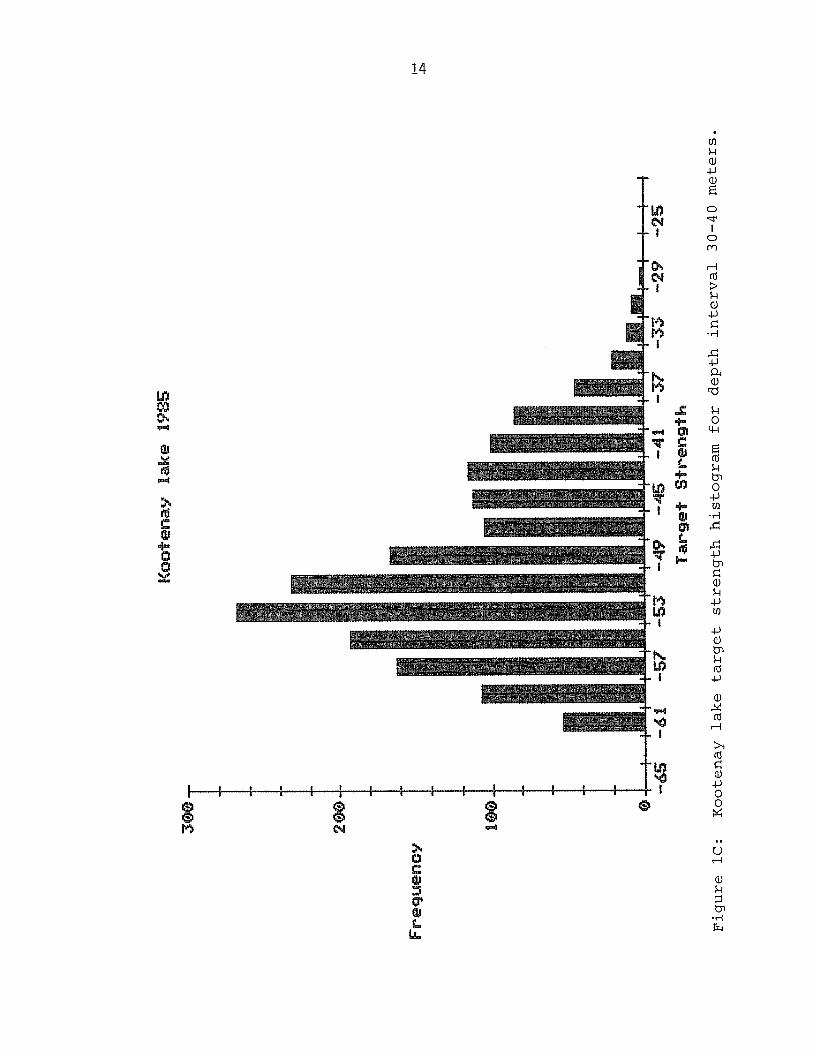
10. Kootenay Lake target strength histogram for depthinterval 30-40 meters 14
1D. Kootenay Lake target strength histogram for depthinterval 40-60 meters 15
2A. Okanagan lake target strength histogram for depthinterval 5-16 meters 16
2B. Okanagan lake target strength histogram for depthinterval 16—25 meters 17
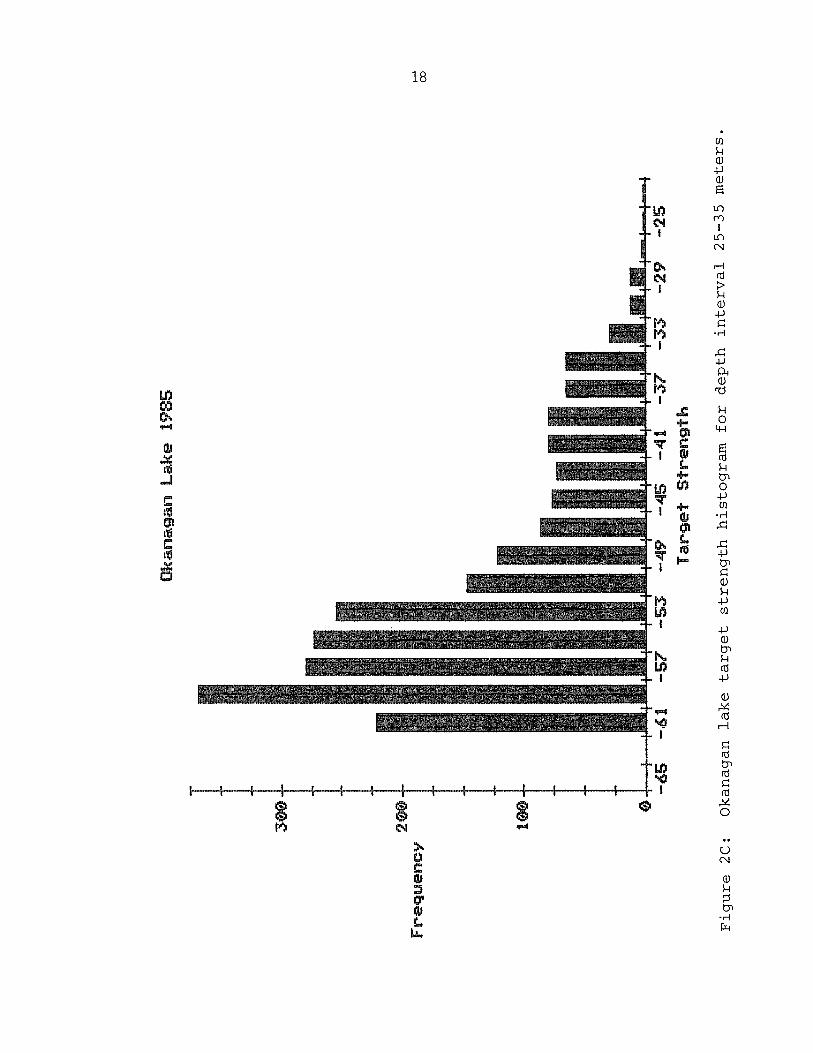
20. Okanagan lake target strength histogram for depthinterval 25-35 meters 18
2D. Okanagan lake target strength histogram for depthinterval 35—55 meters 19
iv

A
SLS~cLPU~sLq~~oJ.~.u~wd~nbe5uLsseDoJd~asnO~SnbULMOL[P~AO4~DLA~AeSe4.LLPL~Mpu~qSL~e143DUPUO~öULqSP~9fl3P~S40DUI‘SDLUOS0~)UPI’40~)1~LPLflOMef~
SiN3W~O~1MON)fDV
HYDROACOUSTIC SURVEY OF FISH IN LAKESKOOTENAY, OKANAGAN AND SKAHA
Richard Thorne and David Marino
INTRODUCTI ON
Sound has an exceptional capability to penetrate water and to
detect the presence of fish. Consequently, hydroacoustic techniques are
being increasingly used for study of fish distribution, abundance and
behavior in lakes (Thorne and Thomas 1984; Thorne 1984). We used these
techniques for assessment of kokanee populations in Lakes Kootenay,
Okanagan and Skaha, British Columbia, during September 1985. This
report describes the result of the survey.
MATERIALS AND METHODS
Data Acquisition Equipment
The principles underlying hydroacoustic techniques for fish detec
tion and enumeration are detailed in several papers and books including
Thorne (1984) , Johannesson and Mitson (1983) , and Clay and Medwin
(1977). Basically, a pulse of sound is transmitted into the water and
echoes from fish are received and analyzed. Although the principles are
similar to those underlying depth sounders and commercial fish finders,
the equipment and techniques applied for scientific purposes are more
specialized and quantitative. The equipment used for the Kootenay lakes
was a calibrated dual-beam echo sounding system, consisting of a
BioSonics model 101 dual channel 420 kHz transceiver, 6 and 15° dual
beam transducer, Ross 250C chart recorder, BioSonics 171 recording
interface, digital signal processor (Sony PCM), and Beta-format video

2
cassette recorder. A portable dual trace oscilloscope was used to
monitor system performance. All components except for the chart
recorder operate from 110 volt AC current and were powered using a 500
volt-amp static inverter which was driven from two 12-volt batteries
wired in parallel. The chart recorder was connected directly to a 12-
volt battery. The transducer was mounted in a V—fin towing vehicle and,
using a davit, suspended alongside the boat at a depth of 0.5-1 m.
The selection of system settings was based on the smallest expected
fish size, i.e., an age 0 sockeye salmon, for which this system have
been extensively used (Thorne and Thomas 1984). The transmit level was
-6 decibels (dB) and the receiver gains were +12 dB for both narrow and
wide beam channels. A time-varied-gain (TVG) of 40 log range was used
to obtain similar echo levels from individual fish independent of depth.
Other parameters included pulse width of 0.5 msec, pulse rate of four
transmissions per second, and a bandwidth of 5 kHz. Record levels for
both narrow and wide channels on the digital signal processor were set
so that a 5 volt-peak signal just reached the recording saturation
level. Calibration tones were recorded at the beginning and end of each
tape so that playback gains could be adjusted to proper levels for post
survey processing.
Survey Design
The lakes were surveyed during 5 consecutive nights in September.
Lake Kootenay was surveyed during the nights of September 9 and 10.
Nine orthogonal transects were run over the lake, each replicated once.
Lake Skaha was surveyed the night of September 11 by four replicated

3
transects and Lake Okanagan was surveyed the nights of September 12 and
13 by ten replicated transects. In all cases, replicates were run
immediately and in the opposite direction of the first. Boat speed was
about 3 rn/sec and was maintained by running the boat motor at a constant
rpm. Transects were located and course maintained by the ship’s
compass and radar in conjunction with maps and prominent landmarks
onshore.
Data Processing
Target densities in all lakes were sufficiently low for employment
of echo counting techniques (Thorne 1984). The hydroacoustic data were
played back by the same recording instruments described above and were
analyzed with a dual-channel storage oscilloscope. The water column was
divided into four continguous depth intervals based on the depth
intervals used by British Columbia Fish and Wildlife to capture fish.
For Lake Kootenay, the depth intervals were: 10-20, 20—30, 30—40, and
40-60 m. Each transect replicate was further divided into three equal
time portions to investigate horizontal distribution. For Okanagan
Lake, the depth intervals were: 5—16, 16—25, 25—35, and 35—55 rn. These
transect replicates were also divided into three sections. For Skaha
Lake the four depth intervals were: 5—15, 15—25, 25—35, and 35-54 m.
All targets which exceeded the minimum threshold were counted for each
transect, replicate, section and depth interval. The counting threshold
was set at 0.24v, a level about 30 dB below peak echo voltage observed
on the narrow beam channel, and slightly below the highest voltages
observed from mysid scattering layers. For all three lakes, the
effective sampling characteristics of the transducer beam were measured

4
by the duration-in--beam technique (Thorne 1984). Total lake estimates
were determined by extrapolating the measured fish densities over the
appropriate area represented by each transect. Total estimates were
allocated to species/cohort groups from independent trawl catch data
provided by British Columbia Fish and Wildlife.
~~~g~h_AnaJysis
In addition to the echo counting, target strength analysis was per
formed on the data with a BioSonics dual—beam target strength processing
system (Ehrenberg 1974). Data from all transects on Kootenay Lake,
Okanagan Lake, and from transect one of Skaha Lake were processed on the
dual beam system. The dual-beam data were written to an MS-DOS disk
ette. The same target threshold of .24 volts-peak was used. The
minimum pulse length for single target criteria was .350 msec at -6 dB
and the maximum was .700 msec. Post processing of the target strength
data included two types. The normal TS measurement program calculates
the TS frequency and mean values on a per-echo basis. A second program,
called TRACK (McClain 1985) tracks individual fish as they pass through
the transducer beam and calculates values on a per—fish basis. This
program was applied to the data with several different beam angle
thresholds and minimum track numbers.
RESULTS
Kootenay Lake Population Estimates
Significant differences were observed in the effective sampling
beam of the transducer between transects 1-4 and the remainder of the
lake, probably as a result of backscattering by mysid concentrations.

5
The duration in beam measurement of the effective sampling cone was 7.8°
for transects 1—4 and 9.1° for transects 5—9 (720 echo duration
measurements). The results of echo counts and density calculations by
depth and transect, as well as variance calculations and echo duration
measurements, are given in Appendix 1. The data are summarized by
transect section in Table 1. The total estimated fish population in the
lake was 9,323,900 ± 913,300 fish. The breakdown by cohort according to
the trawl data was: age 0 = 5,455,400 ± 534,400; age 1 = 1,421,900 ±
139,300; age 2 = 2,149,200~± 210,500 and age 3 = 297,400 ± 29,100. The
confidence intervals for the various cohorts only incorporates variabil
ity from the acoustic data. The trawl cohort proportions were assumed
constant and without error because the trawl data base was insufficient
for a more rigorous treatment. Furthermore, some of the nearshore near-
bottom fish targets in Kootenay and Okanagan lakes were suspected to be
non—kokanee species. Therefore, the total population estimate likely
over estimated the kokanee population.
Lake Okanagan Population Estimates
Six-hundred sixty-four echo duration measurements were made along
transects in Lake Okanagan. The mean estimated sampling beam was 9.2°
with no significant difference among transects. The resulting echo
count and density measurements by depth and transect, as well as vari
ance calculations and echo duration measurements are given in Appendix
2. Estimates by transect section are summarized in Table 2. The total
lake estimate was 9,630,900 ± 366,700 fish. Population breakdown by
cohort from trawl data was: age 0 4,373,700 ± 166,500; age 1
1,502,400 ± 57,200; age 2 = 1,236,600 ± 47,000; age 3 = 2,385,600 ±

6
Table 1. Density and population estimates from Kootenay Lake.
~sityTransect Section (#11000 sq. m) Pqp~j~tion
1 West 20.42Middle 10.52 1,241,600East 18.09
2 West 9.34Middle 22.91 928,800East 13.50
3 West 11.41Middle 21.41 1,000,600East 24.05
4 West 13.04Middle 18.31 953,300East 33.85
5 West 23.11Middle 40.58 1,035,300East 34.64
6 West 37.85Middle 15.68 661,400East 59.50
7 West 24.87Middle 11.47 861,800East 32.81
8 West 38.51Middle 44.39 1,595,700East 35.65
9 West 24.11Middle 26.66 1,045,400East 32.72
TOTAL 9,323,900

7
Table 2. Density and population estimates from Okanagan Lake.
Mean densityTransect Section (#11000 sg.m) Population
1 West 24.40Middle 37.95 1,419,800East 27.31
2 West 33.41Middle 45.72 1,130,600East 21.50
3 West 20.94Middle 31.62 674,400East 16.56
4 West 32.05Middle 58.26 1,726,800East 34.66
5 West 11.59Middle 36.98 780,300East 27.72
6 West 9.72Middle 19.71 360,600East 12.47
7 West 31.40Middle 40.06 1,259,400East 30.60
8 West 22.42Middle 29.39 949,000East 27.87
9 West 8.63Middle 27.49 818,100East 15.29
10 West 31.41Middle 35.37 511,900East 23.56
TOTAL 9,630,900

8
90,800, and age 4 = 132,900 ± 5,100. Again, the trawl cohort portions
were treated as constants in the variance calculation.
Skaha Lake Population Estimates
The duration in beam measurement of the transducer sampling angle
along transect 1 of Skaha Lake was 8.06°. Echo counts and corresponding
densities are given in Table 3. As a result of a failure in the record
ing system, data from transects 2-4 were not recorded on tape, but were
printed on the echogram. Consequently, estimates for these transects
were obtained from analysis of the chart records. First, comparisons
were made between oscilloscope counts and echogram counts for ten tran
sect replicates on Lake Okanagan. The resulting linear regression had
an r value of 0.974 (Appendix 3). This regression was then applied to
the echograms from Skaha Lake to obtain fish density estimates. The
resulting corrected echo counts and corresponding densities are given in
Table 4. The total lake estimate was 489,600 fish. The estimate is
partitioned by cohort and source (wild or hatchery) in Table 5. Confi
dence intervals were not calculated for Skaha because we lost the direct
acoustic data.
Target Strength Measurements
The results of standard, dual-beam, single echo target strength
measurements by depth are given in Appendix 4 and Figures 1A, 13, C, D
and 2A, B, C, 0 for Kootenay and Okanagan, respectively. Mean target
strengths by depth are listed in Table 6. No partition by cohort is
apparent in the data. Further analysis was conducted with the TRACK
program and several different beam angle and track number combinations

9
Table 3. Population estimate and fish densities in various depth andsections of transect 1, Skaha Lake.
~pth Fish Density -
Transect (ml Targets (#11000 cu. m) (#11000 sq. m)
1—1 5—15 3 0.91 9.1215—25 7 1.16 11.5625—35 0 0.00 0.00
1-2 5-15 6 1.83 18.2515—25 7 1.16 11.5625-35 7 0.71 7.10
1-3 5~15 1 0.30 3.0415—25 3 0.50 4.9625—35 0 0.00 0.00
1R—3 5—15 1 0.27 2.7315—25 5 0.74 7.4325—35 5 0.46 4.56
1R—2 5-15 9 2.46 24.6015—25 6 0.89 8.9125-35 2 0.18 1.82
1R-1 5-15 4 1.09 10.9315—25 2 0.30 2.9725—35 2 0.18 1.82
Total Population, Transect 1 = 67,100

10
Table 4. Densities and population estimates in various depths, transectareas 2-4, Skaha Lake.
Depth Targ~~ Density~Pop~on
2 5—15 9 14.7 0.5515—25 43 61.7 1.2525—35 46 65.8 0.8235—54 7 11.9 0.05
2R 5—15 16 24.3 0.8815—25 66 93.4 1.8425—35 42 60.3 0.7335—54 4 7.8 0.03
3 5—15 3 6.4 0.2115—25 39 56.1 1.0225—35 71 100.4 1.1135—54 23 34.0 0.13
3R 5-15 9 14.7 0.4515—25 52 74.1 1.2425—35 64 90.7 0.9335—54 22 32.6 0.12
4 5-15 3 6.4 0.1815—25 35 50.6 0.8025—35 71 100.4 0.9735—54 6 10.5 0.04
4R 5—15 3 6.4 0.1815—25 49 70.0 1.1025—35 56 100.6 0.7735—54 5 9.1 0.03
151,000
144,900
126,600
Total population, transects 2-4 = 422,500
Total lake population = 489,600

00E17’E000L000t709E’9089’6TE!00017000L17’81708E’6~66000900017L’9E0EL’~!E1009~0.010LE~’I17~0~9’~6E617’O68100
~P[~M~Vuo~ndoj~oqo~u
s~ueuodwoDSflO~JPAo~u~se~w~z~see~i~j.oUoL~L;J~ds
ii

Ko
ote
na
yla
ke
19
~
Fre
qu
en
cy
Ta
rge
tS
tre
ng
th
Fig
ure
1A
:K
oo
ten
ay
lake
targ
et
str
en
gth
his
tog
ram
for
de
pth
inte
rva
l1
0-2
0m
ete
rs.
4 2
-~S5
~-5
7-s
~

Fre
qu
en
cy
Ko
ote
na
yla
ke
19
85
Ta
rge
tS
tre
ng
th
(~)
-~5
-si.
-57
-5~
-49
-45
-41
-2~
Fig
ure
1B:
Ko
ote
na
yla
ke
targ
et
str
en
gth
his
tog
ram
for
de
pth
inte
rva
l2
0-3
0m
ete
rs.
Ko
ote
na
yla
ke
198~
4S
2ø
~
Fre
qu
en
cy
-~s
-~i
Ta
rge
tS
tre
ng
th
-2S
Fig
ure
1C:
Ko
ote
na
yla
ke
targ
et
str
en
gth
his
tog
ram
for
de
pth
inte
rva
l3
0-4
0m
ete
rs.

Ko
ate
na
yla
ke
1985
40
30
Fre
qu
en
cy
20 le 0
Ta
rge
tS
tre
ng
th
Fig
ure
1D:
Ko
ote
na
yla
ke
targ
et
str
en
gth
his
tog
ram
for
de
pth
inte
rva
l4
0-6
0m
ete
rs.
-25

Oka
na
ga
nL
ake
1985
Fre
qu
en
cy
4 2 0
I.
-57
-53
-49
-45
-41
-37
-33
-29
Ta
rge
tS
tre
ng
th
Fig
ure
2A:
Oka
naga
nla
ke
targ
et
str
en
gth
his
tog
ram
for
de
pth
inte
rva
l5
-16
me
ters
.

12
0
90
Fre
qu
en
cy
~0
30
Oka
na
ga
nL
ake
198S
0
Ta
rge
tS
tre
ng
th
Fig
ure
2B:
Oka
naga
nla
ke
targ
et
str
en
gth
his
tog
ram
for
de
pth
inte
rva
l1
6-2
5m
ete
rs.
-‘5
Fre
qu
en
cy
30
0
20
0
100
Oka
na
ga
nL
ake
1985
Ta
rge
tS
tre
ng
th
I. co
-~
-.~
1-5
7—
53-4
9-4
5-4
1-3
7-3
3-2
9
Fig
ure
2C
:O
kan
ag
an
lake
targ
et
str
en
gth
his
tog
ram
for
de
pth
inte
rva
l2
5-3
5m
ete
rs.

Oka
na
ga
nL
ake
198S
I’
2Ø
G
ise
1~
eF
req
ue
ncy
-~
-~j
-~7
-~
-49
-4~
-41
-37
-33
-29
-2~
Ta
rge
tS
tre
ng
th
Fig
ure
2D:
Oka
naga
nla
ke
targ
et
str
en
gth
his
tog
ram
for
de
pth
inte
rva
l3
5-5
5m
ete
rs.

0——0t7171819—99~009—8609—~t7~6!9-8th6617—E01619—~99P19—9~t1E19—6809—t~08t7—II68i7—I
#SISISI~~q;deo
Se~pu~sq~.depSflO~..APAu~sq;6ue~s3e&~;u~ew~ouov~.nqLJ~sLa9~

21
were applied. Examples are illustrated in Appendix 5. Some separation
into two groups appeared to occur with relatively narrow beam acceptance
criteria (less than 4.3°), and greater than 3 echoes per fish. However,
even though the basic data set consisted of several thousand fish, these
restrictive parameters reduced sample sizes to relatively small numbers,
so the separation was not conclusive. The basic problem was that the
relatively high transect speed, about 3 rn/sec. restricted echo durations
within 4° of the acoustic axis to less than 5 per target. This small
number does not appear to converge on a mean target strength sufficient
ly for adequate separation of the cohorts. Central limit considerations
would imply that echo duration numbers should be in the vicinity of 30
per fish before convergence on a mean is achieved. If this is the case,
separation of cohorts by acoustic target strength may be possible only
with large track numbers and near axis measurements. This circumstance
would require separate data collection since this combination does not
occur with the high boat speed used during normal surveys.
RECOMMENDATIONS AND CONCLUSIONS
The distribution of fish in the three lakes was very suitable for
hydroacoustic estimation techniques. Fish were distributed in midwater
away from surface or bottom boundaries which could confound detection,
and densities were sufficiently low for application of echo counting,
which is the most efficient data processing technique. Distributions
were also sufficiently dispersed that estimates could be obtained with
narrow confidence intervals. Reduction in transect effort may even be
possible in future surveys, depending upon the desired precision. The

22
only difficulty, excepting the unfortunate loss of part of the Skaha
Lake data, was in the cohort separation. The trawl data were limited
and subject to bias from selective capture. Clear separation of the
acoustic data was not obtained even with the advanced track routines.
However, the data were clearly limited for this purpose because transect
speed was relatively high. Acoustic partition of cohorts may be
possible, but would require a separate mode of data collection,
preferably a drifting or stationary deployment where large track
numbers, 20—30 per fish, could be obtained. Such extra data collection
could be achieved with a similar level of effort by slightly reducing
the number of transects on Kootenay and Okanagan. This reduction is
feasible considering the relatively narrow confidence intervals on the
overall population estimates. An alternate approach would be to
determine the degree of selectivity of the trawl by direct acoustic
measurement of trawl efficiency. The trawl data suggest that virtual
separation of the 0 age cohort from older fish occurs spatially during
certain times of the year. Acoustic determination of fish density
synoptic with the trawling operation allows direct measurement of the
trawl efficiency. If the 0 age cohort is spatially separated, such
measurements would also determine the trawl selectivity for the age 0
and older groups. In addition, target strength measurements under cir
cumstances where age 0 fish are spatially separated would allow eval
uation of the basic variance in the target strength measurement, and the
track size necessary to separate the age 0 cohort acoustically. Since
trawl operations are conducted at a relatively low speed (1.0-1.5 m/sec)

uoL;L;Jed3JO~ODaq;
AO4saz~s)jDQJ3e3enbep~epiAo.AdOSLP4q6~1UUOL~DO~LODeq*ep~oepowsLq~

24
LITERATURE CITED
Clay, C. S. and H. Medwin. 1977. Acoustical Oceanography: Principles
and applications. John Wiley and Sons, New York.
Ehrenberg, J. E. 1974. Two applications for a dual-beam transducer in
hydroacoustic fish assessment systems. Proceedings, Oceans 1974,
Conference on Engineering in the Ocean Environment 1: 152-157.
Johannesson, K. A. and R. B. Mitson. 1983. Fisheries acoustics: a
practical manual for aquatic biomass estimation. FAO Fish. Tech.
Pap. 240. 249 p.
McClain, C. J. 1985. An application of a new dual-beam technology for
hydroacoustic investigations in fisheries. (Abstract.) Mar. Tech.
Soc. Journ. 19(5): 57.
Thorne, R. E. 1984. Hydroacoustics. Chapter 12 in L. Nielsen and 0.
Johnson (eds.), Fisheries Techniques. Amer. Fish. Soc., Bethesda,
Md.
Thorne, R. E. and B. L. Thomas. 1984. Recent applications of hydro
acoustics to assessment of limnetic fish abundance and behavior.
Proceedings, 3rd Conference on Lake and Reservoir Management. U.S.
Environmental Protection Agency, 440/5/84—001.

S3DI~N~ddY

26
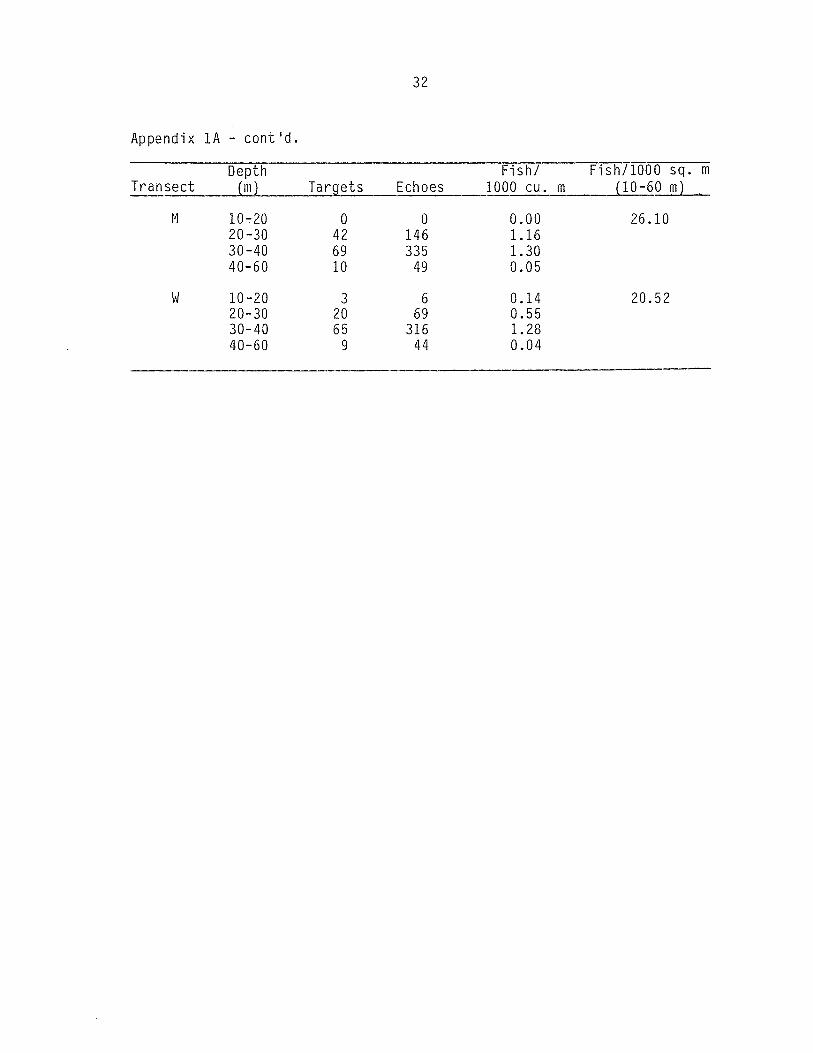
Appendix 1A. Kootenay Lake echoes and densities by depth and transect.
tE~~T~T~Fish/1000sq.mTransect (ml Targets Echoes 1000 cu. m J10-60 m)
1—W 10—20 4 10 0.07 22.9420—30 147 629 1.4830-40 52 311 0.3740—60 106 645 0.19
M 10—20 0 0 0.00 15.0620—30 115 492 1.1630-40 48 288 0.3440—60 2 12 0.00
E 10—20 3 8 0.05 26.1520-30 189 809 1.9030-40 62 371 0.4440—60 62 376 0.11
1R—E 10—20 1 3 0.02 14.6920-30 80 342 0.9730—40 29 174 0.2540—60 53 322 0.11
N 10—20 1 3 0.02 5.9820—30 27 116 0.3330—40 28 168 0.2440—60 2 12 0.00
W 10—20 2 5 0.04 13.2420—30 72 308 0.8730—40 36 216 0.3140—60 23 140 0.05
2—W 10—20 3 8 0.07 11.4720—30 38 163 0.5230—40 50 300 0.4940—60 14 85 0.03
N 10—20 1 3 0.02 22.9120-30 104 445 1.4330—40 82 491 0.8040—60 8 49 0.02
E 10-20 2 5 0.05 14.5620—30 54 231 0.7430—40 61 365 0.6040—60 15 91 0.04

27
Appendix 1A — cont’d.
Depth Fish! Fish/1000 sq. mLransect (m) Targets Echoes 1000 cu. m (10—60 m)
2R—E 10—20 0 0 0.00 12.4320—30 46 197 0.7430—40 38 228 0.4440-60 9 55 0.03
N Data lost - Tape break
W 10—20 0 0 0.00 7.2020—30 14 60 0.3530—40 17 102 0.3140-60 7 43 0.03
3—W 10—20 0 0 0.00 10.9920—30 37 158 0.6030—40 41 246 0.4740-60 5 30 0.01
N 10—20 0 0 0.00 21.0120-30 78 334 1.2630—40 70 419 0.8140-60 6 36 0.02
E 10—20 0 0 0.00 26.1220-30 85 364 1.3730-40 97 581 1.1240—60 21 127 0.06
3R—E 10—20 1 3 0.03 21.9720-30 63 270 0.9830—40 97 581 1.0740-60 22 133 0.06
N 10—20 0 0 0.00 21.8120—30 76 325 1.1830—40 87 521 0.9640—60 7 43 0.02
W 10-20 0 0 0.00 11.8320-30 37 158 0.5730—40 51 306 0.5640-60 8 49 0.02
4—W 10-20 0 0 0.00 13.5020—30 34 146 0.6430—40 53 448 0.7240—60 1 6 0.00

28
Appendix 1A - cont’d.
Depth Fish! ~1/iooW~~. mTransect (m) Targets Echoes 1000 cu. m (10—60 m)
M 10—20 1 3 0.03 19.0020—30 27 116 0.5130—40 98 587 1.3140-60 8 49 0.03
E 10—20 0 0 0.00 33.1420—30 45 193 0.8430—40 177 1060 2.3740—60 16 97 0.05
4R-E 10-20 0 0 0.00 34.5620—30 48 205 0.9330—40 168 1006 2.3240—60 30 182 0.10
M 10—20 1 3 0.03 17.6220—30 29 124 0.5630—40 86 515 1.1540—60 3 18 0.01
W 10—20 0 0 0.00 12.5820—30 27 116 0.5230—40 54 324 0.7240-60 2 12 0.01
5-W 10-20 12 25 0.67 24.3220—30 39 135 1.3130-40 17 83 0.4140—60 4 20 0.02
M 10-20 6 13 0.34 38.1320—30 62 215 2.0830—40 56 272 1.3440—60 5 25 0.03
E 10-20 6 13 0.34 29.3020—30 56 194 1.8830—40 30 146 0.7240—60 0 0 0.00
5R—E 10—20 7 15 0.37 39.9920—30 88 305 2.7930—40 35 170 0.7940—60 4 20 0.02

29
Appendix 1A — cont’d.
Depth Fi~i~/ Fish!1000 sq. rnTransect (m) ~{~~gets Echoes 1000 cu. m (10—60 m)~
N 10-20 7 15 0.37 43.0420-30 83 288 2.6330—40 56 272 1.2740—60 3 15 0.02
W 10—20 3 6 0.16 21.9120—30 52 181 1.6530-40 15 73 0.3440-60 4 20 0.02
6—W 10—20 1 2 0.10 31.3520—30 18 63 1.1130-40 42 204 1.8540—60 3 15 0.03
N 10—20 0 0 0.00 13.6820—30 15 52 0.9330—40 9 44 0.4040—60 2 10 0.02
E 10—20 2 4 0.21 54.7120—30 77 267 4.7630—40 9 44 0.4040-60 2 25 0.05
6R—E 10—20 2 4 0.19 64.3020—30 97 337 5.4230-40 17 83 0.6840—60 7 35 0.07
N 10—20 1 2 0.09 17.6720—30 21 73 1.1730-40 12 58 0.4840—60 1 5 0.01

30
Appendix 1A - cont~d.
Depth Fi~Ti~/ Fish!1000 sq. mTransect Ta~ets Echoes 1000 cu. m ~j10-60 mL~
W 10—20 0 0 0.00 44.3520—30 19 66 1.0630—40 51 248 2.0440—60 17 84 0.17
7 W 10—20 0 0 0.00 23.5520—30 30 104 0.8130-40 74 360 1.4340—60 12 59 0.06
M 10—20 0 0 0.00 11.8820—30 25 87 0.6830—40 25 122 0.4840—60 3 15 0.01
E 10—20 0 0 0.00 32.9920—30 61 212 1.6530—40 81 394 1.5640—60 9 44 0.04
7R-E 10—20 1 2 0.05 32.6320—30 68 236 1.9130—40 62 301 1.2440—60 6 30 0.03
H 10—20 1 2 0.05 11.0720—30 12 42 0.3430—40 34 165 0.6840—60 4 20 0.02
W 10—20 0 0 0.00 26.1920—30 30 104 0.8430—40 82 398 1.6540—60 13 64 0.06
8-W 10—20 1 2 0.04 40.5920-30 84 292 2.1630—40 101 491 1.8540—60 1 5 0.01

31
Appendix 1A - cont’d.
~fl~7T~T~mj~j]~ Echoes 1000 cu. m (10-60 mL
N 10—20 0 0 0.00 40.8820—30 54 187 1.3930—40 146 709 2.6840—60 3 15 0.01
E 10—20 1 2 0.04 27.0720—30 42 146 1.0830—40 84 408 1.5440-60 5 25 0.02
SR—E 10—20 0 0 0.00 44.2320-30 47 163 2.8730—40 81 394 1.4740—60 9 44 0.04
N 10-20 0 0 0.00 47.8920—30 75 260 1.9030—40 155 753 2.8140-60 9 44 0.04
W 10-20 0 0 0.00 36.4320-30 83 288 2.1030-40 79 384 1.4340—60 12 59 0.05
9-W 10—20 0 0 0.00 27.7020-30 50 174 1.3730—40 70 340 1.3740-60 4 20 0.02
N 10—20 0 0 0.00 27.2220—30 44 153 1.2030—40 76 369 1.4840—60 4 20 0.02
E 10—20 3 6 0.14 32.0820—30 69 240 1.8830—40 58 282 1.1340—60 6 30 0.03
9R—E 10—20 0 0 0.00 33.3620—30 58 201 1.6030—40 86 418 1.6940—60 5 25 0.02
Appendix 1A - cont’d.
Depth Fish! Fish!1000 sq. mTransect (m) Targets Echoes 1000 cu.JLLQI
M 10—20 0 0 0.00 26.1020—30 42 146 1.1630—40 69 335 1.3040—60 10 49 0.05
W 10—20 3 6 0.14 20.5220—30 20 69 0.5530—40 65 316 1.2840—60 9 44 0.04
32

33
Appendix lB. Kootenay mean densities and variances by transect.
ToaU Density ( # 1 Pö~u 1 at i o1ETransect sq. mL 1000 sq~m) Mean Variance (1000 fish) Variance
1 75,992 21.38 16.35 25.3512 1,241.6 1.464E111R 11.33
2 60,910 16.31 13.06 10.5560 928.8 3.916E102R 9.82
3 52,779 19.37 18.95 0.1764 1,000.6 4.914E83R 18.54
4 43,872 21.88 21.73 0.0225 953.3 4.331E74R 21.59
5 31,586 30.58 32.78 4.8400 1,035.3 4.829E9SR 34.98
6 17,555 33.25 37.62 19.0969 661.4 5.885E96R 41.98
7 37,390 22.81 23.05 0.0576 861.8 8.053E77R 23.30
8 40,380 36.16 39.51 11.2225 1,595.7 1.830E108R 42.85
9 37,567 29.00 27.83 1.3689 1,045.4 1.932E99R 26.66
Total 398,000 9,323.9 2.171E11
95% C.I. = 913,286

34
Appendix 1C. Duration in beam measurements, Kootenay Lake.
Transects 1-4; depth interval 27-33 m
Duration: 1 2 3 4 5 6 7 8 9 10 11 12(echoes)
Sumobserved: 13 40 57 92 135 132 119 136 45 80 55 24
Mean duration = 5.214 # observations = 240
Transects 5-8; depth interval 27-33 m
Duration: 1 2 3 4 5 6 7 8 9 10 11 12
Sumobserved: 57 148 249 316 280 288 266 168 126 90 11 0
Mean duration = 4.165 # observations = 480
35
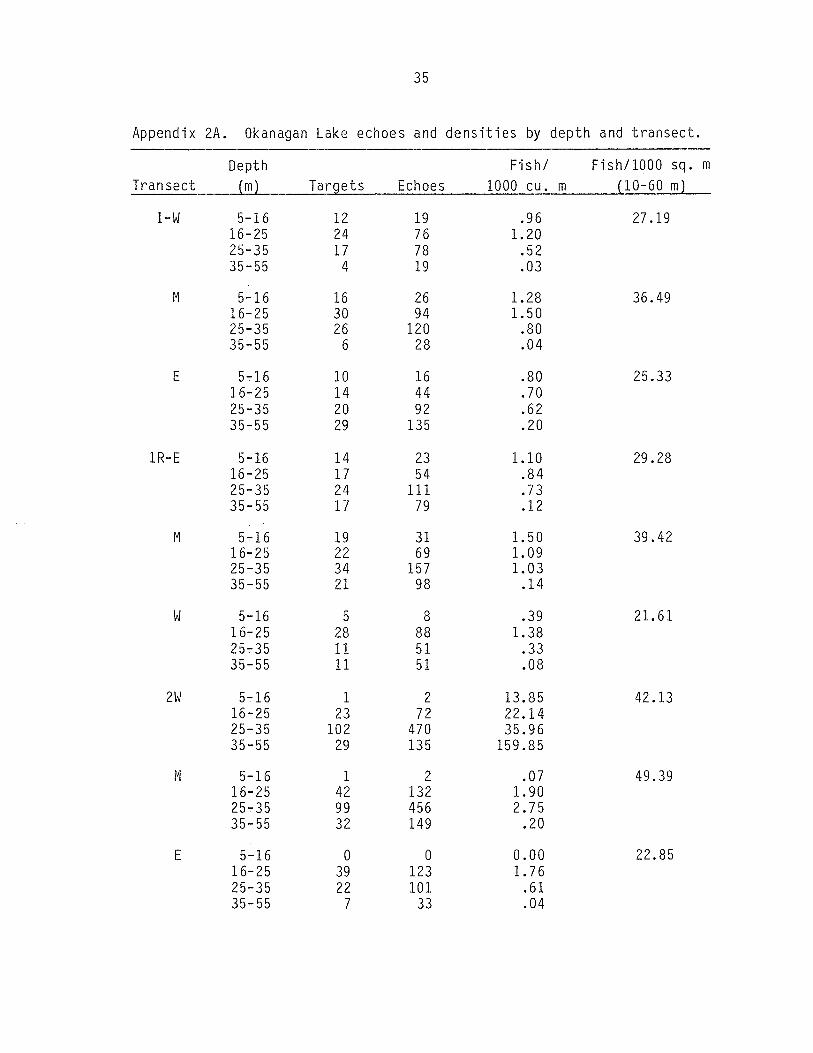
Appendix 2A. Okanagan Lake echoes and densities by depth and transect.
Depth Fish! Fish!1000 sq. mTransect (m) Targets Echoes 1000 cu. m (10—60 m)
1—W 5—16 12 19 .96 27.1916—25 24 76 1.2025—35 17 78 .5235—55 4 19 .03
N 5—16 16 26 1.28 36.4916—25 30 94 1.5025—35 26 120 .8035—55 6 28 .04
E 5—16 10 16 .80 25.3316—25 14 44 .7025-35 20 92 .6235—55 29 135 .20
1R—E 5—16 14 23 1.10 29.2816—25 17 54 .8425—35 24 111 .7335-55 17 79 .12
N 5-16 19 31 1.50 39.4216—25 22 69 1.0925—35 34 157 1.0335—55 21 98 .14
W 5—16 5 8 .39 21.6116-25 28 88 1.3825—35 11 51 .3335—55 11 51 .08
2W 5—16 1 2 13.85 42.1316—25 23 72 22.1425—35 102 470 35.9635—55 29 135 159.85
N 5—16 1 2 .07 49.3916—25 42 132 1.9025—35 99 456 2.7535-55 32 149 .20
E 5—16 0 0 0.00 22.8516—25 39 123 1.7625—35 22 101 .6135-55 7 33 .04

36
Appendix 2A - cont’d.
Depth Fish! Fish/1000 sq. mTransect (m) Targets Echoes 1000 cu. m (10-60 m)
2R-E 5-16 0 0 0.00 20.1616—25 32 101 1.3725—35 25 115 .6635—55 10 47 .06
M 5—16 0 0 0.00 42.0416—25 33 104 1.4225—35 97 447 2.5635—55 31 145 .18
W 5—16 1 2 .07 24.6916—25 18 57 .7725—35 54 249 1.4335—55 23 107 .14
3W 5—16 0 0 0.00 23.3116—25 17 54 .5825—35 71 327 1.5035—55 32 149 .15
5—16 0 0 0.00 30.4116—25 32 101 1.1025-35 83 382 1.7635—55 31 145 .15
E 5—16 1 2 .05 12.8516—25 8 25 .2825—35 39 180 .8235—55 16 75 .08
3R-E 5—16 1 2 .05 20.2616—25 23 72 .7825—35 50 230 1.0435—55 25 117 .12
N 5—16 0 0 0.00 32.8316—25 36 113 1.2125—35 90 414 1.8735—55 35 163 .16
W 5—16 4 6 .22 18.5816—25 11 35 .3725—35 54 249 1.1235-55 18 84 .08

37
Appendix 2A - cont’d.
Depth Fish! Fish!1000 sq. m~ec~~J~J Targ~~ Echoes 1000 cu. m (10-60 m)
4W 5-16 1 2 .05 32.5416—25 36 113 1.1125—35 99 456 1.8835—55 38 177 .16
M 5-16 1 2 .05 58.5916—25 39 123 1.2025-35 196 902 3.7235—55 118 550 .50
E 5—16 0 0 0.00 34.7616—25 16 50 .4925-35 110 506 2.0935-55 111 517 .47
4R—E 5—16 1 2 .05 34.5516—25 16 50 .5125—35 108 497 2.1235—55 93 434 .41
N 5—16 0 0 0.00 57.9316-25 28 88 .8925—35 189 870 3.7135—55 145 676 .64
W 5—16 1 2 .05 31.5516-25 33 104 1.0525—35 89 410 1.7535—55 46 214 .20
5—W 5—16 0 0 0.00 8.1016—25 6 19 .2425—35 19 88 .4835—55 10 47 .06
N 5-16 0 0 0.00 37.3816—25 17 54 .6925—35 88 405 2.2135-55 80 373 .45
E 5—16 2 3 .13 27.6216-25 18 57 .7325—35 60 276 1.5135-55 40 186 .23

38
Appendix 2A - cont’d.
Depth Fish! Fish!1000 sq. mTransect (m) Targets Echoes 1000 cu. m (10—60 m)
5R—E 5—16 2 3 .17 27.8016—25 11 35 .5825—35 54 249 1.7635—55 38 177 .15
M 5—16 0 0 0.00 36.5916—25 16 50 .8525—35 76 350 2.4835—55 51 238 .21
W 5—16 0 0 0.00 15.0816—25 7 27 .3725—35 33 152 1.0835—55 12 56 .05
6—W 5—16 1 2 .09 8.5916—25 2 6 .1125-35 12 55 .4135—55 18 84 .12
M 5—16 0 0 0.00 20.6916—25 1 3 .0625—35 34 157 1.1735—55 62 289 .42
E 5—16 0 0 0.00 13.3916—25 0 0 0.0025—35 27 124 .9335—55 30 140 .21
6R—E 5—16 0 0 0.00 11.5516—25 2 6 .1125—35 14 65 .4935—55 36 168 .28
5—16 0 0 0.00 18.7316—25 0 0 0.0025—35 33 152 1.1535—55 46 214 .36
W 5—16 1 2 .09 10.8416—25 0 0 0.0025—35 21 97 .7335—55 16 75 .13

39
Appendix 2A - cont’d.
Depth Fish! Fish!1000 sq. mTransect (m) Targets Echoes 1000 cu. m (10-60 mL
7W 5—16 1 2 .05 30.4616—25 23 72 .7425—35 61 280 1.2135—55 124 578 .55
M 5—16 1 2 .05 41.7616-25 31 98 1.0025—35 90 414 1.7935—55 160 746 .72
E 5—16 1 2 .05 26.7516—25 26 82 .8425—35 60 276 1.1935-55 75 350 .34
7R—E 5—16 1 2 .05 34.4516-25 37 116 1.2125—35 67 308 1.3535—55 104 484 .47
N 5-16 0 0 0.00 38.3616~25 27 85 .8925—35 94 433 1.9035-55 126 587 .57
W 5-16 0 0 0.00 32.3316-25 21 66 .6925-35 72 332 1.4535—55 128 597 .58
8E 5—16 0 0 0.00 27.6016-25 34 107 1.3725—35 51 235 1.2635—55 24 112 .13
N 5-16 0 0 0.00 29.6116—25 20 63 .8025-35 76 350 1.8835-55 32 149 .18
W 5-16 0 0 0.00 22.3616—25 14 44 .5625-35 64 295 1.5835-55 13 61 .07

40
Appendix 2A - cont’d.
Depth Fish! Fish!1000 sq. mTransect (ml Targets Echoes 1000 cu. m (10—60 m)
8R-W 5—16 0 0 0.00 22.4716—25 14 44 .5525—35 62 285 1.4935—55 25 117 .13
N 5—16 1 2 .06 29.1716—25 19 60 .7425—35 82 378 1.9735—55 20 93 .11
E 5—16 0 0 0.00 28.1516—25 29 91 1.1325—35 66 304 1.5835—55 20 93 .11
9-W 5—16 1 2 .06 9.8116—25 14 44 .5325—35 15 69 .3535—55 8 37 .04
N 5—16 0 0 0.00 29.8716—25 19 60 .7225—35 73 336 1.7135—55 60 280 .32
E 5—16 1 2 .06 17.1916—25 16 50 .6125—35 41 189 .9635—55 14 65 .07
9R—E 5—16 0 0 0.00 13.3916—25 10 32 .3925—35 32 147 .7635—55 21 98 .11
N 5—16 0 0 0.00 25.1016—25 11 35 .4325—35 58 267 1.3935—55 69 322 .87
W 5—16 1 2 .06 7.4516—25 12 38 .4725—35 9 41 .2135—55 4 19 .02

Appendix 2A - cont’d.
Depth Fish! Fish!1000 sq. mTransect cm) Targets Echoes 1000 cu. m (10-60 m)
10—W 5—16 5 8 .93 32.6016—25 20 63 2.3325—35 2 9 .1435—55 - -
M 5—16 5 8 .93 37.2316—25 21 66 2.4525—35 7 32 .5035-55 - -
E 5—16 3 10 .56 18.4716—25 7 22 .8225-35 7 32 .5035—55 - -
1OR—E 5—16 4 6 .68 28.6516—25 20 63 2.1325—35 3 14 .2035-55
tl 5—16 5 8 .85 33.5016—25 19 60 2.0325—35 9 41 .5935-55 - -
W 5—16 4 6 .68 30.2216—25 23 72 2.4525—35 1 5 .0735-55 - -
41

42
Appendix 2B Okanagan mean densities and variances by transect.
Area Population
~L (1000 fish) VarianceTransect (1000 cu. Density Mean Variance
1 47,500 29.67 29.89 .0484 1419.8 1.0920E81 30.10
2 33,710 38.12 33.54 20.9764 1130.6 2.3837E102 28.96
3 29,270 22.19 23.04 .7225 674.4 6.1899E83 23.89
4 41,450 41.96 41.66 .0900 1726.8 1.5463E84 41.34
5 30,650 24.37 25.46 1.0900 780.3 1.0240E95 26.50
6 25,810 14.22 13.97 .0676 360.6 4.5032E76 13.71
7 37,020 32.99 34.02 1.0609 1259.4 1.4539E97 35.05
8 35,730 26.52 26.56 .0016 940.0 2.0426E68 26.60
9 47,730 18.96 17.14 3.3489 818.7 7.6293E99 15.31
10 17,000 29.43 30.11 .4624 511.9 1.3363E810 30.79
Total 345,870 9630.9 3.50076E10
95% C.I. = 366722

43
Duration:(echoes)
Sumobserved: 42 106 165
Mean duration = 4.656
Transects 7—8;
Duration: 1 2 3
Sumobserved: 33 64 117
Mean duration = 4.523
Appendix 2C. Duration in beam measurements, Okanagan Lake.
Transects 1—5; depth interval 27—33 m
1 2 3 4 5 6 7 8 910111213
135 70 33 12 13196 295 306
# observations
depth interval
4 5 6
132 165 180
# observations
252 256
= 404
27-33 m
7 8 9 10 11
203 112 81 30 22
= 260
12 13
24 13

44
Appendix 3. Okanagan Lake 1985 echogram count analysis.
Mean bscillo
Depth Echogram Oscilloscope scope countTransect Time interval count count D~ (1000 cu. m)
2 14:23 5—16 1 2 .0516-25 88 104 1.5725—35 140 223 2.0735-55 58 68 .14
2R 15:09 5—16 1 1 .0216—26 69 83 1.1925—35 152 176 1.5535—55 61 64 .13
4 21:06 5—16 2 2 .0316—26 74 91 .9325—35 247 405 2.5635—55 179 267 .38
4R 20:23 5—16 2 2 .0316—26 54 77 .8225—35 227 386 2.5335—55 221 284 .42
6 11:38 5—16 2 2 .0316—26 5 41 .0625—35 89 167 .8435—55 98 130 .25
6R 11:28 5—16 2 2 .0316—26 2 34 .0425—35 64 163 .7935—55 80 101 .26
7 20:08 5—16 1 3 .0516—25 70 80 .8625—35 175 211 1.4035—55 283 359 .54
7R 19:50 5—16 0 1 .0216—26 76 85 .9325—35 153 233 1.5735—55 283 358 .54

45
Appendix 3. Okanagan Lake 1985 echogram count analysis cont’d.
Mean oscillo—. scope countDepth Echogram Oscilloscope
Transect Time interval count count D~, (1000 cu. m)
8 16:10 5—16 2 0 0.0016—26 43 68 .9125—35 129 191 1.5735—55 64 69 .13
8R 16:41 5—16 1 1 .0216—26 52 62 .8125—35 158 210 1.6835—55 52 65 .12
Scope = 2.2239 + 1.3821 Chart
r2 = .9488

Se)1~Lu~6~u~>jijpu~icPUe;OO)1J04L~A~Ae:~U~.q;depq~e~~toj.w~~o~siqícDuenbe~4pu~‘oLpe~q‘q3öue~q~s~u~eweq~SDALñj7xipuedd~
17XIGN3ddV

47
SUMMARY OF DATA FROM DEPTH 10.0 TO 20.0 Kootenay Lake 1985
DEPTH INTERVALS
FROM 10.00 11.00 12.00 13.00 14.00 15.00 16.00 17.00 18.00 19.00TO 11.00 12.00 13.00 14.00 13.00 16.00 17.00 18.00 19.00 20.00
TB SUM
—75 I 0 0 0 0 0 0 0 0 0 0 0—73 I 0 0 0 0 0 0 0 0 0 0 0—71 I 0 0 0 0 0 0 0 0 0 0 0—69 I 0 0 0 0 0 0 0 0 0 0 0—67 I 0 0 0 0 0 0 0 0 0 0 0—65 I 0 0 0 0 0 0 0 0 0 0 0—63 I 0 0 0 0 0 0 0 0 0 0 0—61 I 0 0 0 0 0 0 0 0 0 0 0—59 I 0 0 0 0 0 0 0 1 1 0 2—57 I 0 0 0 0 0 0 0 0 0 0 0—55 I 0 0 0 0 0 0 0 0 0 0 0—53 I 0 0 0 0 0 0 0 0 0 2 2—51 I 0 0 0 0 1 0 0 0 0 1 2—49 I 0 0 0 0 0 0 0 0 1 0 1—47 I 0 0 0 0 0 0 0 0 1 0 1—45 I 0 0 0 0 0 0 0 0 1 0 1—43 I 0 0 0 0 0 0 0 0 0 0 0‘z41... I 0... .0 0 .0.. 0 0. 0. 0 0 0 .0—39 I 0 0 0 0 0 0 0 0 0 0 0—37 I 0 0 0 0 0 0 0 1 0 0 1—35 I~ 0 0 0 0 0 0 0 0 0 0 0—33 I 1 0 0 0 0 0 0 0 0 0 1—31 I 0 0 0 0 0 0 0 0 0 0 0—29 I 0 0 0 0 0 0 0 0 0 0 0—27 I 0 0 0 0 0 0 0 0 0 0 0-25 I 0 0 0 0 0 0 0 0 0 0 0—23 I 0 0 0 0 0 0 0 0 0 0 0—21 I 0 0 0 0 0 0 0 0 0 0 0-19 I 0 0 0 0 0 0 0 0 0 0 0—17 I 0 0 0 0 0 0 0 0 0 0 0
TOTAL NUMBER OF RECORDED TARGETS - 28880
NUMBER OF TARGETS USED FOR STATISTICS — 11
AVERAGE BACKSCATTERING CROSS SECTION — . 6597E—04 IN dB — —41.81
BACKSCATTERING CROSS SECTION STD DEV — . 1392E—03
AVERAGE TARGET STRENGTH IN dB — —48.94
TARGET STRENGTH STD DEY IN dB — 7.97
S TARGETS WITh BEAM PATTERN FACTORS ) 0 dB— 1
NUMBER OF FISH USED — . 28880ESTIMATED VOLUME IN CUBIC METERS — .226E+07DENSITY IN FISH PER CUBIC METER — .128E—01

48
SUMMARY OF DATA FROM DEPTH 20.0 TO 30.0 Kootenay Lake 1985
DEPTH INTERVALS
FROM 20.00 21.00 22.00 23.00 24.00 25.00 26.00 27.00 28.00 29.00TO 21.00 22.00 23.00 24.00 25.00 26.00 27.00 28.00 29.00 30.00
TS SUM
—75 I 0 0 0 0 0 0 0 0 0 0 0—73 I 0 0 0 0 0 0 0 0 0 0 0—71 I 0 0 0 0 0 0 0 0 0 0 0—69 I 0 0 0 0 0 0 0 0 0 0 0—67 I 0 0 0 0 0 0 0 0 0 0 0—65 I 0 0 0 0 0 0 0 0 0 0 0—63 I. 0 0 0 0 0 0 0 0 0 0 0—61 I 0 1 8 2 11 16 28 15 15 19 115—59 I 1 4 3 8 17 32 38 32 32 21 188—57 I 1 2 3 15 17 19 37 34 32 25 185—55 I 5 0 3 11 13 32 24 42 33 34 197—53 I 3 4 3 16 29 38 45 40 38 46 262—51 I 2 3 5 7 14 21 26 30 31 39 178—49 I 5 2 2 6 16 21 17 25 26 29 149—47 I 0 0 1 6 8 14 14 18 24 12 97—45 I 1 2 4 1 5 13 14 16 8 14 78—43 I 1 0 0 6 2 12 9 17 13 14 74—41 I 0 0 1 1 3 5 8 12 15 17 62—39 I 1 3 1 2 3 11 10 10 12 22 75—37 I 2 0 2 1 6 2 4 11 9 5 42—35 I 0 0 0 0 4 1 3 6 6 2 22—33 I 0 1 0 0 1 0 3 0 2 1 8—31 I 0 0 0 1 0 0 1 2 0 0 4—29 I 0 0 0 0 0 0 1 0 0 0 1—27 I 0 0 0 0 0 0 0 0 0 0 0—25 I 0 0 0 0 0 0 2 0 0 0 2—23 I 0 0 0 0 0 0 0 0 0 0 0—21 I 0 0 0 0 0 0 0 0 0 0 0—19 I 0 0 0 0 0 0 0 0 0 0 0—17 I 0 0 0 0 0 0 0 0 0 0 0
TOTAL NUMBER OF RECORDED TARGETS — 28880
NUMBER OF TARGETS USED FOR STATISTICS — 1739
AVERAGE BACKSCATTERING CROSS SECTION — .3368E—04 IN dB — -44.73
BACKSCATTERING CROSS SECTION STD DEV • 1331E—03
AVERAGE TARGET STRENGTH IN tiE n . . -- — —51.33
TARGET STRENGTH STD DEV IN dB a 6.78
* TARGETS WITh BEAM PATTERN FACTORS ) 0 dB~. 193
NUMBER OF FISH USED — 28880ESTIMATED VOLUME IN CUBIC METERS a .539E+07DENSITY IN FISH PER CUBIC METER a .536E—02

49
SUMMARY OF DATA FROM DEPTH 300 TO 400 Kootenay Lake 1985
DEPTH INTERVALS
FROM 30.00 31.00 3200 33.00 34.00 35.00 36.00 37.00 38.00 39.00TO 31.00 32.00 33.00 34.00 35.00 36.00 37.00 38.00 39.00 40.00
TS SUM
—75 I 0 0 0 0 0 0 0 0 0 0 0—73 I 0 0 0 0 0 0 0 0 0 0 0—71 I 0 0 0 0 0 0 0 0 0 0 0—69 I 0 0 0 0 0 0 0 0 0 0 0—67 I 0 0 0 0 0 0 0 0 0 0 0-65 I 0 0 0 0 0 0 0 0 0 0 0—63 I 0 0 0 0 0 0 0 0 0 0 0—61 I 16 5 5 8 6 2 3 2 5 1 53—59 I 28 15 16 18 8 5 7 3 3 4 107—57 I 36 29 21 17 19 15 13 7 5 0 162—55 I 43 32 31 23 16 13 18 10 4 3 193—53 I 44 48 39 29 32 22 21 12 12 9 268—51 I 36 31 35 35 31 15 17 15 9 8 232—49 I 33 20 29 23 14 14 13 8 8 4 166—47 I 14 17 13 16 14 7 6 7 5 6 105—45 I 14 16 14 15 20 9 7 4 8 5 112—43 I 16 20 15 16 15 10 6 7 5 5 115—41 I 19 17 10 16 8 7 13 5 3 3 101—39 I 12 14 19 14 7 6 4 1 4 4 85—37 I 15 10 3 5 4 2 2 0 1 2 44—35 I 5 1 4 5 1 1 2 0 0 1 20—33 I 2 1 2 1 0 3 0 1 0 0 10—31 I 2 0 1 0 1 1 1 0 1 0 7—29 I 1 0 0 1 0 0 0 0 0 0 2—27 I 0 0 0 0 0 0 0 0 0 0 0—25 I 0 0 0 0 0 0 0 0 0 0 0—23 I 0 0 0 0 0 0 0 0 0 0 0—21 I. 0 0 0 0 0 0 0 0 0 0 0—19 I 0 0 0 0 0 0 0 0 0 0 0—17 I 0 0 0 0 0 0 0 0 0 0 0
TOTAL NUMBER OF RECORDED TARGETS a 28880
NUMBER OF TARGETS USED FOR STATISTICS a 1782
AVERAGE BACKSCATTERING CROSS SECTION a . 3585E—04 IN dB a —44.46
BACKSCATTERI NG CROSS SECTI ON STD DEV - . 8814E—04
AVERAGE TARGET STRENGTH IN dB — —49.91
TARGET STRENGTH STD DEV IN dB a 6.53
0 TARGETS WITH BEAM PATTERN FACTORS ) 0 dB 99
NUMBER OF FISH USED a 28880ESTIMATED VOLUME IN CUBIC METERS a 106E+08DENSITY IN FISH PER CUBIC METER a .272E—02

50
SUMMARY OF DATA FROM DEPTH 40.0 TO 60.0 Kootenay Lake 1985
DEPTH INTERVALS
FROM 40.00 42.00 44.00 46.00 48.00 50.00 52.00 54.00 56.00 58.00TO 42.00 44.00 46.00 48.00 50.00 52.00 54.00 56.00 58.00 60.00
TS SUM
—75 I 0 0 0 0 0 0 0 0 0 0 0—73 I 0 0 0 0 0 0 0 0 0 0 0—71 I 0 0 0 0 0 0 0 0 0 0 0—69 I 0 0 0 0 0 0 0 0 0 0 0—67 I 0 0 0 0 0 0 0 0 0 0 0—65 I 0 0 0 0 0 0 0 0 0 0 0—63 I 0 0 0 0 0 0 0 0 0 0 0—61 I 0 0 0 0 0 0 1 1 2 2 6—59 I 5 1 0 1 1 0 3 5 5 1 22—57 I 5 3 0 0 1 3 5 0 4 1 22—55 I 2 4 2 2 2 2 1 2 5 1 23—53 I 7 7 5 2 2 2 1 6 5 2 39—51 I 6 4 0 3 2 3 3 5 1 3 30—49 I 7 3 1 3 5 4 2 0 2 4 31—47 I 1 0 1 5 3 4 3 1 1 2 21—45 I 0 0 2 4 1 3 2 1 0 2 15—43 I 2 7 2 3 3 0 0 2 1 1 21—41 I 5 3 1 3 1 3 1 1 0 2 20—39 I 3 1 0 1 1 1 0 1 0 0 8—37 I 1 0 1 1 0 2 .0 0 0 1 6—35 I 1 0 0 0 0 0 0 0 0 0 1—n I 0 0 0 0 0 0 0 0 0 0 0—31 I 0 0 0 0 0 0 0 0 0 0 0—29 I 0 0 0 0 0 0 0 0 0 0 0—27 I 0 0 0 0 0 0 0 0 0 0 0—25 I 0 0 0 0 0 0 0 0 0 0 0—23 I 0 0 0 0 0 0 0 0 0 0 0
.—21 I 0 0 0 0 0 0 0 0 0 0 0—19 1 0 0 0 0 0 0 0 0 0 0 0—17 I 0 0 0 0 0 0 0 0 0 0 0
TOTAL NUMBER OF RECORDED TARGETS a 28880
NUMBER OF TARGETS USED FOR STATISTICS a 265
AVERAGE BACI4SCATTERING CROSS SECTION a . 2654E—04 IN dB a -45.76
BACKSCATTERING CROSS SECTION STD DEV a . 4396E—04
AVERAGE TARGET STRENGTH IN dB a —49.97
TARGET STRENGTH STD DEV IN dB a 6.11
* TARGETS WITH BEAM PATTERN FACTORS ) 0 dBa 30
NUMBER OF FISH USED a 28880ESTIMATED VOLUME IN CUBIC METERS a 409E+08DENSITY IN FISH PER CUBIC METER a .705E—03

51
SUMMARY OF DATA FROM DEPTH 5.0 TO 16.0 Okanagan Lake 1985
DEPTH INTERVALS
FROM 5.00 6.10 7.20 8.30 9.40 10.50 11.60 12.70 13.80 14.90TO 6.10 7.20 8.30 9.40 10.50 11.60 12.70 13.80 14.90 16.00
TS SUM
—75 I 0 0 0 0 0 0 0 0 0 0 0—73 I 0 0 0 0 0 0 0 0 0 0 0—71 I 0 0 0 0 0 0 0 0 0 0 0—69 I 0 0 0 0 0 0 0 0 0 0 0—67 I 0 0 0 0 0 0 0 0 0 0 0—65 I 0 0 0 0 0 0 0 0 0 0 0—63 I 0 0 0 0 0 0 0 0 0 0 0—61 I 0 0 0 0 0 0 0 0 0 0 0—59 I 0 0 0 0 0 0 0 0 0 1 1—57 I 0 0 0 0 0 0 0 0 0 0 0—55 I 0 0 0 0 0 0 0 0 0 0 0—53 I 0 0 0 0 0 0 0 2 1 2 5—51 I 0 0 0 0 0 0 0 1 2 1 4—49 I 0 0 0 0 0 0 1 0 0 1 2—47 I 0 0 1 0 0 0 0 0 0 1 2—45 I 0 0 0 0 0 0 0 4 1 0 5—43 I 0 0 0 0 0 0 0 1 0 1 2—41 I 0 0 0 0 0 0 0 0 0 2 2—39 I 0 0 0 0 0 0 0 0 0 0 0—37 I 0 0 0 0 0 0 0 0 0 0 0—35 I 0 0 0 0 0 0 1 0 0 0 1—33 I 0 0 0 0 0 0 0 0 0 0 0—31 I 0 0 0 0 0 0 0 0 0 0 0—29 I 0 0 0 0 0 0 0 0 0 0 0—27 I 0 0 0 0 0 0 0 0 0 0 0—25 I 0 0 0 0 0 0 0 0 0 0 0—23 I 0 0 0 0 0 0 0 0 0 0 0—21 I 0 0 0 0 0 0 0 0 0 0 0—19 I 0 0 0 0 0 0 0 0 0 0 0—17 I 0 0 0 0 0 0 0 0 0 0 0
TOTAL NUMBER OF RECORDED TARGETS a 32189
NUMBER OF TARGETS USED FOR STATISTICS a 24
AVERAGE BACKSCATTERING CROSS SECTION a .3771E—04 IN dB a —44.24
BACKSCATTERING CROSS SECTION STD DEV a . 7459E—04
AVERAGE TARGET STRENGTH IN dE a —48.00
TARGET STRENGTH STD DEV IN dB a 5.49
41 TARGETS WITH BEAM PATTERN FACTORS ) 0 dBa 1
NUMBER OF FISH USED a 32189ESTIMATED VOLUME IN CUBIC METERS a .115E+07DENSITY IN FISH PER CUBIC METER a .279E—01

52
SUMMARY OF DATA FROM DEPTH 16.0 TO 25.0 Okanagan Lake 1985
DEPTH INTERVALS
FROM 16.00 16.90 17.80 18.70 19.60 20.50 21.40 22.30 23.20 24.10TO 16.90 17.80 18.70 19.60 20.50 21.40 22.30 23.20 24.10 25.00
TS SUM
—75 I 0 0 0 0 0 0 0 0 0 0 0—73 I 0 0 0 0 0 0 0 0 0 0 0—71 I 0 0 0 0 0 0 0 0 0 0 0—69 I 0 0 0 0 0 0 0 0 0 0 0—67 I 0 0 0 0 0 0 0 0 0 0 0—65 I 0 0 0 0 0 0 0 0 0 0 0—63 I 0 0 0 0 0 0 0 0 0 0 0—61 I 0 0 1 4 3 10 9 4 6 19 56—59 I 1 0 2 7 21 22 7 10 14 19 103—57 I 1 0 1 9 7 11 2 7 8 14 60—55 I 0 0 2 6 12 10 6 5 8 11 60—53 I 0 0 1 11 9 17 10 10 11 19 88—51 I 1 0 1 5 15 9 10 7 9 5 62—49 I 1 1 1 1 5 5 6 3 7 7 37—47 I 1 1 1 6 4 5 3 2 2 4 29—45 I 2 1 3 4 6 7 2 2 4 1 32—43 I 2 1 2 3 7 5 2 2 7 6 37—41 I 1 0 2 1 0 2 5 2 2 5 20“39 I 0 0 0 2 1 4 4 7 3 5 26—37 I 1 0 1 0 0 2 3 2 5 3 17—35 I 0 0 1 0 0 3 1 2 4 2 13—33 I 0 0 1 0 0 0 1 3 3 1 9—31 I 1 0 0 0 0 1 0 0 1 0 3—29 I 1 0 0 0 1 0 2 3 0 1 8—27 I 0 0 0 0 0 0 0 1 0 0 1—25 I 0 0 0 0 0 1 0 0 0 0 1—23 I 0 0 0 0 0 0 0 0 0 0 0—21 I 0 0 0 0 0 0 0 0 0 0 0—19 I 0 0 0 0 0 0 0 0 0 0 0—17 I 0 0 0 0 0 0 0 0 0 0 0
TOTAL NUMBER OF RECORDED TARGETS - 32189
NUMBER OF TARGETS USED FOR STATISTICS a 662
AVERAGE BACKSCATTERING CROSS SECTION — . 6196E-04 IN dB a —42.08
BACKSCATTERING CROSS SECTION STD DEV a . 2326E-03
AVERAGE TARGET STRENGTH IN dB a —51 • 12
TARGET STRENGTH STD DEV IN dB a 7.91
41 TARGETS WITh BEAM PATTERN FACTORS ) 0 dB 96
NUMBER OF FISH USED — 32189ESTIMATED VOLUME IN WBIC METERS a 368E+07DENSITY IN FISH PER CUBIC METER a .876E—02

.JiJ
SUMMARY OF DATA FROM DEPTH 25.0 TO 35.0 Okanagan Lake 1985
DEPTH INTERVALS
FROM 25.00 26.00 27.00 28.00 29.00 30.00 31.00 32.00 33.00 34.00TO 26.00 27.00 28.00 29.00 30.00 31.00 32.00 33.00 34.00 35.00
TS SUM
—75 I 0 0 0 0 0 0 0 0 0 0 0—73 I 0 0 0 0 0 0 0 0 0 0 0—71 I 0 0 0 0 0 0 0 0 0 0 0—69 I 0 0 0 0 0 0 0 0 0 0 0—67 I 0 0 0 0 0 0 0 0 0 0 0—65 I 0 0 0 0 0 0 0 0 0 0 0—63 I 0 0 0 0 0 0 0 0 0 0 0—61 I 9 22 18 22 24 29 27 23 26 21 221—59 I 26 32 45 48 32 59 31 35 41 20 369—57 I 15 33 38 26 31 29 25 35 34 14 280—55 I 13 28 22 42 24 32 33 24 31 24 273—53 I 15 17 29 23 29 30 32 34 22 24 255—51 I 8 17 11 16 18 19 11 20 14 13 147—49 I 17 8 9 11 18 6 19 13 12 9 122—47 I 10 6 3 10 5 14 7 13 11 7 86—45 I 6 1 4 9 5 11 6 17 10 7 76—43 I 6 5 4 5 7 10 7 9 12 8 73—41 I 2 6 8 14 6 13 4 9 13 4 79—39 I 9 4 7 7 8 8 13 10 6 7 79—37 I 2 8 7 8 3 4 7 8 8 9 64—35 I 7 4 5 10. 8 7 10 4 5 5. 65—33 I 3 2 6 2 4 1 5 3 2 1 29—31 I 2 1 1 0 3 3 0 2 0 0 12—29 I 2 3 0 1 0 1 2 2 0 0 11—27 I 0 0 0 0 1 0 0 0 0 1 2—25 I 0 0 0 0 0 0 0 0 0 1 1—23 I 0 1 0 0 0 0 0 0 0 0 1—21 I 0 0 0 0 0 0 0 0 0 0 0—19 I 0 0 0 0 0 0 0 0 0 0 0—17 I 0 0 0 0 0 0 0 0 0 0 0
TOTAL NUMBER OF RECORDED TARGETS a 32189
NUMBER OF TARGETS USED FOR STATISTICS a 2245
AVERAGE BACKSCATTERING CROSS SECTION — . 4995E—04 IN dB a —43.01
BACKSCATTERING CROSS SECTION STD DEY a . 1809E—03
AVERAGE TARGET STRENGTH IN dB a —51.89
TARGET STRENGTH Sit DEV IN dB a 7.84
* TARGETS WITH BEAM PATTERN FACTORS > 0 dB 366
NUMBER OF FISH USED a 32189ESTIMATED VOLUME IN CUBIC METERS a .835E+07DENSITY IN FISH PER CUBIC METER a .385E—02

54
SUMMARY OF DATA FROM DEPTH 35.0 TO 55.0 okanagan Lake 1985
DEPTH INTERVALS
• FROM 35.00 37.00 39.00 41.00 43.00 45.00 47.00 49.00 51.00 53.00TO 37.00 39.00 41.00 43.00 45.00 47.00 49.00 51.00 53.00 55.00
TS SUM
—75 I 0 0 0 0 0 0 0 0 0 0 0—73 I 0 0 0 0 0 0 0 0 0 0 0—71 I 0 0 0 0 0 0 0 0 0 0 0—69 I 0 0 0 0 0 0 0 0 0 0 0—67 I 0 0 0 0 0 0 0 0 0 0 0—65 I 0 0 0 0 0 0 0 0 0 0 0—63 I 0 0 0 0 0 0 0 0 0 0 0—61 I 25 29 17 9 6 9 10 3 2 1 111—59 I 39 57 28 16 11 8 8 5 2 2 176—57 I 30 46 25 19 11 9 6 2 4 1 153—55 I 45 43 40 14 16 12 7 4 7 2 190—53 I 41 55 37 18 19 16 8 14 8 5 221—51 I 35 23 24 8 10 9 3 8 6 7 133—49 I 17 11 14 10 11 10 6 3 3 3 88—47 I 26 19 9 9 10 6 1 4 6 1 91—45 I 12 11 10 6 5 2 5 3 3 1 58—43 I 9 9 12 8 5 6 1 1 2 2 55—41 I 9 17 6 1 3 5 3 2 3 1 50—39 I 10 9 11 5 6 3 1 0 2 0 47—37 I 11 5 1 3 2 3 0 0 1 0 26—35 I 4 7 1 2 3 0 0 1 0 0 18—33 I 3 2 1 1 3 1 0 1 0 0 12—31 I 0 2 0 0 0 0 0 0 0 0 2—29 I 1 1 0 5 0 0 0 0 0 0 7—27 I 1 0 0 1 0 0 0 0 0 0 2—25 I 0 0 0 0 0 0 0 0 0 0 0—23 I 0 0 0 0 0 0 0 0 0 0 0—21 I 0 0 0 0 0 0 0 0 0 0 0—19 I 0 0 0 0 0 0 0 0 0. 0 0—17 I 0 0 0 0 0 0 0 0 0 0 0
TOTAL NUMBER OF RECORDED TARGETS - 32189
NUMBER OF TARGETS USED FOR STATISTICS — 1440
AVERAGE BACKSCATTERING CROSS SECTION a . 3631E—04 IN dB a —44.40
BACKSCATTERING CROSS SECTION STD DEY a . 1408E-03
AVERAGE TARGET STRENGTH IN dB a —51.80
TARGET STRENGTH STD DEY-- IN dB a 6.89
* TARGETS WITH BEAM PATTERN FACTORS > 0 dB— 166
NUMBER OF FISH USED a 32189ESTIMATED VOLUME IN CUBIC METERS - . 356E+08DENSITY IN FISH PER CUBIC METER a .905E—03

azLse~dw~sS~Dfl~~~A~~e,c‘UO~fl[OSeAses~eJDuLqsL4~o~.~ep~touis~u~d40~~qwnuWflW~U~W~1fl.öU.LS~9~ADUIU0L~L~APApeS~eJDUiAq~.es44os~s3AoqoD~cquoI4nqiJ~sLpIfl.ñUa~A;S3e6JP~eq~./c4L~u~pLo~w~tño~deq~.j.oi(~~jq~eq~.~i(e~s;a&~~e~owses~eJDuL
4[~qwnw~x~ws~’qs~j~iedseoq~ewnwLu~wpu~e~~upw~qwnwix~wöuL5u~qD~os~ej~eeq~pu~wpjöo~td)~3~~fjsDLuoSo~eq;~uLsnej~~U~00)1~A04SLSc[~UPq~ñua~~.s~3&tP40seidiU~xeSeAI6gxipuedd~
9XIUN~ddV

Li
THE COMMAND FILE ~DCTRKPRM “ CONTAINS CALIDRATION PARAMETERSFOR TRANSDUCER 615—013 CALIECRATED ON 7/25/85
420.. 0002.. 500
—179.. 4201.. 430
240.. 0002.. 500
8C:C>o,. C)C)C)350
N4.. 0004.. 0002.. 000
(2)(4)(6)(8)( 10)(1$)( 1 4)(16)(18)(20)(22)(24)
1216.. 700
1.. 0001
240.. 00060.. 000
N700
12.. 000—45.. 000
2.. 300
NUNDER OF FISH WITH ALPHA >NUMDER OF FISH WITH ALPHA <NUM8ER OF FISH WITH ALPHA =
0 DEGREES = 490 DEGREES = 1070 DEGREES = 19
Ranqe in meters (x) vs Tarrjet Strenqth in dB (y)
From 2..5 8..3 140 19..8 25..5 31..3 37..0 42..8 48..5 54..3To B..3 140 19..8 25..5 31..3 37..0 42..8 48..5 54..3 60..0
—73—71—69-67—65—63—61—59-5.7—55—53—51.-49-47-45—43—41—39—37—35-33—31-29-27-25
-21—19—17—15
Sum
oC_)
C..)
0C.)
19.
21
17~C)151 0
571C..)C)C)
0C)C)C)C)C..)
C)
C)
(1) FREGIUENCY(3) TVG START—UP(5) G< AT 1 METER(7) U CORR.. FACTOR(9) N THRESHOLD mY(11) MINIMUM DEPTH(13) DOTTOM THRESH mY(15) MINIMUM —6dB PU(17) CHECK W —6d5 PU ?(19) MAX HALF—ANGLE(21) PING RATE(23) MX.. CH.. IN RANGE
5/5=1 CON=2SOURCE LEVELN CORR.. FACTORNARROW CHANNELU THRESHOLD mYMAXIMUM DEPTHUSE —18 dS PUMAXIMUM —6dB PURECEIVER GAINMEDIAN TSMIN.. PINGS/FISHMX.. T.. BET.. PNGS
0 0 0 0 0C) 0 C:> o 00 0 0 0 0
o ~C> 0 0 0 0
o ~ C) 0C> C) o 10 0 0 0 3o o 0 C) 100 C) C) 1 13C 0 C) 2 210 C> 0 1 15C> C> C) 1 9o ~:> C:) 70 C> 0 C 60 C) 0 C> 70 0 0 0 20 C) 0 1 40 0 C> C) C)
o 0 C>0 C) 0
o o c:~C> 0 0 C) C)C) 0 ~:)C> C> C> 0 C>C) C) 0C) ~:) 0 0o 0 oC:> C:) C) 0C) C:> C:) C:) C:>
0 C) C) 00 C)
o o 0C> 0 0 C) C)0 C> 0 C> C)0 C) 0 C> C)
o 0 0 C) 11 ~:> 0 13 2 0 C) 29 1 C) 0 1
12 0 C) 0 C)5 2 C) C> C)9 3 C) 1 C)3 1 2 2 13 C> 0 0 02 1 C) 0 C)2 0 C) C> 01 C) 0 C) 0C C) C) C) C>0 C> ~:) 0
o 0C) C) C)
0 C)
0 ~:) 0 ~:> C:)c) 0 C) ~:>0 C) C) C:) C:)
C) 0 C) C> C)

57
Frequency Hi ~t o~r~rn of Target St ren~t hs
30 1 *
29) *
28) **
27) **
26) **
25) **
24) **
23) **
22) **
21) ***
20) *** *
19) *** *
18) *** *
17 1 * * * * *
16 I * * * * *
15) ******
14 I * * * * * *
13) ******
121 ****** *
11 I * * * * * * *
10) ********
9 I * * * * * * * *
8)7) ******** *
6) ******** *
5 I * * * * * * * * * *
413)2) ***********
1) *************
I I
—75,. —65k —55~ —45,. —35,.Tar~tet strencith in dE~
TOTAL NUME4ER OF RECORDED ECHOES 14443
TOTAL ECHOES IN ALL FISH COMBINED 380
TOTAL NUMBER OF FISH TRACKED 175
AVERAGE OF ALL E1ACKSCATTERING CROSSSECTIONS FROM EACH FISH ~2827E—04
IN dB —45~4867
BACKSCATTERING CROSS SECTION STD 0EV 4918E—04
AVERAGE OF ALL FISH TARGET STRENGTHSIN dE~ —50k 1074
TARGET STRENGTH STD 0EV IN dB 4~9911
NUMBER OF ECHOES WITH BEAM PATTERNFACTORS > o dB 30

THE COMMAND FILE “J3CTRKPRM “ CONTAINS CALIBRATION PARAMETERSFOR TRANSDUCER 615—013 CALIBRATED ON 7/25/85
(1)(3)(5)
(7)(9)(11)(13)(15)(17)(19)(21)(23)
(2)(4)(6)(8)( 1 C))
(12)( 1 4)(16)( 1 8)(20)(2;~)
2.000 (24)
6/9=1 CON.~2SOURCE LEVELN CORR. FACTORNARROW CHANNELW THRESHOLD mVMAX IMUN DEPTHUSE —18 dB PWMAXIMUM —6dB PURECEIVER GAiNMEDIAN TSfIN. PINGS/FISHMX.. T. BET. PNGS
1216.. 700
1 . oc:’O1
240.. 00060. OOC)
N700
1 ;~.
—45. OC)0
c.~. 3oC)
NUMBER OF FISH WITH ALPHA >NUMBER OF FISH WITH ALPHA <NUMBER OF FISH WITH ALPHA =
t:, DEGREES 70 DEGREES = 130 DEGREES = ()
F REQIJENCYTVG START—UPOx AT 1 METERW CORR. FACTORN THRESHOLD mVMINIMUM DEPTHBOTTOM THRESH mYMINIMUM —6dB PWCHECK W -6dB PUMAX HALF—ANGLEPING RATEMX. CH. IN RANGE
420. ooo2. 500
—179. 4201.430
240. 0002. 500
80C)0. C)C)O350
N4. 0004. 000
Rari~e in meters (x) vs Tarqet Strength in dB (y)
Frcirii 2.5 8.3 14.0 19.8 25.5 31.3 31.O 4a.8 48.5 54.3To 8.3 14.0 19.8 25.5 31.3 37.0 42.8 ‘+8.5 54.3 6C).0 Surpi
—73 ~:) 0 C) o C) ~:) 0 C) 0—71 C) C) 0 c:, 0 ~:) C) 0 0—69 ~:) c:~ 0 C) c: ~:) 0 c: 0 0 C)—67 c:~ ~:) 0 C) ~:) 0 C) €:~—65 ~:> 0 C) C) ~:, C) C) C) 0 C)—63 0 0 C) C> 0 C) C) 0 C) C) C>—s 1 o 0 C) C) ~:‘ o 0 C) 0
59 0 ~ ——0 —f> — 0———~— .— ~C———o— u—57 C) C> 0 C> C) C) 0 0 0 1—55 0 0 C> 0 3,3 ~ 0 C) 1 6—53 C) C) C> C> 3 ~‘ 1 0 C> C) C> 4—51 c:~ C> £:~ c:) 2 1 0 0 C) C) 3—49 ~:> o o o C> Io 0 C) •C> ~—47 C) :~ C) C> 1 2~ C> .C> 0 C) 3—45 C) C) C> C> C) C..> C> 1 C) 2—43 c:) 0 0 o 0 ~: c> 0 o—4 1 C> C) t: c> ~:> C) C) C) C> 0 C:>—39 c:~ c:~ t: 1 C:> C:> C:> C:) 1—37 C) t: 0 c> o ~ C> C) o—35 C) C) ~) C:> o C:> 0 ~:) 0—33 ~:> 0 C> 0 C) C) o C) ~:‘ o—31 C) ~ C) 0 ~:) ~:) t:~ ~—29 c:> C) 0 ~:> ~:, t:> ~:) 0—27 0 0 ~:> c:> c:~ ~ C> C:~ C) 0—25 t:~ o C:) 0 C) C) C) 0 C> ~ C)—23 C) C:> o c:> C> C)—2 1 C> C) C) 0 C) C) C) C) C> C) C)—19 0 o o C:) 0 C) ~ C>— 1 7 ~:> ~:) C) C> 0 C’ C) 0 ~:, 0—is ~ c:) C) o o u ~:> o C:>

Freq uericy Hi st oqr’arn cif Tarqet Streri~t hs
30 I29 I$8 I27 I26 II.... ~J
;~4 I~_~; I22 I21
20 I19 I18 I17 I16 I15 I14 I13 I12 I11 I10 ISI817161SI41 *
31 **
21ii ** *
I I 60 I I
—75. —65. —55. -j45. —35. -25. —15.
Target strength in dB
TOTAL NUMBER OF RECORDED ECHOES 14443
TOTAL ECHOES IN ~LL FISH COMBINED
TOTflL NUMBER OF FISH TRflCKED 20
~VERflGE OF flLL BACRSCflTTERING CROSSSECTIONS FROM EACH FISH = .4053E—04
IN dB —43. 9227
BACKSC~TTERING CROSS SECTION STD 0EV = .929 1E—04
~VER~GE OF ~LL FISH T~RGET STRENGTHSIN dB = —51.1558
Tf~RGET STRENGTH STO DES) [N dB = 4.6125
NUMBER OF ECHOES WITH E4E~~M P~TThRNFi~CTORS > 0 dB

THE COMM1~ND FILE “BCTRKPRM CONTAINS C~LI8RflTION P~R~METERSFOR TRflNSDUCER 615-013 C~LIBRflTED ON 7/25/85
1216.. 700
1 . t)001
240. 00060.. 000
N- 700
1 ;~., — 000—45. 000
2.. 300
NUMBER OF FISH WITH ~LPHfl >NUMBER OF FISH WITH ~LPH~ (NUMBER OF FISH WITH ~LPH~ =
0 DEGREES =
0 DEGREES =
c:) DEGREES = 6
( 1) FREQUENCY 420. 000 (2) 5/6=1 CON=2(3) TVG ST~RT—UP 2500 (4) SOURCE LEVE:L(5) Ox flT 1 METER —17’~.J~0 - ~6~) N CLJRR. FF~CTOR(7) -CORP FflC1OR~ 1 1 4~o (8)~ NARROW CHflNNhL(9) ~rH~~5t~ ~ 24o.o0oc1~) U THRESHOLD mY(11) MINIMUM DEPTH ~. 500 (12) M~XIMUM DEPTH( 13) BOTTOM THRESH niV 8t:o0. c:)oo ( 14) USE —18 dB PU(15) MINIMUM —6dB PW .350 (16) MflX1MLJM —6db PW(17) CHECK W —6dB PW ? N (t8) RECEIVER GAIN(19) M~X HflLF—~NGLE 4.300 (~0) MEDI~N TS(21) PING RATE 4. 000 (22) MIN. f:’TNGS/FISH($3) MX. CH. IN RANGE 2.000 24 MX. 1. BET. PNGS
Range in meters (x) vs Tarqet Strength in dE4 (y)
Fr’:m 2.5 8.3 14.0 19.8 25.5 31.3 370 428 48.5 54.3Tc~ 8.3 14.0 19.8 25.5 31.3 37. C) 42.8 48.5 54.3 60. C) Surii
—73 0 C) o C) 0 0 C) C) 0 0 0—71 C) 0 0 0 0 c:) 0 0 0 C)—69 C) C) C) C) C) C) 0 0 0 0 0—67 0 0 0 0 0 0 0 t) 0—65 0 0 C) C) o 0 0 C) 0 C)—63 0 0 o 0 0 0 0 0 ~) 0 C)—6 1 C) C) C) 0 0 0 C) C) 0~ - -SJ .j — — — — —-— ‘.1 ~_, ~
—57 C) C) 0 0 1 0 0 0 0 C> 1—55 C) C) C) C) 3 1 1 C) C) C) b—53 C) C) C) C) 4 1 1 C) 1 1 8—51 0 0 t:> 0 2 4 2 0 0 1 9—49 C) C) C) C) 6 3 C) C) C) 0 9—47 0 0 C) 0 0 0 0 1 1—45 C) C) C) C) 7 5 0 1 3 1 17—43 0 0 0 c:) 2 1 0 1 8—4 1 C) C) C) C) 3 3 1 1 2 C> 1 C)—3s 3 1 0 C) c:) 6—37 0 C) 0 C) 3 C) C) C) C) C) 3—35 0 0 0 C) 1 0 0 0 0 0 1—33 C) 0 0 C) C) C) C) C) C) C) C)—31 0 0 o o C) 0 0 0 0 C)—29 0 C) C) C) 0 C) C) 0 0—27 0 0 0 0 o c:) C) 0 0—25 o C> C:> C) C) C> C) C) 0 C)—$3 0 o 0 0 C) o t:) 0 0 C) 0—21 0 0 C) C) C) C> c> o o C>—is o 0 C) 0 0 0 0 C) C) C>—17 C) C) C) C) C) C) C) C) C) C> C>—is o 0 C) 0 0 o o C> o 0

61Fr~quericy Hi st oqr~rn cif Tar~jet St reriqt hs
30 I29 I28 Ic~7 Ic6 IL. .J
24 I23
~1 I20 I19 I18 I17 I161 *
15 I14 I *
13 I *
12 I11 I10 I *
SI **~
81 ****
71 ******
LI *******.
SI *******
413 I * * * * * * * ~ *
21 *********
11 **********
I I I I
—75. —65. —55. —45. —~5. ~5. —15.
Target strength in dB
TOTAL NUMBER OF RECORDED ECHOES 14443
TOTPL ECHOES IN ~LL FISH COMBINED 305
TOTflL NUMBER OF FISH IRflCKED 88
flVERt~GE OF flLL BflCKSCflTTERING CROSSSECTIONS FROM EACH FISH . 7513E—04
IN d8 —41.2073
BflCRSC~TTERING CROSS SECTION STO 0EV .8282E—04
~VER~GE OF ~LL FISH TflRGET STRENGTHSIN dB —46. 2578
TPRGET STRENGTH STD 0EV IN dB 5.075~
NUMBER OF ECHOES WITH BEflM PflTTERNFflCTORS > c) dB

62
THE COMMAND FILE “BCTRKPRM CONTAINS CALI8RATION PARAMETERSFOR TRANSDUCER 615—013 CALIBRATED ON 7/25/85
(1)(3)(5)(7)(9)(11)(13)(15)(17)(19)(21)(23)
4;~0. C)002. 50C)
—179. 4201 • 430
240. 0002. 500
8000. 000350
N- 300
4. 0002. 000
S/9~1 CON~2SOURCE LEVELN CORR. FACTORNARROW CHANNELW •IHRESHOLD mYMAXIMUM DEPTHUSE —18 d8 PWMAXIMUM —6ci~t ~JRECEIVER GAINMEDIAN TBPUN. PINL3S/FISHMX. T. BET.. PNGS
1216. 700
1. 0001
240. 00060. 000
N7C)0
1 2 • 000—45. 000
42. 300
NUMBER OF FISH WITH ALPHA >NUMBER OF FISH WITH ALPHA <NUMBER OF FISH WITH ALPHA =
—73—71—69—67—.5—6.3—61
59—57—55— ~ -~.J —,
—51—49—47—45—43—41—39—37—35
—31—~9—27~0
I.-..-,
—21—19—17—15
0 DEGREES 100 DEGREES = 190 DEGREES = 0
0 C) C) 0 C>0 0 0 0 0 0C> C) C> C) 0 C)o C> 0 0 0 C)0 0 t:) o o C>0 0 0 o t:> 00 0 0 0 C> 0o 0 o 0 00 C) C) 0 0 C)0 0 0 00 0 0 0 3 10 0 0 0 0
C> C) C) 2 20 o 0 0 2 20 0 C) C> 1 2o 0 o o 1C> C) C) C) 1 20 0 o 0 i.0 C) C) C:> 1. 0o o 0 0o C) C) C) C) 00 o 0 0 0 o0 C> C> C) C>
o 0 0 c:)0 C> C) C> C) C)o 0 0 o o0 C) 0 C) C) 00 o 0 0 0 00 0 0 C) C> C>o 0 C:) 0 0 o
C> C> C> 0C)
0 C) C)C:) o o C)C> 0 0 00 0 C)C) C> U 0
0 0 0 0C..) C_) C)
C) C_> C..> 1C:)
C:) C> ~:>
o o 00 1 2 0
o 11 0 1 C)0 0 0 C)C> C) C) C)0 o C> o0 C) 0o C> 00 C> 0 C)o o 0 oC> 0 0 0o c:> o oC> C) 0 C)0 0 00 C) C) 0o o c) o
FREQUENCYTVG START—UPG< AT 1 METERW CORR FACTORN THRESHOLD mYMINIMUM DEPTHBOTTOM THRESH mYMINIMUM —6dB PWCHECK W —6dB PuMAX HALF—ANGLEPING RATEMx. CH IN RANGE
(2)(4)(6)(8)(10)(12)(14)(16)(18)(2C))(22)(24)
Range in meters ~<) vs Target Strength in dB (y)
Frciri> 2.5 8.3 14.0 19.8 25.5 31.3 37.0 42.8 48.5 ~4.3Tc’ 8.3 14. C) 19.8 25~ 5 31.3 37. C> 42.8 48.5 54.3 60. C) Burn
C—>
C—>
C-)
C—)
C:>
C_)
C->
C-)
C—)
C—)
446I.
5
1C—)
C—)
C.)
C—)
0C—>
C.)
C)C—>

63
Fr~q uericy Hi stc’yrarn cif Tarç~t St reriqth~
30 I.-, c~L.~. ai
~8 Id7 I~ II.- J
~4 Ic~..3 I22 I21 I20 I19 I18 I17 I16 I15 I14 I13 I1~ I11 I10 I9I8171LISI *
41 * ** *
31 * *** *
21 * *** **
ii * ******
I I I I
—75.. —65. —55. —4~. —35. —P5w —15.
Target strength in dB
TOTAL NUMBER OF RECORDED ECHOES 14443
TOTAL ECHOES IN ALL FISH COMBINED 128
TOTAL NUMBER OF FISH TRACKED
AVERAGE OF ALL BACKSCATTERING CROSSSECTIONS FROM EACH FISH . 7290h—04
[N dB —41.3730
BACRSCATTER INS CROSS SECTION STD DEV . 7213E—04
AVERAGE OF ALL FISH TARGET STRENGTHSIN dEc
TARGET STRENGTH STD DEV IN dEc 4.7101
NUMBER OF ECHOES WITH BEAM PATTERNFACTORS > 0 dEc
64
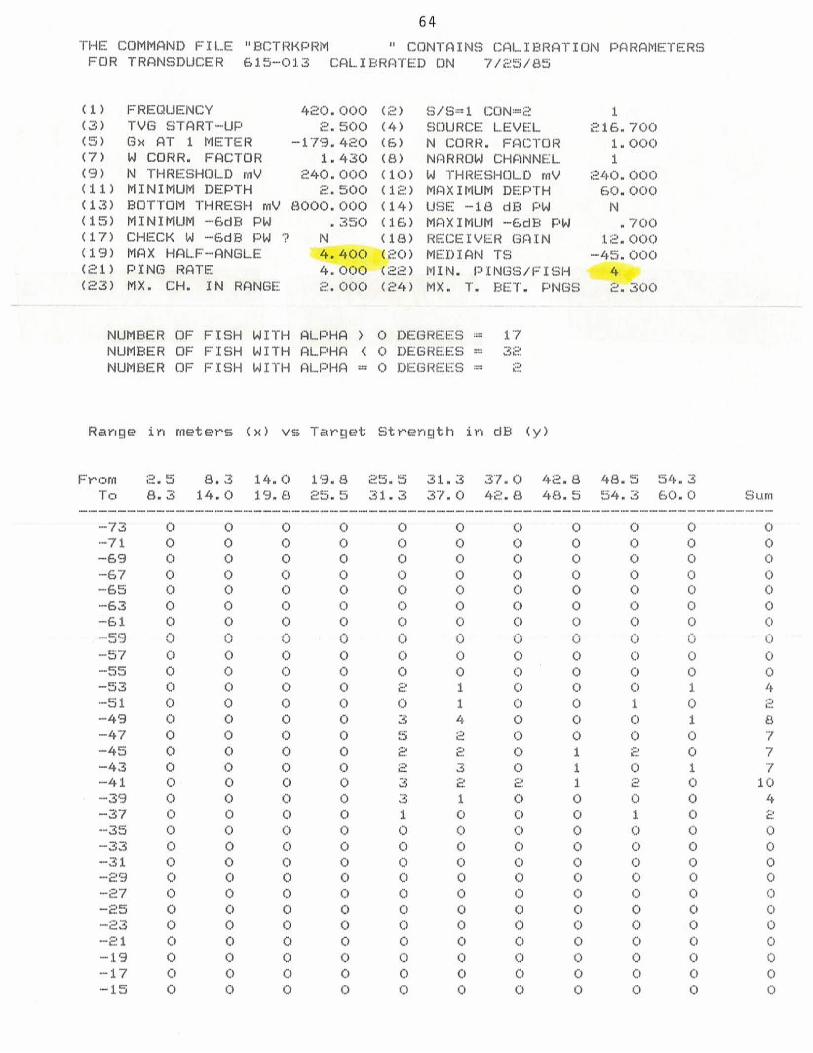
THE COMMAND FILE “BCTRKPRM “ CONTAINS CALIBRATION PARAMETERSFOR TRANSDUCER 615-013 CALIBRATED ON 7/25/85
(1) FREQUENCY 420.000 (2) S/S1 CON:2 1(3) TVG START—UP 2 500 (4) SOURCE LEVEL 216. 700(5) Gx AT 1 METER —179.420 (6) N CORR. FACTOR 1.000(7) W CORR. FACTOR 1.430 (8) NARROW CHANNEL 1(9) N THRESHOLD mY 240. 000 (10) U THRESHOLD mV 240. oc:o(11) MINIMUM DEPTH 2.500 (12) MAXIMUM DEPTH 60.000(13) BOTTOM THRESH mY 8000. 000 (14) USE —18 dB PW N(15) MINIMUM —6dB PW .350 (16) MAXIMUM —6dB F’W .700(17) CHECK U —6dB Pu N (18) RECEIVER GAIN 12.000(19) MAX HALF—ANGLE 4.400 (20) MEDIAN TB —45.000(21) PING RATE 4.000 (22) MIN. PINGS/FISH(23) MX. CH. IN RANGE 2. 000 (24) MX. T. BET. PNGS 2. 300
NUMBER OF FISH WITH ALPHA > 0 DEGREES .= 17NUMBER OF FISH WITH ALPHA < C) DEGREES = 32NUMBER OF FISH WITH ALPHA = 0 DEGREES 2
Range in meters (x) vs Target Strength in dE4 (y)
Fr’:.rn 2.5 8.3 14.0 19.8 25.5 31.3 37.0 42.8 48.5 54.3To 8.3 14.0 19.8 25.5 31.3 37.0 42.8 48.5 54.3 60.0 Sum
—73 0 C> 0 0 C) C) C> C) C) 0 C)—7 1 0 0 0 0 c:~ 0 c:~ 0 0 0—69 C) C) C) C) C) C) C> C) C) C) C)—67 0 0 0 0 0 C) 0 0 0—65 C) C) C) C) C) C) C> C) C) C) C)—63 0 c:~ 0 o 0 0 C) 0—6 1 C) 0 0 C) C) C) C) 0 C) c:)
59 0 o o o o o o—57 C) C) C) C) 0 C) C) C) C) C.) C)—55 C) 0 0 0 0 0 0—53 C) C) C) C) 2 1 C) C) C) 1 4—5 1 C) C) 0 C) 0 1 C) C) 1 C) 2—49 C) C) C) C) 3 4 C) C) C) 1 8—47 0 C) C) 0 C) C) 0 7—45 C) C) C) C) 2 2 C) 1 2 C) 7—43 C) C) C) C) 2 3 C) 1 C) 1 7—41 C) C) C) C) 3 2 2 1 2 C) 10—39 C) C) C) C) 3 1 C) C) C) 0 4—37 C) C) C) C) 1 0 C) C) 1 C) 2—35 0 C) 0 c:~ c:~ t:) o ~:) 0 C)—33 C) C) C) C) C) C) C) C) C) C) C)—3 1 0 C) c: 0 0 o C:) 0 0 0—29 C) C) C) C) C) C) C) C) C) C) C)—27 0 c:~ C) c) o C:) o c:) C)—25 C) C) C) C) C) C) C) C) C) C) C)—;~3 c:~ C) 0 c:~ c:~ C) C) c:~ C:) o 0—2 1 C) C) C) C) C) C) C) C) C) C) 0—19 0 C) c:~ : c:~ t:~ 0 o C:)—17 C) C) C) C) C) C) C) C) C) C) C)— 15 o c:~ 0 C) C) C) c:~ C)

65
Frequency Histogram of Target Strengths
30129128!27!26!25!24!23122!21120119118!17!16!15!14!13!12111 I10! *9! *8! * *7! *****6! *****5! *****4) * ******31 * ******2 I *********1! *********
I I I I
—75. -65. —55. —45. —35. -25. -15.Target strength in dB
TOTAL NUMBER OF RECORDED ECHOES — 14443
TOTAL ECHOES IN ALL FISH COMBINED — 242
TOTAL NUMBER OF FISH TRACKED a 51
AVERAGE OF ALL BACKSCATTER INS CROSSSECTIONS FROM EACH FISH a .8005E—04
IN dB — —40.9667
BACKSCATTER INS CROSS SECTION STD DEV • 6797E—04
AVERAGE OF ALL FISH TARGET STRENGTHSIN dB a —45.0020
TARGET STRENGTh STD 0EV IN dB 4.3860
NUMBER OF ECHOES WITH BEAM PATTERNFACTORS ) 0 dB — 9

THE COMMflND FILE “E4CTRKPRM ~ CONTRINS CflLIE~R~TION P~R~METERSFOR TRflNSDUCER 615—013 CPLIBRflTED ON 7/25/85
(1) FREQUENCY 420.000 (2) S/S~1 CON=2 1(3) TVG STRRT—UP 2. 500 (4) SOURCE LEVEL 216. 700(5) Ox ~T 1 METER —1 79. 420 (6) N CORR. FflCTOR 1.000(7) L~J CORR. FRCTOR 1.430 (8) NARROW CHflNNEL 1(9) N THRESHOLD r,IV 240. c:~oo 10) W rHRESH0I_D mY 240. 000(11) MINIMUM DEPTH 2.500 (12) MflXIMUM DEPTH 60.000(13) BOTTOM THRESH mV 8c:00.000 (14) USE —18 dE~ ~W N(15) MINIMUM —6dE4 PW .350 (16) M~XlMUM -6dB PW .700(17) CHECK W —6dB PW N (18) RECEIVER GRIN 12.000(19) MflX HflLF—flNOLE . 000 (20) MED IflN TS —45. 000(21) PING RATE 4.000 (22) MIN. PINGS/FISH(23) MX. CH. IN RANGE. ~ 000 (24) MX. T. BET. PNGS 2. 300
NUMBER OF FISH WITH flLPH~ > ODEGREES=NUMBER OF FISH WITH RLPHfl < 0 DEGREES 168NUMBER OF FISH WITH ALPHfl = C) DEGREES :~ 7
Range in meters (x) vs Target Strength in dB (y)
Frc’rn 2.5 8.3 14.0 19.8 25.5 31.3 37.0 42.8 48.5 54.3To 8.3 14. C) 13.8 25.5 31.3 37.0 42.8 48.5 54.3 60.0 Suni
—73 C) C) o o o o o o o 0—71 0 o o o 0 0 o o c:> 0—69 0 C) C) C> C) C) C) 0 o c:) 0—67 0 0 0 C> 0 0 0 0 0 0 0—65 0 C> 0 0 0 C> 0 C> c> 0 C)—63 c:> 0 o c> C> C) t:) 0 o—61 C) 0 C) 0 0 0 0 0 0 0 0—50 o () o o o 0 () 0 C 0—57 0 C) C) C) C) 0 :> 0 o o 0—55 o o C) o o 0 C) 0 o 0—53 C> 0 C) C) 1 C) 0 C) 0 1 2—51 0 0 0 0 o 0 0 3—49 C> C) 0 C> 1 C) 4 1 C) 1 16—47 0 0 o o 18 1 1 3 o o—45 C) 0 C) 1 17 1 5 5 0 1 C)—43 0 C) C) 1 1 5 1 9 4 3 3 1 46—41 C) C) 0 0 18 20 1 C) 4 6 2 60—39 C) C> C) C) 13 20 5 2 4 1 45—37 C> C) 0 0 1C> 9 4 2 2 C> 27—35 C> C) 0 1 3 1 2 C) 0 1 8—33 C) 0 0 C) C) 1 C) C) 1—31 0 0 0 C> C> 0 C) 0 C) 0—29 C> 0 0 C) 0 C) C) C) C) C> C)—27 0 0 C) 0 0 C> ) 0 o—25 C> C) C> 0 C) C> C> 0 0 0 C)—23 0 C) :> o o o 0 0 o o—2 1 C) 0 C) C) C) C> 0 > 0 0—19 0 0 0 o 0 o o o o 0— 1 7 :> o o 0 C) 0 C> C> C) C>—is 0 c> 0 o 0 C> 0

67Frequency Histogram of Target Strengths
301291 *****28127$26125$24123122$21120119$ ******181171 ******16$ *******15114$13 I * *•* * * * *12$ *******11) *******101 *******9$ *******81 ********7 I6$ ********SI ********41 ********31 *********2$ **********1 I ***********
I I I I I
—75. —65. —55. —45. —25. —15.Target strength In dB
TOTAL NUMBER OF RECORDED ECHOES 14443
TOTAL ECHOES IN ALL FISH COMBINED 1397
TOTAL NUMBER OF FISH TRACKED a 279
AVERAGE OF ALL BACKSCATTERINI3 CROSSSECTIONS FROM EACH FISH a . 1309E—03
IN dB — —38.8298
BACKSCATTERING CROSS SECTION STD DEV a . 1 137E—03
AVERAGE OF ALL FISH TARGET STRENGTHSIN dB a —42. 3722
TARGET STRENGTH STD DEV IN dB a 3.7934
NUMBER OF ECHOES WITH BEAM PATTERNFACTORS ) 0 dB a 21

THE COMMAND FILE “BCTRKPRM CONTAINS CALIBRATION PARAMETERSFOR TRANSDUCER 615—013 CALIBRATED ON 7/25/85
(1) FREt~UENCV 420. 000 (2) 5/6=1 CON:=2 1(3) TVG START—UP 2. 500 (4) SOURCE LEVEL 216. 7005) G>c AT 1 METER —179.420 (6) N CORR. FACTOR 1.000
(7) W CDRR. FACTOR 1.430 (8) NARROW CHANNEL 1(9) N THRESHOLD mY 240. 000 (1C)) W THRESHOLD mY 240. 000(11) MINIMUM DEPTH 2.500 (12) MAXIMUM DEPTH 60.000(13) BOTTOM THRESH mY 8000. ooo ( 14) us&: —18 dB PW N(15) MINIMUM —6dB PW .350 (16) MAXIMUM —6dB PW .700(17) CHECK W —6dB PW ? N (18) RECEIVER GAIN 12.t)O0(19) MAX HALF—ANGLE 5.000 (20) MEDIAN TS —45.000(21) PING RATE 4.000 (22) MIN. PINGS/FISH 5(23) MX. CH. IN RANGE 2.000 (24) MX. T. BET. PN~~S 2.300
NUMBER OF FISH WITH AL.PHA > 0 DEGREES = 50NUMBER OF FISH WITH ALPHA < 0 DEGREES = 69NUMBER OF FISH WITH ALPHA = 0 DEGREES = 3
Range in meters (x) vs Target Strength in dEl (y)
Front 2.5 8.3 14.0 19.8 aS.5 31.3 37.0 42.8 48.5 b4.~To 8.3 14.0 19.8 25.5 c~i. 3 37. C) 42.8 48.5 54.3 60. C> Sum
—73 0 0 o 0 C) C) 0 C) 0 0 0—71 0 0 0 0 0 0 0 o—69 C) 0 C) C) 0 C) 0 C) 0 0—67 0 0 0 0 0 0 0 0 0 0 0—65 C) 0 C) C) C> 0 C) 0 C) C) C)—63 0 0 0 o o o o 0 ()—61 0 o c> C> 0 C) 0 0 1 o—59 o o o o o o o o o—57 t:> 0 0 C) o o o 0 c) C..) C)
—s~ c:> o 0 o o 0 o 0—53 C) C) C) C) 1 C) C) 0 C) 0 1—51 0 t:) 0 i. 0 o o 0 0 1—49 C) C) C> C) 2 1 C) C) C) 1—47 0 0 0 0 8 4 0 0 0 0 12—45 C> C) C> C) 9 6 1 C) 1 C) 1 7—43 C> C> 0 C) 8 8 1 2 2 1 22—41 C) C) C) C) 8 11 8 2 3 C) 32—39 C) C) C> C> 5 12 1 2 3 1 24—37 C) C) C) C) 3 4 C) C> C) C) 7—35 C) C) C) C) 1 1 0 C) 0 C) 2—33 C) C> C) C) C> 0 C) C) C) C) C)—31 C) C) 0 0 0 C) C> 0 t:) C)—29 C> C> C) C) C) C> C) C) C) C) C)—27 0 C 0 0 C) 0 0 o 0—25 C) C> C) C) 0 0 0 C> C) 0—$3 C) 0 o c) c> 0 C) t:> 0 0—2 1 C) C) C) C) C) C) C) 0 C) C> C)—19 o 0 0 c:~ 0 0 c:> 0 C> o— 1 7 C) C) C) C) c:> C) C) c:> C> 0—15 c:~ 0 0 0 0 0 0 0 0

69
Frequency Histogram of Target Strengths
301 *291 *28! *271 *261 *251 *241 **231 **22! ***21! ***20! ***191 ***181 ***171 ****161 ****151 ****141 ****13! ****12! *****ill *****101 *****9! *****8! *****7! ******6! ******SI ******41 *******31 *******2! ********1!
I I I I
—75. —65. —55. —45. —35. —25. —15.
Target strength In dB
TOTAL NUMBER OF RECORDED ECHOES 14443
TOTAL ECHOES IN ALL FISH COMBINED — 769
TOTAL NUMBER OF FISH TRACKED a 122
AVERAGE OF ALL BACKSCATTERING CROSSSECTIONS FROM EACH FISH a . 1310E—03
IN dB a —38.8263
BACKSCATTERING CROSS SECTION STD DEY a . 1029E—03
AVERAGE OF ALL FISH TARGET STRENGTHSIN dB — —42. 3178
TARGET STRENGTH STD DEV IN dB — 3. 3796
NUMBER OF ECHOES WITH BEAM PATTERNFACTORS > 0 dB a 15

C)00C:)C)0C)C)C)00C)C)00o0C)C)C)C)0LI—
0oC)C)C)0o0ooo61—
()C)C)C)C)C)C)C)0C)012—000C)000000£2—OC)C)00C)0000052—OC)C)0~)o~:oC)C)0L2—C)C)00000()C)C)062—0C)o0o~:>C)00C)C)0C)0C)C)C)C)C)0£~D—
1000oC:)C)0o‘7()C)C)0220C)00rrC:)£I1££C)oC:)C)
C)21‘75C)C)0C)L£00o
8010019C)C)0C)
6C)C)C)0~7oC:)c:0110C)C)t)C)C)C)C)C)
000C)0C)C)C:)IS—C)C)C)C)0C)C)C)C)C)
C)C:)C)C)~)C:)C:)C:)0055—C)C)0C)C)C)C)C)C)C)000C>ooo0o0oC:)£5—0C)C)C)00C)C)C)C)C)19—oC:)oC:)oc)~:)C)00£9—01)C)C)C)000C)C)C)59—
C)C)C)C:)0C)C)L9—C)C:)C)C)C)C)C)0C)C)C:)£9—C:)C:)C)C:)c:>~:)oC:)c:IL—C)00C:)C)0C)C)C)C:)
LUn50”09c’”47q5”91~8”2+i0”L~£“1~5529”61C)”171£9‘DI
£“1755“8+,8“2~0”L~D£“1~S“528“61C)+~£“95~
(A)~f)I.Atb13.Aq.5~SA(X)S.A~~LIJut~35iA~
2=S33è~93UC)=UHd1~HuMHSIddOeI38WflN=S33~93QC)>UHd1UHuMHSIddO~38NflN
22=S33~~EI~C)(~iHd1UHuMHSIddO~38WflN
C)flc’”?SCNd“.L38“1“XN(~r2)C)C)C)”239NUHNIHD“XW(~2)HSId/S9NId“NIW(22)C)C)C)”173IU~9NId(12)
SIN~iI~3W(02)OC)C)319NU—d9~HX~W(61)000”21NIUO~9M3~)3eI(91)N~lid8P9—M)103H3(LI)C)C)L”lid8P9—WflL4IXUW(91)05~”lid~3P9—WflWINIW(51)
Nlid‘~P81—38fl(~71)000”0008ALUHS3~HIWOlIOS(~1)C)00”C)9HId3UWflNIX~N(21)C)C)5”;~HId3UWflWINIW(II)C)C)C)“0~2A~CflOHS3èIH..LIi(01)~~)000~.~UJG9OHS3~HIN(6)
I93NNUHDMOèfèIUN(8)C)~17”1è~OIDUd“e~eiODIi(L)000”IeIOIJUd“e~OC)N(9)02’7”BLT—el3I3WI..WX9(5)OOL“91293A313D~flOS(~)005“2dfl—I~UISCA!(~)
I2=NOC)1=5/S(2)000”02’7ADN3fl~J3~d(1)
58/52/LNI)~3J~ièISI9U3£10-519eI3DflUSNUèI!èIDdSeI3I3WUè!UdNOIIt~e~5IiUC)SNIUINODW~d>I~ID8.,311dCINUWWOO3H..L

71
Frequency Histogram of Target Strengths
301291281271261251241231221211201191181171161151141 *131 *121 **ill ***101 ***SI * ***81 *****71 *****LI *****51 *****41 ******31 ******21 ******1 I ********
I I I I
—75. —65. —55. —45. —35. —25. —15.-. Target••.strength• in dB
TOTAL NUMBER OF RECORDED ECHOES 14443
TOTAL ECHOES IN ALL FISH COMBINED a 459
TOTAL NUMBER OF FISH TRACKED a 60
AVERAGE OF ALL BACKSCATTER INS CROSSSECTIONS FROM EACH FISH a . 1303E—03
IN dE a —38.8502
BACKSCATTER INS CROSS SECTION STD DEY a . 1097E-03
AVERAGE OF ALL FISH TARGET STRENGTHSIN dB a —42.3293
TARGET STRENGTh STD DEV IN dB a 3.1967
NUMBER OF ECHOES WITH BEAM PATTERNFACTORS ) 0 dB a 9

THE COMMAND FILE “8CTRKPRM “ CONTAINS CflLII3RATION PARPMETERSFOR TRPNSDUCER 615—013 C~LIBR~TED ON 7/25/85
1216.. 700
1 — 0001
240. 00060. C)00
N70C>
12. 000—45. 000
7~.. ~300
NUMBER OF FISH WITH ~LPH~ >NUMBER OF FISH WITH flLPH~ <NUMBER OF FISH WITH flLPHA =
0 DEGREES =
0 DEGREES0 DEGREES =
Range in meters Cx) vs Target Strength in dB (y)
Frc’rn 2.. 5 8. 3 14. 0 19.. 8To 8.3 14.0 19.8 25.5
c,I~. ~::• —~i —I_.. i. .J ~ .L - ~ s.J . -
31.3 37. C) 42.842.8 485 54.348.5 54.3 60.0 Sum
—73—71-69—67-65—63—61
—57-55
—51-49—4.7—45—43—41—39—37—35-33—31—29—27— ..
L... ~J
—23—21—19—17
C)
C) 00 00 00 C)0 00 C)
c:)0 C)
C—>
C—)
C—)
C)
UC.)
C—>
()
C)
C—)
C)
1S5‘38611C)
C)
C-)
C)
0C)
0C)
C>
(1) FREG~UENCY 42C)000 (2) S/S:1 CON2(3) TVG STflRT—UP 2. bOO (4) SOURCE LEVEL(5) Gx ~T 1 METER —179.420 (6) N CORR. FACTOR(7) W CORR. FRCTOR 143C) (8) NflRROW CHflNNEL(9) N THRESHOLD mV 240.000 (10) W THRESHOLD mV(11) MINIMUM DEPTH 2.500 (12) M~X1MUM DEPTHC 13) BOTTOM THRESH mV 8000. 000 ( 14) uSE —18 d13 PW(15) MINIMUM —6dB PW .350 (16) MAXIMUM —6dB PW(17) CHECK W —6dB PW ? N (18) RECEIVER GAIN(19) MRX HPLF—flNGLE 5.000 (L...0) MEDI1-~N TB(21) PING RPTE 4.000 (22) MIN. PINGS/FISH(23) MX. CH. IN RPNGE 2.C)00 (24) MX. 1. BET. PNGS
1521
C—)
0 C) C) C) C) C) C)C)
0 C) C) 0 0 C) C) C) C> C)C) C:> C:) C:) C:) C:) 0 00 C> 0 C) 0 C> C> C> C) C)C) ~:) C:> C:> c:~ C:) C:> C:) o
c) C> ~:) C:> C)o o o o o o o 0o o 0 C> ~:> U 0 C:) C) C->
o C:) o C:> o c:~ 0 c> o0 C) C) C> C> C> C) C) 0
o o : o C:) C:) C:)0 C) C) C> C) C) C> 1
C) 3 2 c:) ~ C:)0 C) 3 1 C) C) 1 C>0 0 2 5 0 2 C>0 C> C> 3 2 1 2 C)0 0 1 1 C) 1 3 00 C) C> 1 C> C) C> C>o C:> i 0 :~0 C) C> 0 C) C) C)
0 c: c:~ c:~ 0 C) C)
0 C> C) C> C> C) C) C) 0 C)o C:) o 0 o
0 C> C) 0 c: C) C> ~ C>o t: c: c:~ 0
0 C) C) C:) C:) o C:) o0 t:~ C:) c:> c:~0 C> C) C> 0 C> C) C) C) 0
—15 C) ~:> C) ~ o C—)
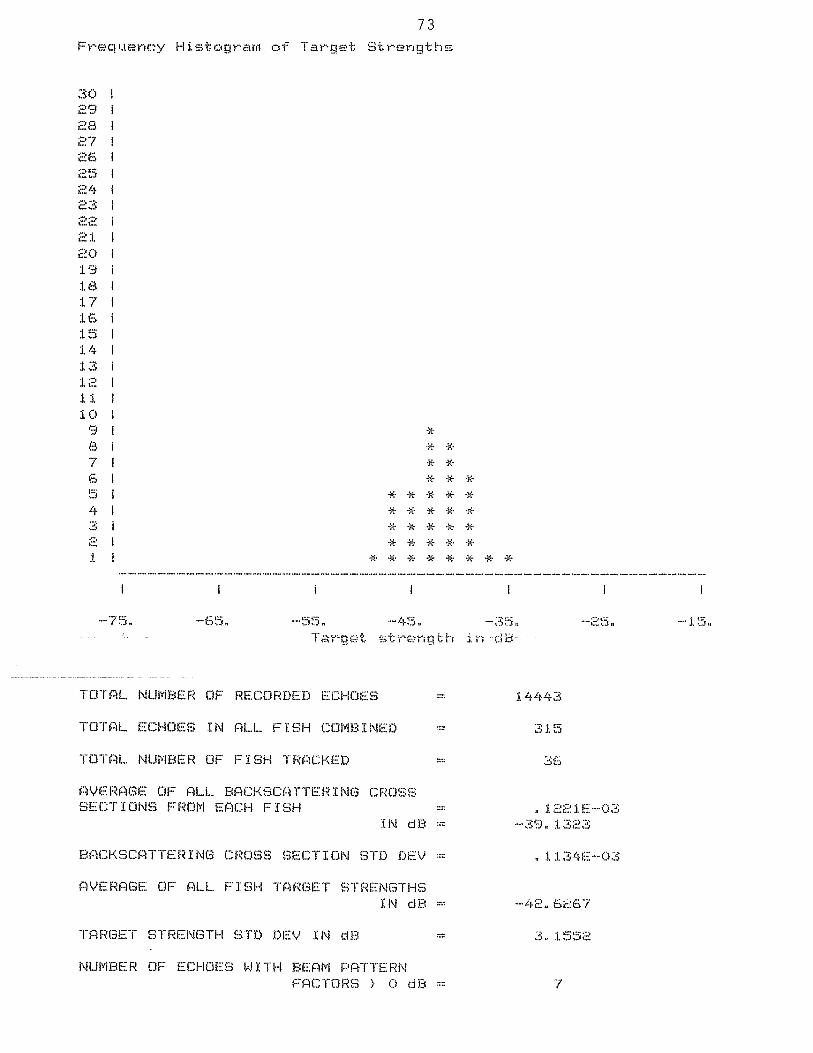
73Frequency Histogram of Target Strengths
30129128127126125124123122121120119118117116)15114113112111 I10)91 *81 **71 **LI ***SI *****41 *****31 *****21 *****ii ********
I I I I
—75. —65. —55. —45. —35. —25. —15.Target strength- in -dB-
TOTAL NUMBER OF RECORDED ECHOES 14443
TOTAL ECHOES IN ALL FISH COMBINED a 315
TOTAL NUMBER OF FISH TRACKED a 36
AVERAGE OF ALL BACKSCATTERINS CROSSSECTIONS FROM EACH FISH .1221E03
IN dB a —39.1323
BAD4SCATTERING CROSS SECTION STD DEV a . 1 134E—03
AVERAGE OF ALL FISH TARGET STRENGTHSIN dB — —42. 6267
TARGET STRENGTh STD DEV IN dB a 3.1552
NUMBER OF ECHOES WITH BEAM PATTERNFACTORS > 0 dB a 7