
University of Toronto 2005 - Hydrogen Student Design … of Toronto 2005 Hydrogen Power Park Design...
38
Transcript of University of Toronto 2005 - Hydrogen Student Design … of Toronto 2005 Hydrogen Power Park Design...


1
University of Toronto 2005Hydrogen Power Park Design Proposal
Authors
Robert BarringtonNemanja Danilovic
Pat GoodalePulkit Gupta
Vikram Khipple Mulligan
Alexander PerezManeesh PodderIvan VinogradovMaureen WongLaszlo Zsidai
Faculty Advisor
Professor Steven J. Thorpe
Special Thanks To
Paulo BorgesPeter Yan Li
Venkataranga S. Puranam
Joanne TsangDivya Yadava
© Copyright by 2005 H2U Design Team, University of Toronto 2005, All Rights Reserved

1
Executive Summary
Hydrogen North is an innovative start-up corporation, created to service Toronto’sburgeoning film and courier industries with hydrogen, electricity and telecommunications.Renewable energy sources will allow a fully self-sustaining station that will serve the followingfunctions from 2010 to 2020:
1. Dispensing 250 kg of compressed hydrogen gas at 10,000 psi per day for a) on-roadPurolator courier vehicles and b) bottled tanks for utility vehicles in the movie industry(e.g. forklifts, scissor trucks).
2. Providing a 100 kW Uninterrupted Power Supply (UPS) between 8 am and 8 pm tosupport film production energy demands (e.g. lighting, special effects, editing).
3. Providing secure high bandwidth telecommunications services and office space tosupport data management and global image processing (HollyWire™).
4. Educating the public about renewable technologies through an interactive display center,guided outreach activity tours, and real-time Internet access to station operationsincluding both data and video feed.
An abandoned coal power plant adjacent to the Toronto film district, Hollywood North, willbe the site of Hydrogen North’s waterfront redevelopment venture. The station will exploit thelatest in green technologies incorporating a SmartEnergy™ Wind/Solar Tower linked to a bankof PEM electrolyzers and fuel cells to generate, store, utilize and dispense hydrogen.
Safety is an integral part of the station’s design to ensure the welfare of employees andcustomers alike. The design of the station is in conformance with existing hydrogen regulatorycodes and standards and a HAZOP’s analysis was conducted to provide a managed risk strategyof operations.
The environmental analysis conducted clearly shows the benefits of the suite of technologieschosen in the station design. Hydrogen North will not produce any emissions throughout itsoperating life of 10 years, and will remove roughly 1.6 x 10⁷ tons of CO2 equivalents (CO2e)annually by providing electricity and dispensing hydrogen fuel.
Through a diverse range of products and services, Hydrogen North is an economically viableenterprise. With a total capital investment cost of $1.8 M USD, the ten-year project will yieldcumulative earnings of $4.3 M USD. By implementing successful business practices HydrogenNorth will be profitable by 2014, with a dispensed hydrogen cost of $5/kg.

2
Table of Contents
Table of Contents............................................................................................................................ 2List of Figures ................................................................................................................................. 4List of Tables .................................................................................................................................. 51.0 Technical Design ...................................................................................................................... 6
1.1 Introduction........................................................................................................................... 61.2 Hydrogen North Location ..................................................................................................... 61.3 Station Layout....................................................................................................................... 71.4 Station Operation .................................................................................................................. 9
1.4.1 Power Generation......................................................................................................... 101.4.2 Power Conversion........................................................................................................ 101.4.3 Hydrogen Production ................................................................................................... 101.4.4 Hydrogen Compression and Storage for Dispensing................................................... 101.4.5 Hydrogen Compression and Storage for UPS ............................................................. 111.4.6 Operational Control ..................................................................................................... 111.4.7 Station Power Consumption ........................................................................................ 11
1.5 Major Station Components ................................................................................................. 121.5.1 SmartEnergy™ Wind/Solar Tower [6] ....................................................................... 121.5.2 Hydrogenics HyLYZER™ 65 PEM Electrolyzer [7] .................................................. 131.5.3 Hydrogenics HyPM™ 65 PEM Fuel Cell [7].............................................................. 131.5.4 Hydro-Pac Inc. C03-15-70/140LX & C06-40-70/140LX Compressors [8]............... 141.5.5 Pressure Products Industries 6V Booster Compressor [9]........................................... 141.5.6 Dynetek Storage Tanks 3,000 & 6,000 PSI [10] ......................................................... 151.5.7 FTI International 10,000 PSI Dispensers [11] ............................................................. 15
1.6 Station Safety Approval...................................................................................................... 152.0 Safety Analysis ....................................................................................................................... 16
2.1 Hazards and Operability Study ........................................................................................... 162.2 Top Priority Hazards and Mitigation .................................................................................. 172.3 Major Safety Features and Systems.................................................................................... 18
2.3.1 Station Layout.............................................................................................................. 182.3.2 Emergency Venting System......................................................................................... 182.3.3 Storage Location .......................................................................................................... 182.3.4 SmartEnergy™ Wind/SolarTower............................................................................... 18
3.0 Environmental Analysis.......................................................................................................... 193.1 Introduction......................................................................................................................... 193.2 Hydrogen Production Methods ........................................................................................... 193.3 Emissions Savings from Electricity Consumption ............................................................. 203.4 Electricity Production for Hollywood North ...................................................................... 203.5 Well to Wheel Analysis ...................................................................................................... 213.6 Environmental Impacts from Wind/Solar Tower ............................................................... 213.7 Conclusion .......................................................................................................................... 22
4.0 Economics............................................................................................................................... 234.1 Overview............................................................................................................................. 234.2 Expenses ............................................................................................................................. 23
4.2.1 Operating Expenses ..................................................................................................... 23

3
4.2.2 Administration ............................................................................................................. 244.3 Revenue Streams................................................................................................................. 25
4.3.1 Building........................................................................................................................ 254.3.2 Services ........................................................................................................................ 254.3.3 Telecommunications .................................................................................................... 26
4.4 Income................................................................................................................................. 265.0 Marketing................................................................................................................................ 27
5.1 Place.................................................................................................................................... 275.2 Price .................................................................................................................................... 275.3 Product ................................................................................................................................ 275.4 Promotion............................................................................................................................ 28
6.0 References............................................................................................................................... 31Appendix A - Major Station Components Data Tables ................................................................ 33Appendix B - Station Blueprint and Flow Sheets......................................................................... 34Appendix C - Economics .............................................................................................................. 35

4
List of FiguresFigure 1 Hydrogen North, Toronto, Ontario, Canada………………………………………… 6Figure 2. Station Site Plot ……………………………………………………………………. 7Figure 3. 3-D Rendering of the Power Park …………………………………………………. 7Figure 4. Production Facility (SE View)……………………………………………………… 8Figure 5. Production Facility (NE View)……………………………………………………... 8Figure 6. Station Flow Sheet………………………………………………………………….. 9Figure 7. Process and Instrumentation Diagram……………………………………………… 9Figure 8. Wind Speed Profile in Lake Ontario Region………………………………………. 10Figure 9. Control System Schematic…………………………………………………………. 11Figure 10. Load Demand versus Time Graph for Scenario 1………………………………… 11Figure 11. Load Demand versus Time Graph for Scenario 2………………………………… 12Figure 12. Plot of station Net efficiency vs. Load..................................................................... 12Figure 13. SmartEnergy™ Wind/Solar Tower………………………………………………. 13Figure 14. Hydrogenics HyLYZER ™ 10……………………………………………………. 13Figure 15. Hydrogenics HyPM™ 10………………………………………………………… 13Figure 16. PEMFC Cell……………………………………………………………………….. 14Figure 17. FTI International 10,000 psi H2 Dispensers .……………………………………… 15Figure 18. Adapted from Economics and Environmental Effects of Hydrogen ProductionMethods [13] ………………………………………………………………………………….
19
Figure 19. Station Annual Revenue…………………………………………………………... 25Figure 20. Station 10 Year Projected Earnings……………………………………………….. 26Figure 21. Hydrogen North Blueprint (Lower and Upper Floor)………………………….…. 33Figure 22. Hydrogen North Electrical and Hydrogen Flow Diagram………………………… 33

5
List of Tables
Table 8. Hydrogen North’s Expense Sheet…………………………………………………… 34Table 9. Hydrogen North’s Revenue Streams………………………………………………... 35Table 10. Hydrogen North’s Income Statement……………………………………………… 35
Table 1. H2 Producers Comparison…………………………………………………………… 13Table 2. H2 Generators Comparison Table…………………………………………………… 14Table 3. HAZOP Risk Assessment Definitions……………………………………………… 16Table 4. Results of the Hazards and Operability Study……………………………………… 17Table 5. Emission Factors taken from OPG [3] and GREET 1.5 program [4] ………………. 20Table 6. Emission Factors taken from OPG and GREET 1.5 program………………………. 20Table 7. Well to Tank and Tank to Wheel Analysis…………………………………………. 21

6
1.0 Technical Design
1.1 IntroductionAs we move into the twenty-first century, our society’s energy demands continue to
grow. This growth means that problems that were once relatively trivial are now becomingmajor threats to sustainability. Ontario currently generates electricity by exploiting coal andnatural gas reserves, nuclear power, and more recently through alternative energy sources [1,2].During times of peak demand, the rate of generation is less than the rate of consumption,requiring the import of electricity from Michigan, New York, Québec, and Manitoba [2,3].There is no present methodology to provide large-scale storage of generated electrical energy forload leveling, thus energy is wasted at times of low demand. Simultaneously, we are nearing theend of the age of abundant oil, requiring new means of storing energy for transportation [4].
These problems are not insurmountable provided we implement new energy strategies intime. Enter “Hydrogen North”. Hydrogen can play a major role by acting as an energycurrency; storing electrical energy through the production of hydrogen when demand is low, andby using the stored hydrogen to produce electricity during periods of peak demand eliminatingOntario’s need for imported electricity. Furthermore, hydrogen can also be used to support thetransportation sector through hydrogen fuel cell or H2ICE vehicles, offering a viablereplacement for gasoline. If the electricity used to make the hydrogen is produced usingsustainable technologies such as wind turbines and solar cells, a zero-emissions energyinfrastructure results.
1.2 Hydrogen North LocationAn abandoned coal power plant adjacent to the Toronto film district, Hollywood North,
will be the site of Hydrogen North’s waterfront redevelopment venture. The 21,000 ft2 of area iscurrently occupied by the decommissioned Hearn coal power plant. The plant has been shutdown for several years, and by 2010 all infrastructure will have been demolished. HydrogenNorth Power Park will come into operation in 2010, with a service life of 10 years. The powerpark will be built and operated in full accordance with local industrial zoning laws and safetycodes. Figure 1 below shows the proposed location of the power park.
Figure 1 Hydrogen North, Toronto, Ontario, Canada

7
1.3 Station LayoutA site plan and 3-D rendering of the power park are shown in Figure 2 and Figure 3
respectively, and consist of several components:1. The factory will contain all of the equipment used to produced, compress and store and
utilize hydrogen for power production and fueling. A SmartEnergy™ Wind/Solar Towerwill provide the stations power /communications requirements.
2. The front of the power park will contain the hydrogen dispensing area, educationalcenter, convenience store and the offices of Hydrogen North. The second floor willcontain retail space for local businesses that support the film industry.
3. Telecommunications services will be provided through proprietary equipment in thetower.
Figures 4 and 5 provide a 3-D rendering of the internal layout of the station componentsof the factory portion of the station. Appendix B contains detailed blueprints for both the firstand second floors of the station.
Figure 2. Station Site Plot
Figure 3. 3-D Rendering of the Power Park

8
Figure 4. Production Facility (SE View)
Figure 5. Production Facility (NE View)

9
1.4 Station OperationHydrogen North will be a model of sustainable engineering. The station will run on
renewable energy sources, provide 100 kW of UPS from 8 am - 8 pm, dispense 250 kg ofcompressed H2 at 10,000 psi per day, while providing telecommunications and educational tours.Figure 6 shows the flow sheet of the station with the process and instrumentation diagram givenin Figure 7. Appendix B contains the hydrogen and electrical flow diagrams.
Figure 6. Station Flow Sheet
Figure 7. Process and Instrumentation Diagram

10
1.4.1 Power GenerationAll electricity demands (1MW) will be met by
the SmartEnergy� Wind/Solar tower, whichproduces 60 Hz VAC. These demands include stationoperations, hydrogen production (after rectifying theelectricity to DC) and related factory operations, andUPS. Average wind speed in the region whereHydrogen North will be constructed has been foundto be well above the estimated cut-in wind speed of4.5-5m/s for the tower. Figure 8 shows the windpatterns for Lake Ontario and Toronto.
If there is insufficient wind/solar to meetnormal station requirements the power demand issupplemented by the stored hydrogen and fuel cells.
In the unlikely event that there is no wind andno sun and the hydrogen fuel supply (2 days worth ofstorage) is exhausted, the power demand will be met by purchasing renewable “Green”electricity from the provincial electricity supplier, Ontario Power Generation. It is estimated, thatthe worst case scenario, a contingency of 30 days (800 kW) worth of funds are set aside tocompensate for the expense. This is also highlighted in the economics and environmentalsections.
1.4.2 Power ConversionTo minimize transmission losses across the factory, the power park’s electric
infrastructure will be maintained at 575 VAC. Moreover, servicing the hydrogen compressors aswell as the Hollywood North load at this Canadian standard of 575 V will eliminate the need fortwo transformers. The HyLYZER™ electrolysis stack operates at 100 VDC, requiring a singlestep-down transformer and a set of parallel rectifiers, with 5% loss, as recommended by themanufacturer. Similarly, power from the 98 VDC fuel cell stacks will incur a 5% loss through avoltage source inverter, transformer and suitable power conditioning.
1.4.3 Hydrogen Production Hydrogen North power park will be designed for a maximum daily hydrogen production
capacity of 330 kg H2 for dispensing and electricity generation. Hydrogen will be produced by 7HyLYZER™ 65 electrolyzers, which consume DC electricity supplied on-site by an OhioAlternative Power (OAP) 1.8 MW Wind/Solar tower and deionized water. City water isdeionized on site before it is stored on site in a 7 water tank.
1.4.4 Hydrogen Compression and Storage for DispensingThe hydrogen produced is compressed to 6,000 psi using 5 Hydro-Pac LX-6 compressors
and stored in 6,000 psi Dynetek tanks respectively. The hydrogen stored at 6,000 psi is thencompressed to over 10,000 psi using a 6V PPI compressor and dispensed by 2 FTI InternationalDispensers at 10,000 psi. The station dispenses 21kg/hr for a total of 250 kg/day, and can handlea maximum peak dispensing of 37.5 kg/hr. FTI hydrogen priority panels are used to optimizestoring and dispensing of hydrogen gas to and from the storage tanks.
Hydrogen North
Figure 8. Wind Speed Profile in LakeOntario Region [5]

11
Case 1: Station Power Consumption
0
100
200
300
400
500
600
700
800
900
8am
9am
10am
11am
12am 1p
m2p
m3p
m4p
m5p
m6p
m7p
m8p
m9p
m10
pm11
pm12
pm 1am
2am
3am
4am
5am
6am
7am
Time
Pow
er C
onsu
mpt
ion
(kW
h)
UPSElectrolysis CompressionStation Operation AuxilliaryTotal
1.4.5 Hydrogen Compression and Storage for UPSThe SmartEnergy� Wind/Solar tower provides the primary source of UPS. When there
is insufficient wind to deliver 100kW, the Hydrogenics fuel cells are brought online andmodulated to provide the UPS. There is enough stored hydrogen to provide UPS for 2 days, 12hours each day. One day’s worth of hydrogen destined for UPS consumption can be replenishedper day. This hydrogen is produced by the electrolyzers, compressed by 3 Hydro-Pac LX-13,000psi compressors and stored in 3,000 psi Dynetek tanks. FTI hydrogen priority panels areused to optimize storing and dispensing of hydrogen gas to and from the storage tanks. Hydrogenstored at 3,000psi is dispensed to the fuel cell through a control valve that lowers the pressure to15 psi.
1.4.6 Operational ControlThe power plant is controlled by a
master central computer system to optimizeeverything from hydrogen production, usageof power, and flows of hydrogen fromcompression and storage to dispensing. Thecontrol system also monitors all of the safetysystems (e.g. gas detectors and nitrogenpurging). The master computer is monitoredby a slave system that only has shutdowncapabilities in case of master failure.
1.4.7 Station Power ConsumptionSince day and night time power usage are different a single model cannot be given
because optimal power consumption will depend on the amount of hydrogen generated andrelated operations. Two case scenarios are provided in Figure 10 and Figure 11 below. Scenario1 depicts nominal station operation in which all of the renewable power is used to provide UPSand dispensed hydrogen only. Scenario 2 further incorporates the need for replenishment of thehydrogen storage system.
Figure 9. Control System Schematic
Figure 10. Load Demand versus Time Graph for Scenario 1

12
Case 2: Station Power Consumption
0
100
200
300
400
500
600
700
800
8am
9am
10am
11am
12am 1p
m2p
m3p
m4p
m5p
m6p
m7p
m8p
m9p
m10
pm11
pm12
pm 1am
2am
3am
4am
5am
6am
7am
Time
Pow
er C
onsu
mpt
ion
(kW
h)
UPSElectrolysisCompressionStation Operation AuxilliaryTotal
95%
35%
0%
10%
20%
30%
40%
50%
60%
70%
80%
90%
100%
Effic
ienc
y (%
)
UPS 100 kW
Net Efficiency Vs. Load
Wind/Solar Tower
Fue l Cell
Depending on the source ofelectricity for UPS the stationelectrical efficiency variesdramatically as depicted inFigure 12.
1.5 Major Station Components
1.5.1 SmartEnergy™ Wind/Solar Tower [6]Hydrogen North is designed to take advantage of renewable wind and solar power. The
icon of this concept is our wind/solar tower. OAP is a licencee of Eneco’s WARPTM tower andadds its patented telecommunications technology to form the SmartEnergyTM tower used tosustain the park year-round. The principal output of the tower is electricity derived from wind,since the seasonal variation, large surface area required, and cost would prohibit solar powerfrom being the principal electricity supply. However a unique feature of the tower is the uppersurfaces of each turbine contain a solar array to supplement the wind supply. Thus our solution is
Figure 11. Load Demand versus Time Graph for Scenario 2
Figure 12. Plot of station Net efficiency vs Load

13
a 161m, 1.58MW wind/solar tower, which earns the power park a unique place in the Torontoskyline.
The local average wind speed of 5.7 m/s at 80m elevation [5]makes traditional large wind turbines only marginally economical. Aninnovative windmill design, the Ohio Alternative Power SmartEnergy�Tower, consisting of numerous smaller rotors permits utilization of lowwind speeds by concentrating wind around the turbines. Themanufacturer claims that their stacked design offers acceleration in windspeed of 1.5 to 1.8. The design is modular, every other unit containingfour rotors of diameter 2-3 m and an individual generator. Aside fromthe benefit of added robustness, this modularity ensures that no power islost when the wind direction and velocity vary with altitude, since eachunit can rotate individually into the wind and each turbine may run at aunique speed. Each unit is between 3 and 5 m in height andapproximately toroidal, with turbines placed between every pair wherethe wind is concentrated. With average winds of 5.7 m/s, the averagepower delivered to the base of this structure will be 1 MW; this will beconverted immediately to the appropriate voltage of 575 VAC to bedistributed around the park.
1.5.2 Hydrogenics HyLYZER™ 65 PEM Electrolyzer [7]Hydrogen North produces H2 gas using 7 Hydrogenics HyLYZER™ 65 PEM
Electrolyzers. Each unit produces a maximum of 2.5 kgH2/hr, up to a maximum stationproduction capacity of 17.5 kgH2/hr. HyLYZER™ 65 is a PEM electrolyzer based on theHydrogenics H2X-701E platform, which dispenses 99% pure hydrogen at 140 psi. In comparisonto alkaline electrolysis technology, a PEM based electrolyzer was chosen to avoid dealing withcaustic handling, albeit at a cost premium.
H2 ProducersRequirementsPEM Alkaline
Low Temperature Yes YesPure H2 product Yes YesZero emissions Yes Yes
No Corrosive Chemicals Yes NoLow Cost No Yes
Table 1. H2 Producers Comparison
1.5.3 Hydrogenics HyPM™ 65 PEM Fuel Cell [7] UPS power for the Hydrogen North station is
supplied by two 65 kW (maximum output) HydrogenicsPEM fuel cells, for a total of 100 kW (130 kW max)available capacity. The HyPM™ 65 system is a polymerelectrolyte membrane fuel cell based on the H2X-505stack. This is a versatile system with fast response time andquick start-up. Hydrogenics Corporation is a leader in the
Figure 12. HydrogenicsHyLYZER ™ 10
Figure 13. HydrogenicsHyPM™ 10
Figure 11. OAPSMARTEnergy™ Wind/Solar Tower
14
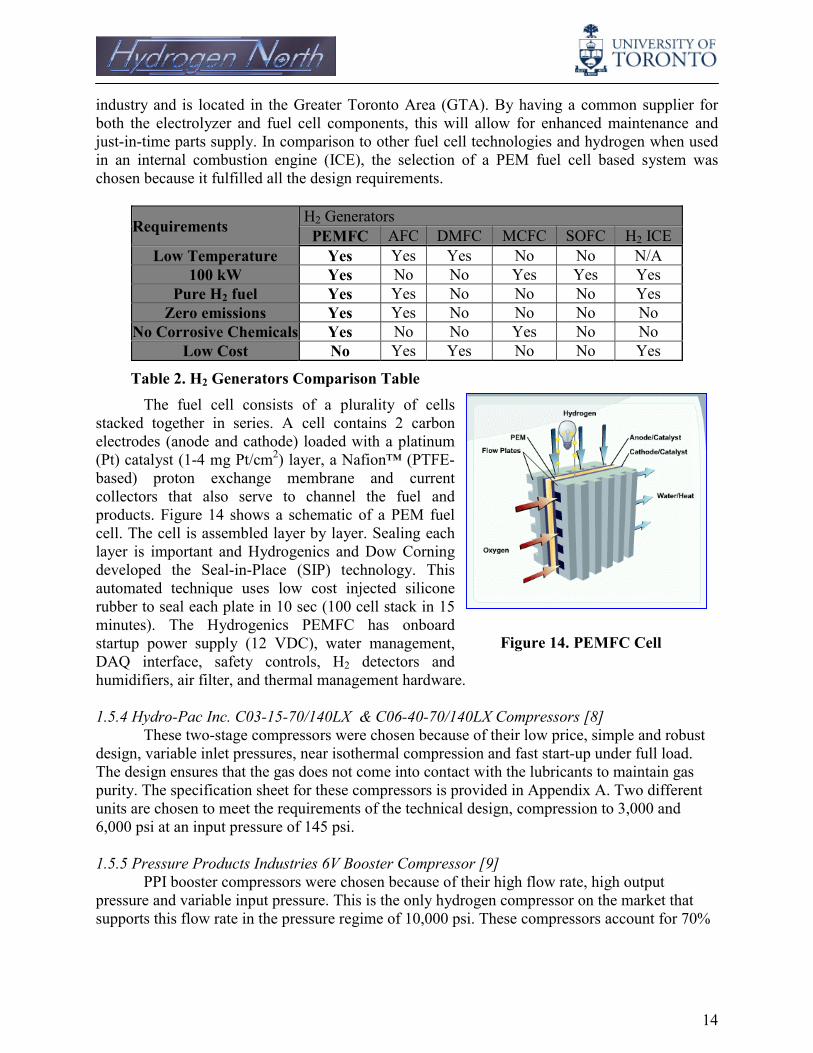
industry and is located in the Greater Toronto Area (GTA). By having a common supplier forboth the electrolyzer and fuel cell components, this will allow for enhanced maintenance andjust-in-time parts supply. In comparison to other fuel cell technologies and hydrogen when usedin an internal combustion engine (ICE), the selection of a PEM fuel cell based system waschosen because it fulfilled all the design requirements.
H2 GeneratorsRequirements PEMFC AFC DMFC MCFC SOFC H2 ICELow Temperature Yes Yes Yes No No N/A
100 kW Yes No No Yes Yes YesPure H2 fuel Yes Yes No No No Yes
Zero emissions Yes Yes No No No NoNo Corrosive Chemicals Yes No No Yes No No
Low Cost No Yes Yes No No Yes
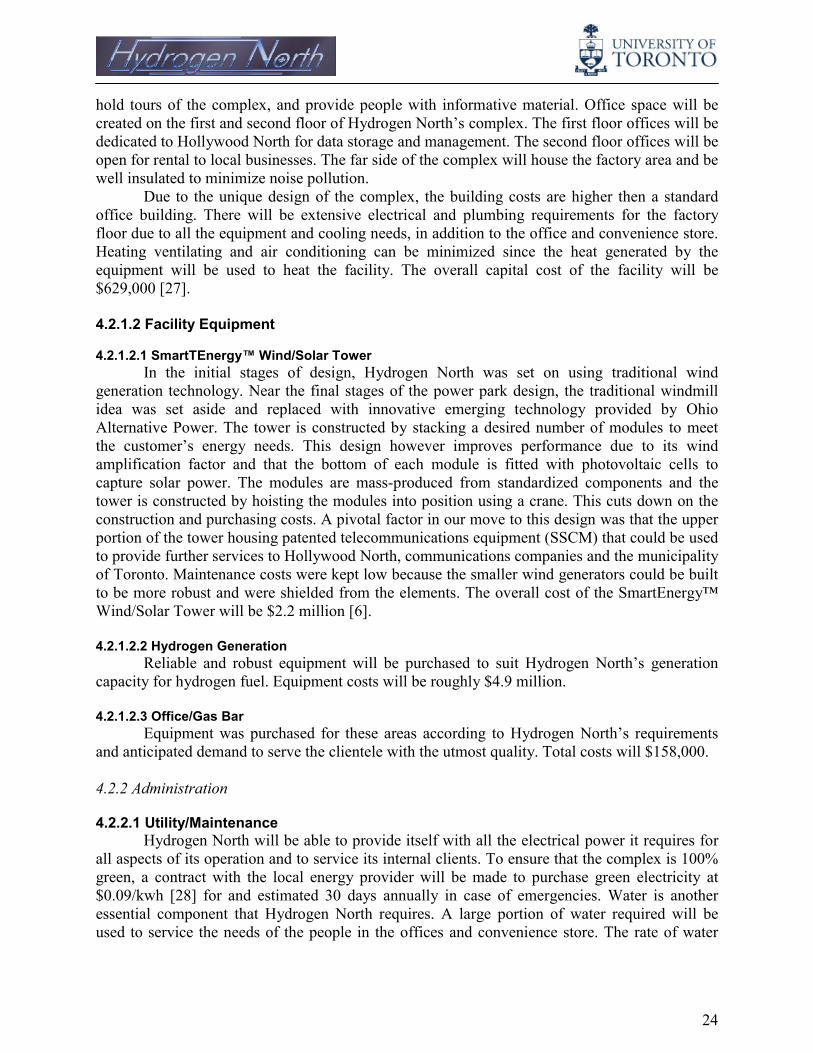
Table 2. H2 Generators Comparison TableThe fuel cell consists of a plurality of cells
stacked together in series. A cell contains 2 carbonelectrodes (anode and cathode) loaded with a platinum(Pt) catalyst (1-4 mg Pt/cm2) layer, a Nafion™ (PTFE-based) proton exchange membrane and currentcollectors that also serve to channel the fuel andproducts. Figure 14 shows a schematic of a PEM fuelcell. The cell is assembled layer by layer. Sealing eachlayer is important and Hydrogenics and Dow Corningdeveloped the Seal-in-Place (SIP) technology. Thisautomated technique uses low cost injected siliconerubber to seal each plate in 10 sec (100 cell stack in 15minutes). The Hydrogenics PEMFC has onboardstartup power supply (12 VDC), water management,DAQ interface, safety controls, H2 detectors andhumidifiers, air filter, and thermal management hardware.
1.5.4 Hydro-Pac Inc. C03-15-70/140LX & C06-40-70/140LX Compressors [8]These two-stage compressors were chosen because of their low price, simple and robust
design, variable inlet pressures, near isothermal compression and fast start-up under full load.The design ensures that the gas does not come into contact with the lubricants to maintain gaspurity. The specification sheet for these compressors is provided in Appendix A. Two differentunits are chosen to meet the requirements of the technical design, compression to 3,000 and6,000 psi at an input pressure of 145 psi.
1.5.5 Pressure Products Industries 6V Booster Compressor [9]PPI booster compressors were chosen because of their high flow rate, high output
pressure and variable input pressure. This is the only hydrogen compressor on the market thatsupports this flow rate in the pressure regime of 10,000 psi. These compressors account for 70%
Figure 14. PEMFC Cell

15
of PPI sales, which shows the level of reliability and quality of manufacture. The design providesleak tight and non-contaminating gas compression.
1.5.6 Dynetek Storage Tanks 3,000 & 6,000 PSI [10]Hydrogen is stored in stationary cylinders at 3,000 and 6,000 psi. Dynetek cylinders were
chosen because they are amongst the lightest storage tanks on the market, have the fastest fillingtimes, are environmentally resistant and can be assembled into a modular array. DyneCell™cylinders are made from an aluminum liner surrounded by a fiber composite.
1.5.7 FTI International 10,000 PSI Dispensers [11]The dispensers are one of the most important parts of the
station exposed to the elements. The choice was concentrated onan “all-in-one” package type dispenser, where the dispenserequipment was bundled with calibrated, temperaturecompensated flow meters and all necessary connections. Factorssuch as safety, availability, international standard compliance,reliability, and ability to work over a wide range of temperaturesalso influenced dispenser choice. FTI International has a proventrack record as a supplier to many companies both in the UnitedStates and Canada. The most attractive feature of the FTI dispensers was their abilityto dispense hydrogen at both the current standard of 5,000 psipressure and the future standard of 10,000 psi. This feature isalready included in the FTI dispensers that are operational atexisting hydrogen refueling station in Burnaby, BC. The new
standard for hydrogen-powered vehicles is expected to become industry wide sometime beforethe year 2010. Having the choice of output pressure will allow our station to dispense fuel to awide range of customers, increasing our potential income base. This could include direct fuelingof vehicles equipped with on-board storage rated at a variety of pressures. Alternatively, thedispenser could be used to fuel transportable bottles for use in off-road vehicles (e.g. scissortrucks, forklifts, boom cranes) widely used in the film industry and easily converted to run onhydrogen.
Lastly the dispensers’ operating temperature range is from –40°C to 65°C, which isimportant for our location at Toronto, where temperatures vary from –30°C in the winter to+35°C in the summer. This ensures that our choice of dispensers will allow the station to remainoperational year round, even under the most severe temperature spikes possible.
1.6 Station Safety ApprovalEfforts were made to obtain a formalized review of the safety of this design, at the time
of submission no formal approval has been received. The governing body for all safety standardsin the region is done through a private corporation called the Technical Services and StandardsAuthority (TSSA). This is the Canadian equivalent of a Fire Marshal. TSSA has approvedsimilar sites, such as the Hydrogenics Canadian National Exhibition Wind Turbine poweredrefueling station and the refueling station at the Stuart Energy headquarters in Mississauga (partof the Greater Toronto Area). TSSA was approached, but the cost and timeline were inconsistent
Figure 15. FTIInternational 10,000 psi

16
with the scope of this contest. We have also tried to obtain input from: local Fire Marshal, theProfessional Engineers of Ontario (PEO), Fiba Canning and the City of Toronto.
2.0 Safety Analysis
Designers of hydrogen processing facilities naturally place a huge emphasis on safety.Not only does the design of the power park need to be inherently technically safe, it also needs tomeet the public’s perception of safety. It is important for the power park to refrain from an overtindustrial appearance. It is Hydrogen North’s intent to inspire and endorse this technology byincorporating safe design principles as an integral part of the power park’s innovativearchitecture, while eliminating public inhibitions.
In the initial stages of this design relevant codes and standards were researched to serveas benchmarks. While a specific set of codes and regulations have not been developed for afacility such as this, currently available codes (IFC and NFPA 50) were closely followed in thedesign of the layout and safety systems.
2.1 Hazards and Operability StudyA hazards and operability study (HAZOP) was deemed essential to conceptually test the
safety of the design. HAZOP is a method of systematically identifying both hazards as well asoperability problems. A hazard is any operation or action that could result in injury to personnelor a catastrophic release of toxic or flammable chemicals, and an operability problem is anyoperation that would cause a shutdown that could possibly lead to violation of environmental,health and safety regulations or negatively impact profitability [12]. Briefly, in a HAZOP study,a team follows through the P&ID of the facility iteratively, each time applying a guideword suchas “NONE” to each flow line entering and leaving an equipment to systematically generatepossible deviations from normal operation. The team then thinks up possible causes,consequences of the deviations and ways to control them. The numbers used for risk assessmentare defined below in Table 3. Table 4 provides a portion of the HAZOP results.
OCC (probability of occurrence): 1 – The cause of deviation will never occur.10 – The cause of deviation will always occur.
DET (probability of detection): How often canwe detect the deviation and prevent it before ithappens.
1 – Always detectable and preventable. 10 – Never preventable.
SEV (Severity of consequences): How baddamage can the deviation cause if the system inplace fails.
1 – No damage done.10 – Total annihilation.
RPN (risk priority number): Indicates whatimportance should be given to hazard and isthe product of the previous three numbers.
1 – Least concern worthy. 1000 – Most concern worthy.
Table 3. HAZOP Risk Assessment Definitions

17
Table 4. Results of the Hazards and Operability Study
2.2 Top Priority Hazards and MitigationThe top priority hazards in descending order are:
1. Computer/control systems failure leading to the loss of all automatic control systems usedto keep the power park functioning normally.
2. A leak leading to hydrogen filling up the factory room or the dispenser area. 3. Physical attack on the cylinders due to accidental vehicular crash or terrorism.4. An electric spark caused by static charge build-up on personnel or by an ignition source.
To enhance control system reliability a Master/Slave Speculative Parallelization (MSSP) will beset as a requirement. In MSSP, one processor –the master – executes an approximate version ofthe program to compute selected values that the full program's execution is expected to computeand then the slave uses these values to validate the input predictions of the next task, inductivelyvalidating the entire execution. The control system would be annually subjected to a series ofcontrolled test-case worst scenarios to validate the system response. Regular maintenance for theprocess control and safety equipment, such as the control valves, relief valves, and pressure reliefplates would be performed. The control system will be connected to the UPS within the facilityto safely shutdown operation in case of a blackout. An expert system will supplement the controlsystem in order to provide the facility operator advice on complicated problems. This is aknowledge base collected from experts in the field accessible to the operator. Manual overridewill be provided in the event of a major software malfunction.

18
2.3 Major Safety Features and Systems
2.3.1 Station Layout All major electrical and hydrogen production equipment will be housed indoors to avoid
weather-related problems. In contrast to the common approach of completely isolating all thepotentially hazardous equipment, the station will be laid out in a single continuous butcompartmentalized building that achieves both aesthetics and safety. The main principle of thisdesign is to monitor the process flow using appropriate sensor technologies in conjunction withan automated control system and human supervision.
2.3.2 Emergency Venting System Two major areas of concern are the factory floor and dispensing area. In the factory area,
the worst-case scenario would be if hydrogen leaks and starts to accumulate unnoticed. Takingadvantage of hydrogen’s buoyant nature, the slope of the roof channels the hydrogen to one sideof the building. On this side hydrogen sensors suspended from the rooftop profile will detect acritical hydrogen concentration, opening a bank of louvers. This will be complemented withheavy-duty blowers to totally flush out all hydrogen within seconds. The dispensing areaincludes an overhang portion of the facility to shelter personnel while fueling. In order to preventhydrogen accumulation below the overhang, this area is also equipped with integral ventilationshafts akin to light pipes to vertically channel hydrogen by natural convection.
2.3.3 Storage LocationThe station layout minimizes any possible physical damage arising from malicious attack
or accidental collision. To decrease the possibility of having a major devastating explosion, amodular storage approach was adopted and separated into two pressure-specific sections. The3,000 psi section lies in the middle of the ground level, protected by a poured steel-reinforcedconcrete wall and buffered by equipment on the opposing side. The more critical 6,000 psi tanksare elevated on steel racks to protect against a through-wall vehicular intrusion.
2.3.4 SmartEnergy™ Wind/SolarTower The SmartEnergy™ Tower contains two main built-in safety features. An apex lightning
arrestor provides a cone of protection against lightning strikes. The second major intrinsic safetyfeature prevents heavy ice build-up. In the event of a major ice storm, such as the one that hitOntario and Quebec in 1998, ice build-up due to freezing rain could lead to spallation of icesheets. The SmartEnergy™ Tower solves this with its ice resistant compound coating andpassive/active internal heating.

19
3.0 Environmental Analysis
3.1 IntroductionThe planned hydrogen power park will not only be a sound investment in energy efficient
technologies and practices in tandem with the Canadian National Implementation Strategy onClimate Change, but will also make significant contributions to the environment in Ontario. Thiswill be accomplished primarily by reducing greenhouse gas emissions in electricity generation,fossil fuel production, distribution, and transportation sectors that produce the majority ofCanadian greenhouse gas (GHG) emissions.
From the use of a wind tower to facilitate the production of hydrogen via the electrolysisof water, to the provision of pure hydrogen to power zero-emission fuel cell vehicles, everyeffort has been made to cost-effectively maximize the self-sufficiency and efficiency of ourhydrogen power park while minimizing environmental impacts from the plant’s construction anduse both on-site and off-site.
By comparing carbon dioxide (CO2) emissions from hydrogen and electricity productionat the power park, as well as carbon dioxide emissions from the park’s energy consumption withrespect to traditional fossil fuel based initiatives, it will be shown that hydrogen is a viable andenvironmentally superior energy provider. To further illustrate the benefits of developing ahydrogen economy a comparison of carbon dioxide emissions between fuel cell vehicles andgasoline driven internal combustion engines (ICE) will be provided.
3.2 Hydrogen Production Methods
Emissions from Different Methods of Hydrogen Production
010203040
Natural Gas -Steam
MethaneReforming
Coal - CoalGasification
Wind/Solar/NuclearEnergy -
Electrolysis
Switchgrass -Biomass
Gasification
Gasoline -Electrolysis
Power Source
Life
cycl
e C
O2 G
ener
atio
n (k
g C
/GJ)
Figure 16. Adapted from Economics and Environmental Effects of Hydrogen Production Methods [13]
Producing hydrogen from electrolysis using renewable energy sources is the mostenvironmentally friendly method of hydrogen (H2) production. The above chart shows thecarbon dioxide emissions given off in order to produce hydrogen by various methods but doesnot include carbon released during the manufacture of equipment used to produce hydrogen.
To generate electricity, a proton exchange membrane fuel cell (PEM) is used. Therewere many fuel cell choices available; the decision to go with a PEM was based on the need for a

20
medium fuel cell capacity (generating 1-500kW) [14], cost and the desire to use pure hydrogenas the fuel source eliminating greenhouse gas emissions. Pure hydrogen is used as fuel wherewater, heat and electricity are the only by-products of the electrochemical reaction. If fossil fuelcombustion were used, carbon dioxide, nitrogen oxides, sulfur oxides and particulate matterswould have been generated.
3.3 Emissions Savings from Electricity ConsumptionThe power park will generate a maximum of 330 kg of hydrogen per day. Of that 330 kg,
250 kg will be stored and used to fuel hydrogen-powered cars. 80 kg can be used to produceelectricity for Hollywood North. The daily power consumption of the power park will beapproximately 800 kW. This amount equates to an estimated annual consumption of 7,008MWh. Although the wind tower is expected to meet energy demands of the power park, onoccasions where the tower is unable to meet demand, we will take emissions-free Green Powerfrom Ontario Power Generation (OPG). Emissions savings using these two energy sources areillustrated by showing emissions values from normal electricity production in Ontario for theequivalent amount of energy consumed.
EmissionFactor
(kg/MWh)Emissions
(kg)
GlobalWarmingPotential
(kg)NOx 1.07 7498.56 2324554CO2 1.8862 13218.49 13218.49
EMIS
SIO
NS
SAVE
DFR
OM
EN
ERG
YC
ON
SUM
PTIO
N
CH4 0.0105 73.584 1545.264Table 5. Emission Factors taken from OPG [15]
and GREET 1.5 program [16]
Apart from CO2 several other gases are released from traditional power plant electricitygeneration. Both NOx and CH4 have global warming potentials of 310 and 21 respectively [17].In other words every kg of NOx has the same greenhouse impact as 310 kg of CO2. The totalgreenhouse gas CO2 equivalent for NOx, CO2, and CH4 is 2,339 tonnes.
3.4 Electricity Production for Hollywood NorthHollywood North will be obtaining approximately 100 kWh for 12 hours each day for
365 days each year from our power park. This amounts to 438 MWh annually. Using similarcalculations as before, annual emissions savings would be:
EmissionFactor
(kg/MWh)Emissions
(kg)
GlobalWarmingPotential
(kg)NOx 1.07 468.66 145284.6CO2 1.8862 826.1556 826.1556
EMIS
SIO
NS
SAVE
DFR
OM
EN
ERG
YPR
OD
UC
TIO
N F
OR
HO
LLYW
OO
DN
OR
TH
CH4 0.0105 4.599 96.579Table 6. Emission Factors taken from OPG[15]
and GREET 1.5 program [16]

The total greenhouse gas CO2 equivalent in this case for NOx, CO2, and CH4 is 146tonnes. Since electricity produced at the station is generated from pure hydrogen using a PEMfuel cell we produce no emissions of the aforementioned gases. We are not currently expected toproduce electricity for the local grid, however possible future efforts to supply power to the localgrid would also be emissions free.
3.5 Well to Wheel AnalysisHydrogen North will be servicing Purolator courier fleet vehicles, therefore figures used
in this section will be taken from those calculated in Transport Canada’s 2001 report: CanadianCourier Market Size Structure and Fleet Analysis Study [18]. Those figures are:
� Vehicle Fuel Efficiencyo Gasoline-driven courier ICE vehicle: 5.2km/L gasoline
� Vehicle Travel Distance per Vehicle� Courier vehicles travel an average distance of 51317km per year
The power park will produce 250 kg of H2 per day for fuel dispensing purposes, whichwill easily meet the daily demand of 50 fuel cell powered vehicles. To fully service the samenumber of gasoline driven ICE courier fleet vehicles an equivalent of 493 m3 of gasoline per yearwould be required. This amount of gasoline converts to a value of 4,319 MWh based on anenergy density of 8.76 kWh/L [19].
The following graph shows total emissions saved from the well to tank stage and the tankto wheel stage for the vehicle fleet which equates to 1.615x10⁷ tonnes and 3.8x10³ tonnesrespectively.
Emissions values forselected GHG gases
(g)
Emissions values forselected GHG gases
(g)CO2 NOx CH4 CO2 NOx CH4
Total Green HouseGas Emissions
(g/kWh)2E+06 6083.6 2574.3
Total Green HouseGas Emissions
(g/kWh)281.16 1.9296 0.554
Total Green HouseGas Emissions (g) 8E+12 3E+10 1E+10 Total Green House
Gas Emissions (g) 1.2E+09 8E+06 2E+06
WEL
L TO
TA
NK
AN
ALY
SIS
[20]
Total EquivalentCO2 emissions (g) 8E+12 8E+12 2E+11 TA
NK
TO
WH
EEL
AN
ALY
SIS
[21]
Total Equivalent CO2emissions (g) 1.2E+09 3E+09 5E+07
3.6 EnvironmentaAlthough th
turbine, Toronto Hproject concluded consultant (Dillon
Table 7. Weel to Tank and Tank to Wheel Analysis
21
l Impacts from Wind/Solar Towerere has been some concern with the environmental impacts of using a windydro Energy Services who have implemented a noteworthy wind turbinein their Wind Turbine Environmental Assessment prepared by an externalConsulting Limited) [22], that there is no significant environmental effects

22
from wind turbines from constructing, operating or decommissioning. Vegetation may beuprooted but will re-vegetate quickly and bird mortality rates are low (less than one bird a year).Likewise, we do not foresee any environmental impacts from our wind tower.
3.7 ConclusionThe hydrogen power park emits no GHG emissions through any of its operations. As
shown by the well to wheel analysis, the savings from using hydrogen powered fuel cell cars canbe tremendous. Expected annual GHG emissions (CO2e) saved from:
� Annual Park Operations is 2,339 tonnes � Energy production for Hollywood North is 146 tonnes� Use of H2 powered cars is 1.615 x 10⁷ tonnes
Considering that an average mature tree will sequester approximately 5 kg of CO2 peryear [23], the CO2e savings made by the use of only 50 H2 powered cars that are supplied byHydrogen North in one year alone would be equivalent to the work of 3.23x10⁹ old growth trees.Taking into account Canadian GHG emissions are up by more than 13.5% since 1990, despitegovernment commitments to the Kyoto Protocol and Canada is 27th out of 29 OECD nationswhen greenhouse gas emissions are measured on a per capita basis– 16.84 tonnes of CO2 perperson per year; 48% above the OECD average of 11.41 tonnes and more than four times theglobal average [24], decreasing our reliance on fossil fuels is necessary to reverse thesedepressing trends.
Hydrogen North’s proposal can benefit Ontario greatly by reducing GHG emissions thatcontribute to climate change. Although GHG emissions have been the focus of this analysis,there are several other harmful effects from fossil fuel production and use such as acid rain,smog and respiratory illnesses. Climate change remains Canada’s most pressing environmentalconcern and the development of alternative energy currencies such as hydrogen will be critical topreserving the environment and ensuring a high quality of life for present and future generations.

23
4.0 Economics
4.1 OverviewWith the increase in focus of environmental issues, governments and people are pushing
for changes in industry through the implementation of new regulations and policies, such as theKyoto agreement. Successful companies will have to adapt to these changes by developinginnovative and cutting edge strategies to better serve their customers, while protecting theircommunities and surrounding environment.
To see this one needs to look no further then Purolator, one of North America’s largestmail service provider. At their Toronto distribution center Purolator is currently in the test phaseof retrofitting some of their delivery trucks to hydrogen power. To effectively complete thisproject they will need to setup, maintain and control the generation, storage and dispensing ofhydrogen.
Hydrogen North was created to service companies embarking on such overwhelmingtransformations. Realizing that Purolator does not have the expertise in maintaining hydrogenfueling facilities, Hydrogen North will use the latest technology as a competitive advantage tocreate a sustainable power park and provide hydrogen to Purolator’s retrofitted fleet at areasonable price. At the same time, recognizing that the movie industry is booming in Torontowith the opening of Hollywood North, along with the escalating cost of major film productionsand tight time schedules, the demand for electricity (namely UPS) will increase. Hydrogen Northwill provide Hollywood North with a multitude of services to fulfill their needs.
4.2 Expenses
4.2.1 Operating ExpensesHydrogen North has tried to keep its operating expenses as low as possible. The expenses
were divided into 2 sections: Location of facility and Facility Equipment. Detailed informationof the components in these sections is in the Expenses Table found in Appendix C.
4.2.1.1 Location of FacilityMany different technical and economical factors were taken into consideration to choose
an appropriate location so that Hydrogen North is strategically placed to maximize its potential.The lakeshore was chosen for a few reasons, firstly the geographical location to a large body ofwater guarantees that our facility will have continuous access to wind; secondly, this plot of landis zoned for industry by the Toronto Municipality and has enough space require for our facility;and lastly, being located so close to the core of downtown Toronto we have close proximity toour customer base. For this reason Hydrogen North will be able to secure a 21,000 ft2 plot ofland for $252,000 [26].
Hydrogen North’s facility incorporates many unique aspects in both the technical andarchitectural design. With the tower protruding from the center of the complex, it gives thefacility a futuristic look, with the glass structure complementing it further and making it visuallyappealing and inviting to both consumers and onlookers. The building is a multipurpose facilitycomprised of different sections; a fueling bar, educational center, office space and a factoryfloor. The fueling section has been positioned in such a way so that it maximizes user-friendliness of the dispensers and storefront by having easy access to the adjacent road. Toenhance the awareness of this emerging industry we have included an educational center that will
24
hold tours of the complex, and provide people with informative material. Office space will becreated on the first and second floor of Hydrogen North’s complex. The first floor offices will bededicated to Hollywood North for data storage and management. The second floor offices will beopen for rental to local businesses. The far side of the complex will house the factory area and bewell insulated to minimize noise pollution.
Due to the unique design of the complex, the building costs are higher then a standardoffice building. There will be extensive electrical and plumbing requirements for the factoryfloor due to all the equipment and cooling needs, in addition to the office and convenience store.Heating ventilating and air conditioning can be minimized since the heat generated by theequipment will be used to heat the facility. The overall capital cost of the facility will be$629,000 [27].
4.2.1.2 Facility Equipment
4.2.1.2.1 SmartTEnergy™ Wind/Solar TowerIn the initial stages of design, Hydrogen North was set on using traditional wind
generation technology. Near the final stages of the power park design, the traditional windmillidea was set aside and replaced with innovative emerging technology provided by OhioAlternative Power. The tower is constructed by stacking a desired number of modules to meetthe customer’s energy needs. This design however improves performance due to its windamplification factor and that the bottom of each module is fitted with photovoltaic cells tocapture solar power. The modules are mass-produced from standardized components and thetower is constructed by hoisting the modules into position using a crane. This cuts down on theconstruction and purchasing costs. A pivotal factor in our move to this design was that the upperportion of the tower housing patented telecommunications equipment (SSCM) that could be usedto provide further services to Hollywood North, communications companies and the municipalityof Toronto. Maintenance costs were kept low because the smaller wind generators could be builtto be more robust and were shielded from the elements. The overall cost of the SmartEnergy™Wind/Solar Tower will be $2.2 million [6].
4.2.1.2.2 Hydrogen GenerationReliable and robust equipment will be purchased to suit Hydrogen North’s generation
capacity for hydrogen fuel. Equipment costs will be roughly $4.9 million.
4.2.1.2.3 Office/Gas BarEquipment was purchased for these areas according to Hydrogen North’s requirements
and anticipated demand to serve the clientele with the utmost quality. Total costs will $158,000.
4.2.2 Administration
4.2.2.1 Utility/MaintenanceHydrogen North will be able to provide itself with all the electrical power it requires for
all aspects of its operation and to service its internal clients. To ensure that the complex is 100%green, a contract with the local energy provider will be made to purchase green electricity at$0.09/kwh [28] for and estimated 30 days annually in case of emergencies. Water is anotheressential component that Hydrogen North requires. A large portion of water required will beused to service the needs of the people in the offices and convenience store. The rate of water

25
and wastewater services is $1.27/m3 [29]. Total utility costs will be $8,536/month. Maintenancecosts were estimated to be $4200 per month for equipment and parts to provide the complex withminor in house repairs and equipment upkeep. A detail break up of these costs can be found inthe Expenses Table in the Appendix.
4.2.2.2 Salaries and AdministrationSince Hydrogen North utilizes advanced technology to automate many of its functions, a
large staff is not required. For the entire facility to run a staff complement of 10 will be needed; 7full-time and 3 are part-time.
The division of labour for the 7 full-time employees will be: 1) Plant manager, overseesthe business operations of Hydrogen North, 2) Shop Supervisor, directs the technicians formaintenance and handles major repairs of the facility, 3) 2 Technicians, perform minor repairsand facility maintenance, 4) Front Desk clerk, handles customers concerns by directing them tothe appropriate personnel, and 5) 2 Store Clerks, operate the gas bar. The 3 part-time employeeswill be: 1) 2 Store Clerk, operate gas bar, 2) 1 tour guide, runs the educational center. Totalsalary costs for Hydrogen North will be $291,184 per annum [30].
Other administrative costs will be directed to advertisement of our facility in variousforms to enhance the public awareness of the facility and its operations, through the use ofbillboards, newspapers and flyers. The estimated cost for this wide range if advertising is $3,620per month. Full details of these costs are given in the Expense Table in the Appendix.
4.3 Revenue StreamsHydrogen North provides a wide variety of
products/services to meet the various demands of itscustomer base. These multiple products/services areoffered in order to mitigate the risk of any of singleventure falling short of expectations. These ventureswere classified into 3 sections: building, servicesand telecommunications. Refer to the RevenueStream table in the Appendix C for exact details.
4.3.1 BuildingThe building section is comprised of the
revenue collected from the office space rental and the sales of the convenience store. With thecomplex opening in 2010 business in the area will have grown to accommodate HollywoodNorth and other businesses.
Hollywood North will rent the first floor offices as a telecommunications hub for theirbusiness. This will include the safe storage, transfer and management of data (HollyWire™), runon reliable UPS generated on site at a $15/ft2 rate. The second floor will be available to lease forregular office space at a rate of $11-$12/ft2. The convenience store is estimated to have $6000worth of sales monthly. This will provide total revenue of $496,392.
4.3.2 ServicesHydrogen North will provide unique services to Purolator and Hollywood North to
compliment their businesses.Hydrogen North will secure a contract to exclusively provide Purolator with its hydrogen
fuel needs in the Toronto area. 250kg of hydrogen fuel will be generated and dispensed daily to
Annual Revenue for Hydrogen North
Offices27%
Convenience Store5%
Hydrogen Revenues28%
Telecommunication35%
Other5%
Figure 17. Station Annual

26
Figure 18. 10 Year Projected Earnings
Hydrogen North's 10 year Projected Earnings
$0
$100
$200
$300
$400
$500
$600
$700
$800
$900
$1,000
2010 2011 2012 2013 2014 2015 2016 2017 2018 2019 2020
Thou
sand
s
Project Year
Net
Ear
ning
s
-$2
-$1
$0
$1
$2
$3
$4
$5
Mill
ions
Cum
ulat
ive
Earn
ings
Net EarningsCumulative Earnings
Purolator’s retrofitted fleet at the station at a time averaged price of $5/kg H2. Taking the lowestearning fiscal year, and determining the break-even point determined the price of hydrogen. Thisservice will generate an annual revenue stream of $450,000.
With the patented SSCM technology embedded in the SmartEnergy� Wind/Solar Tower,Hydrogen North will be able to provide a reliable, secure high speed Internet access toHollywood North for global distribution of data, image processing, CGI, and video production,along with 100kW of UPS to their offices. To make the sales of Hydrogen North’s UPScompetitive, the price was set at $0.13/kWh. This includes administration fees, but a one-timesetup fee of $1000 for customer accounts will also be added. Internet rates were determined frominformation provided to us by Ohio Alternative Power, and cannot be disclosed at their request.$82,680 of revenue will be generated from these services.
4.3.3 TelecommunicationsHydrogen North will receive its major source of revenue through the use of Ohio
Alternative Power’s patented SSCM equipment. The equipment installed into the upper dome ofthe Wind/Solar Tower has the capacity to handle 3 different clients. The first client will beHollywood North, which will be provided with a secure internal communications system,Unlicensed Carrier Tenant. The second client will be one of the local telephone companies,which can use Hydrogen North’s tower to expand service on their grid, FCC Wireless CarrierTenant. The final client will be the City of Toronto’s emergency services, providing them thefixed and mobile communication equipment, Homeland Security Fixed and Mobile MetropolitanArea Network. The details of the exact makeup for pricing cannot be disclosed at OhioAlternative Power’s request. Overall annual revenue from telecommunications services will be$555,900.
4.4 IncomeTo truly make renewable energy a viable resource in the future, it must be economically
feasible. Hydrogen North made a major commitment to becoming profitable in a short period oftime. By diversifying the products and services that Hydrogen North offers this has made theproject a financially lucrative venture over the projected 10 years. To determine how HydrogenNorth performs economically the estimated costs and revenues were summed to get the earningbefore taxes (EBT). Appropriate taxes, 12% provincial and 21% federal [31], were then deductedfrom the EBT to calculate the net earnings. Year-end surplus was calculated for Hydrogen Northby summing the year-start surplus(deficit) and net earnings. Both thesevalues were calculated for theprojected 10 years of the project atpresent value. Figure 18 to the rightshows the net earnings andcumulative earnings of HydrogenNorth. It can be noted that HydrogenNorth with have a positive netearnings for every year, and only thefirst year will produce a year-enddeficit. Exact details of the incomesheet can be found in Appendix C.

27
5.0 MarketingIn order to encourage public acceptance, Hydrogen North will put into place a marketing
strategy that maximizes potential consumer expectations. This implementation will take intoaccount the “Four P’s of Marketing”: place, price, product and promotion [25].
5.1 PlacePreviously, it was determined that the ideal location for Hydrogen North would be in
close proximity to Lake Ontario, in south-eastern Toronto. This spot lends itself to the advantagesince many Torontonians live or commute through this area in accessing facilities on thelakeshore. Additionally, the area has several businesses that include Purolator, Canada Post andthe soon to be built Hollywood North.
The fact that urban wind turbines are still somewhat unusual will incline people to seekout what is being built actively during construction, resulting in an automatic increase in publicawareness. In order to hope for a reasonable amount of continuous awareness, the issue of placeneeds to work closely with promotion. Once the construction is complete, the finished 160 metertall turbine, clearly visible from Lakeshore Blvd. (a major thoroughfare in Toronto) will attractconsumers from a radius of several kilometers. One reason for this attraction is the unique designwhich is a bit different from what one’s initial perception of a traditional windmill. By placing aninteractive educational centre and a hydrogen-powered vehicle refueling station at the site of theturbine, Hydrogen North can capitalize on the visibility and accessibility of the lakeshorelocation
5.2 PriceThe second facet of Hydrogen North’s marketing strategy is to consider the price point of
hydrogen in the market. Potential resistance will be reduced and support will be built through theimplementation of the right pricing strategy [25]. The pricing of both the hydrogen fuel and theelectricity will be using current market rates. This will keep the cost of operating hydrogen-powered vehicles comparable to that of operating equivalent gasoline powered vehicles whilesimultaneously ensuring a sustained level of profitability. Under this schedule, the price ofhydrogen will be $5.00 per kg, and the price of UPS supplied electricity will be $0.13 per kWh.
The products offered at the Hydrogen North fuel station will include many traditional gasstation items including maps, snack food, and car accessories. These items’ prices will becomparable to those of the same items at other gas stations in the area. By implementing amarket pricing strategy for these goods, Hydrogen North can capitalize on the fact that potentialconsumers will see a similarity between Hydrogen North’s fuelling station and conventional gasstations. In addition, the gift shop on site will provide many novel products with both aneducational and entertainment appeal related to the sustainable technologies demonstrated on-site.
5.3 ProductAs was mentioned in the pricing section, Hydrogen North has a wide variety of products,
allowing for a safe level of diversification. With each of these products there is a correspondingmatching customer. These customers can be broken down into three different segments:Purolator, the City of Toronto and Hollywood North.

28
Hydrogen North has signed an exclusive agreement to be the sole provider of hydrogenfuel the entire fleet of Purolator delivery trucks. By signing an agreement with Purolator,Hydrogen North is able to guarantee an early steady stream of income based on the fuelinginfrastructure provided. If Hydrogen North wishes to expand capacity, the capability to providefuel service to other local customers with a similar demand profile (e.g., Canada Post, Loblaws)will be taken into account with the creation of more refilling stations adding value to thebranding of the stations.
The wind turbine Hydrogen North chose has a telecommunications tower attached. Onecustomer that would find this to be beneficial would be the City of Toronto. Thetelecommunications tower capabilities would be a central hub where police, fire and medicalpersonnel where information could be relayed back and forth amongst these service sectors.
While Purolator and the City of Toronto only benefit from one of the products offered atHydrogen North, Hollywood North will be a user of many of the ancillary products. The secondfloor of Hydrogen North’s building will be available entirely to Hollywood North by way ofoffice space. Besides the office space, Hydrogen North also will provide Internet service toHollywood North. This service will allow for Hollywood North to have access to a secure linewith convenience of being close to the provider. The third product that Hydrogen North willprovide to Hollywood North is unlimited power supply (UPS). The benefit being that HollywoodNorth needs a constant supply of power and possibly bottled hydrogen dispensed to service filmindustry related vehicles and Hydrogen North is able to produce and dispense hydrogen for them.
5.4 PromotionPromotion will go a long way in convincing people to make the switch to hydrogen
energy. That is why an aggressive promotion strategy will be implemented from the onset.Hydrogen North will target potential patrons early and often in order to guarantee a large, lastingconsumer base.
Even before the groundbreaking, Hydrogen North will make its name publicly known invarious media, including billboards, flyers and newspaper advertisements. When this name-recognition stage is complete, people will know what Hydrogen North is, what it stands for, andwhat products it offers. Upon completion of the initial name-recognition stage an educationalstage will commence, in which Hydrogen North will encourage public awareness of sustainableenergy solutions and of hydrogen as a clean energy-storage medium. This will be done through aseries of public service announcements, through the educational centre, through high-schooloutreach programs, and through tours of the production facility. The educational centre will offera series of weekly tours and themed expositions. Hydrogen North will seek well-establishedcorporations to act as tiered sponsors for such expositions. The sponsoring companies benefit bybeing seen as a socially responsible “green” company and Hydrogen North provides the venuefor hosting the events. This will help to alleviate any reservations towards the new technologythat might exist in the marketplace.
Once this stage is complete, Hydrogen North will reach a more mature stage ofadvertising with the establishment of proactive community outreach efforts supported byHydrogen North. As a responsible corporate member of Toronto’s society, Hydrogen North willdo its part to co-sponsor events (such as the Toronto Film Festival) and to aid in communitycauses (including United Way campaign). An easily recognizable brand name and corporate logo(see attached ad), will go a long way in ensuring the success of Hydrogen North as both abusiness venture, and as a force to revolutionize energy production and storage.

29

30

31
6.0 References
1. Ontario. Ontario Energy Board, Ontario Ministry of Energy. Ontario Energy Statistics —2002. Sept. 30th, 2004. <http://www.oeb.gov.on.ca/html/en/abouttheoeb/statsandmaps.htm>.
2. Canada. Statistics Canada. Energy supply and demand. Oct. 8th, 2004.<http://www.statcan.ca/english/Pgdb/prim71.htm>.
3. Ontario. Ontario Ministry of Energy. Report on the August 14, 2003 Outage. Aug. 26th,2003. <http://www.energy.gov.on.ca/index.cfm?fuseaction=electricity.reports_outage>.
4. Rifkin, Jeremy. The Hydrogen Economy. New York, Penguin Group, 2002.
5. Canada. Environment Canada. Canadian Wind Energy Atlas. 10 January 2004.<http://windatlas.ca/en/nav.php?no=24&field=EU&height=80>.
6. Robert, Gerity. President, Ohio Alternative Power LLC. Private Communication. Jan. 9, 2005.
7. Ayman Monged, Business Technical Manager-Hydrogen, Hydrogenics Corporation. PrivateCommunication. Nov. 19, 2004.
8. Thomas J. Connelly, Technical Sales Engineer, Hydro-Pac Inc. Nov. 28, 2004.
9. Sales Representative, PPI Industries, http://www.gotoppi.com, Nov. 2004.
10. Sales Representative, Dynetek, <http://www.dynetek.com>, Nov. 2004.
11. Craig Webster, Director of Gas Systems Engineering, Powertech Labs Inc. PersonalCommunication. Nov. 22, 2004.
12. Acusafe, Jan. 2, 2005, <http://www.acusafe.com/Hazard_Analysis/HAZOP_Technique.pdf>
13. Brinkman, Greg. Economics and Effects of Hydrogen Production Methods. RetrievedJanuary 5, 2005 <http://www.puaf.umd.edu/faculty/papers/fetter/students/Brinkman.pdf>
14. Fuel Cells for Transport. Retrieved January 5, 2005 <http://www.supertech.bme.hu/hibrid/Budpest-Fuelcell.pdf>
15. Ontario Power Generation. Environment and Community, Greenhouse Gases. RetrievedJanuary 5, 2005. <http://www.opg.com/envComm/E_emissions_gas.asp>
16. Argonne National Laboratory. GREET Model version 1.5a. Retrieved January 5, 2005.<http://greet.anl.gov/download.html>
17. Hieb, M. Global Warming: A closer look at the numbers. Retrieved January 5, 2005.<http://www.clearlight.com/~mhieb/WVFossils/greenhouse_data.html>

32
18. Transport Canada. Canadian Courier Market Size Structure and Fleet Analysis Study.Retrieved January 5, 2005. <http://www.tc.gc.ca/pol/EN/Report/Courier2001/Final.PDF>
19. Advantages and Disadvantages of Hydrogen. Retrieved January 5, 2005.<http://www.hydrogen.org/Knowledge/w-i-energiew-eng2.html>
20. Argonne National Laboratory. GREET Model version 1.5a. Retrieved January 5, 2005.<http://greet.anl.gov/download.html>
21. SACE (Special Advisory Committee on the Environment). 1991. The Changing Atmosphere:Strategies for reducing CO2 emissions. Technical Volume. City of Toronto SACE, Toronto.
22. Dillon Consulting Limited. Wind Turbine Environmental Assessment Draft ScreeningDocument. Retrieved January 5, 2005.
23. Environment Canada. Envirozine, Environment Canada’s Online Newsmagazine, AnyQuestions?. Retrieved January 5, 2005. < http://www.ec.gc.ca/envirozine/english/issues/02/any_questions_e.cfm>
24. Boyd, David. Canada vs. The OECD: An Environmental Comparison. Retrieved January 5,2005. <http://www.environmentalindicators.com/htdocs/indicators/5gree.htm>
25. Berkowitz, Eric, et. al. Marketing: 4th Edition Page 13. McGraw-Hill Ryerson Limited, Toronto, 2001.
26. Land Cost Estimates, http://www.2ontario.com/orea/home.asp
27. Construction Cost Estimates, http://www.rsmeans.com
28. Electricity Rates, http://www.electricitychoices.org/greenpower.html
29. Water Rates, www.toronto.ca/water_bill/water_rates.htm
30. Employee Wages Estimates, http://www.monster.ca
31. Tax Rates, http://www.fin.gc.ca/

33
Appendix A - Major Station Components Data Tables
Ohio Alternative Power 1.6 MW SmartEnergy™ Wind/Solar Tower
Quantity Modules Height (m) Average Wind Speed (m/s)
Power Output(MW) Total Cost
1 50 160 ~6 1 $2,300,000
Hydrogenics
Unit QuantityPower/Unit
(kW)Hydrogen Consumption
(kgH2/hr) Cost/UnitTotal CostHyPM™ 65 2 65 3.33 $260,000 $520,000
Unit Quantity
Total H2 Prod Rate
(kg H2/hr)Power Consumption
(kWh/kg) Cost/UnitTotal CostHyLYZER™ 65 7 17.5 50.44 $44,444 $311,108
Hydro-Pac Inc. Compressors
Unit Quantity Input P (PSI)
Output P
(PSI)Flowrate(kg H2/hr)
Power Consumption (kWh/kg) Cost/UnitTotal Cost
C06-40-70/140LX (LX-6) 5 145 6,000 3.8 4.75 $57,200 $286,000
UnitQuantity
Input P
(PSI)
Output P
(PSI)Flowrate(kg H2/hr)
Power Consumption (kWh/kg) Cost/UnitTotal Cost
C03-15-70/140LX (LX-1) 3 145 3,000 3.0 3.5 $37,300 $111,900
Pressure Products Industries Booster Compressor
Unit Quantity Input P (PSI)
Output P (PSI)
Flowrate/unit(kg H2/hr)
Power Consumption (kWh/kg) Cost/Unit Total Cost
6V 3 6,000 10,000 12.5 0.5 $202,500 $607,500
Dynetek Storage Tanks
Unit QuantityStorage/Unit
kg H2
Total Capacity
(kg H2) Unit CostTotal CostW320 3,000PSI 50 3.3 170 $1,500 $57,000W303 6,000PSI 66 8.64 570 $3,000 $198,000
FTI InternationalUnit QuantityFlowrate/unitCost/UnitTotal Cost
10,000PSI Dispenser 2 30 kgH2/hr $55,000 $110,000
Priority Panel 4 N/A $10,000 $40,000

Appendix B - Station Blueprint and Flow Sheets
Figu pper Floor)
re 19. Hydrogen North Blueprint (Lower and U34

35
Appendix C - EconomicsFigure 20. Hydrogen North Electrical and Hydrogen Flow Diagram
Table 8. Hydrogen North’s Expense Sheet

36
Table 9. Hydrogen North’s Revenue Streams
Table 10. Hydrogen North’s Income Statement