University of Texas / Texas Tribune Texas Statewide Survey
27
UT-Austin/Texas Tribune – Texas Statewide Survey, November 2015 Page 1 of 27 University of Texas / Texas Tribune Texas Statewide Survey Field Dates: October 30 to November 8, 2015 N=1200 Adults Margin of error: +/- 2.83% (3.28% adjusted for weighting) unless otherwise noted * Interest and Engagement Q1. Are you registered to vote in the state of Texas? 1. Yes, registered 100% Q2. Generally speaking, would you say that you are extremely interested in politics and public affairs, somewhat interested, not very interested, or not at all interested? 1. Extremely interested 47% 2. Somewhat interested 41 3. Not very interested 8 4. Not at all interested 3 5. Don’t know 1 Q3. There are many elections in the state of Texas. Furthermore, many people intend to vote in a given election, but sometimes personal and professional circumstances keep them from the polls. Thinking back over the past two or three years, would you say that you voted in all elections, almost all, about half, one or two, or none at all? 1. Every election 36% 2. Almost every election 33 3. About half 12 4. One or two 10 5. None 8 6. Don’t know 1 * In calculating the margin of error (MOE) for the survey, we provide two calculations, one that compensates for the relative standard deviation of the weights and one that does not. Without taking the variance of the weights into account, the margin of error for the full sample is 2.83%. To compensate for the additional uncertainty from weighting, we apply a multiplier derived from the coefficient of variation of the weights: sqrt(1+CV^2), where CV=sd(weights)/mean(weights). For this weight sensitive calculation, the MOE for the full sample is 3.28%.
Transcript of University of Texas / Texas Tribune Texas Statewide Survey
UT-Austin/Texas Tribune – Texas Statewide Survey, November 2015 Page 1 of 27
University of Texas / Texas Tribune Texas Statewide Survey
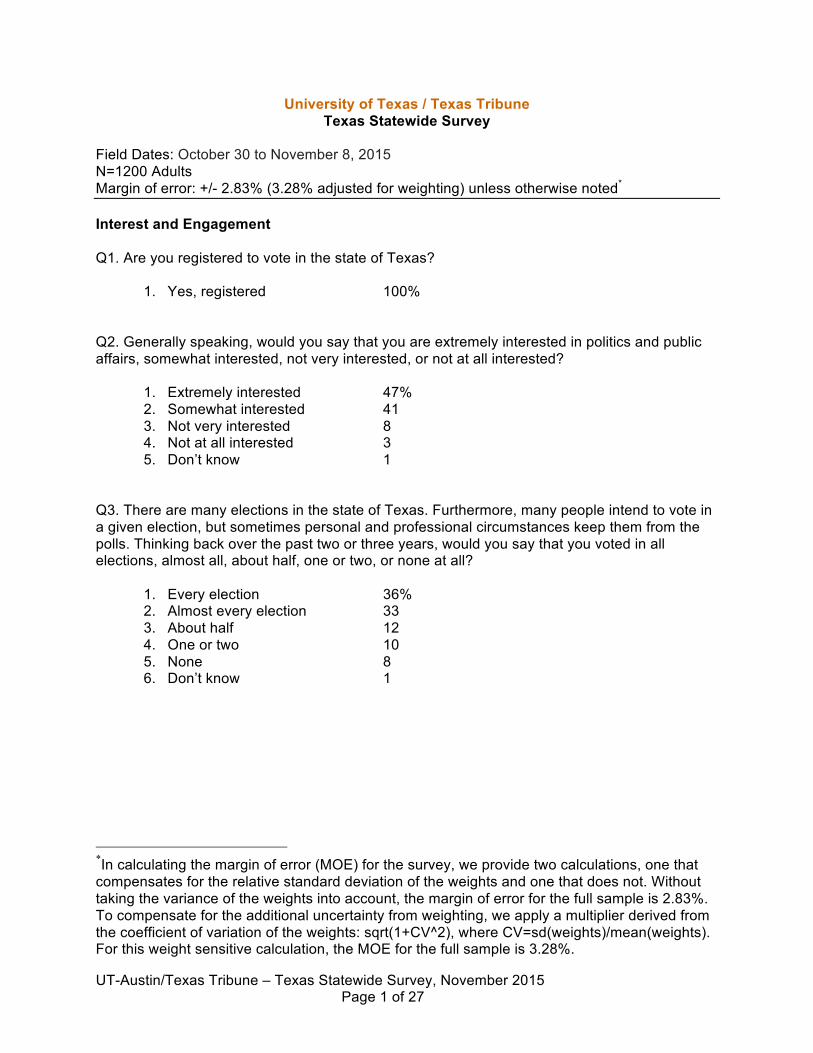
Field Dates: October 30 to November 8, 2015 N=1200 Adults Margin of error: +/- 2.83% (3.28% adjusted for weighting) unless otherwise noted* Interest and Engagement Q1. Are you registered to vote in the state of Texas?
1. Yes, registered 100% Q2. Generally speaking, would you say that you are extremely interested in politics and public affairs, somewhat interested, not very interested, or not at all interested?
1. Extremely interested 47% 2. Somewhat interested 41 3. Not very interested 8 4. Not at all interested 3 5. Don’t know 1
Q3. There are many elections in the state of Texas. Furthermore, many people intend to vote in a given election, but sometimes personal and professional circumstances keep them from the polls. Thinking back over the past two or three years, would you say that you voted in all elections, almost all, about half, one or two, or none at all?
1. Every election 36% 2. Almost every election 33 3. About half 12 4. One or two 10 5. None 8 6. Don’t know 1
*In calculating the margin of error (MOE) for the survey, we provide two calculations, one that compensates for the relative standard deviation of the weights and one that does not. Without taking the variance of the weights into account, the margin of error for the full sample is 2.83%. To compensate for the additional uncertainty from weighting, we apply a multiplier derived from the coefficient of variation of the weights: sqrt(1+CV^2), where CV=sd(weights)/mean(weights). For this weight sensitive calculation, the MOE for the full sample is 3.28%.

UT-Austin/Texas Tribune – Texas Statewide Survey, November 2015 Page 2 of 27
Most Important Problem Q4. What would you say is the most important problem facing this country today? [Randomize]
1. The economy 11% 2. Political corruption/leadership 11 3. Immigration 10 4. Federal spending/national debt 10 5. National security/terrorism 6 6. Moral decline 6 7. Health care 5 8. Income inequality 5 9. Unemployment/jobs 5 10. Border security 4 11. Gun control/gun violence 4 12. Education 3 13. Taxes 3 14. Partisan gridlock 2 15. Middle East instability 2 16. Environment 2 17. Social welfare programs 2 18. Police brutality/police militarization 2 19. Race relations 2 20. Crime and drugs 1 21. Gay marriage 1 22. Gas prices 1 23. Abortion 1 24. Voting system 1 25. The media 1 26. Government data collection 1 27. Energy 0 28. Housing 0 29. Afghanistan/Pakistan 0 30. Foreign trade 0 31. Russia 0 32. Gender inequality 0

UT-Austin/Texas Tribune – Texas Statewide Survey, November 2015 Page 3 of 27
Q5. What would you say is the most important problem facing the state of Texas today? [Randomize]
1. Immigration 18% 2. Border security 17 3. Political corruption/leadership 8 4. Education 6 5. The economy 5 6. Health care 5 7. Unemployment/jobs 5 8. Moral decline 4 9. Gun control/gun violence 4 10. Declining oil prices 3 11. Crime and drugs 3 12. Water supply 2 13. Transportation/roads/traffic 2 14. Social welfare programs 2 15. State government spending 2 16. Taxes 2 17. Gay marriage 2 18. Redistricting 2 19. Abortion 1 20. State budget cuts 1 21. Environment 1 22. Voting system 1 23. Energy 1 24. Housing 1 25. Property rights 1 26. Police brutality/police militarization 1 27. Gas prices 0 28. Insurance rates 0 29. Utility rates 0 30. Electoral fraud 0 31. The media 0 32. State courts 0
Retrospective Assessments Q6. How would you rate the job Barack Obama has done as president? Would you say that you…
1. Approve strongly 17% 2. Approve somewhat 19 3. Neither approve nor disapprove 9 4. Disapprove somewhat 8 5. Disapprove strongly 46 6. Don’t know 1

UT-Austin/Texas Tribune – Texas Statewide Survey, November 2015 Page 4 of 27
Q7. How would you rate the job the U.S. Congress is doing? Would you say that you…
1. Approve strongly 2% 2. Approve somewhat 8 3. Neither approve nor disapprove 17 4. Disapprove somewhat 25 5. Disapprove strongly 46 6. Don’t know 3
Q8A. How would you rate the job Greg Abbott has done as governor? Would you say that you…
1. Approve strongly 20% 2. Approve somewhat 22 3. Neither approve nor disapprove 21 4. Disapprove somewhat 10 5. Disapprove strongly 19 6. Don’t know 7
Q8B. How would you rate the job Dan Patrick has done as lieutenant governor? Would you say that you…
1. Approve strongly 10% 2. Approve somewhat 19 3. Neither approve nor disapprove 28 4. Disapprove somewhat 9 5. Disapprove strongly 17 6. Don’t know 16
Q8C. How would you rate the job Joe Straus has done as Speaker of the Texas House of Representatives? Would you say that you…
1. Approve strongly 4% 2. Approve somewhat 16 3. Neither approve nor disapprove 32 4. Disapprove somewhat 8 5. Disapprove strongly 14 6. Don’t know 25
Q9A. How would you rate the job Ted Cruz has done as U.S. Senator? Would you say that you…
1. Approve strongly 27% 2. Approve somewhat 17 3. Neither approve nor disapprove 11 4. Disapprove somewhat 9 5. Disapprove strongly 28 6. Don’t know 9
UT-Austin/Texas Tribune – Texas Statewide Survey, November 2015 Page 5 of 27
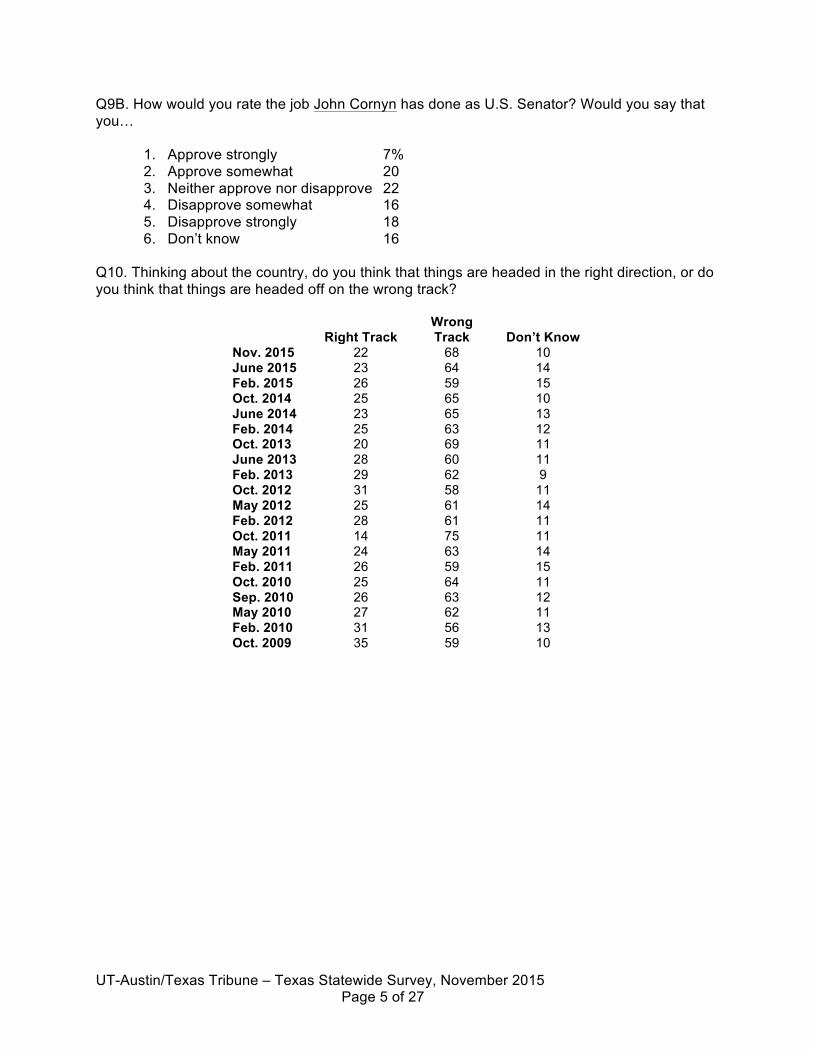
Q9B. How would you rate the job John Cornyn has done as U.S. Senator? Would you say that you…
1. Approve strongly 7% 2. Approve somewhat 20 3. Neither approve nor disapprove 22 4. Disapprove somewhat 16 5. Disapprove strongly 18 6. Don’t know 16
Q10. Thinking about the country, do you think that things are headed in the right direction, or do you think that things are headed off on the wrong track?
Right Track
Wrong Track Don’t Know
Nov. 2015 22 68 10 June 2015 23 64 14 Feb. 2015 26 59 15 Oct. 2014 25 65 10 June 2014 23 65 13 Feb. 2014 25 63 12 Oct. 2013 20 69 11 June 2013 28 60 11 Feb. 2013 29 62 9 Oct. 2012 31 58 11 May 2012 25 61 14 Feb. 2012 28 61 11 Oct. 2011 14 75 11 May 2011 24 63 14 Feb. 2011 26 59 15 Oct. 2010 25 64 11 Sep. 2010 26 63 12 May 2010 27 62 11 Feb. 2010 31 56 13 Oct. 2009 35 59 10

UT-Austin/Texas Tribune – Texas Statewide Survey, November 2015 Page 6 of 27
Q11. Compared to a year ago, would you say that the national economy is a lot better off, somewhat better off, about the same, somewhat worse off, or a lot worse off?
A lot better off
Somewhat better off
About the same
Somewhat worse off
A lot worse off
Don’t Know/No Opinion
Nov. 2015 7 25 28 23 14 3 June 2015 7 24 33 21 13 3 Feb. 2015 11 25 33 18 11 3 Oct. 2014 6 25 30 23 14 2 June 2014 7 24 26 25 16 2 Feb. 2014 5 24 28 23 17 2 Oct. 2013 5 20 25 25 24 1 June 2013 7 28 31 18 15 1 Oct. 2012 7 25 25 19 23 1 May 2012 4 24 29 20 19 4 Feb. 2012 4 25 30 19 20 2 Oct. 2011 2 12 25 28 31 2 May 2011 2 20 26 24 25 3 Feb. 2011 3 24 30 24 17 2 Oct. 2010 3 19 20 23 33 3 Sep. 2010 3 20 21 20 34 2 May 2010 5 23 24 15 32 1 Feb. 2010 3 25 19 23 29 1 Oct. 2009 5 19 16 23 36 1 Q12. Thinking about the state of Texas, do you think that things are headed in the right direction, or do you think that things are headed off on the wrong track?
Right Track
Wrong Track Don’t Know
Nov. 2015 45 36 19 June 2015 50 32 18 Feb. 2015 50 30 20 Oct. 2014 48 35 18 June 2014 49 33 17 Feb. 2014 45 35 20 Oct. 2013 42 39 19 June 2013 50 32 18 Feb. 2013 45 39 16 Oct. 2012 43 34 23 May 2012 38 42 21 Feb. 2012 43 38 19 Oct. 2011 39 43 18 May 2011 36 48 16 Feb. 2011 41 41 18 Oct. 2010 45 37 18 Sep. 2010 43 38 18 May 2010 45 38 17 Feb. 2010 43 37 20 Oct. 2009 38 39 23

UT-Austin/Texas Tribune – Texas Statewide Survey, November 2015 Page 7 of 27
Q13. Compared to a year ago, would you say that you and your family are economically a lot better off, somewhat better off, about the same, somewhat worse off, or a lot worse off?
A lot better off
Somewhat better off
About the same
Somewhat worse off
A lot worse off
Don’t Know/No Opinion
Nov. 2015 5 18 45 23 7 1 June 2015 5 21 48 17 7 2 Feb. 2015 6 21 44 21 7 2 Oct. 2014 5 22 42 23 7 1 June 2014 6 21 42 21 8 2 Feb. 2014 5 20 43 22 9 1 Oct. 2013 5 17 41 23 12 2 June 2013 6 19 44 23 7 1 Oct. 2012 6 17 43 23 11 1 May 2012 4 15 48 19 13 2 Feb. 2012 4 16 45 23 11 1 Oct. 2011 3 13 40 28 15 1 May 2011 2 16 40 25 16 2 Feb. 2011 3 17 45 24 11 1 Oct. 2010 3 16 38 27 14 2 Sep. 2010 3 17 39 26 14 1 May 2010 4 16 42 25 13 1 Feb. 2010 3 14 41 29 12 2 Oct. 2009 3 14 39 27 16 1 Q14. Compared to a year ago, would you say that the Texas economy is a lot better off, somewhat better off, about the same, somewhat worse off, or a lot worse off?
A lot better off
Somewhat better off
About the same
Somewhat worse off
A lot worse off
Don’t Know/No Opinion
Nov. 2015 4 25 41 20 5 5 June 2015 5 28 44 14 4 4 Feb. 2015 6 26 47 14 3 4 Oct. 2014 9 32 40 12 4 3 Oct. 2012 4 21 51 16 5 3

UT-Austin/Texas Tribune – Texas Statewide Survey, November 2015 Page 8 of 27
Political Figures and Elections Q15. If the 2016 primary elections for President were held today, would you vote in the Republican primary, the Democratic primary, or wouldn’t you vote in either primary?
1. Republican primary 50% 2. Democratic primary 35 3. Wouldn’t vote in a primary 7 4. Don’t know 8
[For Q16A-Q16B and Q17A-Q17B, after indicating their first choice, respondents were asked, “Of the remaining possible candidates, who would be your second choice, or have you not thought about it enough to have an opinion?”] Q16A. [ASK IF Q15=1] If the 2016 Republican primary election for president were held today, which of the following possible candidates would you vote for, or haven’t you thought about it enough to have an opinion? [Randomize 1-15] (n=542, MOE is +/- 4.21%; MOE is +/- 4.72% when adjusted for weighting) First Choice Second Choice
1. Ted Cruz 27% 19% 2. Donald Trump 27 15 3. Ben Carson 13 19 4. Marco Rubio 9 10 5. Jeb Bush 4 6 6. Rand Paul 4 3 7. Carly Fiorina 4 7 8. Mike Huckabee 2 5 9. Chris Christie 1 4 10. Rick Santorum 1 1 11. John Kasich 1 2 12. Bobby Jindal 0 1 13. Lindsey Graham 0 0 14. George Pataki 0 1 15. Jim Gilmore 0 0 16. Haven’t thought enough
about it to have an opinion 5 7

UT-Austin/Texas Tribune – Texas Statewide Survey, November 2015 Page 9 of 27
Q16C. [ASK IF Q15=1] Are there any of these candidates for the Republican nomination for president whom you would definitely not support? [REMOVE CHOICE FROM Q16 AND Q16A. RANDOMIZE REMAINING CHOICES] [GRID AND SELECT ALL THAT APPLY]
1. Jeb Bush 25% 2. Lindsey Graham 22 3. George Pataki 20 4. Chris Christie 18 5. Jim Gilmore 18 6. Donald Trump 16 7. John Kasich 16 8. Rand Paul 15 9. Rick Santorum 14 10. Mike Huckabee 11 11. Bobby Jindal 10 12. Marco Rubio 9 13. Carly Fiorina 9 14. Ted Cruz 8 15. Ben Carson 7
Q17A. [ASK IF Q15=2] If the 2016 Democratic primary election for president were held today, which of the following possible candidates would you vote for, or haven’t you thought about it enough to have an opinion? [Randomize 1-4] (n=459, MOE is +/- 4.57%; MOE is +/- 5.76% when adjusted for weighting) First Choice Second Choice
1. Hillary Clinton 61% 18% 2. Bernie Sanders 30 27 3. Martin O’Malley 1 13 4. Lawrence Lessig 0 5 5. Haven’t thought enough about
it to have an opinion 7 37 Q17C. [ASK IF Q15=2] Are there any of these candidates for the Democratic nomination for president whom you would definitely not support? [REMOVE CHOICE FROM Q17 AND Q17A. RANDOMIZE REMAINING CHOICES] [GRID AND SELECT ALL THAT APPLY]
1. Lawrence Lessig 6 2. Hillary Clinton 5 3. Bernie Sanders 5 4. Martin O’Malley 4

UT-Austin/Texas Tribune – Texas Statewide Survey, November 2015 Page 10 of 27
Q18. Suppose the Tea Party movement organized itself as a political party. When thinking about the next election for Congress, would you vote for [Randomize] the Republican candidate from your district, the Democratic candidate from your district, or the Tea Party candidate from your district? [Randomize 1-2]
1. Republican candidate 22% 2. Democratic candidate 35 3. Tea Party candidate 17 4. Don’t know 26
Q19. Do you think the Tea Party movement has too much influence, too little influence, or the right amount of influence in the Republican Party?
1. Too much influence 34% 2. Too little influence 26 3. The right amount of influence 19 4. Don’t know 21
[RANDOMIZE Q20-Q24] Q20. Please tell us whether you have a very favorable, somewhat favorable, neither favorable nor unfavorable, somewhat unfavorable, or very unfavorable opinion of Ted Cruz.
Very Favorable
Somewhat Favorable
Neither Favorable
nor Unfavorable
Somewhat Unfavorable
Very Unfavorable
Don’t Know/No Opinion
Nov. 2015 25 16 12 9 29 8 June 2015 22 18 15 8 29 7 Feb. 2015 26 15 12 8 28 10 Oct. 2014 26 18 11 8 28 8 June 2014 29 17 10 6 28 11 Feb. 2014 29 14 10 8 29 10 Oct. 2013 23 15 14 6 31 10 June 2013 26 14 13 7 24 17 Q21. Please tell us whether you have a very favorable, somewhat favorable, neither favorable nor unfavorable, somewhat unfavorable, or very unfavorable opinion of John Cornyn.
1. Very favorable 6% 2. Somewhat favorable 20 3. Neither favorable nor unfavorable 24 4. Somewhat unfavorable 14 5. Very unfavorable 18 6. Don’t know/no opinion 18

UT-Austin/Texas Tribune – Texas Statewide Survey, November 2015 Page 11 of 27
Q22. Please tell us whether you have a very favorable, somewhat favorable, neither favorable nor unfavorable, somewhat unfavorable, or very unfavorable opinion of Greg Abbott.
Very Favorable
Somewhat Favorable
Neither Favorable
nor Unfavorable
Somewhat Unfavorable
Very Unfavorable
Don’t Know/No Opinion
Nov. 2015 23 21 17 11 19 10 June 2015 24 24 15 9 20 7 Feb. 2015 25 21 16 9 19 10 Oct. 2014 23 24 12 11 23 8 June 2014 25 20 15 7 18 15 Feb. 2014 23 22 15 9 16 16 Oct. 2013 16 20 23 11 13 18 June 2013 12 17 20 9 11 31 Q23. Please tell us whether you have a very favorable, somewhat favorable, neither favorable nor unfavorable, somewhat unfavorable, or very unfavorable opinion of Donald Trump.
1. Very favorable 16% 2. Somewhat favorable 18 3. Neither favorable nor unfavorable 12 4. Somewhat unfavorable 12 5. Very unfavorable 39 6. Don’t know/no opinion 3
Q24. Please tell us whether you have a very favorable, somewhat favorable, neither favorable nor unfavorable, somewhat unfavorable, or very unfavorable opinion of Hillary Clinton.
1. Very favorable 15% 2. Somewhat favorable 19 3. Neither favorable nor unfavorable 7 4. Somewhat unfavorable 9 5. Very unfavorable 47 6. Don’t know/no opinion 3

UT-Austin/Texas Tribune – Texas Statewide Survey, November 2015 Page 12 of 27
[RANDOMIZE Q25-Q26] Q25. Please tell us whether you have a very favorable, somewhat favorable, neither favorable nor unfavorable, somewhat unfavorable, or very unfavorable opinion of the Democratic Party.
1. Very favorable 12% 2. Somewhat favorable 20 3. Neither favorable nor unfavorable 12 4. Somewhat unfavorable 13 5. Very unfavorable 39 6. Don’t know/no opinion 4
Q26. Please tell us whether you have a very favorable, somewhat favorable, neither favorable nor unfavorable, somewhat unfavorable, or very unfavorable opinion of the Republican Party.
1. Very favorable 8% 2. Somewhat favorable 22 3. Neither favorable nor unfavorable 17 4. Somewhat unfavorable 20 5. Very unfavorable 29 6. Don’t know/no opinion 5
[RANDOMIZE Q27-Q28] Q27. Please tell us whether you have a very favorable, somewhat favorable, neither favorable nor unfavorable, somewhat unfavorable, or very unfavorable opinion of Planned Parenthood.
1. Very favorable 19% 2. Somewhat favorable 15 3. Neither favorable nor unfavorable 15 4. Somewhat unfavorable 8 5. Very unfavorable 38 6. Don’t know/no opinion 4
Q28. Please tell us whether you have a very favorable, somewhat favorable, neither favorable nor unfavorable, somewhat unfavorable, or very unfavorable opinion of the National Rifle Association (NRA).
1. Very favorable 28% 2. Somewhat favorable 20 3. Neither favorable nor unfavorable 16 4. Somewhat unfavorable 8 5. Very unfavorable 23 6. Don’t know/no opinion 6

UT-Austin/Texas Tribune – Texas Statewide Survey, November 2015 Page 13 of 27
Policy Questions Q29. Of the three branches of federal government, which one do you trust the most?
1. The U.S. Congress, the legislative branch 18% 2. The President, the executive branch 18 3. The U.S. Supreme Court, the judicial branch 24 4. Don’t know 40
Q30. Which of the following factors should play the greatest role in guiding your Congressperson’s actions?
1. The beliefs of constituents like you 64% 2. The personal beliefs of the representative 12 3. The positions of the political party to which they belong 10 4. Don’t know/No opinion 15
Q31. Do you think your congressional representative should mostly be looking out for the interests of…
1. Their congressional district 30% 2. Their state 15 3. The country as a whole 47 4. Don’t know/No opinion 8
Q32. In general, in the face of political or policy conflicts, is it more important for government officials to compromise or to stand on principle?
1. Compromise 51% 2. Stand on principle 49
Q33. In general, do you think that political leaders publicly express their religious faith too much, too little, or the right amount?
1. Too much 27% 2. Too little 35 3. Right amount 19 4. Don’t know/No opinion 18

UT-Austin/Texas Tribune – Texas Statewide Survey, November 2015 Page 14 of 27
[RANDOMIZE Q34A-Q34B] Q34A. Do you think that the Republicans in Congress are conservative enough, too conservative, or not conservative enough?
1. Conservative enough 14% 2. Too conservative 35 3. Not conservative enough 34 4. Don’t know/No opinion 16
Q34B. Do you think that the Democrats in Congress are liberal enough, too liberal, or not liberal enough?
1. Liberal enough 19% 2. Too liberal 48 3. Not liberal enough 15 4. Don’t know/No opinion 18
Q35. Which of the following poses the greatest threat to the United States? [RANDOMIZE 1-9]
1. Illegal immigration 22 2. Foreign terrorist groups (e.g. ISIS, Al Qaeda) 18 3. Polarization/Intractable partisan conflict 12 4. Decaying American infrastructure 10 5. Gun violence/Mass shootings 9 6. Unfriendly foreign nations (e.g. Russia, Iran, China) 8 7. Racial tensions 6 8. Climate change 5 9. Computer network vulnerabilities 2 10. Other 6 11. Don’t know/no opinion 3
Q36. Do you think that women who want to avoid becoming pregnant should have access to birth control?
1. Yes, should have access 87% 2. No, should not have access 5 3. Don’t know/No opinion 7
Q37. What is your opinion on gay marriage?
1. Gays and lesbians should have the right to marry 43% 2. Gays and lesbians should not have the right to marry 43 3. Don’t know 14

UT-Austin/Texas Tribune – Texas Statewide Survey, November 2015 Page 15 of 27
Q38. Do you agree or disagree with the following statement: Undocumented immigrants currently living in the United States should be deported immediately
1. Strongly agree 30% 2. Somewhat agree 25 3. Somewhat disagree 18 4. Strongly disagree 21 5. Don’t know/No opinion 6
Q39. As you may know, the 14th Amendment to the Constitution says that all children born in the United States are automatically U.S. citizens regardless of their parents' legal status. Would you favor or oppose changing the Constitution to REPEAL this part of the 14th Amendment?"
1. Favor 48% 2. Oppose 39 3. Don’t know/No opinion 13
Q39A. In so-called "sanctuary cities," local law enforcement officials do not actively enforce some federal immigration laws. Do you approve or disapprove of city governments that choose not to enforce some immigration laws?
1. Approve of sanctuary cities 23% 2. Disapprove of sanctuary cities 60 3. Don't know/No opinion 17
Q40. In general, do you think gun control laws should be made more strict, less strict, or left as they are now?
1. More strict 41% 2. Less strict 18 3. Left as they are now 36 4. Don’t know/No opinion 6

UT-Austin/Texas Tribune – Texas Statewide Survey, November 2015 Page 16 of 27
Q41A. Thinking about mass shootings that have occurred in the United States in recent years, from what you know or have read, how much do you think each of the following factors is to blame for the shootings? [GRID WITH RESPONSE OPTIONS, “A great deal”, “A fair amount”, “Not much”, “Not at all”, “Don’t know/No opinion”.] [RANDOMIZE A-I] A great
deal A fair
amount Not
much Not at
all Don’t know
A. Failure of the mental health system to identify dangerous individuals 55 30 7 3 5
B. Current gun laws 28 17 17 33 5 C. Drug use 34 35 18 7 7 D. Violence in movies, video games, music lyrics 30 27 24 14 5
E. Spread of extremist points of view on the internet 37 36 16 5 6
F. Insufficient security at public buildings including businesses and schools 29 33 26 7 5
G. Inflamatory language from prominent political commentators 25 27 24 15 9
H. Unstable family situations 48 35 11 2 5 I. Media attention given to perpetrators of mass shootings 47 34 11 3 5
Q41B. And which of the following factors is most to blame for the shootings? [RANDOMIZE 1-9]
1. Failure of the mental health system to identify dangerous individuals 30% 2. Current gun laws 13 3. Unstable family situations 13 4. Media attention given to perpetrators of mass shootings 10 5. Violence in movies, video games, music lyrics 8 6. Spread of extremist points of view on the internet 7 7. Insufficient security at public buildings including businesses and schools 7 8. Drug use 4 9. Inflamatory language from prominent political commentators 3 10. Don’t know/No opinion 7
Q42. How much have you heard or read about Hillary Clinton’s use of a personal email address and server for work-related matters while she was Secretary of State?
1. A lot 57% 2. Some 28 3. Not very much 8 4. Nothing at all 4 5. Don’t know 2

UT-Austin/Texas Tribune – Texas Statewide Survey, November 2015 Page 17 of 27
Q43. [ASK IF Q44 EQ 1,2, or 3] Has Hillary Clinton's use of a personal email address and server for work while she was Secretary of State made your opinion of her better, made your opinion worse, or has this not affected your opinion of Hillary Clinton?
1. Better 5% 2. Worse 49 3. No effect 44 4. Don’t know 2

UT-Austin/Texas Tribune – Texas Statewide Survey, November 2015 Page 18 of 27
Political Knowledge [Randomize INFO1-INFO4] INFO1. Which political party holds the majority in the U.S. House of Representatives?
1. Republican Party 77% 2. Democratic Party 10 3. Neither 2 4. Don’t know 11
INFO2. What majority of both houses of the U.S. Congress is needed to override a presidential veto?
1. More than one-half 6% 2. More than two-thirds 69 3. More than three-fourths 12 4. Don’t know 13
INFO3. Which presidential candidate is currently a U.S. Senator from Florida? [RANDOMIZE 1-4]
1. Rick Santorum 4% 2. Marco Rubio 65 3. Rand Paul 3 4. Lindsey Graham 2 5. Don’t know 27
INFO4. Which presidential candidate is currently the governor of Ohio? [RANDOMIZE 1-4]
1. John Kasich 59% 2. Chris Christie 6 3. Jeb Bush 3 4. Bobby Jindal 3 5. Don’t know 29
INFO5. Which of the following presidential candidates had a former career as a neurosurgeon? [RANDOMIZE 1-4]
1. Scott Walker 1% 2. Mike Huckabee 1 3. Ben Carson 78 4. Carly Fiorina 1 5. Don’t know 18

UT-Austin/Texas Tribune – Texas Statewide Survey, November 2015 Page 19 of 27
Political Orientation We’re almost done. Now we just have a few basic questions for statistical purposes. LIBCON. On a scale from 1 to 7, where 1 is extremely liberal, 7 is extremely conservative, and 4 is exactly in the middle, where would you place yourself? [Wording on scale: (1) “Extremely liberal,” (4) “In the middle,” (7) “Extremely conservative”]
1. Extremely liberal 6% 2. Somewhat liberal 10 3. Lean liberal 6 4. In the middle 29 5. Lean conservative 11 6. Somewhat conservative 21 7. Extremely conservative 17
PID3. Generally speaking, would you say that you usually think of yourself as a…
1. Democrat 40% 2. Independent 11 3. Republican 49
PID7. (Uses the four PID3 follow-up questions)
1. Strong Democrat 18% 2. Not very strong Democrat 13 3. Lean Democrat 9 4. Independent 11 5. Lean Republican 14 6. Not very strong Republican 12 7. Strong Republican 22
Demographics AGE. Please indicate your age group.
1. 18-29 16% 2. 30-44 24 3. 45-64 37 4. 65 and up 22
LOCATE. Would you say that you live in an urban, suburban, or rural community?
1. Urban 29% 2. Suburban 52 3. Rural 19
METRO. Do you live in the Houston, Dallas-Fort Worth, San Antonio, or Austin metropolitan areas?

UT-Austin/Texas Tribune – Texas Statewide Survey, November 2015 Page 20 of 27
1. Yes, I live in the Houston area. 23% 2. Yes, I live the Dallas-Fort Worth area 26 3. Yes, I live in the San Antonio area 13 4. Yes, I live in the Austin area 9 5. No, I live in another part of Texas. 29
CHILD. How many children are currently living with you?
1. One 16% 2. Two 12 3. Three 6 4. Four or more 3 5. None 63
SCHOOL. Do you have any children currently enrolled in school in Texas? (check all that apply)
1. Yes, I have a child/children under 18 enrolled in public school in Texas. 20% 2. Yes, I have a child/children under 18 enrolled in private school in Texas. 2 3. Yes, I have a child/children under 18 who are being home schooled in Texas. 2 4. No, I do not have any children under 18 in school in Texas. 76
JT1. To what extent do you agree or disagree with the following about how you view life’s uncertainties: “I really dislike not knowing what is going to happen.”
1. Totally disagree 5% 2. 5 3. 7 4. Neither disagree nor agree 32 5. 18 6. 15 7. Totally Agree 18
JT2. In general people often face risks when making financial, career or other life decisions. Overall, how would you place yourself on the following scale?
1. Extremely uncomfortable taking risks 6 2. 10 3. 21 4. Neither comfortable nor uncomfortable taking risks 32 5. 21 6. 6 7. Extremely comfortable taking risks 4
JT3. We are interested in you and your family’s economic security. By economic security we mean your security in being able to keep your job, maintain your income, have health insurance coverage, and retire comfortably. Overall, how satisfied are you about your economic security?
1. Extremely dissatisfied 11 2. 10 3. 18

UT-Austin/Texas Tribune – Texas Statewide Survey, November 2015 Page 21 of 27
4. Neither dissatisfied nor satisfied 24 5. 17 6. 12 7. Extremely satisfied 7
INCOME. In which category would you place your household income last year?
1. Less than $10,000 5% 2. $10,000 to $19,999 7 3. $20,000 to $29,999 11 4. $30,000 to $39,999 11 5. $40,000 to $49,999 8 6. $50,000 to $59,999 10 7. $60,000 to $69,999 6 8. $70,000 to $79,999 8 9. $80,000 to $99,999 7 10. $100,000 to $119,999 7 11. $120,000 to $149,999 4 12. More than $150,000 4 13. Prefer not to say 13

UT-Austin/Texas Tribune – Texas Statewide Survey, November 2015 Page 22 of 27
AB. Generally speaking, do you consider yourself to be pro-life, pro-choice, or neither?
1. Pro-life 45% 2. Pro-choice 35 3. Neither 13 4. Don’t know 6
EDU. What is the highest level of education that you received?
1. Less than high school 9% 2. High school degree 25 3. Some college 25 4. Two-year college degree 9 5. Four-year college degree 20 6. Post-graduate degree 10
ONEDU. These days many colleges and universities offer courses online. Have you ever taken a course online?
1. Yes 29% 2. No 71

UT-Austin/Texas Tribune – Texas Statewide Survey, November 2015 Page 23 of 27
RELIG1. What is your primary religious affiliation, if any? [No open response on “other”]
1. Agnostic 4% 2. Assembly of God* 2 3. Atheist 4 4. Baptist* 17 5. Born again 2 6. Buddhist 1 7. Catholic* 20 8. Christian Scientist* 0 9. Church of Christ* 3 10. Church of God* 1 11. Disciples of Christ* 1 12. Episcopal/Anglican* 1 13. Evangelical 1 14. Hindu 1 15. Jehovah’s Witnesses 1 16. Jewish 1 17. Lutheran* 2 18. Methodist* 6 19. Mormon* 1 20. Muslim/Islam 1 21. Nondenominational Christian* 8 22. Orthodox/Eastern Orthodox* 0 23. Pentecostal/charismatic/spirit-filled* 2 24. Presbyterian* 1 25. Protestant (non-specific)* 2 26. Reformed* 0 27. Unitarian/Universalist* 0 28. United Church of Christ* 0 29. Religious but not spiritual 0 30. Spiritual but not religious 7 31. No religious affiliation/none 7 32. Other* 3 33. Don’t know 1

UT-Austin/Texas Tribune – Texas Statewide Survey, November 2015 Page 24 of 27
RELIG2. What is your secondary religious affiliation, if any? [No open response on “other”]
1. Agnostic 2% 2. Assembly of God* 1 3. Atheist 1 4. Baptist* 6 5. Born again 6 6. Buddhist 0 7. Catholic* 4 8. Christian Scientist* 0 9. Church of Christ* 3 10. Church of God* 1 11. Disciples of Christ* 0 12. Episcopal/Anglican* 1 13. Evangelical 1 14. Hindu 0 15. Jehovah’s Witnesses 0 16. Jewish 1 17. Lutheran* 2 18. Methodist* 3 19. Mormon* 0 20. Muslim/Islam 0 21. Nondenominational Christian* 4 22. Orthodox/Eastern Orthodox* 0 23. Pentecostal/charismatic/spirit-filled* 1 24. Presbyterian* 1 25. Protestant (non-specific)* 4 26. Reformed* 0 27. Unitarian/Universalist* 0 28. United Church of Christ* 0 29. Religious but not spiritual 2 30. Spiritual but not religious 7 31. No religious affiliation/none 30 32. Other* 6 33. Don’t know 12
LITERAL. Which of these statements comes closest to describing your feelings about the Bible?
1. The Bible is the actual word of God and is to be taken literally, word for word. 31% 2. The Bible is the word of God but not everything in it should be taken literally, word for
word. 41 3. The Bible is a book written by men and is not the word of God. 20 4. Don’t know. 8
IMPORT. How important is religion in your life?
1. Extremely important 46% 2. Somewhat important 30 3. Not very important 11 4. Not at all important 12

UT-Austin/Texas Tribune – Texas Statewide Survey, November 2015 Page 25 of 27
ATTEND. Aside from weddings and funerals, how often do you attend religious services or participate in religious activities?
1. More than once a week 14% 2. Once a week 22 3. A few times a month 11 4. Once or twice a year 24 5. Never 29
RACE1. What race do you consider yourself to be?
1. White 61% 2. African American 13 3. Hispanic or Latino 22 4. Asian/Pacific Islander 1 5. Native American 1 6. Multi-racial 1 7. Other 1
RACE2. [Ask if RACE ~= “Hispanic or Latino”] Do you happen to have a Hispanic-Latino grandparent?
1. Yes 4% 2. No 95 3. Don’t know 1
NATIVE1. [Ask if RACE = “Hispanic or Latino”] Were you born in the United States or Puerto Rico, or in another country?
1. Born in the United States or Puerto Rico 87% 2. Born in another country 13 3. Don’t know 1
NATIVE2. [Ask NATIVE2 if answer 1 on NATIVE1] Were your parents born in the United States or Puerto Rico, or another country?
1. Both of my parents were born in the United States or Puerto Rico 58% 2. One of my parents was born in another country 24 3. Both of my parents were both in another country 18
MOVE. Did you move to Texas from some other state?
1. Yes 41% 2. No 59

UT-Austin/Texas Tribune – Texas Statewide Survey, November 2015 Page 26 of 27
STATE. [ASK IF MOVE=1] Which state did you move from (most recently)?
1. Alabama 1% 2. Alaska 0 3. Arizona 3 4. Arkansas 2 5. California 12 6. Colorado 1 7. Connecticut 1 8. Delaware 0 9. District of Columbia 0 10. Florida 5 11. Georgia 3 12. Hawaii 0 13. Idaho 0 14. Illinois 5 15. Indiana 2 16. Iowa 1 17. Kansas 3 18. Kentucky 2 19. Louisiana 6 20. Maine 0 21. Maryland 1 22. Massachusetts 1 23. Michigan 4 24. Minnesota 2 25. Mississippi 2 26. Missouri 3 27. Montana 0 28. Nebraska 1 29. Nevada 0 30. New Hampshire 0 31. New Jersey 4 32. New Mexico 4 33. New York 4 34. North Carolina 1 35. North Dakota 0 36. Ohio 2 37. Oklahoma 4 38. Oregon 0 39. Pennsylvania 3 40. Rhode Island 1 41. South Carolina 0 42. South Dakota 0 43. Tennessee 1 44. Utah 1 45. Vermont 0 46. Virginia 3 47. Washington 1 48. West Virginia 1 49. Wisconsin 3

UT-Austin/Texas Tribune – Texas Statewide Survey, November 2015 Page 27 of 27
50. Wyoming 0 HOME. Do you own or rent your home?
1. Own 72% 2. Rent 28
MARITAL. What is your marital status?
1. Married 56% 2. Separated 2 3. Divorced 9 4. Widowed 5 5. Single 23 6. Domestic Partnership 5
GENDER. What is your gender?
1. Male 47% 2. Female 53