University of Tasmania Catering Research Report · University of Tasmania – Catering Research...
31
December 2011 University of Tasmania Catering Research Report Prepared by
Transcript of University of Tasmania Catering Research Report · University of Tasmania – Catering Research...

December 2011
University of Tasmania Catering Research Report
Prepared by

December 2011
This report has been prepared by Enterprise Marketing and Research Services Pty. Ltd.
60 Main Road, Moonah, 7009
All enquiries should be addressed to
Samuel Paske Chief Operations Director Phone: (03) 62 111 222 PO Box 402 Fax: (03) 62 111 219 Moonah TAS 7009 E-mail: [email protected]

University of Tasmania – Catering Research Report I EMRS
Contents Summary 1
Section One – Introduction 3
1.1 Background 3
1.2 Research Aim 3
1.3 Methodology 3
1.3.1 Sampling 3
1.4 Structure of the Report 3
1.5 The People Interviewed 4
Section Two – Catering Venues 5
2.1 Catering Venues Used 5
2.2 Catering Venues Used Most Often 7
2.3 Frequency of Eating at a UTAS Location on Campus 9
2.4 Average Number of Meals/ Snacks Eaten Per Day 11
2.5 Overall Rating of Aspects for Current UTAS Catering Venues 13
2.6 Key Motivations to Eat at UTAS Catering Venues More Often 14
2.7 Importance of a Service Provider Being Sustainable and Environmentally Friendly 16
Section Three – Choice of Food Offerings 17
3.1 Food Options Respondents Would Like to see More of on Campus 17
3.2 Types of International Foods Respondents Would Like to see More of on Campus 19
3.3 Importance of Having Nationally Recognised Brands 20
3.4 Respondents’ Association with the word “Value” 21
Section Four – UTAS Vending 22
4.1 Frequency of Purchasing Products from UTAS Vending 22
4.2 Types of Product Respondents Would Like to Purchase from UTAS Vending 24
Section Five – Branded Outlets off Campus 25
5.1 Visiting Branded Outlets off Campus 25
Appendix A – The Questionnaire 26

1
Tas Gas – Barriers to Connection Round 3 Research Report I EMRS
Summary
Catering Venues Used
More than one third each mentioned that they used “Lazenby’s” (39%) and “The Ref” (35%), while one
fifth mentioned the “Uni café”.
Smaller percentages mentioned they used the “Coffee Shop” (14%), “Degrees Restaurant” (12%) and the
“Unibar (Hobart)” (11%), while all other UTAS venues were mentioned by less than 10% of respondents
each.
Catering Venues Used Most Often
Similar to the previous question, the venues mentioned as being used most often by respondents were
“Lazenby’s” (25% stated this as the venue they used most often), closely followed by “The Ref” (23%).
The “Uni Café”, “Coffee Shop” and “Cradle Coast Café” were also mentioned by slightly higher
percentages of respondents as the venue they used most often (15%, 7% and 6%, respectively).
Frequency of Eating
Nearly half (42%) of respondents stated that they would typically eat at a UTAS location on campus
“once a week”, while more than one quarter stated “2-3 days a week”. Just 8% would eat at a UTAS
location “4-5 days a week”, while more than one fifth (22%) said they “never” eat at a UTAS location on
campus.
Average Number of Meals and Snacks
Just over two thirds (68%) of respondents stated they would have just one meal or snack per day from a
UTAS venue, while nearly one fifth (19%) stated “2 per day”. 10% of respondents indicated they would
“rarely/ never eat on campus”.
Overall Rating of UTAS Catering Venues
More than one third (39%) of respondents indicated they would rate the catering venue they most used
as “average” in terms of the taste, quality, variety and value for money of the food offered. Just under
one third (30%) stated it was “good”, while 5% claimed the food at their most used UTAS venue was
“excellent”. Altogether, 35% rated their most used venue “excellent” or “good”, while 25% stated it was
“below average” or “poor”.
Key Motivations
The top three key motivations cited by respondents for eating at UTAS catering venues more often were
“greater value for money” (55%), “better variety of choices” (53%) and “better quality food” (51%).
2
Tas Gas – Barriers to Connection Round 3 Research Report I EMRS
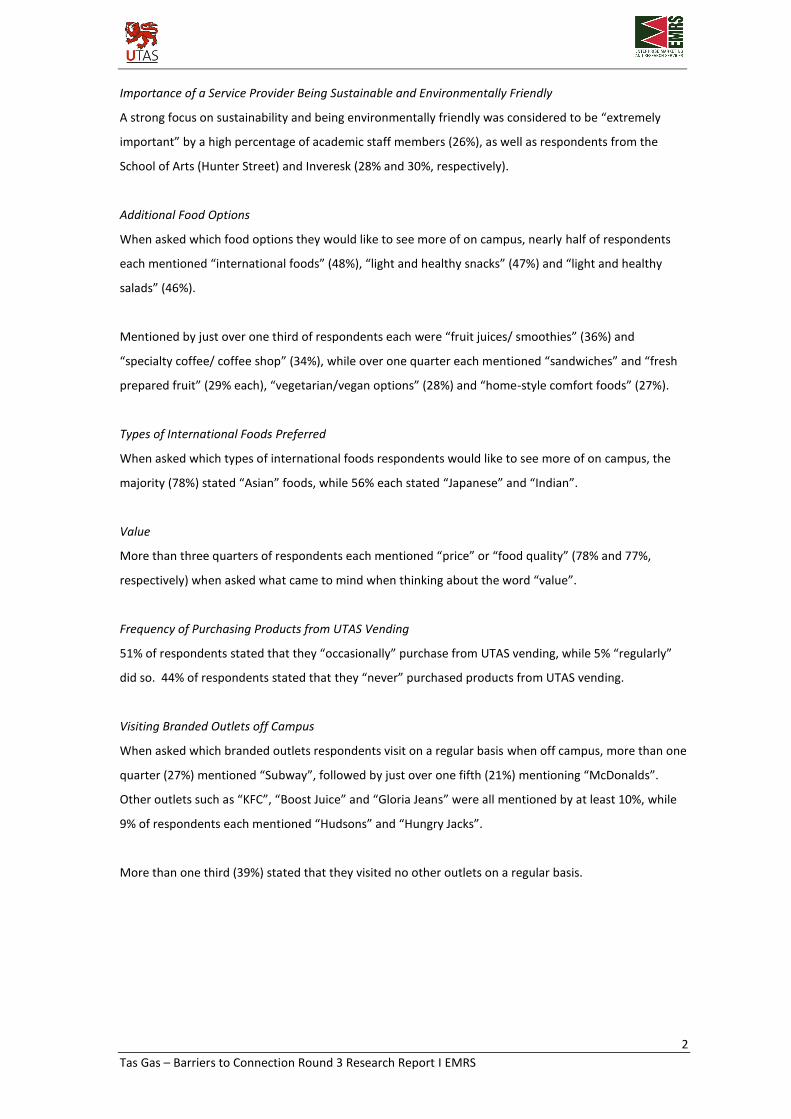
Importance of a Service Provider Being Sustainable and Environmentally Friendly
A strong focus on sustainability and being environmentally friendly was considered to be “extremely
important” by a high percentage of academic staff members (26%), as well as respondents from the
School of Arts (Hunter Street) and Inveresk (28% and 30%, respectively).
Additional Food Options
When asked which food options they would like to see more of on campus, nearly half of respondents
each mentioned “international foods” (48%), “light and healthy snacks” (47%) and “light and healthy
salads” (46%).
Mentioned by just over one third of respondents each were “fruit juices/ smoothies” (36%) and
“specialty coffee/ coffee shop” (34%), while over one quarter each mentioned “sandwiches” and “fresh
prepared fruit” (29% each), “vegetarian/vegan options” (28%) and “home-style comfort foods” (27%).
Types of International Foods Preferred
When asked which types of international foods respondents would like to see more of on campus, the
majority (78%) stated “Asian” foods, while 56% each stated “Japanese” and “Indian”.
Value
More than three quarters of respondents each mentioned “price” or “food quality” (78% and 77%,
respectively) when asked what came to mind when thinking about the word “value”.
Frequency of Purchasing Products from UTAS Vending
51% of respondents stated that they “occasionally” purchase from UTAS vending, while 5% “regularly”
did so. 44% of respondents stated that they “never” purchased products from UTAS vending.
Visiting Branded Outlets off Campus
When asked which branded outlets respondents visit on a regular basis when off campus, more than one
quarter (27%) mentioned “Subway”, followed by just over one fifth (21%) mentioning “McDonalds”.
Other outlets such as “KFC”, “Boost Juice” and “Gloria Jeans” were all mentioned by at least 10%, while
9% of respondents each mentioned “Hudsons” and “Hungry Jacks”.
More than one third (39%) stated that they visited no other outlets on a regular basis.

3
University of Tasmania – Catering Research Report I EMRS
Section One – Introduction
1.1 Background
The University of Tasmania (UTAS) is considering its options around the delivery of catering services
across campuses and is exploring the development of a new model. The current situation involves the
Tasmanian University Union (TUU) having the right to deliver catering to students across all campuses;
however, as part of this potential change, there have been confidential discussions between the UTAS
and TUU Boards on the transfer of those services directly to UTAS.
1.2 Research Aim
The primary aim of the research is to engage students and staff and provide them with the opportunity
to offer feedback on what their preferences in food and drink are, but also include discussion on the
availability of places to socialise and the opening hours of various offerings.
1.3 Methodology
The data was collected through an online 5 minute survey hosted on the EMRS website. Students of the
University of Tasmania were sent a link via their student email directing them to the location of the
survey.
1.3.1 Sampling
The population is based on approximately 22,000 students from the University of Tasmania. As with all
quantitative research, it must be remembered that all sample surveys are subject to sampling error. The
sampling error depends largely on the number of responses to the online survey and the way the sample
was selected. In theory, with the sample size of 4075 respondents, in this research we can say with 95%
certainty that the results have statistical accuracy of +/- 1.4 percentage points of what they would be if
the entire student population had been surveyed.
The questionnaire is included as an appendix to this report.
1.4 Structure of the Report
The remainder of the report will be divided into the following 4 sections:
Section Two – Catering Venues
Section Three – Choice of Food Offerings
Section Four – UTAS Vending
Section Five – Branded Outlets off Campus

4
University of Tasmania – Catering Research Report I EMRS
1.5 The People Interviewed
4075 respondents completed an online survey in November 2011. The following chart shows the
percentages of each demographic group involved in the survey.
Table 1 – The People Interviewed
(Number and percentage of those in each demographic group)
Demographic Number Percentage
Total 4075 100
Gender Male Female Declined to answer
1564 2482
29
38 61 1
Age 17-24 years 25-39 years 40-54 years 55 years or over Declined to answer
1440 1282 966 356 31
35 32 24 9 1
Study Status Full-time student Part-time student Staff member – Academic Staff member – Professional
2240 503 456 864
55 12 12 21
Campus Sandy Bay School of Arts (Hunter Street) Medical Sciences (Hobart City) Conservatorium Newnham Inveresk Cradle Coast Other Campus not in Tasmania
2117 142 243 32
1091 112 204 122 12
52 4 6 1
27 3 5 3 0
Place of Residence On-campus accommodation Off-campus rental accommodation Off-campus non-rental accommodation
217 1311 1215
8
48 44
Student Type Tasmanian student Student from mainland Australia or New Zealand International student
1945 279 519
71 10 19
5
University of Tasmania – Catering Research Report I EMRS
Section Two – Catering Venues
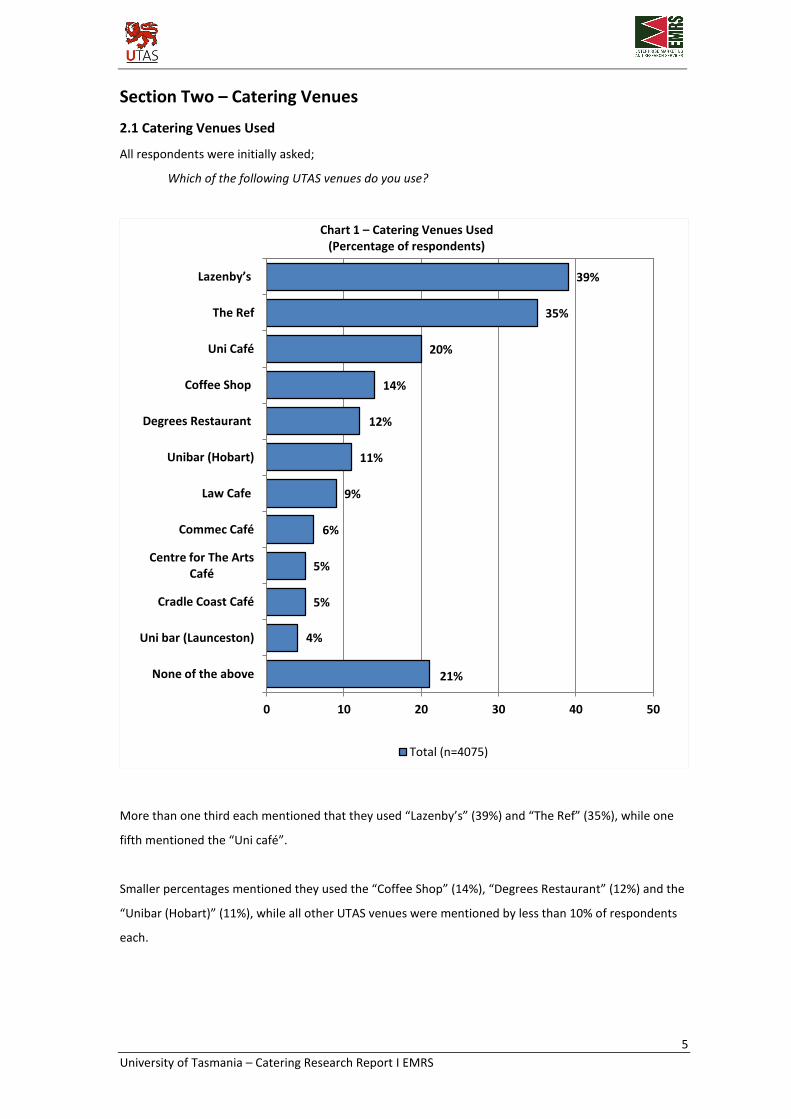
2.1 Catering Venues Used
All respondents were initially asked;
Which of the following UTAS venues do you use?
More than one third each mentioned that they used “Lazenby’s” (39%) and “The Ref” (35%), while one
fifth mentioned the “Uni café”.
Smaller percentages mentioned they used the “Coffee Shop” (14%), “Degrees Restaurant” (12%) and the
“Unibar (Hobart)” (11%), while all other UTAS venues were mentioned by less than 10% of respondents
each.
21%
4%
5%
5%
6%
9%
11%
12%
14%
20%
35%
39%
0 10 20 30 40 50
None of the above
Uni bar (Launceston)
Cradle Coast Café
Centre for The Arts Café
Commec Café
Law Cafe
Unibar (Hobart)
Degrees Restaurant
Coffee Shop
Uni Café
The Ref
Lazenby’s
Chart 1 – Catering Venues Used (Percentage of respondents)
Total (n=4075)
6
University of Tasmania – Catering Research Report I EMRS
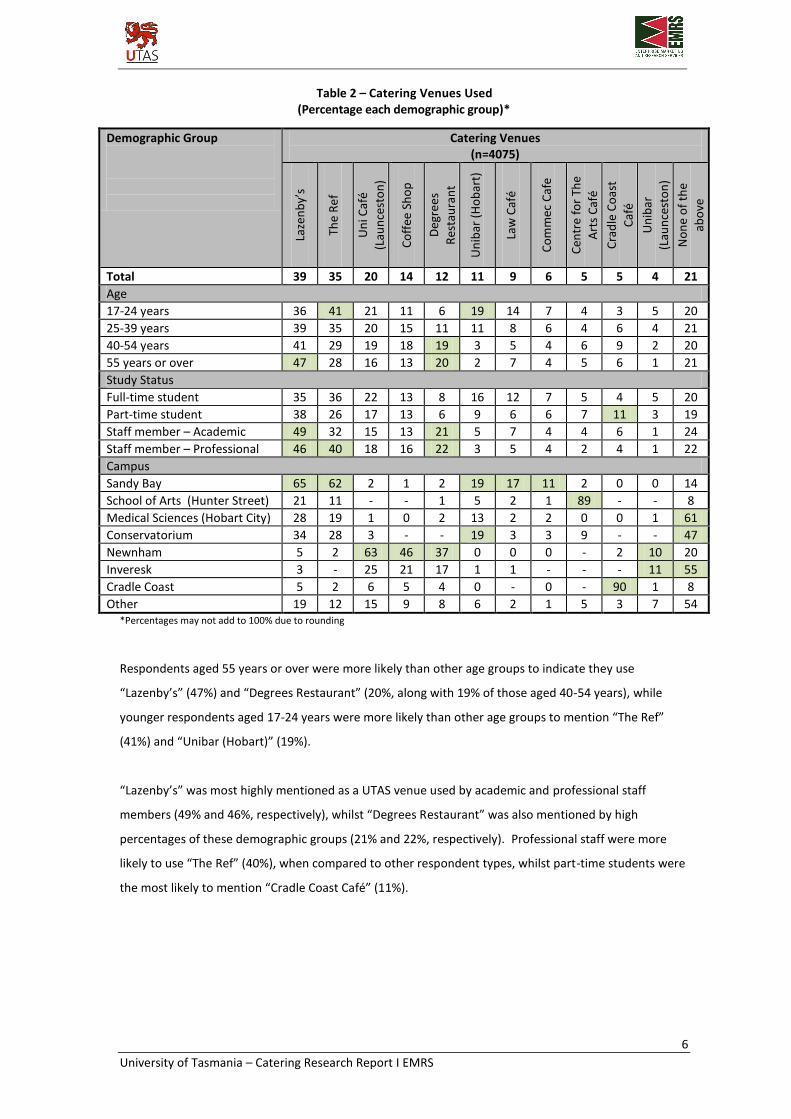
Table 2 – Catering Venues Used (Percentage each demographic group)*
Demographic Group
Catering Venues (n=4075)
Laze
nb
y’s
The
Re
f
Un
i Caf
é
(Lau
nce
sto
n)
Co
ffee
Sh
op
Deg
ree
s
Res
tau
ran
t
Un
ibar
(H
ob
art)
Law
Caf
é
Co
mm
ec C
afe
Cen
tre
for
The
Art
s C
afé
Cra
dle
Co
ast
Caf
é
Un
ibar
(Lau
nce
sto
n)
No
ne
of
the
abo
ve
Total 39 35 20 14 12 11 9 6 5 5 4 21
Age
17-24 years 36 41 21 11 6 19 14 7 4 3 5 20
25-39 years 39 35 20 15 11 11 8 6 4 6 4 21
40-54 years 41 29 19 18 19 3 5 4 6 9 2 20
55 years or over 47 28 16 13 20 2 7 4 5 6 1 21
Study Status
Full-time student 35 36 22 13 8 16 12 7 5 4 5 20
Part-time student 38 26 17 13 6 9 6 6 7 11 3 19
Staff member – Academic 49 32 15 13 21 5 7 4 4 6 1 24
Staff member – Professional 46 40 18 16 22 3 5 4 2 4 1 22
Campus
Sandy Bay 65 62 2 1 2 19 17 11 2 0 0 14
School of Arts (Hunter Street) 21 11 - - 1 5 2 1 89 - - 8
Medical Sciences (Hobart City) 28 19 1 0 2 13 2 2 0 0 1 61
Conservatorium 34 28 3 - - 19 3 3 9 - - 47
Newnham 5 2 63 46 37 0 0 0 - 2 10 20
Inveresk 3 - 25 21 17 1 1 - - - 11 55
Cradle Coast 5 2 6 5 4 0 - 0 - 90 1 8
Other 19 12 15 9 8 6 2 1 5 3 7 54 *Percentages may not add to 100% due to rounding
Respondents aged 55 years or over were more likely than other age groups to indicate they use
“Lazenby’s” (47%) and “Degrees Restaurant” (20%, along with 19% of those aged 40-54 years), while
younger respondents aged 17-24 years were more likely than other age groups to mention “The Ref”
(41%) and “Unibar (Hobart)” (19%).
“Lazenby’s” was most highly mentioned as a UTAS venue used by academic and professional staff
members (49% and 46%, respectively), whilst “Degrees Restaurant” was also mentioned by high
percentages of these demographic groups (21% and 22%, respectively). Professional staff were more
likely to use “The Ref” (40%), when compared to other respondent types, whilst part-time students were
the most likely to mention “Cradle Coast Café” (11%).

7
University of Tasmania – Catering Research Report I EMRS
2.2 Catering Venues Used Most Often
All respondents who used at least one venue were then asked;
Which of these UTAS venues do you use most often?
Similar to the previous question, the venues mentioned as being used most often by respondents were
“Lazenby’s” (25% stated this as the venue they used most often), closely followed by “The Ref” (23%).
The “Uni Café”, “Coffee Shop” and “Cradle Coast Café” were also mentioned by slightly higher
percentages of respondents as the venue they used most often (15%, 7% and 6%, respectively).
4%
1%
3%
3%
4%
5%
5%
6%
7%
15%
23%
25%
0 5 10 15 20 25 30
None of the above
Uni bar (Launceston)
Commec Café
Unibar (Hobart)
Centre for The Arts Café
Law Cafe
Degrees Restaurant
Cradle Coast Café
Coffee Shop
Uni Café
The Ref
Lazenby’s
Chart 2 – Catering Venues Used Most Often (Percentage of respondents)
Total (n=3241)

8
University of Tasmania – Catering Research Report I EMRS
Table 3 – Catering Venues Used Most Often (Percentage of each demographic group)*
Demographic Group
Catering Venues (n=3241)
Laze
nb
y’s
The
Re
f
Un
i Caf
é
(Lau
nce
sto
n)
Co
ffee
Sh
op
Cra
dle
Co
ast
Caf
é
Law
Caf
é
Deg
ree
s
Res
tau
ran
t
Cen
tre
for
The
Art
s C
afé
Co
mm
ec C
afe
Un
ibar
(H
ob
art)
Un
ibar
(Lau
nce
sto
n)
No
ne
of
the
abo
ve
Total 25 23 15 7 6 5 5 4 3 3 1 4
Age
17-24 years 18 28 18 3 3 9 4 4 4 5 1 4
25-39 years 25 25 14 8 7 2 5 3 4 4 1 3
40-54 years 31 15 13 10 9 2 7 6 2 1 0 4
55 years or over 39 16 8 7 5 3 10 6 2 1 0 4
Study Status
Full-time student 20 24 19 6 5 6 4 5 4 5 1 4
Part-time student 30 15 12 7 13 3 4 7 3 4 1 3
Staff member – Academic 37 18 8 6 6 2 11 4 3 1 0 4
Staff member – Professional 30 28 10 10 4 2 8 2 2 0 0 3
Campus
Sandy Bay 41 38 0 0 0 8 0 1 5 5 0 2
School of Arts (Hunter Street) 2 2 - - - 1 1 91 - 2 - 2
Medical Sciences (Hobart City) 39 25 - - - 2 2 - 1 16 1 14
Conservatorium 41 18 6 - - - - 6 6 18 - 6
Newnham 1 1 50 23 0 - 17 - 0 0 2 6
Inveresk 4 - 36 20 - - 22 - - - 10 8
Cradle Coast - 1 2 1 93 - - - 1 - 1 3
Other 29 5 14 5 4 2 13 9 - 4 2 14 *Percentages may not add to 100% due to rounding
Respondents aged 55 years or over and academic staff members were most likely to indicate they used
“Lazenby’s” most often (39% and 37%, respectively). “Cradle Coast Café” was mentioned most often by
part-time students (13% of these respondents indicated it was the venue they used most often), while
11% of academic staff members mentioned “Degrees Restaurant”.

9
University of Tasmania – Catering Research Report I EMRS
2.3 Frequency of Eating at a UTAS Location on Campus
All respondents were asked;
Approximately, how many days per week do you typically eat at a UTAS location on campus?
Nearly half (42%) of respondents stated that they would typically eat at a UTAS location on campus
“once a week”, while more than one quarter stated “2-3 days a week”. Just 8% would eat at a UTAS
location “4-5 days a week”, while more than one fifth (22%) said they “never” eat at a UTAS location on
campus.
42%
28%
8%
22%
0
5
10
15
20
25
30
35
40
45
50
Once a week 2-3 days a week 4-5 days a week Never
Chart 3 – Frequency of Eating at a UTAS Location on Campus (Percentage of respondents)
Total (n=4075)

10
University of Tasmania – Catering Research Report I EMRS
Table 4 – Frequency of Eating at a UTAS Location on Campus (Percentage of each demographic group)*
Demographic Group Frequency (n=4075)
Once a week 2-3 days a
week 4-5 days a
week Never
Total 42 28 8 22
Age
17-24 years 39 32 9 20
25-39 years 43 28 6 23
40-54 years 45 25 7 24
55 years or over 48 23 7 23
Study Status
Full-time student 39 33 9 19
Part-time student 47 23 3 28
Staff member – Academic 44 21 9 26
Staff member – Professional 48 22 7 24
Campus
Sandy Bay 45 29 8 19
School of Arts (Hunter Street) 41 39 4 17
Medical Sciences (Hobart City) 36 15 4 45
Conservatorium 25 16 3 56
Newnham 42 32 10 17
Inveresk 34 12 4 51
Cradle Coast 48 34 3 16
Other 25 14 5 57 *Percentages may not add to 100% due to rounding
Respondents from the School of Arts (Hunter Street) were more likely than other demographic groups to
indicate they ate at a UTAS location on campus “2-3 days a week” (39%).
Part-time students and those from Medical Sciences (Hobart City), the Conservatorium, Inveresk and
those from “other” campuses were more likely to say they “never” eat at a UTAS location, when
compared to other demographic groups (28%, 45%, 56%, 51% and 57%, respectively).

11
University of Tasmania – Catering Research Report I EMRS
68%
19%
3% 1%
10%
0
10
20
30
40
50
60
70
80
1 per day 2 per day 3 per day 4 or more per day Rarely/ never eat on campus
Chart 4 – Average Number of Meals or Snacks Eaten Per Day (Percentage of respondents)
Total (n=3176)
2.4 Average Number of Meals or Snacks Eaten Per Day
All respondents were asked;
On the days that you eat on campus at a UTAS location, approximately how many meals and/or snacks per day do you typically eat?
Just over two thirds (68%) of respondents stated they would have just one meal or snack per day from a
UTAS venue, while nearly one fifth (19%) stated “2 per day”. 10% of respondents indicated they would
“rarely/ never eat on campus”.

12
University of Tasmania – Catering Research Report I EMRS
Table 5 – Average Number of Meals or Snacks Eaten Per Day
(Percentage of each demographic group)*
Demographic Group 1 per day 2 per day 3 per day
4 or more per day
Rarely/ never eat on campus
Total 68 19 3 1 10
Age
17-24 years 66 21 4 1 8
25-39 years 69 18 3 1 9
40-54 years 70 18 1 0 11
55 years or over 69 15 5 1 14
Study Status
Full-time student 66 22 4 1 8
Part-time student 63 21 2 1 12
Staff member – Academic 70 14 1 1 14
Staff member – Professional 76 11 1 1 11
Campus
Sandy Bay 72 16 2 1 9
School of Arts (Hunter Street) 64 19 5 1 11
Medical Sciences (Hobart City) 69 12 3 1 16
Conservatorium 43 14 - - 43
Newnham 65 22 3 1 8
Inveresk 60 16 6 - 18
Cradle Coast 56 33 3 1 8
Other 59 21 6 - 15 *Percentages may not add to 100% due to rounding
76% of professional staff members indicated they would typically eat “1 meal or snack per day”,
compared to a total average of 68%. Those from the Cradle Coast were more likely than other
demographics to state “2 per day” (33%), while respondents from the Conservatorium, and those from
Inveresk showed higher percentages stating that they “rarely/ never eat on campus” (43% and 18%,
respectively”.

13
University of Tasmania – Catering Research Report I EMRS
2.5 Overall Rating of Aspects for Current UTAS Catering Venues
All respondents were then asked;
Overall, how would you rate the catering venue you use most in terms of the taste, quality,
variety and value for money of food offered?
More than one third (39%) of respondents indicated they would rate the catering venue they most used
as “average” in terms of the taste, quality, variety and value for money of the food offered. Just under
one third (30%) stated it was “good”, while 5% claimed the food at their most used UTAS venue was
“excellent”. Altogether, 35% rated their most used venue “excellent” or “good”, while 25% stated it was
“below average” or “poor”.
Table 6 – Overall Rating for Catering Venues Used Most Often (Percentage of each demographic group)*
Demographic Group
Catering Venues (n=3176)
Tota
l
Laze
nb
y’s
The
Re
f
Un
i Caf
é
(Lau
nce
sto
n)
Co
ffee
Sh
op
Cra
dle
Co
ast
Caf
é
Law
Caf
é
Deg
ree
s
Res
tau
ran
t
Cen
tre
for
The
Art
s C
afé
Co
mm
ec C
afe
Un
ibar
(H
ob
art)
Un
ibar
(Lau
nce
sto
n)
Excellent 5 5 3 3 5 7 2 8 1 4 6 8
Good 30 30 29 30 30 36 25 39 18 21 43 23
Average 39 39 42 40 45 27 40 33 38 51 33 54
Below Average 15 16 16 15 14 16 18 12 15 13 15 12
Poor 10 10 9 12 6 13 15 8 25 10 5 4
Unsure 1 0 0 1 - 1 - 1 - - - -
5%
30%
39%
15%
10%
1%
0
5
10
15
20
25
30
35
40
45
Excellent Good Average Below Average Poor Unsure
Chart 5 – Overall Rating of Aspects for Current UTAS Catering Venues (Percentage of respondents)
Total (n=3176)

14
University of Tasmania – Catering Research Report I EMRS
2.6 Key Motivations to Eat at UTAS Catering Venues More Often All respondents were asked;
What would encourage you to eat on campus at a UTAS location more often?
The top three key motivations cited by respondents for eating at UTAS catering venues more often were
“greater value for money” (55%), “better variety of choices” (53%) and “better quality food” (51%).
Also highly mentioned was “flexible weekly opening hours” (27%), “nicer atmosphere” (18%) and
“friendlier service” (16%), while a smaller percentage each mentioned “faster service” (13%), “more
convenient locations” (12%) and “more available seating” (6%).
14%
6%
12%
13%
16%
18%
27%
51%
53%
55%
0 10 20 30 40 50 60
Other
More available seating
More convenient locations
Faster service
Friendlier service
Nicer atmosphere
Flexible weekly opening hours
Better quality food
Better variety of choices
Greater value for money
Chart 6 – Key Motivations to Eat at UTAS Catering Venues More Often (Percentage of respondents)
Total (n=4075)

15
University of Tasmania – Catering Research Report I EMRS
Table 7 – Key Motivations to Eat at UTAS Catering Venues More Often (Percentage of each demographic group)*
Demographic Group Key Motivations (n=4075)
Bet
ter
vari
ety
of
cho
ices
Bet
ter
qu
alit
y fo
od
Mo
re c
on
ven
ien
t
loca
tio
ns
Flex
ible
we
ekly
op
enin
g h
ou
rs
Gre
ater
val
ue
for
mo
ney
Fast
er s
ervi
ce
Frie
nd
lier
serv
ice
Mo
re a
vaila
ble
seat
ing
Nic
er a
tmo
sph
ere
Oth
er
No
ne
Total 53 51 12 27 55 13 16 6 18 14 6
Age
17-24 years 53 53 16 31 71 14 21 8 18 11 2
25-39 years 55 52 11 26 54 11 14 5 17 13 5
40-54 years 53 49 8 24 41 13 13 4 19 18 7
55 years or over 43 42 12 25 35 12 9 4 19 15 14
Study Status
Full-time student 52 50 15 29 65 13 17 7 17 12 3
Part-time student 45 42 8 25 41 12 13 6 15 17 12
Staff member – Academic 55 58 10 31 36 11 11 3 25 22 8
Staff member – Professional 57 56 10 23 50 12 16 3 21 13 7
Campus
Sandy Bay 51 53 12 27 59 10 16 6 20 14 5
School of Arts (Hunter Street) 80 68 1 46 46 13 11 2 27 20 1
Medical Sciences (Hobart City) 47 43 32 30 55 7 9 9 11 15 5
Conservatorium 25 28 38 22 31 3 9 - 16 22 6
Newnham 54 53 7 25 55 20 21 4 18 12 5
Inveresk 36 42 46 30 46 6 14 7 19 15 3
Cradle Coast 72 40 0 27 45 11 3 0 5 10 9
Other 35 39 22 22 44 12 13 8 11 20 16 *Percentages may not add to 100% due to rounding
Respondents aged 17-24 years were more likely than other age groups to be motivated to eat more
often at a UTAS location by “greater value for money” (71%, along with 65% of those classed as a full-
time student) and “friendlier service” (21%), while those aged 55 years or over were more likely than
other age groups to cite no motivations that would encourage them to eat more on campus.
Academic staff members were more likely than other respondent types to state “better quality food”
(58%) and “nicer atmosphere” (25%).
16
University of Tasmania – Catering Research Report I EMRS
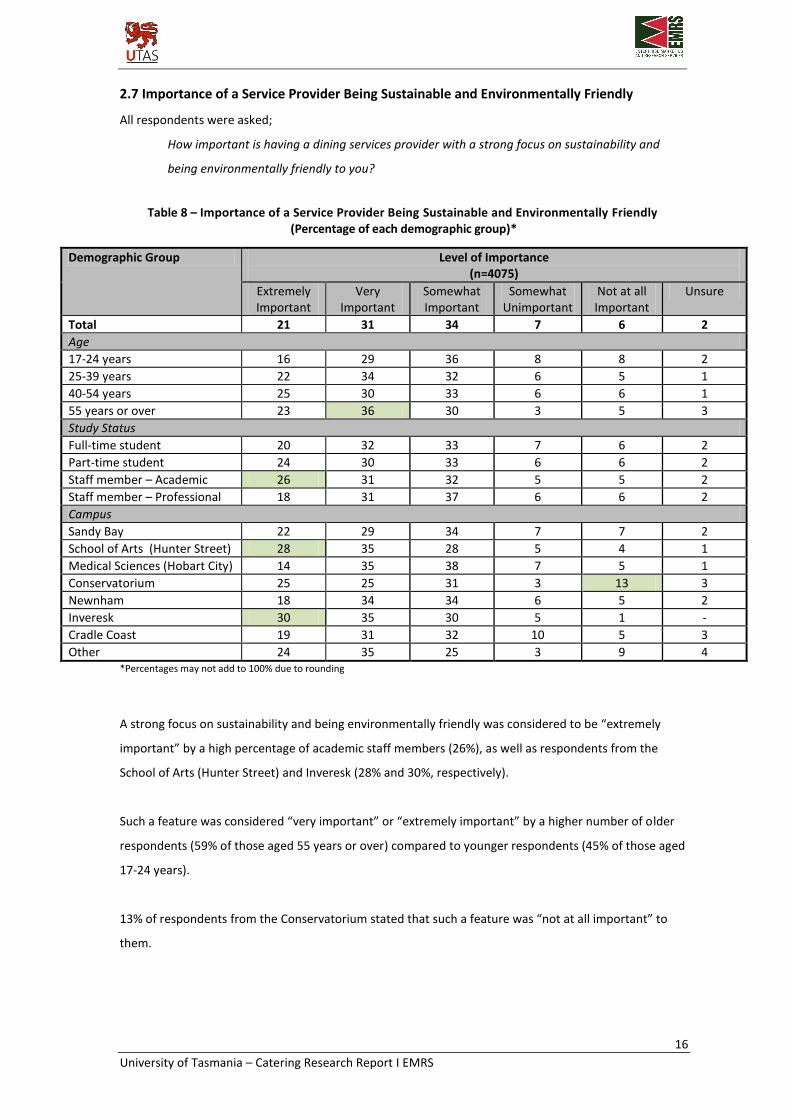
2.7 Importance of a Service Provider Being Sustainable and Environmentally Friendly
All respondents were asked;
How important is having a dining services provider with a strong focus on sustainability and
being environmentally friendly to you?
Table 8 – Importance of a Service Provider Being Sustainable and Environmentally Friendly
(Percentage of each demographic group)*
Demographic Group Level of Importance (n=4075)
Extremely Important
Very Important
Somewhat Important
Somewhat Unimportant
Not at all Important
Unsure
Total 21 31 34 7 6 2
Age
17-24 years 16 29 36 8 8 2
25-39 years 22 34 32 6 5 1
40-54 years 25 30 33 6 6 1
55 years or over 23 36 30 3 5 3
Study Status
Full-time student 20 32 33 7 6 2
Part-time student 24 30 33 6 6 2
Staff member – Academic 26 31 32 5 5 2
Staff member – Professional 18 31 37 6 6 2
Campus
Sandy Bay 22 29 34 7 7 2
School of Arts (Hunter Street) 28 35 28 5 4 1
Medical Sciences (Hobart City) 14 35 38 7 5 1
Conservatorium 25 25 31 3 13 3
Newnham 18 34 34 6 5 2
Inveresk 30 35 30 5 1 -
Cradle Coast 19 31 32 10 5 3
Other 24 35 25 3 9 4 *Percentages may not add to 100% due to rounding
A strong focus on sustainability and being environmentally friendly was considered to be “extremely
important” by a high percentage of academic staff members (26%), as well as respondents from the
School of Arts (Hunter Street) and Inveresk (28% and 30%, respectively).
Such a feature was considered “very important” or “extremely important” by a higher number of older
respondents (59% of those aged 55 years or over) compared to younger respondents (45% of those aged
17-24 years).
13% of respondents from the Conservatorium stated that such a feature was “not at all important” to
them.

17
University of Tasmania – Catering Research Report I EMRS
Section Three – Choice of Food Offerings
3.1 Food Options Respondents Would Like to see More of on Campus
All respondents were asked;
What food options would you like to see more of on campus?
When asked which food options they would like to see more of on campus, nearly half of respondents
each mentioned “international foods” (48%), “light and healthy snacks” (47%) and “light and healthy
salads” (46%).
Mentioned by just over one third of respondents each were “fruit juices/ smoothies” (36%) and
“specialty coffee/ coffee shop” (34%), while over one quarter each mentioned “sandwiches” and “fresh
prepared fruit” (29% each), “vegetarian/vegan options” (28%) and “home-style comfort foods” (27%).
Just 13% of respondents stated they would like to see more “burger/fries” options on campus.
3%
9%
13%
27%
28%
29%
29%
34%
36%
46%
47%
48%
0 10 20 30 40 50 60
Unsure
Other
Burger/ fries
Home-style comfort foods
Vegetarian/ vegan options
Fresh prepared fruit
Sandwiches
Specialty coffee/ coffee shop
Fruit juices / smoothies
Light and healthy salads
Light and healthy snacks
International foods
Chart 7 – Food Options Respondents Would Like to See More of on Campus (Percentage of respondents)
Total (n=4075)

18
University of Tasmania – Catering Research Report I EMRS
Table 9 – Food Options Respondents Would Like to see More of on Campus (Percentage of each demographic group)*
Demographic Group Types of Food Offering (n=4075)
Inte
rnat
ion
al
foo
ds
Ligh
t an
d h
ealt
hy
snac
ks
Ligh
t an
d h
ealt
hy
sala
ds
Fru
it ju
ices
/
smo
oth
ies
Spec
ialt
y co
ffee
/
coff
ee s
ho
p
Fres
h p
rep
ared
fru
it
San
dw
ich
es
Veg
etar
ian
/ ve
gan
op
tio
ns
Ho
me-
styl
e
com
fort
fo
od
s
Bu
rger
/ fr
ies
Oth
er
Un
sure
Total 48 47 46 36 34 29 29 28 27 13 9 3
Age
17-24 years 45 46 39 46 30 29 34 23 32 22 6 3
25-39 years 51 45 45 35 34 29 29 28 27 13 10 3
40-54 years 47 51 55 30 38 29 24 34 20 4 13 3
55 years or over 48 46 53 18 38 33 23 30 18 1 9 6
Study Status
Full-time student 48 45 39 41 30 28 32 25 30 18 7 3
Part-time student 42 47 52 31 34 29 26 35 23 10 10 5
Staff member – Academic 55 49 54 28 44 32 22 35 19 5 11 4
Staff member – Professional 47 50 56 32 39 30 26 28 24 6 13 3
Campus
Sandy Bay 51 45 44 36 37 27 28 29 24 15 9 3
School of Arts (Hunter Street) 49 51 58 44 39 42 32 45 33 10 18 2
Medical Sciences (Hobart City) 46 49 49 39 33 30 33 27 24 12 9 2
Conservatorium 41 56 56 38 44 38 25 34 19 13 3 6
Newnham 45 49 44 35 28 29 28 24 28 11 9 4
Inveresk 58 44 41 38 40 33 29 38 32 6 12 2
Cradle Coast 30 51 60 41 31 38 29 24 40 18 11 2
Other 45 37 43 31 25 31 25 26 21 7 8 10 *Percentages may not add to 100% due to rounding
Respondents aged 17-24 years had a strong preference for seeing more “fruit juices/ smoothies”,
“sandwiches”, “home-style comfort foods” and “burger/ fries”.
“Light and healthy salads” were mentioned by higher percentages of those aged 40 years or above, along
with those classed as a “part-time student”, academic or professional staff member.
More “vegetarian/ vegan options” were stated by a high number of respondents who were part-time
students or academic staff members.

19
University of Tasmania – Catering Research Report I EMRS
3.2 Types of International Foods Respondents Would Like to see More of on Campus
All respondents were asked;
What international foods would you like to see more of on campus?
When asked which types of international foods respondents would like to see more of on campus, the
majority (78%) stated “Asian” foods, while 56% each stated “Japanese” and “Indian”.
44% of respondents mentioned “Greek/ Mediterranean” foods, while 43% stated “Italian”.
2%
9%
43%
44%
56%
56%
78%
0 10 20 30 40 50 60 70 80
Unsure
Other
Italian
Greek / Mediterranean
Indian
Japanese
Asian
Chart 8 – Type of International Foods Respondents Would Like to see More of on Campus (Percentage of respondents)
Total (n=1945)

20
University of Tasmania – Catering Research Report I EMRS
3.3 Importance of Having Nationally Recognised Brands
All respondents were asked;
When considering new food options on campus, how important is having nationally-recognized brands?
Table 10 – Importance of Having Nationally Recognised Brands
(Percentage of each demographic group)*
Demographic Group Extremely Important
Very Important
Somewhat Important
Somewhat Unimportant
Not at all Important
Total 4 11 29 18 38
Age
17-24 years 5 13 36 20 26
25-39 years 4 12 28 18 39
40-54 years 4 8 22 18 49
55 years or over 4 11 18 16 51
Study Status
Full-time student 5 14 32 19 30
Part-time student 4 10 26 18 42
Staff member – Academic 2 5 17 17 60
Staff member – Professional 3 8 27 18 44
Campus
Sandy Bay 4 10 27 19 41
School of Arts (Hunter Street) 4 4 26 16 50
Medical Sciences (Hobart City) 5 9 29 18 40
Conservatorium - 19 22 13 47
Newnham 5 14 32 18 32
Inveresk 5 11 30 24 30
Cradle Coast 6 11 34 21 28
Other 4 15 23 16 43 *Percentages may not add to 100% due to rounding
Overall, just 4% of respondents felt it “extremely important” having nationally-recognised brands when
considering new food options on campus, with 11% saying it was “very important”. More than half
(56%) considered it to be “somewhat unimportant” or “not at all important”.
Respondents from the Conservatorium were more likely than other demographic groups to feel that
having nationally-recognised brands was “very important” (19%), while those aged 17-24 years were
more likely to state that this was “somewhat important” (36%).
Older students and professional staff members were most likely to cite this as being “not at all
important”.

21
University of Tasmania – Catering Research Report I EMRS
3.4 Respondents’ Associations with the Word “Value”
All respondents were asked;
When you think about the word “value” in relation to food and drink what comes to mind?
More than three quarters of respondents each mentioned “price” or “food quality” (78% and 77%,
respectively) when asked what came to mind when thinking about the word “value”.
Nearly half of respondents each mentioned “portion size” (48%) and “taste” (46%), while 17%
mentioned “variety”, 13% stated “service” and 7% made reference to “location/ convenience” (7%).
0%
2%
7%
13%
17%
46%
48%
77%
78%
0 10 20 30 40 50 60 70 80
Unsure
Other
Location/ convenience
Service
Variety
Taste
Portion size
Food quality
Price
Chart 9 – Value (Percentage of respondents)
Total (n=4075)

22
University of Tasmania – Catering Research Report I EMRS
Section Four – UTAS Vending
4.1 Frequency of Purchasing Products from UTAS Vending
All respondents were asked;
Do you purchase products from UTAS vending?
51% of respondents stated that they “occasionally” purchase from UTAS vending, while 5% “regularly”
did so. 44% of respondents stated that they “never” purchased products from UTAS vending.
44%
51%
5%
0
10
20
30
40
50
60
Never Occasionally Regularly
Chart 10 – Purchasing Products from UTAS Vending (Percentage of respondents)
Total (n=4075)

23
University of Tasmania – Catering Research Report I EMRS
Table 11 – Frequency of Purchasing Products from UTAS Vending (Percentage of each demographic group)*
Demographic Group Never Occasionally Regularly
Total 44 51 5
Age
17-24 years 28 63 9
25-39 years 44 52 5
40-54 years 58 40 2
55 years or over 69 31 1
Study Status
Full-time student 32 60 8
Part-time student 50 46 4
Staff member – Academic 60 39 1
Staff member – Professional 62 36 2
Campus
Sandy Bay 41 54 6
School of Arts (Hunter Street) 29 63 9
Medical Sciences (Hobart City) 60 39 2
Conservatorium 47 50 3
Newnham 50 46 4
Inveresk 24 63 13
Cradle Coast 38 57 5
Other 58 39 3 *Percentages may not add to 100% due to rounding
The younger the respondent, the more likely they were to purchase a product from UTAS vending, while
full-time students also were more likely to do so.
Respondents most likely to purchase products from UTAS vending “occasionally” or “regularly” were
those aged 17-24 years (72%) and respondents from Inveresk (76%).
24
University of Tasmania – Catering Research Report I EMRS
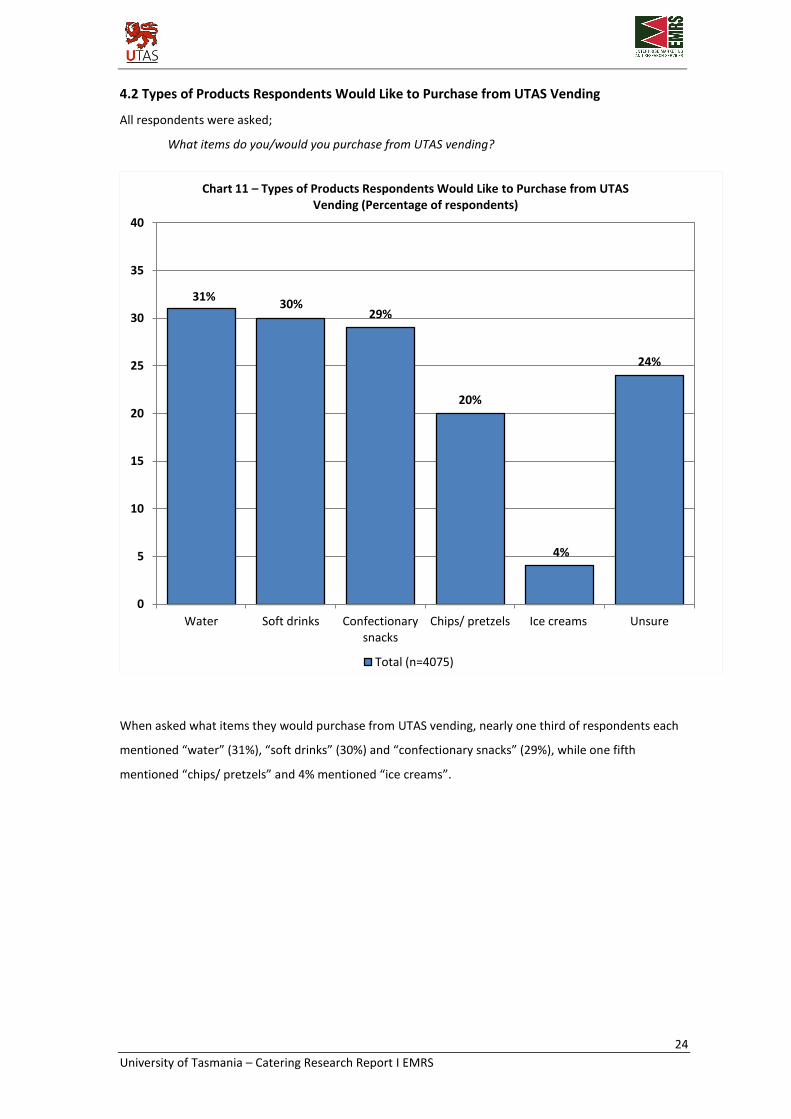
4.2 Types of Products Respondents Would Like to Purchase from UTAS Vending
All respondents were asked;
What items do you/would you purchase from UTAS vending?
When asked what items they would purchase from UTAS vending, nearly one third of respondents each
mentioned “water” (31%), “soft drinks” (30%) and “confectionary snacks” (29%), while one fifth
mentioned “chips/ pretzels” and 4% mentioned “ice creams”.
31% 30%
29%
20%
4%
24%
0
5
10
15
20
25
30
35
40
Water Soft drinks Confectionary snacks
Chips/ pretzels Ice creams Unsure
Chart 11 – Types of Products Respondents Would Like to Purchase from UTAS Vending (Percentage of respondents)
Total (n=4075)

25
University of Tasmania – Catering Research Report I EMRS
Section Five – Branded Outlets off Campus
5.1 Visiting Branded Outlets off Campus
All respondents were asked;
When you are off campus, which branded outlets do you visit on a regular basis?
When asked which branded outlets respondents visit on a regular basis when off campus, more than one
quarter (27%) mentioned “Subway”, followed by just over one fifth (21%) mentioning “McDonalds”.
Other outlets such as “KFC”, “Boost Juice” and “Gloria Jeans” were all mentioned by at least 10%, while
9% of respondents each mentioned “Hudsons” and “Hungry Jacks”.
More than one third (39%) stated that they visited no other outlets on a regular basis.
39%
10%
9%
9%
10%
11%
13%
21%
27%
0 10 20 30 40 50
None
Other
Hungry Jacks
Hudsons
Gloria Jeans
Boost Juice
KFC
McDonalds
Subway
Chart 12 – Visiting Branded Outlets Off Campus (Percentage of respondents)
Total (n=4075)

26
University of Tasmania – Catering Research Report I EMRS
Appendix A - The Questionnaire
UTAS Catering Research Questionnaire Online Survey
The University of Tasmania (UTAS) has engaged an independent research company, EMRS to conduct research about catering requirements and preferences on campus. The purpose of this survey is to engage students and staff and provide the opportunity to offer feedback on what your preferences in food and drink are, but also include discussion on the availability of places to socialise and the opening hours of various offerings. The survey should take no longer than 5 minutes to complete and all of the information you provide will remain confidential to the research team. Thank you for your co-operation to assist us in this important project.
1. Are you… 1. Male 2. Female
2. Are you aged between… 1. 17 to 24 years 2. 25 to 39 years 3. 40 to 54 years 4. 55 years and over
3. What is your current status at UTAS? 1. Full-time student 2. Part-time student 3. Staff member - Academic 4. Staff member - Professional
4. At which UTAS campus do you spend the majority of your time?
1. Sandy Bay 2. School of Arts (Hunter Street) 3. Medical Sciences (Hobart City) 4. Conservatorium 5. Newnham 6. Inveresk 7. Cradle Coast 8. Other (Please specify) 9. Campus not in Tasmania
4a. Other (Please specify)
RECORD IN DETAIL
5. Where do you currently live? ASK ONLY THOSE ANSWERING ‘1’ OR ‘2’ TO Q3 NEED TO ANSWER – OTHERS GO TO Q7
1. On-campus accommodation 2. Off-campus rental accommodation 3. Off-campus non-rental accommodation
6. Would you describe yourself as a...
1. Tasmanian student 2. Student from mainland Australia or New Zealand 3. International student

27
University of Tasmania – Catering Research Report I EMRS
7. Which of the following UTAS venues do you use? PLEASE SELECT ANY THAT YOU’VE VISITED 7a. Which of the following UTAS venues do you use MOST OFTEN? SELECT ONE ONLY
1. Lazenby’s (Hobart) 2. The Ref (Hobart) 3. Law Cafe (Hobart) 4. Commec Cafe (Hobart) 5. Unibar (Hobart) 6. Centre for The Arts Cafe (Hobart) 7. Uni Cafe (Launceston) 8. Degrees Restaurant (Launceston) 9. Coffee Shop (Launceston) 10. Unibar (Launceston) 11. Cradle Coast Cafe 12. None of the above
8. Approximately, how many days per week do you typically eat at a UTAS venue on campus?
1. Never 2. Once a week 3. 2-3 days a week 4. 4-5 days a week
9. On the days that you eat on campus at a UTAS location, approximately how many meals and/or snacks per day do you typically eat?
1. Rarely/Never eat on campus 2. 1 a day 3. 2 a day 4. 3 a day 5. 4 or more a day
10. Overall, how would you rate the catering venue you use most in terms of the taste, quality, variety and value for money of food offered?
1. Excellent 2. Good 3. Average 4. Below Average 5. Poor 6. Unsure
11. What would encourage you to eat on campus at a UTAS location more often? Multiple Response
1. Better variety of choices 2. Better quality food 3. More convenient locations 4. Flexible opening hours during the week 5. Greater value for money 6. Faster service 7. Friendlier service 8. More available seating 9. Nicer atmosphere 10. Other (Specify)
11a. Other (Specify)
RECORD IN DETAIL
12. How important is having a dining services provider with a strong focus on sustainability and being environmentally friendly to you?
1. Extremely important 2. Very important 3. Somewhat important 4. Somewhat unimportant 5. Not at all important

28
University of Tasmania – Catering Research Report I EMRS
13. What food options would you like to see more of on campus? Multiple Response
1. International foods 2. Sandwiches 3. Burger/ fries 4. Fruit juices / smoothies 5. Home-style comfort foods 6. Fresh prepared fruit 7. Light and healthy salads 8. Light and healthy snacks 9. Specialty coffee/ coffee shop 10. Vegetarian/ vegan options 11. Other (specify)
13a. Other (Specify)
RECORD IN DETAIL
Q14. What international foods would you like to see more of on campus?
1. Italian 2. Japanese 3. Greek/Mediterranean 4. Indian 5. Asian 6. Other (please specify)
Q14a. Other (Specify) RECORD IN DETAIL
Q15. When considering new food options on campus, how important is having nationally-recognised brands?
1. Extremely important 2. Very important 3. Somewhat important 4. Somewhat unimportant 5. Not at all important
Q16. When you think about the word “value” in relation to food and drink what comes to mind?
1. Price 2. Portion size 3. Food quality 4. Location/convenience 5. Service 6. Variety 7. Taste 8. Other (specify)
Q17. Do you purchase products from UTAS vending? 1. Never 2. Occasionally 3. Regularly
Q18. What items do you/would you purchase from UTAS vending?
1. Confectionary snacks 2. Chips/pretzels 3. Icecreams 4. Soft drinks 5. Water
Q19. When you are off campus, which branded outlets do you visit on a regular basis?
1. McDonalds 2. Subway 3. Gloria Jeans 4. Hudsons 5. Boost Juice 6. Hungry Jacks 7. KFC 8. Pizza Hut 9. Other (specify)
Finally, are there any other comments or suggestions you would like to make in relation to catering and food options on UTAS campuses? RECORD IN DETAIL