UNIVERSITY OF SOUTHAMPTON Faculty of Engineering, Science ... · LIST OF FIGURES vii 7.1 Two...
89
UNIVERSITY OF SOUTHAMPTON Faculty of Engineering, Science and Mathematics School of Electronics and Computer Science A group design project report submitted for the award of MEng Computer Science Supervisor: Professor Michael Butler and Colin Snook Examiner: Dr Mike Poppleton Extensions to UML-B Notation and Toolset by James Amor, Tim Lewy and Chris Lovell December 14, 2006
Transcript of UNIVERSITY OF SOUTHAMPTON Faculty of Engineering, Science ... · LIST OF FIGURES vii 7.1 Two...

UNIVERSITY OF SOUTHAMPTON
Faculty of Engineering, Science and Mathematics
School of Electronics and Computer Science
A group design project report submitted for the award of
MEng Computer Science
Supervisor: Professor Michael Butler and Colin SnookExaminer: Dr Mike Poppleton
Extensions to UML-B Notation and
Toolset
by James Amor, Tim Lewy and Chris Lovell
December 14, 2006

UNIVERSITY OF SOUTHAMPTON
ABSTRACT
FACULTY OF ENGINEERING, SCIENCE AND MATHEMATICS
SCHOOL OF ELECTRONICS AND COMPUTER SCIENCE
A group design project report submitted for the award of MEng Computer Science
by James Amor, Tim Lewy and Chris Lovell
The UML-B notation has been created as an attempt to combine the success and easeof use of UML, with the verification and rigorous development capabilities of formalmethods. However, the notation currently only supports a basic diagram set. To addressthis we have, in this project, designed and implemented a set of extensions to theUML-B notation that provide a much fuller software engineering experience, criticallymaking UML-B more appealing to industry partners. These extensions comprise fivenew diagram types, which are aimed at supplying a broader range of design capabilities,such as conceptual Use-Case design and future integration with the ProB animator tool.

Contents
Acknowledgements viii
1 Introduction 11.1 Project Brief . . . . . . . . . . . . . . . . . . . . . . . . . . . . . . . . . . 21.2 Project Scope . . . . . . . . . . . . . . . . . . . . . . . . . . . . . . . . . . 2
2 Background 42.1 Formal Methods . . . . . . . . . . . . . . . . . . . . . . . . . . . . . . . . 4
2.1.1 B-Method . . . . . . . . . . . . . . . . . . . . . . . . . . . . . . . . 42.1.2 ProB . . . . . . . . . . . . . . . . . . . . . . . . . . . . . . . . . . . 5
2.2 UML Design . . . . . . . . . . . . . . . . . . . . . . . . . . . . . . . . . . 52.3 UML-B . . . . . . . . . . . . . . . . . . . . . . . . . . . . . . . . . . . . . 62.4 Eclipse . . . . . . . . . . . . . . . . . . . . . . . . . . . . . . . . . . . . . . 6
2.4.1 RODIN . . . . . . . . . . . . . . . . . . . . . . . . . . . . . . . . . 72.4.2 EMF . . . . . . . . . . . . . . . . . . . . . . . . . . . . . . . . . . . 72.4.3 GEF and GMF . . . . . . . . . . . . . . . . . . . . . . . . . . . . . 8
3 Requirements 93.1 Activity Diagram . . . . . . . . . . . . . . . . . . . . . . . . . . . . . . . . 9
3.1.1 UML-B Specific Requirements . . . . . . . . . . . . . . . . . . . . 103.1.2 Uses in UML-B . . . . . . . . . . . . . . . . . . . . . . . . . . . . . 10
3.2 Component Diagram . . . . . . . . . . . . . . . . . . . . . . . . . . . . . . 113.2.1 UML-B Specific Requirements . . . . . . . . . . . . . . . . . . . . 123.2.2 Uses in UML-B . . . . . . . . . . . . . . . . . . . . . . . . . . . . . 12
3.3 Object Diagram . . . . . . . . . . . . . . . . . . . . . . . . . . . . . . . . . 123.3.1 UML-B Specific Requirements . . . . . . . . . . . . . . . . . . . . 133.3.2 Uses in UML-B . . . . . . . . . . . . . . . . . . . . . . . . . . . . . 13
3.4 Sequence Diagram . . . . . . . . . . . . . . . . . . . . . . . . . . . . . . . 143.4.1 UML-B Specific Requirements . . . . . . . . . . . . . . . . . . . . 153.4.2 Uses in UML-B . . . . . . . . . . . . . . . . . . . . . . . . . . . . . 16
3.5 Use-Case Diagram . . . . . . . . . . . . . . . . . . . . . . . . . . . . . . . 163.5.1 UML-B Specific Requirements . . . . . . . . . . . . . . . . . . . . 173.5.2 Uses in UML-B . . . . . . . . . . . . . . . . . . . . . . . . . . . . . 17
4 Editor Construction 194.1 Metamodel . . . . . . . . . . . . . . . . . . . . . . . . . . . . . . . . . . . 194.2 Graphical Model . . . . . . . . . . . . . . . . . . . . . . . . . . . . . . . . 214.3 Tooling Model . . . . . . . . . . . . . . . . . . . . . . . . . . . . . . . . . 22
ii

CONTENTS iii
4.4 Mapping Model . . . . . . . . . . . . . . . . . . . . . . . . . . . . . . . . . 224.5 Generation Model . . . . . . . . . . . . . . . . . . . . . . . . . . . . . . . 234.6 Extensions and Code Customization . . . . . . . . . . . . . . . . . . . . . 23
5 Design 255.1 Activity Diagram . . . . . . . . . . . . . . . . . . . . . . . . . . . . . . . . 25
5.1.1 Metamodel . . . . . . . . . . . . . . . . . . . . . . . . . . . . . . . 255.1.2 Activity . . . . . . . . . . . . . . . . . . . . . . . . . . . . . . . . . 265.1.3 Initial Node . . . . . . . . . . . . . . . . . . . . . . . . . . . . . . . 285.1.4 Decision . . . . . . . . . . . . . . . . . . . . . . . . . . . . . . . . . 285.1.5 Merge . . . . . . . . . . . . . . . . . . . . . . . . . . . . . . . . . . 285.1.6 Fork . . . . . . . . . . . . . . . . . . . . . . . . . . . . . . . . . . . 285.1.7 Join . . . . . . . . . . . . . . . . . . . . . . . . . . . . . . . . . . . 285.1.8 Flow Final . . . . . . . . . . . . . . . . . . . . . . . . . . . . . . . 285.1.9 Final Node . . . . . . . . . . . . . . . . . . . . . . . . . . . . . . . 295.1.10 Flow . . . . . . . . . . . . . . . . . . . . . . . . . . . . . . . . . . . 295.1.11 Technical Challenge . . . . . . . . . . . . . . . . . . . . . . . . . . 29
5.2 Component Diagram . . . . . . . . . . . . . . . . . . . . . . . . . . . . . . 315.2.1 Metamodel . . . . . . . . . . . . . . . . . . . . . . . . . . . . . . . 315.2.2 Component . . . . . . . . . . . . . . . . . . . . . . . . . . . . . . . 325.2.3 Interfaces . . . . . . . . . . . . . . . . . . . . . . . . . . . . . . . . 335.2.4 Interface Association . . . . . . . . . . . . . . . . . . . . . . . . . . 335.2.5 Component Association . . . . . . . . . . . . . . . . . . . . . . . . 345.2.6 Technical Challenges . . . . . . . . . . . . . . . . . . . . . . . . . . 34
5.3 Object Diagram . . . . . . . . . . . . . . . . . . . . . . . . . . . . . . . . . 345.3.1 Metamodel . . . . . . . . . . . . . . . . . . . . . . . . . . . . . . . 355.3.2 Object . . . . . . . . . . . . . . . . . . . . . . . . . . . . . . . . . . 365.3.3 Object Association . . . . . . . . . . . . . . . . . . . . . . . . . . . 375.3.4 Toolbar . . . . . . . . . . . . . . . . . . . . . . . . . . . . . . . . . 37
5.4 Sequence Diagram . . . . . . . . . . . . . . . . . . . . . . . . . . . . . . . 375.4.1 Metamodel . . . . . . . . . . . . . . . . . . . . . . . . . . . . . . . 375.4.2 Technical Challenges . . . . . . . . . . . . . . . . . . . . . . . . . . 39
5.4.2.1 Custom Shapes . . . . . . . . . . . . . . . . . . . . . . . . 405.4.2.2 Layout . . . . . . . . . . . . . . . . . . . . . . . . . . . . 415.4.2.3 Connection Anchors . . . . . . . . . . . . . . . . . . . . . 425.4.2.4 Ordered Links . . . . . . . . . . . . . . . . . . . . . . . . 43
5.5 Use-Case Diagram . . . . . . . . . . . . . . . . . . . . . . . . . . . . . . . 445.5.1 Metamodel . . . . . . . . . . . . . . . . . . . . . . . . . . . . . . . 445.5.2 Actor . . . . . . . . . . . . . . . . . . . . . . . . . . . . . . . . . . 455.5.3 Use-Case . . . . . . . . . . . . . . . . . . . . . . . . . . . . . . . . 465.5.4 System Box . . . . . . . . . . . . . . . . . . . . . . . . . . . . . . . 465.5.5 Links . . . . . . . . . . . . . . . . . . . . . . . . . . . . . . . . . . 46
5.6 Diagram Integration . . . . . . . . . . . . . . . . . . . . . . . . . . . . . . 47
6 Testing 486.1 Requirements Testing . . . . . . . . . . . . . . . . . . . . . . . . . . . . . 486.2 Testing Metamodel Design . . . . . . . . . . . . . . . . . . . . . . . . . . . 48

CONTENTS iv
6.3 Testing Diagram Behaviours . . . . . . . . . . . . . . . . . . . . . . . . . . 496.3.1 Testing the Component Layout Manager . . . . . . . . . . . . . . . 496.3.2 Testing the Sequence Layout Manager . . . . . . . . . . . . . . . . 496.3.3 Testing Link Management . . . . . . . . . . . . . . . . . . . . . . . 50
6.4 User Acceptance Testing . . . . . . . . . . . . . . . . . . . . . . . . . . . . 50
7 Future Work 517.1 Integration with a Model Animator . . . . . . . . . . . . . . . . . . . . . . 51
7.1.1 UML-B to Animation Script . . . . . . . . . . . . . . . . . . . . . 527.1.2 Animation to UML-B . . . . . . . . . . . . . . . . . . . . . . . . . 52
7.2 Model Refinement . . . . . . . . . . . . . . . . . . . . . . . . . . . . . . . 537.3 Error Notification . . . . . . . . . . . . . . . . . . . . . . . . . . . . . . . . 54
7.3.1 Activity Diagram . . . . . . . . . . . . . . . . . . . . . . . . . . . . 547.3.2 Sequence Diagram . . . . . . . . . . . . . . . . . . . . . . . . . . . 54
7.4 Custom Properties Windows . . . . . . . . . . . . . . . . . . . . . . . . . 557.5 Mathematical Notation . . . . . . . . . . . . . . . . . . . . . . . . . . . . 55
8 Project Management 568.1 Individual Roles . . . . . . . . . . . . . . . . . . . . . . . . . . . . . . . . 56
8.1.1 James Amor . . . . . . . . . . . . . . . . . . . . . . . . . . . . . . 568.1.2 Tim Lewy . . . . . . . . . . . . . . . . . . . . . . . . . . . . . . . . 578.1.3 Chris Lovell . . . . . . . . . . . . . . . . . . . . . . . . . . . . . . . 57
8.2 Group Dynamics . . . . . . . . . . . . . . . . . . . . . . . . . . . . . . . . 588.3 Work Plan Overview . . . . . . . . . . . . . . . . . . . . . . . . . . . . . . 598.4 Communication . . . . . . . . . . . . . . . . . . . . . . . . . . . . . . . . . 61
8.4.1 Communication with Supervisors and Customer . . . . . . . . . . 618.4.2 Communication between the Group . . . . . . . . . . . . . . . . . 61
9 Evaluation 639.1 Activity Diagram . . . . . . . . . . . . . . . . . . . . . . . . . . . . . . . . 639.2 Component Diagram . . . . . . . . . . . . . . . . . . . . . . . . . . . . . . 639.3 Object Diagram . . . . . . . . . . . . . . . . . . . . . . . . . . . . . . . . . 649.4 Sequence Diagram . . . . . . . . . . . . . . . . . . . . . . . . . . . . . . . 659.5 Use-Case Diagram . . . . . . . . . . . . . . . . . . . . . . . . . . . . . . . 65
10 Conclusions 6710.1 Project Outcome . . . . . . . . . . . . . . . . . . . . . . . . . . . . . . . . 6710.2 Project Management . . . . . . . . . . . . . . . . . . . . . . . . . . . . . . 68
Bibliography 69
A Testing Diagrams 1
B CD Listing 6B.1 Basic GMF Required Files . . . . . . . . . . . . . . . . . . . . . . . . . . . 6
B.1.1 Activity and Use-Case Diagram Special Case . . . . . . . . . . . . 7B.2 Integration Code . . . . . . . . . . . . . . . . . . . . . . . . . . . . . . . . 7B.3 Diagram Specific Code . . . . . . . . . . . . . . . . . . . . . . . . . . . . . 8

CONTENTS v
B.3.1 Activity Diagram . . . . . . . . . . . . . . . . . . . . . . . . . . . . 8B.3.2 Component Diagram . . . . . . . . . . . . . . . . . . . . . . . . . . 8B.3.3 Sequence Diagram . . . . . . . . . . . . . . . . . . . . . . . . . . . 9

List of Figures
2.1 Output from the ProB animator showing the animation of a system mon-itoring users being registered to a system and whether they are logged inor logged off. . . . . . . . . . . . . . . . . . . . . . . . . . . . . . . . . . . 5
3.1 An example of a Activity Diagram for a database of people with µB addedto the guard conditions for the activities. The Activities addPerson andremovePerson are protected by the Guard Conditions pp /∈ people and pp∈ people, which are defined using their ASCII equivalents. . . . . . . . . . 10
3.2 An example UML 2.0 Component Diagram showing the ‘ball and socket’join . . . . . . . . . . . . . . . . . . . . . . . . . . . . . . . . . . . . . . . . 11
3.3 An example UML 2.0 Object Diagram showing the make up of a systemmodelling a car. . . . . . . . . . . . . . . . . . . . . . . . . . . . . . . . . . 13
3.4 An example of a UML 2.0 Sequence Diagram showing the sequence ofevents involved in an email system. . . . . . . . . . . . . . . . . . . . . . . 14
3.5 An example of a Use-Case diagram for a shop . . . . . . . . . . . . . . . . 16
4.1 An extract from the EMF tree editor . . . . . . . . . . . . . . . . . . . . . 204.2 An extract from Sequence Diagram GMF Map, showing a nested node. . 23
5.1 The Activity Diagram Metamodel . . . . . . . . . . . . . . . . . . . . . . 275.2 Initial implementation of defining a Flow in the Activity Diagram. All
Activity Diagram elements generalize the UMLB AD Element. . . . . . . 305.3 Part of the Activity Diagram Metamodel that demonstrates how incoming
and outgoing Flows can be differentiated. The associations source andtarget are define whether a given Flow is coming from the element of goinginto the element. The associations incoming and outgoing define the setof incoming and the set of outgoing Flows an element has. . . . . . . . . . 31
5.4 The Component Diagram Metamodel . . . . . . . . . . . . . . . . . . . . 325.5 An example of a Component Diagram showing a configuration where
component i would snap down to the boundary line A, when it shouldsnap to B. . . . . . . . . . . . . . . . . . . . . . . . . . . . . . . . . . . . . 35
5.6 The Object Diagram Metamodel . . . . . . . . . . . . . . . . . . . . . . . 365.7 The Sequence Diagram Metamodel . . . . . . . . . . . . . . . . . . . . . . 385.8 The Sequence Proto Diagram . . . . . . . . . . . . . . . . . . . . . . . . . 395.9 A Custom Shape used in the Sequence Diagram . . . . . . . . . . . . . . . 405.10 Layout Manager behaviour in the Sequence Diagram. . . . . . . . . . . . . 415.11 Diagram showing connection behaviour in the Sequence Diagram. . . . . . 425.12 Diagram showing model link ordering in the Sequence Diagram. . . . . . . 435.13 The Use-Case Diagram Metamodel . . . . . . . . . . . . . . . . . . . . . . 45
vi

LIST OF FIGURES vii
7.1 Two Sequence Diagrams showing a restaurant scenario with a Customer,Waiter and Chef. In a UML-B Sequence Diagram these two diagramswould produce the same animation script, but are different in meaning.Diagram (a) shows a model where the originating Class of an event isdetermined by the last Class to accept an event, which produces themeaning that the Chef is ordering a drink. Diagram (b) shows the realmeaning that was required in this diagram, where it is a Customer whoorders a drink. . . . . . . . . . . . . . . . . . . . . . . . . . . . . . . . . . 53
8.1 The Initial Gantt Chart, produced during Week One . . . . . . . . . . . . 598.2 The Revised Gantt Chart, produced in Week Six . . . . . . . . . . . . . . 608.3 The Final Gantt chart . . . . . . . . . . . . . . . . . . . . . . . . . . . . . 60
A.1 Example of the Activity Diagram with all link types implemented. . . . . 2A.2 Example of the Component Diagram with all links, elements and nesting
features shown. . . . . . . . . . . . . . . . . . . . . . . . . . . . . . . . . . 3A.3 Example of the Object Diagram with all elements and links shown. . . . . 3A.4 Example of the Sequence Diagram with all elements and links shown. . . 4A.5 Example of the Use-Case Diagram with all link types implemented. Also
shown is the nesting ability of the System Boxes. Note that the linksbetween Use-Cases are not affected by whether the Use-Cases is inside aSystem Box or not, or whether two Use-Cases are inside the same SystemBox. . . . . . . . . . . . . . . . . . . . . . . . . . . . . . . . . . . . . . . . 5

Acknowledgements
The group would like to thank the following people for their help and input throughoutthis project:
Professor Michael Butler for supervising our project, guiding our projects focus andanalysing our designs.Colin Snook also for supervising our project and giving us an in-depth insight intoUML-B.Ian Johnson from AT Engine Controls Ltd. for his input into the requirements of theproject.Dr Mike Poppleton for his input through the progress seminars.Elisabeth Ball for demonstrating UML-B and answering our questions early on in theproject.
viii

Chapter 1
Introduction
As part of an ongoing effort to increase the uptake of formal methods and make themmore accessible to the wider community, a notation known as UML-B [25] is beingdeveloped. Discussed in detail in the following sections, the aim of this notation isessentially to combine the rigorous and formal capabilities of the B-notation [22] withthe ease of use and low barriers to entry of the widely used UML [18] methodology.
Along with the notation, a set of tools for the creating and application of the notationis required. Some have already been developed by the University of Southampton. Thefirst of these was based upon IBM’s Rational Rose package [23, 8], which is a packagefor the design and modelling of software systems. This provided an effective tool forconstructing models. However, being based on a proprietary and closed-source platform,meant the final tool lacked the openness and flexibility ideally required for such a toolto be successful. It also imposed a minimum level of investment upon anyone wishingto make use of it. The tool, nonetheless, provided proof of concept.
To address these issues a new tool was developed, based upon the highly popular andopen Eclipse platform [6] (also originally from IBM). Eclipse is an open source, Java-based, platform which is highly extensible. This provided a much friendlier environmentfor developing the tool. The Eclipse framework also includes several plug-in frameworkssuch as GMF and EMF (see Section 2.4) that provide an extended level of support forcreating model based tools and applications, such as the UML-B environment. Thesefactors, combined with the existing popularity of the platform, made it an ideal platformfor UML-B.
Developed as part of the RODIN project (see Section 2.4.1) the UML-B tool providessupport for the established range of UML-B notations. Now this is available, it is beingbrought to the attention of interested companies (such as AT Engine Controls Ltd., theindustrial partner to this project). As a result, it has become apparent that there is aneed to expand the UML-B notation to include other diagramming types such as theComponent, Sequence and Use-Case Diagrams.
1

Chapter 1 Introduction 2
The existing notations are very ‘B-orientated’ and they provide adequate functionalityfor a software engineer to perform diagrammatically, what could otherwise have beenachieved using formal methods. In this respect they achieve their goals. However, thereis little else to them; especially considering that UML-B is supposed to be UML extendedwith B connotations, rather than the other way round [4].
UML-B is sold as both a combination of and an alternative to formal methods andUML design. To fulfil this role, it must support the entire software engineering process,not just those parts requiring rigorous formalisation. As such new, extended notationsare being designed that will be aimed at enhancing UML-B as a software engineeringprocess. This is the aim of this project.
1.1 Project Brief
More formally, this project extends the UML-B tools currently available and allowsthe use of new diagrammatic models, which extend and enhance the use of UML-B. Itachieves this by first extending the existing UML-B metamodel and secondly, by pro-ducing Eclipse plug-ins to support the editing of new diagram types. The new diagramsare adapted from existing UML notations that were omitted from the original UML-Bspecification. The new diagrams that have been decided upon and implemented are:
• Activity diagram
• Component diagram
• Object diagram
• Sequence diagram
• Use-Case diagram
These new models are to be integrated with the existing UML-B models and tools, sothat the entire extended notation can be seamlessly utilised. The key requirement ofthese extensions is that they enhance the software engineering process, without raisingthe learning curve or introducing barriers to entry.
1.2 Project Scope
This project has been somewhat limited in scope due to restrictions in terms of timeand man power. The nature of the group project system, under which this work wascarried out, was such that the total time allowed for implementation was only ten weeksof part-time work, by three students. Bearing this in mind, it was decided that the

Chapter 1 Introduction 3
scope of this project would extend to fully designing and implementing new model anddiagram types for the UML-B notation. Originally, three new diagrams were proposed,but as the project progressed a further two were found to be necessary and the scopewas extended.
There is much more work that could be performed to further enhance the UML-Bnotation and toolset. Some thought has been given to this and several possibilities areoutlined in Section 7. In addition, though it was outside of the scope of the project, eachnew diagram has been evaluated for possible uses within the larger UML-B framework.These are presented together with some possible corresponding semantics for the variousdiagram elements.

Chapter 2
Background
2.1 Formal Methods
Formal methods are “mathematically based techniques for describing system proper-ties” [33] when designing a computer system. Formal methods are used to design andverify systems to try and ensure completeness of the system being designed. Due tothe high cost in terms of time taken to design a system using formal methods and theexpertise required from the system designers, formal methods are generally limited tobeing used in safety critical systems.
2.1.1 B-Method
The B-Method, designed by J.-R. Abrial [1], is a formal methods approach described bySchneider for “specification and development of computer software systems” [22]. TheB-Method takes aspects of formal systems design, such as Z, and has been designedas a simplification of other formal method approaches. In this project we discuss twovariations of the B-Method: Classic-B and Event-B. Classic-B is the name given toAbrial’s original B concept, where as Event-B [16] is an extension to B to allow for theformal design of distributed systems.
In Event-B, events replace the idea of operations in Classic-B. Events have guard con-ditions associated to them, similar to pre-conditions in Classic-B. In Event-B an eventcan be called at any time when the guard condition is true, meaning that events beingcalled is largely a random process.
The B-Method has been used to solve several large formal system designs, including thedesign of the Paris Metro Line 14’s Train Control System [5].
4

Chapter 2 Background 5
2.1.2 ProB
ProB is an animation and model checking tool for the B-Method [15]. Currently ProBis used in Classic-B model checking, however there is an intention for it to be modifiedto work with Event-B and then to be added to the RODIN platform.
ProB allows the user to create a Classic-B model and then provides various methodsfor consistency checking. The consistency checking in ProB is used to check that theinvariant is preserved throughout a given model’s lifetime. If the checker manages tofind a situation where the invariant has been violated, the checker stops and displaysin the animator the current state for the model. In this project we are less concernedabout the consistency checking element of ProB, other than for it to be the motivationfor using the ProB animator.
The ProB animator, as shown in Figure 2.1, shows for a given state, the current statesof all variables in the model, the available operations and the list of operations thatwere called to get to the given state. When an operation is called in the ProB animator,the state properties and the history are updated to reflect this and the invariant isrecalculated.
Figure 2.1: Output from the ProB animator showing the animation of a systemmonitoring users being registered to a system and whether they are logged in or logged
off.
2.2 UML Design
The Unified Modelling Language or UML [18] is a diagrammatic notation originallydeveloped in the 90’s by the Object Modelling Group to support object-oriented softwareengineers through the entire development process. The Unified name comes from thefact that UML was one of the first notations to bring together both object-orientedanalysis and design under a single model. With the help of significant early corporatebacking, UML has become a de facto standard, almost universally recognised withinthe industry. Unlike formal methods, which have been met with some resistance, UMLremains consistently popular and remains under development today [13].

Chapter 2 Background 6
The notation itself is very large, its current format (UML 2.0) encompasses 13 separatediagram types, each with well defined semantics. Even so, it is not considered to bestrict. The UML philosophy generally aims to provide flexibility, being an enablingtechnique rather than a constricting one.
An example of its usage: A software engineer might conceptualise his system usingUse-Case Diagrams, high level Class Diagrams and Activity Diagrams; perform detaileddesign it with Package Diagrams, lower level Class Diagrams and Deployment Diagrams;and produce blueprint designs with implementation level Class Diagrams, Timing Dia-grams and Sequence Diagrams. This is, of course, just an example usage: there are noregulations compelling you to use certain diagrams only in specific situations.
2.3 UML-B
UML-B [25] is being developed to try and bridge the gap between the UML designmodel and formal methods techniques. UML is a widely accepted design format andmany customers of software systems may expect to see it being used, whereas formalmethods is often seen as being unnecessary and costly. In the work carried out byAmey [2] it was reported that customers of software systems often did not like the ideaof formal methods being used, with some customers asking “couldn’t you use UML?”.UML-B brings the two together into a combined standard that provides the diagramsof UML, reinforced with added structure and formalisation. This allows B code to bemuch more easily constructed, via UML-B diagrams.
Currently UML-B has four UML style diagrams implemented, the Package, Context,Class and State Diagrams. By creating a package with a given context and classes,a system designer can start to design a system as they would in standard UML. Byadding state diagrams to classes to show how the events in classes operate, the designerhas got to a stage where they are close to defining the total functionality of a system.Finally a system designer must include an amount of formal mathematical logic, knownas µB [25], to the class and state diagrams to define how events occur and the guardsthat have to be true in order for the operation to take place.
When a system designer produces a the required UML-B diagrams along with theevents and guard conditions, UML-B can be used to automatically produce Event-Bcode through the U2B tool [23, 24].
2.4 Eclipse
The Eclipse Framework [6] is a project that started life as a product of IBM, aimed atreplacing their VisualAge development environment. In common with VisualAge, the

Chapter 2 Background 7
aim of the framework was to provide a platform on which integrated development envi-ronments (IDEs) can be based. Eclipse reached mass audience with the popularity [12]of its Java IDE, known as the JDT (Java Development Tool) [10]. However, this is onlyone of many plug-ins and its real power is as a platform.
Eclipse is now maintained independently from IBM by the Eclipse Foundation [26], anot-for-profit consortium of leading companies. It is one of the most popular develop-ment frameworks available today, with companies such as Adobe, Borland and SAP AGchoosing it as the basis for their upcoming products [20, 9, 21].
2.4.1 RODIN
The RODIN (Rigorous Open Development Environment for Complex Systems) project [19],is being developed to provide an Eclipse-based platform and open, extensible, environ-ment for formal systems specification. RODIN aims to encapsulate all aspects of formalsystem design and currently supports several plug-ins and components, such as UML-Band U2B.
With the RODIN UML-B plug-in, a user can define a system in UML-B through thePackage, Machine, Class and Sequence diagrams. RODIN then automatically translatesthe UML-B to Event-B using the U2B plug-in. Details of how the translations areperformed can be found in UML-B: Formal Modelling and Design Aided by UML [25].During this process any syntax errors are returned to the user through the problemareas, which are highlighted in red. The completed Event-B code can then be sent to aprover where automatic and semi-automatic proving takes place.
2.4.2 EMF
The Eclipse Modelling Framework (EMF) [28] is a framework for building model-basedtools and Eclipse plug-in applications. It includes facilities for both designing models andgenerating code that can be used as a back-end, upon which more advanced applicationscan be created. Diagram editors, especially structured ones such as those used in softwareengineering, are a classic example of a model based application. In this case the model’suse is obvious; it is used to store all the semantic information associated with a diagram,abstracted away from the details of presentation or formatting. The framework is notlimited to this use though, any Eclipse application that makes use of a model, definableon a class diagram, can take advantage of EMF.
By building an application based upon EMF, the developer enjoys a high level of com-patibility with modern CASE tools such as Rational Rose. There is also the advantageof reduced development time, allowing the framework to quickly and reliable generatequite straightforward code, which avoids an otherwise time consuming and laborious

Chapter 2 Background 8
process. This code can then be easily altered and maintained from the single model file,allowing potentially significant model changes to be made right the way through theimplementation process.
2.4.3 GEF and GMF
The Graphical Editing Framework [30] is a product of the Eclipse Tools Project [27],a major project within Eclipse aimed at developing and promoting the developmentof significant Eclipse-based tools and support utilities. GEF is a framework for moreeasily constructing rich EMF-based Graphical editors. It achieves this by implementingan extensible API, based on an MVC architecture, which provides control and viewcomponents [3, 17] that utilise an EMF model. A major aspect of the framework isthe Draw2D plug-in [14], which provides a diagram-centric layout and rendering toolkit,with an API specialised for creating diagram viewers and editors.
The theory behind GEF is that a programmer can develop a GEF implementation ofan editor more rapidly than a bespoke implementation. An advantage of this method,besides time saving, is that by using an established approach the application will besmoother and less susceptible to bugs. However, GEF has a high initial learning curveand as a result one must become an expert with it, in order to develop usable tools.
To address this issue the Graphical Modelling Framework (GMF) [31] was conceived.GMF is an additional plug-in to Eclipse, which provides an API and simple toolset forautomatically producing template GEF editors based on a supplied EMF model. UsingGMF anyone, even without significant programming skills, can produce a basic diagrameditor. The framework is broken down into four scripts, or models, that represent thedifferent aspects of an editor plug-in. These are the: Graphical Model, Tools Model,Mapping Model and the Generator Model, which handles configuration of the plug-initself. Each of these is composed of specific classes and associations that represent someelement of the diagram that, when processed, will be translated into fully implementedGEF code. To ease the process further, a set of Wizards are provided to easily createthe models in the correct sequence.
For more information on using GMF, see the official GMF tutorials [29]. Whilst initiallyuseful, these peer-reviewed documents can be confusing and are frequently lacking in keyareas. Therefore, to compliment this we have included our own overview of the GMFdiagram creation process in Chapter 4.

Chapter 3
Requirements
The requirements of both the new diagram types and the associated development toolsare detailed in this section. This reflects how the Project Brief will be realised andwhich aspects of the notations were assessed to be necessary and suitable for adoptioninto the UML-B notation. Any specific restrictions, extensions or changes made to thenotations are also outlined. These requirements directly drive the structure of the newmodels and so were highly important in developing the new metamodels and editors.
3.1 Activity Diagram
The Activity Diagram must look like the UML 2.0 Activity Diagram [7], as shown inthe example in Figure 3.1. The Activity Diagram must have elements for Initial Node,Activity, Fork, Join, Decision, Merge, Final Node, Flow Final along with a notion ofa flow linking the elements. This differs slightly from the UML 2.0 Activity Diagramby the removal of partitions in the UML 2.0 definition of the Activity Diagram. Theelements used in this Activity Diagram must look like their equivalents in the UML 2.0Activity Diagram.
Activities must have labels associated to them, which are linked to the Activities name.The label must be positioned inside the center of the Activity element and must resizeitself and the graphical component as the amount of text in the label increases. Flowsgoing into Activities must also have labels that are linked to the Guard Conditions forthe Activity the flow is going into.
All elements in the Activity Diagram have different requirements in terms of how manyFlows the element can receive and how many Flows the element can transmit. TheInitial Node allows no incoming Flows and at most one outgoing Flow. An Activityallows at most one incoming Flow and at most one outgoing Flow. A Fork allows oneincoming Flow and many outgoing Flows. A Join allows many incoming Flows but only
9

Chapter 3 Requirements 10
one outgoing Flow. A Decision allows one incoming Flow and many outgoing Flows. AMerge allows many incoming Flows but only one outgoing Flow. A Final Node allowsonly one incoming Flow and no outgoing Flow and the same is true for a Flow Finalelement.
Ideally there should be one tool in the Activity Diagram editor for creating a Flow andthe editor should be able to determine the starting and ending elements to determinewhether there are any constraints on the Flow.
There may only be at most one Initial Node in an Activity Diagram. Whilst there maybe any number of the other elements in an Activity Diagram.
Figure 3.1: An example of a Activity Diagram for a database of people with µB addedto the guard conditions for the activities. The Activities addPerson and removePersonare protected by the Guard Conditions pp /∈ people and pp ∈ people, which are defined
using their ASCII equivalents.
3.1.1 UML-B Specific Requirements
The Activity Diagram will be integrated with the other UML-B diagrams at severalpoints. These include with the UML-B Machine on the Package Diagram and on theClass element of the UML-B Class Diagram.
3.1.2 Uses in UML-B
The Activity Diagram is used more in early system design to determine how the systemmay operate. The Activity Diagram sits closely with the Use-Case Diagram to developinitial understanding on the problem being solved. In terms of relationships with UML-B, the Activity Diagram has not been given a specific purpose for processes such as U2Btranslation and is provided solely to help the user understand and model their system.

Chapter 3 Requirements 11
To allow flexibility of using the model, the Activity Diagram should be able to be definedin the machine and class levels of UML-B. Activity diagrams can also sit outside of amachine or class and be defined as their own entity.
3.2 Component Diagram
The Component Diagram must have a similar look and feel as a UML 2.0 ComponentDiagram, an example of which is shown in Figure 3.2. This requires that the Com-ponent Diagram uses Object, Required Interface and Provided Interface elements andAssociations between both Components, and Required and Provided Interface pairs
Components should be represented by a rectangular box with a component icon in thetop right corner and a name label. Components should also be able to nest within eachother.
Provided Interfaces should be represented by an unfilled circle and are attached to aComponent with a solid line. Required Interfaces should be represented by an opensemicircle and are attached to a Component with a solid line. Both Interface typesshould have a name label.
Figure 3.2: An example UML 2.0 Component Diagram showing the ‘ball and socket’join

Chapter 3 Requirements 12
Associations between Interface pairs should consist of one Provided Interface connectedto one Required Interface such that it results in the ‘ball and socket’ type join. Un-connected interfaces should be connected to their parent Component by a straight,perpendicular line and should be positioned close to their parent. The facility to con-nect together two unconnected interfaces to produce the ‘ball and socket’ join shouldbe provided. This action should be able to be undone; such that a pair of connectedinterfaces revert to their unconnected state.
Associations between Components should be represented by a solid line with no arrow.The Association should have an optional label.
3.2.1 UML-B Specific Requirements
To integrate the Component Diagram with the UML-B tool it needs to be linked to aPackage. The user should be able to right-click a package and create a new ComponentDiagram from the pop-up menu. Component Diagrams should also be creatable withoutthe need for an existing Package.
3.2.2 Uses in UML-B
A Component is representative of a Machine or Group of Machines. The diagram canbe used in UML-B to show the way the different parts of a system interact and whatInterfaces are be needed. This will be useful when a UML-B system is in the refiningprocess.
3.3 Object Diagram
The Object Diagram must have a similar look and feel as a standard UML 2.0 ObjectDiagram, as shown in Figure 3.3. This requires that the Object Diagram uses Objectelements and Associations between Objects.
The Object element should be represented as a rectangular box with a separate com-partment for the Object’s attributes. The Object should also have a Class Type and aName, which displayed as label with the format Name: ClassType. This should allowfor Objects without a defined Name, but not for Objects without a defined Class Type.Attributes for Objects should be displayed as AttributeName: Value. This should allowfor Attributes without a Value.
Associations between Objects should be represented by a solid line with no arrow headand should have an optional label to describe the relationship between the Objects.

Chapter 3 Requirements 13
Figure 3.3: An example UML 2.0 Object Diagram showing the make up of a systemmodelling a car.
3.3.1 UML-B Specific Requirements
To integrate the Object Diagram into the UML-B tool it must sit with the other availablediagrams and complement their functionality. This will be achieved by linking the ObjectDiagram to the existing UML-B tool in the several ways.
The Object Diagram should be attached to Machines and Contexts as it will providemodelling capabilities for both of these UML-B components. It should therefore bepossible for the user to create a new Object Diagram through the right-click menu optionsof a Machine or Context and for the created diagram to be linked to the parent. TheXMI produced from the Component Diagram should be contained within the existing.umlb XMI file.
The Object Diagram should allow the user to create a new Object as an instance ofan existing UML-B Class. This should be integrated into the right-click pop-up menusuch that the option is presented when the user right-clicks on an empty space in thediagram.
3.3.2 Uses in UML-B
The Object Diagram is used to model a static snapshot of a dynamic system. This givesit several possible uses in UML-B. Firstly, the diagram can be used as a model of acomplex system of entities to get an idea of ther structure as a first step in designing asystem. Secondly, the diagram can be used to model the relationship of Objects insidea UML-B Machine or Context. This could be useful to explain the way in which Classesinteract with each other. Thirdly, the Object Diagram can be used as a supplementarydiagram when a system is being animated. The diagram can show the state of the system

Chapter 3 Requirements 14
at any point during the animation and can be linked to an Event Call in a SequenceDiagram to show the state of the system up to that point in the diagram.
3.4 Sequence Diagram
The Sequence Diagram is used to depict a sequence of progressions and transitionsbetween various elements on the diagram, which are arranged as swim lanes runningfrom top to bottom (see Figure 3.4). In UML 2.0 the semantics correspond to ObjectOriented Design. The diagram shows method calls between Objects in a system. This isuseful in modelling the sequence of operations that make up some larger task or process.
Figure 3.4: An example of a UML 2.0 Sequence Diagram showing the sequence ofevents involved in an email system.
Syntactically, the Sequence Diagram is to look much the same as the UML 2.0 SequenceDiagram. The swim lanes represent Objects in the system (instances of the UML-BClasses). These are represented by a yellow box containing the Class name and Objectlabel, with a dotted line that extends vertically downwards, terminating with an X. Thelength of the line can be extended to accommodate varying lengths of diagram.
The activity boxes, which in UML 2.0 represent periods of activity within the Objectsare included in the diagram. However, in terms of UML-B, these are more to completethe look of the diagram than to add meaning. With the B language not being Object

Chapter 3 Requirements 15
Oriented, there is no real notion of Object life or activity. The Classes present in theUML-B diagram, when translated, are recreated procedurally using sets. The activityboxes are useful however, for providing an element to anchor links to.
There are two types of link present on the UML-B Sequence Diagram. Standard links,which reflect method calls in UML 2.0, now represent Event Calls (the closest equivalentto methods in Event-B). These are represented by a solid horizontal line, which runsfrom an area of activity in one object to that in another. The target end of the linkis decorated by an open arrow, as in the UML 2.0 version. The other type of link isa dotted line, in UML 2.0 this represents a method return. In UML-B this notation isincluded, partially to complete the illusion of object orientation and partly as it couldcorrespond to an animator backtrack.
Of all the UML 2.0 diagrams, the Sequence Diagram is probably the most restricted interms of appearance. The swim lanes, which correspond to Class instances, or Objects,should all be aligned on the same horizontal axis, with their upper boundaries at a fixeddistance from the edge of the canvas. The user may arrange the swim lane positionshorizontally, with the ability to change the spacing between them, but not move verti-cally. The activity boxes are locked to the centre of the swim lane’s dotted line, theycan be resized vertically but not horizontally.
3.4.1 UML-B Specific Requirements
The layout of the links on the diagram are to be more formalised than in UML 2.0.In UML 2.0 there are little rules or restrictions on how or where they can be placed.In UML-B the links are restricted so that they are also horizontal lines and there is astrict notion of sequence, which is the key aspect of the Sequence Diagram to record foroutput. Only one link may occupy any one vertical level on the diagram, this removesan ambiguity in determining the order of occurrence. The diagram editor will have toenforce this, providing functionality to automatically position and organise the links,depending on the order in which the user wishes to place them. The order will also needto be recorded persistently in the model file.
The diagram will be integrated with the existing notations. This will occur at twopoints. Firstly there will be a method of linking the diagram to Machines within theUML-B Package Diagram. A Machine effectively represents a collection of Classes, soit makes sense to link sequences of calls between these Classes to the relevant parentMachine. Secondly, within the Sequence Diagram itself there will be the ability to linkthe Object swim lanes to their corresponding Class elements and the Event Call links totheir corresponding Events, both of which will have been defined via the other diagrams.

Chapter 3 Requirements 16
3.4.2 Uses in UML-B
In UML-B we can use the sequence depicted in the diagram to actually drive a testanimation (see Section 7.1), which can then be run to verify the validity of the model.Achieving this would be relatively straightforward; an animation script could be gener-ated simply by reading the order that the Event Calls are recorded in.
3.5 Use-Case Diagram
The Use-Case Diagram must look like the UML 2.0 Use-Case Diagram [7], as shownin the example in Figure 3.5. Therefore the Use-Case Diagram must have elements forActors, Use-Cases and System Boxes. The elements in the Use-Case Diagram must looklike the elements in the UML 2.0 Use-Case diagram.
Figure 3.5: An example of a Use-Case diagram for a shop
The Actor, Use-Case and System Box elements must also have labels that are associatedto the to a property of the element. The labels must be positioned differently for eachelement in the Use-Case Diagram. The label in the Actor element is linked to the Actor’sname. The Actor label must sit below the actor and resize itself automatically if thetext in the label requires it to do so, without resizing the actor graphical figure. TheUse-Case label is linked to the Use-Case’s description. The Use-Case label must becentered inside the Use-Case graphical figure and the label must resize itself and theUse-Case figure as the amount of text in the label increases. The System Box label islinked to the System Box’s name. The System Box labels position is not critical so longas it can be read and distinguished as a label for the System Box.
The System Box must allow other System Box and Use-Case elements to be nestedinside of them as is allowed in the UML 2.0 Use-Case Diagram. The nesting must not

Chapter 3 Requirements 17
interfere with connections between Use-Cases or Actors. Actors cannot be nested insideof a System Box.
Actors representing the system are not a special element of the Use-Case diagram. Tocreate a System Actor, the system designer must add <<system>> to the actor’s namelabel.
The links between elements in the Use-Case Diagram are defined as being: a link froman Actor to a Use-Case; a link from a Use-Case to an Actor; a link between an Actor andanother Actor and three types of links from Use-Case to Use-Case, which are include,extend and generalize. All links in the Use-Case Diagram exist as a many to manyrelationship. The link from an Actor to a Use-Case show where an Actor is usinga particular Use-Case, this link is a continuous line with an open ended arrow headpointing at the Use-Case. The link from a Use-Case to an Actor shows when a Use-Caseinvokes or requires another Actor, this link is a continuous line with no arrow head. Thelink between two Actor elements is used to show one Actor generalizing another Actor,the link is a continuous line with a closed arrow head at the end. The include linkbetween two Use-Case elements shows where one Use-Case must invoke another Use-Case for it to complete its operation, this link is a continuous line with an open arrowhead pointing at the Use-Case being included. The include link also requires a pre-setuneditable label that contains the text “<<include>>”. The extend link between twoUse-Case elements shows where one Use-Case is an extension to the behaviours describedin the Use-Case being pointed to. The extend link is a continuous line with an openarrow head pointing at the Use-Case being extended. The extend link also requiresa pre-set uneditable label that contains the text “<<extend>>”. The generalize linkbetween two Use-Case elements allows the generalization of the Use-Case being pointedto. The generalize link requires a continuous line with a closed arrow head pointing atthe Use-Case being generalized.
3.5.1 UML-B Specific Requirements
The Use-Case diagram will have no semantic meaning within UML-B in terms of U2Btranslation, it is primarily a support notation (see Chapter 7). Use-Case diagrams shouldbe able to be created from both the package and machine elements.
3.5.2 Uses in UML-B
The Use-Case diagram is used as a high level system design tool and as such has no formalrole in UML-B in terms of U2B translation. The purpose of the Use-Case Diagram isto help the system designer in the design process and is included to help UML-B be acomplete solution in system design.

Chapter 3 Requirements 18
The Use-Case Diagram should be able to be created from the package and machinelevel in UML-B. The Use-Case Diagram should also work as a standalone diagram typewithin a UML-B project.

Chapter 4
Editor Construction
There are several steps that need to be taken to construct a diagram editor in the GMFframework. This process starts with the definition of a metamodel for the diagramand then moves into the definition of the Graphics, Tooling and Mapping models. AGenmodel is created from the Mapping model and is used to generate the diagram code.A short overview of diagram editor construction in GMF is given in the following section.
4.1 Metamodel
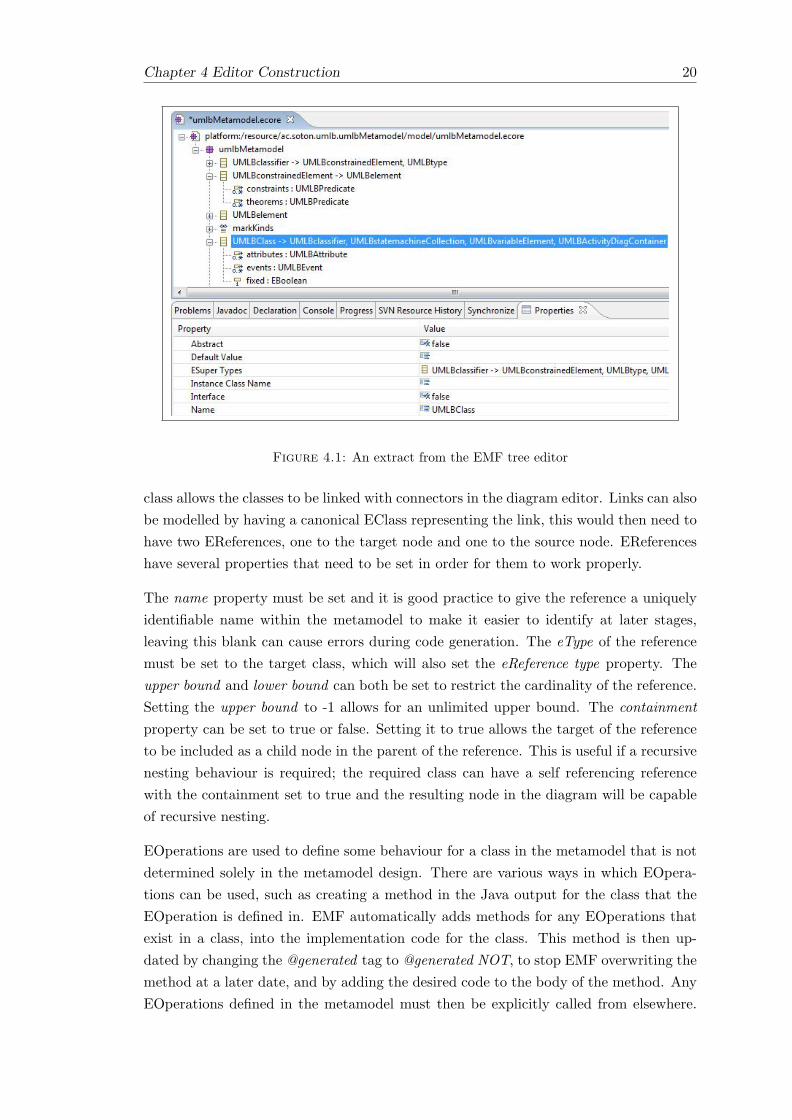
The EMF Metamodel for a diagram defines the way in which the diagram nodes caninteract with each other. The metamodel XMI format is known as an Ecore file, whichis a standard that exists outside of Eclipse; as such it is possible to define the metamodelexternally, using a tool such as Rational RSA. Within Eclipse there are three optionsfor editing the model: directly editing the XMI, which is useful for copying large blocksof the model between files; editing the model via the EMF tree editor, which providesa methodical and unambiguous approach (shown in Figure 4.1); and lastly using theGMF editor, this allows the model to be created using a class diagram-like viewer,which is extremely useful in aiding visualisation and conception (it is this viewer thatthe metamodel screenshots have been taken from). The nodes are specified as EClasses inthe metamodel, which can have a number of EAttributes, EReferences and EOperations.
EAttributes are used to define the attributes that are desired in the diagram class andhave to be given both a name and a type. Attribute types can be any of the standardJava types, such as String, Long or Boolean. The name of the attribute is not restrictedbut it is often good practice to name it in such a way that it can be differentiated fromsimilar attribute names in different classes.
EReferences are used to define the relationships between one class and another, or be-tween one class and itself. Setting a reference between two classes or back to the same
19
Chapter 4 Editor Construction 20
Figure 4.1: An extract from the EMF tree editor
class allows the classes to be linked with connectors in the diagram editor. Links can alsobe modelled by having a canonical EClass representing the link, this would then need tohave two EReferences, one to the target node and one to the source node. EReferenceshave several properties that need to be set in order for them to work properly.
The name property must be set and it is good practice to give the reference a uniquelyidentifiable name within the metamodel to make it easier to identify at later stages,leaving this blank can cause errors during code generation. The eType of the referencemust be set to the target class, which will also set the eReference type property. Theupper bound and lower bound can both be set to restrict the cardinality of the reference.Setting the upper bound to -1 allows for an unlimited upper bound. The containmentproperty can be set to true or false. Setting it to true allows the target of the referenceto be included as a child node in the parent of the reference. This is useful if a recursivenesting behaviour is required; the required class can have a self referencing referencewith the containment set to true and the resulting node in the diagram will be capableof recursive nesting.
EOperations are used to define some behaviour for a class in the metamodel that is notdetermined solely in the metamodel design. There are various ways in which EOpera-tions can be used, such as creating a method in the Java output for the class that theEOperation is defined in. EMF automatically adds methods for any EOperations thatexist in a class, into the implementation code for the class. This method is then up-dated by changing the @generated tag to @generated NOT, to stop EMF overwriting themethod at a later date, and by adding the desired code to the body of the method. AnyEOperations defined in the metamodel must then be explicitly called from elsewhere.

Chapter 4 Editor Construction 21
For example it is possible to define link constraints in GMF that are represented in Javacode that are used to call the classes defined using EOperations.
Once the metamodel has been constructed, an EMF GenModel must be created fromthe metamodel. This is available through the right-click menu on the metamodel file(.ecore extension), in the Eclipse Package Explorer window. Generally the GenModeldoes not require alteration. The Model Code and Edit Code need to be generated fromthe EMF GenModel before continuing, this can be performed using operations providedby the right-click menu on the root node of the EMF Model.
4.2 Graphical Model
The Graphical Model is used within the GMF framework to define the graphical elementsof the diagram. This includes nodes, labels, connections and decorations for connectionends. The Graphical Model contains a Figure Gallery that contains the figures that areused to define the shapes; the elements that define the nodes, labels and connections areunder the root of the file.
GMF provides a simple wizard for the creation of Graphical Models, which is availablethrough the right-click menu on the metamodel file. The wizard allows the desirednodes, labels and connections to be selected, and will automatically choose a sensibleset of defaults when provided with a root class. The output from the wizard is a simpleGraphical Model that contains figures and elements for the selected classes, labels andconnections. The generated Graphical Model can be heavily modified to produce therequired behaviour.
There are three major modifications that can be made to the Graphical Mapping. Thefirst is to change the default graphical representation of the nodes. This is accomplishedby defining a new figure in the Figure Gallery and setting the appropriate node to use thenew figure. New figures can either be one of those available by default, such as RoundedRectangles, Ellipses and Polygons, or they can be Custom Figures. To use a Custom Fig-ure a Java class needs to be defined that extends the org.eclipse.draw2d.Graphics.Shapeclass and overrides the fillShape() and outlineShape() methods. The custom class thenneeds to be referenced by the Custom Figure.
The second major modification is to add a Compartment that can be used in the MappingModel. This is a two stage process; the Compartment must be added below the root ofthe Graphical Model and a Figure needs to be defined for it. Compartments need to benamed, and can optionally be forced to display this name in the diagram editor.
The third major modification is to modify the style of the Connections. There are twooptions for this: modifying the style of the line or modifying the style of the Decorationsthat appear at the source and target ends of the Connection. The line is easily modifiable

Chapter 4 Editor Construction 22
through the properties that define it in the Graphical Model. Several properties can bechanged, such as line kind, line width and the graphical elements used for source andtarget Decorations. The Decoration is more difficult to modify and often involves thecreation of a Custom Decoration in the same way as a Custom Figure is created.
4.3 Tooling Model
The Tooling Model is used within GMF to define the toolbar and menus to be used withthe diagram editor. The Tooling Model allows several types of menu to be included,such as Context, Pop-up and Main Menus. The toolbar, which is the main focus of theTooling Model, is defined within a Palette and contains Tool Groups, which contain theTools.
GMF again provides a wizard to generate a Tooling model, which is available throughthe right-click menu on the metamodel file. The wizard produces a reasonable set ofdefaults that can be modified to provide the required behaviour. The most commonmodification of the Tooling model is to split the Tool Groups into different categoriesand to change the names on the Tools, this is easily performed.
4.4 Mapping Model
The Mapping Model is used within GMF to map the Graphical and Tooling Modelsto the metamodel. The Mapping Model can be automatically generated through thewizard, which GMF makes available, but this is slightly unreliable and has a tendencyto associate a creation tool for one element with the graphical definition for a differentelement, so the resulting Mapping Model must be carefully checked.
The Mapping Model consists of several Top Node References, which each contain oneNode Mapping and are used to map nodes in the diagram to both the element in themetamodel and to the creation tool. It is within the Node Mapping that Label Mappings,Child References and Compartment Mappings are defined.
Label Mappings map a Diagram Label in the Graphical Model to one or more attributesin the metamodel class that is referenced by the enclosing Node Mapping. Compart-ment Mappings map a Compartment from the Graphical Model into the metamodelclass referenced by the enclosing Node Mapping. Compartments can also have children,which are specified as Child References of the Node Mapping. Child References allowmetamodel classes to have children and as such contain an inner Node Mapping, or a ref-erence to an already defined Node Mapping. An example of this is shown in Figure 4.2,the UMLBObjectActivity node is nested within the UMLBObjectLifeTime node.

Chapter 4 Editor Construction 23
Figure 4.2: An extract from Sequence Diagram GMF Map, showing a nested node.
Once the Mapping Model has been completed it is used to create the Generation Model.This is done through the right-click menu of the Mapping Model.
4.5 Generation Model
The Generation Model is used within GMF to produce the diagram code. As such, itcontains many features that can be modified to produce specific features in the diagramcode. Figures defined the Graphical Model can be given a default size property at thisstage for example.
The Generation Model is not normally modified as most of the functionality should beincluded in the prior diagrams. One common modification however is to change thepackage location that the diagram code is generated into. This becomes necessary ifthere are several diagrams being produced from one metamodel, to avoid one diagramoverwriting another; it also helps to have the digram code in separate packages to makethe addition and maintenance of custom code easier. The generation package is modifiedby changing the Gen Editor’s package name prefix and the Gen Plugin’s ID to the desiredpackage name.
4.6 Extensions and Code Customization
The use of GMF with EMF allows the rapid construction of a wide range of differentdiagrams. However, there is a limit to the level of complexity that the framework canprovide. For instance, if one wanted to create a diagram with some specialised graphics,formatting or behaviour, there would be very little support in GMF.

Chapter 4 Editor Construction 24
The solution to creating more complex diagrams is to extend what GMF produces. Thereare a number of ways of achieving this. GMF and EMF do themselves provide somesupport for extensions. In EMF it is possible to add custom constraints to the nodes.An example of this is seen in the Activity Diagram Metamodel (Section 5.1.1). Addingcustom constraints creates place-holder methods when the model code is generated, byadding code to these methods constraint behaviour can be customised.
GMF provides inbuilt extension mechanisms within the GMF Graph. Here it is possibleto provide custom implementations of key features at certain points. For instance, itis possible to create a custom graphical representation for any of the elements on thediagram. This is done by creating a Java class that draws the shape of the elementexactly as desired (see Section 5.4.2.1 for an example). It is also possible to specify acustom layout for a container, so that elements that appear within that container canbe laid out in a specific manner (again, the sequence diagram shows an example of this).
Beyond these two mechanisms, it is not possible to obtain additional complexity throughstandard routes. However, as GMF is an API on top of GEF, it is possible to manipulatethe GEF code and Eclipse plug-in configuration directly. These are the files that aregenerated by the GMF Generator Model and at this level it is possible to widely alterthe behaviour of the editor, within the constraints of GEF. Performing this requires anintimate knowledge of the GEF framework and how it works. There is not space withinthis report to provide this, however some example modifications and explanations canbe found within the sequence diagram (Section 5.4).

Chapter 5
Design
Each editor was developed using the process outlined in Chapter 4. The design detailsof each, together with any associated extensions or technical challenges are presented inthis chapter. The metamodels of each diagram are presented individually (see Chapter 5)but are in fact unified under a single hierarchy. This allows an entire UML-B projectto be carried out using a single output model file, increasing the level of cohesion andportability.
5.1 Activity Diagram
The Activity Diagram consists of many element types: Initial Node, Activity, Decision,Merge, Join, Fork, Final Node and Flow Final. The Activity Diagram also consists of asingle Flow link type that is constrained in different ways for each element type.
5.1.1 Metamodel
The base class in the Activity Diagram Metamodel, shown in Figure 5.1, is the UML-BActivityDiagram. The diagram type is defined as being made up of multiple Merges,Joins, activities, Final Nodes, Flow Finals, Forks, Decisions and Flows. The diagramalso allows at most one Initial Node.
The nodes directly aggregated from UMLBActivityDiagram are the components of thediagram, for example UMLB AD InitialNode represents the Initial Node component inthe Activity Diagram. The Merge, Join, Activity, Final Node, Flow Final, Fork, Decisionand Flow elements have no maximum limitation on the number of times they can appearin the diagram. The Initial Node element is restricted through the initial aggregationto at most one Initial Node element per Activity Diagram.
25

Chapter 5 Design 26
The Activity element, UMLB AD Activity contains a name property of type EString.The name property is designed to allow the Activity to have a name, that then linksto the label inside of an Activity in the diagram. The Flow element, UMLB AD Flowcontains a guard property also of type EString. This allows guard conditions to be addedto the Flows, which are used when a Flow enters an Activity.
To solve the problem of keeping track of the Flows allowed into and out of a diagramelement, the metamodel designed has four restrictive classes based on incoming and out-going properties for Flows. Flows in the metamodel are defined as the UMLB AD Flowclass and are associated to the UMLB AD Element class, which is the base class forall components that can be added in the Activity Diagram. The associations incom-ing and outgoing are used to define the set of Flows that an Activity Diagram elementhas incoming and outgoing. The associations target and source are the opposite asso-ciations to incoming and outgoing respectively. In the metamodel, the incoming andoutgoing associations have no upper limit set, meaning that for any element in theActivity Diagram, the element can have multiple incoming Flows and multiple outgo-ing Flows. Obviously we do not want all elements of the Activity Diagram to havemultiple incoming and outgoing Flows, therefore we must restrict this. In the meta-model, Flow restrictions are defined by the classes UMLB AD Element NoIncoming,UMLB AD Element OneIncoming, UMLB AD Element NoOutgoing andUMLB AD Element OneOutgoing, where the restrictions are no incoming Flows, oneincoming Flow, no outgoing Flows and one outgoing Flow respectively. Elements arerestricted in the metamodel by generalizing one or more of these restrictive classes.
The UMLB AD Element base class for all diagram components provides two meth-ods which return a boolean depending on whether a node is legal to start from, or toend at. The method isLegalToStartFrom checks to see if the given element is of typeUMLB AD Element NoOutgoing, if it is then false is returned as the element cannotaccept any Flows. Next the isLegalToStartFrom method will check to see if the elementis of type UMLB AD Element OneOutgoing, if it is and the number of outgoing Flowsis zero then the element is legal to start a Flow from. The method isLegalToEnd checksto see if the given element can have another incoming Flow assigned to it. Firstly isLe-galToEnd checks to see if the element is of type UMLB AD Element NoIncoming, if itis false is returned as the element cannot accept incoming Flows. Next isLegalToEndchecks to see if the element is of type UMLB AD Element OneIncoming, if it is theincoming Flows is checked to see if it is empty and so able to accept this incoming Flow,the result of this is returned.
5.1.2 Activity
An Activity is a rounded rectangle with a label corresponding to the name attributedefined in UMLB AD Activty in the metamodel. An Activity is only allowed to have

Chapter 5 Design 27
Figure 5.1: The Activity Diagram Metamodel
a single incoming Flow and a single outgoing Flow. The incoming Flow should containthe guard conditions for the Activity and this ability to do this is provided by theFlow object in the metamodel. An Activity is only allowed one incoming Flow and oneoutgoing Flow, which is restricted in the metamodel.

Chapter 5 Design 28
5.1.3 Initial Node
The Initial Node is a filled circle and is defined in the metamodel asUMLB AD InitialNode. The Initial Node is restricted in the metamodel so that it hasno incoming and only one outgoing Flow.
5.1.4 Decision
The Decision node is a diamond shaped element and is defined in the metamodel asUMLB AD Decision. Decisions are restricted in the metamodel so that they have oneincoming Flow, the outgoing Flows are not restricted as multiple outgoing Flows areallowed.
5.1.5 Merge
The Merge node defined in the metamodel as UMLB AD Merge, is graphically equivalentto the Decision node and so uses the same graphical component in the GMF graph. TheMerge element is not restricted in its incoming Flows so as to allow multiple incomingFlows, whilst the outgoing Flows are restricted so that only one outgoing Flow is allowed.
5.1.6 Fork
The Fork node is a thin, filled rectangular bar that can be positioned horizontally orvertically in a standard UML 2.0 Activity Diagram. In this Activity Diagram, the Forkgraphical component is by default a vertical bar however the user can resize and reshapethe bar to allow them to produce a horizontal bar. The Fork element has its incomingFlows restricted so that only one incoming Flow is allowed, whilst the outgoing Flowsare not restricted thus allowing multiple outgoing Flows.
5.1.7 Join
The Join element, defined in the metamodel as UMLB AD Join, is graphically equivalentto Fork and so uses the same graphical component. The Join element has no restrictionson the incoming Flows so as to allow many incoming Flows, whilst the outgoing Flowsare restricted so as to allow only one outgoing Flow.
5.1.8 Flow Final
The Flow Final element is graphically defined as a circle with a cross through through it,in the metamodel Flow Final is defined as UMLB AD FlowFinal. The size of the Flow

Chapter 5 Design 29
Final graphical component cannot be changed by the user, as GMF does not resize thecross in relation to the size of the circle meaning that resizing the figure would producean unrecognisable diagram element. The Flow Final element is restricted so that itaccepts only on incoming Flow and no outgoing Flows.
5.1.9 Final Node
The Final Node element is defined graphically as a circle with a second filled innercircle, in the metamodel Final Node is defined as UMLB AD FinalNode. The FinalNode element is restricted so that only one incoming Flow is accepted and no outgoingFlows are allowed.
5.1.10 Flow
The Flow element is the most complex part of the Activity Diagram to define, due tothere being many restrictions on the Flows that Activity Diagrams can have incomingand outgoing. In the metamodel, Flows are defined as UMLB AD Flow and have oneproperty, the guard, which should be used to show the guard conditions going into anActivity. Graphically, a Flow is a line with an open arrow head pointing in the directionof the Flow, but it also contains a label element that is linked to the guard attribute.
In GMF, Flows are assigned two link constraints, one for incoming and one for outgoingnodes. These constraints are defined in Java in the diagram code and when the con-straints are called by the editor, the methods isLegalToStartFrom or isLegalToEnd arecalled depending on whether the Flow is trying to start from or connect to a graphicalcomponent. These constraints determine whether the editor allows a Flow to be placedin the model.
5.1.11 Technical Challenge
The Activity Diagram presented a technical challenge in terms of defining the restrictionson Flows between Activity Diagram elements in the metamodel. Activity Diagrams havevarious different restrictions on the number of Flows that a diagram element can haveincoming and outgoing, which is difficult to define in the metamodel.
Initially the Activity Diagram Metamodel was produced so that every diagram elementtype generalized the same parent base class that had a single Flow association referencingitself, see Figure 5.2. The problem with this approach was that it meant any elementcould have any number of incoming outgoing Flows, which is not the behaviour required.
Another way that was looked at to try and control Flows was to try and define all of thelinks that are possible between all pairs of elements. By doing this you would be able

Chapter 5 Design 30
Figure 5.2: Initial implementation of defining a Flow in the Activity Diagram. AllActivity Diagram elements generalize the UMLB AD Element.
to define the relationship constraints, such as one to one, one to many. However thismethod has three disadvantages to it, the first disadvantage is that the metamodel wouldbecome extremely complicated with such a high number of associations between classes.The second disadvantage is that GMF would create a separate link in the diagramseditor for each and every association that defines a link in the metamodel, meaning itwould make the editor extremely unintuitive for the user. Finally, this way of definingthe metamodel would have the problem that you would still be able to have multipleFlows coming out of an element, such as an Initial Node, where you only want at mostone Flow to come out of. Multiple Flows coming out of an Initial Node would be legalin this type of model as there would be a link from the Initial Node to multiple othernodes.
Looking at the original UML-B diagrams found that the State Diagram had a similarrequirement on counting the number of links diagram elements had going in and comingout. The portion of the Activity Diagram metamodel shown in Figure 5.3, shows howthe metamodel has to be defined in order to count the number of incoming and outgoingFlows. In the metamodel the incoming and outgoing associations will contain all of theFlows that are going into and coming out of the given diagram element.
The final problem was to use the information about the number of incoming and out-going Flows to try and constrain whether or not any given diagram element can have aFlow assigned to them. In Figure 5.3 there are the operations isLegalToStartFrom andisLegalToEnd, which are used to determine whether or not Flows can leave or enter agiven element. The code in these operations could have been defined for each and everydiagram element, however this would have created a large amount of code, with littleindication in the metamodel of what was happening. This is why the final metamodelhas the constraint classes talked about in Section 5.1.1, so as to show in the metamodelwhat the Flow constraints for each element are.

Chapter 5 Design 31
Figure 5.3: Part of the Activity Diagram Metamodel that demonstrates how incomingand outgoing Flows can be differentiated. The associations source and target are definewhether a given Flow is coming from the element of going into the element. Theassociations incoming and outgoing define the set of incoming and the set of outgoing
Flows an element has.
5.2 Component Diagram
The Component Diagram consists of Components, Required Interfaces, Provided Inter-faces, associations between Required and Provided Interfaces, and associations betweenObjects. The Component Diagram is used to show how a system is built up and howthe different parts interact. In UML-B this is at the Package level, with a Compo-nent representing a Machine or Group of Machines. The design of the Metamodel andimplementation of the Editor are explained in the following section.
5.2.1 Metamodel
To get the required graphical behaviour for the Component Diagram the Metamodelshown in Figure 5.4 was created. This metamodel is stand alone but has been includedin the UML-B Metamodel for the sake of completeness.
The UMLBComponentDiagram class is the main root of the diagram and is aggregatedto the UMLBComponent class. The UMLBComponent class is the main class for thediagram as it is the representation of a Component. Both interfaces are aggregated tothe UMLBComponent to allow them to be used as child nodes when the ComponentDiagram is being used. The Compartment has two self referencing links; the aggregationCD Subcomponent, which allows for the nesting of Components, and the association

Chapter 5 Design 32
Figure 5.4: The Component Diagram Metamodel
CD Association, which allows Components to have associations that do not involveinterfaces.
Having Interfaces as children of a Component will make using the XMI output of thediagram easier in translation to B, because the process of identifying the interfaces thatbelong to a Component is straight forward. The child Interfaces are part of the parentComponent’s XMI node, which would not be the case if the Interfaces were not children.In this case, the links between Components and Interfaces would have to be looked at,which would be more difficult and time consuming.
Required Interfaces are associated to Provided Interfaces through the CD InterfaceUsesassociation. This allows for Required Interfaces to link to Provided Interfaces and visu-alize interface usage in the Component Diagram.
5.2.2 Component
The Component is implemented using a custom Java class to define the shape that thenode uses. The custom class draws the Component as a square edged rectangle with theUML 2.0 Component icon in the top right-hand corner. The rectangle is drawn a setdistance inside the bounds of the node to create a margin in which Required Interfacesand Provided Interfaces can sit. This allows the Interfaces to sit next to their parent

Chapter 5 Design 33
Component and appear to be joined to the outside. This would not have been possibleif the rectangle was drawn on the bounds of the node as the Interfaces would lie insidethe rectangle.
Interfaces are positioned inside the Component through use of the Layout Manager.GMF provides a Layout Manager that, by default, allows child nodes to be repositionedanywhere within the bounds of the parent node. The required behaviour for the Com-ponent is that its children are snapped to the edge of the Component so that Interfacesappear to be joined to the edge of the drawn rectangle. Interfaces are also able to bedragged and dropped into a new location and snap to the closest edge from that point.To achieve this behaviour a custom Layout Manager was written.
The custom Layout Manager calculates which edge of the Component each Interface isclosest to and moves the Interface to be sitting on the outside of that edge. This is doneby calculating the centre points of both parent and child. These are used to get thenormalized vectors from the centre point of the parent to the four corners of its boundsand to the centre of the child. These vectors are used to calculate which sector (top,bottom, left or right) the child lies in, and therefore which edge it is closest to on theparent. Calculating the closest edge by using vectors allows the Interfaces to be droppedoutside the bounds of the Component and still snap back correctly.
5.2.3 Interfaces
Both the Required Interface and Provided Interface are implemented through the useof a custom Java class to define their shape. The Required Interface is drawn as asemicircular arc, connected to the Component through a perpendicular line extendingfrom the base of the arc. The Provided Interface is drawn as a closed, unfilled circle,joined to the Component through a short, perpendicular line.
As both Interfaces need to be attached to all four sides of the Component, their drawnimage must be rotated such that they are always connected to the Component. To dothis, the Interface classes make use of the custom Layout Manager to calculate theirclosest edge. The image is then drawn to align with the closest edge.
5.2.4 Interface Association
The association between a Required Interface and a Provided Interface is visualizedin the diagram by a dashed line with an open arrowhead pointing from the RequiredInterface to the Provided Interface.

Chapter 5 Design 34
5.2.5 Component Association
The association between Components in the diagram is visualized by a solid line withno arrowhead between the two Components in the association.
5.2.6 Technical Challenges
The technical challenge in developing the Component Diagram lay in the custom LayoutManager, which was challenging for two reasons. Firstly, when defining a custom LayoutManager in GMF, layout edit policies are used to define which child nodes in the parentnode can be moved and edited. The edit policy must be specified within the generateddiagram code, rather than in the GMFGraph file where the Layout Manager is specified,and will use the default policy otherwise. The default edit policy is not to allow anythingto be moved within the parent and this initially caused problems. Since there is nomention in the available documentation about setting an edit policy, the default editpolicy was being used. Using the default edit policy meant that the drag and dropfunctionality for the Interfaces did not function. As the only visible thing to be changedin the GMFGraph file was the Layout Manager, the assumption was that it was thecustom Layout Manager that was causing the drag and drop to be non-functional. Thisassumption led to a lot of time being spent with the custom Layout Manager before itbeing realized that the layout edit policy needed to be changed. The requisite changeswere made to use the XYLayoutEditPloicy, which provided the functionality that wasneeded.
Secondly, the algorithm to snap Interfaces to the edge of the Component took sev-eral iterations to obtain the correct functionality. The initial algorithm calculated theclosest edge by calculating the distances between each edge of the Interface and eachcorresponding edge of the Component using the bounds of both nodes. The Interfacewas snapped to the edge with the shortest distance. This produced the desired resultprovided that the Interface was not moved outside the bounds of the Component. Ifthis were the case, the Interface would occasionally snap to an incorrect edge, especiallyif it had been moved outside a corner. Figure 5.5 shows an example of bad snapping inthe Component Diagram Layout Manager. This problem was rectified by implementingthe vector system described above.
5.3 Object Diagram
The Object Diagram consists of Objects, Attributes and associations between Objectsand is used to model a static instance of a dynamic system. Within UML-B this could beshowing how a system looks during animation, showing how a system looks at a point in

Chapter 5 Design 35
Figure 5.5: An example of a Component Diagram showing a configuration wherecomponent i would snap down to the boundary line A, when it should snap to B.
a Sequence Diagram or showing the relationships between real-world objects before thesystem is formally designed. The metamodel and editor design for the Object Diagramis explained in the following section.
5.3.1 Metamodel
To get the required graphical behaviour for the Object Diagram the metamodel shownin Figure 5.6 was created. This metamodel is not stand-alone but is integrated withthe UML-B metamodel. This is to allow the diagrams functionality to be integratedwith the rest of the UML-B diagrams and to allow the diagram to make use of existingUML-B classes.
The UMLBObjectDiagram class is the main root class for the diagram and is linkedthrough an aggregation to the UMLBObject class. The UMLBObject class is the repre-sentation of an Object in the metamodel and has a name attribute and an associationback to itself. This association provides for the ability to link Objects to other Objectsin the diagram. The UMLBObject class is associated to two additional classes that werealready present in the UML-B Metamodel; UMLBAttribute and UMLBClass. The linkto UMLBAttribute allows Objects to have optional Attributes with the same function-ality as UMLBAttributes, which are used in the already existing Class Diagram. TheinstanceOf association to UMLBClass is included for completeness but should allow forenhancements to the functionality of the diagram.
The aggregation from UMLBSequenceElement to the UMLBObjectDiagram class is toallow the Object Diagram to be linked to the Sequence Diagram through the EventCalls. Having the Object Diagram as a child of the UMLBSequenceElement allows for alink between an Event Call and an Object Diagram, which can be used when providingthe right-click pop-up menu functionality.

Chapter 5 Design 36
Figure 5.6: The Object Diagram Metamodel
5.3.2 Object
The Object node is represented graphically with a rounded rectangle containing a labelfor the Object’s name, and a separate labelled compartment that stores the Object’sAttributes. Attributes have a label that is used to display both the name and value ofthe attribute. The rounded rectangle and labelled compartment were used to maintain avisual similarity between the Object Diagram and Class Diagram, which uses the samedesign for Class nodes. The Object is resizeable to any dimension, again, matching thefunctionality of the Class Diagram.
The mapping of two data items to one label, for both the Object and Attribute labels,is defined in the GMF mapping. Labels can take a variable number of features, whichcorrespond to Class attributes in the metamodel. Labels have a view pattern, whichdefines how the features are viewed in the diagram, and an edit pattern, which defineshow the features are edited in the label. The feature used for the Object label are name.The features used for the Attribute label are name and initialValue. For the Attributelabel the view and edit patterns used are 0:1, which produces the ‘name: value’ styleview for Attributes.

Chapter 5 Design 37
It is possible to have null values for any label feature in the Object Diagram, whichprovides for having attributes without a specified value. However, to get a null value,the value for the non-null part of the label must be entered via the properties window.This is due to the direct editing on the label not handling null values very well. If onefeature is left blank when the label is being edited no value will be recorded for eitherfeature.
5.3.3 Object Association
The Object association for the diagram is visualized as a solid line with no arrow. Asso-ciations are constrained using an OCL constraint, specified within the GMF mapping,so that the two Objects joined by an association are different. This prevents associationsfrom one Object back to itself.
5.3.4 Toolbar
The toolbar is defined in the GMF tooling definition and contains the buttons necessaryto create Objects, Attributes and associations. The toolbar is split into two tool group-ings, one for nodes and one for links, both of which are collapsible. This has been doneto keep the toolbar looking similar to the toolbars in the other UML-B diagram editors.
5.4 Sequence Diagram
The Sequence Diagram represents the sequence of operations to be carried out by aMachine in some example procedure, possibly with the aim of driving an animationscript. The diagram displays UML-B Objects as swimlanes, with calls to events asarrows that take the state of the Machine from one point to another. Visually on thediagram, the arrows move from a calling Object to a receiving Object, denoting thesequence in which the units of code are executed.
5.4.1 Metamodel
The UML-B Sequence Diagram meta model (see Figure 5.7) is relatively straightforwardin terms of complexity, at least compared to some of the other diagrams. The root nodeis the sequence itself, which is then comprised of Object Lifetimes, a start point andsequential elements (links).
The Object lifetime elements have three types of children: A name property that actsas a label to distinguish one instance of a class from another. A reference to a Class

Chapter 5 Design 38
object that records what Class the object is an instance of (this will have been definedin another diagram, such as a Class Diagram). And finally the Activity Boxes, whichare the yellow vertical boxes that provide a region for the links to anchor to.
Figure 5.7: The Sequence Diagram Metamodel
The start point is a leaf node on the diagram that does not have any children or at-tributes. This is due to the fact that the start point is merely a graphical widget thatprovides a starting position for the sequence. It is not a mandatory element on thediagram and it does not carry any semantic meaning with it. However, an Event Calllinking the start point to an object can be associated with an event just like any other,this is useful if there is an initialisation method that is called by the environment, per-haps when a program is first started up (it can be used to show an Event Call comingfrom a region of the system that falls outside of the scope of the Sequence Diagram).It shares a common superclass with the object lifetime, UMLBTemporal element, thisis so that the elements which are to be arranged horizontally on the page can be han-dled uniformly by the Layout Manager. It also means that, in theory, one could easilyextend the notation at this level to include another type of element, without having toreimplement the layout.
The two types of links, or sequential elements, on the diagram are the Event Calls andthe backtrack link. They are linked by a common superclass as they are handled very

Chapter 5 Design 39
similarly by the canvas. It again, allows the same code for positioning, linking andlayout to be applied universally to all links. Links are represented by their own elementson the diagram, rather than simply allowing object lifetimes to directly reference otherobject lifetimes. This provides a more distinct representation of the Event Calls, whichare arguably the most important element on the diagram, within the model file. Ratherthan simply having a reference under the lifetime node, there is a child link node thatholds all the information in a readily available and explicit place. It also allows us torecord the order of the nodes on the diagram, which could not have been done if therewas not an actual node for each link.
The backtrack link is very simple, only recording where it comes from and goes to. Thereis no need to record anything else, as the link merely represents a transition back to aprevious state and provides no new data. The Event Call is slightly more complicated,here there is a reference to the event that is being called, a label attribute to aid it’sidentification on the diagram and a string that represents the parameters being passedto the event.
5.4.2 Technical Challenges
Figure 5.8: The Sequence Proto Diagram
Whilst the metamodel is simple, creating the Sequence Diagram editor so that it looksand behaves in a way similar to the UML 2.0 Sequence Diagram is another matter. Ofall the UML 2.0 diagrams, this is the one that is mostly frequently poorly implementedand awkward to use. The main reason for this, is that it is not simple type of diagramwhere the user can drop elements onto the canvas anywhere and then link them upas they wish. As stated in the requirements, the layout is quite strict, with elementsbeing aligned in swim lanes and links always being horizontal. Unfortunately GMF only

Chapter 5 Design 40
natively supports the former and so the complex functionality has to be programmed inmanually.
To demonstrate the magnitude of this, Figure 5.8 shows the proto-Sequence Diagramthat GMF was able to produce. This was the basis of the editor, all other functionalityhas been added by hand.
5.4.2.1 Custom Shapes
Figure 5.9: A Custom Shape used in the Sequence Diagram
The shapes displayed on the diagram, which represent the Object Life Time elementsproved too complex to create in GMF. Instead they were created by utilising a customshape object that extends the Draw2d.Shape class and is registered as the graphicalrepresentation of the element at the GMF level. This class can be found in the Packageac.soton.umlb.umlbMetamodel.diagram.custom. By overriding the class’ draw and fillmethods it was possible to recreate the desired shape exactly. First an outline is drawn;the box at the top of the shape (shown in Figure 5.9) is of a set relative size and shape,this is multiplied by the zoom level of the diagram to produce an absolute size. Thedotted line that travels down the centre of the shape, starts from where the box at thetop finished and ends at a position that is half the absolute size of the cross at thebottom away from the lower limit of the area. The cross is drawn in the same way asthe box, only using two drawLine() calls, rather than drawRectangle(). Secondly theshape is filled, in reality only the box needs colouring in and so a fill rectangle, slightlysmaller than the border is used.

Chapter 5 Design 41
5.4.2.2 Layout
There are two aspects of the Sequence Diagram that required specialised forms of layouts.These were hinted at during the requirements phase and are now shown in Figure 5.10.Firstly the elements that are placed directly onto the canvas have to be laid out asshown; that is the Object Life Time elements are all aligned to the top of the page andthe start point is kept at the left hand side. Other than the start point, the elementsmay be arranged horizontally, with the ability to reorder them, though they must notoverlap. The second layout behaviour required is the positioning of the Activity Boxeswithin the life times. Here the box must be aligned to the dotted line and must start ata given distance below the Object Box.
Figure 5.10: Layout Manager behaviour in the Sequence Diagram.
Adding a custom layout to a container requires attaching a special class that implementsDraw2D.AbstractHintLayout. Within this interface the key method is Layout(IFigureParent), which handles the laying out of all the children of the supplied figure (whichwill correspond to the container being manipulated). The layout code iterates througheach of the figure’s children and alters their bounds and positioning depending uponthe desired location (acquired using getConstraints()). Beyond this it is a simple matterof crunching numbers and calculating the correct positions. It is also important totake into account the zoom and scroll functions of Eclipse, this is done by translatingthe calculated coordinates from relative points to absolute points (there is a methodprovided for this, IFigure.translateToAbsolute()).
Layouts are generally registered with the plug-in at the GMF level. In the GMFGraphmodel it is possible to specify a custom layout class for any container. When specifyinga layout for the canvas itself it is slightly harder, this has to be done using GEF. Thelayout class has to be added in to the GEF code responsible for creating the canvas

Chapter 5 Design 42
figure (in the Sequence Diagram this is ac.soton.umlb.umlbMetamodel.diagram.edit.parts.UMLBSequenceEditPart).
5.4.2.3 Connection Anchors
The behaviours of the links on the Sequence Diagram proved very challenging to im-plement: how they were laid out, where they were connected and how they could bemoved. Link behaviour in GEF (there are no options whatsoever for changing linkbehaviour in GMF) is managed by two classes, the EditPart class that controls thefigure to which the link is connected to and the ConnectionAnchor class. In essencethe behaviour is controlled by having two connection anchors, one at either end of thelink. By controlling the positioning of these anchors on the border of the connectedelements, the position of the link can be changed. This is done by implementing theConnectionAnchor.getLocation(Point reference) method.
Figure 5.11: Diagram showing connection behaviour in the Sequence Diagram.
The EditPart class, in this case ac.soton.umlb.umlbMetamodel.diagram.edit.parts.UMLBObjectActivityEditPart, contains four methods that handle creation of connec-tion anchors. The getSourceConnectionAnchor(Request request) and getTargetConnec-tionAnchor(Request request) methods are called whilst the links are being created anddragged around, but before the mouse is let go and the position becomes permanent.These methods are passed a Request object that contains the position of the connec-tion request. The getTargetConnectionAnchor(org.eclipse.gef.ConnectionEditPart arg0)and getTargetConnectionAnchor(org.eclipse.gef.ConnectionEditPart arg0) methods han-dle permanently setting the link location and recreating the anchors when the diagramis opened from a saved file. These methods are only passed a ConnectionEditPart ob-ject that does not contain any information regarding the desired position of the link.As a result the final position of the link should either not depend upon the position atwhich the mouse was clicked on the diagram, or the location has to be somehow trans-ferred from the first two methods to the second two. The Sequence Diagram does thelater. When a connection anchor is created from a request object, the mouse location is

Chapter 5 Design 43
recorded in a static variable, this is then used to remember the correct y coordinate ofthe connection. The x coordinate is always equal to the x bound of the ObjectActivityelement border that is closest to the opposing anchor (the position of which is passed viathe reference point), ensuring that the connection always runs between the closest twosides of the connected elements. A convenient knock on effect of using a static variableis that the y coordinate for the source and target anchors is shared, causing the two tomove in sync vertically, always perpendicular to the ObjectActivity box.
The actual y positions are not exactly equal to the position at which the link was initiallyplaced, the order of the link on the diagram is taken into account and used to space thelinks nicely. This can be seen in Figure 5.11, where adding a new link to the middle ofthe diagram causes the other links to space out.
5.4.2.4 Ordered Links
It was important that the links were not only arranged neatly on the diagram, but alsothat the order in which they appeared, running from top to bottom, was recorded in themeta model. This was achieved by ensuring the the collection of Event Calls recordedin the meta model was orderable (an option present when configuring the EMF) and byincluding code to update the order at relevant points.
The code was added to the Connection Anchors so that whenever a link was either addedor moved on the canvas, the position in the order was recalculated. The key aspect hereis that the existing links are always spaced at a specific distance apart (taking intoaccount the level of zoom on the diagram). By taking the desired position of either thesource or target anchor, belonging to the new or relocated link, relative to the top of theActivity Box, and dividing it by the spacing; one could (with some rounding) obtain theposition of the link in the order. This is then used to a) work out the correct position
Figure 5.12: Diagram showing model link ordering in the Sequence Diagram.

Chapter 5 Design 44
for the link on the canvas, and b) update the order of the link in the meta model. Thisbehaviour can be seen on Figure 5.12, even though link C was added to the diagramafter all the other links, it appears in the correct order in the model hierarchy
Updating the meta model from the GEF layer in the framework is not just a matterof calling the relevant method. Changes made to the model have to pass through acommand system, which manages concurrent changes being made to the model fromthe various different views upon it. This allows changes to be done and undone trans-actionally, without violating the consistency of the data. In order to change the orderof the links, first the command stack has to be obtained from the diagram, then a newMOVE command is created. This is supplied with details of: the model feature that isbeing altered, the element that is being moved, the editing context that is performingthe operation and the new position in the index that the element is to be moved to. Theobject can then be pushed onto the stack, which will execute it in due course.
5.5 Use-Case Diagram
The Use-Case Diagrams consist of three element types: Actor; Use-Case and SystemBox, along with the various links that join them all together.
5.5.1 Metamodel
The base class in the Use-Case Diagram Metamodel, shown in Figure 5.13, is the Use-CaseDiagramParent that represents the overall Use-Case Diagram. The UseCaseDia-gramParent is made up of many Actor, UseCaseItem and SystemBox elements. Actor,UseCaseItem and SystemBox generalize UCDElement, where UCDElement is designedto allow shared properties between all of the Use-Case Diagram elements. UCDElementcreates the name property so that Actor, UseCaseItem and SystemBox all have a nameattribute.
As System Boxes are required to allow other System Boxes and Use-Cases to be nestedinside of them, there are aggregates from SystemBox to SystemBox and SystemBox toUseCaseItem. These aggregates allow multiple SystemBox and UseCaseItem items tobe created inside of any SystemBox.
Associations between classes in the Use-Case Metamodel represent the types of links thatare allowed in a Use-Case Diagram. The links uses and calls represent the situationswhere an Actor can use a Use-Case and where a Use-Case requires an Actor to completeits execution. The UseCaseItem is associated to itself through the includeUseCase andextendUseCase links that represent the situations where a Use-Case has to include orextend another Use-Case.

Chapter 5 Design 45
The generalization of Actors or Use-Cases also requires a self-referencing associationfrom both the Actor and UseCaseItem classes. Doing this however complicates themodel definition as the Use-Case Diagram would have two different generalize links. Tosolve this problem, the Actor and UseCaseItem classes generalize UCDGeneralizable inthe metamodel. There is then a single generalize self-referencing association from theUCDGeneralizable class.
Figure 5.13: The Use-Case Diagram Metamodel
5.5.2 Actor
The Actor is comprised of a graphical component, the ‘stick man’, along with a labelthat is linked to the Actor’s name attribute. The ‘stick man’ graphical component isdefined in GMF as an ellipse for the head and a custom figure for the body, positionedso that the body and head match. The graphical component cannot be resized by theuser when they are creating a Use-Case Diagram, because this caused problems of thehead and body no longer joining each other. This is not a problem when the diagramis viewed at a different zoom level inside of Eclipse, as GMF maintains the structure ofthe graphical component by scaling it.
The label for the Actor is positioned outside of the main Actor graphical object, so thatthe label can resize itself without trying to resize the ‘stick man’ graphical object.

Chapter 5 Design 46
5.5.3 Use-Case
The Use-Case is an ellipse containing a centered label that is linked to the name of theUse-Case. In GMF the label is centered by applying a border layout to the ellipse shapeand then setting the label to be a center component. The Use-Case ellipse will alsoexpand automatically as the length of the text in the label increases so that all of thetext in the label is shown.
5.5.4 System Box
The System Box is a rectangle container with a labelled bar at the top that shows thename of the System Box. As in the UML 2.0 Use-Case Diagram, System Boxes are ableto nest other System Boxes and Use-Cases. Providing this nesting capability is a twostage problem, the first part of defining a metamodel to allow this has been discussedin Section 5.5.1, the second part is setting up GMF to allow this.
To allow nesting in GMF, child references for System Box and Use-Case have to beadded to Node Mapping for the System Box Top Node Reference in the GMF mappingfile. The System Box node mapping must also be set as a compartment by addinga Compartment Mapping. By doing this, GMF will now manage the graphics andinterface when any System Boxes or Use-Cases that are placed inside of another SystemBox. The graphical and interface components that GMF will control here include addingand removing components from a System Box, moving a System Box and adding scrollbars to a System Box to show its entire contents if the System Box is not large enoughto show its entire contents.
5.5.5 Links
The links defined in the Use-Case Diagram are designed to look like the links in a UML2.0 Use-Case Diagram. Therefore the use, include and extend links are all lines with anopen arrow head pointing in the direction of the link. The generalize link has a closedarrow head and the call link from a Use-Case to an Actor has no arrow head.
The include and extend links automatically generate a label depicting whether they arean include or extend link as they should do in a UML 2.0 Use-Case Diagram. Theinclude and extend labels have had the editable property set to false so as not to allowthe label to be modified.
The links designed in the metamodel allow multiple links to be made per element inthe Use-Case Diagram. There are some properties for links that cannot be definedin the metamodel, such as preventing Use-Cases including, extending or generalizingthemselves. In these cases the links can have link constraints set in the GMF mapping

Chapter 5 Design 47
defined using OCL as shown in OCL 1, which ensures that the node at the start of thelink is not the same as the node at the end of the link.
self <> oppositeEnd
OCL 1: OCL to ensure no self-referencing
In the Use-Case Metamodel, Actor and UseCaseItem have been generalized to UCDGen-eralizable, so in its default behaviour any generalize link will allow Actors to generalizeUse-Cases legally. As this behaviour is not legal in a Use-Case Diagram, there must besome constraints made about the links that are made, which again can be made in theGMF mapping. The OCL shown in OCL 2 ensures that the start and end nodes in alink are of the same type, either Actor or UseCaseItem.
(self.oclIsTypeOf(Actor) and oppositeEnd.oclIsTypeOf(Actor)) or(self.oclIsTypeOf(UseCaseItem) and oppositeEnd.oclIsTypeOf(UseCaseItem))
OCL 2: OCL for generalize constraint
5.6 Diagram Integration
Part of the requirements for each diagram was that they must be integrated into theexisting UML-B notations and, where appropriate, integrated with each other. As al-ready discussed, the first stage of this is to unify the metamodels under a single file.Beyond this, integration takes the form of being able to create or open specific diagramsvia a right-click option on relevant diagram elements. It has also been made possible tonavigate from a nested diagram, back up to the parent. For instance, where a SequenceDiagram is created as a child of a Machine element, it is possible to open the PackageDiagram in which that Machine appears, by right-clicking on the Sequence Diagramcanvas and clicking ‘Open Parent’.
This functionality is obtained by extending the editors at the GEF level. A custom classis created within the Package of each editor that is to have a right-click action added.This class is registered with Eclipse in the plugin.xml file of that editor, as an objectcontributor to the popupMenu plug-in extension point. The class then has to handlecalls to the new action, providing the relevant prompts and either opening the relevantfile or displaying a new diagram wizard. When creating a new diagram the class has toprovide the correct root element, in some cases (where the root node is not an elementon the parent diagram) this has to be created using an Add Command to the model.

Chapter 6
Testing
The development of new diagram editors for the UML-B system has produced manythings than need to be tested for correctness and completeness. Elements that needtesting fit broadly into one of four categories; requirements, Metamodels, diagram be-haviour and custom code. The testing procedure used for each of these categories isdiscussed in this chapter.
6.1 Requirements Testing
As most of the requirements were to define UML 2.0 style models that already existed,requirements testing was a relatively simple process. Once the requirements were de-fined they were presented to our supervisors who then agreed each of our requirementsdocuments.
6.2 Testing Metamodel Design
The design of the Metamodel for each diagram type was critical to ensure that thediagram worked correctly when it was implemented. Testing the Metamodel design wasthrough peer review, which occurred in design meetings. Each Metamodel was presentedto the group along with the reasons as to how it was designed and how it is intended towork. Once the group agreed that the Metamodel design was reasonable, the Metamodelwas implemented as a diagram type.
48

Chapter 6 Testing 49
6.3 Testing Diagram Behaviours
Testing diagram behaviours was again a relatively simple process as we were creatingrefinements of standard UML 2.0 models with well known behaviours. Each diagramtype was tested against its requirements to ensure that correct linking between diagramelements took place, that diagram elements could only be used in certain legal situationsand that any data handling not visible to the user took place. The outcome of this testingprocess is shown in Appendix A, where each diagram is shown in a complex configurationdemonstrating all possible link types and diagram elements.
In some circumstances more in-depth testing of diagram behaviour had to be carried outbecause there were large amounts of coded elements that provided behaviours and func-tionality that GMF cannot provide on its own. In particular in-depth testing involvedthe Sequence Diagram’s layout management and the Component Diagram’s ComponentLayout Manager.
6.3.1 Testing the Component Layout Manager
The Component Layout Manager is responsible for ensuring that both Provided andRequired Interfaces snap to the edge of a Component in the diagram editor. Thisbehaviour was thoroughly tested by attempting to position Interfaces at several pointsaround the diagram. Positioning points were chosen so that they would test both thesnapping when the Interface was inside the drawn area and when the Interface wasoutside the drawn area. In the cases where the Interface was outside, more points werechosen to test the correctness of snapping near corners as described in Section 5.2.6.
6.3.2 Testing the Sequence Layout Manager
The Sequence Diagram Layout Managers controlled two aspects of the diagrams be-haviour: the positioning and management of the top level elements on the canvas andthe positioning and sizing of the Object Activity Boxes within the Object Life Timeboxes. The later was tested by ensuring that the Activity Box was always correctlypositioned and sized no matter what the size or position of the parent element. It wasalso tested by resizing the parent element after the box had been added, ensuring thatsize moved relative to the parent and that the spacing between the top of the box andthe top of the dotted line remained constant.
The Canvas Layout Manager has several elements that had to be tested. Firstly, weensured that start points were always on the left and could not be moved and thatObject Life Times elements were always a set distance from the canvas top and couldnot be moved vertically. Secondly, we ensured that the horizontal positioning of the
Chapter 6 Testing 50
Object Life Times was correct. The elements were allowed to be placed at any pointalong the x-axis, but were not permitted to overlap. We ensured moving one of theelements to the opposite side of another correctly caused them to be reordered. Eachof these areas was rigorously tested by carrying out repeated tests of every possiblecombination of moving, resizing and reordering. Attempts were also made to induceincorrect behaviour by trying to overlap elements.
6.3.3 Testing Link Management
The important aspects of the link behaviour to be tested are that the links must alwaysremain horizontal, must by movable and reorderable and must be evenly spaced in theorder they appear in the Metamodel. Each of these factors was verified through repeatedtesting of the linking; repeatedly recreating links in every possible location with everydifferent combination of parent nodes.
6.4 User Acceptance Testing
Throughout the project we demonstrated the diagrams as they were implemented withour project supervisors. This ensured that any changes to the diagrams or their require-ments were determined as early on in the project as possible.
In the penultimate week of the project we were able to demonstrate all of the diagramswith most of their features working to our supervisors and our customer. In this sessionwe were able to demonstrate how all of the diagrams would sit together inside a UML-Bproject and it gave our supervisors and customer chance to provide us with feedback anda small number of extensions to implement. In this meeting our supervisors requestedthat the Activity and Component Diagrams should be linked back to the original UML-Bdiagram types.

Chapter 7
Future Work
Updating and extending UML-B has a very large scope for continued work. In thisproject we have worked on designing and specifying the requirements for the variousmodels we have implemented. Throughout this process we have developed some furtherideas of how UML-B can interact with other components in RODIN and in this nextsection we will outline some key ideas about updates to RODIN through UML-B. Theseare discussed in this chapter.
7.1 Integration with a Model Animator
In the B animator ProB, the system is held in terms of the state the system is in, theoperations that are enabled and the history of operations that took place in an animation.Sequence Diagrams are used to show the order and flow of actions in a given system,whilst Object Diagrams can be used to show the state of a system at a given time. Herewe can see the beginning of the link between the two diagrams and the animator, whereSequence Diagrams can be linked to the animator’s history of operations and the ObjectDiagram can be linked to the animator’s state properties.
UML-B interacting with model animators will be of use in two areas of model checking.Firstly a user may wish to define a set of sequences to perform on a model to determinethat a particular behaviour maintains the invariant. To do this we will need a method oftranslating UML-B to an animation script. Alternatively, a user may wish to investigatean animation sequence that had taken place, especially if a given animation violated theinvariant. In this scenario we should provide a system that takes an animation outputand produces a UML-B model showing how the animation progressed.
51

Chapter 7 Future Work 52
7.1.1 UML-B to Animation Script
The UML-B Sequence Diagram can be used to develop a sequence of events to applyto the system being designed. Starting from the Initial Node, the Sequence Diagramallows the user to define the events being called along with any parameters that need tobe passed to the event. This is achieved through the Event Call link. The terminatingend of the Event Call link determines the Class to which the event belongs. Finally theorder in which the Event Calls are placed can determine the order in which the eventsare called.
Eclipse stores the Sequence Diagram data in an XMI file that is ordered in the eventorder defined in the diagram. This means it should be possible for the XMI file to betaken and converted into a format that an animator can take as input, defining thesequence of events to call in a given model.
7.1.2 Animation to UML-B
A user may also wish to have a more in-depth look at how an animation sequence ran,especially in terms of debugging animations that lead to an invariant being violated.In this situation both the sequence and Object Diagrams come into use, by using theSequence Diagram to show the sequence of events and the Object Diagram to show thesystem state.
Firstly we must assume that the animator stores the state of the animation after eachanimation step. Secondly, the animator must store all Event Calls and all backtracksthat occur during an animation sequence. This means that after any event or backtrackwe can recall the state of the system. The animator should be able to provide thisdata in a file that can be subsequently opened by RODIN and used to build a SequenceDiagram.
In loading the output from an animation, a UML-B Sequence Diagram should be builtand the state information stored in a format that can be used to link from the Event Callin the Sequence Diagram to the state at that time. In an inverse operation to the UML-B to animation sequence method previously described, the Sequence Diagrams can haveevents added to them in the order in which they happened in the animation. The targetfor an event and the parameters passed to the event should be a part of the informationpassed back from the animator about the event called. What cannot be determined iswhere an event originated from, except for the very first event that must have come fromthe Initial Node. The UML-B Sequence Diagram in this situation should not attemptto work out where events originate from as this is an unsolvable problem with manydifferent solutions but all with different meaning to the user, see Figure 7.1. In this caseall events should originate from a System Class and the user can then decide to arrange

Chapter 7 Future Work 53
where events originate from if they so wish. With the Sequence Diagram built, the usershould then be given the option to select any event in the Sequence Diagrams operationand build an Object Diagram showing the system state at that time.
Figure 7.1: Two Sequence Diagrams showing a restaurant scenario with a Customer,Waiter and Chef. In a UML-B Sequence Diagram these two diagrams would producethe same animation script, but are different in meaning. Diagram (a) shows a modelwhere the originating Class of an event is determined by the last Class to accept anevent, which produces the meaning that the Chef is ordering a drink. Diagram (b)shows the real meaning that was required in this diagram, where it is a Customer who
orders a drink.
7.2 Model Refinement
Refinement in B is a key component of formal system design and one that is currentlymissing from UML-B. With the addition of the Component Diagram, it could now bepossible to implement model refinement in UML-B.
The Component Diagram lets us unplug elements of the system and replace them withmodifications whilst still maintaining the same system behaviour. To create a system forrefinement, the Component Diagram would need to be further integrated into UML-Bsuch that a Component represented an element of the UML-B model or a section ofEvent-B code where refinement would be required.
An example situation may be that a UML-B model is defined that includes a set con-taining all the users of a particular system. A Component of this model would be theClass containing all of the users that was modelled as a set. This Component couldthen be replaced with a refined Component that contained all of the users of a systemmodelled in a list with the various checks to ensure a user only occurs at most once inthat list.

Chapter 7 Future Work 54
7.3 Error Notification
The U2B process may in some cases come across errors in the models defined. Thediagrams that were part of UML-B before this project are able to report these errors tothe user, this is achieved by highlighting in red sections of the model that have causederrors [32]. Error notification may not be appropriate in all of the diagram types; herewe present the diagrams where error notification could be used.
7.3.1 Activity Diagram
At this time the Activity Diagram does not have a specific role inside UML-B in termsof U2B translation and determining how error notification could be provided is limited.One error checking method that could be included would be to check the guard conditionsthat lead into activities to ensure that they are in a legal syntax. In a situation wherethe guard condition is not legal syntax, the guard label could be coloured red to showwhere the error has occurred.
7.3.2 Sequence Diagram
As Sequence Diagrams will be used to run and display model checking animation se-quences, error notification in Sequence Diagrams could be used to show where a modelchecker violates an invariant. This form of error notification could have two distinctcircumstances.
The first error reporting situation is when a model checker is used and no SequenceDiagram was used to provide a test script. In this situation we have no expected list ofevents to be called and if the model checker violates the invariant the Sequence Diagramcould display all of the events leading up to the violation.
The second scenario is if a Sequence Diagram has been used to provide an animationtest sequence that subsequently led to the invariant being violated. In this situationthe model checker should return back the original Sequence Diagram but clearly showthe events that were called and the events that did not occur because of the invariantviolation. To do this, the event arrow that caused the violation could be coloured redand all of the events after be coloured in a different colour, perhaps orange, to signifythey were never called.

Chapter 7 Future Work 55
7.4 Custom Properties Windows
The UML-B diagrams implemented before this project all have custom properties win-dows [11] that are used to hide the unrequired EMF and GMF properties that wouldotherwise be shown in the diagram [32]. Implementing custom properties windows foreach diagram would have the advantage of removing the complexity of the EMF andGMF default properties and just focusing the user’s attention on the UML-B specificproperties, as well as keeping the same look and feel throughout UML-B.
7.5 Mathematical Notation
In some of the diagrams there is a requirement to include some formal notation by usingµB. In the diagrams we have created, this is achieved through ASCII entry and displayonly. A future improvement to the diagrams we have created would be to implementa system similar to that produced by Andrew Tillman [32] in entering µB through theRODIN UML-B keyboard and to display any µB in true mathematical notation.

Chapter 8
Project Management
Developing the new diagram editors for UML-B has been an involved and complexprocess, requiring careful management of time and personnel throughout the courseof the project. The roles of each individual, group dynamics, project planning andcommunication are discussed in this chapter.
8.1 Individual Roles
The group members had little prior knowledge about the technologies being used in thisproject. As the project progressed, members were able to specialise their skills in variousaspects of the technologies used.
While a large amount of the project was group based especially during the specificationof requirements and design, the group was able to split the work into individual taskswhen it came to implementing the models designed.
8.1.1 James Amor
James brought a good knowledge of Java to the project, along with a solid understandingof the UML 2.0 diagram set. As a result James took on a major part in the group’s designmeetings, those held with the group’s supervisors and in drawing up the requirementsspecifications for each diagram. James also took a secondary coding role, providingthe additional functionality needed on the Component Diagram and acquiring a goodunderstanding of the GMF framework through the implementation process. James alsotook on the role of editor for the group’s final report, becoming responsible for ensuringthat the report was consistent and well proof read.
During the implementation process, James worked on the Object Diagram and theComponent diagram. The Object Diagram was a relatively simple model to implement,
56

Chapter 8 Project Management 57
whilst the Component diagram was far more complex, with a hard to define graphicaleditor, requiring large amounts of custom code. This involved the definition of newgraphical elements and the creation of a Layout Manager to snap Interfaces to the sideof Components.
In writing the report, James wrote about the diagrams he implemented in the Require-ments and Design chapters and wrote, with contributions from other members of thegroup, the Evaluation and Editor Construction chapters. James also contributed to theProject Management and Testing chapters.
8.1.2 Tim Lewy
Tim came to the project from a strong Java background, with a keen interest in softwareengineering, application development and implementing technologies. As a result he tookon the major programming aspects of the project, in particular the Sequence Diagram,becoming an expert in extending and manipulating the supplied frameworks to providecomplex functionality. In meetings he gave many demonstrations of the work in progress,answering questions on implementation specifics and endeavouring to ensure that thesoftware engineering aspects of the project were always well looked after, and did notbecome overlooked.
During the implementation process, Tim worked the Sequence Diagram. With theSequence Diagram being extremely challenging in terms of developing an entirely newLayout Manager and linking system that was not supported by GMF.
In writing the report, Tim wrote about the diagram he implemented in the Require-ments and Design chapters, along with the vast technical challenges of implementingthe Sequence Diagram. Tim also researched and wrote background on UML 2.0, Eclipseand its various plug-ins as well as contributing to the Abstract, Introduction, EditorConstruction, Future Work, Testing, Project Management and Conclusion chapters.
8.1.3 Chris Lovell
Chris was the only member of the group to take the required course, Comp3011: CriticalSystems and as such provided insight into B for the group. The knowledge of B was of useto the group during the specification of requirements, so as to help develop links betweenUML 2.0 and B. His knowledge of B was also used to answer questions in progressseminars that revolved around the ideas of translating the new diagrams produced to Bor animation sequences. Chris was also the only member of the group to have experiencein using LaTeX to produce a large technical document and so made sure this processwent smoothly by supporting the other group members.

Chapter 8 Project Management 58
During the implementation process, Chris worked on Use-Case Diagram and the ActivityDiagram. With the Use-Case Diagram being a relatively easy diagram to implement andthe Activity Diagram being a far more complex diagram in terms of defining a metamodeland controlling flows between diagram elements.
In writing the report, Chris wrote about the diagrams he implemented in the Require-ments and Design chapters. Chris also wrote the formal methods sections of the Back-ground chapter, along with sections in the Project Management, Future Work, Testing,Conclusions chapters and compiling the Appendices.
8.2 Group Dynamics
Even though none of the group members had worked on projects with each other previ-ously, the group quickly gelled and worked solidly together throughout the entire project.This group project was also unusual in that no one member neither acted nor needed toact as a group leader to guide the project. The reason for there being no requirement fora group leader was that we divided the tasks to be carried out as a group and individualmembers chose the tasks to do themselves. Each member then took full responsibilityfor ensuring that the task was completed too a very high standard.
Throughout the project, all group members listened to each others ideas and thoughtsabout the direction the project should take, along with determining how to resolve thetechnical challenges faced. This was especially important in working out the require-ments for the diagrams developed and in writing the final technical report. Equallyimportant was group members questioning each others ideas to try and determine if aparticular line of thinking may lead to undesirable consequences elsewhere in the project.For example, when defining how an animation sequence could be converted back intoa Sequence Diagram, the idea was originally presented that each Event Call in the se-quence would start from the Class that the previous Event Call ended. After analysingthis further we realised that this could create diagrams with the wrong meaning, asdiscussed in Section 7.1.2. Next the idea that Event Calls would not need to have astarting Class when being converted from an animation sequence was introduced by agroup member. This idea again seemed reasonable, but when another group memberquestioned the technical feasibility of defining a link in GMF with no starting node, theidea was refined further to end with the method defined in Section 7.1.2.
There was a level or respect in the group in ensuring that work was carried out as soon aspossible. For example, most of the design meetings took place on a Thursday or Fridayand usually ended with a couple of new diagram types that could be implemented. Theusual etiquette was for a proof of concept prototype diagram to be implemented by thefollowing Monday morning were any implementation issues were discussed, the level ofcompleteness of the diagram only depended on the technical aspects of the model.

Chapter 8 Project Management 59
When a group member became stuck with an aspect of the project, be it trying to solvea particular problem, understanding how to create the graphs in Eclipse or creating thefinal document in LaTeX, another group member was quick to offer guidance or help.For example, in the beginning of the project we struggled to understand how to useGMF to create the diagrams as this process had minimal documentation. One groupmember was able to put in more time in trying to understand how to develop a diagramsusing GMF and so was then able to help the rest of the group when they became stuckwith various issues in the implementation process. Another example came later on in theproject when the report writing started. We decided to write the document in LaTeX,so as to help version control and multiple accesses to the document. However, only onegroup member had any real experience in writing a large report in LaTeX and so itbecame their responsibility to support the other two group members.
Overall, the group formed a very strong bond during the project, meaning the wholeproject was completed as a group and that any decisions, problems and achievementsbelonged to the group and not any individual.
8.3 Work Plan Overview
The planning of the project was undertaken by the entire group at the beginning ofthe project. A meeting was held to discuss the work that needed to be done and theindividual task breakdowns that this would entail. Estimates of the time it would taketo complete each task were drawn up, resulting in the Gantt chart shown in Figure 8.1.
Figure 8.1: The Initial Gantt Chart, produced during Week One
This Gantt chart shows that the group intended to have all the diagram editors completeby the end of week 7 and then spend some time on translating one of the diagrams intoUML-B. This was a very optimistic estimate of, which it became clear was not achievableas development of the diagram editors was far more complex and time consuming than

Chapter 8 Project Management 60
had been initially thought. This led the group to have another project planning meetingto discuss and revise the goals of the project. The outcome of that meeting was thatthe group would concentrate on the diagram editors and drop the implementation of atranslation element of the project. The Gantt chart shown in Figure 8.2 was drawn upas a revised project schedule.
Figure 8.2: The Revised Gantt Chart, produced in Week Six
The revised Gantt chart shows that the estimates of the length of time required tocomplete the diagram editors has increased to compensate for their increased complexityand time drain. There is also a fifth diagram on the revised diagram (the ComponentDiagram), which was added after a meeting with the project supervisors. The revisedGantt chart has dropped the translation element, aside from the feasibility assessmentthat had been carried out.
Figure 8.3: The Final Gantt chart
The revised project plan was followed up to the end of the project, with some devel-opment tasks over-running. This was due to some last minute changes and integrating

Chapter 8 Project Management 61
the editors into the rest of the UML-B environment. The final Gantt chart, shown inFigure 8.3, charts the group’s actual progress through the project and is very similarto the revised Gantt chart, shown in Figure 8.2.
8.4 Communication
Communication between the group and the supervisors took place through email, dis-cussions and meetings.
8.4.1 Communication with Supervisors and Customer
Throughout the project we had weekly meetings with our supervisors, Michael Butlerand Colin Snook. These meetings were a time to show the progress we had made, addressany problems and guidance on the direction the project should take. We first met ourcustomer, Ian Johnson from AT Engine Controls Ltd. at our first progress seminar andwe met again at the end of the project where we demonstrated a near complete project.
As the project required us to look at how the models we were designing could fit in withUML-B and RODIN, the weekly meetings gave us opportunity to discuss the variousideas that we had. Most of the time we presented our ideas and our supervisors lookedat whether they were feasible ideas. In some situations we were unable to determine howa particular model might be used in UML-B and our supervisors were able to advise uson how they thought it might be used.
8.4.2 Communication between the Group
The group communicated through informal meetings in the undergraduate labs, moreformal meetings in library study rooms and through email.
During a typical week the group met for a minimum of four hours to discuss projectprogress, problems and technical issues that we needed to resolve. In the implementationprocess this usually involved us demonstrating what we had achieved so far, how we hadgone about achieving it and discussing any problems that were found when implementingit. As we found that we all met similar problems at various stages of the implementationprocess, these informal meetings were valuable to help each other.
The group also met roughly once a fortnight for a structured technical meeting lastingtwo to three hours where system requirements and designs were developed. In thesedesign meetings, each diagram type was presented to the group by the person who hadtaken the responsibility to implement the diagram. This presentation normally consistedof a reminder of what the standard UML 2.0 equivalent is required to have in terms of

Chapter 8 Project Management 62
its components along with how the model should be used. The presentation also hadthe initial ideas for how the diagram could be used in UML-B. The meeting then setout about defining the requirements as well as trying to see what the likely technicaldifficulties would be and these difficulties could be overcome.

Chapter 9
Evaluation
Updating and extending the UML-B tool set to include five new diagram types hasproduced a large number of requirements that cover the form and function of thesediagrams. The new diagrams all require evaluation against their original requirementsand this chapter discusses that evaluation.
9.1 Activity Diagram
The Activity Diagram meets all the requirements set out in Section 3.1. The requirementfor the diagram to use the same graphical elements as the UML 2.0 Activity Diagram hasbeen met, resulting in the same graphical appearance. The restrictions on the numberof Flows and outgoing Flows from each diagram element have been met to give the samefunctionality in the diagram as the UML 2.0 equivalent.
The integration of the diagram to the UML-B tool has been partially accomplished.Activity Diagrams can be liked to Machines, and opened through the right-click menufrom a Machine in a Package Diagram.
There is a very minor issue with Flows not joining directly to the edges of some nodesbut ending in blank space a small distance away. This is not a major issue and is purelygraphical. It does not detract from the functionality of the diagram, which will be veryuseful in the early stages of designing a UML-B system.
9.2 Component Diagram
The Component Diagram has met most of the points set out in Section 3.2. The graphicalrequirements for the Component, Required Interface and Provided Interface nodes have
63

Chapter 9 Evaluation 64
mostly been met, as have the requirement for the graphical appearance of Componentassociations.
The requirement for Interface pairs to join using the ‘ball and socket’ style has not beenmet due to time and complexity reasons. Instead, a dashed arrow with an open arrow-head has been used to join Required Interfaces to Provided Interfaces. The dashed arrowis legal notation in UML 2.0 and has not adversely affected the diagram’s functionalitybut has had the effect of allowing a Required Interface to connect to multiple ProvidedInterfaces. This was not specified but is advantageous as it allows the diagram to beused to model more complex interactions between Components.
The Component association link does not appear to link up properly to the Componentsit is linking. This is because the bounds of the Component element are a set distanceoutside the drawn rectangle of the Component. The result is that the anchor pointsfor the link attach to the bounds, not the drawn rectangle. As this does not affectthe functionality of the diagram it has not been fixed due to time restraints and thecomplexity of the fix. This is not a major issue for the diagram
The integration of the Component Diagram with the rest of the UML-B tool has beenimplemented at the Package level. A Component Diagram can be opened throughthe right-click popup menu from blank space in the Package Diagram and the owningPackage Diagram can be opened from a Component Diagram.
Overall the Component Diagram has met most of its requirements and not suffered infunctionality by not meeting any. The diagram has in fact gained some functionality byallowing Required Interfaces to link to many Provided Interfaces, thus allowing for themodelling of more complicated systems. The Component Diagram will be a very usefultool to aid in the UML-B refinement process.
9.3 Object Diagram
The Object Diagram has met most of the points specified in Section 3.3. All the graphicalrequirements have been met, resulting in the required UML 2.0 style being achieved. Thelook of the Object has been modified slightly (rounding the corners and adding a labelto the Attributes compartment) to better fit the look of the other UML-B diagrams butthis only serves to enhance the diagram. The associations in the diagram also meet therequirements.
The functionality for the Object name label to show both the Object’s name and itsclass type has not been met as this is not possible in GMF at this time. The requirementfor the Attribute name: value label to require that all Objects have a class type andthat all Attributes have a name has not been implemented due to time restrictions. Thisdoes not affect the core functionality of the diagram.

Chapter 9 Evaluation 65
The integration of the Object Diagram into the rest of UML-B has been largely accom-plished. The Object Diagram is creatable from both UML-B Machines and Contexts,through the right-click popup menu. It is also possible to open the containing Machineor Context Diagram from the Object Diagram, again, through the popup menu. Theability to create an Object as an instance of an existing Class has not been implementeddue to time constraints but this does not adversely affect the core functionality of thediagram.
Overall, the Object Diagram has met enough of the requirements for it to be usefulin the UML-B environment. The features that are unimplemented were mostly onlyrequired as additional touches to make the diagram easier to use. Their exclusion hasnot affected the core functionality to any great extent.
9.4 Sequence Diagram
The Sequence Diagram has met all of the points specified in Section 3.4. All of thegraphical requirements for the layout and appearance of the diagram have been adheredto and the required similarity to UML 2.0 has been achieved.
The requirement for the diagram to record Event Calls in the vertical order in whichthey appear in the diagram has been met by re-ordering the XMI produced from thediagram. This is a very important achievement for the diagram as it will make thetransition of the diagram into an animation script significantly easier.
The Sequence Diagram is also fully integrated to the UML-B Package Diagram; SequenceDiagrams are able to be linked to Machines and opened from the right-click menu onthe Machine. The Sequence Diagram has also integrated the Object Diagram, whichcan be linked to an Event Call in the diagram and opened accordingly.
Overall the Sequence Diagram has met all of the requirements and is a very usefuladdition to the UML-B tool.
9.5 Use-Case Diagram
The Use-Case Diagram meets all of the points specified in Section 3.5. The graphicalelements used are the same as those in the UML 2.0 Use-Case Diagram and the re-quirement to have the same look as UML 2.0 has been met. The requirement for thebehaviour of the diagrams has also been met. Restrictions on the elements that can beplaced into System Boxes have been observed and System Boxes are nestable. The linksbetween the elements in the diagram all conform to the specification in both graphicaland behavioural terms.

Chapter 9 Evaluation 66
The integration of Use-Case Diagrams into UML-B has been fully completed. Use-Case Diagrams are integrated to the UML-B Package Diagram and Machines withinthe Package Diagram. New Use-Case Diagrams can be created through the right-clickmenus from both of the existing UML-B elements. The parent element can be openedfrom the child Use-Case Diagram.
Overall, the Use-Case Diagram has met all of its requirements and provides all of thecorrect functionality to make it a useful tool in the design of UML-B systems.

Chapter 10
Conclusions
The existing UML-B notations provide diagrams that can be used by a developer tographically create B-method specifications. We have taken these notations and builtupon them, creating new diagram types and editors that support not just the formalmethods behind UML-B, but the entire software engineering process as well. This projecthas:
• Proposed five new diagram notations.
• Created supporting metamodels for these notations through EMF.
• Developed graphical editors for each notation through GEF and GMF.
• Defined possible semantics for the elements of each new diagram.
• Advised on possible future uses and work to take advantage of the extentions.
10.1 Project Outcome
This project has been extremely successful, we have produced a wide variety of diagramtypes that can now be used within UML-B. Implementing these diagrams has meantovercoming a very large learning curve in building the skills to effectively use EMF andGMF to define diagram editors.
Our biggest achievement has been to define possible new ways for the UML-B notationto be used, through utilising Sequence Diagrams to define animation sequences that canbe used in a model checker. It is also possible that the Sequence and Object Diagramscould be used to show the system state when a model checker violates the invariant. Thisis an important achievement as previously UML-B diagrams were only being thoughtof as being used in U2B translation. Combining Sequence and Object diagrams with
67

Chapter 10 Conclusions 68
the model checking process would open up a new area of development in RODIN andUML-B, with many possibilities for further projects.
10.2 Project Management
The group has performed well, forming an effective and cohesive team in a very shortspace of time. We have succeeded, especially in terms of work load management, sharingresponsibilities and using each others expertise. Our time and efforts have been handledwell and we have managed to bring the project to a natural conclusion within the tenweek time span.

Bibliography
[1] J.-R. Abrial. The B-Book: Assigning Programs to Meanings. Cambridge UniversityPress, New York, NY, USA, 1996.
[2] P. Amey. Dear sir, Yours faithfully: an everyday story of formality. In F. Redmilland T. Anderson, editors, Proc. 12th Safety-Critical Systems Symposium, pages3–15. Springer, 2004.
[3] C. Aniszczyk. Using GEF with EMF. Technical report, IBM, June 2005.
[4] M. Butler, C. Snook, and I. Oliver. UML-B Specification for Proven EmbeddedSystems Design, chapter 5. Springer, 2004.
[5] D. Craigen, S. Gerhart, and T. Ralston. Formal methods reality check: Industrialusage. IEEE Trans. Softw. Eng., 21(2):90–98, 1995.
[6] J. des Rivieres and W. Beaton. Eclipse platform technical overview. Technicalreport, The Eclipse Foundation, 2006.
[7] M. Fowler. UML Distilled, 3rd Edition. Pearson, 2003.
[8] IBM. Rational rose. http://www-306.ibm.com/software/rational/, last ac-cessed December 2006.
[9] Borland IDE: JBuilder 2007. http://www.borland.com/jbuilder/, last accessedDecember 2006.
[10] Java Development Toolkit (JDT). http://www.eclipse.org/jdt/, last accessedDecember 2006.
[11] D. Johan. Take control of your properties. Eclipse.org, May 2003.
[12] S. M. Kerner. Eclipse adoption on the rise. internetnews.com, September 2006.
[13] C. Kobryn. UML 3.0 and the future of modeling. Software Systems and Modelling,3(1), 2004.
[14] D. Lee. Display a UML diagram using Draw2D. Technical report, IBM, August2003.
69

BIBLIOGRAPHY 70
[15] M. Leuschel and M. Butler. ProB: A Model Checker for B. In K. Araki, S. Gnesi,and D. Mandrioli, editors, FME 2003: Formal Methods, LNCS 2805, pages 855–874.Springer-Verlag, 2003.
[16] C. Metayer, J.-R. Abrial, and L. Voisin. Event-b language. Technical report,RODIN, 2005.
[17] B. Moore, D. Dean, A. Gerber, G. Wagenknecht, and P. Vanderheyden. EclipseDevelopment using the Graphical Editing Framework and the Eclipse ModellingFramework. Technical report, IBM, last accessed December 2006.
[18] OMG. Unified modeling language 1.5 specification. Technical report, Object Man-agement Group, March 2003.
[19] RODIN - Rigorous Open Development Environment for Complex Systems. http:
//rodin.cs.ncl.ac.uk/, last accessed December 2006.
[20] Adobe - Flex 2 - IDE, Eclipse based IDE, Integrated Development Environment.http://www.adobe.com/products/flex/flexbuilder/, last accessed December2006.
[21] SAP - Components & Tools of SAP NetWeaver: SAP NetWeaver Developer Stu-dio. http://www.sap.com/platform/netweaver/components/developerstudio/index.epx, last accessed December 2006.
[22] S. Schneider. The B-Method: An Introduction. Palgrave, 2002.
[23] C. Snook. UML-B rose script. http://www.ecs.soton.ac.uk/∼cfs/, last accessedDecember 2006.
[24] C. Snook and M. Butler. Using a Graphical Design Tool for Formal Specification. InG. Kadoda, editor, Proc. 13th Anuual Workshop of the Psychology of ProgrammingInterest Group, pages 311–321, 2001.
[25] C. Snook and M. Butler. UML-B: Formal Modeling and Design Aided by UML.ACM Trans. Softw. Eng. Methodol., 15(1):92–122, 2006.
[26] The Eclipse Foundation. Eclipse forms independent organization. Eclipse.org,February 2004.
[27] The Eclipse Foundation. The Eclipse Tools Project, Top Level Project Charter.http://www.eclipse.org/tools/eclipsetools-charter.php, 2006.
[28] The Eclipse Foundation. Eclipse Modelling Framework. http://www.eclipse.
org/emf/, last accessed December 2006.
[29] The Eclipse Foundation. GMF Tutorial. http://wiki.eclipse.org/index.php/GMF Tutorial, last accessed December 2006.

BIBLIOGRAPHY 71
[30] The Eclipse Foundation. Graphical Editing Framework. http://www.eclipse.
org/gef/overview.html, last accessed December 2006.
[31] The Eclipse Foundation. Graphical Modelling Framework. http://www.eclipse.org/gmf/, last accessed December 2006.
[32] A. Tillman. A UML-B Drawing Tool for Eclipse. Master’s thesis, University ofSouthampton, School of Electronics and Computer Science, September 2006.
[33] J. M. Wing. A Specifiers Introduction to Formal Methods. Computer, 23(9):8–23,1990.

Appendix A
Testing Diagrams
1

Appendix A Testing Diagrams 2
Figure A.1: Example of the Activity Diagram with all link types implemented.

Appendix A Testing Diagrams 3
Figure A.2: Example of the Component Diagram with all links, elements and nestingfeatures shown.
Figure A.3: Example of the Object Diagram with all elements and links shown.

Appendix A Testing Diagrams 4
Figure A.4: Example of the Sequence Diagram with all elements and links shown.

Appendix A Testing Diagrams 5
Figure A.5: Example of the Use-Case Diagram with all link types implemented. Alsoshown is the nesting ability of the System Boxes. Note that the links between Use-Casesare not affected by whether the Use-Cases is inside a System Box or not, or whether
two Use-Cases are inside the same System Box.

Appendix B
CD Listing
Presented here is a summarised listing of all of the files that have been submitted.
B.1 Basic GMF Required Files
All five of the diagrams implemented have their own set of files that GMF requires to cre-ate the diagram type. These files are all stored in ac.soton.umlb.umlbMetamodel/model/and have the following file types and meanings as shown in Table B.1.
File Extension Description.gmfgraph Contains all of the image data that GMF uses in a diagram. Special
cases are for the Use-Case and Activity diagrams, as their .gmf-graph file calls in another .gmfgraph file that contains the drawingelements, this is covered later on.
.gmftool Defines the order and layout of the toolbar in the graphical editor.
.gmfmap Combines all elements of the metamodel, .gmfgraph and .gmftoolthat make up the given diagram.
.gmfgen Produced by GMF, this is the file that is used to generate thediagram code.
Table B.1: Table showing the files GMF expects and their location in our file system.All files can be found under ac.soton.umlb.umlbMetamodel/model/.
The prefixes for each diagram type are:
• umlbMetamodelActivity - for the Activity Diagram
• umlbComponentDiag - for the Component Diagram
• umlbObjectDiagram - for the Object Diagram
• umlbMetamodelStateDiag - for the State Diagram
• umlbMetamodelUseCaseDiag - for the Use Case Diagram
6

Appendix B CD Listing 7
B.1.1 Activity and Use-Case Diagram Special Case
Both the Activity and Use-Case Diagrams use two .gmfgraph files to define the graph-ical components. The .gmfgraph files mentioned previously define the top level graphi-cal components, but as both the Activity and Use-Case Diagrams require complicatedgraphical components these have been defined in secondary .gmfgraph files.
File Descriptionmygraphs/activityDiagramGraph.gmfgraph Contains all of the shapes that make up
the graphical components found in theActivity Diagram.
useCaseGraphs/useCaseModels.gmfgraph Contains all of the shapes that make upthe graphical components found in theUse-Case Diagram.
Table B.2: Table showing extended GMF graph files we have imple-mented and their location in our file system. All files can be found under
ac.soton.umlb.umlbMetamodel/model/.
B.2 Integration Code
All of the diagrams have had code added to them to assist in integrating the diagramswith the rest of UML-B. The integration code for each and its location is summarisedin Table B.3.
File DescriptionActivity Diagram activitydiagram.custom.OpenParentDiagram
packageDiagram.custom.OpenActivityDiagramclassDiagram.custom.OpenActivityDiagram
Component Diagram componentDiagram.custom.OpenParentDiagrampackageDiagram.custom.OpenComponentDiagram
Object Diagram objectdiagram.custom.OpenParentDiagrampackageDiagram.custom.OpenObjectDiagram
Sequence Diagram diagram.custom.OpenParentDiagramdiagram.custom.OpenObjectDiagrampackageDiagram.custom.OpenSequenceDiagram
Use-Case Diagram usecasediagram.custom.OpenParentDiagrampackageDiagram.custom.OpenUseCaseDiagram
Table B.3: Table of classes used for integrating diagrams into the rest of UML-B. Allpackages listed are local to the ac.soton.umlb.umlbMetamodel package

Appendix B CD Listing 8
B.3 Diagram Specific Code
Presented here are files that contain code that is specifically used by a particular diagramto achieve some behaviour.
B.3.1 Activity Diagram
File DescriptionUMLB AD ElementImpl.java Contains the code isLegalToEnd() and isLegal-
ToStartFrom() defined in the Activity Diagram Meta-model.
Table B.4: Table showing files in ac.soton.umlb.umlbMetamodel.componentDiagram/src/ac/soton/umlb/umlbMetamodel/umlbMetamodel/impl that are used by the Activity Dia-
gram to implement code defined in the Activity Diagram Metamodel.
File DescriptionUmlbMetamodelBaseItemSemanticEditPolicy.java Contains the Java constraints
isLegalToStartFrom() and isLe-galToEnd() defined in umlb-MetamodelActivity.gmfmap.
Table B.5: Table showing files in ac.soton.umlb.umlbMetamodel.activitydiagram/src/ac/soton/umlb/umlbMetamodel/activitydiagram/edit/policies that are used by the Activity
Diagram to implement code defined as Activity Diagram Link Constraints.
B.3.2 Component Diagram
File DescriptionComponent.java Code that defines the custom shape of the Component nodeComponentLayout.java Code that defines behaviour of the custom layout managerProvidedInterface.java Code that defines the shape of the Provided InterfaceRequiredInterface.java Code that defines the shape of the Required Interface
Table B.6: Table showing files in ac.soton.umlb.umlbMetamodel.componentDiagram/src/ac/soton/umlb/umlbMetamodel/componentDiagram/custom/ that are used by the Com-
ponent Diagram.

Appendix B CD Listing 9
B.3.3 Sequence Diagram
File Descriptionedit/parts/FixedConnectionAnchor.java Code for controlling Connection Anchor
behaviourcustom/ActivityLayout.java Layout code for the activity boxcustom/SequenceLayout.java Layout code for the diagramcustom/ObjectShape.java Code for generating a custom lifeline shape
Table B.7: Table showing files in ac.soton.umlb.umlbMetamodel.diagram/src/ac/soton/umlb/umlbMetamodel/diagram/ that are used by the Sequence Diagram.