
State of Rhode Island and Providence Plantations Rhode Island
Upload
truongnhanCategory
view
219download
0
University of Rhode Island Cooperative Extension
Linda T Green,Program Director
Rhode Island Sea Grant URI Watershed Watch Natural Resources Science Dept. The Coastal Institute in Kingston 1 Greenhouse Road Kingston, RI 02881
Elizabeth M. Herron,Program Coordinator
www.uri.edu/ce/wq/ww/html/ww.html
University of Rhode Island, United States Department of Agriculture, and local governments cooperating. Cooperative Extension in Rhode Island provides equal opportunities without regard to race, age, color, national origin, sex or sexual preference, creed, or handicap.
University of Rhode Island Watershed Watch
SALT PONDS MONITORING MANUAL SUPPLEMENT to
URI WATERSHED WATCH LAKE AND POND MONITORING MANUAL
WatershedWatch
URI
Written by: Linda T. Green and Elizabeth M. Herron
Department of Natural Resources Science
Cooperative Extension University of Rhode Island
Kingston, Rhode Island
May 2003 (updated May 2004)
Linda T. Green is URI Watershed Watch Program Director, Elizabeth Herron is URI Watershed Watch Program Coordinator in the Department of Natural Resources Science, Cooperative Extension Water Quality Programs.

2004
SALT PONDS MONITORING MANUAL SUPPLEMENT
to
URI Watershed Watch Lake and Pond Monitoring Manual
Contents
List of Monitoring Locations Map of Monitoring Locations Water Quality Measurements – Salt Ponds Monitoring Green Hill & Ninigret Ponds Monitoring Schedule Salt Ponds: Biweekly Monitoring Salt Ponds: Monitoring on Water Collection Days Chlorophyll and Nutrients Monitoring Dissolved Oxygen Bacterial Monitoring Salinity Monitoring Directions to the URI Watershed Watch Laboratory Field Data Sheet
Green Hill Pond and Ninigret Pond Monitoring Locations
Site Name SPC# URIWW # GH-Sea Lea 14 GH-1 GH-Teal Road 16G GH-2 GH-Indigo Point 16I GH-3 GH-Twin Peninsula 16T GH-4 Green Hill – in pond GH-5, Green Hill-in pond NP-Pond Street 12B NP-1 NP-Crawford Dock 15 NP-2 NP-Tockwotten Dock 11A NP-3 NP-Vigna Dock 12A NP-4 NP-Tom Cove 13B NP-5 NP-Stumpy Point 13A NP-6 NP-Fort Neck 13C NP-7

GH
- 5
GH
- 4
GH
- 2
GH
-3
1
Upd
ated
8/1
2/03
A
s pe
r Ral
ph M
inop
oli
File
nam
e:aa
ww
wor
d/D
EM
-E
PA
/GH
NP
/site
map
s.do
c
GH
-
NP
- 2
NP
- 1
NP
- 3
UR
IWW
#
Mon
itorin
g Lo
catio
n
S
PC
# G
H –
1
Gre
en H
ill a
t Sea
Lea
Dr.
11
G
H –
2
Gre
en H
ill a
t Tea
l Rd.
16
GH
– 3
G
reen
Hill
at I
ndig
o P
t.
14B
G
H –
4
Gre
en H
ill a
t Tw
in P
enin
sula
16
B
GH
– 5
G
reen
Hill
In C
ente
r of P
ond
NP
– 1
Nin
igre
t Pon
d at
Toc
kwot
ten
Doc
k 12
B
NP
– 2
Nin
igre
t Pon
d at
Cra
wfo
rd D
ock
15
NP
– 3
N
inig
ret P
ond
at P
ond
Stre
et
11A

WHAT WE MONITOR:
URI WATERSHED WATCH WATER QUALITY MEASUREMENTS
for Salt Ponds Monitoring on
Green Hill Pond, Ninigret Pond, Great Salt Pond
BIWEEKLY
Algal Biomass (estimated by chlorophyll content)
Water Temperature
Dissolved Oxygen
Salinity (optional)
Water Clarity (optional) (measured by Secchi Depth Transparency)
WATER COLLECTION DAYS (Approximately every four weeks)
A suite of water samples is collected by program volunteers brought to a central collection area, and then to URI to be analyzed by URI Watershed Watch staff for:
Fecal coliform, E. coli, & Enterococci Bacteria
Total, Nitrate, and Ammonium Nitrogen Total Phosphorus
Salinity

URI WATERSHED WATCH 2006 WATER QUALITY BIWEEKLY MONITORING SCHEDULE
SALT POND COALITION PONDS All monitoring will take place on Wednesday mornings to accommodate SPW bacterial analytical requirements. All monitoring and water sample collections will take place between 6 and 8:30 am. Please contact Ralph Minopoli (364-7771), Jack Frost (322-5001) or Ted Callender (322-8877) Salt Pond Watchers (SPW) Monitoring Coordinators for volunteer coordination and sample pick-up and delivery information, questions or concerns. Please contact Linda Green or Elizabeth Herron, URI Watershed Watch, 874-2905 for sampling and testing methods questions or concerns.
2006
Wednesday Dates
Biweekly monitoring: Collect and run samples in “WORK HORSE” BOTTLES for temperature,
chlorophyll, dissolved oxygen, (salinity optional)
SAMPLES COLLECTED AND
DELIVERED TO THE USFW OFFICES BIWEEKLY
May 10 May 17 X FIRST COLLECTION: May 17
All water sample bottles, chl-a filters 24
May 31 X SPW bacteria bottle only June 7
June 14 X SECOND COLLECTION: June 14 All water sample bottles, chl-a filters
21 June 28 X SPW bacteria bottle only July 5
July 12 X THIRD COLLECTION: July 12 All water sample bottles, chl-a filters
19 July 26 X SPW bacteria bottle only
August 2 August 9 X FOURTH COLLECTION: Aug. 9
All water sample bottles, chl-a filters 16
August 23 X SPW bacteria bottle only 30
Sept. 6 Week off – Enjoy Labor Day! Sept. 13 X FIFTH COLLECTION: Sept. 13
All water sample bottles, chl-a filters 20
Sept. 27 X
Chlorophyll filters only – keep in your freezer
(no SPW bacteria collection) October 4
October 11 X End of monitoring
SIXTH COLLECTION Oct. 11 All water sample bottles, chl-a filters

How to Monitor: Biweekly - 1
SALT PONDS: BIWEEKLY MONITORING of Bacteria, Chlorophyll, Dissolved Oxygen,
& Water Temperature This section summarizes the monitoring procedures used. The monitoring is conducted at various sites from the ends of docks in Green Hill & Ninigret Ponds and from one site in the middle of Green Hill Pond. Detailed descriptions of each individual procedure can be found in Section III, Specific Monitoring Techniques. Remember that some of the chemical reagents in your kits are dangerous. All of your supplies must be kept away from children. Use protective eyewear and gloves when performing the dissolved oxygen and salinity tests. Keep a supply of dry paper towels on hand to put under your bottles and wet paper towels to mop up spills. After you complete your monitoring tests the chemicals can be disposed of without causing harm. If you spill anything on yourself be sure to thtorughly wash the affected area – using pond water is fine. The amount of chemical reagents in your kits will not afttect the water quality of your water. You are muchmore important that any water sample! Before going out on the water make sure you have everything you need. The list is at the end of this section. Have all testing items set out on-shore out of direct sunlight to test your samples as soon as you come off the water. Monitoring of Green Hill & Ninigret Ponds is done on Wednesdays. Water samples must be delivered to the Fish and Wildlife office, Shoreline Plaza, Old Post Road, Charlestown by 8:30 am so that they can be picked up and brought to URI. 1. Go to your sampling location and role up the sleeve of your sampling arm! 2. Perform bacterial monitoring in water at arm's depth, removing "sterile" label
just before sampling on all bottles assigned for bacterial monitoring. The bottle you will be using to take your sample has a white location label and a magenta “Split sample” label on it.
Do not touch inside of bottle or cap. Do not put cap on boat seat. Do not use any water sampling device. Scoop your bottle down to get a water sample halfway to the bottom, or at arm’s length, whichever is shallower. Pour half the water into the URI micro lab bottle (it looks like a plastic urine specimen bottle.) Recap both bottles immediately after sampling and place in cooler.
3. Rinse both chlorophyll sample bottles ( the grey plastic bottles with the white top) with surface water, discarding the rinse water.
4. Hold your sample bottle completely upside down as you lower it into the water. When you have reached your arm’s length or halfway to the bottom, whichever is shallower, turn the bottle upright and scoop it up to the surface. Fill both of the chlorophyll bottles. Fill all bottles only to the shoulder of the bottle. Place filled bottles out of direct sunlight.
5. Fill the surface water temperature bottle with water taken at a depth of 6”.

How to Monitor: Biweekly - 2
6. Rinse your two glass dissolved oxygen bottles with pond water. Collect water
samples as in step 4. Fill both dissolved oxygen bottles to the very top and then cap them. Remember that the dissolved oxygen sample bottle must be filled to the brim with water before you begin the test. The presence of an air bubble will “contaminate” the sample with oxygen from the air.
7. Add the first three reagents for the dissolved oxygen test, following the instructions with your dissolved oxygen kit. The instructions are also in this packet. Once you have added the sulfuric acid (reagent with red cap) your samples are “fixed” and will not be affected by oxygen in the air.
8. Measure and record the temperature in your surface temperature bottle. 9. Measure and record the temperature of the water in one of the chlorphyll bottles.
Place filled bottles in a cooler or in your refrigerator. 10. Bring your bacteria bottle to the F&W office in Charlestown by 8:30 am. Return
home to finish your tests! 11. OUT OF DIRECT SUNLIGHT perform the chlorophyll filtration twice on each of
your two water samples, taking care to properly label the four filters before freezing them.
CAUTION: You should not have to push with all your strength in order to filter the water. If you see water drops coming out from between the top and bottom of the white plastic filter holder the filter has become plugged (either with algae or sediment). You must start over with a fresh filter and water sample. Use less water, for example 25 ml, and record the amount used on your postcard and on the filter itself. 15. Label your filters with location and date, put in plastic bag with desiccant chips,
store in your freezer. 16. Finish the dissolved oxygen test on your water samples in the clear glass bottles.
Run the test twice on each sample, so that you have four results. 17. Fill out the monitoring postcard with all your results. Remember to include the
location, date and your name(s). Mail the monitoring postcard right away! 18. Rinse your monitoring equipment with tap water, no detergent, let air dry.
Reassemble loosely.
Biweekly Monitoring Checklist
Bring to your dock/sampling site • Bacteria monitoring bottles • 2 plastic chlorophyll sample bottles • surface temperature bottle • dissolved oxygen kit • Thermometer • insulated cooler bag with ice/frozen cooler packs
In the shade or in the kitchen:
Monitoring Manual Paper Towels, goggles/glasses, gloves Chlorophyll filtration apparatus Dissolved Oxygen test kit Monitoring postcard

SALT PONDS: MONTHLY WATER URIWW COLLECTIONS
Procedures printed with bold type are those that are performed only on the water collection days.
1. Go to your sampling location, roll up the sleeve of your sampling arm! 2. Perform bacterial monitoring in water at arm's depth, using the bottle with the
magenta label, removing "sterile" label just before sampling. • Do not touch inside of bottle or cap. • Do not put cap on boat seat. • Do not use any water sampling device. • Pour half of water into second URI micro sterile bacteria bottle. • Recap bottles immediately after sampling and place in cooler.
3. Rinse both chlorophyll sample bottles with surface water. Also rinse all bottles with the “unfiltered” labels, plastic and glass, with surface water. Discard the rinse water.
4. Hold each sample bottle upside down as you lower them into the water. When you have reached your arm’s length or halfway to the bottom, whichever is less, turn the bottle upright and scoop it up to the surface. Fill all bottles to the shoulder of the bottle, except for the clear glass dissolved oxygen bottles, which must be filled to the brim.
5. Fill the surface water temperature bottle with water taken at a depth of 6”. 6. Rinse your two glass dissolved oxygen bottles with pond water. Collect water
samples as in step 4. Fill both dissolved oxygen bottles to the very top and then cap them. Remember that the dissolved oxygen sample bottle must be filled to the brim with water before you begin the test. The presence of an air bubble will “contaminate” the sample with oxygen from the air.
7. Add the first three reagents for the dissolved oxygen test, following the instructions with your dissolved oxygen kit. The instructions are also in this packet. Once you have added the sulfuric acid (reagent with red cap) your samples are “fixed” and will not be affected by oxygen in the air.
8. Measure and record the temperature in your surface temperature bottle. 9. Measure and record the temperature of the water in one of the plastic
chlorophyll bottles. Place filled bottles out of direct sunlight in a cooler. 10. While waiting for the D.O. flocculant to settle, OUT OF DIRECT SUNLIGHT
perform the chlorophyll filtration twice on each of your two samples, taking care to properly label the filters before freezing them. Save the filtered water in the brown glass bottle with the “filtered” label. Use the first filtered water to rinse the bottle. You will have more than enough water to fill the bottle.
CAUTION: You should not have to push with all your strength in order to filter the water. If you see water drops coming out from between the top and bottom of the white plastic filter holder the filter has become plugged (either with algae or sediment). You must start over with a fresh filter and water sample. Use less water, for example 25 ml, and record the amount used on your postcard and on the filter itself.
How to Monitor: Monthly Water Collections - 3

11. Use the labels provided to label your filters adding the date and amount of water filtered, put in plastic bag with desiccant chips.
12. Bring your filled bottles, and any chlorophyll filters, to the F&W office in Charlestown by 8:30 am. Return home to finish your dissolved oxygen tests!
13. Rinse your monitoring equipment with tap water, no detergent, let air dry. Reassemble loosely.
14. Fill out the monitoring postcard with all your results. Remember to include the location, date and your name(s). Mail the monitoring postcard right away!
Checklist for Water Collection Days For dockside/on the water:
• Monitoring postcard, monitoring instruction manual • sterile bacterial bottles • 2 white plastic chlorophyll/salinity sample bottles • surface temperature bottle • dissolved oxygen kit • thermometer • Glass and plastic bottles with magenta labels • insulated cooler bag, with frozen freezer pack
For on shore in the shade or in the kitchen: • Monitoring Postcard, monitoring manual • Paper towels, goggles, gloves • Chlorophyll filtration apparatus
• syringe • 2 round plastic filter holders • 4 small filter circles (from 35 mm film canister) • wrapping/blotter filters (coffee filter, or paper toweling) • tweezers • squeeze bottle containing magnesium carbonate • aluminum foil squares (your own) • chlorophyll labels
Brown glass bottle with yellow label for filtered water Remember that some of the chemical reagents in your kits are dangerous. All of your supplies must be kept away from children. Use protective eyewear and gloves when performing the tests. Keep a supply of dry paper towels on hand to put under your bottles and wet paper towels to mop up spills. After you complete your monitoring tests the chemicals can be disposed of in down your drainor onto the ground without causing harm.
How to Monitor: Monthly Water Collections - 4

Specific Monitoring Techniques: - Chlorophyll
CHLOROPHYLL & NUTRIENTS Sample collection and filtering for chlorophyll is done biweekly (every other week. It is only done on 1 meter water (or mid depth), not bottom water samples. It is very important to keep the water samples in an insulated bag and out of the light until you are ready to begin the chlorophyll filtration.
Equipment insulated cooler bag with freezer pack 2 plastic bottles (labeled for chlorophyll) of sample water chlorophyll filtering apparatus • 60 ml plastic syringe, marked at 50 ml • 2 round white plastic filter holders • small filter circles (stored in 35 mm film canister) • wrapping paper, coffee filters or paper toweling (provided by you) • tweezers or large safety pin • 4" squares of aluminum foil (your own) • sheet of chlorophyll labels • squeeze bottle containing magnesium carbonate (MgCO3) • resealable plastic bag containing blue desiccant chips
B. Instructions 1. Before you go out on the water, set out your filtering apparatus, making
sure you have everything you need, including paper toweling for wrapping filters and aluminum foil for sealing them.
2. Collect two separate 1-meter water samples using your water sampler. After rinsing your plastic chlorophyll bottle, fill the one bottle with your first sample, and the second bottle with your second sample. Cap the bottles and put them into your insulated bag. They must be kept out of sunlight.
3. Finish your other monitoring activities and return to shore. When you are back on shore and in subdued light:
4. Open one round white filter holder assembly. Next, using tweezers, remove 1 small filter from its container (35 mm film canister). Center the filter rough side up, gridded side down, on the metal screen on the bottom of the filter assembly. Handle the filters with your tweezers, not your fingers. Place the black rubber gasket on top of the filter and screw the filter holder back together.
5. Thoroughly shake one of the plastic bottles containing your water sample. Use your syringe to draw up approximately 20 ml. of water from the bottle. Push this water back and forth in the syringe, then out, discarding it. This rinses the syringe
Continued on next page→

Specific Monitoring Techniques: - Chlorophyll
6. Take apart your syringe by pulling the plunger all the way out. 7. Attach the round white filter holder to the syringe by twisting it on. You
will see that there is only one way in which it will fit. 8. Cap your sample bottle and shake well again. Hold the syringe with filter
holder facing down. Pour your water sample to the 50-ml line marked on the syringe.
9. Shake the flip top bottle of magnesium carbonate. Squeeze four drops of magnesium carbonate into the water sample in the syringe.
10. Attach the syringe plunger and slowly push the water through the filter apparatus with even pressure. Take your time! Usually you will discard the filtered water. On triseason sampling days you will save the filtered water in the brown glass bottle with the yellow-label that says “filtered.”
CAUTION: On some lakes with intense algal blooms the algae will completely clog the filter before you have filtered all 50 ml of water. You should not have to push with all your strength to filter the water sample. If this is the case or if you see water drops coming out from between the top and bottom of the white plastic filter holder the filter has become clogged (either with algae or sediment.) You must start over with a fresh filter and water sample. Use less water, say 25 ml, and record the amount used on your postcard and on the filter label itself.
11. When you have finished filtering your water sample, take the filter holder off the syringe and unscrew the two halves. Using tweezers lift out the black rubber gasket. Make sure you are out of direct sunlight.
12. Again using tweezers (or the tip of a large safety pin), lift out the filter circle by an edge, placing it on a piece of blotting/wrapping paper(paper towel/coffee filter). If the filter breaks while you are removing it, try to get all the pieces onto the blotting/wrapping filter paper.
13. Fold the filter circle in half with the rough sides together. BE SURE TO FOLD THE FILTER CIRCLE SO THAT THE CHLOROPHYLL SAMPLE IS ON THE INSIDE – your filter will be a half circle, like pita bread! Wrap the blotting/wrapping paper over the filter. Then place the folded filter paper on a piece of aluminum foil. Cover it loosely with foil.
14. Shake your first water sample in white plastic bottle again. Repeat from step 4 to filter a second sample of water from the first chlorophyll bottle.
15. Now repeat these steps twice with the water from the second chlorophyll sample bottle.
bYOU WILL HAVE FILTERED A TOTAL OF 4 SAMPLES OF WATER!
Continued on next page→

Specific Monitoring Techniques: - Chlorophyll
16. Securely fold a piece of aluminum foil around the four filters, attach a sticky label, filling in your name, the date, the amount of water you filtered, and the number of filters. Place the aluminum foil packet in the resealable plastic bag containing desiccant chips and then into your freezer.
17. Take apart the syringe and filter assembly. Rinse all apparatus with tap water - DO NOT USE DETERGENTS. Place upside down on a paper towel to dry. Reassemble loosely when dry.

GENERAL INFORMATION ABOUT DISSOLVED OXYGEN MONITORING
Dissolved oxygen (D.O.) monitoring will be done biweekly (every other week). Monitors on Green Hill and Ninigret Ponds and the associated tributaries will collect and analyze dissolved oxygen from samples taken halfway between the top and bottom of their monitoring location.
Run the dissolved oxygen test TWICE on each water sample. Record all measurements on your monitoring postcard. The most important first step is to make sure your dissolved oxygen bottle is filled to the brim and that there is no air bubble. When obtaining water samples for dissolved oxygen measurement you must be very careful to minimize contact of the water sample with air. While our water samples will typically contain 0-12 ppm oxygen, the air we breathe contains about 210,000 ppm oxygen
When you arrive back on shore, the dissolved oxygen test must be started before any other measurements. We use LaMotte test kits. The specific instructions for the kit are on the next pages as well as in the kit itself. Please familiarize yourself with procedure before you begin. The basic procedure involves "fixing" the oxygen by reacting it with several different chemicals. Once the dissolved oxygen is "fixed" atmospheric oxygen cannot affect the results. Read the information contained on the Material Safety Data Sheets that come with each kit. Glasses or safety goggles and gloves should be worn because of the chemical reagents used. The dissolved oxygen kits must be kept out of the reach of children. After the test is completed all the equipment must be carefully rinsed with tap water, and allowed to air dry on a paper towel. The chemicals used in the analysis can safely be flushed down the drain with plenty of water. Wash your hands thoroughly when you are done. If you spill any of the chemical reagents on yourself, immediately flush the affected area with water. If you on on a pond or at a stream just put the affected area in the water RIGHT AWAY and keep it in the water, fifteen minutes is the recommended amount of time. If you are at home turn on the water at the sink and flush the affected area. None of the chemicals in this kit will damage the lake/pond/stream you are monitoring. Your health and safety is much more important than any water sample!!!
Specific Monitoring Techniques: Dissolved Oxygen Monitoring 3-8

DISSOLVED OXYGEN MONITORING (Plastic and Glass Syringe) LaMotte Dissolved Oxygen Kit Instructions
Model 7414 or 5860
• The following instructions are also on the inside of the lid of your dissolved oxygen kit. Familiarize yourself with the instructions before your use your kit.
• Make sure you completely fill your dissolved oxygen bottle with water. Air bubbles will cause erroneously high results.
• Please follow the steps in the order they are written. Wear safety goggles and gloves while completing the procedure outlined below. Keep a supply of paper towels on hand to mop up any spills right away. Step 1 Fix the sample in the glass bottle. a) Holding the reagent bottle completely upside down, add 8 drops of Manganous
Sulfate solution (labeled “1” on bottle). b) Holding the reagent bottle completely upside down, add 8 drops of Alkaline
Potassium Iodide Azide (labeled “2” on bottle.) c) Cap and shake the bottle for 30 seconds. A clear to brownish orange floc will
cloud the sample bottle. d) Let the floc settle until the top half of the bottle is clear. Shake again. Allow to settle again. Wait a maximum of 15 minutes for the floc to settle. Step 2 Add 8 drops of Sulfuric Acid 1:1 (red cap on bottle) and shake for at least 30 seconds. The solution will turn brown to clear in color (If you still see some dark solids in the solution add 1 more drop). Your sample is now "fixed". Step 3 Pour your fixed sample into the graduated cylinder to the 20 mL mark and then pour into titration vial (glass vial labeled code 0299). Step 4 Fill the titrator (plastic syringe labeled code 1649 or glass syringe labeled code 0377). First push in the plunger to expel air and then put the tip of the titrator into the hole in the top of the titrating solution (bottle labeled Sodium Thiosulfate 0.025N). Turn bottle upside down and slowly pull back on the syringe plunger until the tip on the bottom of the plunger is well past the zero mark on the scale on the titrator. Step 5 Turn everything right side up. Slowly push the plunger until the large ring on the plunger of the plastic titrator or the black tip of the plunger of the glass titrator is right at the zero mark on the titrator. Remove the titrator from the sodium thiosulfate bottle. Step 6 Put the tip of the titrator into the opening on the plastic cap of the titration vial (code 0299) that contains your fixed sample.
Specific Monitoring Techniques: Dissolved Oxygen - 13

Step 7 Titrate the sample. Add the titrating solution one drop at a time by gently pushing the plunger. Swirl the solution between drops until the sample has turned pale yellow. If your solution is already pale yellow skip this step. If your solution is colorless you have zero mg/L dissolved oxygen (if this is the case you can proceed to step 8 for confirmation, if you like). Step 8 Pop off the plastic cap from the titration vial with the titrator still in the hole without moving the plunger. Add 8 drops of starch Indicator solution to the titration vial. The sample should now turn blue or black. Step 9 Continue titration. Put the cap and titrator back on the titration bottle and continue to add one drop at a time, swirling the solution between each drop. Stop right when the solution turns from blue to colorless. (If no color change occurs by the time the plunger tip reaches the bottom of the scale on the titrator, refill the titrator by filling with titrant to the zero mark and continue the titration. Include both titration amounts in the final test results.) Step 10 Read the test result directly from where the scale intersects the ring of the plunger for plastic titrator or the tip of the plunger for the glass titrator. The titrator is marked at 0.2 ppm increments. So if the titrator ring or tip (as appropriate) is touching the third line below the line marked “7” the result would be 7.6 mg/L dissolved oxygen. (If the titrator has been refilled once before, the result would be 17.6 mg/L dissolved oxygen.) Step 11 Repeat steps 1 through 9 for a duplicate test. If the results are more than 1 mg/L apart between the two tests, repeat the test again and record all three results on your monitoring postcard.
Specific Monitoring Techniques: Dissolved Oxygen - 14

COMMON QUESTIONS ABOUT ANALYZING
DISSOLVED OXYGEN
This assumes that you have collected your water sample(s) and have capped the bottle(s).
Should I pour off any of the water in my sample bottle before I add the reagents? NO! If you pour off some water you are introducing air (and oxygen). When you cap the bottle and shake it this oxygen can cause erroneously high results. Put the bottle on a paper towel if necessary to catch any water that spills over when you add the reagents. How should I hold the dropper bottles to get the eight drops of each reagent out? When you add the reagents - the managanous sulfate solution and the alkaline potassium iodide azide, hold the dropper bottles completely upside down. This ensures a uniform drop size. Why must I shake the bottle and let the floc settle twice? Doing this twice ensures that the chemical reactions are complete and that all the oxygen molecules have reacted with the reagents. Sometimes after I add the eight drops of sulfuric acid some brown flakes remain in the water sample. Is this OK? The brown flakes should be dissolved before you continue with your test. First, try shaking the sample bottle about fifteen seconds more to see if they dissolve. If this doesn't work add one more drop of sulfuric acid (red capped bottle). Occasionally in water with an algae bloom there may be some organic matter present in you sample. This won't dissolve. You should be able to tell the difference between it and the chemical flakes. What does it mean by my sample being "fixed"? In a practical sense it means that atmospheric oxygen will not contaminate your sample. The chemical reactions that occur in this analysis are explained at the end.
Specific Monitoring Techniques: Dissolved Oxygen Monitoring 3 - 10

What is the best way to measure the amount of fixed sample that I should titrate? If you have a plastic graduated cylinder, use it to measure 20 ml of fixed sample. If you don't have one pour the fixed sample directly into the titration tube (glass bottle labeled 0299). In either case make sure that the bottom of the meniscus is at the 20 ml line. Exactly how do I fill the syringe with the sodium thiosulfate? 1. Before you fill your syringe with sodium thiosulfate push the plunger to the bottom to expel air. 2. Insert the syringe into the opening in the sodium thiosulfate bottle. 3. Hold the sodium thiosulfate bottle upside down and slowly pull back on the plunger. What happens if I see air bubbles in the barrel of the syringe? Push the plunger all the way in and then pull back. You may have to do this several times to get rid of any air bubbles. How far back should I pull the barrel of the syringe? Pull back on the plunger until the black point of the barrel is right at the "0" line. The end result should be that the there is sodium thiosulfate filling the syringe and any attached tip, and that the point of the black plunger on the barrel is set right at zero. This is extremely important. Exactly how should I read the syringe? Hold the syringe vertically with the top of the syringe pointing up (and the tip down). The zero mark should be be facing up. Read the syringe where the tip of the plunger meets the scale. The scale is measured in units (bigger lines 0 to 10) and in two-tenths (0.2, 0.4, etc.)
Specific Monitoring Techniques: Dissolved Oxygen Monitoring 3 - 11
Okay, now I've got my syringe filled and the cap on the titrator bottle. How come sometimes the drops don't seem to fall into the water sample? Each cap should have a tiny vent hole in it so that as the sodium thiosulfate is added to the fixed water sample the displaced air can escape. If you don't have this tiny hole as you add the sodium thiosulfate instead of it dropping into the liquid it will run down the side of the bottle. This will also happen if the vent hole gets covered by a drop of liquid on top of the cap. So, make sure that 1) your cap has a vent hole, and 2) that is remains unobstructed during the titration. If your cap doesn't have a vent hole you can easily make one or enlarge an existing one by heating a pin and pushing it through the plastic. The directions say to add sodium thiosulfate until the water samples turns a straw yellow. How much does the color matter? Why shouldn't I add the starch indicator all at once in the beginning? ? I checked with Steve Wildberger of LaMotte Chemical Company about these questions. He feels that if you add the starch indicator all at once you will be likely to overshoot the end point. The color change from dark blue to colorless is much more abrupt than the more gradual change from brown to yellow. The pale yellow color in itself is a indicator that you are nearing the end point of the titration. He suggests that the yellow color you should be looking for when adding the indicator is "a manila folder yellow" rather than a straw yellow. I have also found that in high oxygen water if you add the starch indicator in the beginning the dark blue color seems to coat the sides of the titration tube, which makes the visual determination of the endpoint more difficult. My water sample is pale yellow right after it is fixed. Do I still have to see it get lighter before I add the starch indicator? If your water sample is already a pale yellow after it is fixed, add the starch indicator before you begin your titration. If your sample is completely colorless after it is fixed and remains that way after you add the indicator this means that there is no dissolved oxygen in your sample. If this is the case you might want to check the dissolved oxygen content of the surface water just to make sure that the reagents in your kit are still functioning properly. If the surface water also has no detectable dissolved oxygen, call RI Watershed Watch at 792-2905 so that we can check your reagents to make sure everything is OK. How many times should I run the test on my water sample? You should run the dissolved oxygen test at least twice on you water sample. If the results are more than 0.6-1.0 ppm apart run it a third time. Remember to report all the results on your monitoring postcard. What should I do with any leftover sodium thiosulfate in the syringe? After you have read the result from the syringe, discard any remaining sodium thiosulfate by emptying the syringe into the titration vial. Do not put it back into the bottle it came from. Then take apart your syringe and rinse it with tap water. Store it with the plunger backed off from the bottom of the syringe.
Specific Monitoring Techniques: Dissolved Oxygen Monitoring 3 - 12

Chemical Reactions when Using the Azide Modification of the Winkler Method to Test for Dissolved Oxygen
(from: Clean Water: A Guide to Water Quality Monitoring, by E. Stancioff, University of Maine Cooperative Extension.) The first step in a dissolved oxygen (DO) titration is the addition of manganous sulfate solution (4167) and alkaline potassium iodide azide (7166) to the water sample. These reagents react with each other to form a precipitate, or floc, of manganous hydroxide, Mn(OH)2. Chemically the reaction is: MnSO4 + 2KOH Mn(OH)2 + K2SO4 manganous sulfate + potassium sulfate manganous hydroxide + potassium sulfate Immediately upon formation of the precipitate, the oxygen in the water oxidizes an equivalent amount of the manganous hydroxide to manganic hydroxide. In other words, for every molecule of oxygen in the water one molecule of manganous hydroxide is converted to manganic hydroxide. The reaction is: 2 Mn(OH)2 + O2 + 2H2O 2Mn(OH)4manganous hydroxide + oxygen + water manganic hydroxide After the precipitate is formed a strong acid, sulfuric acid 1:1 (6141WT) is added to the water sample. The acid converts the manganic hydroxide to manganic sulfate. At this point the sample is considered “fixed”. Any concern for additional oxygen being introduced into the sample is reduced. The chemical reaction is: 2Mn(OH)4 + 4H2SO4 2Mn(SO4)2 + 8H2O manganic hydroxide + sulfuric acid manganic sulfate + water Simultaneously, iodine from the potassium iodide in the alkaline potassium iodide azide solution is replaced by sulfate, releasing free iodine into the water. Since the sulfate for this reaction comes from the manganic sulfate which was formed from the reaction between the manganic hydroxide and oxygen; the amount of iodine released is directly proportional to the amount of oxygen present in the original sample. The release of free iodine is indicated by the sample turning a yellow-brown color. This chemical reaction is: 2Mn(SO4)2 + 4KI 2Mn(SO4) + 2K2SO4 + 2I2 manganic sulfate + potassium iodide manganic sulfate + potassium sulfate + iodine The final step in the Winkler titration is the addition of sodium thiosulfate. The sodium thiosulfate reacts with the free iodine to produce sodium iodide. When all the iodine has been converted the sample changes color from yellow-brown to colorless. Often a starch indicator is added to enhance the final endpoint. This chemical reaction is: 4NaS2O3 + 2I2 Na2S4O6 + 4NaI sodium thiosulfate + iodine sodium tetrathionate + sodium iodide
Specific Monitoring Techniques: Dissolved Oxygen 3 - 13

Wildlife
Sediments
Pets
Septic Systems
Waterfowl Domestic Animals
Runoff
Sewage Treatment Plants
SanitaryWaste
Wildlife
Sediments
Pets
Septic Systems
Waterfowl Domestic Animals
Runoff
Sewage Treatment Plants
Wildlife
Sediments
PetsWildlife
Sediments
Wildlife
Sediments
Pets
Septic Systems
Waterfowl Domestic Animals
Runoff
Sewage Treatment Plants
SanitaryWaste
Kelly Addy, Elizabeth Herron, and Linda Green URIWW-2, March 2003
URI
Is it safe to swim in the water? That’s a question we often hear when we say we are monitoring a favorite swimming spot. Researchers and regulatory agencies have determined that one way to answer that question is to conduct bacterial monitoring. They do this to determine the human health risk associated with recreational water contact. The bacteria selected for water quality monitoring rarely cause human illness; rather the occurrence of these bacteria indicates that fecal contamination may have occurred and pathogens may be present in the water. Pathogens are microorganisms that cause illnesses; they may be viruses, bacteria or protozoans. Direct measurement of pathogens, including giardia, cryptosporidium, and Norwalk virus, is expensive and impractical because:
• There are innumerable types of pathogens that may be in waterbodies; it would be impossible to check for all these pathogens.
• The presence of one pathogen may not indicate presence of others.
• Generally, simple laboratory techniques do not exist to measure pathogens.
Bacterial monitoring is a practical method to determine the potential health risk of water exposure. Bacteria are microscopic, single-celled organisms that can be found in virtually any environment. Bacterial indicators of pollution are in the intestines of warm-blooded animals, including humans, where many pathogens also originate. Indicator bacteria in a waterway come from many sources (Figure 1), e.g., animal droppings, faulty or leaking septic or sewage systems, combined sewage overflows (CSOs, see Box 1), stormwater runoff, boat sanitary waste and disturbed sediments.
Why Monitor Bacteria?
Bacterial indicators should meet as many of the criteria listed in Box 2 as possible to ensure safe swimming water. Water quality monitors screen water samples most frequently for fecal coliform (F.C.), Escherichia coli or enterococci as bacterial indicators (see Box 3 for details). These indicators are prevalent in the intestines of warm-blooded animals and associated with fecal contamination. Total coliforms are a group of closely related bacteria, fecal coliforms are a subgroup of total coliforms and E. coli are a specific species of F.C. bacteria (Figure 2). Enterococci are another group of bacteria unrelated to the coliforms.
Bacterial Monitoring URI WATERSHED WATCH, Cooperative Extension College of the Environment and Life Sciences (CELS) Department of Natural Resources Science (NRS) Coastal Institute in Kingston, 1 Greenhouse Road, Kingston, Rhode Island 02881-0804
What bacterial indicators are monitored?
Figure 1: Potential sources of bacteria to a waterway (from Ely, 1997).
Box 1: Combined Sewage Overflows (CSOs) Combined Sewage Overflow systems carry storm water from roadways and untreated sewage from home and businesses in the same pipes. On a dry day, all this waste water is treated by the sewage treatment plant. However, on very rainy days, the sewage treatment plant may not be able to treat all the water and may release some untreated waste water into waterways. CSO con-trol plans are in progress in the Providence area to mini-mize these inputs to Upper Narragansett Bay.
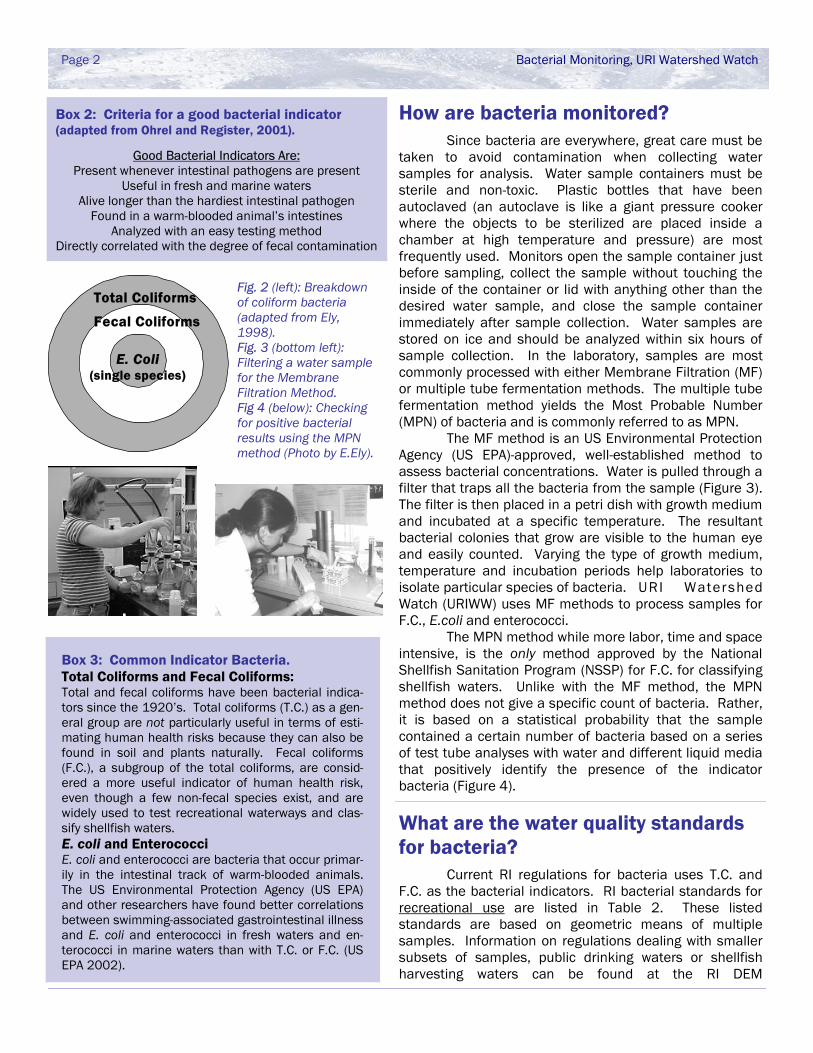
Since bacteria are everywhere, great care must be taken to avoid contamination when collecting water samples for analysis. Water sample containers must be sterile and non-toxic. Plastic bottles that have been autoclaved (an autoclave is like a giant pressure cooker where the objects to be sterilized are placed inside a chamber at high temperature and pressure) are most frequently used. Monitors open the sample container just before sampling, collect the sample without touching the inside of the container or lid with anything other than the desired water sample, and close the sample container immediately after sample collection. Water samples are stored on ice and should be analyzed within six hours of sample collection. In the laboratory, samples are most commonly processed with either Membrane Filtration (MF) or multiple tube fermentation methods. The multiple tube fermentation method yields the Most Probable Number (MPN) of bacteria and is commonly referred to as MPN. The MF method is an US Environmental Protection Agency (US EPA)-approved, well-established method to assess bacterial concentrations. Water is pulled through a filter that traps all the bacteria from the sample (Figure 3). The filter is then placed in a petri dish with growth medium and incubated at a specific temperature. The resultant bacterial colonies that grow are visible to the human eye and easily counted. Varying the type of growth medium, temperature and incubation periods help laboratories to isolate particular species of bacteria. URI Watershed Watch (URIWW) uses MF methods to process samples for F.C., E.coli and enterococci. The MPN method while more labor, time and space intensive, is the only method approved by the National Shellfish Sanitation Program (NSSP) for F.C. for classifying shellfish waters. Unlike with the MF method, the MPN method does not give a specific count of bacteria. Rather, it is based on a statistical probability that the sample contained a certain number of bacteria based on a series of test tube analyses with water and different liquid media that positively identify the presence of the indicator bacteria (Figure 4).
Page 2 Bacterial Monitoring, URI Watershed Watch
Total Coliforms
Fecal Coliforms
E. Coli (single species)
What are the water quality standards for bacteria? Current RI regulations for bacteria uses T.C. and F.C. as the bacterial indicators. RI bacterial standards for recreational use are listed in Table 2. These listed standards are based on geometric means of multiple samples. Information on regulations dealing with smaller subsets of samples, public drinking waters or shellfish harvesting waters can be found at the RI DEM
Fig. 2 (left): Breakdown of coliform bacteria (adapted from Ely, 1998). Fig. 3 (bottom left): Filtering a water sample for the Membrane Filtration Method. Fig 4 (below): Checking for positive bacterial results using the MPN method (Photo by E.Ely).
Box 3: Common Indicator Bacteria. Total Coliforms and Fecal Coliforms: Total and fecal coliforms have been bacterial indica-tors since the 1920’s. Total coliforms (T.C.) as a gen-eral group are not particularly useful in terms of esti-mating human health risks because they can also be found in soil and plants naturally. Fecal coliforms (F.C.), a subgroup of the total coliforms, are consid-ered a more useful indicator of human health risk, even though a few non-fecal species exist, and are widely used to test recreational waterways and clas-sify shellfish waters. E. coli and Enterococci E. coli and enterococci are bacteria that occur primar-ily in the intestinal track of warm-blooded animals. The US Environmental Protection Agency (US EPA) and other researchers have found better correlations between swimming-associated gastrointestinal illness and E. coli and enterococci in fresh waters and en-terococci in marine waters than with T.C. or F.C. (US EPA 2002).
How are bacteria monitored? Box 2: Criteria for a good bacterial indicator (adapted from Ohrel and Register, 2001).
Good Bacterial Indicators Are: Present whenever intestinal pathogens are present
Useful in fresh and marine waters Alive longer than the hardiest intestinal pathogen
Found in a warm-blooded animal’s intestines Analyzed with an easy testing method
Directly correlated with the degree of fecal contamination

Page 3
What do bacterial standards mean?
Bacterial Monitoring, URI Watershed Watch
Standards (continued)…. we bs i te (w ww .s ta te . r i . us/dem/programs/benviron/water/index.htm). The US EPA criteria (US EPA, 1986, 2002) are based on E. coli and enterococci as the bacterial indicators (Table 2). The federal Beach Act of 2000 mandates that states with coastal recreational waters adopt the US EPA criteria for designated beaches by 2004. However, most public health agencies and water quality monitors continue to use T.C. or F.C. as their indicator of choice, possibly because of their familiarity with analytical protocols and their extensive datasets for these indicators. Rhode Island is evaluating the US EPA indicators. In 2002, RI waterways were tested for enterococci to compile baseline data to compare to the F.C. currently mandated. URIWW can analyze water samples for F.C., E. coli and enterococci.
Recreational contact with waters at or above standard levels of indicator bacteria does not mean you will definitely get sick; however, your chances of getting sick are increased. The US EPA criteria are based on health risk of contracting gastrointestinal illnesses (EPA, 1986). More research is needed on the risk of contracting upper respiratory and skin ailments from recreational water contact. RI’s procedures for beach closings are outlined in Box 5. As in any facet of water quality monitoring, the US EPA and other water quality professionals emphasize the importance of repeat analysis of waterbodies for indicator bacteria. Single samples may give the most recent information about the water quality and a basis on which to post beach closings or advisories for potential health risks. However, repeat sampling should be conducted to determine variability in indicator bacterial levels or if a chronic contamination problem exists.
Re-test
CLOSE Beach
Exceed bacterialstandard
Is water known to be affected by a
pollution event*?
YES
NO
Retest daily until bacteria levels are
below the standard; then reopen
Beach remains
OPEN
YES
NO
CLOSE Beach
Does re-test exceed
standard?
Box 5: Beach closing procedures in RI (modified RI DOH flowchart).
* Pollution event may be a storm related CSO discharge. Corner illustration from the University of Wisconsin Cooperative Extension
Table 2: Bacterial standards for recreational water uses by RI1 and EPA
1 For more details on RI water classes and other bacterial standards please contact RI DEM: www.state.ri.us/dem/programs/benviron/water/index.htm 2 Standard represents the geometric mean of multiple samples. For more details on RI bacterial standards, visit the above RI DEM website. 3 From US EPA 1986 and 2002.
Box 4: Who monitors bacteria in RI? The RI Department of Health (DOH) monitors bacteria at 123 RI salt and freshwater beaches and posts subsequent beach closings (Box 5). The RI Department of Environmental Management (DEM) Shellfish program collects samples regularly in shellfish waters and conducts sanitary surveys. RI DEM, with help from URI Watershed Watch (URIWW) and other volunteer monitoring programs, monitors bacterial levels in additional water bodies. URIWW monitors waterways for indicator bacteria to augment the state’s dataset and to point out potential areas of concern.
Water Type Current RI Standard2 EPA Criteria2,3
————— count per 100 ml water sample —————
Freshwater
Total coliform 1000 Enterococci 33
Fecal coliform 200 E.coli 126
Total coliform 700 Enterococci 35
Fecal coliform 50
Saltwater

For further information on bacterial monitoring: Ely, E. 1998. Bacteria Testing Part 1: Meth-
ods Primer. The Volunteer Monitor. Vol-ume 10, No. 2.
Ely, E. 1998. Bacteria Testing Part 2: What Methods do Volunteer Groups Use? The Volunteer Monitor. Volume 10, No. 2.
Heufelder, G. 1997. Interpreting Fecal Coli-form Data: Tracking Down the Right Sources. The Volunteer Monitor. Volume 9, No. 2.
Miceli, G.A. 1998. Bacterial Testing Q & A. The Volunteer Monitor. Volume 10, No. 2.
Ohrel Jr., R.L. and K.M. Register. 2001. Volun-teer Estuary Monitoring: A Methods Man-ual. Second Edition. U.S. EPA.
This manual is available on-line at: www.epa.gov/owow/estuaries/monitor/ Turin, D. and M. Liebman. 2002. Keeping
Posted: Communicating Health Risks at Public Beaches. Journal of Urban Tech-nology 9:45-69.
US EPA. 1986. Ambient Water Quality Criteria for Bacteria-1986. EPAA440/5-84-002.
US EPA. 2002. Draft Implementation Guid-ance for Ambient Water Quality Criteria for Bacteria. EPA-823-B-02-003.
RI DEM Office of Water Resources: www.state.ri.us/dem/programs/benviron/water/index.htm RI DOH’s Bathing Beaches Program: www.health.state.ri.us/environment/beaches Issues of the Volunteer Monitor : www.epa.gov/owow/volunteer/vm_index.html
Kelly Addy, M.S., Elizabeth Herron, M.S., and Linda Green, M.S., are members of the Dept. of Natural Resources Science, College of the Environment and Life Sciences, University of Rhode Island. Contribution #3983 of the RI Agricultural Experiment Station, with support from RI Cooperative Extension, RI Department of Environmental Management, and RI Seagrant. Cooperative Extension in Rhode Island provides equal opportunities without regard to race, age, religion, color, national origin, sex or preference, creed or handicap.
Page 4 Bacterial Monitoring, URI Watershed Watch
Repeat measurements should be performed to determine if there is a long-term bacterial problem within a waterway and to identify any seasonal variation in bacterial levels. Waterbodies surrounded by summer communities can experience a surge in bacteria levels due to increased near-shore population and the resultant waste during the summer. In addition, warmer water may protect bacteria and promote growth. Conversely in the winter, bacteria tend to die off in cold waters. It may also be useful to sample for bacteria following storm events when CSOs may overflow and runoff may wash fecal waste from the land into water. These seasonal and storm event data often guide agencies in advisory protocols and may help to track bacterial sources. If a chronic bacterial problem is diagnosed, sanitary shoreline surveys are usually conducted to determine the source of the bacteria. Such a survey involves an investigator looking throughout the watershed for evidence of failing septic systems, broken sewer pipes, and storm drains discharging water during dry weather. Additional observations of large congregations of waterfowl, wildlife, farm animals or pets are noted. Dyes or tracers may be used to determine the pathways of some potential pollutants. Once the source of the high levels of bacteria is determined, remediation action can be taken. There have been many advances in bacterial source tracking using state-of-the-art microbiological techniques. Researchers compare the DNA of the bacteria in the water sample with DNA of known sources of fecal contamination. It is important to note that the US EPA no longer allows broad exemptions to their regulations for waterbodies that have identified the source of high bacteria loads as non-human (US EPA, 2002). More research needs be conducted on the potential of human health risk from the exposure to non-human fecal contamination. Therefore, the goal of this DNA fingerprinting is to help identify the source of the contamination for remediation purposes. In some instances where bacterial contamination cannot be resolved, most likely due to economic or social restraints, EPA allows states to deem waterbodies suitable for only secondary recreational contact. Activities such as canoeing or motor boating are allowed because water contact and immersion seem unlikely.
What can YOU do to minimize the amount of bacteria entering
waterways? • Have your septic system
inspected and pumped regularly. • Properly dispose of pet waste. • Don’t feed waterfowl. • Pump out boat waste at
approved pumping stations. • Support community plants to
construct or upgrade sewage treatment plant and eliminate CSO’s.
What can be done about high bacteria levels?
To learn more about the URI Watershed Watch program or their bacterial monitoring, please contact:
Linda Green, Program Director
Phone: 401-874-2905 Email: [email protected]
Elizabeth Herron, Program Coordinator Phone: 401-874-4552 Email: [email protected]
www.uri.edu/ce/wq/ww/html/ww.html

MONITORING SALINITY Salinity is a measurement of how much salt is dissolved in water. Salinity is usually expressed in parts per thousand (ppt). Seawater has approximately 35 parts salt per thousand parts of water. Drinking water has less than 0.5 ppt. In an estuary salinity generally increases with depth. In estuaries salinity and water temperature determine how well mixed the water is. Fresh and salt water usually do not mix readily when they first meet. However storms, tides, and wind all cause mixing to occur. Salinity controls what kinds of plants and animals can live in an estuary, depending on their salt tolerance.
MEASURING SALINITY USING THE LAMOTTE SALINITY TITRATION KIT
1. Fill the demineralizer bottle with tap water. It is the big bottle with the brown-black crystals in it.
2. Recap, making sure that the spout is closed, and shake vigorously for 30 seconds.
3. Fill the titration vial (code 0648) to the 10 ml line with demineralized water.
4. Fill the 1 ml titrator syringe (code 0376) with your water sample. Wipe off tip of the titrator syringe.
5. Dispense 0.5 ml of sample water into the titration vial containing demineralized water. Discard the rest of the water in the syringe.
6. Add 3 drops salinity reagent A. Cap the titration vial and swirl gently to mix. The solution will turn yellow.
7. Fill the 0 - 20 ml titrator syringe (code 0378) with salinity reagent B. 8. Insert that titrator syringe into the hole in the cap of the titration vial. 9. Depress the plunger to add reagent B dropwise. Swirl gently to mix the
reagent with the water sample. 10. The end point of the reaction is when the color changes from yellow
to cloudy pink-brown, sort of a grapefruit pink. 11. Read the titrator syringe where the tip of the plunger crosses the scale.
Record your result. (Remember that the smallest divisions are 0.4 ppt.). See the chart on the next page for help in reading the scale.
12. Repeat the test with another sample of water.
Specific Monitoring Techniques: Salinity - 6

Chemical Reactions When Using the Silver Nitrate Titration Method to Measure Salinity
Written by Kerrie Burgess, URI Watershed Watch student chemist,
summer 2001
The Argentometric Equation
The first step involves diluting the salt water sample with demineralized water. The water sample is then mixed with an indicator, potassium chromate, to produce the prepared solution. The liquid will be transparent yellow due to the chromate ion. This mixture contains both the chloride ions and the chromate ions in solution. The prepared solution is then titrated with silver nitrate until the solution changes from yellow to pink-orange. The reaction takes place in two steps.
•
•
The silver nitrate reacts with the chloride ions from the water sample to produce insoluble white silver chloride: AgNO3 (aq) + Cl- (aq) AgCl (s) + NO3
- (aq) Silver nitrate + chloride ion silver chloride solid + nitrate ion When all the chloride ion has been converted to silver chloride, the remaining silver nitrate will react with the chromate, the indicator, to form the pink-orange colored silver chromate precipitate. This color change signals the end of the reaction given above.
The volume of titrant, silver nitrate, added in the procedure will be used to calculate the salinity of the original water sample. The amount of chloride can be converted to the salinity of the sample by a multiplier dependent on the sample volume and the concentration of the silver nitrate. It is based on the Knudson equation: salinity (ppt) = 1.805 (Cl-) + 0.030, and has been modified by Harvey for the LaMotte kit we use. (personal communication, Charlie Gloyd, LaMotte Chemical Products Company, May 2001.)
Specific Monitoring Techniques: Salinity - 7

FIELD DATA SHEET The information on this sheet should duplicate the information on your Watershed Watch postcards. It is a good way for you to keep track of your data and It will prove invaluable in case any postcards are lost! Location monitored: Monitors:
Water Filt'd Salin- Salin- Initials Date Time temp. Chl? DO DO Light Wind Rain Tide ity ity.
General Information - 9