UNIVERSITY OF NOVA GORICA GRADUATE SCHOOL - …library/doktorati/okolje/32Budal.pdf · UNIVERSITY...
87
UNIVERSITY OF NOVA GORICA GRADUATE SCHOOL DEVELOPMENT OF NEW METHODS FOR DETERMINATION OF BIOGENIC AMINES AND INVESTIGATION OF RELATED ENZYMATIC PROCESSES DISSERTATION Sara Budal Mentor: prof.dr. Mladen Franko Nova Gorica, 2013
Transcript of UNIVERSITY OF NOVA GORICA GRADUATE SCHOOL - …library/doktorati/okolje/32Budal.pdf · UNIVERSITY...

UNIVERSITY OF NOVA GORICA
GRADUATE SCHOOL
DEVELOPMENT OF NEW METHODS
FOR DETERMINATION OF BIOGENIC AMINES
AND INVESTIGATION OF RELATED ENZYMATIC
PROCESSES
DISSERTATION
Sara Budal
Mentor: prof.dr. Mladen Franko
Nova Gorica, 2013

II
III
SUMMARY
Awareness concerning the importance of food safety, and related impacts on human
health has grown significantly in recent years due to potential toxicological and
physiological effects of food ingredients on individuals. Much emphasis has been
given to biogenic amines (BAs), as toxic substances usually present in fermented
food and used as indicators for food subjected to poor hygienic conditions during
food processing.
The toxicity of biogenic amines led to considerable interest in the development of
methods, and consequently also analytical technologies, for their determination. High
performance liquid chromatography (HPLC) is the most frequently used analytical
tool, for this purpose, but a derivatization step, necessary for BAs determination,
makes this technique time consuming in sample preparation steps. Therefore, for
screening purposes, an analytical method which enables rapid detection of trace
amounts of biogenic amines is very much needed.
In this work we used the thermal lens spectrometry (TLS) for development of an
analytical method, combined with an enzymatic reaction and a colorimetric reaction,
to avoid in this way the derivatization step.
In the enzymatic reaction, transglutaminase (TGase) catalyses an acyl transfer
reaction between the γ-carboxamide group of protein bound glutamine residue (Gln),
and the amino group of a primary amine, diamine or polyamine in peptides or
proteins; in our case the amino groups of BA. During this reaction ammonia is
released, and in our case detected with a colorimetric reaction known as indophenol
blue reaction. The presence of indophenol is visible when a particular blue coloration
is formed with a characteristic absorption band between 550 and 750 nm, with a
maximum at around 650 nm.
Novel dual beam TLS spectrometers based on the excitation from a He-Ne (632.8
nm) and a Kr-laser (647 nm) were constructed, tested and used for the detection of
indophenol. For the first time a probe beam at 543.5 nm was used as a second He-Ne
laser. This facilitates the alignment of the pump and probe beams, and their

IV
separation before reaching the detector, which would be much more demanding in
case of two read beams (632.8 and 647 nm). In addition, the shorter wavelength of
the probe beam contributes to a 16.4% higher sensitivity of the TLS measurement for
the given wavelengths.
The influence of two organic solvents, acetonitrile and ethanol, on indophenol
reaction was tested. Organic solvents were used as additives to water in thermal lens
spectrometry in order to obtain higher enhancement of the TLS signal, due to
generally better thermooptical properties of organic solvents in comparison with
water. The TLS enhancement factor, when using 25% acetonitrile/water mixture, was
1.62 times higher in comparison with the enhancement factor in water. Decision to
choose acetonitrile instead of ethanol is entirely due to the higher TLS signal
achieved with acetonitrile that results from a greater enhancement factor.
Batch mode measurement on a He-Ne TLS detection unit was initially performed to
test the performances and applicability of the described methods for the
determination of ammonia by the indophenol blue method. The limit of detection
achieved by TLS in water with 25% of added acetonitrile, after indophenol blue
method optimization, was 8 ng/mL, and is in fact 9.8 times lower when compared to
spectrophotometric measurements in water. In comparison to spectrophotometric
detection in 25% acetonitrile the improvement was even higher (16 times) which was
due to the effect of acetonitrile on spectral properties and the reaction rate of
indophenol blue formation.
The TGase enzymatic reaction was tested in combination with indophenol blue
reaction after its optimization. Tested BAs are putrescine, cadaverine, tyramine and
histamine. At this point, with this TLS setup, the achieved improvement are
expressed in a 44 to 135 fold lower LOD, for biogenic amines investigated,
compared to the reported enzymatic method in the literature. Limits of detection
ranged from 5.2×10⁻⁷
M to 2.0×10⁻⁶
M for putrescine and tyramine, respectively.
To improve achieved limits of detection for BAs, in batch mode, with the He-Ne
TLS detection unit, a new TLS system was constructed exploiting the higher power

V
of Kr-laser (200 mW), that also better matches the absorbance of indophenol at 650
nm. In a previous system the excitation laser emission line was at 632.8 nm, in this
case the emission line of Kr-laser is 647 nm, much closer to the absorption maximum
of indophenol blue at 650 nm. This contributes to a higher absorbance by 1.08 times.
The limits of detection achieved in this case for the four investigated biogenic amines
are between 12 to 32 times lower compared to those achieved by the He-Ne detection
unit, and ranged from 3.6×10⁻⁸
M to 1.3×10⁻⁷
M from cadaverine to tyramine,
respectively. Improvement was partially due to the seven-times higher excitation
laser power provided by the Kr-laser and to better matching of the excitation
wavelength with the absorption maximum of indophenol blue. Additional
improvement can only be attributed to better alignment of the system, which was not
carefully investigated for the He-Ne TLS system, which was constructed primarily
for testing purposes.
Developed batch mode method was also used for analysis of real samples of the
white wine to test applicability of the method in real samples. The method is not
specific for the identification of single biogenic amine, but allows the determination
of the total biogenic amines present. For this reason the quantity of biogenic amines
was expressed as equivalents of histamine, the only BA for which the maximum
contamination level is regulated. Tested samples were two different types of white
wine: home made wine from mixed white grapes and Rebula wine provided by the
Centre of Wine Research at the University of Nova Gorica. Based on the addition of
histamine and from the difference of TLS signals from spiked and original wine
samples, a concentration of BAs corresponding to (6.4±0.3)×10-7
M which
corresponds to 0.069±0.003 mg/L equivalents of histamine was estimated for home
made wine, and (1.8±0.9)×10-6
M concentration which correspond to 0.2±0.1 mg/L
equivalents of histamine for Rebula wine. Results indicate that in the selected
samples of wine the concentrations of BA were up to five times lower when
compared to the reported values in the literature. This allows us to consider the
developed TLS method as a highly sensitive and rapid tool for semi-quantitative
screening of BAs presence in real samples. However for the ultimate confirmation of
the presence of BAs in investigated samples and for final validation of the method, a

VI
comparative analysis with an independent analytical method such as HPLC is
necessary.
A flow injection analysis system (FIA) was constructed to facilitate sample handling
and improve sample throughput. A FIA manifold consisted of two different HPLC
pumps, one injection valve and a bioanalytical column with immobilized enzyme, a
reaction coil and Kr-TLS detection unit. Measurements demonstrated a complete loss
of activity of immobilized TGase. It was also clearly evident, that the reaction of
indophenol blue reaction proceeds even without the use of MTGase, and has at the
same time confirmed that the indophenol blue method suffered from BAs
interference. This, however, also confirmed that for screening purposes, the FIA-TLS
method can be used without the need of TGase, and provides comparable or lower
LODs (2.6×10⁻⁶
M for histamine and 7.7×10⁻⁶
M for tyramine), as an enzymatic
method reported in literature.
As known from the literature, indophenol blue reaction suffers from interference in
the presence of aminoacids that can cause errors in ammonia determination. For this
reason, three structurally different amino acids (asparagine, glycine, and histidine),
which cover almost entire spectrum of positive interferences by amino acids (0.8 –
56 %) as known from the literature, were tested in order to estimate possible margins
of positive errors from interferences. Determined relative error due to the
interference from aminoacids was found to be 6% for asparagines, 12% for glycine
and 20% for histidine, when the amino acids were present in concentrations
equimolar to those of ammonia entering the indophenol reaction. Based on these
results and known concentrations of free amino acids in natural waters (10-7
M) it
was concluded that significant positive errors from interfering amino acids can only
be expected at extremely low concentrations of ammonium (below 10-6
M). At
concentrations of ammonium ten times higher than the LOD of the TLS method
developed in this work the errors due to the presence of amino acids in natural waters
are estimated at 1-2% or less. However, the presence of amino acids shall not affect
the determination of biogenic amines in real samples, which requires extraction of

VII
biogenic amines. During this process the amino acids are separated and removed
because of their solubility in the aqueous phase.

VIII
IX
CONTENTS
1 Introduction ................................................................................................................................. 1
1.1 Objectives ............................................................................................................................ 3
2 Theoretical background .............................................................................................................. 4
2.1 Biogenic amines ................................................................................................................... 4 2.1.1 Toxicity of BAs............................................................................................................... 5 2.1.2 Function of BAs .............................................................................................................. 6 2.1.3 Presence in food .............................................................................................................. 6
2.1.3.1 Seafood .................................................................................................................. 7 2.1.3.2 Beer ....................................................................................................................... 7 2.1.3.3 Wine ...................................................................................................................... 8 2.1.3.4 Meat, fruits and vegetables .................................................................................... 9 2.1.3.5 Cheeses .................................................................................................................. 9
2.2 Determination of biogenic amines ..................................................................................... 10 2.2.1 Analytical techniques .................................................................................................... 10
2.2.1.1 Ammonia determination ...................................................................................... 12
2.3 Transglutaminase .............................................................................................................. 14 2.3.1 Transglutaminase catalysing reactions .......................................................................... 14 2.3.2 Transglutaminase and interaction with amines ............................................................. 17 2.3.3 Transglutaminase and diseases ..................................................................................... 17 2.3.4 Transglutaminase and its applications .......................................................................... 17 2.3.5 Transglutaminase in foods ............................................................................................ 18
2.4 Thermal Lens Spectrometry (TLS) ..................................................................................... 19
2.5 Flow Injection Analysis (FIA) system ................................................................................ 21
3 Experimental ............................................................................................................................. 23
3.1 Materials ............................................................................................................................ 23
3.2 Preparation of solutions .................................................................................................... 24 3.2.1 Solution for indophenol reaction ................................................................................... 24 3.2.2 Solution for enzymatic reaction .................................................................................... 24
3.3 Indophenol blue method for biogenic amines determination exploiting enzymatic reaction
25
3.4 Thermal lens detection system ........................................................................................... 25 3.4.1 He-Ne detection unit ..................................................................................................... 25 3.4.2 Kr-detection unit ........................................................................................................... 26
3.5 Bioanalytical system .......................................................................................................... 27 3.5.1 Enzyme immobilization on glass beads ........................................................................ 27 3.5.2 Protein quantization – Bradford reaction ...................................................................... 28 3.5.3 Transglutaminase activity ............................................................................................. 28 3.5.4 Bioanalytical FIA setup ................................................................................................ 29
4 Results and discussion ............................................................................................................... 31
4.1 Detection of ammonia by formation of indophenol............................................................ 31 4.1.2 Enhancement (E) factors in TLS ................................................................................... 34 4.1.3 TLS determination of ammonia .................................................................................... 37
4.1.3.1 Recovery test ....................................................................................................... 39 4.1.3.2 Interferences in ammonia determination ............................................................. 39
4.2 Detection of biogenic amines based on indophenol blue reaction ..................................... 41 4.2.1 Influence of buffers an MTGase (UV-Vis measurements) ........................................... 41 4.2.2 Influence of organic solvents on MTGase activity ....................................................... 43
X
4.2.3 Determination of BAs with He-Ne-TLS detection unit (batch mode) .......................... 43 4.2.4 Determination of BAs with Kr-TLS detection unit (batch mode) ................................ 46
4.2.4.1 Determination of biogenic amines in real samples.............................................. 48
4.3 FIA-TLS bioanalytical system ........................................................................................... 53 4.3.1 Influence of sample volume.......................................................................................... 53 4.3.2 Determination of BAs with Kr-TLS detection unit ...................................................... 54
4.3.2.1 Addition of acetonitile for BAs determination in the FIA-system ...................... 58
5 Conclusions ................................................................................................................................ 60
6 References .................................................................................................................................. 63

XI
LIST OF FIGURES
Figure 1: Structures of the most common biogenic amines. ........................................ 4
Figure 2: Reaction of BAs with amine oxidase enzyme. ............................................ 11
Figure 3: Reaction of a biogenic amine with the acyl groups donor, catalized by
transglutaminase. ....................................................................................................... 12
Figure 4: The Berthelot reaction ............................................................................... 13
Figure 5: Transglutaminase post-translational reactions. ........................................ 15
Figure 6: FIA sample steam and resulting peak diagram. ........................................ 22
Figure 7: Schematic representation of the He-Ne detection unit. ............................. 26
Figure 8: Schematic representation of Kr-detection unit. ........................................ 27
Figure 9: Bioanalytical FIA setup, consisting of two HPLC pumps, one injection
valve (200 μL inj.loop), bioanalytical column with immobilized TGase enzyme,
reaction coil and the TLS detection unit. ................................................................... 29
Figure 10: Kinetic curves of the indophenol formation with 5% hypochlorite water
solution and using commercial hypochlorite solution (50 mg/L NH4Cl). ................. 31
Figure 11: Typical calibration curve for the spectrophotometric determination of
ammonia based on indophenol formation in water after 10 minutes of incubation
time (R= 0.997; k=0.178 A×L/mg ). .......................................................................... 32
Figure 12: Absorbance spectrum of indophenol in water, in 25% ethanol and in 25%
acetonitrile/water mixture (concentration of NH4Cl = 250 mg/L) after 600 seconds of
incubation. ................................................................................................................. 33
Figure 13: Kinetic curves of indophenol formation in water and in 25% acetonitrile
water solution (NH4Cl 50 mg/L). ............................................................................... 34
Figure 14: Plot of the calculated effective enhancement factor as a function of the
acetonitrile or ethanol volume fraction. The curve is a plot of E values calculated
from Eq. (1) and multiplied by dilution factors. ........................................................ 37
Figure 15: Calibration curve for the determination of ammonium by TLS with He-Ne
as excitation laser, based on indophenol formation in 25% acetonitrile/water mixture
after 10 minutes of incubation time (R=0.998; k= 5.73 mV×L/mg). ......................... 38
Figure 16: Measured absorbances for indophenol blue formation after MTGasee
enzymatic reaction in different buffer solutions (BAs concentration 2mM). ............. 42
Figure 17: Kinetic curves of indophenol formation using putrescine as representative
biogenic amine (BA concentration 2mM) in different buffer solutions at 650nm. .... 42
Figure 18: Calibration curves for putrescine and cadaverine recorded by the He-Ne
detection unit (Rputrescine=0.987, kputrescine=506 V,; Rcadaverine=0.980; kcadaverine=186
V/M). .......................................................................................................................... 45
Figure 19: Calibration curves for histamine and tyramine detected by the He-Ne
detection unit (Rhistamine=0.993, khistamine=173 V/M; Rtyramine=0.996; ktyramine=129
V/M). .......................................................................................................................... 45
Figure 20: Calibration curves for putrescine and cadaverine detected by the Kr-TLS
detection unit (Rputrescine=0.964, kputrescine=7258 V/M; Rcadaverine=0.976;
kcadaverine=7745 V/M). ................................................................................................. 47
Figure 21: Calibration curves histamine and tyramine detected by the Kr-TLS
detection unit (Rhistamine=0.975, khistamine=4253 V/M; Rtyramine=0.996; ktyramine=2215
V/M). .......................................................................................................................... 47
Figure 22: Calibration curves for putrescine and cadaverine for the Kr-TLS
detection unit after extraction (Rputrescine=0.988, kputrescine=3814 V/M;
Rcadaverine=0.979; kcadaverine=3464 V/M). ..................................................................... 50

XII
Figure 23: Calibration curves for histamine and tyramine for the Kr-TLS detection
unit after extraction (Rhistamine=0.975, khistamine= 2515 V/M,; Rtyramine=0.999;
ktyramine=2010 V/M).(Data for histamine and tyramine at 5×10⁻⁷
M were omitted in
the linear fit). .............................................................................................................. 50
Figure 24: Signals of sample 1 and sample 2 with the Kr-TLS detection unit. .......... 53
Figure 25: Influence of the sample volume on the peak height (conditions: 0.2
mL/min pump A; 0.3 mL/min pump B; 2mM putrescine; excitation at 647 nm,
P=200mW ). ............................................................................................................... 54
Figure 26: FIA-Kr-TLS diagram of different BAs with the use of immobilized
MTGase and with CBZ-Gln-Gly (conditions: 0.2 mL/min pump A; 0.3 mL/min pump
B; BAs concentration: 0.5mM; 1mM; 2mM; 5mM; excitation at 647 nm, P=200mW).
.................................................................................................................................... 55
Figure 27: FIA-Kr-TLS diagram of different BAs without the use of MTGase and
without CBZ-Gln-Gly (conditions: 0.2 mL/min pump A; 0.3 mL/min pump B; BAs
concentration: 0.5mM; 1mM; 2mM; 5mM; excitation at 647 nm; P=200mW). ........ 56
Figure 28: FIA-Kr-TLS diagram of different BAs with the use of GTGase and with
CBZ-Gln-Gly (conditions: 0.2 mL/min pump A; 0.3 mL/min pump B; BAs
concentration: 0.5mM; 1mM; 2mM; 5mM; immobilized enzyme GTGase; excitation
at 647 nm; P=200mW). .............................................................................................. 57
Figure 29: FIA-Kr-TLS diagram of different BAs without the use of GTGase and
without CBZ-Gln-Gly (conditions: 0.2 mL/min pump A; 0.3 mL/min pump B; BAs
concentration: 0.5mM; 1mM; 2mM; 5mM; excitation at 647 nm; P=200mW). ........ 57
Figure 30: FIA-TLS diagram of different BAs without the use of TGase and without
CBZ-Gln-Gly (conditions: 0.2 mL/min pump A; 0.2 mL/min pump B; BAs
concentration: 0.05mM;0.1mM;0.25mM;0.5mM;1mM; excitation at 647 nm;
P=200mW). ................................................................................................................ 58

XIII
LIST OF TABLES
Table 1: Concentration of used reagents. .................................................................. 24
Table 2: Table of calculated LOD for indophenol formation on the
spectrophotometer. .................................................................................................... 34
Table 3: Thermooptical properties of water, acetonitrile and ethanol. .................... 35
Table 4: Calculated thermooptical properties of acetonitrile/water mixtures. ......... 36
Table 5: Calculated thermooptical properties of ethanol/water mixtures. ............... 36
Table 6: Table of calculated LOD for indophenol formation on the He-Ne TLS
detection unit. ............................................................................................................. 39
Table 7: Different concentration of fortified samples and recovery obtained. ......... 39
Table 8: Table of merit for batch mode determination of BAs with He-Ne TLS
detection unit. ............................................................................................................. 44
Table 9: Table of merit for batch mode determination of BAs with Kr-TLS detection
unit. ............................................................................................................................ 48
Table 10: Table of merit for batch mode determination of BAs with the Kr-TLS
detection unit after extraction. ................................................................................... 49
Table 11: Recoveries for determination of putrescine. .............................................. 51
Table 12: Recoveries for the determination of cadaverine. ....................................... 51
Table 13: Recoveries for the determination of histamine. ......................................... 51
Table 14: Recoveries for the determination of tyramine. .......................................... 52
Table 15: Table of merit for detection of BAs by the FIA-Kr-TLS system with an
addtion of 25% acetonitrile into the aqueous carrier solution. ................................ 59

XIV
ABBREVIATIONS
BA = Biogenic amine
BAs = Biogenic amines
TGase = Transglutaminase
MTGase = Microbial transglutaminase
GTGase = Transglutaminase from guinea pig liver
CBZ = N-carbobenzoxy
TLS = Thermal lens spectrometry
CPG = Controlled pore glass
FIA = Flow-injection analysis
LOD = Limit of detection
PUT = Putrescine
CAD = Cadaverine
HIS = Histamine
TYR = Tyramine
SD = standard desviation
RSD = relative standard deviation
SPE = solid phase extraction

1
1 Introduction
An awareness of the importance of a healthy diet has increased considerably in
recent years, and hence, any issue related to food safety has a considerable impact on
consumers’ behaviour and official policy. Demand for good quality and healthier
food products have prompted the research on compounds with toxic effect and
harmful impact on human health. Among others, many studies have focused on the
presence of biogenic amines (BAs) in foodstuffs and their adverse effect of on
humans.
BAs are formed mainly by microbial decarboxylation of amino acids, through a
fermentative process (Wantke F., 1996) or due to microbial contamination and poor
hygienic conditions during aging or storage and their content in food depends on
protein content in food (Leuschner R.G., 1998; Eerola S., 1997). ). In some cases
microbial contamination and related formation of BAs can also result from
environmental pollution by municipal wastewaters and sewage systems. The non-
observance of the optimal conditions of storage and conservation which determine
the speed of protein hydrolysation and at the same time, the start of microbial
degradation, and indicate the absence of hygiene during the processing, storage,
transport and distribution of the food products. Therefore, BAs are frequently used as
indicators of food quality and hygienic conditions during food processing.
The presence of BAs in different fermented food such as cheese (Novella-Rodríguez
S., 2003), fish (Lehane L., 2000), sausages (Suzzi G., 2003), meat (Loovas E., 1991)
and in beverages as beer ( Izquiredo-Pulido M., 2000) and wine (Manfroi L., 2009),
can cause different adverse effects, such as headaches, respiratory problems, heart
palpitations, hyper- or hypotension and several allergic reactions. These symptoms
can be amplified in individuals with respiratory and coronary problems, people with
intestinal problems (gastritis, stomach and colon ulcers) and individuals in treatment
with monoamine oxidase (MAO) or diamines oxidase (DAO) inhibitors used for
stress and depression therapy or in Alzheimer’s or Parkinson’s diseases.

2
The toxicity and potential use of BAs as food quality markers are the two main
reasons for the need of developing novel analytical methods for the determination of
BAs. The third reason for the growing demand for improved analytical methods is
the long time of analysis for all known methods and in some cases insufficient
sensitivity or selectivity.
Various methods for the determination of BAs exist at present and are mainly based
on chromatography (HPLC, GC-MS) that requires time-consuming derivatization
procedures for BAs, which last up to one hour (Proestos J., 2008). In HPLC, pre- or
post-column derivatization are commonly used for individual separation and
detection of BAs. Derivatization is necessary because the majority of BAs do not
possess chromophoric or fluorophoric moieties. O-phthalaldehyde (OPA) is one of
the preferred derivatising agents, giving rise to highly fluorescent derivatives, but it
can react only with primary amines. Dansyl-chloride, another widely used
derivatising reagent, can react also with secondary and tertiary amines (Proestos J.,
2008). Derivatives are stable and fluorescent and detectable in the UV region. Gas
chromatography (GC) is another widely used technique; the derivatization step is
needed to obtain the corresponding (o-heptafluorobutyryl) volatile derivatives that
allow the determination by gas chromatography (Fernandes J.O., 2000).Capillary
electrophoresis (CE) is attractive due to the short analysis time, without need of a
derivatization step and high specificity, but the lack of sensitivity is the main
problem in this case.
Other non chromatographic methods include ELISA tests, electrochemical
biosensors, and enzymatic methods.
ELISA tests were developed for histamine determination. The time required for
complete analysis is about 20 minutes, 10 for incubation, and rest for complete
enzyme activation and deactivation, before the absorbance is measured at 450 nm
(Marcobal A., 2004). However, by these test only histamine can be determinined. To
the best of our knowledge, ELISA tests for other biogenic amines were not reported
in literature.
Approximately same time (20 minutes) is also needed in the case of electrochemical
biosensor for determination of biogenic amines (Lange J., 2002). The drawback of

3
this method is that unlike in microplate readers used in ELISA, where up to 96
samples can be analysed simultaneously, each sample must be analyzed individually.
Enzymatic methods are often used and are commonly based on peroxidase enzymes
and detection of the produced hydrogen peroxide by an amperometric method (Male
K.B., 1996; Frébort I., 2000). Recently another enzymatic method was reported for
detection of biogenic amines, which utilizes transglutaminase and optical detection
(Punakivi K., 2006) and requires two hours of reaction time.
Relatively low sample throughput is in general the main drawback of the available
methods for detection of BAs. Therefore, rapid analytical methods, which enable
highly sensitive and selective detection of trace amounts of biogenic amines are
needed. In order to reduce the number of samples analysed by time consuming
methods, fast screening methods are highly desired as well. In this case, selectivity
can be sacrificed by determining total concentration instead of concentrations of
individual BAs, in order to gain higher sample throughput.
1.1 Objectives
This work focused on the development of a sensitive and high sample throughput
analytical method for the detection of biogenic amines in food samples.
From this perspective it is our general objective to investigate the applicability of
bioanalytical assays to introduce required selectivity, highly sensitive laser
techniques such as thermal lens spectrometry in order to provide appropriate
sensitivity and higher throughput as well as flow injection analysis to facilitate
sample handling and improve sample throughput.
Furthermore, our specific objectives include immobilization and incorporation of
transglutaminase into a flow injection system, construction and testing of a novel
thermal lens spectrometer as a detection system for batch mode as well as flow
injection measurements, and finally testing of the developed methods for analysis of
real samples.
4
2 Theoretical background
2.1 Biogenic amines
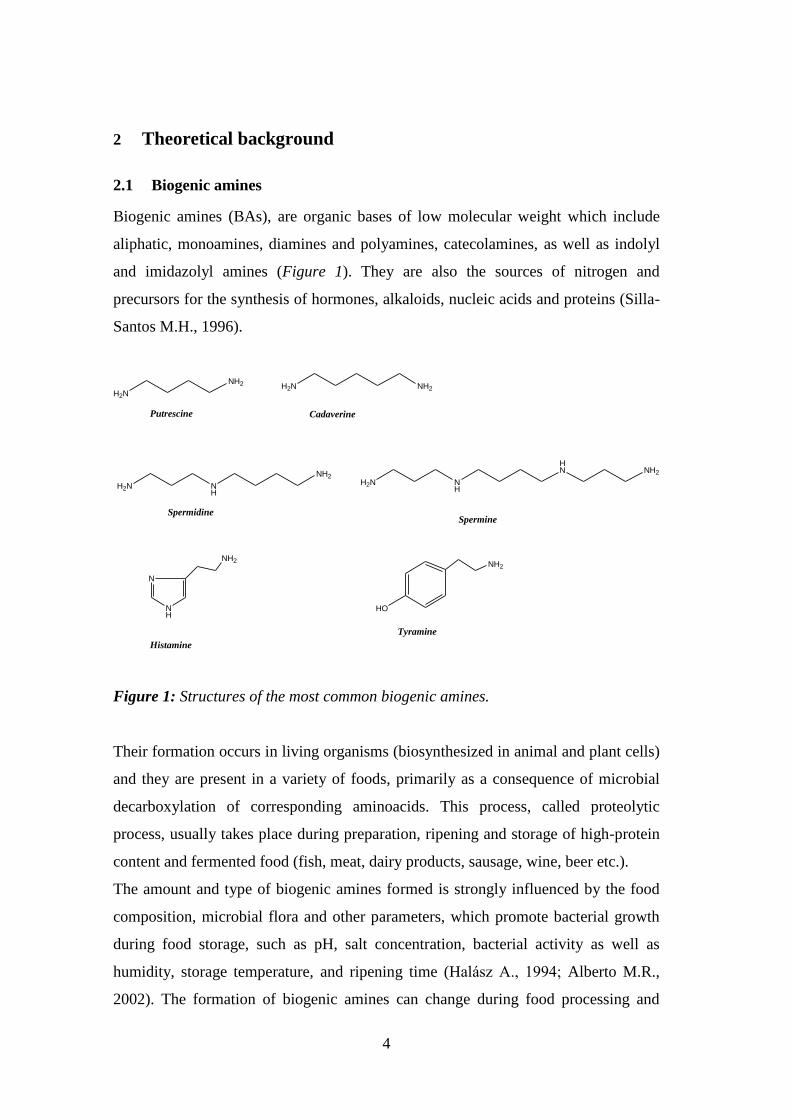
Biogenic amines (BAs), are organic bases of low molecular weight which include
aliphatic, monoamines, diamines and polyamines, catecolamines, as well as indolyl
and imidazolyl amines (Figure 1). They are also the sources of nitrogen and
precursors for the synthesis of hormones, alkaloids, nucleic acids and proteins (Silla-
Santos M.H., 1996).
Putrescine Cadaverine
SpermineSpermidine
H2N NH
HN NH2
H2N NH
NH2
H2N NH2H2N
NH2
NH
N
NH2
Histamine
HO
NH2
Tyramine
Figure 1: Structures of the most common biogenic amines.
Their formation occurs in living organisms (biosynthesized in animal and plant cells)
and they are present in a variety of foods, primarily as a consequence of microbial
decarboxylation of corresponding aminoacids. This process, called proteolytic
process, usually takes place during preparation, ripening and storage of high-protein
content and fermented food (fish, meat, dairy products, sausage, wine, beer etc.).
The amount and type of biogenic amines formed is strongly influenced by the food
composition, microbial flora and other parameters, which promote bacterial growth
during food storage, such as pH, salt concentration, bacterial activity as well as
humidity, storage temperature, and ripening time (Halász A., 1994; Alberto M.R.,
2002). The formation of biogenic amines can change during food processing and

5
storage, and can also be influenced by the hygienic conditions (Draisci R., 1998) in
the food production process. Their formation has been proposed as an index (Mietz
J.L.K., 1977) of chemical freshness of various foodstuffs such as fish, olives, and
fruits.
They are usually used as quality markers due to their impact on human health if
present in food at high concentration levels.
2.1.1 Toxicity of BAs
Low levels of BAs in food are not considered a serious risk. However, if the amount
of ingested BAs is high enough various physiological effects such as hypotension
(histamine, putrescine, cadaverine are interested) or hypertension (tyramine), nausea,
headache, rash, dizziness, cardiac palpitation and in some cases anaphylactic shock
syndrome and death in very extreme cases (Rawles D.D., 1996) can occure.
BAs are also considered precursors of carcinogens such as N-nitrosamines (Križek
M., 1998a). Reaction of nitrosating agents with primary amines produces short-lived
alkylating species that react with other components in the food matrix and generate
products (mainly alcohols) with toxic activity. The nitrosable secondary amines
(spermine, spermidine) can form nitrosamines through reaction with nitrite, while
tertiary amines produce a range of labile N-nitroso products (Halász A., 1994).
Normally, ingested BAs are metabolized by the natural detoxification system,
present in the gastro-intestinal tract of mammalians (Silla-Santos M.H., 1996). Under
normal conditions, exogenous amines adsorbed from food are rapidly detoxified by
the action of amine oxidase or conjugation. Enzymes involved in detoxification
system are monoamino oxidase ( MAO, EC 1.4.3.4) and diamino oxidase (DAO, EC
1.4.3.6). MAO and DAO are present in gut epithel and thus oxidation products of BA
are introduced in blood (Križek M., 1998a). Polyamines are usually first acetylated
and then oxidized by DAO (Ascar A., 1986; Stratton J.E., 1991).
In the case of allergic individuals, or those taking drugs acting as monoamine
inhibitors, or when the intake of BAs is high, the detoxification process is inefficient
and BAs accumulate in the body (Halász A., 1994). People with gastrointestinal
problems (gastritis, irritable bowel syndrome, Crohn’s disease, stomach and colonic
ulcers) are also at risk because the activity of oxidases in these individuals is lower
than in healthy individuals. Patients treated with inhibitors of MAO and DAO
6
(antihistamines, antimalaria agents, and psychopharmaceutics) have altered
metabolism of BAs that can also cause health problems (Silla-Santos M.H., 1996;
Halász A., 1994).
2.1.2 Function of BAs
In plants, polyamines are involved in a number of cell processes (cell division and
differentiation, synthesis of nucleic acids and proteins, membrane stability, stress
responses and delay in senescence). Different studies (Kalač P., 2002b) have
demonstrated that the polyamines putrescine, spermine and spermidine are
practically present in all vegetables at levels less than mg/100g of fresh weight.
In plants, diamines, like putrescine and polyamines spermine and spermidine are
engaged in physiological processes such as cell divisions, flowering, fruit
development and response to stress (Halász A., 1994).
Polyamines are responsible for growth, renovation and metabolism of every organ in
the body and are essential for maintaining the high metabolic activity and
immunological system of the gut (Silla-Santos M.H., 1996; Bardocz S., 1995). This
role diversity of polyamines in cellular metabolism and growth is recognized in
tumour growth, and for this reason inhibition of polyamine biosynthesis in tumour-
baring individuals is one of the targets in tumour therapy research (Bardocz S.,
1995).
BAs as putrescine, cadaverine, and spermine also act as free radical scavengers.
Tyramine also has an antioxidative activity that increases with its content, and
depends on amino and hydroxyl groups (Halász A., 1994).
Diamines such as histamine, putrescine and cadaverine are decomposition products
of histidine, ornithine and lysine.
2.1.3 Presence in food
Food can naturally contain potentially harmful substances such as BAs. Different
authors have reported intensive hypertensive crises following consumption of food
rich in tyramine or other amines from aged cheese, wine, beer and yeast extracts but
also vegetables such as sauerkraut, broad bean, banana peel and avocado (McCabe
B.J., 1986).
7
2.1.3.1 Seafood
The most frequent intoxication involves histamine and this poisoning is known as
“scombroid fish poisoning”, because it is often associated with the ingestion of
scombroid fish like tuna, mackerel and sardines (Halász A., 1994). Therefore, the
maximum permitted level of histamine in fish samples indicated, and adopted by
European Commission regulations, is 200 mg kg-1
. Histamine poisoning occurs
frequently in Asia. Histamine was reported in extremely high levels in some salted
and dried fermented products. Other countries outside Asia have also reported cases
of histamine poisoning (Lehane L., 2000). The largest outbreak (2656 cases) was
recorded in Japan in 1973 (Lehane L., 2000). USA FDA, has established 500 ppm as
a hazardous level for histamine (FDA, 2001). So, this is considered an indicator of
earlier microbial decomposition of seafood and a guidance level of 50 ppm is
considered as the chemical index for fresh fish spoilage. Histamine is generally not
uniformly distributed in a decomposed food. The histamine level of a decomposing
fish varied from 50 ppm in one location to exceeding 500 ppm in another location of
the tissue (FDA, 2001; Lehane L., 2000). The fish and fishery products with high
histamine level are prohibited from being sold for human consumption (Ben-Gigirey
B., 1998). A more detailed review in the oral toxicity to humans of histamine in fish
muscle suggested that histamine induced slight poisoning at 80-400 mg/kg (ppm)
fish, moderate poisoning at ›400 mg/kg and severe posoning at ›1000 mg/kg. Based
on the assessment of poisoning cases, the guidance levels suggested for histamine
content for seafood are for safe consumption ‹50mg/kg, toxic and unsafe for human
consumption ›1000 mg/kg (Lehane L., 2000).
2.1.3.2 Beer
Beer has been reported to be a health risk for some consumers, resulting from BAs
content. The first symptom is hypertensive crises after consumption in patients
treated with different drugs (painkillers, drugs for stress and depression treatment
and in case of Parkinson’s disease), that inhibit the natural detoxification enzyme
monoamine oxidase (MAO E.C 1.4.3.4.) (Shulman K.I., 1997). The BAs that cause
this effect is tyramine. Tyramine intakes exceeding 6 mg in a period of 4-h or beers

8
with more than 10mg of tyramine per litre have been considered dangerous for this
type of patients (Tailor S.A., 1994).
2.1.3.3 Wine
BAs may be formed by yeasts during the alcoholic fermentation; by lactic acid
bacteria (LAB) during malolactic fermentation (MLF) and during maturation of
wines. Biogenic amines can also be present in the must. Putrescine in grapes is
associated with potassium deficiencies in the soil. The main biogenic amines in wine
are histamine, tyramine, putrescine and cadaverine.
High levels of biogenic amines correlate fairly well with other wine spoilage
components for example butyric acid, lactic acid, acetic acid, ethylacetate and diethyl
succinate. Red wines also have higher levels of BAs than white wines, mainly due to
vinification practices and maturation (Manfroi L., 2009).
An increase in the levels of biogenic amines usually occurs towards the end of the
MLF or during maturation, when lactobacilli and pediococci are the main culprits.
At this stage there are no legal limits, but certain countries have recommended
maximum limits with regard to histamine levels (mg/L) that are applicable to
imported wines:
Switzerland - 10 mg/L
France - 8 mg/L
The Netherlands - 3 mg/L
Belgium - 5-6 mg/L
Germany - 2 mg/L
Austria - 10 mg/L
Factors influencing biogenic amine formation in wines are:
pH
levels of SO2
presence of precursor amino acids
number of decarboxylase positive LAB
duration of the initial fermentation phase
time of skin contact
spontaneous MLF
turbidity of wine during barrel maturation (lees contact)

9
2.1.3.4 Meat, fruits and vegetables
“Red meat” (adult bovine) and “white meat” (chicken) are particularly susceptible to
protein degradation under appropriate conditions. In fatty foods (bacon), a high
temperature and the presence of water can contribute to the formation of carcinogen
N-nitrosopyrrolidine from putrescine or spermidine (Loovas E., 1991).
Free biogenic amines in fruits and vegetables form the typical and characteristic taste
of mature foods and precursors of certain aroma compounds (Askar A., 1989). BAs
presence at relatively high concentrations in vegetables was also associated with
spoilage due to prolonged storage time and high temperature (Cerutti G., 1989; Yen
G.C., 1992).
Fruits and fruit juices are particularly rich in putrescine (Maxa E., 1993; Shalaby
A.R., 1996), while green vegetables are rich in spermidine (Valero D., 2002). It was
described (Cirilo M.P.G., 2003; Shalaby A.R.,2000) that cooking processes and heat
treatments can influence polyamine contents.
Tyramine and other aromatic amines are less widespread than polyamines, they can
reach particularly high concentrations in some vegetables (e.g. in Acacia berlandieri)
which seem to have a defensive role against insects and herbivores. In most fruits
and vegetables, the reported mean tyramine contents of 0.7, 2.3, 1.0, and 0.4
mg/100g, were respectively for banana pulp, avocado, orange pulp and tomato
(Udenfriend S., 1959). High mean levels of tyramine were reported by Tarjan and
Janossy (1978) for vegetables such as potato (84.0 mg/100g), paprika (26.6
mg/100g), tomato (25.0 mg/100g) and cabbage (67.0 mg/100mg). Mean tyramine
levels of 0.7 and 3.7 mg/100g were found in concentrated tomato paste and ketchup
samples respectively (Kalač P., 2002b).
2.1.3.5 Cheeses
The BAs of major interest present in cheeses are cadaverine, histamine, spermidine,
spermine and tyramine. They are responsible for aroma and taste, the most abundant
BAs in cheeses is tyramine, and is the principal cause of the so called “cheese
reaction”.

10
2.2 Determination of biogenic amines
Analysis of certain BAs in food is a necessity in order to assess potential health
hazards before consumption.
The highest drawbacks in the analysis of BAs in food are:
a. Complexity of the sample matrix
b. Low concentration levels at which the compounds are present in the samples
(Busto O., 1994)
Trichloroacetic acid, hydrochloric acid or a methanol-water mixture have been used
for the extraction of biogenic amines from solid food samples (Lange J., 2002). A
purification and preconcentration process usually occur before BAs determination
and consist of liquid-liquid extraction (LLE) or solid phase extraction (SPE). SPE
has been preferred over liquid-liquid extraction because of the practical advantages
of no emulsions, better recoveries, cleaner extracts achievable, and the ability to
remove many interferences and matrix components selectively. Of course, SPE was
also prefered because of the much lower quantities of solvents required, and the
corresponding decrease in the volume of waste solvents produced. Another
advantage for SPE over LLE is that the LLE process requires at least two and usually
three successive solvent equilibrium, according to chromatographic theory and
practice, in order to achieve the highest recoveries. What has become one of the most
important advantages for SPE is that it is much more capable of being automated.
Such an advantage is very desirable during these times of tight timelines, abundant
needs for maximizing throughput while minimizing cost and optimizing the use of
scarce and expensive human resources.
Several studies confirm the suitability of C-18-based sorbent cartridges for BAs
extraction (Zotou A., 2003).
2.2.1 Analytical techniques
Several methods for BAs analysis in food are based on thin layer chromatography
(Naguib K., 1995), amino acid analysers (Simon-Sarkadi L., 1994a), liquid
chromatography (HPLC) (Moret S., 1996), gas chromatography (Rogers P.L., 1997),
biochemical assays (Zeng K., 2000), conventional capillary electrophoresis (CE)
(Santos B., 2004) with UV or fluorescence detection (Lange J., 2002), reversed phase

11
high performance liquid chromatography (HPLC) with pre-column (Reggiani R.,
1990), post-column (Hyvönen T., 1992) or on-column derivatization techniques,
coupled with UV-DAD or fluorescence detectors (Saito K., 1992). Alternative
approaches are based on HPLC tandem mass spectrometry (Gosetti F., 2007) and
ion-exchange chromatography with pulsed amperometry (Hoekstra J.C., 1998) or
conductometric detection (Cinquina A.L., 2004).
HPLC with pre- or post-column derivatization are commonly used for individual
separation and detection of BAs. Derivatization is necessary because the majority of
BAs do not possess chromophoric or fluorophoric moieties. Derivatization reagents
are o-phthalaldehyde, dansylchloride or dabsylchloride. The first one reacts only
with primary amines and its fluorescent derivatives are instable, the other two react
with primary and secondary amines and their derivatives are stable.
Recently electrochemical biosensors (Bouvrette T., 1997; Compagnone D., 2001;
Lange J., 2002; Niculescu M., 2000) or bioreactors (Tombelli S., 1998) for BAs
detection on commercial or home-purified enzymes have been used. The favourite
enzyme is the diamine oxidase (DAO) obtained from microorganisms, plants or
animal tissues that showed very different enzymatic activity.
However, HPLC methods require complicated and expensive instrumentation,
extensive sample pre-treatment and time consuming operation. Alternatively,
biosensor technology allows fast, cost effective and specific detection of BAs
(histamine) in seafood spoilage (Malle P., 1996).
For a more specific, simple and fast determinations of biogenic amines, the
enzymatic methods have become very common recently.
The most widely used methods are based on biogenic amine conversion to the
corresponding aldehydes by the amine oxidase that catalyzes a fast oxidative
deamination (Figure 2). Hydrogen peroxide and ammonia are produced in this
reaction.
RH2C NH2
+ O2 + H2Oamine
oxidase
R CHO + NH3 + H2O2
Figure 2: Reaction of BAs with amine oxidase enzyme.

12
In this method the hydrogen peroxide was detected with a colouring reaction using a
peroxidase enzyme and a chromogen.
Another promising enzyme that can be used for biogenic amine determination is the
transglutaminase, belonging to the group of acyltransferases. This enzyme catalyses
an acyl transfer reaction between a donor, the γ-carboxamide group of protein bound
glutamine residue (Gln), and the acceptor, the amino group of primary amine,
diamine or polyamine in peptides or proteins, in our case, the amino groups of BA.
In this reaction a cross-linkage is formed and ammonia is produced as a byproduct
(Figure 3) (Punakivi K., 2006).
R Gln R
C
O
NH2
Donor
+ H2N R NH2
Acceptor
Transglutaminase
R Gln R
C
O
NH
+
R NH2
NH3
Figure 3: Reaction of a biogenic amine with the acyl groups donor, catalized by
transglutaminase.
2.2.1.1 Ammonia determination
Ammonia is a significant alkaline pollutant which can be found in the atmosphere,
soil and water. Ammonia is released into the environment by industrial processes,
usage of natural or synthetic fertilizers or animal excreta. Ammonia emitted into the
troposphere is captured by acidic cloud droplets and neutralizes their acidity by
forming ammonium salts or reacting with acidic gases to form aerosol (Tanabe S.,
1988). Frequent presence of ammonium (or ammonia) in a vide variety of
environmental, clinical and industrial samples have stimulated the development of a
large number of methods for its determination. One of the most widely used methods
for the determination of ammonium (or ammonia) is the spectrophotometric
indophenol blue method (Clescieri L.S., 1998).
The indophenol blue method is based on a particular reaction known as the Berthelot
reaction. In this reaction the hypochlorite is necessary as a source of chlorine. Under
an alkaline condition, up to pH 10 (Prenter J., 2004), ammonium and hypochlorite
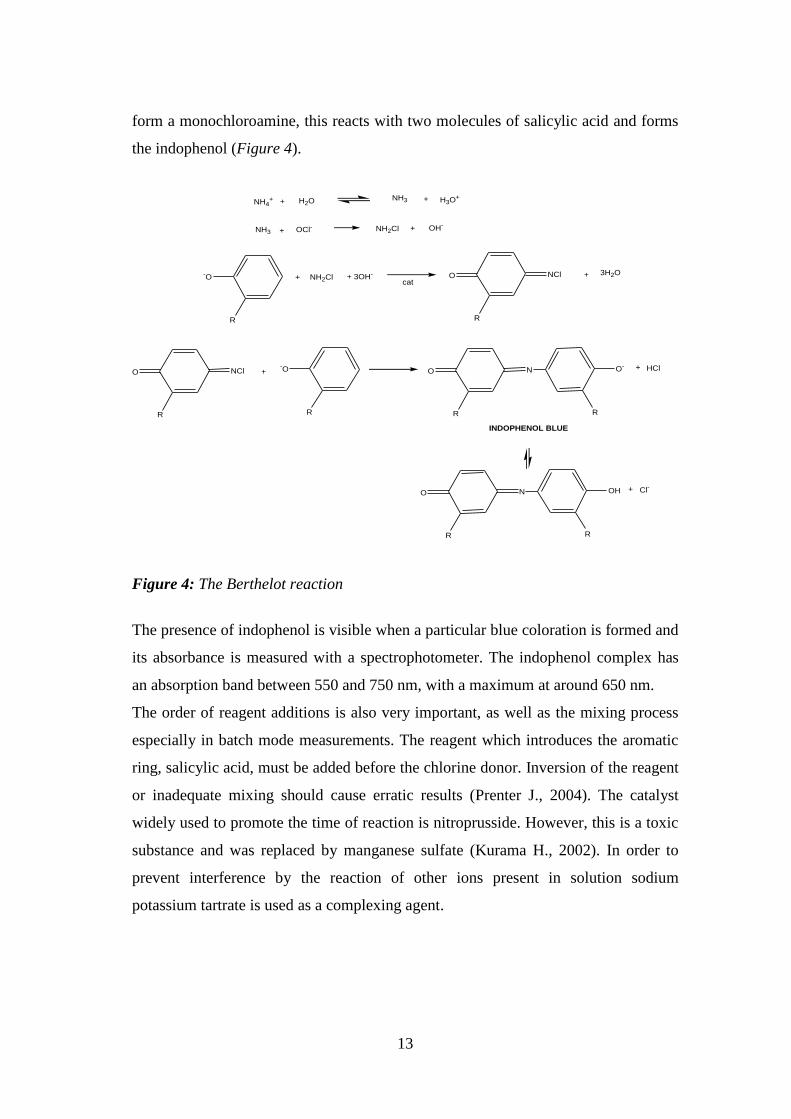
13
form a monochloroamine, this reacts with two molecules of salicylic acid and forms
the indophenol (Figure 4).
NH4+ + H2O NH3 + H3O+
NH3 + OCl- NH2Cl + OH-
-O
R
+ NH2Cl + 3OH-
catO NCl
R
+ 3H2O
O NCl
R
+-O
R
O N
R
O-
R
+ HCl
INDOPHENOL BLUE
O N
R
OH
R
+ Cl-
Figure 4: The Berthelot reaction
The presence of indophenol is visible when a particular blue coloration is formed and
its absorbance is measured with a spectrophotometer. The indophenol complex has
an absorption band between 550 and 750 nm, with a maximum at around 650 nm.
The order of reagent additions is also very important, as well as the mixing process
especially in batch mode measurements. The reagent which introduces the aromatic
ring, salicylic acid, must be added before the chlorine donor. Inversion of the reagent
or inadequate mixing should cause erratic results (Prenter J., 2004). The catalyst
widely used to promote the time of reaction is nitroprusside. However, this is a toxic
substance and was replaced by manganese sulfate (Kurama H., 2002). In order to
prevent interference by the reaction of other ions present in solution sodium
potassium tartrate is used as a complexing agent.

14
2.3 Transglutaminase
Transglutaminases (TGases, EC 2.3.2.13) are a family of calcium-dependent
enzymes that catalyse the posttranslational modification of a wide range of proteins
involving protein crosslinking, polyamination and deamidation (Lorand L., 2003).
Heinrich Waelesh and collegues (Sarkar N.K., 1957) identified an amine-
incorporating activity in liver homogenates, where amines are attached to the γ-
glutamyl moieties after the release of ammonia and this activity has been named
“transglutamination”.
Until now nine homologous transglutaminase genes have been identified in humans
and mice, all, except one, code active transglutaminases (TGases 1-7 and factor
XIIIa) which are variably expressed in multiple organs and cell types of organisms
(Grenard P., 2001).
2.3.1 Transglutaminase catalysing reactions
TGase active site (Cys277) catalyses a nucleofilic attack on delta carbon of the
glutamine side chain (cystein protease-like catalytic mechanism). Thiol-ester bound
enzyme-substrate intermediate is formed and a release of ammonia takes place (Folk
J.E., 1983). Formed γ-glutamyl-enzymes thioester intermediately transfers the γ-
glutamyl moiety to (Figure 5):
I. another amine –transamidation (small BAs or the ε-amine group in a lysine)
II. an aliphatic alcohol - esterification
III. water - glutamine hydrolysis; deamidation

15
Transamidation
a. Crosslinking
CH2CH2C
O
H2NH2CH2CH2CH2C
TG
Ca++CH2CH2CNHCH2CH2CH2CH2
O+ NH3
b. Amine incorporation
CH2CH2CNH2
O
NH2R
CH2CH2CNH
O
R + NH3
c. Acylation
R1 CH2CH2C
O
H2NH2CH2CH2CH2C
R1 CH2CH2CNHCH2CH2CH2CH2
O+ NH3
NH2
NH2
Esterification
CH2CH2C
O
NH2
OH R2
CH2CH2CNH
O
OR2 + NH3
d.
Hydrolysis
e. Deamidation
CH2CH2C
O
NH2
H2O
CH2CH2COH
O
+ NH3
Figure 5: Transglutaminase post-translational reactions.
TGases are widely distributed in the most mammalian tissues and body fluids
(Aeschlimann D.,1994). Factor XIII and TGase from guinea pig liver (GTGase) have
been well characterized as Ca++
-dependent enzymes (Folk and Chung, 1973).
Ca++
-independent microbial transglutaminase (MTGase) was firstly isolated from the
culture broth of Streptoverticillium Bacteria (Ando H., 1989) and the primary
structure was determined by Kanaju and coworkers (1993). They found that MTGase
and GTGase have low sequence similarity, even in active site regions, but the
hydrophobic environment of the catalytic site was similar.
MTGase has, in recent years, acquired interest due to the potential application in
food industry (Zhou L.D., 2000). Guinea pig liver transglutaminase was the unique
source of commercial transglutaminase for decades. The scarce source and the
complicated separation and purification processes resulted in an extremely expensive
enzyme, which makes it difficult to apply in food processing on an industrial scale.
16
Many efforts have led to production of transglutaminase from micoorganisms (Ando
H., 1989).
Commercial use of microbial transglutaminase in the food industry started with the
manufacturing of surimi in Japan. Addition of transglutaminase increases the
elasticity and firmness of surimi gel, and can minimise wastage by stabilising
fluctuations in raw material quality (Armbrust C., 2003). Transglutaminase is used
world-wide for preparation of meat, dairy, bakery, soy products, pasta etc. to
improve the texture and to modify the properties of prepared foods in general
(Kuraishi C., 2001).
Ajinomoto Company Japan, commercialises various “ready-to-use” food enzyme
preparations. These mainly consist of sugar matrix in combination with
transglutaminase in order to simplify its use (Ajinomoto Company Information).
Deamidation activity of these two different TGases differs. It was proven that
MTGase had little deamidation activity (on CBZ-Gln-Gly as substrate) and less than
that of GTGase (Nonaka M.., 1996), but MTGase is more stable than GTGase
(Motoki M., 1997); therefore, on longer incubation; MTGase might achieve high
efficiency in deamidation. The optimum pH for deamidation of CBZ-Gln-Gly was
around pH 6. MTGase can catalyze deamidation over wider range of pH than
GTGase, but the activity was lower. In the reaction of primary amines, an optimum
pH of TGase is 6.0 -8.0 (Motoki M., 1997), but deamidation occurred at a slightly
acidic pH. This result was due to the ionization state of the substrate, because only
unprotonated forms are reactive (Folk J.E., 1973).
In deamidation, the rate-limiting step is the nucleophilic attack by H2O. In primary
amine incorporation the deacylation of MTGase, after nucleofilic attack by NH2OH,
occurs much faster than that of other TGase. At a low concentration of amine
substrate, water can act as the acyl acceptor and protein-bound glutamyl residues are
formed (Folk J.E., 1966a).
However, MTGase remains the most desiderate at the moment for many applications
(meat and poultry products especially). It is most stable in activity and is effective
over a wide range of temperatures and pH.

17
2.3.2 Transglutaminase and interaction with amines
In vitro, many amines, diamines, polyamines, and alcohols are capable of interaction
with the protein-γ-glutamyl-enzyme intermediate. However, in vivo, only lysine ε-
amino groups and polyamines are the available amine substrates (Lorand L., 1984),
and coupling of amine neurotransmitters (Walther D.J., 2003), or membrane lipids
(Nemes Z., 1999) to proteins is possible in cells with specialized pathways for
producing such substrate compounds.
Due to the drastic and disruptive effects of uncontrolled protein cross-linking in
living cells, the enzymatic activity of vertebrate TGases are controlled by the
availability of calcium ions, which are essential cofactors for the operation of
catalytically active conformational states.
2.3.3 Transglutaminase and diseases
Tissue transglutaminase has been identified as a contributor to the formation of
cataracts and to Celiac disease, and is suspected to be involved in atherosclerosis,
inflammation, fibrosis, diabetes, cancer metastases, autoimmune diseases, psoriasis
(Kim S.Y., 2002). It is also suspected to have a role in neurodegenerative diseases,
such as Huntington’s disease, Alzheimer disease, Parkinson disease, associated with
an increase in polyglutamine-containing peptides in the brain (Cooper A.J.L., 2002;
Singer S.M., 2002; Karpuj M.V., 2002).
2.3.4 Transglutaminase and its applications
Use of enzymes in many industrial, biomedical and biotechnological applications
requires new biocatalysts capable of working in extreme physicochemical conditions.
Several strategies have been evaluated for preparing highly stable enzymes,
including: isolation from thermo-philic organisms (Sunna A., 1997), site-directed
mutagenesis (Minagawa H., 2000); immobilization in solid supports (Saito T., 1997);
surface covalent modification with low-molecular-weight compounds (Murphy A.,
1996) as well as with water soluble polymers (Darias R., 2001). Among these
different approaches, enzyme chemical modification seems particularly promising
because it is simple, inexpensive, and allows for the preparation of water-soluble
biocatalysts with functional stability (Gòmez L., 2000).

18
Several disadvantages are associated with the toxicity of reagents commonly used for
modifying enzymes through chemical procedures (Lalibertè G., 1994), which are
inappropriate for catalysts in biochemical use and food applications. Addition of
chemicals often reduces the catalytic effectiveness of the enzymes (Darias R., 2001).
TGase produces either intra- or inter-molecular isopeptide bonds with the γ-
carboxamide group of endprotein glutamine residue as an acyl donor substrate and
the ε-amino groups of endprotein lysine residues as an acyl acceptor (Aeschlimann
D., 1994). In addition, reactive lysines may be substituted by several low-molecular-
weight compounds containing primary amino groups, giving rise to a variety of
protein-(γ-glutamyl) derivatives (Folk J.E., 1985). For these reasons, TGase was used
as a biotechnological tool for the modification of biological activities of peptides
(Esposito C., 1999; Esposito C., 1995; Mancuso F., 2001) and proteins (Bechtold U.,
2000) with covalent linking polyamines to their reactive endo-glutamine residues.
2.3.5 Transglutaminase in foods
TGase is expected to improve the nutritional value and rheological properties of food
proteins and as source of gelatinization of food products, for improving solubility,
water-holding capacity or thermal stability of food proteins or to improve food
flavour, nutritional value appearance or texture (Wijngaards G., 1997). The use of
TGase to increase the quality for a wide range of food products is increasing since
large quantities of MTGase have become commercially available (Yokoyama K.,
2004).
In the baking industry it is used to improve the functional properties of bread, pastry
and croissant dough. Recent studies in the molecular mechanism of celiac disease
suggest the possibility that TGase in baked products act upon gliadin proteins in
dough to generate epitope associated with celiac disease. Effects of TGase in foods
are largely due to its crosslinking activity. Food treated with transglutaminase
potentially contains deamidated protein residues and proteins conjugated to any free
amines in the food matrix. The exact product mix usually depends on particular
processing conditions.
A beneficial effect of transglutaminase in cereal products has been reported (Gerrard
J.A., 2000; Bauer N., 2003a-b; Collar C., 2004; Rasiah I.A., 2005).

19
In general, TGase strengthens dough and also the final product. It has proved a
beneficial action in protecting frozen doughs from damage, leading to a higher
quality product during thawing and baking.
2.4 Thermal Lens Spectrometry (TLS)
TLS is a highly sensitive detection method based on an indirect measurement of
absorbance by a photothermal effect, which originates from a non radiative
relaxation of excited molecules in the sample that result in defocusing of the laser
beam. During the deexcitation that might involve vibrational relaxation, internal and
external conversion and intersystem crossing, the absorbed energy is converted into
heat. In the case of a non fluorescent sample it is possible to assume that the amount
of released heat is equal to the energy absorbed by the sample.
A laser beam with a Gaussian profile is used for excitation and the heat results in the
formation of a radial temperature distribution with its maximum at the center of the
beam. Consequently a lens-like element is formed in the irradiated sample, due to the
change in the refractive index. Due to the thermal conductivity on the samples part,
the heat will be continuously dissipated into the environment. For this reason the
thermal lens effect is time dependent and reaches a maximum value when the amount
of heat released during the radiationless relaxation processes, is in equilibrium with
the heat dissipated into the environment (steady-state thermal lens).
Different theoretical models (Weimer W.A., 1985; Dovichi N.J., 1984) have
described mathematically the time and position dependent changes in beam centre
intensity during the thermal lens experiment. The theoretical models range from
relatively simple formulations to complex and sophisticated derivations. These
models cover thermal lens effects, generated under different excitation conditions
(pulsed or continuous wave excitation), different pump/probe geometries (single and
dual beam, collinear and crossed beam configurations) and different sample
conditions (stationary and flowing samples).

20
These derivations have often been simplified. One approximation is used for most
analytical applications, where the magnitude of the thermal lens effect is usually
measured as relative change in the beam centre intensity.
The relative change in the probe beam intensity is described in this relationship:
k
AdTdnP
Ibc
Ibc
)/(303.2 ( Eq.1)
Where :
Ibc
Ibc is the relative change in the beam centre intensity
P is the excitation laser power
Tn / is the sample's temperature coefficient of the refractive index
A is the absorbance of the sample
is the probe beam wavelength
k is the thermal conductivity of the sample
From this relationship we can see that the sensitivity of the technique could be
increased simply by increasing the laser power and/or improving the thermo-optical
properties of the sample medium, i.e., the thermal conductivity and temperature
coefficient of refractive index.
Higher TLS signals can be obtained when experiments are performed in solvents
with more favourable thermo-optical properties than water. As seen from the
equation (Eq.1) high temperature-dependence of refractive index and low thermal
conductivity are preferred for TLS detection. Water is the most common medium
used in analytical chemistry, but due to relatively low temperature-dependence of
refractive index and high thermal conductivity, water provides a low enhancement
factor (E), which is defined in equation 2 (Eq.2). For this reason water is not
preffered for TLS detection. Organic solvents induce much higher enhancements and
are for this reason more suitable for TLS measurements.

21
kdT
dnE 91.1/ (Eq. 2)
Using adequate laser power, absorbances on the order of 10-7
absorption units have
been measured by TLS (Dovichi N.J., 1987).
2.5 Flow Injection Analysis (FIA) system
The concept of flow injection analysis (FIA) was introduced in the mid-seventies. It
was preceded by the success of segmented flow analysis, mainly in clinical and
environmental analysis. Flow Injection Analysis (FIA) is an analytical technique
based on fluid manipulation of samples and reagents. Samples are injected into a
carrier/reagent solution which transports the sample zone into a detector while
chemical or biochemical reactions take place. The detector continuously records the
changes in absorbance, electrode potential or other physical parameters resulting
from the passage of the sample material through the flow cell.
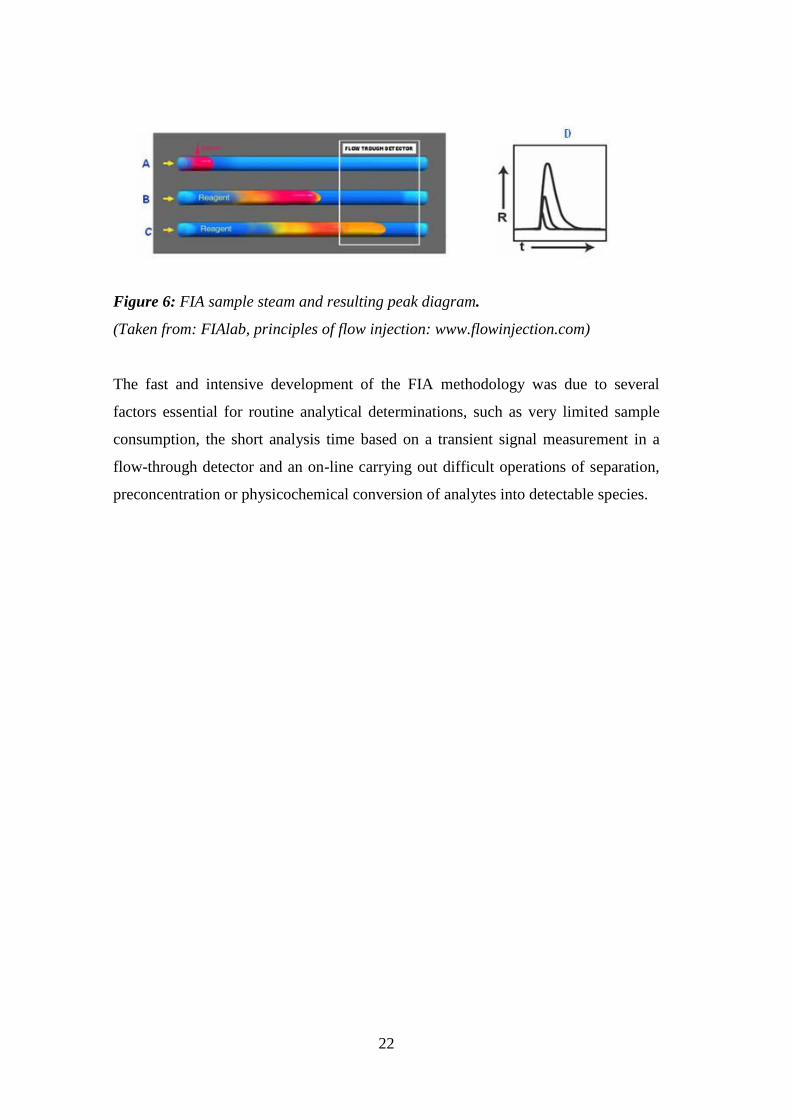
The general FIA protocol comprises of the following steps (Figure 6) :
A) injection of an exact volume of analyte solution into a flowing stream of reagent.
B) sample (red zone) moves downstream and the sample solution disperses into
reagent forming a reaction product (yellow). The grade of mixing and the length of
reaction time are controlled by the flow rate, by channel volume and geometry.
C) the reaction mixture flows through the detector producing a response.
D) the peak height recorded by the detector is proportional to the analyte
concentration.
22
Figure 6: FIA sample steam and resulting peak diagram.
(Taken from: FIAlab, principles of flow injection: www.flowinjection.com)
The fast and intensive development of the FIA methodology was due to several
factors essential for routine analytical determinations, such as very limited sample
consumption, the short analysis time based on a transient signal measurement in a
flow-through detector and an on-line carrying out difficult operations of separation,
preconcentration or physicochemical conversion of analytes into detectable species.
23
3 Experimental
3.1 Materials
Four biogenic amines (BA) were used in our studies: tyramine hydrochloride (98%)
and histamine dihydrochloride (98%) purchased from Alfa Aesar (Karlruhe,
Germany), putrescine hydrochloride (98%) purchased from AppliChem (Darmstadt,
Germany), cadaverine hydrochloride (98%) from Sigma-Aldrich (Seelze, Germany).
Transglutaminase (E.C. 2.3.2.13, 1670 nkat/g) was purchased from Ajinomoto Co.
INC., Japan (Europe Sales GMBH, Hamburg, Germany), transglutaminase from
guinea pig liver (E.C. 2.3.2.13, 2 UN) and N-carbobenzoxy-L-glutaminylglycine
(CBZ-Gln-Gly) were purchased from Sigma-Aldrich (Seelze, Germany).
In the solid phase extraction (SPE) studies cartridges C18 from Sigma-Aldrich
(Seelze, Germany) were used. For cartridge conditioning a pure methanol solution
(Sigma-Aldrich Seelze, Germany) and deionized water (18.0 MΩ-cm-1
deionized
water; Nanopure, Barnstead, Germany) was used for phenylalquinlamines (histamine
and tyramine) and pure methanol solution (Sigma-Aldrich Seelze, Germany) and
HCO3 solution at pH 12 was used for alquilamines (putrescine and cadaverine). For
sample elution pure methanol solution (Sigma-Aldrich Seelze, Germany) was used in
case of phenylalquinlamines and 2% of glacial acetic acid solution (Fluka, Seelze,
Germany) in the other case.
For the enzyme immobilization controlled-pore glass (CPG 240, 80-120 mesh) was
purchased from Sigma Chemicals and Sigma-Aldrich (Seelze, Germany), 50%
glutaraldehyde solution and 3-amminopropyltriehoxysilane were obtained from
Merck.
For the indophenol blue method reagents used were sodium salicylate (99.5 %)
purchased from Sigma-Aldrich (Seelze, Germany), sodium hydroxide from Riedel-
de-Haën (Seelze, Germany), solution of sodium hypochlorite (Pejo, Slovenia),
potassium sodium tartrate tetrahydrate (99 %) and manganese sulfate monohydrate
(98 %) from Fluka (Seelze, Germany).

24
Organic solvents, acetonitrile and ethanol, used for TLS measurements were
purchased from Sigma-Aldrich (Seelze, Germany).
3.2 Preparation of solutions
3.2.1 Solution for indophenol reaction
All solutions used were prepared using deionized water (18.0 MΩ-cm-1), prepared
using a Nanopure system (Barnstead, Germany).
A stock solution containing 100 mg/L NH4+ was prepared by dissolving 0.297g of
ammonium chloride in 1L of deionized water (18.0 MΩ-cm-1
). Working solutions
were prepared daily by diluting a stock solution of ammonium chloride accurately.
Reagents preparations are described in Table 1:
Table 1: Concentration of used reagents.
REAGENTS CONCENTRATION
Sodium salicylate 1.5 M
Sodium potassium tartrate tetrahydrate 30 g/L
Manganese sulphate monohydrate 2.5 × 10⁻³
M
Sodium hydroxide 0.5 M
Hypochlorite Commercial bleach (40g/L of active Cl-)
3.2.2 Solution for enzymatic reaction
The standard solutions of biogenic amines were prepared by dissolving each of them
separately in a water solution. These standard solutions were stored in glass
containers at 4° C.
Enzyme substrate (2mM) N-carbobenzoxy-L-glutaminylglycine (CBZ-Gln-Gly) was
dissolved in 0.5 M NaOH.
Enzymes (MTGase and GTGase) were opportunely dissolved in cold water in order
to obtain enzyme activity 16.7 nkat/mL (1 U/mL).

25
3.3 Indophenol blue method for biogenic amines determination exploiting
enzymatic reaction
Two mixtures of reagents were prepared for the indophenol blue method. Mixture A
contained 10 mL of sodium salicylate, 10 mL of potassium sodium tartrate and 2 mL
of manganese sulphate prepared with appropriate dilution of corresponding stock
aqueous solutions. Mixture B, which contained 10 mL of sodium hydroxide and 10
mL of hypochlorite was also prepared with an appropriate dilution of corresponding
stock aqueous solutions. Each mixture was freshly prepared daily.
One mL of each mixture (A and B) was introduced in a 10 mL flask with one mL of
CBZ-Gln-Gly, one mL of enzyme solution, one mL of BA of interest, and a mixture
of acetonitrile/water (1/1; v/v) or other solvent,in order to obtain the final volume of
10 mL. Then the solution was transferred in a quartz cuvette (batch mode
measurement) and introduced either in a UV-Vis spectrophotometer (absorbance
measured at 650nm) or exposed in a TLS cuvette holder.
3.4 Thermal lens detection system
In the study two dual-beam detection units were built and tested:
3.4.1 He-Ne detection unit
A high power He-Ne laser (Figure 7) operating at 632.8 nm (35mW, MellesGriot,
Carlsbad, California, USA) used as an excitation source and a relatively weaker He-
Ne laser operating at 543.5 nm (5mW, MellesGriot, Carlsbad, California, USA) as a
source of the probe beam. Separate lenses were used to focus the excitation beam
directly onto the sample and to mismatch the beam waists of the pump and the probe
beams. A variable-speed mechanical chopper modulated the pump laser beam at 30
Hz. In order to achieve optimal sensitivity a good spatial overlapping of both beams
inside the sample is necessary. The alignment of the two beams was facilitated by a
dichroic mirror. The generated thermal lens produces fluctuations in the radial
intensity distribution of the probe beam that is monitored by a PIN photodiode,
placed behind a filter which filters out the excitation laser beam. The photodiode is
connected to a lock-in amplifier (Stanford Research System, Sunnyvale, California,
USA) and a personal computer for data acquisition.

26
Probe He-Ne laser
Pupm He-Ne laserChopper
Mirror
Mirror
MirrorDicroic
mirror
Lens
Lens
Sample
MirrorFilter
Photodiode
Lock-in amplifier
PC station
Figure 7: Schematic representation of the He-Ne detection unit.
3.4.2 Kr-detection unit
A powerful Kr-laser (Figure 8) operating at 647 nm (200mW,) as excitation source
and a relatively weaker He-Ne laser operating at 543.5 nm (5mW, MellesGriot,
Carlsbad, California, USA) as a source of the probe beam was used. Separate lenses
are used to focus the excitation beam directly onto the sample and to mismatch the
beam waists of the pump and the probe beams. A variable-speed mechanical chopper
modulated the pump laser beam at 30 Hz. For optimal sensitivity a good spatial
overlapping of both beams inside the sample is necessary. A dichroic mirror
facilitates the alignment of the two beams. The fluctations generated by the thermal
lens is monitored by a PIN photodiode, behind a filter which filters out the excitation
laser beam. A lock-in amplifier (Stanford Research System, Sunnyvale, California,
USA) is connected to photodiode and a personal computer is linked for data
acquisition.

27
Pump Kr-laser
Probe He-Ne laser
MirrorMirror
Mirror
Mirror
Mirror
Dicroic
mirror
Chopper
Lens
Lens
Filter
Photodiode
Lock-in amplifier
PC station
.
Figure 8: Schematic representation of Kr-detection unit.
3.5 Bioanalytical system
3.5.1 Enzyme immobilization on glass beads
TGases enzymes were immobilized using the method based on cross-linking with
glutataldehyde and binding to the activated controlled porosity glass – CPG
(Pogačnik and Franko, 2001).
Immobilization consists of 4 fundamental steps:
Pre-cleaning step: CPG-240 was boiled 5% nitric acid for 30 min. The CGP-240 was
filtered on a sintered glass filter, washed with deionized water and dried in an oven at
95° C. The whole procedure with water washing was repeated twice.
Aminoalkylating step: diluted 3-aminopropyltriethoxysilane (98%) was adjusted to
pH 3.5 with HCl acid. The dried CGP-240 was added to the aminoalkylating solution
and swirled for 150 min in a water bath at 75° C. The beads were filtered, washed
with deionized water and dried at 95° C until the moisture was completely
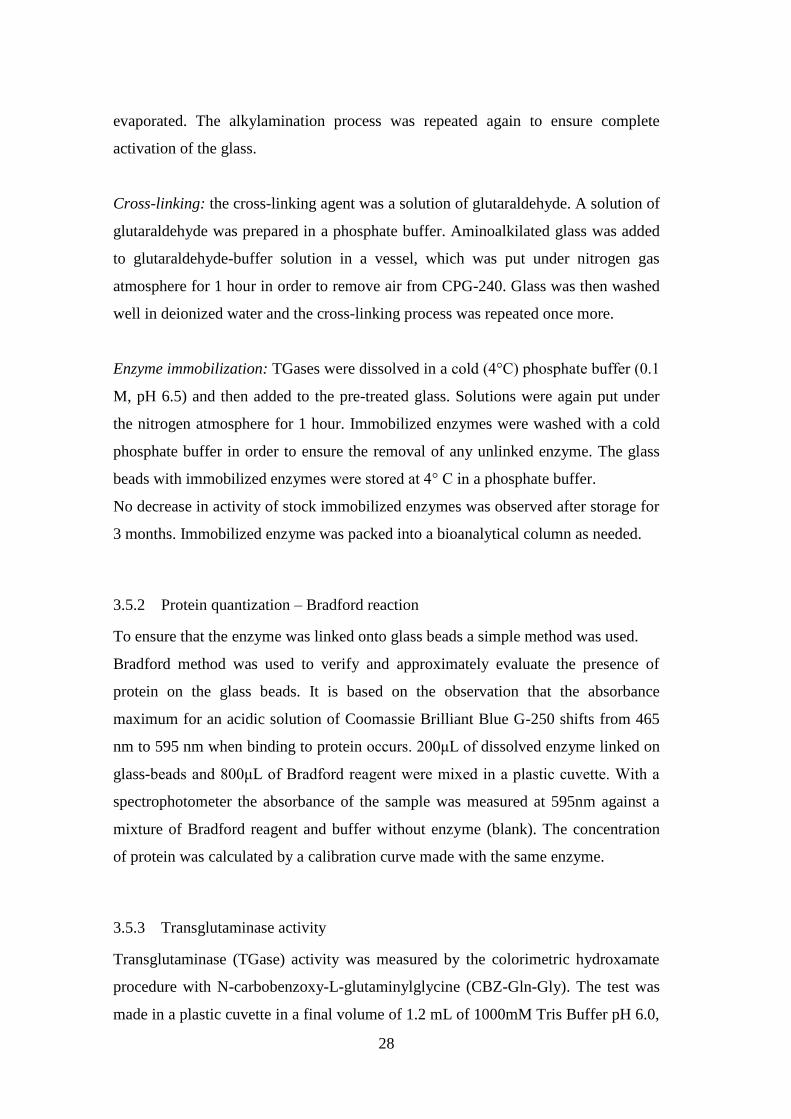
28
evaporated. The alkylamination process was repeated again to ensure complete
activation of the glass.
Cross-linking: the cross-linking agent was a solution of glutaraldehyde. A solution of
glutaraldehyde was prepared in a phosphate buffer. Aminoalkilated glass was added
to glutaraldehyde-buffer solution in a vessel, which was put under nitrogen gas
atmosphere for 1 hour in order to remove air from CPG-240. Glass was then washed
well in deionized water and the cross-linking process was repeated once more.
Enzyme immobilization: TGases were dissolved in a cold (4°C) phosphate buffer (0.1
M, pH 6.5) and then added to the pre-treated glass. Solutions were again put under
the nitrogen atmosphere for 1 hour. Immobilized enzymes were washed with a cold
phosphate buffer in order to ensure the removal of any unlinked enzyme. The glass
beads with immobilized enzymes were stored at 4° C in a phosphate buffer.
No decrease in activity of stock immobilized enzymes was observed after storage for
3 months. Immobilized enzyme was packed into a bioanalytical column as needed.
3.5.2 Protein quantization – Bradford reaction
To ensure that the enzyme was linked onto glass beads a simple method was used.
Bradford method was used to verify and approximately evaluate the presence of
protein on the glass beads. It is based on the observation that the absorbance
maximum for an acidic solution of Coomassie Brilliant Blue G-250 shifts from 465
nm to 595 nm when binding to protein occurs. 200μL of dissolved enzyme linked on
glass-beads and 800μL of Bradford reagent were mixed in a plastic cuvette. With a
spectrophotometer the absorbance of the sample was measured at 595nm against a
mixture of Bradford reagent and buffer without enzyme (blank). The concentration
of protein was calculated by a calibration curve made with the same enzyme.
3.5.3 Transglutaminase activity
Transglutaminase (TGase) activity was measured by the colorimetric hydroxamate
procedure with N-carbobenzoxy-L-glutaminylglycine (CBZ-Gln-Gly). The test was
made in a plastic cuvette in a final volume of 1.2 mL of 1000mM Tris Buffer pH 6.0,
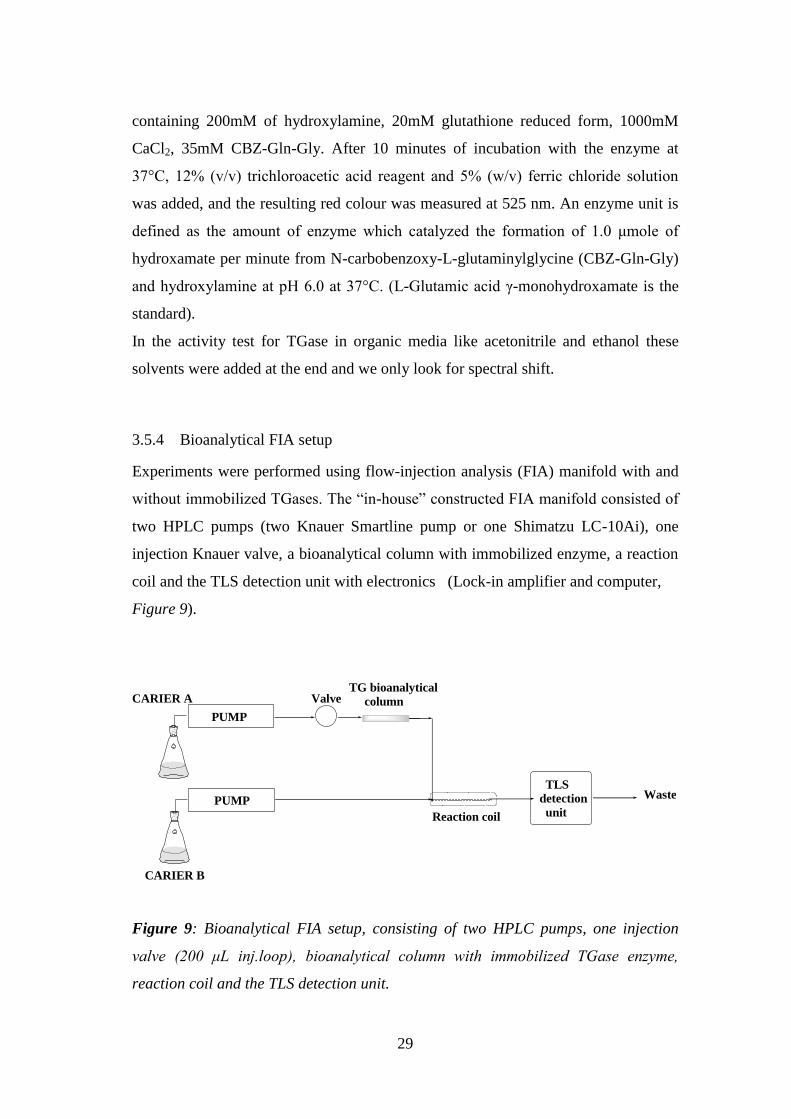
29
containing 200mM of hydroxylamine, 20mM glutathione reduced form, 1000mM
CaCl2, 35mM CBZ-Gln-Gly. After 10 minutes of incubation with the enzyme at
37°C, 12% (v/v) trichloroacetic acid reagent and 5% (w/v) ferric chloride solution
was added, and the resulting red colour was measured at 525 nm. An enzyme unit is
defined as the amount of enzyme which catalyzed the formation of 1.0 μmole of
hydroxamate per minute from N-carbobenzoxy-L-glutaminylglycine (CBZ-Gln-Gly)
and hydroxylamine at pH 6.0 at 37°C. (L-Glutamic acid γ-monohydroxamate is the
standard).
In the activity test for TGase in organic media like acetonitrile and ethanol these
solvents were added at the end and we only look for spectral shift.
3.5.4 Bioanalytical FIA setup
Experiments were performed using flow-injection analysis (FIA) manifold with and
without immobilized TGases. The “in-house” constructed FIA manifold consisted of
two HPLC pumps (two Knauer Smartline pump or one Shimatzu LC-10Ai), one
injection Knauer valve, a bioanalytical column with immobilized enzyme, a reaction
coil and the TLS detection unit with electronics (Lock-in amplifier and computer,
Figure 9).
CARIER A
CARIER B
PUMP
PUMP
ValveTG bioanalytical
column
Reaction coil
TLS
detection
unit
Waste
Figure 9: Bioanalytical FIA setup, consisting of two HPLC pumps, one injection
valve (200 μL inj.loop), bioanalytical column with immobilized TGase enzyme,
reaction coil and the TLS detection unit.

30
Repeated sample injections (at least thrice) with a 200 μL injection loop were
performed in order to verify the repreciabilty and minimize measurement errors.
Each bioanalytical column filling was used for several experiments in one day.
Around 20-30 mg of glass beads with immobilized TGase enzyme were usually used
to fill the column.
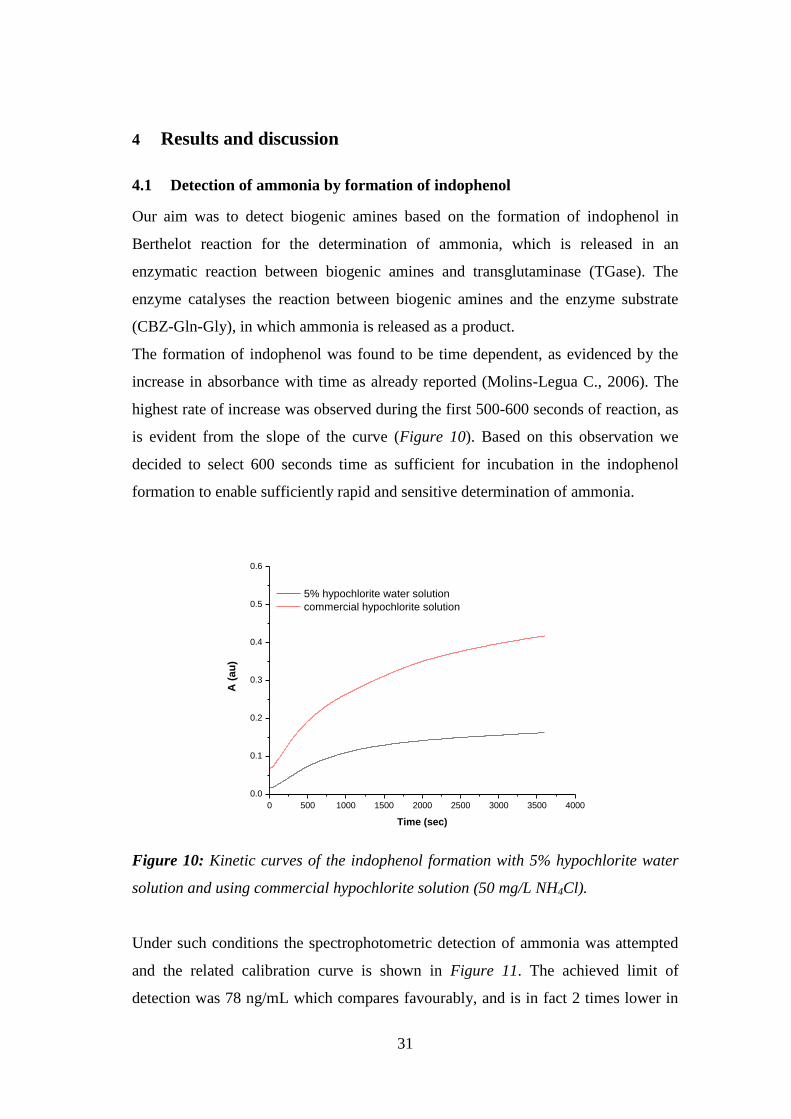
31
4 Results and discussion
4.1 Detection of ammonia by formation of indophenol
Our aim was to detect biogenic amines based on the formation of indophenol in
Berthelot reaction for the determination of ammonia, which is released in an
enzymatic reaction between biogenic amines and transglutaminase (TGase). The
enzyme catalyses the reaction between biogenic amines and the enzyme substrate
(CBZ-Gln-Gly), in which ammonia is released as a product.
The formation of indophenol was found to be time dependent, as evidenced by the
increase in absorbance with time as already reported (Molins-Legua C., 2006). The
highest rate of increase was observed during the first 500-600 seconds of reaction, as
is evident from the slope of the curve (Figure 10). Based on this observation we
decided to select 600 seconds time as sufficient for incubation in the indophenol
formation to enable sufficiently rapid and sensitive determination of ammonia.
0 500 1000 1500 2000 2500 3000 3500 4000
0.0
0.1
0.2
0.3
0.4
0.5
0.6
A (
au
)
Time (sec)
5% hypochlorite water solution
commercial hypochlorite solution
Figure 10: Kinetic curves of the indophenol formation with 5% hypochlorite water
solution and using commercial hypochlorite solution (50 mg/L NH4Cl).
Under such conditions the spectrophotometric detection of ammonia was attempted
and the related calibration curve is shown in Figure 11. The achieved limit of
detection was 78 ng/mL which compares favourably, and is in fact 2 times lower in

32
comparison to the LOD reported by Molins-Legua C. and coworkers (2006) (Table
2) which is based on the same reaction but using a lower concentration of
hypochlorite.
0 1 2 3 4 5
0.000
0.002
0.004
0.006
0.008
0.010
Ain
do
ph
en
ol -
Ab
lan
k
C (mg/L)
Figure 11: Typical calibration curve for the spectrophotometric determination of
ammonia based on indophenol formation in water after 10 minutes of incubation
time (R= 0.997; k=0.178 A×L/mg ).
The improvement of LOD was presumably entirely due to use of a higher
concentration of hypochlorite as evident from the differences in the kinetic curves for
Berthelot reactions at different concentration of hypochlorite (Figure 10).
4.1.1 Influence of organic solvents on the Berthelot reaction (indopehnol UV-Vis
spectra)
In the following section the indophenol blue method was tested in different organic
solvents to exploit, in a best possible way, the thermooptical properties of solvents
and the resulting enhancement of the thermal lens signal. Spectrophotometric
measurements were performed initially to observe possible effects of organic
solvents on spectral properties of indophenol.
The influence of acetonitrile and ethanol, as the two most frequently applied organic
solvents as additives to water in thermal lens spectrometry was investigated (see
33
paragraph 4.1.2.). Ammonium chloride was used as a standard in measurements of
eventual spectral shifts caused by the organic solvent (Figure 12).
550 600 650 700 750 800
0,0
0,1
0,2
0,3
0,4
0,5
0,6
0,7Solvents A
650nm(au)
In H2
O 0.623
In 25% EtOH 0.403
In 25% CH3
CN 0.415
A (
au
)
Wavelenghts (nm)
IN H2O
IN 25% EtOH
IN 25% CH3CN
Figure 12: Absorbance spectrum of indophenol in water, in 25% ethanol and in 25%
acetonitrile/water mixture (concentration of NH4Cl = 250 mg/L) after 600 seconds of
incubation.
The measurements of the absorbance spectra of indophenol in the presence of
organic solvents were performed by running the Berthelot reaction in aqueous
solution and in both organic solvents.
No significant change in the position of λmax (650 nm) was observed, while the
absorbance of indophenol in 25% acetonitrile/water mixture and in 25%
ethanol/water mixture after 10 minutes of incubation was 1.5-times lower when
compared to absorbance in water respectively (Figure 12).
The difference in the absorbance spectrum is mainly due to different reaction rates in
different solvents, as visible in Figure 13, where the slope of the curve showing
indophenol formation is lower in acetonitrile in comparison with the slope in water.

34
0 500 1000 1500 2000 2500 3000 3500 4000
0.0
0.1
0.2
0.3
0.4
0.5
0.6
A (
au
)
Time (sec)
H2O
25% CH3CN
Figure 13: Kinetic curves of indophenol formation in water and in 25% acetonitrile
water solution (NH4Cl 50 mg/L).
The limit of detection (Table 2), which was observed in water in comparison to the
LOD in 25% acetonitrile/water mixture was 1.68 times lower, in accordance with the
difference in absorbance maxima (Figure 12).
Table 2: Table of calculated LOD for indophenol formation on the
spectrophotometer.
THIS WORK MOLINS-LEGUA
METHOD
LOD IN WATER (ng/mL) 78 160
LOD IN 25 % ACETONITRILE
(ng/mL) 131 --
4.1.2 Enhancement (E) factors in TLS
As was already discussed in the introductory section, the TLS signal is considerably
affected by the solvent used in the measurements. Different organic solvents have
different thermo-optical properties [temperature coefficient of refractive index
( dTdn / ) and thermal conductivity ( k )], and these affect the TLS signal. The lowest
signal is obtained with the use of water. For this reason we studied two different

35
solvents and their effect on indophenol reaction. The enhancement of the thermal
lens signal in organic solvents, with respect to that in water, was due to higher
dTdn / and a lower k .
For calculation of the enhancement factor the values for thermo optical properties,
i.e. dTdn / and k of pure solvents were taken from Bialkowski S.E. (1996), and are
presented for acetonitrile and ethanol (Table 3). For mixtures of liquids or solutions,
the information on their thermo-optical properties is usually unavailable, and these
values should be measured or calculated for each mixture. Most frequently, the
enhancement factors for liquid mixtures are estimated assuming that dTdn/ and k
are linear functions of the volume fraction of each solvent or in case of k by using
some empirical relations for calculation of its value from the thermal conductivities
of pure solvents (Weimer W.B., 1986).
As shown for the case of acetonitrile, in this work the following relation (Eq.3) was
used:
)(72.0
)/()/(/
2333322
3322
2 OHCNCHCNCHOHCNCHCNCHOHOH
CNCHCNCHOHOH
kkFFkFkF
dTdnFdTdnF
k
dTdn
(Eq.3)
where F is the volume fraction of the specified solvent. The calculated values for the
enhancement factor are given in Table 3, Table 4 and Table 5.
Table 3: Thermooptical properties of water, acetonitrile and ethanol.
SOLVENT k /( W m-1
K-1
)* ( dTdn / )/(10-4
K-1
)* E (W-1
)
Water (100%) 0.598 -0.91 146
Acetonitrile(100%) 0.188 -4.50 2306
Ethanol (100%) 0.169 -4.00 2280
*Thermooptical properties were taken from Bialkowski S.E. 1996. Enhancement factors were
calculated for 543.5 nm.

36
Table 4: Calculated thermooptical properties of acetonitrile/water mixtures.
SOLVENT )/(/
Wmk
dTdn
* E (W
-1) E (W
-1) × C
**
Acetonitrile(10%) 2.17×10⁻⁴
209 188
Acetonitrile(25%) 3.28×10⁻⁴
315 236
Acetonitrile(40%) 4.65×10⁻⁴
448 269
Acetonitrile(50%) 5.79×10⁻⁴
558 279
Acetonitrile(60%) 7.25×10⁻⁴
698 279
Acetonitrile(80%) 1.19×10⁻³
1146 229
Acetonitrile(90%) 1.62×10⁻³
1561 156
*Thermooptical properties were taken from Bialkowski S.E. 1996. Enhancement factors were
calculated for 543.5 nm.
** C= dilution factor
Table 5: Calculated thermooptical properties of ethanol/water mixtures.
SOLVENT )/(/
Wmk
dTdn
* E (W
-1) E (W
-1) × C
**
Ethanol (10%) 2.11×10⁻⁴
203 183
Ethanol (25%) 3.06×10⁻⁴
295 221
Ethanol (40%) 4.30×10⁻⁴
414 248
Ethanol (50%) 5.33×10⁻⁴
513 256
Ethanol (60%) 6.66×10⁻⁴
722 253
Ethanol (80%) 1.11×10⁻³
1069 214
Ethanol (90%) 1.54×10⁻³
1483 148
*Thermooptical properties were taken from Bialkowski S.E. 1996. Enhancement factors were
calculated for 543.5 nm.
** C= dilution factor

37
The calculated enhancement factors show the expected increase with volume fraction
of organic solvent. The highest effective enhancement factor, which is reflected in
the final sensitivity of the method, is however, predicted for volume fraction of 0.5
acetonitrile and 0.6 in the case of ethanol (Figure 14), because at a higher volume
fractions the inevitable dilution of the sample contributes to the decreased sensitivity
more than is the increase from the enhancement factor.
0.0 0.2 0.4 0.6 0.8 1.0
140
160
180
200
220
240
260
280
300
En
ha
nc
em
en
t fa
cto
r (W
-1)
Volume fraction
Acetonitrile enhancement factor
Ethanol enhancement factor
Figure 14: Plot of the calculated effective enhancement factor as a function of the
acetonitrile or ethanol volume fraction. The curve is a plot of E values calculated
from Eq. (1) and multiplied by dilution factors.
Based on the enhancement factors of two investigated solvents, we have chosen
acetonitrile/water mixture that assures a higher TLS signal due to the higher
enhancement factor.
4.1.3 TLS determination of ammonia
As already discussed in the previous section, an addition of organic solvents
increases the TLS signal. A higher enhancement factor was predicted for 25%
acetonitrile solution (0.236 mW-1
) and 25% ethanol (0.221 mW-1
) when compared to
water (0.146 mW-1
). This 1.62-times higher enhancement factor actually cancels out
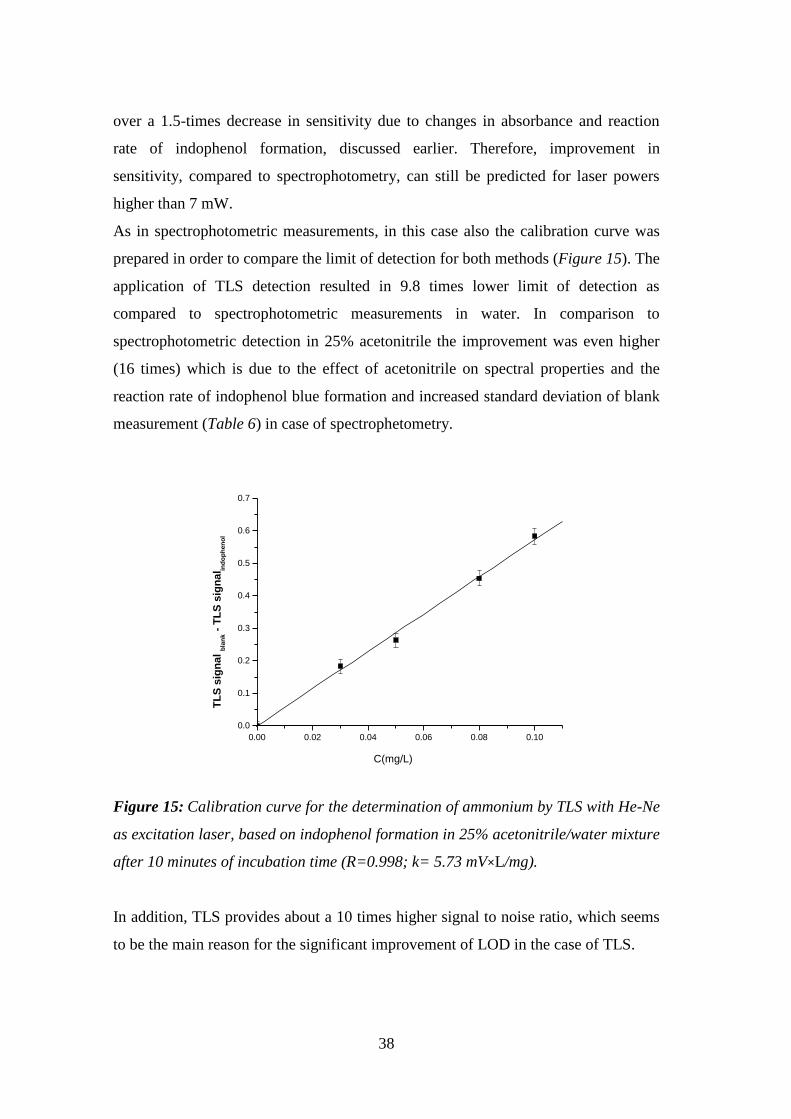
38
over a 1.5-times decrease in sensitivity due to changes in absorbance and reaction
rate of indophenol formation, discussed earlier. Therefore, improvement in
sensitivity, compared to spectrophotometry, can still be predicted for laser powers
higher than 7 mW.
As in spectrophotometric measurements, in this case also the calibration curve was
prepared in order to compare the limit of detection for both methods (Figure 15). The
application of TLS detection resulted in 9.8 times lower limit of detection as
compared to spectrophotometric measurements in water. In comparison to
spectrophotometric detection in 25% acetonitrile the improvement was even higher
(16 times) which is due to the effect of acetonitrile on spectral properties and the
reaction rate of indophenol blue formation and increased standard deviation of blank
measurement (Table 6) in case of spectrophetometry.
0.00 0.02 0.04 0.06 0.08 0.10
0.0
0.1
0.2
0.3
0.4
0.5
0.6
0.7
TL
S s
ign
al
bla
nk -
TL
S s
ign
al in
do
ph
en
ol
C(mg/L)
Figure 15: Calibration curve for the determination of ammonium by TLS with He-Ne
as excitation laser, based on indophenol formation in 25% acetonitrile/water mixture
after 10 minutes of incubation time (R=0.998; k= 5.73 mV×L/mg).
In addition, TLS provides about a 10 times higher signal to noise ratio, which seems
to be the main reason for the significant improvement of LOD in the case of TLS.

39
Table 6: Table of calculated LOD for indophenol formation on the He-Ne TLS
detection unit.
Spectrophotometer in
H2O
Spectrophotometer in
25% CH3CN
He-Ne TLS
detection unit
LOD 78 ng/mL 131 ng/mL 8 ng/mL
SD of blank 4.55×10⁻³
au 6.5×10⁻³
au 0.015 mV
Average
blank signal 0.023 au 0.032 au 0.758 mV
S/N 5.05 4.92 50.5
4.1.3.1 Recovery test
Accuracy of the method was tested by analysing water samples fortified with
different levels of NH4+. Results are presented in Table 7 and demonstrate
comparable agreement of measured concentrations with true values.
Table 7: Different concentration of fortified samples and recovery obtained.
NH4+ concentration in
the sample (μg/L) measured NH4
+ (μg/L) RECOVERY (%)
30 32 ±3 104 ±10
50 46 ± 4 91.6 ± 8
100 99 ± 2 98.9 ± 4
4.1.3.2 Interferences in ammonia determination
The presence of amino acids in natural waters, which originate from microalgae and
bacteria, interferes with determination of ammonia using the indophenol blue
reaction. As demonstrated by Jüttner (1999), naturally occurring nitrogenous
compounds interfere with modified indophenol blue reaction using salicilate, as in

40
this work. Among them L-aspargine, L-histidine, and glycine, which were observed
to give between 3 and 42% positive interference in the determination of ammonium,
respectively, at equimolar concentrations of interferents and ammonium. For this
reason these three structurally different amino acids, available in the laboratory
(asparagine, glycine, and histidine), which cover an almost entire spectrum of
possible positive interferences by amino acids (0.8 – 56 %) (Jüttner F.,1999) were
tested, in order to determine possible margins of errors due to interferences in the
indophenol blue method applied in this work.
In all measurements the concentration used to estimate possible positive errors in the
determination of ammonia due to the presence of amino acids was 0.5 mM for all
species.
The relative errors due to the interference from amino acids, determined from the
ratio of measured TLS signals for amino acids and the TLS signal for equimolar
concentration of ammonium, were found to be 6% for asparagine, 12% for glycine
and 20% for histidine.
Similarly to the results of Jüttner this work confirms the lowest contribution of
asparagine to the interference. Overall the observed interferences from the selected
amino acids show over 30% smaller contribution to positive errors, compared to the
method described in the literature (Jüttner F., 1999). In particular the contribution of
glycine is about 4 times lower than previously reported, while interference from
histidine is about 2 times higher than reported. These differences are most probably
due to the use of different catalysts in the Berthelot reaction (manganese sulphate
instead of nitroprusside).
In natural waters the concentrations of all free amino acids on the order of 10-7
M
can be expected. (Thuman E.M., 1985). This is comparable or lower than the LOD
for determination of ammonium by this method. Therefore, significant positive errors
from interfering amino acids can only be expected at extremely low concentrations
of ammonium (below 10-6
M). At concentrations of ammonium ten times higher than
the LOD of this TLS method the errors due to the presence of amino acids in natural
waters are estimated at 1-2% or less.

41
The problem of the interferences can be in principle resolved also by using the
indophenol reaction based on the phenol instead of salicilate. However, due to the
toxicity of the phenol, this option was not exploited in this work.
However, in view of the final application of the newly developed method for
determination of biogenic amines, the presence of amino acids in analysed samples,
does not pose any limitation in terms of interferences, since during the extraction of
biogenic amines the amino acids are separated due to their solubility in aqueous
phase.
4.2 Detection of biogenic amines based on indophenol blue reaction
Previously optimized indophenol blue reaction was used as colorimetric method for
the detection of biogenic amines.
During the MTGase enzymatic reaction with substrate (Cbz-Gln-Gly) and biogenic
amine, ammonia is released and detected by exploiting indophenol blue reaction.
Detection of structurally different biogenic amines (putrescine, cadaverine, histamine
and tyramine) was investigated.
4.2.1 Influence of buffers an MTGase (UV-Vis measurements)
The optimum pH for MTGase is between 6 and 7 (specified by the producer). For
this reason a study of buffer influence on indophenol blue reaction in the pH range 6-
7 was necessary, since the recommended pH for indophenol formation is between 7-
10.5 (Aminot, 1997).
Tested buffers were: phosphate buffer (pH 7), PBS buffer (pH 7), acetate buffer (pH
6) and Tris- buffer (pH 7) (usually used in TGase enzymatic activity test protocols).
As is clearly visible in Figure 16 the highest sensitivity of biogenic amine
determination by MTGase and indophenol blue reaction is obtained in water and in a
phosphate buffer at pH 7. Reactions in acetate and PBS buffer showed lower
absorbance after 10 minutes of reaction compared to the phosphate buffer. This can
be attributed to the presence of bivalent ions, that have a negative influence on the
MTGase enzymatic activity and thermal stability, in our case the addition of MgCl2
(Kütemeyer C., 2005) in PBS buffer. This effect was the strongest in case of
tyramine. For acetate buffer the reason of a lower enzymatic activity is the acidic pH
which is not favorable for indophenol blue reaction, where the alkaline environment
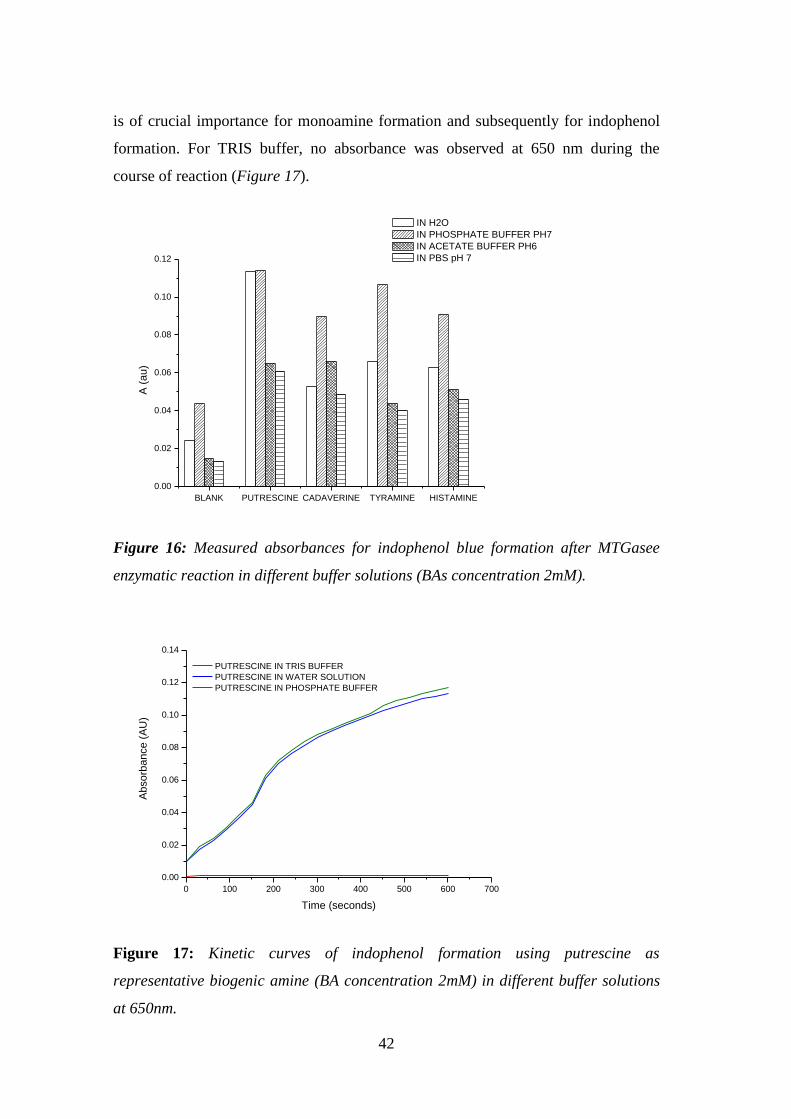
42
is of crucial importance for monoamine formation and subsequently for indophenol
formation. For TRIS buffer, no absorbance was observed at 650 nm during the
course of reaction (Figure 17).
BLANK PUTRESCINE CADAVERINE TYRAMINE HISTAMINE
0.00
0.02
0.04
0.06
0.08
0.10
0.12
A (
au
)
IN H2O
IN PHOSPHATE BUFFER PH7
IN ACETATE BUFFER PH6
IN PBS pH 7
Figure 16: Measured absorbances for indophenol blue formation after MTGasee
enzymatic reaction in different buffer solutions (BAs concentration 2mM).
0 100 200 300 400 500 600 700
0.00
0.02
0.04
0.06
0.08
0.10
0.12
0.14
Abso
rba
nce
(A
U)
Time (seconds)
PUTRESCINE IN TRIS BUFFER
PUTRESCINE IN WATER SOLUTION
PUTRESCINE IN PHOSPHATE BUFFER
Figure 17: Kinetic curves of indophenol formation using putrescine as
representative biogenic amine (BA concentration 2mM) in different buffer solutions
at 650nm.

43
In all of the cases, the blank sample was prepared by introducing deionized water
into the mixture of reagents instead of the BA of interest. The detected signal was
due to the non specificity of MTGase, which is also capable of reacting with water in
the absence of biogenic amines (Folk, 1983). In such a case the ammonium
originates from the CBZ substrate.
4.2.2 Influence of organic solvents on MTGase activity
Enzyme activity can also be influenced by the presence of organic solvents (Gekko
K., 1998). To evaluate TGase activity in the presence of organic solvents added to
incease the sensitivity of TLS detection, activity test for transglutaminases (TGase)
was performed in ethanol/water and acetonitrile/water mixtures according to
published procedures (Folk J. E., 1966a and 1966b). TGase activity is usually
measured in a TRIS buffer, but since the TRIS buffer was shown to interfere with the
indophenol formation (section 4.2.1) the effects of ethanol and acetonitrile were
compared to TGase activity in water. Solutions of TGase were prepared in water, in
25% ethanol/water mixture and in 25% acetonitrile/water mixture. Measurements of
the TGase-substrate reaction product (Cbz-Gln-Gly hydroxamate) showed
comparable absorbances at 525nm (Chung, S.I., 1970) in case of water and
acetonitrile/water mixture and an about 25% increase in activity and consequently
absorbance in ethanol/water mixture. Similar effects for ethanol were already
described in the literature (Cui L., 2008).
4.2.3 Determination of BAs with He-Ne-TLS detection unit (batch mode)
The magnitudes in TLS signals resulting from the formed indophenol were plotted
against the concentration of biogenic amines (Figure 18 and Figure 19) in order to
obtain the calibration curve for each of investigated BAs. It is clearly visible, that the
calibration curves are not linear. The nonlinearity is mainly attributed to the
saturation of the TLS signal, which is caused by the high blank signal originating
from ammonium (and/or amino compounds) present in deionized water, as
confirmed by ion chromatography (25 ng/mL). The nonlinearity for the given

44
detection system is observable at signals above 0.6 mV and does not affect the
determination of cadaverine, for which the lowest sensitivity was achieved. In any
case, the nonlinearity does not hinder the applicability of the developed method for
the purpose of fast screening, where only a binary response is required (BAs present
or not present at a concentration above selected limit). However, for the calculation
of the LODs the slopes of calibration curves were required and for this purpose only
the concentrations within the linearity range for a given BA were considered. The
resulting curves have similar, and acceptable correlation, coefficient between 0.980
and 0.996. Limits of detection calculated for each of biogenic amines are listed in
Table 8 and are in good agreement with LODs achieved for the determination of
ammonia (section 4.1). Actually, the LODs are just slightly higher than those
achieved for the determination of ammonium (expressed in molar concentrations),
when considering the formation of one ammonium per molecule of a biogenic amine.
Table 8: Table of merit for batch mode determination of BAs with He-Ne TLS
detection unit.
Putrescine Cadaverine Histamine Tyramine
LOD (M) 5.2×10⁻⁷
1.4×10⁻⁶
1.5×10⁻⁶
2.0×10⁻⁶
Average blank
signal (V) 2.1×10
-3 2.1×10
-3 2.1×10
-3 2.1×10
-3
RSD of blank (%) 4.1% 4.1% 4.1% 4.1%
Linearity
range (M)
1.0×10⁻⁶
2.5×10⁻⁶
1.0×10⁻⁶
2.5×10⁻⁶
1.5×10⁻⁶
2.5×10⁻⁶
1.5×10⁻⁶
2.5×10⁻⁶
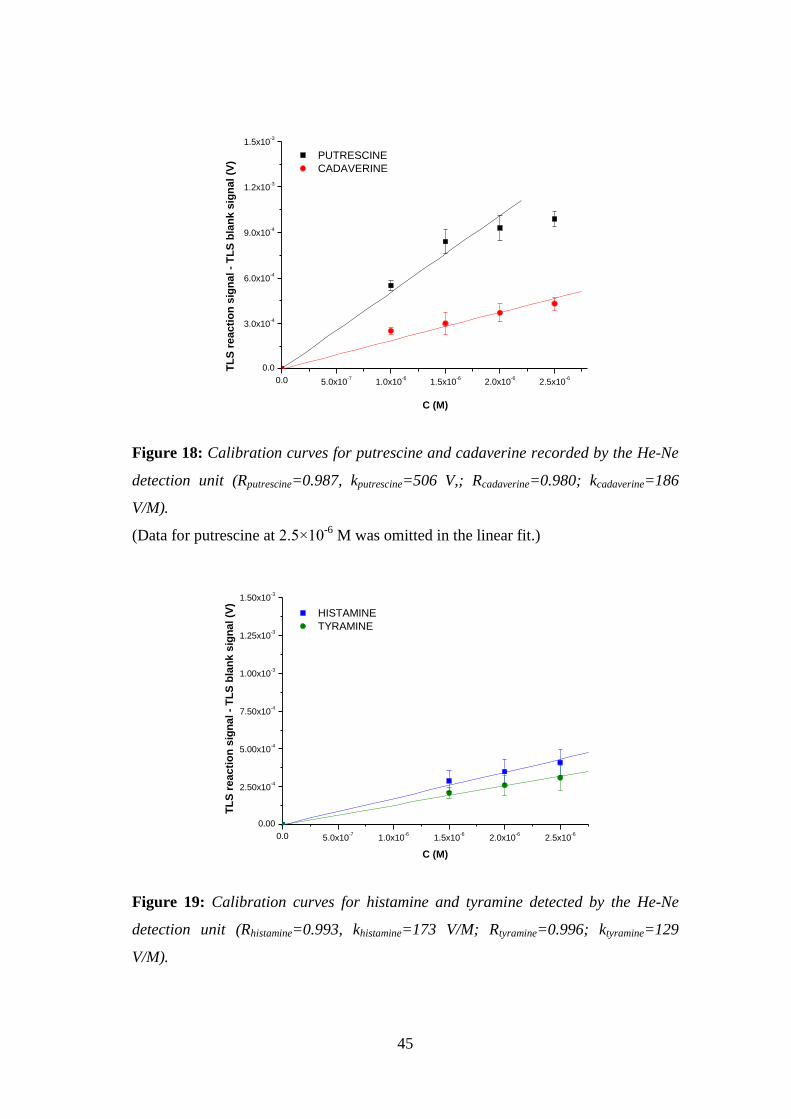
45
0.0 5.0x10⁻⁷
1.0x10⁻⁶
1.5x10⁻⁶
2.0x10⁻⁶
2.5x10⁻⁶
0.0
3.0x10⁻⁴
6.0x10⁻⁴
9.0x10⁻⁴
1.2x10⁻³
1.5x10⁻³
TL
S r
ea
cti
on
sig
na
l -
TL
S b
lan
k s
ign
al
(V)
C (M)
PUTRESCINE
CADAVERINE
Figure 18: Calibration curves for putrescine and cadaverine recorded by the He-Ne
detection unit (Rputrescine=0.987, kputrescine=506 V,; Rcadaverine=0.980; kcadaverine=186
V/M).
(Data for putrescine at 2.5×10⁻⁶
M was omitted in the linear fit.)
0.0 5.0x10⁻⁷
1.0x10⁻⁶
1.5x10⁻⁶
2.0x10⁻⁶
2.5x10⁻⁶
0.00
2.50x10⁻⁴
5.00x10⁻⁴
7.50x10⁻⁴
1.00x10⁻³
1.25x10⁻³
1.50x10⁻³
HISTAMINE
TYRAMINE
TL
S r
ea
cti
on
sig
na
l -
TL
S b
lan
k s
ign
al (V
)
C (M)
Figure 19: Calibration curves for histamine and tyramine detected by the He-Ne
detection unit (Rhistamine=0.993, khistamine=173 V/M; Rtyramine=0.996; ktyramine=129
V/M).
46
When compared to a previously reported method for BA determination using
MTGase (Punakivi K., 2006), the LODs achieved in this work represent a 44 fold
improvement in case of histamine, 30 fold improvement in case of tyramine and 71
fold improvement in case of cadaverine, while in case of putrescine this
improvement is even 135 fold. In addition to the TLS enhancement of sensitivity by
4.4 times for the 30 mW excitation power, such improvement in LOD is attributed
also to 13.5-times higher extinction coefficient of indopehnol at 650 nm compared to
the extinction coefficient of NADH absorption maximum at 340 nm which was
related to a concentration of BA in the method developed by Punakivi. Besides the
significant improvement of the LODs it has to be pointed out that previously reported
TGase method requires two hours of reaction time, to achieve the indicated LODs,
while the newly developed method described in this work requires just 10 minutes of
reaction time, thus reducing the time of analysis by 12 times.
4.2.4 Determination of BAs with Kr-TLS detection unit (batch mode)
To further improve the limits of detection for BAs the determination achieved with
the He-Ne TLS detection unit, a new powerful TLS system was constructed
exploiting the higher power of a Kr-laser (200 mW) which also better matches the
absorbance of indophenol at 650 nm. With the previous system the excitation laser
emission line was at 632.8 nm, in this case the emission line of the Kr-laser was 647
nm, much closer to the absorption maximum of indophenol blue at 650 nm. This
contributes to higher absorbance by 1.08 times. This setup in general allows
detection of at least 10 times lower concentrations (10-8
M concentration range) of
BAs compared to the He-Ne detection unit (Figure 20 and Figure 21).

47
0.0 5.0x10⁻⁸
1.0x10⁻⁷
1.5x10⁻⁷
2.0x10⁻⁷
2.5x10⁻⁷
3.0x10⁻⁷
0.0
5.0x10⁻⁴
1.0x10⁻³
1.5x10⁻³
2.0x10⁻³
2.5x10⁻³
TL
S r
ea
cti
on
sig
na
l -
TL
S b
lan
k s
ign
al (V
)
C(M)
PUTRESCINE
CADAVERINE
Figure 20: Calibration curves for putrescine and cadaverine detected by the Kr-TLS
detection unit (Rputrescine=0.964, kputrescine=7258 V/M; Rcadaverine=0.976;
kcadaverine=7745 V/M).
0.0 5.0x10⁻⁸
1.0x10⁻⁷
1.5x10⁻⁷
2.0x10⁻⁷
2.5x10⁻⁷
3.0x10⁻⁷
0.0
5.0x10⁻⁴
1.0x10⁻³
1.5x10⁻³
2.0x10⁻³
2.5x10⁻³
C(M)
TL
S r
ea
cti
on
sig
na
l -
TL
S b
lan
k s
ign
al
(V)
TYRAMINE
HISTAMINE
Figure 21: Calibration curves histamine and tyramine detected by the Kr-TLS detection
unit (Rhistamine=0.975, khistamine=4253 V/M; Rtyramine=0.996; ktyramine=2215 V/M).

48
The LODs (Table 9) reported for the four investigated biogenic amines are between
12 to 32 times lower compared to LODs achieved by the He-Ne detection unit. Part
of this improvement is due to a 7-times higher excitation laser power provided by the
Kr-laser and to better matching of the excitation wavelength with the absorption
maximum of indophenol blue. Additional improvement can only be attributed to
better alignment of the system, particularly to the proper positioning of the sample
cell with respect to the waist of the probe beam. This was not carefully investigated
for the He-Ne TLS system, which was constructed primarily for testing purposes.
Better performance from the Kr-TLS instrument is also evident from the lower RSD
of the measurements, as shown for the blank signals in Table 8 and Table 9.
Table 9: Table of merit for batch mode determination of BAs with Kr-TLS detection
unit.
Putrescine Cadaverine Histamine Tyramine
LOD (M) 4.0×10⁻⁸
3.6×10⁻⁸
6.6×10⁻⁸
1.3×10⁻⁷
Average blank
signal (V) 9.23×10
-3 9.23×10
-3 9.23×10
-3 9.23×10
-3
RSD (%) 1.0 % 1.0 % 1.0 % 1.0 %
Linearity
range (M)
1.0×10⁻⁷
2.5×10⁻⁷
1.0×10⁻⁷
2.5×10⁻⁷
1.0×10⁻⁷
2.5×10⁻⁷
1.0×10⁻⁷
2.5×10⁻⁷
4.2.4.1 Determination of biogenic amines in real samples
The newly developed method was tested in real samples with complex matrices to
verify its applicability. Wine was selected as a complex matrix sample for this
purpose.
Before the sample analysis, an extraction method was tested using standard solution
of biogenic amines in order to determine the recoveries for each studied amine. The
extraction of BAs was based on the already developed extraction method (Molins-
Legua C., 2005). Amine standard solutions were prepared as described in caption

49
3.2.2 and extracted with the Molins-Legua procedure. As a blank solution synthetic
wine was used, as decribed by Peña-Gallego and co-workers (2009): an aqueous
solution at pH 3.5, containing 10% (v/v) ethanol and 5 g L-1
of tartaric acid.
Limits of detection achieved after the SPE procedure for each biogenic amine are
illustrated in Table 10, with corresponding calibration curves (Figure 22, Figure 23)
obtained after extraction. Limits of detections for each biogenic amine are similar to
those obtained in direct determination of BAs in standard solutions (previous
chapter).
Table 10: Table of merit for batch mode determination of BAs with the Kr-TLS
detection unit after extraction.
Putrescine Cadaverine Histamine Tyramine
LOD (M) 5.0×10⁻⁸
5.5×10⁻⁸
8.4×10⁻⁸
1×10⁻⁷
Average
blank signal
(V)
9.89×10⁻³
9.89×10⁻³
0.01017 0.01017
Linearity
range (M)
5×10⁻⁸
1.5×10⁻⁷
5×10⁻⁸
1.5×10⁻⁷
1×10⁻⁷
2.5×10⁻⁶
1×10⁻⁷
2.5×10⁻⁶
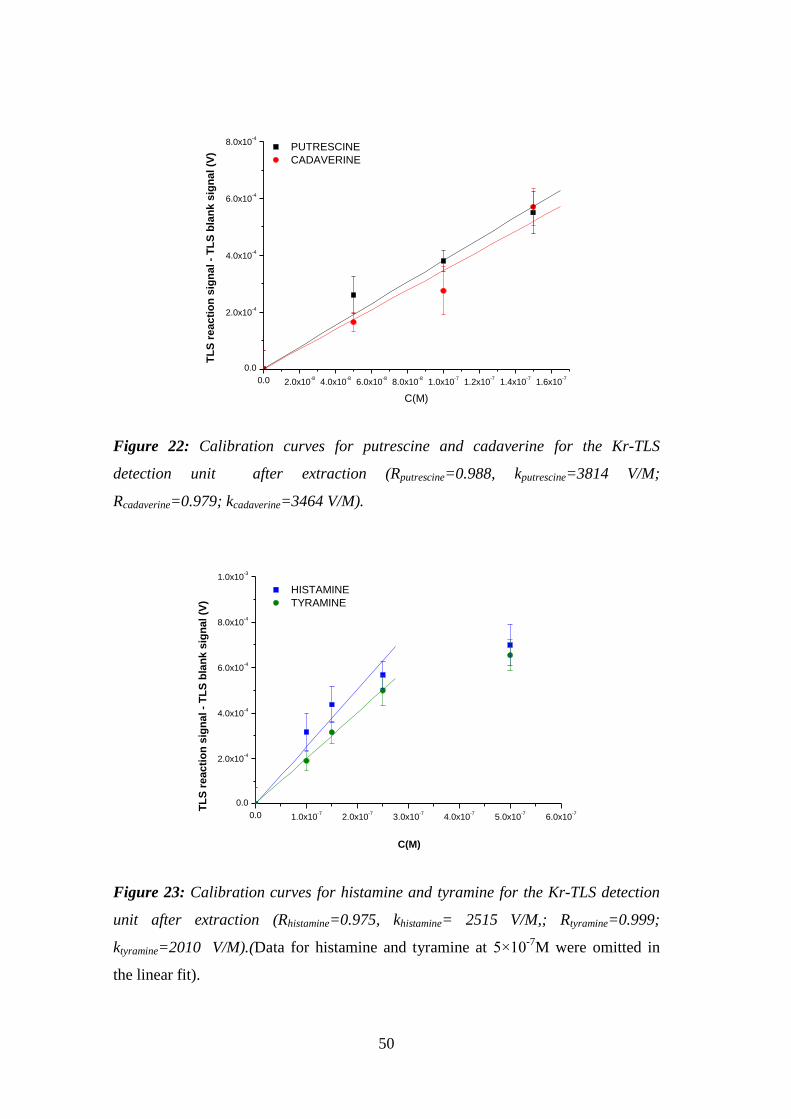
50
0.0 2.0x10⁻⁸
4.0x10⁻⁸
6.0x10⁻⁸
8.0x10⁻⁸
1.0x10⁻⁷
1.2x10⁻⁷
1.4x10⁻⁷
1.6x10⁻⁷
0.0
2.0x10⁻⁴
4.0x10⁻⁴
6.0x10⁻⁴
8.0x10⁻⁴
TL
S r
ea
cti
on
sig
na
l -
TL
S b
lan
k s
ign
al (V
)
PUTRESCINE
CADAVERINE
C(M)
Figure 22: Calibration curves for putrescine and cadaverine for the Kr-TLS
detection unit after extraction (Rputrescine=0.988, kputrescine=3814 V/M;
Rcadaverine=0.979; kcadaverine=3464 V/M).
0.0 1.0x10⁻⁷
2.0x10⁻⁷
3.0x10⁻⁷
4.0x10⁻⁷
5.0x10⁻⁷
6.0x10⁻⁷
0.0
2.0x10⁻⁴
4.0x10⁻⁴
6.0x10⁻⁴
8.0x10⁻⁴
1.0x10⁻³
TL
S r
ea
cti
on
sig
na
l -
TL
S b
lan
k s
ign
al (V
)
C(M)
HISTAMINE
TYRAMINE
Figure 23: Calibration curves for histamine and tyramine for the Kr-TLS detection
unit after extraction (Rhistamine=0.975, khistamine= 2515 V/M,; Rtyramine=0.999;
ktyramine=2010 V/M).(Data for histamine and tyramine at 5×10⁻⁷
M were omitted in
the linear fit).

51
As in the case of ammonia determination (section 4.1.3) accuracy of the method was
tested by analysing aqueous solutions with different concentration levels of a single
biogenic amine. Results demonstrate good agreement with true values in the case of
putrescine (Table 11), histamine (Table 13) and tyramine (Table 14). In case of
cadaverine (Table 12) the measurements at 1×10⁻⁷
M showed only 70% recovery,
while at 1.5×10⁻⁷
M recovery of over 130% was observed.
Table 11: Recoveries for determination of putrescine.
PUTRESCINE
CONCENTRATION IN
THE SAMPLE (M)
MEASURED PUTRESCINE
(M) RECOVERY (%)
5×10⁻⁸
5.9×10⁻⁸
± 1×10⁻⁸
118±20
1×10⁻⁷
1.1×10⁻⁷
±0.5×10⁻⁸
110±5
1.5×10⁻⁷
1.5×10⁻⁷
±0.9×10⁻⁸
100±6
Table 12: Recoveries for the determination of cadaverine.
CADAVERINE
CONCENTRATION IN
THE SAMPLE (M)
MEASURED PUTRESCINE
(M) RECOVERY (%)
5×10⁻⁸
4.4×10⁻⁸
± 1×10⁻⁸
88±20
1×10⁻⁷
7×10⁻⁸
±1.5×10⁻⁸
70±15
1.5×10⁻⁷
2×10⁻⁷
±0.4×10⁻⁸
133±3
Table 13: Recoveries for the determination of histamine.
HISTAMINE
CONCENTRATION IN
THE SAMPLE (M)
MEASURED PUTRESCINE
(M) RECOVERY (%)
1×10⁻⁷
1.1×10⁻⁷
±0.5×10⁻⁸
110±5
1.5×10⁻⁷
1.4×10⁻⁷
±0.8×10⁻⁸
93±5
2.5×10⁻⁷
2.8×10⁻⁷
±0.7×10⁻⁸
112±2

52
Table 14: Recoveries for the determination of tyramine.
TYRAMINE
CONCENTRATION IN
THE SAMPLE (M)
MEASURED PUTRESCINE
(M) RECOVERY (%)
1×10⁻⁷
8.8×10⁻⁸
±1.0×10⁻⁸
88±10
1.5×10⁻⁷
1.6×10⁻⁷
±0.22×10⁻⁸
107±2
2.5×10⁻⁷
2.7×10⁻⁷
±0.55×10⁻⁸
108±3
The assay is not specific for identification of single biogenic amines, but allows the
determination of the total biogenic amines present. Therefore, for analysis of the
wine samples, we decided to express the quantity of biogenic amines as equivalents
of histamine, the only BA for which the maximum contamination level in wine is
regulated. Tested samples were two different types of white wine for which different
levels of BAs were expected due to different composition of grapes: home made
wine from mixed white grapes (sample 1) and wine sample produced from Rebula
grapes and provided by the Centre of Wine Research at the University of Nova
Gorica (sample 2). Both wines were produced using the classic procedures of
crushing, pressing, fermentation, filtration and bottling.
As it is visible from the comparison of the signals in Figure 24, the presence of BAs
in both samples can be predicted. The higher signal in sample 2, suggests higher
concentration of biogenic amines. However, based on the addition of histamine and
from the difference of TLS signals from spiked and original wine samples, a
concentration of BAs corresponding to (6.4±0.3)×10-7
M which corresponds to
0.069±0.003 mg/L equivalents of histamine was estimated for sample 1, and
(1.8±0.9)×10-6
M concentration which correspond to 0.2±0.1 mg/L equivalents of
histamine was estimated for sample 2. Due to a relatively large standard deviation in
the measurement of spiked sample 2 the difference in concentrations of BAs in the
two samples could not be confirmed. Nonetheless, these results indicate, that in the
selected samples of wine the concentrations of BA are up to 5 times lower compared
to the reported values (recalculated as histamine equivalents) in Greek wine (cHis=
0.34 mg/L by Proestos C., 2008). But even concentrations below 0.1mg/L can still be
reliably detected due to the high sensitivity of the TLS method.

53
Definitive confirmation of the presence of BAs and their concentrations however
requires determination of these compounds with a second standardised method such
as HPLC, which would also be necessary for final validation of the proposed
enzymatic method.
WINE WINE + 1,5E-7 HIS
0.0
3.0x10⁻³
6.0x10⁻³
9.0x10⁻³
1.2x10⁻²
1.5x10⁻²
TL
S s
ign
al (V
)
SAMPLE 1
SAMPLE 2
Figure 24: Signals of sample 1 and sample 2 with the Kr-TLS detection unit.
4.3 FIA-TLS bioanalytical system
In the following section the performances of two different TLS detection systems
were analyzed and optimized. In order to achieve best performance for the FIA
system in terms of sensitivity and LOD experimental variables that affect the
performance were studied.
4.3.1 Influence of sample volume
Influence of different sample volumes was examined. 2mM solutions of each
biogenic amine were injected using 4 different sample loops (10μL; 50μL; 100μL,
200μL).
Different flow rates were chosen for the 2 pumps in order to ensure higher residence
time in the bioanalytical column. The objective was to ensure a sufficient incubation
time (10 minutes), as determined in batch mode measurements.

54
The peak height increased with increasing sample injection volume in the range
10μL - 200μL. Increasing the injection volume, caused broadening of the peaks, for
investigated sample injection volumes in the range 10μL - 200μL. The highest TLS
signal was obtained with a 200μL sample volume and was selected as the sample
volume for injection of BAs in the flow steam (Figure 25).
0 100 200 300 400 500 600 700 800 900
0
1
2
3
4
5
6
7
TL
S s
ign
al (m
V)
Time (sec)
2mM PUT (10ul inj.loop)
2mM PUT (50ul inj.loop)
2mM PUT (100ul inj.loop)
2mM PUT (200ul inj.loop)
Figure 25: Influence of the sample volume on the peak height (conditions: 0.2
mL/min pump A; 0.3 mL/min pump B; 2mM putrescine; excitation at 647 nm,
P=200mW ).
4.3.2 Determination of BAs with Kr-TLS detection unit
Two structurally different biogenic amines were used for this study: putrescine as a
representative of diamines and histamines as a representative of heterocyclic
monoamines. The resulting graphs of the TLS signal as function of time (Figure 26),
where the signal heights correspond to the different concentration of BAs injected,
clearly differ in the peak width and height.
These differences could be attributed to different structures of investigated BAs. The
observed longer retentions of putrescine in the column can be explained by
differences in the structure of putrescine (aliphatic) and histamine (heterocyclic)
which can contribute to stronger interaction with the material of the bioanalytical
column and its packing in case of putrescine.

55
0 200 400 600 800 1000 1200 1400 1600 1800 2000
0
1
2
3
4
5
6
7
8
9
10
TL
S s
ign
al (m
V)
Time (sec)
PUTRESCINE WITH TG WITH CBZ
HISTAMINE WITH TG WITH CBZ
Figure 26: FIA-Kr-TLS diagram of different BAs with the use of immobilized
MTGase and with CBZ-Gln-Gly (conditions: 0.2 mL/min pump A; 0.3 mL/min pump
B; BAs concentration: 0.5mM; 1mM; 2mM; 5mM; excitation at 647 nm, P=200mW).
Another immediate observation can be made regarding the sensitivity of the method.
This is substantially lower compared to the previously discussed determination of
BAs by MTGase in batch mode, where concentrations at the level of 10-6
M were
easily detected, while in the FIA mode at least two orders of magnitude higher
concentrations are required for detection.
The observed low sensitivity could be due to the loss of MTGase activity during the
immobilization procedure. To elucidate this effect another set of measurements was
conducted under similar conditions but without immobilised MTGase and without
the addition of CBZ-Gln-Gly.
From Figure 27, it is clearly evident that the reaction of indophenol blue formation
proceeds even without the use of MTGase and CBZ-Gln-Gly. Similar peak heights,
such as those in the presence of MTGase, show that TGA completely lost the activity
upon immobilization. This has, concurrently, confirmed that the indophenol blue
method suffers from BAs interference. However, taking into account the high
concentrations of BAs used in this test, we have estimated that the contribution of

56
BAs to direct formation of indophenol is only 1% compared to the signal generated
by the ammonium released from BAs (in batch mode).
0 500 1000 1500 2000 2500
0
1
2
3
4
5
6
7
8
9
TL
S s
ign
al (m
V)
Time (sec)
PUTRESCINE NO TG NO CBZ
HISTAMINE NO TG NO CBZ
Figure 27: FIA-Kr-TLS diagram of different BAs without the use of MTGase and
without CBZ-Gln-Gly (conditions: 0.2 mL/min pump A; 0.3 mL/min pump B; BAs
concentration: 0.5mM; 1mM; 2mM; 5mM; excitation at 647 nm; P=200mW).
As a last option we have tried to change the type of enzyme immobilized on CPG,
always a TGase, but this time from guinea pig liver. Even upon changing the enzyme
the sensitivity of the method did not improve as illustrated in Figure 28 and Figure
29.
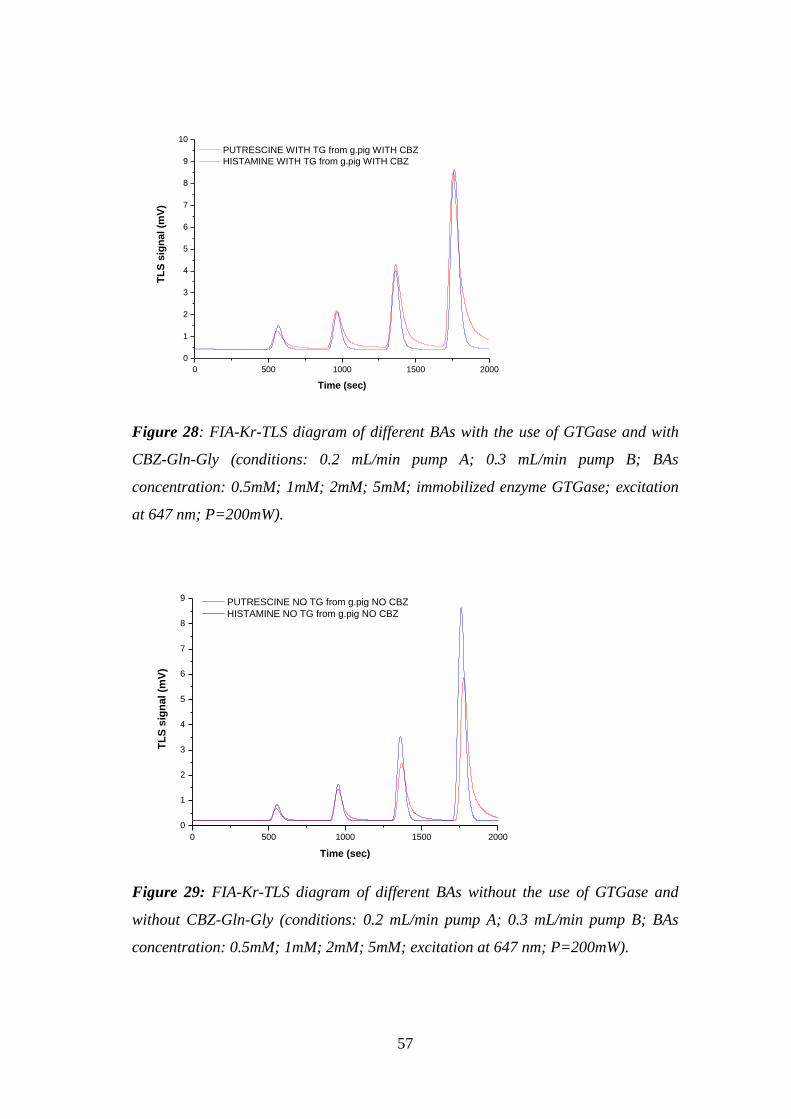
57
0 500 1000 1500 2000
0
1
2
3
4
5
6
7
8
9
10
TL
S s
ign
al (m
V)
Time (sec)
PUTRESCINE WITH TG from g.pig WITH CBZ
HISTAMINE WITH TG from g.pig WITH CBZ
Figure 28: FIA-Kr-TLS diagram of different BAs with the use of GTGase and with
CBZ-Gln-Gly (conditions: 0.2 mL/min pump A; 0.3 mL/min pump B; BAs
concentration: 0.5mM; 1mM; 2mM; 5mM; immobilized enzyme GTGase; excitation
at 647 nm; P=200mW).
0 500 1000 1500 2000
0
1
2
3
4
5
6
7
8
9
TL
S s
ign
al (m
V)
Time (sec)
PUTRESCINE NO TG from g.pig NO CBZ
HISTAMINE NO TG from g.pig NO CBZ
Figure 29: FIA-Kr-TLS diagram of different BAs without the use of GTGase and
without CBZ-Gln-Gly (conditions: 0.2 mL/min pump A; 0.3 mL/min pump B; BAs
concentration: 0.5mM; 1mM; 2mM; 5mM; excitation at 647 nm; P=200mW).

58
4.3.2.1 Addition of acetonitile for BAs determination in the FIA-system
As already discussed in previous chapters, the addition of organic solvents, in our
case 25% acetonitrile added to carrier solution B, improves the sensitivity for the
detection of biogenic amines. With this addition we conducted our investigations
using 10 times lower concentrations of BAs injected in the FIA system in
comparison to concentrations when using only water solutions (Figure 30).
0 300 600 900 1200 1500 1800 2100 2400 2700
0
1
2
3
4
5
6
7
TL
S s
ign
al (m
V)
Time (sec)
PUTRESCINE
Figure 30: FIA-TLS diagram of different BAs without the use of TGase and without
CBZ-Gln-Gly (conditions: 0.2 mL/min pump A; 0.2 mL/min pump B; BAs
concentration: 0.05mM;0.1mM;0.25mM;0.5mM;1mM; excitation at 647 nm;
P=200mW).
Despite a much lower sensitivity in FIA-TLS compared to the batch mode
measurements, the limits of detection were still 10-times lower (Table 15) in
comparison with the bioanalytical method reported in the literature.
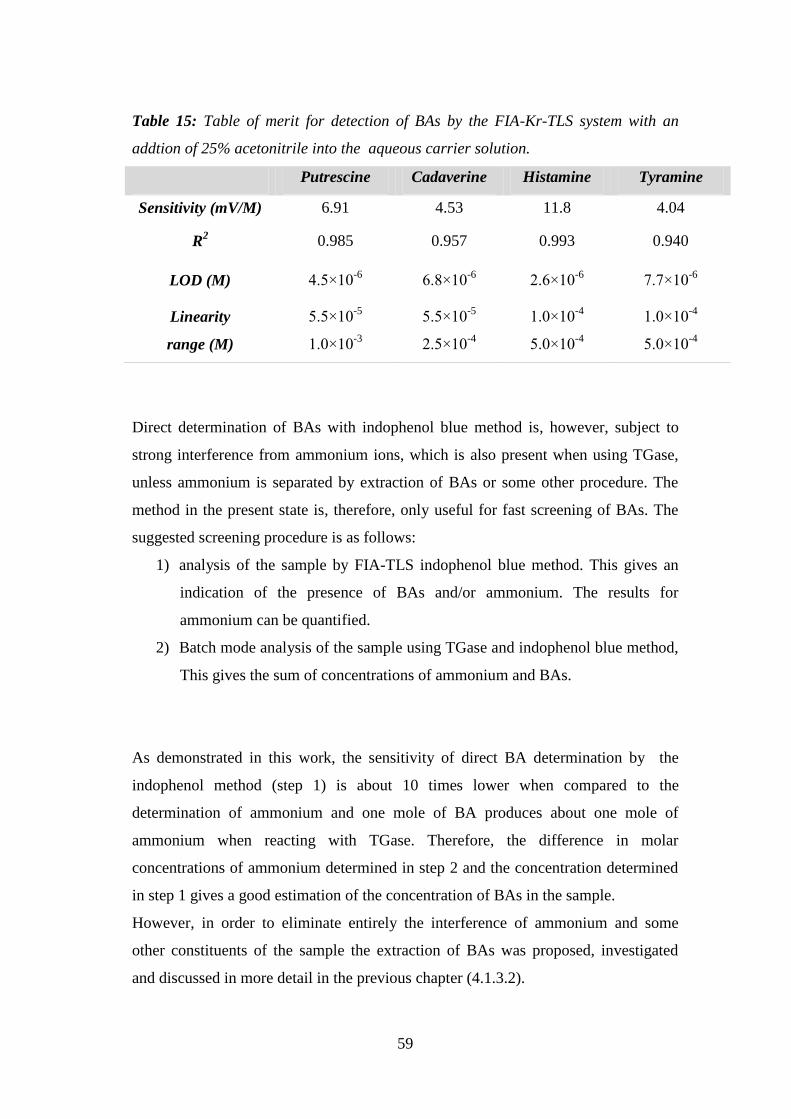
59
Table 15: Table of merit for detection of BAs by the FIA-Kr-TLS system with an
addtion of 25% acetonitrile into the aqueous carrier solution.
Putrescine Cadaverine Histamine Tyramine
Sensitivity (mV/M) 6.91 4.53 11.8 4.04
R2 0.985 0.957 0.993 0.940
LOD (M) 4.5×10⁻⁶
6.8×10⁻⁶
2.6×10⁻⁶
7.7×10⁻⁶
Linearity
range (M)
5.5×10⁻⁵
1.0×10⁻³
5.5×10⁻⁵
2.5×10⁻⁴
1.0×10⁻⁴
5.0×10⁻⁴
1.0×10⁻⁴
5.0×10⁻⁴
Direct determination of BAs with indophenol blue method is, however, subject to
strong interference from ammonium ions, which is also present when using TGase,
unless ammonium is separated by extraction of BAs or some other procedure. The
method in the present state is, therefore, only useful for fast screening of BAs. The
suggested screening procedure is as follows:
1) analysis of the sample by FIA-TLS indophenol blue method. This gives an
indication of the presence of BAs and/or ammonium. The results for
ammonium can be quantified.
2) Batch mode analysis of the sample using TGase and indophenol blue method,
This gives the sum of concentrations of ammonium and BAs.
As demonstrated in this work, the sensitivity of direct BA determination by the
indophenol method (step 1) is about 10 times lower when compared to the
determination of ammonium and one mole of BA produces about one mole of
ammonium when reacting with TGase. Therefore, the difference in molar
concentrations of ammonium determined in step 2 and the concentration determined
in step 1 gives a good estimation of the concentration of BAs in the sample.
However, in order to eliminate entirely the interference of ammonium and some
other constituents of the sample the extraction of BAs was proposed, investigated
and discussed in more detail in the previous chapter (4.1.3.2).
60
5 Conclusions
Novel dual beam TLS spectrometers based on the excitation from a He-Ne (632.8
nm) and a Kr laser (647 nm) were constructed, which for the first time utilize a green
probe beam at 543.5 nm from a second He-Ne laser. This facilitates the alignment of
the pump and probe beams, and their separation before reaching the detector, which
would be far more demanding in case of two read beams (632.8 and 647 nm). In
addition, the shorter wavelength of the probe beam (543.5 nm) contributes to a
16.4% higher sensitivity in the TLS measurement compared to the usually used
probe beam from a He-Ne laser (632.8 nm).
Indophenol blue reaction was proven as a suitable alternative tool for the
determination of ammonia by TLS. The application of TLS resulted in over 9.8 times
lower LODs, compared to spectrophotometric measurements in water. Improvement
was even higher (16 times) in 25% acetonitrile solutions in which the LODs were
lowered down to 8 ng/mL in this work.
The indophenol blue-TLS method was further successfully employed for the
detection of biogenic amines, which was based on the release of ammonium from the
reaction between the biogenic amine and the enzyme transglutaminase.
Comparison of the developed method based on TLS detection with He-Ne excitation,
to the enzymatic method previously reported in the literature, showed an
improvement expressed in 44 to 135 fold lower LODs, for the different biogenic
amines investigated. The calculated LODs were dependent on the biogenic amine
and ranged from 5.2×10⁻⁷ M to 2.0×10⁻⁶ M.
A new powerful TLS system was constructed with two fundamental characteristics to
further improve the LODs was utilised: higher laser power (Kr-laser, 200 mW), and
excitation wavelength (647 nm) similar to the absorbance maximum of indophenol,
close to 650 nm. The achieved LODs (3.6×10⁻⁸
M to 1.3×10⁻⁷
M) were 12 to 32 times
lower compared to He-Ne detection unit and in the range of those obtained with RP-
HPLC with UV detection. However, the method developed in this work does not
require the derivatization step needed for BAs prior determination by HPLC, which

61
is time-consuming and lasting from half an hour to one hour. It must, however, be
pointed out that the TGase-TLS method can not discriminate between individual BAs
and is therefore only applicable as a screening method for determining the presence
or absence of BAs. In this respect the high sample throughput is of more importance
than just the selectivity of the method.
In this context, owing to the high sensitivity of TLS detection, the previously
required two hours reaction time for the enzymatic method (Punakivi K., 2006) was
reduced to only 10 minutes. This allows an increase in sample throughput to at least
6 samples per hour.
In view of a possible flow injection method for rapid screening for BAs, it was,
however, found that during the immobilization of MTGase or GTGase the enzyme’s
activity was not preserved. Our experiments on a FIA-TLS manifold, however,
confirmed, that for screening purposes, the indophenol blue FIA-TLS method can be
used without the need of TGase, and provides comparable or lower LODs (2.6×10⁻⁶
M for histamine and 7.7×10⁻⁶ for tyramine), as enzymatic method reported in
literature, while offering about 10 times higher sample throughput. In such a case the
relative error due to the interference from aminoacids, which are known to interfere
with the indophenol-blue reaction, was found to be 6% for asparagines, 12% for
glycine and 20% for histidine, when the amino acids were present in concentrations
equimolar to those of ammonia entering the indophenol reaction.
The developed batch mode method was also used for analysis of real samples of
white wine in order to test the applicability of the method to real samples where it
allows the determination of the total biogenic amines present. For this reason the
quantity of biogenic amines is expressed as equivalents of histamine, the only BA for
which the maximum contamination level in wine is regulated.
Based on the standard addition of histamine, a concentration of BAs corresponding
to (6.4±0.3) ×10-7 M or 0.069±0.003 mg/L equivalents of histamine was estimated
for home made wine, and (1.8±0.9) ×10-6 M or 0.2±0.1 mg/L equivalents of
histamine was for the Rebula wine. Results indicated that in the selected samples of
wine the concentrations of BA are up to 5 times lower compared to the reported

62
values in literature. This allows us to consider the developed TLS method as a highly
sensitive and rapid tool for semi-quantitative screening of BAs presence in real
samples. However for the ultimate confirmation of the presence of BAs in
investigated samples and for final validation of the method, a comparative analysis
with an independent analytical method such as HPLC is necessary.
However, additional work shall be focused on immobilization procedures for TGase,
which should provide higher specificity of the method and enable the analysis in the
FIA mode. This is the main prerequisite for further development of microfluidic
bioassay systems which can further increase the speed of diffusion controlled
reactions, due to increased interface surface to volume ratio. Under microfluidic
thermal lens microscopic detection sample throughputs of up to 30/hour are
predicted.
63
6 References
Aeschlimann D., Paulsson M. (1994). Transglutaminases: Protein cross-linking
enzymes in tissues and body fluids. Thromb. Haemostasis 71: 402-415.
Alberto M.R., Farias M.E., Manca de Nadra M.C. (2002). Effect of wine phenolic
compounds on Lactobacillus hilgardii 5w viability. J. Food Prot. 65: 211-213.
Ando H., Adachi M., Umeda K., Matsuura A., Nonaka M., Ucio R., Tanaka H.,
Armbrust C., Werlein H.D., Watkinson B. (2003). Transglutaminase – Einsatz und
Wirkung in Fischprodukten. Deut. Lebens. Rundsch. 99: 181-187.
Askar A., Trepton H. (1989). Biogene Amine in Fleischprodukten.
Ernahrung/Nutrition 14: 425-429.
Bardocz S. (1995). Polyamines in food and their consequences for food quality and
human health. Trends Food Sci. Technol. 6: 341-346.
Bauer N., Koehler P., Wieser H., Scieberle P. (2003a). Studies on effects of
microbial transglutaminase on gluten proteins of wheat. I. Biochemical analysis.
Cereal Chem. 80: 781-786.
Bauer N., Koehler P., Wieser H., Scieberle P. (2003b). Studies on effects of
microbial transglutaminase on gluten proteins of wheat. II. Rheological properties.
Cereal Chem. 80: 787-790.
Bechtold U., Otterbach J.T., Pasternack R, Fuchsbauer H.L. 2000. Enzymic
preparation of protein G-peroxidase conjugates catalysed by transglutaminase. J.
Biochem. 127:239–245.
Ben-Gigirey B., Craven C., An H. (1998). Histamine formation in Albacore mucle
analyzed by AOAC and enzymatic methods. J.Food Science 63: 210-214.
Bialkowski S.E. (1996). Photothermal spectroscopy methods for chemical analysis.
In: Winefordner (Ed.), Chemical Analysis, Vol. 134, New York.
Ben-Gigirey B., Craven C., An H. (1998). Histamine formation in Albacore mucle
analyzed by AOAC and enzymatic methods. J.Food Science 63: 210-214.
Bouvrette P., Male K.B., Luong J.H.T., Gibbs B.F. (1997). Amperometric biosensor
for diamine using diamine oxidase purified from porcine kidney. Enzyme Microb.
Technol. 20: 32-38.
Busto O., Guasch J., Borrull F. (1996). Biogenic amines in wine: A review of
analytical methods. J. Inter. Sci. Vigne Vin 30: 85-101.

64
Cerutti G., Finoli C. Vecchio A. (1989). Non-volatile amine biogenesis from wort to
beer. Monatsschr. Brauwiss. 42: 246-248.
Chung, S.I. (1970). Mechanism of action of guinea pig liver transglutaminase. VII.
Chemical and stereochemical aspects of substrates binding and catalysis. J. Biol.
Chem. 245: 6424-6435,
Cinquina A. L., Longo F., Calì A., De Santis L., Baccelliere R., Cozzani R. (2004).
Validation and comparison of analytical methods for the determination of histamine
in tuna fish samples. J.Chrom. A 1032: 79-85.
Cirilo M.P.G., Coelho A.F.S., Araujo C.M., Goncalves F.R.B., Nogueria F.D., Gloria
M.B.A. (2003). Profile and levels of bioactive amines in green and roasted coffee.
Food Chem. 82: 397-402.
Clescieri L.S., Arnold E., Deaton A.D. (1998). Standard Methods for the
Examination of Water and Wastewater, 20th ed. American Public Health
Association, American Water Works Association, and Water Environment
Federation, Baltimore.
Collar C., Bollain C. (2004). Impact of microbial transglutaminase on the
viscoelastic profile of formulated bread doughs. European Food Res. Technol. 218:
139-146.
Compagnone D., Isoldi, G., Moscone D., Palleschi G. (2001). Amperometric
detection of biogenic amines in cheese using immobilised diamine oxidase. Anal.
Lett. 34: 841-854.
Cooper A. J. L., Jeitner T.M., Gentile V., Blass J.P. (2002). Cross linking of
polyglutamine domains catalyzed by tissue transglutaminase is greatly favored with
pathological-length repeats: does transglutaminase activity play a role in (CAG)n/Qn-
expansion diseases? Neurochem. Int. 40: 53-67.
Cui L., Guocheng D., Dongxu Z., Xuerong F., Jian C. (2008). Stability and
conformational changes of transglutaminase from Streptomyces hygroscopicus in
ethanol–aqueous medium. Process Biochem. 43: 887-891.
Darias R., Villalonga R. (2001). Functional stabilization of cellulase by covalent
modification with chitosan. J. Chem. Technol. Biotechnol. 76: 489-493.
Dovichi N.J., Nolan T.G., Weimer W.A. (1984). Theory for laser-induced
photothermal refraction. Anal. Chem. 56: 1700-1704.

65
Draisci R., Volpe G., Lucentini L., Cecilia A., Federico R., Palleschi G. (1998).
Determination of biogenic amines with electrochemical biosensor and its application
to salted anchovies. Food Chemistry 62: 225-232.
Eerola S., Roig-Sagues A.X., Lilleberg L., Aatto H. (1997). Biogenic amines in dry
sausages during shelf-life storage. Z. Lebensm.Unters. For. A 205: 351-355.
Esposito C., Costa C., Amoresano A., Mariniello L., Sommella M.G., Caputo I.,
Porta R. (1999). Transglutaminase-mediated amine incorporation into substance P
protects the peptide against proteolysis in vitro. Regul. Peptides, 84: 75–80.
Esposito C., Mancuso F., Calignano A., Di Pierro P., Pucci P., Porta R. (1995).
Neurokinin receptors could be differentiated by their capacity to respond to the
transglutaminase- synthesized γ-(glutamyl5) spermidine derivative of substance. P. J.
Neurochem.65:420–426.
FDA (Food and Drug Administration) 2001. Fish and fisheries products hazards and
controls guidance. Third Edition.
http://www.fda.gov/Food/GuidanceComplianceRegulatoryInformation/GuidanceDoc
umants/Seafood/FushandFisheriesProductsHazardsandcontrolsGuidance/ucm091091.
htm.
Fernandes J.O., Ferreira M.A. Combined ion-pair extraction and gas
chromatography-mass spectrometry for the simultaneous determination of diamines,
polyamines and aromatic amines in Port wine and grape juice. J.Chrom. A. 886: 183-
195.
Folk J.E. (1983). Mechanism and basis for specificity of transglutaminase-catalyzed
epsilon-(gamma-glutamyl) lysine bond formation. Adv. Enzymol. Relat. Areas Mol.
Biol. 54: 1-56.
Folk J.E., Cole P. W. (1966a). Mechanism of action of Guinea Pig Liver
Transglutaminase. J. Biol. Chem. 241: 5518-5525.
Folk J. E., Cole P.W. (1966b). Transglutaminase: Mechanistic features of the active
site as determined by kinetic and inhibitor studies. Biochim. Biophys. Acta 22: 244-
264.
Folk J.E., Chung S.I. (1985) Transglutaminases. Methods Enzymol. 113:.358–364.
Folk J.E., Chung S.I. (1973). Molecular and catalytic properties of transglutaminase.
Adv. Enzymol. Relat. Areas Mol. Biol. 38: 109-191.

66
Franko M. (2008). Thermal Lens Spectrometric Detection in Flow Injection Analysis
and Separation Techniques. Appl. Spectrosc. Rev. 43: 358-388.
Frébort I., Skoupá L., Pec P. (2000) Amine oxidase-based flow biosensor for the
assessment of fish freshness. Food Contr. 11: 13-18.
Gekko K., Ohmae E., Kameyama K., Takagi T. (1998). Acetonitrile-protein
interactions: amino acid solubility and preferential salvation. Biochim. Biophys. Acta
1873: 195-205.
Gerrard J. A., Newberry M.P., Wilson A.J., Ross, M., Fayle S.E., Kavale S. (2000).
Pastry lift and croissant volume as affected by microbial transglutaminase. J. Food
Science 65: 312-314.
Grenard P., Bates M.K., Aeschlimann D. (2001). Evolution of transglutaminase
genes: identification of a transglutaminase gene cluster on human chromosome
15q15. Structure of gene encoding transglutaminsae X and a novel gene family
member, transglutaminase Z. J.Biol. Chem. 276: 33066-33078.
Gómez L., Villalonga R. (2000). Functional stabilization of invertase by covalent
modification with pectin. Biotechnol. Lett. 22:1191–1195.
Gosetti F., Mazzucco E., Gianotti V., Polati S., Gennaro M.C.(2007). High
performance liquid chromatography/tandem mass spectrometry determination of
biogenic amines in typical Piedmont cheeses. J.Chromatogr.A. 1149:151–157.
Halász A., Baráth A., Simon-Sakadi L., and Holzapfel W. (1994). Biogenic amines
and their production by microorganisms in food. Trends Food Sci. Technol. 5: 42-49.
Hoekstra J. C., Johnson D.C. (1998). Comparison of Potential-Time Waveforms for
the Detection of Biogenic Amines in Complex Mixtures following Their Separation
by Liquid Chromatography. Anal. Chem. 70: 83-88.
Hyvönen T., Keinänen T.A., Khomutov A.R., Eloranta T.O. (1992). Monitoring of
the uptake and metabolism of aminooxy analogues of polyamines in cultured cells by
high-performance liquid chromatography. J.Chromatogr. 574: 17-21.
Izquiredo-Pulido M., Mariné-Font A., Vidal-Carou M.C. (2000). Effect of tyrosine
on tyramine formation during beer fermentation. Food Chem 70: 329-332.
Jüttner F. (1999). Interference with ammonium determination by the indopohenol-
type reaction of salicylate and dichloroisocyanurate. Fresenius' J. Ana.Chem. 363:
128-129.

67
Kalač P., Šavel J., Křižek M., Pelikánová T., Prokopová M. (2002a). Biogenic amine
formation in bottled beer. Food Chem.79: 431-434.
Kalač P., Švecová S., Pelikánová T. (2002b). Levels of biogenic amines in typical
vegetable products. Food Chem. 77: 349-351.
Kanaji T., Ozaki H.,. Takao T., Kawajiri K., Ide H., Motoki M., Simonishi Y. (1993).
Primary structure of microbial transglutaminase from Streptoverticillium sp. strain s-
8112. J.Biol. Chem. 268: 11565-11572.
Karpuj M.V., Becker M.W., Steinman L. (2002). Evidence for a role for
transglutaminase in Huntington’s disease and the potential therapeutic implications.
Neurochem. Int. 40: 31-36.
Kim S. Y., Jeitner T.M., Sternert P.M. (2002). Transglutaminases in disease.
Neurochem. Int. 40: 85-103.
Krìžek M., Kalač P. (1998a). Biogenic amines in foods and their roles in human
nutrition. Czech J.Food Sci. 16: 151-159.
Krìžek M., Pelikánová T.. (1998b). Determination of seven biogenic amines in foods
by micellar electrokinetic capillary chromatography. J.Chromatogr. A. 815: 243-250.
Kuraishi C., Yamazaki K., Susa Y. (2001). Transglutaminase: its utilization in the
food industry. Food Rev. Int. 17: 221-246.
Kurama H., Poetzschke J., Haseneder R. (2001). The application of memebrane
filtration for the removal of ammonium ions from potable water.
Kütemeyer C., Froeck M. ,Werlein H.-D., Watkinson B.M. (2005). The influence of
salts and temperature on enzymatic activity of microbial transglutaminase. Food
Contr. 16: 735-737.
Laliberte G., Proulx D., De Pauw N., De La Noue J. (1994). Algal technology in
wastewater treatment. In: Algae and water pollution, Rai, LC., Gaur, JP. And Soeder,
CJ. (Eds.), Archiv fur hydrobiology,Vol. 42. Berlin, 283-302.
Lange J., Wittmann C. (2002). Enzyme sensor array for the determination of
biogenic amines in food samples. Anal. Bioanal. Chem. 372: 276-283.
Lehane L., Olley J. (2000). Histamine fish poisoning revisited. Int. J.Food Microbiol.
58: 1-37.
Leuschner R.G., Heidel M., Hammes W.P. (1998). Histamine and tyramine
degradation by food fermenting microorganisms. Int. J.Food Micorbiol. 39: 1-10.
Lovaas E. (1991). Antioxidative effects of polyamines J.O.A.C.S. 68: 353-358.

68
Lorand L., Conrand S.M. (1984). Transglutaminases. Mol. Cell. Biochem. 58: 9-35.
Lorand L., Graham R.M. (2003). Transglutaminases: crosslinking enzymes with
pleiotropic functions. Nat. Rev. Mol. Cell Biol. 4: 140-156.
Malle P., and Valle' M. (1996). Assay of biogenic amines involved in fish
decomposition. J. Ass. Off. Analy. Chem 79: 43-49.
Male K.B., Bouvrette P., Luong J.H.T., Gobbs B.F. (1996) Amperometric biosensor
for total histamine, putrescine and cadaverine using diamine oxidase. J. Food Sci.
61:1012–1016.
Mancuso F., Porta R., Calignano A., Di Pierro P., Sommella M.C., Esposito C.
(2001). Substance P and its transglutaminase-synthesized derivatives elicit yawning
behavior via nitric oxide in rats. Peptides. 22: 1453–1457.
Manfroi L., Silva P.H.A., Rizzon L.A., Sabaini P.S., Glória M.B.A. (2009). Influence
of alcoholic and malolacticstarter cultures on bioactive amines in Merlot wines. Food
Chem. 116: 208-213.
Marcobal A., Polo M.C., Martín-Álvarez P.J., Moreno-Arribas M.V. (2004) Biogenic
amine content of red Spadish wines: comparison of a direct Elisa and an HPLC
method for the determination of histamine in wine. Food Res. Int. 38: 387-394.
Maxa E., Brandes W. (1993). Biogene amine in fruchtsäften. Mitt. Klosterneuburg
86: 101-106.
McCabe, B.J. (1986). Dietary tyramine and other pressor amines in MAOI regimens:
a review. J. Am. Diet. Assoc. 86: 1059-1064.
Mietz J.L.K., Karmas E. (1977). Chemical quality index of canned tuna as
determined by high-pressure liquid chromatography. J. Food Sci. Technol. 42: 155-
158.
Minagawa H., Kaneko H. (2000). Effect of double mutation on thermostability of
lactate oxidase. Biotechnol. Lett. 22: 1131-1133.
Molins-Legua C., Campins-Falcò P. (2005) Solid phase extraction of amines. Anal.
Chim. Acta 546: 206-220.
Molins-Legua C., Meseguer-Lloret S., Moliner-Martinez Y., Campíns-Falcó P.
(2006). A guide for selecting the most appropriate method for ammonium
determination in water analysis. Trends Anal. Chem. 25: 282-290.

69
Moret S., Conte L.S. (1996). High-performance liquid chromatographic evaluation of
biogenic amines in foods. An analysis of different methods of sample preparation in
relation to food characteristics. J. Chromatogr.A 729: 363-369.
Motoki M. (1997). Gelation of proteins. In: Gel Technology. Tokyo: Science forum,
80.
Murphy A, Ò-Fágáin C. (1996). Stability characteristics of chemically modified
trypsin. J. Biotechnol. 49:163–171.
Naguib K., Ayesh A.M., Shalaby A.R. (1995). Studies on the determination of
biogenic amines in foods. 1. Development of a TLC method for the determination of
eight biogenic amines in fish. J.Agric. Food Chem. 43: 134-139.
Nemes Z., Marekov L.N., Fèsus L., Steinert P.M. (1999). A novel function for
transglutaminse 1: Attachment of a long-chain ω-hydroxyceramides to involucrin by
ester bond formation. Proceedings of the National Academy of Sciences 96: 8402-
8407.
Niculescu M., Nistor C., Frébort I., Pec P., Mattiasson, B., Csöregi, E. (2000). Redox
hydrogel-based amperometric bienzyme electrodes for fish freshness monitoring.
Anal.Chem. 72: 1591-1597.
Nonaka M., Sawa A., MatsuuraY., Motoki M., Nio N. (1996). Deamidation of
several food proteins using free and immobilized Ca2+
-independent microbial
transglutaminase. Biosci. Biotech. Bioch. 60: 532-533.
Novella-Rodríguez S., Veciana-Nogués M.T., Izquierdo-Pulido M., Vidal-Carou
M.C. (2003). Distribution of biogenic amines and polyamines in cheese. J.Food Sci
68: 750-755.
Peña-Gallego A., Hernández-Orte P., Cacho J., Ferreira V. (2009). Biogenic amine
determination in wines using solid-phase extraction: A comparative study.
J.Chromatogr.A 1216: 3398-3401.
Pogačnik L., Franko M. (2001). Optimisation of FIA system for detection of
organophosphorus and carbamate pesticides based on cholinesterase inhibition.
Talanta 54: 631-641.
Prenter J., MacNeil C., Dick J.T.A., Riddell G.E., Dunn A.M. (2004). Lethal and
sublethal toxicity of ammonia to native, invasive and parasitised freshwater
amphipods. Water Res. 38: 2847-2850.
70
Proestos C., Loukatos P., Komaitis M. (2008). Determination of biogenic amines in
wines by HPLC with precolumn dansylation and fluorimetric detection. Food Chem.
106: 1218-1224.
Punakivi K., Smolander M., Niku-Paavola L., Mattinen J., Buchert J. (2006).
Enzymatic determation of biogenic amines with transglutaminase. Talenta 68: 1040-
1045.
Rasiah I. A., Sutton K.H., Low F.L., Lin H.M., Gerrard J.A. (2005). Crosslinking of
wheat dough proteins by glucose oxidase and the resulting effects on bread and
croissants. Food Chem. 89: 325-332.
Rawles D.D., Flick G.J., Martin R.Y. (1996). Biogenic Amines in Fish and Shellfish.
In: Advances in Food & Nutrition Research, Vol. 39, p. 329-365.
Reggiani R., Giussani P., Bertani A. (1990). Relationship between the Accumulation
of Putrescine and the Tolerance to Oxygen-Deficit Stress in Gramineae Seedlings.
Plant cell Physiol. 31: 489-494.
Rogers P.L., Staruszkiewicz W. (1997). Gas chromatographic method for putrescine
and cadaverine in canned tuna and mahimahi and fluorometric method for histamine
(minor modification of AOAC official method 977.13). J.AOAC Int. 80: 591-602.
Romero R., Bagur M., Sánchez-Viñas M., Gázquez, D. (2000). Optimization of
experimental variables in the dansyl chloride derivatization of biogenic amines for
their determination by RP-HPLC. Chromatographia 51: 404-410.
Saito K., Horie M., Nose N., Nakagomi K., Nakazawa H. (1992). High-performance
liquid chromatography of histamine and 1-methylhistamine with on-column
fluroescence derivatization. J. Chromatogr.A. 595: 163-168.
Saito T., Arsenault A.L., Yamauchi M., Kuboki Y., Crenshau M.A. (1997). Mineral
induction by immobilized phosphoproteins. Bone 21: 305-311.
Santos B., Simonet B.M., Ríos A., Varcálcel M. (2004). Direct automatic
determiantion of biogenic amines in wine by flow injection-capillary electrophoresis-
mass spectrometry. Electrophoresis 25: 3427-3433.
Sarkar N. K., Clarke D.D., Waelsch H. (1957). An Enzymically Catalyzed
Incorporation of Amines Into Proteins. Biochim. Biophys. Acta 25: 451-452.
Shalaby A. R. (1999). Simple, rapid and valid thin layer chromatographic method for
determining biogenic amines in foods. Food Chem.65: 117-121.

71
Shalaby A. R. (2000). Changes in biogenic amies in nature and germinating legume
seeds and their behaviour during cooking. Die Nahrung 44: 23-27.
Shulman K. I., Tailor S.A.N., Walker S.E., Gardner D.M. (1997). Tap (draft) beer
and monoamine oxidase inhibitor dietary restrictions. Can.J.Psychiatry 42: 310-312.
Silla Santos, M. H. (1996). Biogenic amines: their importance in foods. Int. J. Food
Microbiol. 29: 213-231.
Simon-Sarkadi L., Holzapfel W., Halasz A.J. (1994). Biogenic amine content and
microbial contamination of leafy vegetables during storage at 5 °C. J.Food Biochem.
17: 407-418.
Simon-Sarkadi L., Holzapfel W.H., (1994). Determination of biogenic amines in
leafy vegetables by amino acid analyser. Z. Lebensm.Unters. For. A 198: 230-233.
Singer S. M., Zainelli G.M., Norlund J.M., Lee N.A. (2002). Transglutaminase bonds
in neurofibrillary tangles and paired helical filament tau early in Alzheimer’s disease.
Neurochem. Int. 40: 17-30.
Stratton J. E., Hutkins R.W., Taylor S. L. (1991). Biogenic amines in cheese and
other fermented foods. A review. J. Food Prot. 54: 460-470.
Stratton J. E., Taylor S.L. (1991). Scombroid poisoning. In: Microbiology of Marine
Food Products. Ward, D. and C. Hackney, Van Nostrand Reinhold, New York. New
York, USA, Van Nostrand Reinhold Co., p. 331-347.
Sunna A., Tokajian S., Burghardt J., Rainey F., Antranikian G., Hashwa F. (1997).
Identification of Bacillus kaustophilus, Bacillus thermocatenulatus and Bacillus
strain HSR as members of Bacillus thermoleovorans. Syst. Appl. Microbiol. 20: 232-
237.
Suzzi G., Gardini F. (2003). Biogenic amines in dry fermented sausages: A review.
Int. J. Food Microb. 88: 41-54.
Tailor S. A., Shulman H.I., Walker S.E., Moss J., Gardner D. (1994). Hypertensive
episode associated with phenelzine and tap beer a reanalysis of the role of pressor
amines in beer. J. Clinic. Psychopharmacol. 14: 5-14.
Tanabe S., Matsumoto H. (1988). Effect of preliminary treatment with ammonia on
the reduction of CuY zeolite. Appl.Catal. 45: 27-37.
Tarjan V., Janossy G.P.Y. (1978). The role of biogenic amines in food. Die Nahrung
22: 285-289.

72
Thuman E.M. (1985). Organic Geochemistry of Natural Waters, Kluver Academic
Publishers, Dordrecht.
Tombelli S., Mascini M. (1998). Electrochemical biosensors for biogenic amines: a
comparison between different approaches. Anal. Chim. Acta 358: 277-284.
Udenfriend S., Lovenberg W., Sjoderma A. (1959). Physiologically active amines in
common fruits and vegetables. Archives Biochem. Biophys. 85: 487–490.
Valero D., -Romero D., Serrano M. (2002). The role of polyamines in the
improvement of the shelf life of fruit. Trends Food Sci. Tech. 13: 228-234.
Vyas N.K., Vyas M.N., Quiocho, F.A. (1988). Sugar and signal transducer binding
sites of the Escherichia coli galactose chemoreceptor protein. Science 242: 1290-
1295.
Walther D. J., Peter J.U., Winter S., Holtje M., Paulmann N., Grohmann M.,
Vonwinckel J., Alamo-Bethencourt V., Wilhelm C.S., Ahnert-Hilger G., Bader M.
(2003). Serotonylation of small GTPases is a signal transduction pathway that
triggers platelet α-granule release. Cell 115: 851-862.
Wantke F., Hemmer F., Haglmuller T., Gotz M., Jarisch R. (1996). Histamine in
wine. Int. Arch. Allergy Immun. 110: 397.
Weimer W.B., Dovichi N.J. (1986). Simple Model for the Time Dependence of the
Periodically Excited Crossed-Beam Thermal Lens. J. Appl. Phy, 59: 225.
Wijngaards G., Zhu Y., Maagd J.M., Bol J. (1997) Transglutaminase as a potential
tool in developing new protein ingredients and foods. Med. Fac.Landbouw Univ.
Gent. 62: 1381-1383.
Wu M. L., Yang C.C., Yang G.Y., Ger J., Deng J.F. (1997). Scrombroid fish
poisoning: an overlooked marine food poisoning. Vet. Hum.Toxicol. 39: 236-241.
Yen G. C. (1992). Effects of heat treatment and storage temperature on the biogenic
amine contents of straw mushroom (Volvariella volvacea). J. Sci. Food Agr. 58: 59-
61.
Yokoyama K., Nio N., Kikuchi Y. (2004). Properties and applications of microbial
transglutaminases. Appl. Microbiol. Biot. 63: 447-454.
Zeng K., Tachikawa H., Zhu Z., Davidson V.L. (2000). Amperometric detection of
histamine with a methylamine dehydrogenase polypyrrole based sensor. Anal. Chem.
72: 2211-2215.

73
Zhou L.D., Chen J., Du G.C. (2000). Functional properties of microbial
transglutamianse and its application method in food processing. China. Food
additives 1: 54-59.
Zotou A., Loukou Z., Soufleros E., Stratis I. (2003). Chromatography with Pre-
column Dansylation and Ultraviolet Detection. Chromatographia 57: 429-439.