UNIVERSITY OF NAIROBI SCHOOL OF COMPUTING AND …
55
UNIVERSITY OF NAIROBI SCHOOL OF COMPUTING AND INFORMATICS USE OF GPS, GSM AND GPRS TECHNOLOGIES TO ALERT FOR SPEEDING VEHICLES REAL TIME ON KENYA HIGHWAYS BY MAITAI JACKSON RIMOINE P53/79364/2015 SUPERVISOR PROF ROBERT OBOKO JULY, 2018 _________________________________________________________________________ A Project Submitted to the School of Computing and Informatics in Partial Fulfillment of the Requirements of the Degree of Master of Science in Distributed Computing Technology of the University of Nairobi.
Transcript of UNIVERSITY OF NAIROBI SCHOOL OF COMPUTING AND …

UNIVERSITY OF NAIROBI
SCHOOL OF COMPUTING AND INFORMATICS
USE OF GPS, GSM AND GPRS TECHNOLOGIES TO ALERT FOR SPEEDING VEHICLES
REAL TIME ON KENYA HIGHWAYS
BY
MAITAI JACKSON RIMOINE
P53/79364/2015
SUPERVISOR
PROF ROBERT OBOKO
JULY, 2018
_________________________________________________________________________
A Project Submitted to the School of Computing and Informatics in Partial Fulfillment of the
Requirements of the Degree of Master of Science in Distributed Computing Technology of the
University of Nairobi.

ii
DECLARATION
This research report is my original work and has not been presented for any other award in any other
University.
Signature: ……………………………………… Date: …………………………………
Maitai Jackson Rimoine
P53/79371/2015
This project has been submitted as partial fulfillment of the requirements for the degree of Master of
Science in Distributed Computing Technology of the University of Nairobi with my approval as the
University supervisor.
Signature: ……………………………………… Date: …………………………………
Prof. Robert Oboko
School of Computing and Informatics.
University of Nairobi.

iii
DEDICATION
The research project is dedicated to my parents; I owe special gratitude to my late mum Nation Enolol
Maitai and my dad Simiren Olol Maitai who have always been there for me in every step of my life.
I’m forever greatly indebted to you for the sacrifices made and your invaluable counsel.
Above all, I’m greatly thankful to the Almighty God who has been my source of wisdom, strength and
inspiration throughout this project work. His grace and mercies have really been abundant in my life.

iv
ACKNOWLEDGEMENT
My sincere appreciations go to my thesis advisor and supervisor Prof. Robert Oboko who has been
very kind and insightful throughout this thesis despite his busy schedule. His counsel, guidance and
expert opinions were invaluable.
I would like also to thank my colleagues at the School of Computing and Informatics for extending
help to me in one way or another.
v
ABSTRACT
In Kenya highways, there is still a high rate of road accidents. Most of these accidents are caused by
over speeding and reckless driving. Most of the drivers are reckless and do not obey the speed set for
given road places. On how to cub this, currently National Transport and Safety Authority (NTSA)
measure over speeding using speed Guns. The speed Guns does not measure over speeding but rather
calculate the speed at which the vehicle is travelling and require human intervention to detect over
speeding. It’s has also used the speed governor which only detect a fix speed limit i.e. 80km/hr. along
the roads for public vehicles. This therefore mean a place with a speed limit of 50km/hr., a public
vehicle can easily over speed by 30km/hr hence the challenge is the dynamic nature of our highways
speed limit i.e. Same road have different speed limits on different segments.
This project is then all about how to dynamically detect speed violation and notification of relevant
authorities real-time. This is achieved using a Configuration module that sets up all the segments and
vehicles details, a GPS module that collect the GPS data and Processing module that calculate speed,
detect speed violation and makes appropriate notification to relevant individuals.
The prototype was developed using HTML5 and C# for the configuration module and data stored on
MYSQL database. The GPS and Processing module was developed using android language and
installed on a mobile device which was boarded to the vehicles and the data synchronized to the server
using the GPRS technology. The notification were made using the GSM technology in the mobile
device.
This helps in the advancement of science and technology by diversifying the usage of GSM, GPS and
GPRS technologies.

vi
TABLE OF CONTENTS
ABSTRACT .............................................................................................................................................. v
ACRONYMS ............................................................................................................................................ x
CHAPTER ONE ....................................................................................................................................... 1
INTRODUCTION .................................................................................................................................... 1
1.1 Background ..................................................................................................................................... 1
1.2 Problem Statement .......................................................................................................................... 2
1.3 Objectives ........................................................................................................................................ 3
1.4 Research Questions ......................................................................................................................... 3
1.5 Justification ..................................................................................................................................... 4
CHAPTER TWO ...................................................................................................................................... 5
LITERATURE REVIEW ......................................................................................................................... 5
2.1 Introduction ..................................................................................................................................... 5
2.2 Current solutions to over-speeding.................................................................................................. 5
2.2.1 Lidar Speed Gun ....................................................................................................................... 5
2.2.2 Image Processing ...................................................................................................................... 6
2.3 Relevant Technologies for Proposed Solution ................................................................................ 6
2.3.1 Automatic Vehicle Location Systems (AVL) ........................................................................... 6
2.3.2 Global Positioning Systems (GPS) ........................................................................................... 9
2.3.3 CarTel ..................................................................................................................................... 10
2.4 Point on Polygon ........................................................................................................................... 11
2.4.1 The Algorithm of Ray Casting ............................................................................................... 11
2.4.2 Algorithm of Winding number ............................................................................................... 12
2.4.3 Comparing .............................................................................................................................. 12
2.5 Exception Reporting ...................................................................................................................... 12
2.6 Literature summary ....................................................................................................................... 13

vii
2.7 System Overall Architecture ......................................................................................................... 13
CHAPTER THREE................................................................................................................................. 15
METHODOLOGY.................................................................................................................................. 15
3.1 Introduction ................................................................................................................................... 15
3.2 Data Collection .............................................................................................................................. 15
3.3 Agile Methodology........................................................................................................................ 15
3.3.1 Why Agile Methodology ............................................................................................................ 16
3.4 System Testing .............................................................................................................................. 17
3.4.1 Module Test ............................................................................................................................ 17
3.4.2 Regression Test ....................................................................................................................... 17
3.4.3 System Test ............................................................................................................................. 17
CHAPTER FOUR ................................................................................................................................... 19
ANALYSIS, DESIGN AND IMPLEMENTATION .............................................................................. 19
4.1 Requirement Specification and Systems Analysis ...................................................................... 19
4.1.1 Functional Requirements .................................................................................................. 19
4.1.2 Non-Functional Requirements .......................................................................................... 20
4.2 System Design .............................................................................................................................. 20
4.2.1 Architectural System Design ............................................................................................ 20
4.2.2 System Flowchart Design ................................................................................................. 21
4.2.3 Database Design ................................................................................................................ 25
CHAPTER FIVE..................................................................................................................................... 27
RESULTS AND DISCUSSION ............................................................................................................. 27
5.1 Configuration Module ................................................................................................................... 27
5.1.1 Device Details ......................................................................................................................... 27
5.1.2 Vehicle Details ........................................................................................................................ 27
5.1.3 Segment Details ...................................................................................................................... 28

viii
5.1.4 Segment Coordinates .............................................................................................................. 29
5.1.5 Entity Types ............................................................................................................................ 30
5.1.6 Entity Details .......................................................................................................................... 31
5.1.7 Map Details ............................................................................................................................. 32
5.2 GPS module ................................................................................................................................... 33
5.3 Processing module ......................................................................................................................... 35
5.3.1 Vehicle speed .......................................................................................................................... 35
5.3.2 Point in Polygon ..................................................................................................................... 35
5.3.3 Notification ............................................................................................................................. 36
5.4 Reporting ....................................................................................................................................... 38
5.4.1 Over-Speed per Segment ........................................................................................................ 38
CHAPTER SIX ....................................................................................................................................... 39
CONCLUSIONS AND RECOMMENDATION OF FURTHER WORK ............................................. 39
6.1 Achievements ................................................................................................................................ 39
6.1.1 Achievements of research Objectives ............................................................................... 39
6.2 Research contribution ............................................................................................................... 40
6.3 Conclusions .............................................................................................................................. 40
6.4 Recommendation of Further Work ........................................................................................... 41
REFERENCES........................................................................................................................................ 42
APPENDIX I: PROJECT SCHEDULE .................................................................................................. 44
APPENDIX II: PROJECT BUDGET ..................................................................................................... 45

ix
TABLE OF FIGURES
Fig 1 Schematic Display of an AVL System ......................................................................................... 6
Fig 2 Twenty Four Satellites of GPS (Source: Okunieff, 1997) .......................................................... 9
Fig 3 Ray Casting Algorithm ............................................................................................................... 12
Fig 4 System Overall Architecture ...................................................................................................... 14
Fig 5 Agile .............................................................................................................................................. 16
Fig 6 Architectural System Architecture ............................................................................................ 20
Fig 7 System Flowchart Design ............................................................................................................ 21
Fig 8 Draw Segment Polygon Flowchart ............................................................................................. 22
Fig 9 Point in Polygon Flowchart ........................................................................................................ 23
Fig 10 Over-speeding SMS notification Flowchart ............................................................................ 24
Fig 11 Database Design ......................................................................................................................... 26
Fig 12 Device Details Screen ................................................................................................................ 27
Fig 13 Vehicle Details Screen ............................................................................................................... 28
Fig 14 Segment Details Screen ............................................................................................................. 28
Fig 15 Segments Coordinates Screen .................................................................................................. 29
Fig 16 Entity Types Screen ................................................................................................................... 30
Fig 17 Entity Details Screen ................................................................................................................. 31
Fig 18 Map Details Screen .................................................................................................................... 32
Fig 19 GPS enable snippet .................................................................................................................... 33
Fig 20 GPS enable setting ..................................................................................................................... 34
Fig 21 Ray Casting code snippet .......................................................................................................... 36
Fig 22 Sample warning SMS ................................................................................................................ 36
Fig 23 Driver Sample SMS ................................................................................................................... 37
Fig 24 Vehicle Owner Sample SMS ..................................................................................................... 37
Fig 25 Officer Sample SMS .................................................................................................................. 37
Fig 26 Bar Chart Representation ........................................................................................................ 38
Fig 27 Pie Chart Representation.......................................................................................................... 38

x
ACRONYMS
GPS Global Positioning System
AVL Automatic Vehicle Locator
GSM Global System for Mobile
GPRS General Packet Radio Service
PIP Point on Polygon
1
CHAPTER ONE
INTRODUCTION
1.1 Background
In Kenya roads, there is still a high rate of road accidents. Most of these accidents are caused by over
speeding and reckless driving. Most of the drivers are reckless and do not obey the speed set for given
road places.
The statistics in the global status report by World Health Organization (WHO) in 2009 showed there
were 3,760 traffic deaths in Kenya, the highest in the East Africa region. WHO then predicted an
increase in road deaths from 1.2 to 1.8 million by 2015, and 2.4 million by 2030. Most accidents in
Kenya occur due to careless driving, drunk driving, over speeding, poorly serviced vehicles among
others. Over speeding, for instance, contributes to approximately 51.9% according to African Health
Sciences (AFR) organization. From these statistics, it is imperative to mitigate such mortality rates that
occur from such avoidable mistakes to maintain economic sustainability. Several methods have been
adopted in attempts to mitigate death rates due to over speeding. Unfortunately, most of these counter
methods are largely ineffective. In other cases, these methods relied on manual operation and hence
depended fully on the user’s ability to be alert when using them.
Currently NTSA uses two major ways to cub over speeding i.e.
Measure speed using speed Gun and then with the set speed limit of the segment an officer detect
whether the vehicle is over speeding.
Also on public vehicles a speed governor device is installed into a vehicle which then limits it from
going beyond 80km/hr throughout its journey. This therefore does not cover the variance of speed in
different segments of the road. The speed governor currently covers only the public service vehicles.
As such, it is important to have an automatic speed alert system that can inform a driver the required
speed limit and the vehicle driving speed. The automatic speed alert system also will alert the driver
when he or she exceeds the limit. The project will help to curtail over speeding mostly by public
service vehicles due to the automatic nature of speed detection and the levies that will be imposed
thereof.

2
The Global Positioning System (GPS) currently is the most common methods used when determining a
point’s location. This is evident from the wider availability of GPS receivers and antennas and the
affordability of their prices.
1.2 Problem Statement
Currently over speeding is measured using speed Guns by National Transport and Safety Authority
(NTSA).
The speed Guns does not measure over speeding but rather calculate the speed at which the vehicle is
travelling and require human intervention to detect over speeding.
The speed Gun uses LiDAR technology i.e. the speed gun has a sight on which an officer aims a device
on the target vehicle (Bachman, 1979). A thin ray of invisible infra-red light is produced in distinct
beats when a trigger is pulled. The beam progressively increases in size. At 300m it is 1m to 1.5m in
diameter. The minute the lights beam hits a fairly perpendicular, reflective surface it is reflected
towards the speed gun.
The then calculates the speed this way:
The first beat took .0015 seconds to get to the surface and back, which means the vehicle is 300m
away. The second beat took .0014 seconds to get to the surface and back and so now the target vehicle
is 290m away from the device. The third beat went to the surface and back at .0013 seconds hence the
target vehicle is at 270m from the device. All this took one third second to gather and that means the
target vehicle in one third second went 30m. Therefore the target vehicle is going at 80km per hour.
Limitations:
The ability of a police officer to identify and target a vehicle can be impeded by the presence of
darkness.
Sun Occlusion: prevents vehicle targeting.
Cosine error: a lower-than-actual speed is calculated by the gun when using off-center angles.
This is because less distance is calculated between pulses since the car is moving at an angle to
the gun.
Motion: the officer testing over-speed will be required to hold the gun still for accurate
measurement.
Heavy traffic – Only the target vehicle will be measured

3
When also using the speed governor to cub speed, the challenge is a static speed of 80km/hr is used
whereas the highways have varying speed depending on the terrain.
Using Global Positioning System (GPS), the devise can collect significant information about a moving
object. For example, when using basic time and location data, a GPS unit can compute the relative
speed of the object in relation to the average distance covered in a particular finite period. With a
programmable interface, one can know the speed limits of a given region by first determining which
segment a point is and getting its speed limit.
When combine with the GMS and GPRS technologies, the over speeding is reported on time to be dealt
with.
1.3 Objectives
The project research objectives are as indicated below:
1. To research on how to use the GPS, GSM and GPRS to alert for over speeding vehicles
2. To automate speed calculation and dynamic limit checking.
3. To alert for exceed speed limit
4. To calculate and notify fine imposition on over speeding vehicles.
1.4 Research Questions
Below are the research queries for the research project:
1. How to determine Vehicle speeds from Vehicle GPS device data?
2. How to draw the segments polygon?
3. How to determine point is in a polygon?
4. Which are the existing over-speeding alert methods?
5. What are the short comings to the existing solutions?

4
1.5 Justification
Speed Alert System provides both accurate real-time and historical data about the over speeding
prevailing on the Kenyan highways.
Taking into account that Kenya is a growing economy in terms of research, innovations and industry,
there is a need for home grown solutions to our problems in order to achieve vision 2030.
Most drivers are not aware of the set speed limits on various roads and hence they end up exceeding the
limit. Most over speed detection methods such as radar and speed cameras have been found not to be
totally effective in curtailing over speeding on our roads, as the Lidar speed gun only function during
the day and cameras are too expensive to implement in all the highways in the country.
This research will provide a continuous and reliable 24 hour over speed Alert system. It will also show
the driver his current speed when over speeding and the speed limit of the road. Hence, this information
cane help drivers to be more careful. As a result, this mitigates road accidents and improves life to
expectancy.

5
CHAPTER TWO
LITERATURE REVIEW
2.1 Introduction
Here we will evaluation the current ways in which over-speeding is being reported. We will discuss the
proposed over-speeding alert system on how it will detect and report on real time.
The chapter has been divided into; Current solutions, relevant technologies, literature summary and
overall system architecture.
2.2 Current solutions to over-speeding
2.2.1 Lidar Speed Gun
LIDAR (light detection and ranging) Speed Guns practice a more straight forward method that depend
on the light reflection time (Bachman, 1979). A LIDAR gun discharges a very little burst of infrared
laser light and then waits for it to mirror off the target vehicle. The Speed Gun then counts the
nanoseconds that it takes for the both ways, and distance to the car can then be calculated by dividing it
by 2. If the gun per second takes 500 samples, it can then compare the variation in space between trials
and calculate the speed of the target vehicle. The use of many mirroring’s and an averaging technique
in the speed measurement process increase the integrity of the speed reading. Vehicles are usually
furnished with a vertically oriented registration plate that, when lightened, causes a high reliability
reflection to be reverted to the LIDAR - regardless of the shape of the vehicle.
Advantages
This is only more precise on a small distant for a specific vehicle on aim.
Disadvantages
Being mostly a handheld device requires police presence.
Lidar does not automatically alert the driver if he is over speeding.
For one to operate a radar equipment effectively, certification and user training is a basic
requirement.
A visible mirage of the aimed vehicle is created when days are hot with low humidity. In many
cases, when the laser is aimed it receives beam from both the aimed vehicle and the mirage
producing an error called Sweep error.

6
2.2.2 Image Processing
Image processing is the commonly used method in monitoring of traffic (Mo, Sheng, & Li, 2009) . This
solution provides data in a video sequence. Video processing then follows, which helps in locating the
observed vehicles in each frame of the video. A number of image processing techniques are applied in
the process. This include segmentation, edge detection and filtering. This allocate the observed vehicle
contour inside the frame observation area. The traffic officer is required to discover the conditional
center of the target vehicle while still in the contour area so as to calculate the speed of a vehicle. It is
possible to compute the number of vehicles on motion in the observed region by labelling and counting
the contours.
Weakness
The solution relies solely on implementing an enormous number of expensive CCTVs (Closed Circuit
Television) cameras around the target area; not to statement the sophisticated equipment in need to
process the data and the long time taken.
2.3 Relevant Technologies for Proposed Solution
2.3.1 Automatic Vehicle Location Systems (AVL)
Automatic Vehicle Location Systems (AVL) are computer-based vehicle tracking systems. They are
also known as Automatic Vehicle Monitoring (AVM) Systems or Automatic Vehicle Location and
Control Systems (AVLC) (Casey & Labell, Advanced Public Transportation Systems, 1998). They are
used in ambulances, police cars, trucking fleets, transit, and for military purposes (Casey & Labell,
1998).
Fig 1 Schematic Display of an AVL System

7
2.3.1.2 Uses of AVL Systems
The first use of AVL technology in transit was in the city of London, England in the late 1950s. The
first use in the US was in Chicago in the late 1960s (Turnbull, 1993) A number of transit systems in
North America and abroad began to plan for and implement AVL systems during the 1980s (Turnbull,
1993).
According to the research of Casey in 2002, 322 transit agencies are operating, implementing, or
testing AVL systems (Casey, 2002). The number of transit agencies used AVL systems increased by
four hundred percent as compared to earlier studies in 1995 (Casey, 2002). An increasing number of
transit agencies are planning to install AVL systems because the cost of AVL systems has rapidly
dropped (Turnbull, 1993).
2.3.1.3 Technologies of AVL Systems
Two technologies are there in AVL systems: Location and Data Transmission technology.
Location technology is the module used to measure the actual vehicle position real-time, and data
transmission technology is the module used to transmit the information to a centralized location (Casey
& Labell, Advanced Public Transportation Systems, 1998).
2.3.1.3.1 Location Technology
Location technology includes signpost and odometer, dead-reckoning, differential GPS (DGPS), global
positioning systems (GPS), etc. For tracking vehicle, a single location technology is usually not
sufficient for determining position. For instance, multi-path errors occur due to tall buildings blocking
the signals.
Therefore, the primary location technology is supplemented with another location technology (Casey &
Labell, 1998). Dead-reckoning is the most self-determined type of location technology. The transit
vehicle determines its own location without the help of external technologies. First, the transit vehicle
is told its starting point. The vehicle measures the traveled distance from the starting point by reading
the odometer. Then the vehicle determines the traveled direction by compass headings. Dead-reckoning
location technology is seldom used by itself because the equipment has to be reset frequently from a
known location. Dead-reckoning is usually supplemented by one of other location technologies like
signpost or GPS (Casey & Labell, 1998). It is relatively inexpensive, but the accuracy degrades with
distance traveled (Okunieff, 1997).
Odometer and Signpost uses a number of radio beacons positioned along the bus routes. The beacons
transmit a low power signal and the signal is sensed by a receiver on the transit vehicle. Then the
vehicle notifies its position to dispatch in relation to the traveled distance, which is taken from the

8
odometer (Casey & Labell, 1998). The technology requires low in-vehicle cost and it is well
established and proven.
However, additional installation is required with route changes and it cannot track the vehicle when a
bus is off-route (Okunieff, 1997).
Global positioning systems (GPS) determine the position using the signals which are transmitted from
up to 24 satellites. GPS works everywhere the satellites scope, and it is much more robust than other
location technologies. However, satellite signals do not extent to underground. They can also be
disturbed by tall buildings. Where these problems happen, odometer and signpost can supplement the
GPS (Casey & Labell, 1998).
The United States Department of Defense (DOD) intentionally degraded the accuracy of GPS for safety
reason. To correct this interruption, an additional (differential) correction was added and this system is
called Differential GPS (DGPS) (Casey & Labell, 1998).
2.3.1.3.2 Data Transmission Technology
Position information, regardless of which location technology is adopted, is usually stored on the transit
vehicle for some period of time. The information is transmitted to the dispatch center in raw method or
is processed on the on-boarded device. There are two most common data transmission technology: i.e.
exception reporting and polling (Johnson & Thomas, 2000).
With polling technology, the server at the dispatch center asks each on-boarded device for its location
at even intervals. The accuracy of location is a function of how often the transit vehicle is polled. In
addition, the number of radio frequencies which are available in urban areas is limited. Due to this
reason, many transit agencies have chosen another technology, exception reporting (Casey & Labell,
1998).
Under the exception reporting method, each bus reports its location at a few specified locations or
when the bus is found to be off-schedule by some pre-defined tolerance. Exception reporting requires
each transit vehicle to know not only its position but also its scheduled position. Many agencies
combine the polling and exception reporting methods (Johnson & Thomas, 2000).

9
2.3.2 Global Positioning Systems (GPS)
This is a satellite-based system used for navigation which is funded and controlled by the United State
Department of Defense (DOD) (Okunieff, 1997). It was earlier intended for military use. It was later
set available for private citizen applications world-wide in the 1980s (Dana, n.d.). The GPS contains of
24 satellites (see Fig 2) and transmits the estimated velocity, position, and current time to GPS
receivers.
At least four satellites has to transmit signals to receiver to compute velocity, position and current time.
Fig 2 Twenty Four Satellites of GPS (Source: Okunieff, 1997)
2.3.2.1 GPS Accuracy
GPS consist of two services for positioning: i.e. Standard Positioning Service (SPS) and Precise
Positioning Service (PPS). Only authorized users uses PPS e.g. United State and Allied military. SPS
can be used by all the other users worldwide. A degradation was intentionally by DOD to SPS accuracy
for security reasons. PPS has a 22 meters accuracy while SPS has a 100 meters accuracy. SPS accuracy
was improved by adding an additional correction (differential) signal, and this became Differential GPS
(DGPS) (Center, 2014). DGPS has a 10 meters accuracy (Okunieff, 1997).
A dramatic improvement of the SPS accuracy was when the US military removed on May 1, 2000 the
intentional degradation to the signal (Center, 2014). Currently SPS and PPS has the same accurancy.
GPS currently has a 10 and 20 meters accuracy, while DGPS has a 3 and 5 meters accuracy (Johnson &
Thomas, 2000).
10
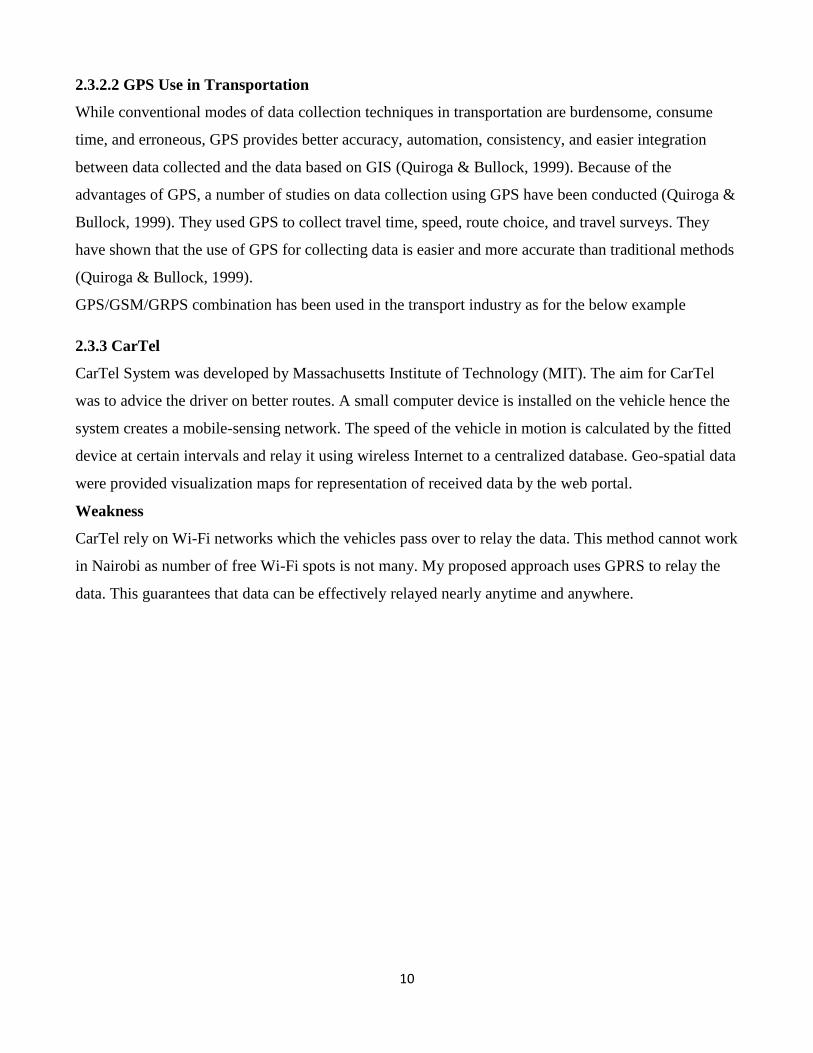
2.3.2.2 GPS Use in Transportation
While conventional modes of data collection techniques in transportation are burdensome, consume
time, and erroneous, GPS provides better accuracy, automation, consistency, and easier integration
between data collected and the data based on GIS (Quiroga & Bullock, 1999). Because of the
advantages of GPS, a number of studies on data collection using GPS have been conducted (Quiroga &
Bullock, 1999). They used GPS to collect travel time, speed, route choice, and travel surveys. They
have shown that the use of GPS for collecting data is easier and more accurate than traditional methods
(Quiroga & Bullock, 1999).
GPS/GSM/GRPS combination has been used in the transport industry as for the below example
2.3.3 CarTel
CarTel System was developed by Massachusetts Institute of Technology (MIT). The aim for CarTel
was to advice the driver on better routes. A small computer device is installed on the vehicle hence the
system creates a mobile-sensing network. The speed of the vehicle in motion is calculated by the fitted
device at certain intervals and relay it using wireless Internet to a centralized database. Geo-spatial data
were provided visualization maps for representation of received data by the web portal.
Weakness
CarTel rely on Wi-Fi networks which the vehicles pass over to relay the data. This method cannot work
in Nairobi as number of free Wi-Fi spots is not many. My proposed approach uses GPRS to relay the
data. This guarantees that data can be effectively relayed nearly anytime and anywhere.

11
2.4 Point on Polygon
The point-in-polygon (PIP) issue asks if a given point is outside, inside, or on the edge of a given
polygon. This is point location problems special case. It is applied in areas which deal with geometrical
data processing e.g. geographical information systems (GIS), computer graphics and CAD.
There are two approaches to this:
2.4.1 The Algorithm of Ray Casting
An odd number of crossings for a ray going through from the outside of the polygon to any point
denote that the point in question is within the polygon. In the event that the point is in the outside of the
polygon, the ray casting algorithm test also works in three dimensions.
To determine if the point lies outside or inside a polygon, one can only determine how many times a
Ray, which is going in any fixed direction and starts from the point, crosses the edges of the polygon.
For a point which lies on the outer side of the polygon, an even number of times will be crossed by the
ray on its edge. An odd number of times will be crossed on the edge if the point lies within the
polygon. Unfortunately, this mode won't work in case the point is on the edge of the polygon.
The algorithm is also called the crossing number or even-odd rule algorithm. It is based on a basic
observation that if a point moves alongside the ray from infinity to the review point and if it intersect
the edge of a polygon, probably several times, then it consecutively goes from the inside to outside,
then from the outside to the inside, etc. As a result, after every two "border intersects" the point on
motion goes outside. This statement may be arithmetically attested using the Jordan Curve Theorem.
If this is executed on a computer with limited precision arithmetic, the outcome may be incorrect in
case the point is very close to the edge, due to the errors of rounding. This is not usually an issue, as
velocity is much more vital than whole accuracy in most applications of computer graphics.

12
Fig 3 Cast Ray
The number of crosses for a ray going through from the outside of the polygon to any point; if odd, it
imply that the point is inside the polygon. In case it is even, the point is not inside the polygon; this also
works on three dimensions.
2.4.2 Algorithm of Winding number
This algorithm calculates the winding number of the given point with respect to the polygon. If the
number is non-zero, then the point is inside the polygon. A way to calculate the number is by summing
up the angles each side of the polygon subtend. However, this comprises costly reverse trigonometric
functions that generally brands this algorithm slower than the algorithm of ray casting.
2.4.3 Comparing
On simple polygons, the two algorithms will at all times give the same outcome for all trials. However,
on complex polygons, the two may output different outcomes for points in the sections where the
polygon crosses itself or where the polygon do not have an elaborate outlined outside and inside. In this
project, the algorithm of even-odd rule is perfect as the road network in Kenya is relatively straight
hence polygon drawn from the road segments are simple polygon with not intersections.
The algorithm is also easy to adopt and prove.
2.5 Exception Reporting
Programming procedure for the creation of exception reports may vary reliant upon the preference of
the user or the nature of the data. However it has to follow a similar development:
1. What do you want?
2. What do you have?
3. What are the differences?
4. What was found?

13
This therefore works well with this project as:
1. Speed and the segment at which the vehicle is at is want we want
2. Speed limit for the segment is what we have
3. The difference between the two is the different
4. The difference is what determine whether the vehicle is over-speeding.
2.6 Literature summary
Having gone through the following speed alert systems, two key things are observed:
1. Human intervention is needed for analysis.
2. It takes time to identify over speeding vehicles
This therefore calls for a more real-time system to alert when a vehicle over speed.
2.7 System Overall Architecture
Fig 4 shows the system overall architecture showing how the system components are interlinked. The
System components include the following:
1. Configuration module – It where the details of the segments, vehicles, devices and actors are
maintained on the backend server. They are then pulled by the onboard device
2. GPS Module – GPS receiver on the GPS device on the vehicle is used for data collection. This
where the actual coordinates of the vehicle location are collected.
3. Processing Module - onboard device uses the data collected from the GPS receiver to compute
the vehicle speed, get current vehicle segment and hence the segment speed limit. It then detect
whether the speed limit has be violated. The process data is the used appropriately. If the speed
limit has been violated, it sends appropriate text messages to appropriate actors and the over
speed data send to the central server. GPRS is used for communication GPS device and the
server that is continuously listening to configure port. GSM is used to send alerts to driver,
owner and officers.
4. Report Module – this module generate over speeding vehicles per segment, over speed hot
spot and over-speed per vehicle
The results obtained from the system will impact on Policy formulation and Road Safety.

14
Fig 4 System Overall Architecture

15
CHAPTER THREE
METHODOLOGY
3.1 Introduction
The chapter provides the methodology which will be used in system analysis, design and
implementation and testing.
3.2 Data Collection
Global Positioning System (GPS) devices will be used as the primary data collection tool. The area of
interest in this study is Waiyiaki Way which starts. A vehicle will be boarded with GPS device for data
collection. In this system, GPS receiver will interface with a GSM modem and placed in the vehicle.
Over-Speeding Data will be relayed real time to the server. GPRS will be used for the Real time
communication of the data. The data collected are stored on MySQL database on a central server. The
data collected from the GPS device will include the GPS device ID, longitude and latitude of the
location of where the data entry is made, the corresponding time stamp and speed.
The longitude and latitude of the location will help in deciding the office to receive the alert and the
speed limit for the road section as they are configured per segment.
3.3 Agile Methodology
The development phase will use agile methodology which is a software development methodology
typically used in rapid development and implementation. It is a repetitious, incremental mode of
managing projects; particularly in the software development field. These repetitions give project
managers many chances to evaluate and modify the project during its lifespan as well as keeping the
end user conversant and involved in the development.

16
Fig 5 Agile
3.3.1 Why Agile Methodology
According to (Williams, 2007), software development usually has too much changes during the time
that the team is developing the product to be considered a defined process. Williams further states that
a set of predefined steps may not lead to a desirable, predictable outcome because software
development is a decidedly human activity: requirements change, technology changes, people are
added and taken off the team, and so on (Williams, 2007).
3.3 Data Collection
Android GPS device was used as the primary data collection tool. The area of interest in this study was
Waiyiaki Way which starts from UON main campus to Gitaru. According to Quiroga and Bullock
(1999) Analysis, the route was broken down into segments to better quantify the speed measurement
and dynamic speed limit detection. A vehicle was boarded with the Android GPS device system for
data collection on different times. In this system was GPS receiver and GSM technology for
notifications.
Data was collected for continuously on trip to and fro. Real time communication of the data was carried
out using GPRS and alerts using GSM. The collected data were stored using Structured Query
Language (SQL) database on a central server for reporting and analysis. The collected data from the

17
Android GPS device included the mac address of the device and the speed of the vehicle if it has
violated the speed limit.
3.4 System Testing
To ensure veracity and completeness of the Real Time Over-Speed Alert System, numerous tests will
be conducted. The testing will be incremental and repetitive in nature. The main concern on the testing
will be both the non-functional and functional requirements which will be identified during the analysis
stage.
3.4.1 Module Test
Every module will be tested independently. This will be done to ensure that every unit/module works
properly on its own.
The module on GPS data collection should first tested whether the right data is being collected. Then
the transmission of collected data module is tested.
The processing of the collected data is also tested separately.
This independent testing is achieved by simulating different inputs and trying to have the module
achieve its core value.e.g. when I want to test notification. I will just need to supply the message and
the receiver to that module and expect the receiver to receive the message.
3.4.2 Regression Test
As development progresses, new modifications will be sometimes added into a module as enhancement
or change. The new changes plus the entire module had to be tested again to make sure that the
modifications did not impact the already verified code functioning.
3.4.3 System Test
When done with all the modules, verified and found to properly function, they are then integrated. The
whole system will be then verified to make sure there is cohesiveness, meet the scope and the system
works as per the specification.
3.5 Over-Speed Calculation
Over-Speed calculation was based on GPS received data above which has first point coordinates and
second point coordinates of the vehicles. The first and second points’ coordinates are taken at an
interval of 5 seconds. The distance is then calculated using the GPS get distance function
lStart.distanceTo(lEnd) / 1000.00

18
I then get the speed using the GPS get speed function
location.getSpeed() * 18 / 5
When I get the speed and check which segment the vehicle is the speed limit is then retrieved. A
comparison of the two is then done to identify the violation. If the speed is more than the speed limit
then the over-speed is detected and logged.
3.6 Over-Speed Hot Spot Detection
The following are steps that were used for identification of an Over-Speed hot spot:
Step 1:
To analyze the over speed behavior efficiently, the road was segmented and after the segmentation
normal limit speed was assigned to each road segment depending on the type of the road. According to
Joseph, et al., n.d. speed limit of 30km/h will be designated for residential areas and 60km/h and above
for major arterial roads.
Step 2:
Calculate the speed of the vehicle and determine the Over-Speed. Log all the over-Speed. Get the
number of over-speeds per segment.
Step 3:
Get the average over-speed per segment.
If Current number of over speed is more than the earlier hotspot the new hotspot is the Current
Segment.
Step 4:
Hot spot is identified by
Number of over-speed * average over-speed
If Current is more than the earlier hotspot the new hotspot is the Current Segment. Zero is the best
value and infinity is the worst side.

19
CHAPTER FOUR
ANALYSIS, DESIGN AND IMPLEMENTATION
4.1 Requirement Specification and Systems Analysis
4.1.1 Functional Requirements
This requirement defines functions of a given system or its components, describing an activity or
process that the system must perform. The following are Speed monitor modules:
i. GPS data Receiver module – it is used for coordinates collection; the module continuously listens for
client connections read data.
ii. Configuration Module – This is used to set up data used in the system
a. Set up segment details.( start coordinates and end coordinates, officers in the segment-numbers
and names, segment speed limit)
b. Set the vehicle details( Vehicle number, driver name and number, owner name and number)
iii. Process data – it is used for calculating distance covered and calculates speed using time taken.
a. Calculate vehicle speed
b. Get Vehicle current segment
c. Get speed limit for the segment.
d. Then check if the speed limit is exceeded.
e. Then load data of over-speeding vehicles to a table to be used for reporting.
iv. Use transformed data – this module computes the following parameters in real time
a. Over-speeding SMS notification to the officers, Driver and car Owner
v. Reports module – this module generate the following reports
a. Over-speeding vehicles per segment
b. Over-speed per vehicles.
c. Over-speed hot spot

20
4.1.2 Non-Functional Requirements
A non-functional requirement specifies systems’ properties and constraints.
i. An easy to use and navigate Graphical User Interface.
ii. Simple and easy to interpret alert message
iii. Instance alert of the over-speeding vehicle.
iv. Accurate selection of who to alert.
4.2 System Design
4.2.1 Architectural System Design
This depicts from a broader perspective of how the various components of the system are interlinked.
The system was designed in a 4-tier architecture consisting of the Data Layer, the Data Transformation
Layer, the Business Logic Layer and the User Interface Layer as shown below:
Vehicle with a GPS device
- Get GPS
coordinates
Over-speed
data
Configuration
data
Use processed data
Over-speeding SMS
notification to the officers,
Driver and car Owner
Process data
- Calculate speed
- Get seg and speed limit
- Exceed limit= Y log to over-speed
Report
Over-speed vehicles per seg
Over-speed vehicles per day
Most over-speeded seg
Configuration module
- Segment details
- Vehicle details
Fig 6 Architectural System Architecture
21
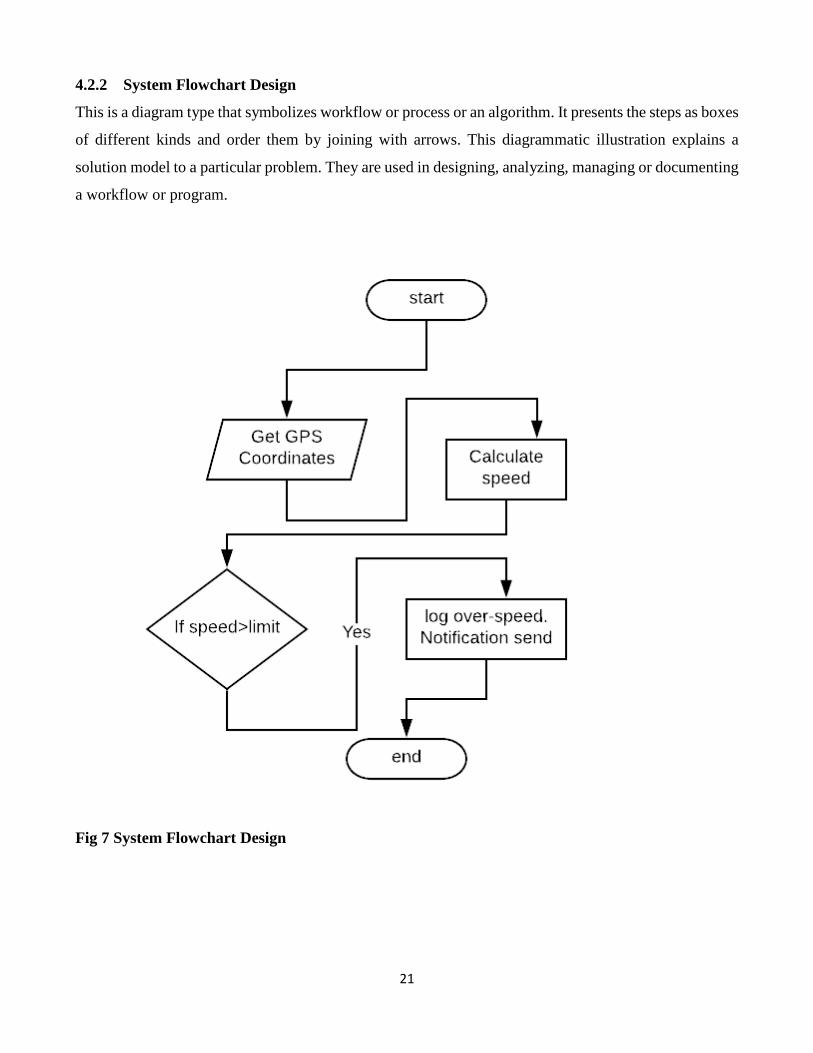
4.2.2 System Flowchart Design
This is a diagram type that symbolizes workflow or process or an algorithm. It presents the steps as boxes
of different kinds and order them by joining with arrows. This diagrammatic illustration explains a
solution model to a particular problem. They are used in designing, analyzing, managing or documenting
a workflow or program.
Fig 7 System Flowchart Design

22
4.2.2.1 Draw Segment Polygon Flowchart
This shows the process used to draw the segment using the segment coordinates so as to be used to
determine if a point is in that segment as shown below
Fig 8 Draw Segment Polygon Flowchart

23
4.2.2.2 Point in Polygon Flowchart
This shows the process used to determine the segment at which a vehicle is at a particular moment to
get the set speed limit for the segment as shown below
Fig 9 Point in Polygon Flowchart

24
4.2.2.3 Over-speeding SMS notification Flowchart
Over speeding SMS notification flowcharts shows the process used to determine when a vehicle is
moving at speed higher than the set speed limit and then SMS notification is send to the traffic police
and vehicle owner for necessary action as shown below.
Fig 10 Over-speeding SMS notification Flowchart

25
4.2.3 Database Design
This is the process of creating a thorough database data model. This logical data model contains all the
required physical and logical design selections and physical storage parameters required to make a
scheme in a data definition language hence can then be used to generate a database.
A completely attributed data model covers thorough attributes for each and every entity.
Data receive from GPS device fitted on vehicles is initially process and if over-speed detected on the
vehicle log on Over-speed table.
Segment details are stored in segment_details table. SegCoordinates table is then used to store all the
coordinates that are used to draw the segment. The coordinates are kept in the order of how to draw the
polygon.
Vehicle is stored in vehicle_details table.
All system notification messages are stored in notification table.
Driver, owner and officers’ information are stored on entity_detail table which uses the entity_type
table to differentiate the relationship.
Fine table is used to store the fine per over-speed of each vehicle.

26
Fig 11 Database Design

27
CHAPTER FIVE
RESULTS AND DISCUSSION
5.1 Configuration Module
The development of the module was successful. This was developed using the C# programming
language alongside HTML5 and JavaScript for interactivity.
I chose these programming languages as they allow a thin client hence the system can be easily access
anywhere. The only requirement for one to access the system is access to internet and a browser. This
can be on either phone or computer.
This was well achieved as I was able to onboard road segments, segment coordinates, vehicle details,
officers’ details, drivers’ details and vehicle owners’ details.
This is done prior to the use of the system.
5.1.1 Device Details
These are sent by the device the first time it connects with the server. The device is uniquely identified
by the device id.
I therefore hosted the application server on my machine and connected the machine to internet. With
then the public IP of the computer, and the device connected to internet I was able to synchronize the
communication between the two.
Fig 12 Device Details Screen
5.1.2 Vehicle Details
This keeps the details of the vehicle which details of the assign device. The device details are sent by
the device on the first sync with the server.

28
Fig 13 Vehicle Details Screen
5.1.3 Segment Details
This is where the segments for a given route are added. The required details are the segment name and
the segment speed limit.
Fig 14 Segment Details Screen

29
5.1.4 Segment Coordinates
This is where a segment point are taken and recorded to be used to mark it. The coordinates has to be
taken one by one and has to be precise to where the segment path will be passing. The points have to be
taken sequencially i.e on the way at which the segment polygon can be drawn.
The points are then used to draw segment polygon which will be vital on determining the vehicle
position hence speed limit.
This is mapping brings about the dynamic speed limit feature of this solution. The segment can be as
large as the all road journey or as small as only 100 metres of a given road
Fig 15 Segments Coordinates Screen

30
5.1.5 Entity Types
These are the different role taken by the actors of this project. The project actors include: driver,
vehicle owner and traffic officer.
The menu below offer for a screen to add or remove any of the actors role.
Fig 16 Entity Types Screen

31
5.1.6 Entity Details
This is where the actual actors are added. The details include; the full name, the phone number and the
role.
Depending on the role the actor is then assigned either the vehicle or the segment i.e a driver is assign a
vehicle as an officer is assigned a segment.
Fig 17 Entity Details Screen

32
5.1.7 Map Details
This screen is used to show the all segments configured as they appear on the Google map. Any newly
added segment will appear after a refresh of the page.
The maps allow both zoom in and zoom out to accommodate the need to check how a given segment
has been configured.
This is purely used for confirmatory purposes.
Fig 18 Map Details Screen
33
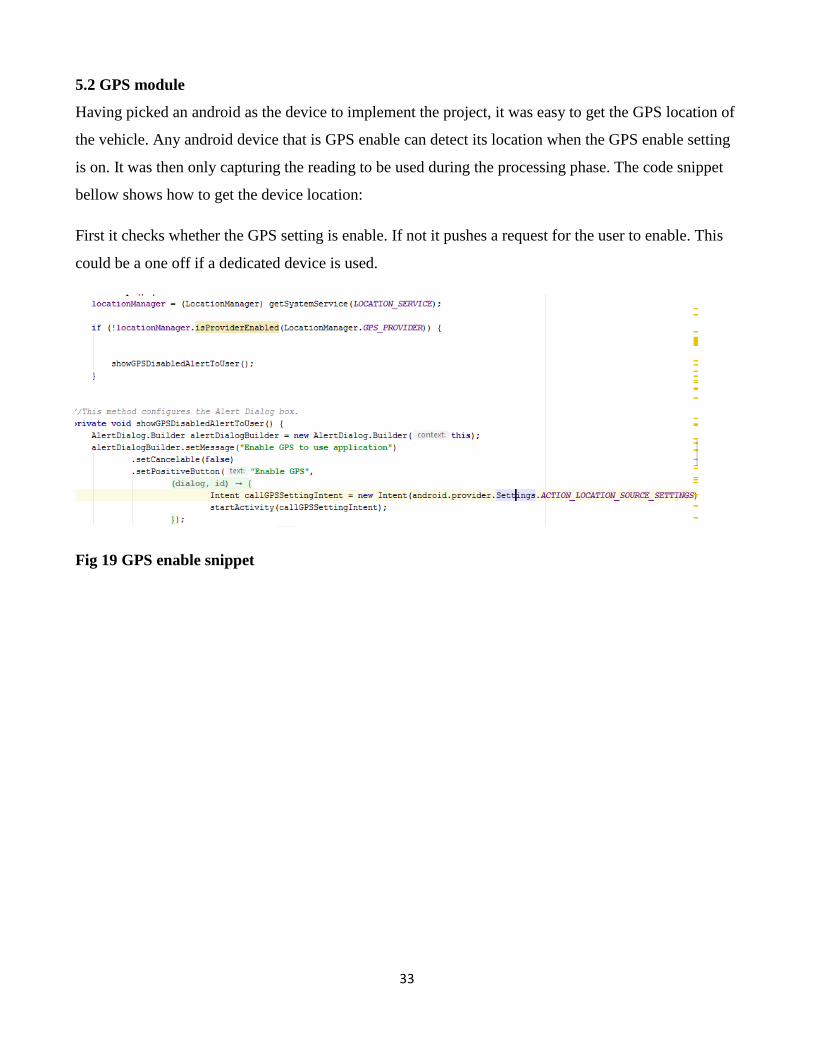
5.2 GPS module
Having picked an android as the device to implement the project, it was easy to get the GPS location of
the vehicle. Any android device that is GPS enable can detect its location when the GPS enable setting
is on. It was then only capturing the reading to be used during the processing phase. The code snippet
bellow shows how to get the device location:
First it checks whether the GPS setting is enable. If not it pushes a request for the user to enable. This
could be a one off if a dedicated device is used.
Fig 19 GPS enable snippet

34
Fig 20 GPS enable setting
After enabling GPS, you can then go ahead and click on the START CALCULATING button.
This will there start the application.
First it will get the device location as per this module.
public void onLocationChanged(Location location);
The above snippet will always return the location of the device.

35
5.3 Processing module
5.3.1 Vehicle speed
After getting the location of a device, I then check the speed of the vehicle using below method
Speed = location.getSpeed() * 18 / 5
The above returns the speed of the vehicle in KM/H.
5.3.2 Point in Polygon
After getting the speed of the vehicle we will need to get speed limit of the segment on which the
vehicle is at the moment.
First get the segment on which the vehicle is.
The algorithm used is called ray casting algorithm. The number of intersections for a ray passing from
the exterior of the polygon to any point; if odd, it shows that the point lies inside the polygon. If it is
even, the point lies outside the polygon.
The code snippet below, show the programmatic representation of the algorithm. The method receives
the coordinates of the location and the coordinates of the polygon and return odd if the point is inside
the polygon.
This then gives me the segment on which the vehicle is.

36
Figure 21 Ray Casting code snippet
After getting the segment I then get the speed limit as each segment is configured with a speed limit.
With a speed limit and vehicle travelling speed I was then able to check whether there was speed
violation by simple comparing the figures
if (speed_ > speedlimit_)
A grace range called warning level was set to only notify the driver to reduce or maintain speed else
he/she will be escalated to the segment officers.
5.3.3 Notification
A warning notification is both an SMS and a sound bite.
Fig 22 Sample warning SMS

37
If the driver goes ahead and ignore the warning notification and accelerate beyond the speed limit grace
range then a fine notification SMS and a danger warning sound bite are again send to the driver.
An SMS notification is also send to the segment officer as well as the vehicle owner.
Fig 23 Driver Sample SMS
Fig 24 Vehicle Owner Sample SMS
Fig 25 Officer Sample SMS

38
5.4 Reporting
5.4.1 Over-Speed per Segment
The test of the prototype was done in four different segments and below is a representation of
the total over-speed per segment.
Fig 26 Bar Chart Representation
Fig 27 Pie Chart Representation
0
2
4
6
8
10
12
14
16
18
Waiyiaki_A Waiyiaki_B Chiromo Kenya_Pipeline
Over Speed per Segment
Over Speed per Segment
Waiyiaki_A Waiyiaki_B Chiromo Kenya_Pipeline

39
CHAPTER SIX
CONCLUSIONS AND RECOMMENDATION OF FURTHER WORK
6.1 Achievements
6.1.1 Achievements of research Objectives
The research had four objectives as detailed in section 1.3 which were achieved as follows:
1. Research on how to use the GPS, GSM and GPRS to alert for over speeding vehicles
This objective was well achieved on chapter two of the project document. This is where I
outlined how these technologies are currently used on related fields to achieve similar or almost
similar goal in transport industry.
2. The other three objectives i.e. Automating speed calculation and dynamic limit
checking, Alerting for exceed speed limit and calculating and notifying fine imposition on
over speeding vehicles; were all achieved on a web based application developed using C#,
HTML5 and MYSQL platforms. This was integrated with an android application installed on a
GPS enable android device. The whole Real Time Speed Alert System has;
Configuration module – This was well achieved with development of a web
application hosted on Internet Information Services (IIS) server. This an application
server used in windows. The web application was on HTML5 and C# for backed. The
database was on MYSQL.
GPS module – this was to get the coordinates. This was a module achieved on the
android application. The application was developed using android language.
Processing module – this module was also achieve on the mobile application. This
entailed the calculation of speed using the data from the GPS module, checking against
the configurations on the configuration module, detecting violation and making
notifications accordingly using the GSM technology of the device used. This was well
demonstrated on testing of the prototype.
Reporting module – The queries on the over-speed data were then stored on the
MYSQL database in which reports were generated from.

40
6.2 Research contribution
The main research contribution was the development of an algorithm for checking segment speed
violation using the configuration data. The algorithm was designed in such a way that it takes care of
short changes in speed limits on a given route. How to deal with segmentation on a road was very
important on this project as the main objective of the project is ability to calculate speed and be able to
detect violation real-time.
6.3 Conclusions
The application of GPS, GSM and GPRS in over-speeding detection and alerting is proving to be the
most effective solution compared to other existing over-speeding methods like safety speed gun, cameras,
human inspection and speed governors. Having a digital segmentation of a roads to allow dynamic speed
violation detection puts the system at more upper side than any other existing system.
The research resulted in the development of A Real Time Alert system for automation of over-speeding
detection and alerting. The System was built based on several integrated modules which were developed
in the course of the study i.e. Configuration module, GPS module, Processing module and Reporting
module, all of which are essential towards the calculation of speed, detection of speed violation and
notification of any violation to all relevant units on any given road segment. The notification was in form
of SMS to officers, vehicle owners and Drivers. The Driver also received notifications in form of sound
bites to warn on the speed he/she is travelling.
All this violations and notification are stored on the database which can be used for later analysis on
speed violation patterns.

41
6.4 Recommendation of Further Work
Enhancing the system towards on boarded device which is fitted on the vehicle and has all the module
integrated to enable all vehicles to be monitored. Also configure more segments on our highways to
make the whole road network covered.

42
REFERENCES
Bachman, C. (1979). Laser Radar Systems and Techniques. Norwood (MA): Artech House.
Casey, R. F., & Labell, N. (1998). Advanced Public Transportation Systems. The State of the Art
Update 98. Publication FTA-MA-26-7007-98-1, 40-45.
Casey, R. F., & Labell, N. (2000). Advanced Public Transportation Systems. The State of the Art
Update 2000. Publication FTA-MA-26- 7007-00-1, pp. 50-62.
Johnson, C. M., & Thomas, L. E. (2000). Automatic Vehicle Location Successful Transit Applications:
A. Federal Transit Administration, U.S. Department of Transportation.
Michael Galetzka, P. G. (2017). A Simple and Correct Even-Odd Algorithm for the Point-in-Polygon
Problem for Complex Polygons. Proceedings of the 12th International Joint Conference on Computer
Vision, Imaging and Computer Graphics Theory and Applications (VISIGRAPP 2017), Volume 1.
Mo, J. P., Sheng, Q. Z., & Li, X. (2009). RFID Infrastructure Design. IEEE Internet Computing, 48-49.
National Research Council. (1999). Dynamic Segmentation Techniques. Journal of Transportation
Research Board, TRB, 48-57.
National Research Council. (2012). Dynamic Segmentation Techniques. Journal of Transportation
Research Board,TRB, 48-57.
Okunieff, P. E. (1997). AVL Systems for Bus Transit. Washington DC: Transportation Research Board
National Research Council.
Quiroga, C., & Bullock, D. (1999). Travel time information using GPS and dynamic.
Turnbull, K. F. (1993). Evaluation of Automatic Vehicle Location Systems in Public Transit. Research
Report 3006-1F.
Joseph, O., Francis, A. & B.E.K., P., n.d. Urban Traffic Speed Management: The Use of GPS/GIS.
Karl Petty, Hisham Noeimi, Kumud Sanwal, Rydzewski, Alexander Skabardonis and Pravin Varaiya.
The Freeway Service Patrol Evaluation Project: Database, Support Programs, and Accessibility.
Mo, J., Sheng, Q. & Zeadally, S., 2009. RFID Infrastructure Design: A Case Study of Two Australian
RFID Projects. IEEE Internet Computing.

43
Nermin Mudzelet, 2007, “Road network travel-time calculation using GPS data”, Aalborg . 9220,
Denmark
Okunieff, P. E., 1997. AVL Systems for Bus Transit. Transportation Research Board National
Research Council, Washington D.C.
Park, D. & Rilett, L. R., 1999. Forecasting Freeway Link Travel Times with a Multilayer Feedforward
Neural Network. Volume XIV.
Quiroga, C. A. & Bullock, D., 199. Travel Time Information Using Global Positioning System and
Dynamic Segmentation Techniques. Journal of Transportation Research Board, TRB, National
Research Council, Washington, DC, pp. 48-57.
Quiroga, C.A. and D. Bullock, 1999. “Travel time information using GPS and dynamic
Salon, Deborah and Eric Aligula (2012) Urban Travel in Nairobi, Kenya: Analysis, Insights, and
Opportunities. Journal of Transport Geography 22 (May 2012), 65 - 76
Samadi, S., Rad, A., Kazemi, F. & Jafarian, H., 2012. Performance Evaluation of Intelligent Adaptive
Traffic Control Systems: A Case Study. Journal of Transportation Technologies

44
APPENDIX I: PROJECT SCHEDULE

45
APPENDIX II: PROJECT BUDGET
Expense Amount
Stationery & Printing 10,000.00
Transport Charges 15,000.00
Internet Charges 18,000.00
Report Binding 6,000.00
Miscellaneous 10,000.00
Total 59,000.00