University of Michigan Dow Sustainability Fellows Program ... · Valuing Distributed Solar...
43
Valuing Distributed Solar Generation in Michigan White Paper University of Michigan Dow Sustainability Fellows Program December 12, 2014 Ali Al-Heji Rachel Chalat Josh Cornfeld Sarah Mostafa
Transcript of University of Michigan Dow Sustainability Fellows Program ... · Valuing Distributed Solar...

Valuing Distributed Solar Generation in Michigan
White Paper
University of Michigan
Dow Sustainability Fellows Program December 12, 2014
Ali Al-Heji
Rachel Chalat
Josh Cornfeld
Sarah Mostafa

2
About Us Made possible by The Dow Chemical Company, the Dow Sustainability Fellows Program at the University of Michigan supports full-time graduate students and postdoctoral scholars who are committed to finding interdisciplinary, actionable, and meaningful sustainability solutions on local-to-global scales. The program aspires to prepare future sustainability leaders to make a positive difference in organizations worldwide.
The Dow Sustainability Fellows Program includes a select group of full-time graduate students pursuing terminal masters and other professional degrees at the University of Michigan in Ann Arbor. Each year, 40 fellows are selected from a pool of candidates nominated by Schools and Colleges throughout the University. Each cohort begins in January and concludes in December of the same year.
Each fellow participates in collaborative engagement activities and a substantial interdisciplinary team project. For the project requirement, fellows form interdisciplinary teams of 4-6 fellows each to draft a persuasive white paper, ideally for a client, that develops a comprehensive stance or an analysis of options on a particular sustainability challenge of the team’s choosing.
Ali Al-Heji is an Electrical Engineering master’s student at the University of Michigan focusing on power and energy systems. He is interested in creating embedded control systems combined with energy storage that would eliminate the variability in renewable generation. Ali holds two Bachelor engineering degrees in Electrical Engineering and Materials Engineering & Science from the University of Michigan.
Rachel Chalat is a third-year dual masters candidate with the School for Natural Resources and Environment and the Applied Economics program. Her current research is focused on energy markets and the role renewable energy can play. Rachel has worked with local community nonprofits to promote sustainable transportation and storm water management. Rachel holds a Bachelor of Arts in Economics and Environmental Studies from Skidmore College, Saratoga Springs, NY.
Josh Cornfeld is a second-year MBA candidate at the University of Michigan's Stephen M. Ross School of Business. Prior to moving to Michigan, Josh spent a year as an Analyst at Jet Capital Management in New York City and 3 years in Washington, D.C. as a Hamilton Fellow at the Treasury Department and as an Intern at the White House Council on Environmental Quality and the Brookings Institution. Josh holds a Master of Environmental Studies and a Bachelor of Arts in Economics from the University of Pennsylvania.
Sarah Mostafa is a second-year masters candidate at the University of Michigan’s Ford School of Public Policy. Her research focuses on economic development through renewable energy, with a focus on both off and on-grid solar energy. Prior to pursuing her masters, Sarah spent a year working with community development nonprofits. She holds a Bachelor of Science from the University of Maryland’s Environmental Science and Policy program.

3
Table of Contents About Us .......................................................................................................................................... 2
Introduction ..................................................................................................................................... 4
Project Overview ............................................................................................................................. 5
Value of Solar Externality Analysis ................................................................................................ 6 Overview ...................................................................................................................................... 6 Analysis Results ........................................................................................................................... 7
Fuel Price Hedge ...................................................................................................................... 8 Environmental Benefits .......................................................................................................... 11 Reactive Supply & Voltage Control ...................................................................................... 13
Recommendations ...................................................................................................................... 16
Michigan Public Service Commission Solar Working Group Staff Report Review ..................... 17 Report Summary ........................................................................................................................ 17 Stakeholder Feedback ................................................................................................................ 18
Process Overview ................................................................................................................... 18 Key Findings .......................................................................................................................... 20
Conclusion ..................................................................................................................................... 30
Acknowledgements ....................................................................................................................... 31
Appendix ....................................................................................................................................... 32 Fuel Price Hedge ........................................................................................................................ 32 Environmental Benefits ............................................................................................................. 35 Reactive Supply & Voltage Control .......................................................................................... 38 Stakeholder Interview Questions ............................................................................................... 41
Works Cited ................................................................................................................................... 42

4
Introduction Distributed solar generation (DSG), also commonly referred to as rooftop solar, is growing rapidly in the United States. According to the Solar Energy Industries Association, 4,751 megawatts (MW) of solar photovoltaic (PV) capacity was installed in the U.S. in 2013, making it the second-largest source of new electricity capacity.1 While the majority of this capacity is utility-scale solar PV, recently non-utility solar PV, which includes both residential and commercial DSG, has become an important contributor accounting for 40% of the solar capacity installed in 2013.1
One of the reasons for the growth of DSG in recent years is that many states have implemented policies that promote growth. One of the most important of these policies is net energy metering (NEM), which allows DSG owners to sell excess electricity generated back to the electric utility at the retail price of electricity. However, NEM is now under attack in several states. Critics of NEM, which include many electric utilities, believe that DSG owners are not paying enough for the upkeep of the electric grid even though they depend on this infrastructure for a reliable power supply.2
Eliminating NEM would significantly reduce the attractiveness of DSG economics.3 As a result, proponents of DSG have pushed back by arguing that utilities are not incorporating all of the benefits of DSG in the reduced tariffs for which utilities are advocating, rather only considering the cost. These benefits, known as solar externalities, include reduced grid congestion, reduced need for peak generating capacity, no volatility in the future cost of power, reduced local air pollution and greenhouse gas emissions and economic development benefits due to the establishment of a new labor-intensive industry. DSG advocates believe solar externalities should be included in the tariff that electric utilities pay for electricity generated by DSG and thus have developed the value of solar (VOS) analysis to quantify them.
Michigan Public Act 295 of 2008 (PA 295), The Clean, Renewable and Efficient Energy Act, requires Michigan electric utilities to develop biennial Renewable Energy Plans (REPs) that are subject to regulatory review by the Michigan Public Service Commission (MPSC). The December 19, 2013 MPSC order approving DTE Energy’s REP directed the MPSC Staff to convene a working group to discuss and determine possibilities for improving the Company’s DSG pilot program, called SolarCurrents, and to determine a means for incorporating community solar. Consumers Energy also agreed to join the working group to discuss its DSG pilot program, called the Experimental Advanced Renewable Program (EARP). In response, the MPSC Staff assembled an ad-hoc working group consisting of Consumers Energy, DTE Energy, and “Friends of Solar” to discuss Michigan solar policy. One of the contentious issues this working group hoped to resolve is what tariff the electric utilities should pay DSG owners for electricity generated. On June 30, 2014, the MPSC Staff published a report presenting the Solar Working Group’s recommendations to the MPSC Commissioners.

5
Project Overview On behalf of the Michigan Public Service Commission, the Dow Fellows Team developed a project to help promote the fair use of DSG in Michigan while fulfilling the requirements of the Dow Sustainability Fellows Program. The project includes the following components:
1. A value of solar externality analysis for Michigan. 2. A review of stakeholder feedback on the MPSC Solar Working Group Staff Report.
This White Paper presents the findings of the Dow Fellows Team’s value of solar externality analysis for Michigan and the review of stakeholder feedback on the MPSC Solar Working Group Staff Report. The intended audience for the first section of this report is individuals looking to understand the value of solar externalities in Michigan and the technical methodology behind the analysis. The intended audience for the second section of the report is policymakers and others looking to understand where different stakeholders stand on the net energy metering vs. value of solar tariff debate.
6
Value of Solar Externality Analysis
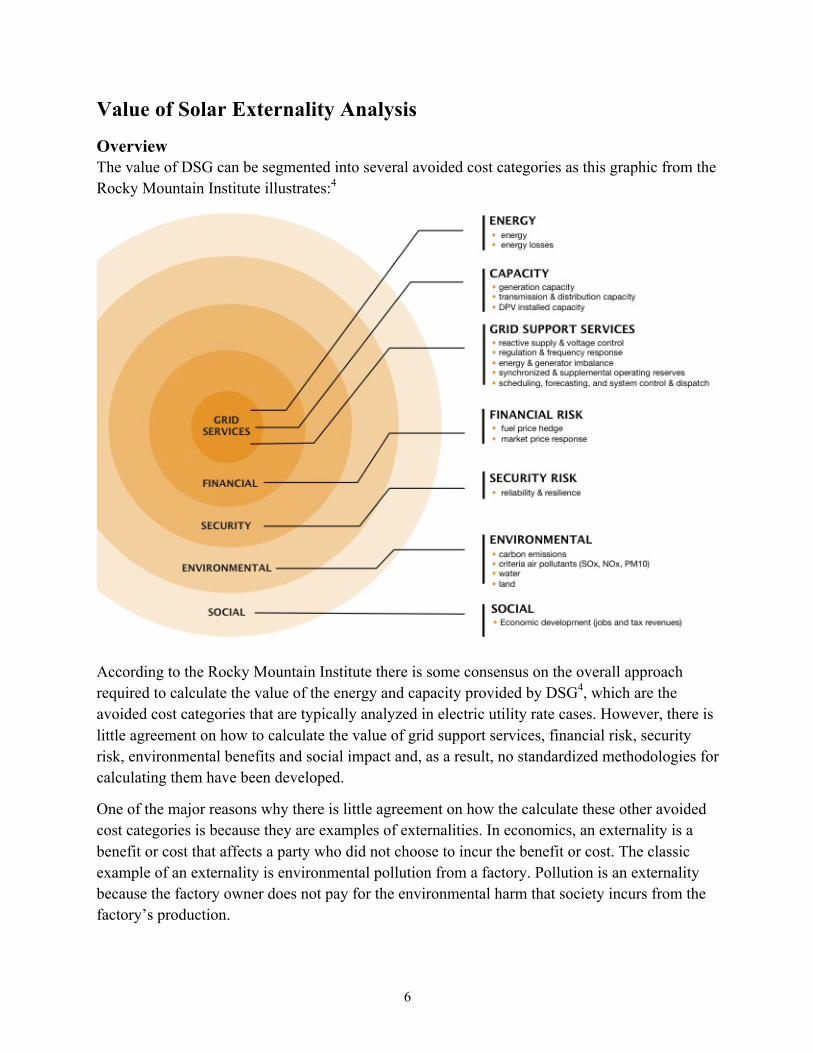
Overview The value of DSG can be segmented into several avoided cost categories as this graphic from the Rocky Mountain Institute illustrates:4
According to the Rocky Mountain Institute there is some consensus on the overall approach required to calculate the value of the energy and capacity provided by DSG4, which are the avoided cost categories that are typically analyzed in electric utility rate cases. However, there is little agreement on how to calculate the value of grid support services, financial risk, security risk, environmental benefits and social impact and, as a result, no standardized methodologies for calculating them have been developed.
One of the major reasons why there is little agreement on how the calculate these other avoided cost categories is because they are examples of externalities. In economics, an externality is a benefit or cost that affects a party who did not choose to incur the benefit or cost. The classic example of an externality is environmental pollution from a factory. Pollution is an externality because the factory owner does not pay for the environmental harm that society incurs from the factory’s production.

7
Reactive Supply & Voltage
Control Value $0.002/kVARh
Fuel Price Hedge Value $0.019/kWh
Environmental Benefit Value $0.023/kWh
Michigan Solar Externality Analysis Results
In the context of DSG, solar externalities exist because other parties besides the homeowner who installs solar panels are impacted. Other parties that are affected include electric utilities, ratepayers and society. Electric utilities are affected because under NEM electric utilities must pay homeowners the full retail price of electricity for the excess power generated by DSG. The retail price of power is likely higher than the wholesale price of electricity that electric utilities pay for other forms of electricity generation. Other ratepayers are affected because under current electric tariff design, homeowners with DSG pay much less for the fixed costs of grid-upkeep than a ratepayer who relies on the electric grid for all required power. Therefore, as DSG penetration increases, ratepayers without DSG take on an ever-increasing share of the burden for maintaining the electric grid; electric utilities label this problem as cross-subsidization. Finally, society is also impacted in several ways. For instance, DSG is a type of renewable energy generation that does not produce any carbon dioxide emissions, criteria air pollution or water pollution in the use phase; as a result, society likely reaps these environmental benefits.
This value of solar externality analysis calculated the value of a selection of solar externalities in order to determine if solar externalities are material to the value of DSG in Michigan. The solar externalities analyzed were the:
1. Fuel Price Hedge 2. Environmental Benefit 3. Reactive Supply and Voltage Control
Note, this value of solar externality analysis is not a full value of solar analysis for Michigan. A full VOS analysis would include the quantification of several additional avoided cost categories not analyzed in the scope of this project.
Analysis Results The Dow Fellows Team concluded that the value of solar externalities analyzed in Michigan is $0.042 per kWh and $0.002 per kVARh. The remainder of this section will discuss what the solar externalities analyzed are, why they are important, how they were calculated and how the Dow Fellows Team’s value compared to other values calculated for other states in other VOS analyses.

8
Fuel Price Hedge One of the benefits of DSG is that once the solar panels are installed the cost of the electricity generated by these solar panels is known for the lifetime of the equipment, which is expected to be around 30 years. On the other hand, electricity generation powered by fossil fuels has uncertain future prices because the fossil fuels used to produce electricity, such as coal and natural gas, have uncertain future prices. Therefore, DSG provides a hedge against uncertain fossil fuel prices because DSG reduces the amount of electricity required from fossil fuel generation.
This hedge is valuable because history shows fossil fuel prices are extremely volatile. For instance, in the past 15 years, the average annual spot price of natural gas at Henry Hub has ranged from as little as $2 per million British thermal units (MMBtu) to almost $14 per MMBtu.5 Since fuel prices are a major component of electricity costs, volatile fossil fuel prices can have a large impact on the retail prices consumers pay for electricity in Michigan.
The fuel price hedge is the cost that an electric utility would incur to guarantee that fuel supply-costs are fixed. In Michigan this is a cost that is imposed on ratepayers since neither Consumers Energy nor DTE Energy hedge a substantial portion of their future fossil fuel requirements.6 Therefore, Michigan ratepayers are currently exposed to the financial risk that fossil fuel prices increase and, as a result, DSG provides a valuable fuel price hedge.
The fuel price hedge is calculated by comparing the difference between an investment with fuel price uncertainty to an investment with fuel price certainty. This can be more easily understood by considering the following hypothetical scenario that considers two investment opportunities. First, an electric utility could set aside the entire future fuel cost obligation upfront by entering into two contracts. The first is a futures contract for the future fuel needs. The second is a risk-free security, such as Treasury note, that the electric utility knows will mature when the electric utility needs to make the payment on the futures contract for future fuel needs. Comparing this scenario to a second scenario where the electric utility just purchases the fuel when needed each year isolates the fuel price hedge value.
Formally, the annual fuel price hedge is calculated using the following equation7: Annual Fuel Price Hedge = (E * H * P) / (1 + R) where:
• E = Distributed Solar Electricity Generated • H = Heat Rate of the Offset Generation • P = Burnertip Price of the Offset Generation fuel • R = Risk-Free Interest Rate
DSG generated was calculating for 2014 by applying a PV capacity factor of 13.82% to the total residential DSG installed under DTE Energy’s SolarCurrents and Consumers Energy’s EARP programs, which was 5.85 MW through 2013.8,9 The PV capacity factor was the actual PV

9
capacity factor of DTE’s SolarCurrents program in 2013.8 A solar degradation rate of 0.5% annually was then applied for future years to account for declining module effectiveness. This degradation rate is the rate covered by a standard PV module’s warranty.10
In Michigan, DSG displaces coal- and natural gas-fired generation. Therefore, separate calculations for the annual fuel price hedge were calculated for both the offset coal and natural gas generation. This value of solar externality analysis assumed that in 2013 coal was the marginal unit 65% of the time DSG was produced. This ratio was determined by comparing estimated dispatch costs of Michigan electricity plants to the 2013 hourly net load for Michigan. The estimated costs are part of a working project through University of Michigan with Professor Jeremiah Johnson. The comparison of load and dispatch costs provided hourly location marginal prices (LMPs), from which the marginal fuel source during solar generation was identified. The table below identifies the hours solar generation was assumed to occur accounting for seasonal variation:
Season Hours of the Day Months Winter 10am-4pm Nov, Dec, Jan, Feb Summer 6am-8pm May, June, July, Aug Fall/Spring 8am-6pm Sept, Oct, April, March
As this value of solar externality analysis is strongly influenced by which type of fossil fuel generation DSG offsets, further research needs to be conducted to determine the exact ratio of coal vs. natural gas.1
For this analysis, a timeframe of 25 years was chosen, which is the same timeframe used in the Minnesota VOS Methodology.11 The assumed share of natural gas offset by DSG rises by 1.1% annually from 35% in 2014 to 66% in 2038 to account for coal plant retirements due to stricter environmental rules and lower natural gas prices from the shale revolution. The rate is derived from the schedule of coal plant retirements in Michigan during the years 2015 to 2024.11
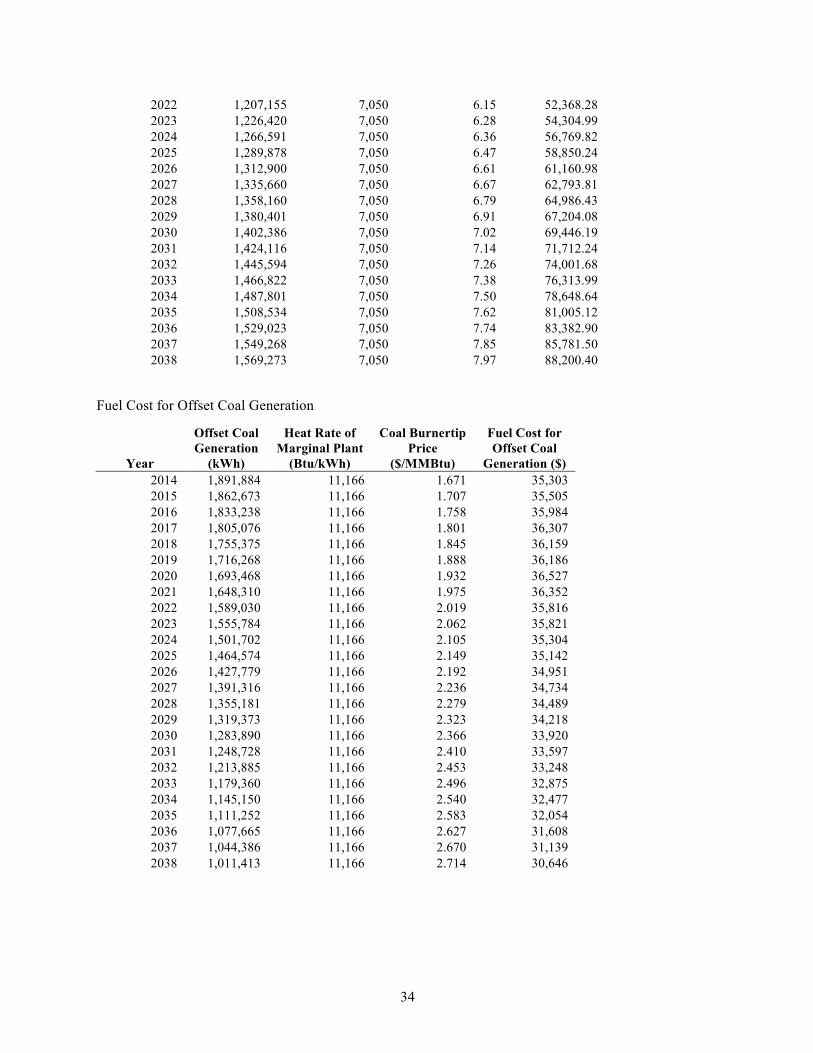
The heat rate of offset natural gas was assumed to be 7,050 Btus per kWh, which is the heat-rate of a combined cycle natural gas turbine.12 The heat rate of offset coal was assumed to be 11,166 Btus per kWh, which is the average heat rate of the coal units at the River Rouge and St. Clair power plants.13 For this project these power plants were assumed to be the marginal coal power plants in Michigan.
The burnertip price of natural gas can be separated into fuel cost and the transportation cost to Michigan. The fuel cost of natural gas was assumed to be the average of the monthly Henry Hub Natural Gas Physical Futures Settlement contracts on April 30, 2014 when available.14 Natural 1 To reinforce the calculated ratio of coal to natural gas as the marginal unit, historical LMPs were also used to assume the marginal unit. Using reported LMPs for the Michigan from 2012, natural gas units were assumed to have an LMP of $35 or more. A weighted average calculation of LMPs greater than $35 with respect to time and season resulted in natural gas plants being the marginal unit 38% of the year.

10
gas futures are available for the first 12 years of the analysis timeframe. A regression analysis found that the estimated fuel cost of natural gas is expected to increase by $0.1185 per MMBtu annually. This regression coefficient was used to calculate the natural gas fuel price in years 13 through 25. The transportation cost of $0.83 per MMBtu to Michigan was calculated by averaging the monthly difference between the Henry Hub Natural Gas Spot Price and the Michigan Electric Utility Natural Gas Price for the year 2013.5,15
The burnertip price of coal can be calculated using the same methodology for natural gas. The fuel cost of coal was determined using the Powder River Basin Coal (Platts OTC Broker Index) Futures Settlement contracts on May 13, 2014 when available.16 Coal futures are available for the first 3 years of the analysis timeframe. A regression analysis found that the estimated fuel cost of coal is expected to increase by $0.84 per short ton annually. The transportation cost of $18.64 per short ton was found by applying a two-year inflation increase of 4.5% to the reported average cost of transporting coal to Michigan in 2010.17 The burnertip price was converted from price per short ton to price per MMBtu by using a coal heat content of 19.336 MMBtus per short ton.18
The risk-free interest rate was calculated by taking the average U.S. Treasury STRIPS yields from May 2, 2014 for each year.19 U.S. Treasury STRIPS are zero-coupon notes and bonds that are the most accurate representation of a risk-free interest rate because they face no prepayment or yield curve risk. A linear extrapolation was used for the years U.S. Treasury STRIPS yields were not available.
Once the annual fuel price hedge was determined for both the coal and natural gas generation offset, the fuel price hedge value was calculated by taking two additional steps. First, the total fuel price hedge for the entire 25-year analysis period was calculated by summing all of the annual fuel price hedges. Second, the fuel price hedge value was calculated by discounting the total fuel price hedge by the Michigan electric utility’s average weighted average cost of capital of 5%20 and then dividing by the total distributed solar electricity generated. The complete calculations for the fuel price hedge value can be found in the Appendix.
The Dow Fellows Team concluded that the value of the fuel price hedge provided by DSG in Michigan is $0.019/kWh, which is in-line with other value of solar analyses that have been performed for other states in the country:

11
Environmental Benefits As the Rocky Mountain Institute report demonstrated there are numerous environmental benefits that can be considered from DSG. This study focused on mitigated carbon emissions for several reasons. The first is that there is an established social cost of carbon calculated by the Federal Government. This value is an estimate of the economic damage associated with carbon emissions, such as human health, ecosystem damage, and changes in agriculture production.21 Unlike avoided damage to land or water, or the cost of criteria pollutants in Michigan, the social cost of carbon is a nationally recognized value that is used in regulatory actions to quantify the value of reduced pollution. For instance, the social cost of carbon was used in the Joint EPA/Department of Transportation Rulemaking to establish Light-Duty Vehicle Greenhouse Gas Emissions Standards and Corporate Average Fuel Economy Standards. Further it is important to consider carbon emissions in Michigan due to the majority of net electricity generation coming from coal plants.22 In 2011, Michigan ranked 10th in CO2 emissions for the nation.23 The established cost of carbon provided the basis for which to quantify this significant issue in Michigan.
The reduction of carbon emissions includes both financial and social benefits. Avoided compliance costs, carbon taxes and other fees are important to affordable electricity generation in the future. As the EPA continues to tighten regulation of carbon emissions from electricity generation, mitigation options are imperative. In addition, carbon emissions have a severe impact on both human and ecosystem health. In light of the most recent news about climate change and the irreversible collapse of Antarctica glaciers it is imperative for society to begin to reduce greenhouse emissions in many areas.24
$-
$0.005
$0.010
$0.015
$0.020
$0.025
$0.030
$0.035
$0.040
$0.045
Michigan Dow Fellows
2014
San Antonio CPR 2013
New Jersey & Pennsylvania
CPR 2012
United States NREL 2008
United States R. Duke
2005
Fuel Price Hedge Value

12
To quantify the value of avoided carbon emissions by DSG in Michigan, the social cost of carbon was applied to the avoided emissions from offset generation. The formula for the value of avoided carbon emissions is: Avoided Carbon Emissions = E * H * C * P where:
• E = Distributed Solar Electricity Generated • H = Heat Rate of the Offset Generation • C = Carbon Dioxide Emissions from the Offset Generation • P = Social Cost of Carbon
The distributed solar electricity generated and the heat rate of the offset generation were calculated using the same methodology described in the fuel price hedge section above. Offset natural gas generation was assumed to emit 117 pounds of carbon dioxide per MMBtu.10 Offset coal generation was assumed to emit 214.3 pounds of carbon dioxide per MMBtu.25 This is the emissions coefficient of sub-bituminous coal from the Powder River Basin where the majority of coal used by Michigan power plants is mined. The social cost of carbon for 2014-2038 was calculated by applying a 7-year inflation adjustment of 12%10 to the social cost of carbon values with a 3% discount rate provided in 2007 dollars by the Federal Government.26 This table illustrates the social cost of carbon used in the analysis:
Year Value (2007 Dollars per Metric Ton)
2014 $36.00 2015 $37.00 2016 $38.00 2017 $39.00 2018 $40.00 2019 $42.00 2020 $43.00 2021 $43.00 2022 $44.00 2023 $45.00 2024 $46.00 2025 $47.00 2026 $48.00 2027 $49.00 2028 $50.00 2029 $51.00 2030 $52.00 2031 $52.00 2032 $53.00 2033 $54.00 2034 $55.00 2035 $56.00 2036 $57.00 2037 $58.00 2038 $59.00

13
Once the annual avoided carbon emissions value was determined for both the coal and natural gas generation offset, the avoided carbon emissions value was calculated by taking two additional steps. First, the total avoided carbon emissions value for the DSG installed in Michigan in 2013 was calculated for the entire 25-year analysis period by summing all of the annual avoided carbon emission values. Second, the avoided carbon emissions value was calculated by discounting the total avoided carbon emissions value by the Michigan electric utility’s average weighted average cost of capital and then dividing by the total distributed solar electricity generated. The complete calculations for the avoided carbon emissions value can be found in the Appendix.
The Dow Fellows Team concluded that the value of avoided carbon emissions provided by DSG in Michigan is $0.023/kWh. Other studies found very similar results, with the average value of offset carbon being about $0.02/kWh.
Reactive Supply & Voltage Control Although DSG systems are installed on residents’ property, the systems are connected to utility transmissions and therefore integrated into the greater electrical system. As such, the presence of DSG can affect the grid’s efficiency and capability. Recent advances in power electronics enabled PV inverters to control the phase angle between current and voltage, allowing the inverters to produce AC electric power at any desired leading/lagging power factor. A leading power factor indicates reactive power production (capacitive load), whereas a lagging power factor indicates reactive power consumption (inductive load). In general, voltage is more strongly coupled to reactive power injection than active power since the real impedance (resistance) of a transmission conductor is relatively much smaller than its imaginary impedance
$-
$0.005
$0.010
$0.015
$0.020
$0.025
$0.030
Michigan Dow Fellows
2014
California Crossborder Energy
2013
California R. Duke
2005
Illinois R. Duke
2005
Environmental Benefits Value

14
(reactance). As a result, injection or consumption of reactive power is used to increase or decrease voltage, respectively.27
ΔV𝑉 =
(𝑃×𝑅)+ (±𝑄×𝑋)|𝑉|!
To facilitate the understanding of the value of localized reactive provision, an overview of AC complex power is provided below. The magnitude of complex power is the Pythagorean addition of active and reactive power.
𝑆 = 𝑃 + 𝑗𝑄 → |𝑆| = 𝑃! + 𝑄!
Additionally, the complex power can be related to voltage and current by the following equation:
𝑆 = 𝑉𝐼∗
Finally, the concept of power factor describes the amounts of active and reactive power that comprise the complex power.
𝑃 = 𝑆 ×𝑃.𝐹. & 𝑄 = |𝑆|× 1− 𝑃.𝐹.!
The relationship between active and reactive power is nonlinear. This has enormous implications on the significance of localized reactive provision for voltage support because generators that operate near unity power factor only have to sacrifice a small amount of active power in order to generate a relatively large amount of reactive power.28 As a result, reactive power is valued at much lower base rate compared with the wholesale price of active power.
Electric utilities promise customers that they will deliver electricity within the voltage statutory limits centered at 120 VRMS by tightly regulating the grid voltages through a top-down approach. This is conventionally achieved through capacitor/reactor banks, synchronous condensers, and solid-state VAR compensators. The incremental investment cost of the conventional technologies is far more cost-effective than advanced inverters as stand-alone devices.29
However, the cost of upgrading PV inverters to include the advanced inverter features would only increase the PV installation cost by only 2-3%28. Also, the advanced features might shorten the return-on-investment time of the PV system by providing voltage ancillary service through the sale of reactive power.
The total value of reactive supply and voltage control is the base rate plus additional sources of value. However, calculating the total value of reactive supply and voltage control in Michigan is difficult. Currently, there is no market in place for bulk reactive power wholesale as is the case with active power.29 Therefore, the only commodity that has a market price is active power supply. However, in the PJM and MISO markets, there are several isolated cases where the Federal Energy Regulatory Commission has approved rates for reactive power provision for

15
Figure 1
voltage support.29 By averaging all the approved rates, the base rate was estimated to be 0.000564 $/kVARh.
Next, the economic value of localizing reactive power was added to the base rate. To gain some insight into the value of localized reactive power supply by an advanced inverter, the Dow Fellows Team analyzed an idealized scenario where the distribution system operator only has two options: Obtain reactive power from a remote generator or obtain reactive power from a local source such as advanced inverters as demonstrated in Figure 1. The main three benefits of localized reactive power supply are:
1. Reduced line losses 2. Increased transmission capacity 3. Increased maximum power transfer capability
The savings are annualized for the peak demand period of 6 hours over 260 working days per year. During the peak demand period, transmission lines become heavily loaded, causing the system voltages to sag. The first benefit looks into savings from reducing 𝐼!𝑅 line losses by moving reactive power supply from the generation side to load.
The second benefit looks into the value of elevating line congestions (thermal limit). Line congestion causes locational marginal prices (LMPs) to differ among generators at different nodes in the gird. Generators located near high load areas tend to charge higher hourly costs for their incremental power generation. For example, Figure 2 shows a snap shot of the LMPs contour in Michigan during the peak demand time, where the LMP of generators in Jackson County is higher than those near Grand Rapids by $4.76 per MWh. This is mainly caused by the limited transmission capacity feeding into Jackson County. Local provision of reactive power frees up some of the transmission capacity, which could be used to reallocate active power supply to generators with lower LMPs.
The third benefit comes from increased power transfer capability (stability limit) which is defined by the North American Electric Reliability Corporation as “the measure of the ability of interconnected electric systems to reliably move or transfer power from one area to another over all transmission lines (or paths) between those areas under specified system conditions.”30 In a
Figure 2: Generation LMP contour for Michigan around 3 PM (05/25/2014)

16
similar manner to the 2nd benefit, more power generation can be reallocated to generators with lower LMPs during peak demand period. By adding the values of these three benefits to the base rate, the annualized rate of reactive power was determined to be $0.0018 $/kVARh. The complete calculations are detailed in the Appendix.
In reality, most low-voltage residential distribution networks are regulated by on-load tap changer (OLTC) transformers. OLTCs are operated by changing the winding ratios to ensure that residential distribution voltages are within the limits. In essence, OLTCs to some extent decouple residential voltages from the remaining of the system. Therefore, it would be unnecessary to further reinforce voltage regulation via advanced inverters at the residential level. Additionally, in real-time operation, it is difficult to distinguish whether voltage problems are caused by the shortcomings of the electric utilities or the renewable interconnection. A more likely scenario, especially in locations with high DSG penetration, is that voltages tend to increase during peak PV generation due to power injection, or voltages fluctuate as generation becomes variable.
In conclusion, advanced inverters have been shown in technical literature to greatly enhance the grid reliability by minimizing voltage instabilities caused by renewable interconnections. However, the economic impact of localized reactive supply is not significant even in an idealized scenario.
Recommendations The value of the fuel price hedge, environmental benefits and reactive supply & voltage control is $0.042 per kWh and $0.002 per kVARh in Michigan, which is 31% of the retail electricity price of $0.142 per kWh. This key finding suggests that solar externalities as a whole likely have a material value in Michigan. As a result, the MPSC should take the following actions:
1. Include solar externalities in a value of solar tariff if the MPSC chooses to adopt this policy. This is necessary to establish a fair market price for DSG.
2. Conduct a complete value of solar analysis for Michigan that includes all of the solar externalities in order to determine the true value of DSG in Michigan.

17
Michigan Public Service Commission Solar Working Group Staff Report Review
Report Summary After six months of meeting with stakeholders and convening regular meetings, the Michigan Public Service Commission Staff issued a report on June 30, 2014 with recommendations for distributed solar policy in Michigan.31 Specifically, the report proposed adopting one of three solar policies:
1. Net Energy Metering (NEM): Under this policy the current NEM cap in Michigan would be expanded by 50 MW. A customer would enroll in a utilities’ existing program and would receive the residential retail rate for energy generated. In addition, the customer would receive a REC payment for contributing renewables to Michigan’s electricity grid. The MPSC estimates that under this policy about 10,000 projects would occur and the customer would receive $0.125 per kWh of generation plus an additional value for the REC payment.
2. Buy All/Credit All Value of Solar Tariff (VOST): Under this policy the customer would purchase all electricity used from the utility at the retail rate and sell all solar generation to the utility at the value of solar tariff rate. The customer’s bill would show a credit for all solar generation at the VOST rate and the REC. This policy is different from net energy metering because the utility would buy all the solar generation instead of purchasing only for excess solar generation. The MPSC assumed a value of solar credit of $0.10 per kWh under this policy and forecasts that this policy would likely result in at most 500 projects, varying in size from 20 kW to 500 kW.
3. Buy Net/Credit Net Value of Solar Tariff: This policy is a hybrid of the two options above. Under this policy, solar customers first consume their solar generation behind-the-meter. Then, excess generation is sold to the utility for a value of solar credit. The MPSC assumes a value of solar of $0.10 per kWh and a REC credit of $0.035 per kWh. Similar to the buy all/credit all policy, the MPSC forecasts the policy would result in at most 500 projects.
In all three programs, the MPSC analyzed a payment scheme that results in a $0.15 per kWh credit for solar generation. According to the MPSC, $0.15 per kWh is it is the required rate for small-scale solar projects to breakeven.
Since the report was published in June, the Dow Fellows team has conducted interviews with relevant stakeholders to understand their positions on distributed solar policy in Michigan. These interviews are intended to provide the MPSC with feedback about the proposed policies and possible alternatives in order to shape future solar policy in Michigan.

18
Stakeholder Feedback
Process Overview
To collect stakeholder feedback on the MPSC report, the Dow Fellows Team first identified a list of individuals and organizations to contact for a holistic picture of distributed solar policy in Michigan. The interviewees were provided with a list of questions about the MPSC report, VOST policy and VOS analyses (See Appendix). Each interviewee was provided the list of questions in advance so they could review and prepare. Interviews were conducted in person and via conference call. Although each interview used the same list of questions, the interviews were conducted in a conversation style so the length of responses varied due to interest and personal knowledge of the issues.
In addition to Michigan-based stakeholders, the Dow Fellows Team spoke with several stakeholders from Minnesota about their state’s value of solar tariff. In 2013, Minnesota passed legislation that required the Department of Commerce to establish a Value of Solar Methodology. The timeliness and similarity of the VOST processes in Minnesota and Michigan prompted the team to engage these stakeholders to collect additional information for the MPSC.
In total, the Dow Fellows Team conducted 11 interviews:
5 Lakes Energy: 5 Lakes Energy (5 Lakes) is a Michigan-based policy consulting firm offering services in clean energy and the environment to the public and private sector. The Dow Fellows Team interviewed Liesl Eichler Clark, Principal and Co-Founder, and Douglas Jester, Principal. Douglas Jester is the informal leader of solar advocates in Michigan, responsible for advising and coordinating positions.
Chart House Energy: Chart House Energy (Chart House) is a predominantly commercial solar developer in the Midwest with an installed PV capacity to date of 2 MW. The company currently owns about 330 kW of their installation, mostly commercial. The Dow Fellows Team interviewed Robert Rafson, President and Founder.
Consumers Energy: Consumers Energy (Consumers) is one of the nation’s largest combination utilities providing electricity and natural gas service to nearly 6.8 million of Michigan’s 10 million residents. The Dow Fellows Team interviewed Nancy Popa, Director of Renewable Resources and Distributed Generation.
DTE Energy: DTE Energy (DTE) is a diversified energy company involved in the development and management of energy-related businesses and services nationwide. DTE’s largest operating subsidiaries are DTE Electric and DTE Gas. Together, these regulated utility companies provide electric and/or gas services to more than three million residential, business and industrial customers throughout Michigan. The Dow Fellows Team interviewed Todd Lohrmann, Manager of Renewable Energy Business Development and Terri Schroeder, Senior Strategist – Renewable Energy Business Development.

19
Four Elements Energy: Four Elements Energy (Four Elements) is an installer of residential PV systems. Four Elements has installed a significant portion of Consumers Energy’s Solar EARP capacity. The Dow Fellows Team interviewed Art Toy, President, and Dan Always.
Great Lakes Renewable Energy Association: The Great Lakes Renewable Energy Association (GLREA) is a statewide nonprofit organization that educates, advocates, and promotes renewable energy in Michigan. The Dow Fellows Team interviewed John Sarver, a Member of the Board of Directors. John provided his own opinion because GLREA has not taken a formal position on VOSTs yet.
Michigan Environmental Council: The Michigan Environmental Council (MEC) – a 501(c)(3) charitable organization – is a coalition of more than 70 organizations created in 1980 to lead Michigan’s environmental movement in achieving positive change through the political process. The Dow Fellows Team interviewed James Clift, Policy Director and Sarah Mullkoff, Energy Program Director.
Minnesota Department of Commerce: The Minnesota Department of Commerce (MN DOC) is responsible for enforcement of Public Utilities Commission (PUC) rules and orders, regulation of natural gas and electric public utilities, energy conservation standards and information programs. The Department of Commerce worked with the PUC on engaging stakeholders on the VOS methodology. The Dow Fellows team spoke with Lise Trudeau, Sr. Engineering Specialist for Distributed Generation and Advanced Technologies
Solar Winds Power Systems: Solar Winds Power Systems is a Michigan solar developer based in Shelbyville that currently manages about 70 solar customers, including both residential and commercial customers up to 100kW. The Dow Fellows Team interviewed Mike Linsea, Owner and Project Manager.
State Representative Jeff Irwin: Representative Jeff Irwin (Rep. Irwin) is the state representative for Michigan’s 53rd House District, which includes parts of the city of Ann Arbor and portions of Ann Arbor, Pittsfield and Scio townships. The Dow Fellows Team interviewed Rep. Irwin.
Xcel Energy: Xcel Energy (Xcel) is a major U.S. electric and natural gas company. Based in Minneapolis, Minnesota, the company operates in eight states and provides a comprehensive portfolio of energy-related products and services to 3.4 million electricity customers and 1.9 million natural gas customers. The Dow Fellows Team interviewed Carolyn S. Brouillard, Regulatory Policy & Strategy Manager.
The interviewees are segmented in to the following groups for discussion below:
1. Investor-Owned Utilities (IOUs): DTE Energy, Consumers Energy 2. Solar Developers: Chart House Energy, Four Elements Energy, Solar Winds Power Systems

20
3. Solar Advocates: 5 Lakes Energy, Great Lakes Renewable Energy Association, Michigan Environmental Council
4. Legislators: Representative Jeff Irwin 5. Minnesota: Department of Commerce and Xcel Energy
Key Findings After reviewing the stakeholder interviews, the Dow Fellows Team synthesized the feedback into 11 key findings. 1. There is no consensus on NEM vs. VOST among stakeholders.
Investor-Owned Utilities: DTE and Consumers would prefer a buy all/credit all VOST as long as the tariff only included quantifiable values. DTE believes net energy metering should not continue because under NEM, customers without solar subsidize customers with solar for their access to the electricity grid.
Solar Developers: All three of the solar developers have a strong preference to NEM due to its simplicity and transparency. NEM also provides a reliable and predictable value when analyzing the economics of solar systems. Additionally, the developers noted that the VOST calculation in other states turned out to be comparable to the retail value, raising questions about the impact of adopting a VOST policy.
Net Energy Metering
Buy All/Credit All VOST
Buy Net/Credit Net VOST

21
Solar Advocates: The Michigan Environmental Council would prefer a VOST that is phased-in over time and NEM for existing solar customers should be grandfathered. John Sarver of GLREA believes that both NEM and VOST should be options for customers.
Legislators: Rep. Irwin would continue using NEM because it is the easiest policy for the consumer to understand and likely offers higher rates. However, Rep. Irwin sees the value of a new policy based on VOS concepts and has introduced House Bill 5676 that is in support of either approach.
Minnesota: Xcel stated that they had initially supported the VOST concept because of its potential to address the cross-subsidization problem associated with NEM and enable recovery of fixed costs from DSG customers. As the methodology was being developed, Xcel grew concerned about how certain elements of the VOST were being calculated. For purposes of community solar gardens, Xcel currently supports the use of an applicable retail rate, which is tied to the overall cost of delivered energy, because it allows for more predictability and flexibility. The Minnesota Department of Commerce also reported that there was opposition against VOST from some solar developers on the basis that VOST alone (without an incentive) may not guarantee profitability for third-party solar garden operators. The financial appeal of the applicable retail rate with the additional REC payment over the value of solar was a large reason why the Commission permitted Xcel to use it.
2. There is no consensus on if or how either NEM or the current IOU solar incentive programs should be redesigned among stakeholders.
If Michigan decides to continue using NEM there is no consensus among stakeholders about what changes to the policy, if any, should be enacted.
Investor-Owned Utilities: DTE and Consumers believe NEM as it currently stands should be eliminated because of the cross-subsidization concern. DTE believes NEM could potentially be fixed in the short-term by reimbursing solar customers for excess electricity generated at the electric utility’s avoided cost rate. Consumers would like to consider alternative options that address cross-subsidization but did not specifically identify any alternatives.
DTE would like to clarify that while the intake for the SolarCurrents program has been limited, net energy metering policy was established by PA 295 and is still active. NEM is capped under PA 295, but the NEM program is currently substantially below the cap. Current rooftop installations, which include customers who are participating in SolarCurrents, amount to less than 15% of the true NEM cap as defined in PA 295. Thus, any indication that the cap is limiting is only referring to the solar incentive programs.
Solar Developers: Solar developers are pushing for a “true” net energy metering regime. This would include the elimination of standby charges and the removal of the current cap on the size of distributed solar systems of all project scales.

22
Developers support removing the cap on both DTE and Consumers’ solar incentive programs. One developer suggested a market scheme to address application overload for Consumer’s existing EARP program. This would involve IOUs offering a fixed price of power, with the lowest price winning the right to build (which would effectively be a replacement for VOST.) This developer compared his experience with EARP and SolarCurrents, citing that experience with commercial installations through SolarCurrents excludes private development, limits ownership of PV systems to utilities, and intentionally selects the most expensive solar systems to fund.
Also, Rob Rafson of Chart House Energy reported that despite downward cost trends that have made solar cost-competitive, the limitations imposed by the MPSC and utilities on the allowable size of distributed solar systems is one of the main reasons that steer investors away from Michigan. Notably, the solar installers would like the IOUs to raise the cap of category 1 net metering significantly to increase flexibility for both large local businesses and customers with electric cars or other disturbed energy resources.
Solar Advocates: Douglas Jester of 5 Lakes and John Sarver of GLREA believe NEM should be uncapped. John said that the lack of resources and the lottery system are the two biggest problems with the current IOU solar incentive programs. John recommended that the Environmental Law and Policy Center’s proposal for a block auction system be implemented to mitigate these problems. The Michigan Environmental Council believes the NEM cap should be raised to a level that will re-open the program for new customers. MEC is very concerned that the current policy regime creates a boom and bust cycle for solar in Michigan.
Minnesota: Xcel maintained that their preferred standard for crediting their solar customers was based on a ‘point of indifference,’ where a non-solar customer would be indifferent as to another customer’s decision to install solar. Their concern is that the methodology overstates the benefits of solar, which would result in higher costs for non-solar customers. Ms. Brouillard stated that if additional compensation is required to support the solar market, this compensation should be in the form of incentives that are transparent and responsive to market changes, instead of built into the VOST rate.
3. Not all stakeholders understand the VOST concept.
While stakeholders who participated in the MPSC’s Solar Working Group had an understanding of the VOST concept, some stakeholders, especially those that did not attend all the meetings, are still unclear on how the policy would function in practice. For example, the solar developers perceived VOST as a more complicated tariff design than NEM. Specifically, two developers cited that their customers had an easier time conceptualizing NEM and factoring the policy into their investment decisions. Developers also saw NEM as an easier way for their customers to link their energy consumption and generation to their monthly bill. Finally, the solar developers themselves were concerned about the VOST policy being “too complex” and inaccessible.

23
4. The VOST concept should be extended to apply to commercial and industrial consumers as well as other distributed energy resources.
Investor-Owned Utilities: DTE and Consumers believe a VOST should also apply to commercial and industrial customers because solar can be installed at any customer site. However, DTE noted that the value of the VOST may differ based on customer segment because the circuit voltage level varies, resulting in a potential benefit/cost from location.
Solar Developers: Developers saw no major distinction between a credit system for residential and commercial & industrial distributed solar customers. It was cited frequently, however, that a key solar trend in Michigan was for businesses and industries to use their solar generation for the purpose of peak-shaving, to reduce time-of-use charges. This is also true for a few municipal power companies who are viewing distributed solar as a cost-effective strategy to reduce their peak-purchasing needs. In this light, developers are pushing for distributed generation to be valued according to peak generating prices. Additionally, developers feel that other forms of distributed energy should apply for the similar valuation standards, especially for distributed energy storage during peak periods and distributed biogas.
Legislature: The Energy Freedom bills sponsored and co-sponsored by Rep. Irwin are geared towards incentivizing distributed energy generation in the State, without specific focus on solar. The bills address the same issues Minnesota’s recent legislation addresses, including tariff design and VOST methodology, ownership of REC credits, as well as modifications of NEM.
Minnesota: Xcel’s first VOS calculation submitted to the Commission was significantly higher than those based on the comments subsequently received by the Department of Commerce. Xcel stated that they made reasonable assumptions on how to interpret certain components in the calculation methodology, and the Department later clarified the methodology. This change in the resulting rate highlighted the sensitivity of the methodology to changes in assumptions, which argued in favor of the applicable retail rate for community solar gardens.
5. Stakeholders are in favor of community solar but significant differences remain on program design.
Investor-Owned Utilities: DTE and Consumers believe community solar should be allowed under a buy all/credit all VOST but not under NEM. Consumers proposes using a dynamic pricing scheme to value the generation.
Solar Developers: All solar developers were supportive of the idea of community solar as a way to allow customers greater access to distributed solar generation in the state. In fact, Four Elements cited that more than two-thirds of their customers in Michigan do not have optimal sites for PV generation. Developers brought up concerns regarding incentives for investors, ownership of REC credits, and equitable financing schemes for customers. Rob Rafson of Chart House expressed his mistrust of community solar projects’ end benefit for customers and owners, especially those done through on-bill reporting, because tax-benefits are not always shared

24
among non-equity investors. To optimally attract third-party investment, developers argue that solar investors and subscribers should be able to install solar projects on commercial and industrial facilities as community for-profit LLCs and apply on-bill billing directly to subscribers (without needing to sell directly to IOUs).
Solar Advocates: Douglas Jester of 5 Lakes and John Sarver of GLREA believe community solar should be allowed. However, Douglas said the policy would have to be tailored slightly. Specifically, Douglas said that the VOS calculation should be adjusted to include any additional administrative fee required by utilities to manage the system and the absence of avoided transmission and distribution costs if the system is large enough.
Minnesota: There are a few particularly significant features of Minnesota’s community solar garden program: 1) Xcel is required by law to offer customers the access to subscribe to community solar gardens; 2) the credit to customers is in the form of a bill-credit; 3) there is no limit on the total installed capacity, and 4) the utility’s program must reasonably allow for the creation and financing of community solar gardens. This later condition presented a challenge to the first VOS calculation, which was lower than what solar installers stated was necessary to allow for financing. To correct for this, an additional incentive (which may have been added to the fuel-price adjustment) was proposed to the Commission during the VOS review process, which Xcel felt was premature given a lack of actual market data. The Dow Fellows Team’s interview with Xcel revealed that they have limited visibility into the contracts between investors and solar garden operators and solar garden operators and customers.
6. Concrete recommendations for the technical details of a VOST were not provided by most stakeholders.
The Dow Fellows Team asked stakeholders several questions about how a VOS should be constructed, including:
1. Should the VOST go into effect immediately or should there be a phase-in period where net energy metering is also allowed?
2. Assume the VOST is recalculated annually in a proceeding similar to a rate case. Should the recalculated rate apply to all solar customers (new and existing) or should the VOST rate be locked in for the length of the solar customer’s contract similar to a feed-in tariff? Should any other control mechanisms, such as a price floor/ceiling or indexing, be used?
3. If Michigan chooses to adopt a VOST where the rate is locked in similar to a feed-in tariff should the rate be fixed or should it include an escalator?
However, most stakeholders were not prepared to answer these questions at this time and recommended that the MPSC wait to tackle these issues until a VOST policy is approved. Below, the Dow Fellows Team summarizes some of the interesting points relating to these questions that were mentioned by interviewees:

25
Investor-Owned Utilities: DTE believes a price floor/ceiling or indexing will not be required because this should be a properly functioning energy market. DTE is not in favor of a feed-in tariff type structure because the value of solar will likely change each year.
Solar Developers: Generally, it seems that while developers in Michigan have strong opinions about the value of their solar systems to the grid, there is confusion over the exact calculation methodology. One solar developer felt that VOST should be adjusted annually to reflect market changes in the price of power and value of RECs based on regulation. He noted that fixing prices in long-term contracts may pose an undue burden on ratepayers, especially as solar penetration increases and the components of the value of solar fluctuate.
Solar Advocates: John Sarver of GLREA believes the VOST should be recalculated annually but that a given solar customer’s VOST should only be calculated once in order to make the economics transparent for the customer by providing revenue certainty. Also, John believes that an escalator is unjustified because the value of solar in future years is unknown. The Michigan Environmental Council believes the VOST should function like a feed-in tariff to increase the certainty of payback for solar customers and eliminate wild fluctuations in the rate.
7. There are significant differences among stakeholders about which avoided cost categories should be included in the value of solar (VOS) analysis.
Investor-Owned Utilities: DTE believes the value of solar should only include avoided cost categories for which clear, quantifiable values can be calculated. In DTE’s presentation to the Solar Working Group, the company advocated for only including avoided fuel costs, avoided variable O&M costs and avoided generation and reserve capacity costs. In 2013, DTE calculated a value of solar of $0.039 per kWh. Additionally, DTE believes solar integration costs should also be included as the data becomes available to conduct a proper valuation.
Similar to DTE, Consumers believes the tariff should credit the value of avoided energy and capacity costs. Consumers would also be in favor of including avoided transmission and distribution infrastructure investment as long as the value can be justified. In addition, Consumers believes that if a utility wants to buy RECs from DSG systems, that is reasonable. However, it is difficult to value RECs in Michigan because there is not a large REC market in the state.
Solar Developers: Solar developers are concerned that the positive externalities of solar were not fairly represented in the VOST calculation of DTE, especially when compared to the Austin Energy and Minnesota VOST calculations. Solar externalities include avoided environmental costs, which one developer argued should include legacy costs of hazardous waste storage from non-renewables. Additionally, the solar developers are of the opinion that utilities have especially ignored the value of solar generation during peak demand time (peak shaving). To this point, installers felt that the utilities highlighted solar integration costs associated with solar peak generation, as illustrated by the “duck curve,” that are not yet relevant to Michigan. They argued

26
that frequency modulation issues and other costs associated with ramping could be addressed by incentives for solar system modifications, such as for smart inverters, re-orientation of panels, or energy storage. Developers were supportive of customers retaining the rights to REC credits and commented that many customers were banking them in anticipation of their greater value in the future.
Solar Advocates: Douglas Jester of 5 Lakes, John Sarver of GLREA and the Michigan Environmental Council believe the VOS should include all avoided electric utility costs and all solar externalities. Douglas believes the value of avoided electric utility costs should be calculated using retail rates for the specific time and location. Additionally, Douglas would credit all solar externalities and notes that avoided carbon emissions and the fuel price hedge have significant value. Douglas and the MEC believe that in the near-term, solar integration costs will be minimal but in the long-term these costs should be included in the VOS to ensure solar customers pay their fair share. John said the VOS analysis should be conducted over the lifetime of the solar panels which can last anywhere from 20-40 years.
Minnesota: Minnesota’s constitution requires that environmental externalities be included in the VOST. This was a point of contention for Xcel, who did not feel that environmental costs that do not represent a real cost to utilities or customers, among other externalities, should be included in solar rates. They stated that social externalities, as well as the inflation escalator, were particularly problematic and led to what they felt was a lack of transparency in the VOS methodology.
8. The development of Michigan solar policy is not transparent; many stakeholders believe solar policy should be included in a general ratemaking proceeding but continued, specialized engagement is required in the near-term.
Several stakeholders across the spectrum expressed the view that Michigan solar policy should be handled in a ratemaking proceeding to increase the transparency of the policy development process. For example, DTE believes solar policy should be debated during ratemaking proceedings because the focus should be on creating good energy policy, not just solar policy, and recommended that solar policy be included in annual power supply cost recovery hearings. Consumers, Douglas Jester at 5 Lakes, John Sarver of GLREA and the MEC also believe that the VOS should be recalculated on a rate case schedule.
However, while the solar developers did not comment directly on whether or not to include solar policy in a general ratemaking proceeding, several expressed that they greatly appreciated the increased communication with the MPSC provided by the Solar Working Group. Additionally, some developers believe that the MPSC could play a larger role in pushing constructive solar policies forward.
27
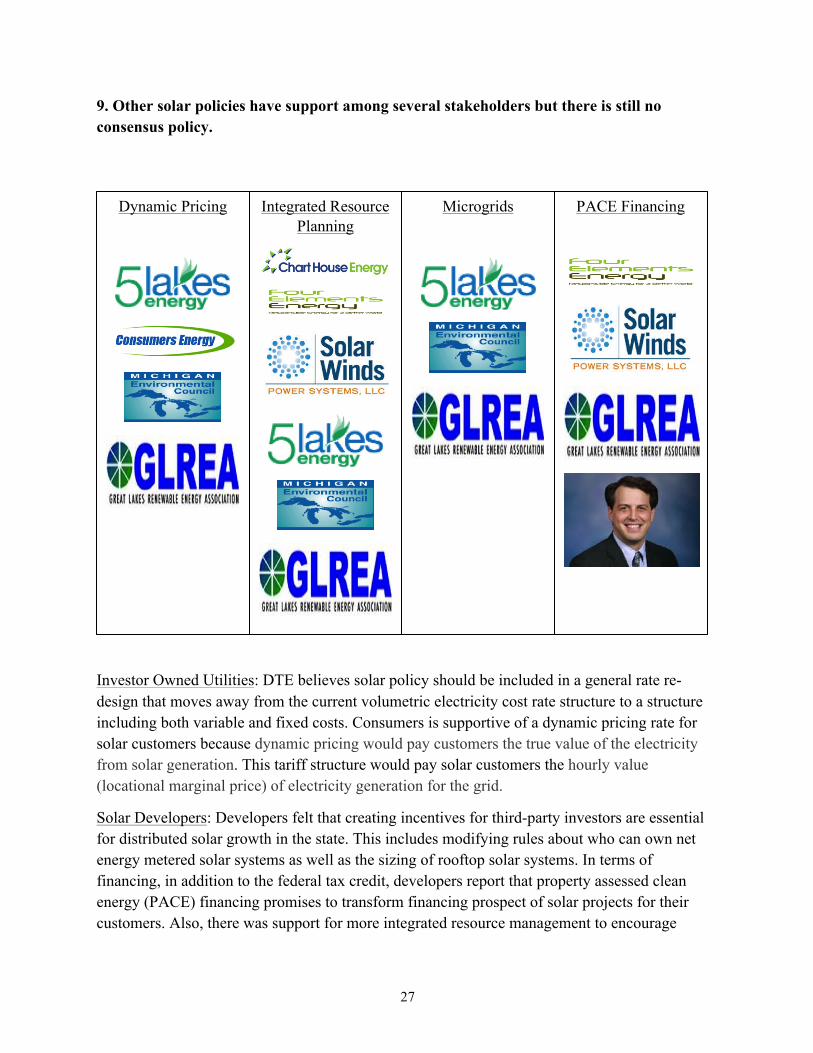
9. Other solar policies have support among several stakeholders but there is still no consensus policy.
Investor Owned Utilities: DTE believes solar policy should be included in a general rate re-design that moves away from the current volumetric electricity cost rate structure to a structure including both variable and fixed costs. Consumers is supportive of a dynamic pricing rate for solar customers because dynamic pricing would pay customers the true value of the electricity from solar generation. This tariff structure would pay solar customers the hourly value (locational marginal price) of electricity generation for the grid.
Solar Developers: Developers felt that creating incentives for third-party investors are essential for distributed solar growth in the state. This includes modifying rules about who can own net energy metered solar systems as well as the sizing of rooftop solar systems. In terms of financing, in addition to the federal tax credit, developers report that property assessed clean energy (PACE) financing promises to transform financing prospect of solar projects for their customers. Also, there was support for more integrated resource management to encourage
Dynamic Pricing
Integrated Resource Planning
Microgrids
PACE Financing

28
renewable power generation where the grid needs additional power generation and replacement capacity, both at the municipal and state-levels.
Solar Advocates: Douglas Jester at 5 Lakes and the MEC would prefer dynamic pricing and allow the use of micro grids to increase the reliability benefit of on-site generation. Liesl Eichler Clark of 5 Lakes and the MEC believes an important part of the conversation should be to not focus on tariff design and rates, but the entirety of energy management in the state and that Michigan would benefit from an integrated resource planning process. John Sarver of GLREA would allow virtual NEM for community solar, secure a property tax exemption for solar panels and expedite and standardize permitting to reduce soft costs.
Legislature: Rep. Irwin believes allowing PACE financing could have an enormous impact on both the Michigan solar and home energy efficiency markets.
10. The market impact of adopting a VOST is unclear.
Stakeholders were unable to provide a detailed forecast of installed solar capacity in Michigan if a VOST is enacted but did express some general views. For instance, DTE believes installed solar capacity will only grow if subsidies remain because there is still a cost gap between solar energy and conventional energy and this gap is unlikely to continue to shrink because solar modules prices have bottomed-out. Developers, however, report a dramatic trend of declining costs of installations, with some reporting that the levelized cost of electricity for solar is at grid parity for select projects. Developers anticipate that with more flexible policies for third-party investors, DSG would see tremendous momentum in the future. John Sarver of GLREA believes that a VOST with a rate similar to Minnesota’s would have a “significant” impact on a solar market that is already growing rapidly, albeit from a small base. MEC believes growth will be slow at first but increase over time.
The Minnesota Department of Commerce and Xcel believe that any increase in the penetration rate of DSG post the adoption of the Minnesota VOST methodology is uncertain, although the fact that the community solar programs has no cap has generated significant interest.
11. Action on Michigan solar policy will shift to the legislature where the outlook is uncertain.
Rep. Irwin and Liesl Eichler Clark of 5 Lakes believe energy will likely be a key issue in the 2015 legislative session because Michigan’s Renewable Portfolio Standard will expire at the end of the year. As a result, both believe action in solar policy in 2015 is also possible. Rep. Irwin expects hearings to start in February and wrap up in the fall with the introduction of a new energy policy bill. However, Rep. Irwin believes the outlook for a solar policy bill is uncertain because of differences of opinion among Democrats and Republicans as well as key stakeholders.
29
The Dow Fellows Team engaged some of the developers about the proposed changes to NEM in House Bill 5673 and the response was that the new proposals were generally agreeable. However, in response to the proposed House Bill 567, Rob Rafson of Chart House cited concern over 1) the minimum number of subscribers 2) the small size of the system (2MW) not being enough to attract investors and 3) that the electricity and RECs must be sold to a IOU. Regarding NEM or VOST, there was concern over what the credit for community solar would be under the Bill.
In Minnesota, legislation has been the clear driver for the increased solar uptake in the state by customers. The Omnibus bill of 2013 introduced a package of energy bills that focused on DSG requirements, such as the Solar Energy Standards quota for systems less than 10kW, in addition to community garden statute.
Interestingly, VOST was first introduced through a stakeholder process by utilities to the Department of Commerce. Prior to VOST regulation, reforms to NEM had been made at the legislative level as well. In Minnesota, the Department of Commerce was a key player in bridging stakeholder feedback with legislation.
Xcel emphasized the importance of “getting legislation right.” Current debate in Minnesota focuses on the Commission’s interpretation of certain aspects of the 2013 legislation, including the appropriateness of adding incentives to increase the financial appeal of VOST, or transitioning from NEM to VOST. Xcel highlighted the importance of the Commission to continue transparently engaging with stakeholders on contentious aspects of implementing the new legislation.

30
Conclusion Distributed solar generation is growing rapidly in the United States. One of the primary reasons is a policy called net energy metering but NEM is now under attack. Critics believe DSG owners are not paying enough for the upkeep of the electric grid, even though they depend on this infrastructure for a reliable power supply. Proponents of NEM have responded that not all of the benefits of DSG are included in current electricity tariffs. These additional benefits, known as solar externalities, include reduced grid congestion, no volatility in the future cost of power and reduced local air pollution and greenhouse gas emissions.
In Michigan, DTE Energy’s and Consumers Energy’s DSG programs use NEM but in 2013 a group of solar advocates challenged the programs arguing they do not fulfill the requirements of Michigan Public Act 295 to develop a sustainable solar industry. In response, the Michigan Public Service Commission convened a Solar Working Group. An alternative to NEM was proposed called a value of solar tariff, which credits DSG customers for electricity generated at the value of solar, not the retail rate.
To set a VOST, the value of solar must be calculated, including all solar externalities. This project measured three solar externalities to determine if they had value. The Dow Fellows Team found that in Michigan the value of the fuel price hedge and avoided carbon emissions is $0.042 per kWh, however the value of reactive supply and voltage control is non-material. As a result, the Dow Fellows Team recommended the MPSC take the following actions:
1. Include solar externalities in a value of solar tariff if the MPSC chooses to adopt this policy. 2. Conduct a complete value of solar analysis for Michigan that includes all of the solar
externalities in order to determine the true value of DSG in Michigan.
In phase two of the project the Dow Fellows Team collected stakeholder feedback for the MPSC on the Michigan Public Service Commission Solar Working Group - Staff Report. Key findings from the feedback include:
1. There is no consensus on NEM vs. VOST among Michigan stakeholders. 2. There is no consensus on if or how either NEM or the current IOU solar incentive programs
should be redesigned among stakeholders. 3. Some stakeholders do not understand the VOST concept. 4. There are significant differences among stakeholders about which avoided cost categories
should be included in a value of solar analysis. 5. The market impact of adopting a VOST is unclear.
Moving forward, action on Michigan solar policy will shift to the legislature where the outlook is uncertain. In the interim the Dow Fellows Team recommends the MPSC continue to engage stakeholders about transitioning from NEM to a VOST.

31
Acknowledgements The Dow Fellows Team would like to thank all the people and organizations who helped facilitate and advise this project. An especially big thank you to Julie Baldwin and Jesse Harlow of the Michigan PSC for sponsoring the project, Douglas Jester of 5 Lakes Energy and Professor Jeremiah Johnson of SNRE for serving as the principal advisors, all of the stakeholders the Dow Fellows Team interviewed over the course of our project and Dow Chemical for giving the team this tremendous opportunity to shape solar policy in Michigan.

32
Appendix
Fuel Price Hedge DSG Electricity Generated in Michigan by Year
Year DSG Electricity
Generated (kWh) 2014 2,910,592 2015 2,896,039 2016 2,881,558 2017 2,867,151 2018 2,852,815 2019 2,838,551 2020 2,824,358 2021 2,810,236 2022 2,796,185 2023 2,782,204 2024 2,768,293 2025 2,754,452 2026 2,740,679 2027 2,726,976 2028 2,713,341 2029 2,699,774 2030 2,686,275 2031 2,672,844 2032 2,659,480 2033 2,646,182 2034 2,632,952 2035 2,619,787 2036 2,606,688 2037 2,593,654 2038 2,580,686
Michigan Burnertip Natural Gas Price
Year Forecasted NG Price MI NG Burnertip Price 2014 $4.85 $5.67 2015 $4.42 $5.24 2016 $4.34 $5.16 2017 $4.43 $5.25 2018 $4.56 $5.39 2019 $4.73 $5.56 2020 $4.96 $5.78 2021 $5.15 $5.98 2022 $5.33 $6.15 2023 $5.46 $6.28 2024 $5.53 $6.36 2025 $5.65 $6.47 2026 $5.78 $6.61 2027 $5.84 $6.67 2028 $5.96 $6.79 2029 $6.08 $6.91

33
2030 $6.20 $7.02 2031 $6.32 $7.14 2032 $6.44 $7.26 2033 $6.55 $7.38 2034 $6.67 $7.50 2035 $6.79 $7.62 2036 $6.91 $7.74 2037 $7.03 $7.85 2038 $7.15 $7.97
Michigan Burnertip Coal Price
Year Energy Price / Ton Burnertip Price / Ton Burnertip Price / MMBtu 2014 $13.67 $32.31 $1.6712 2015 $14.37 $33.01 $1.7071 2016 $15.35 $33.99 $1.7579 2017 $16.19 $34.83 $1.8013 2018 $17.03 $35.67 $1.8448 2019 $17.87 $36.51 $1.8882 2020 $18.71 $37.35 $1.9317 2021 $19.55 $38.19 $1.9751 2022 $20.39 $39.03 $2.0186 2023 $21.23 $39.87 $2.0620 2024 $22.07 $40.71 $2.1054 2025 $22.91 $41.55 $2.1489 2026 $23.75 $42.39 $2.1923 2027 $24.59 $43.23 $2.2358 2028 $25.43 $44.07 $2.2792 2029 $26.27 $44.91 $2.3227 2030 $27.11 $45.75 $2.3661 2031 $27.95 $46.59 $2.4095 2032 $28.79 $47.43 $2.4530 2033 $29.63 $48.27 $2.4964 2034 $30.47 $49.11 $2.5399 2035 $31.31 $49.95 $2.5833 2036 $32.15 $50.79 $2.6268 2037 $32.99 $51.63 $2.6702 2038 $33.83 $52.47 $2.7136
Fuel Cost for Offset Natural Gas Generation
Year
Offset Natural Gas Generation
(kWh)
Heat Rate of Marginal Plant
(Btu/kWh)
Natural Gas Burnertip Price
($/MMBtu)
Fuel Cost for Offset Nat Gas Generation ($)
2014 1,018,707 7,050 5.67 40,743.86 2015 1,033,366 7,050 5.24 38,201.91 2016 1,048,320 7,050 5.16 38,138.87 2017 1,062,075 7,050 5.25 39,318.16 2018 1,097,440 7,050 5.39 41,695.06 2019 1,122,283 7,050 5.56 43,989.28 2020 1,130,890 7,050 5.78 46,083.29 2021 1,161,926 7,050 5.98 48,964.49
34
2022 1,207,155 7,050 6.15 52,368.28 2023 1,226,420 7,050 6.28 54,304.99 2024 1,266,591 7,050 6.36 56,769.82 2025 1,289,878 7,050 6.47 58,850.24 2026 1,312,900 7,050 6.61 61,160.98 2027 1,335,660 7,050 6.67 62,793.81 2028 1,358,160 7,050 6.79 64,986.43 2029 1,380,401 7,050 6.91 67,204.08 2030 1,402,386 7,050 7.02 69,446.19 2031 1,424,116 7,050 7.14 71,712.24 2032 1,445,594 7,050 7.26 74,001.68 2033 1,466,822 7,050 7.38 76,313.99 2034 1,487,801 7,050 7.50 78,648.64 2035 1,508,534 7,050 7.62 81,005.12 2036 1,529,023 7,050 7.74 83,382.90 2037 1,549,268 7,050 7.85 85,781.50 2038 1,569,273 7,050 7.97 88,200.40
Fuel Cost for Offset Coal Generation
Year
Offset Coal Generation
(kWh)
Heat Rate of Marginal Plant
(Btu/kWh)
Coal Burnertip Price
($/MMBtu)
Fuel Cost for Offset Coal
Generation ($) 2014 1,891,884 11,166 1.671 35,303 2015 1,862,673 11,166 1.707 35,505 2016 1,833,238 11,166 1.758 35,984 2017 1,805,076 11,166 1.801 36,307 2018 1,755,375 11,166 1.845 36,159 2019 1,716,268 11,166 1.888 36,186 2020 1,693,468 11,166 1.932 36,527 2021 1,648,310 11,166 1.975 36,352 2022 1,589,030 11,166 2.019 35,816 2023 1,555,784 11,166 2.062 35,821 2024 1,501,702 11,166 2.105 35,304 2025 1,464,574 11,166 2.149 35,142 2026 1,427,779 11,166 2.192 34,951 2027 1,391,316 11,166 2.236 34,734 2028 1,355,181 11,166 2.279 34,489 2029 1,319,373 11,166 2.323 34,218 2030 1,283,890 11,166 2.366 33,920 2031 1,248,728 11,166 2.410 33,597 2032 1,213,885 11,166 2.453 33,248 2033 1,179,360 11,166 2.496 32,875 2034 1,145,150 11,166 2.540 32,477 2035 1,111,252 11,166 2.583 32,054 2036 1,077,665 11,166 2.627 31,608 2037 1,044,386 11,166 2.670 31,139 2038 1,011,413 11,166 2.714 30,646

35
Annual Fuel Price Hedge Value
Year Total Fuel Cost for Offset Fossil Fuel Generation ($)
Treasury STRIPS Yield
Fuel Price Hedge ($)
2014 76,046.94 0.05% 76,009 2015 73,707.08 0.16% 73,589 2016 74,123.09 0.50% 73,754 2017 75,625.18 0.97% 74,901 2018 77,853.91 1.43% 76,756 2019 80,175.07 1.71% 78,831 2020 82,609.85 2.00% 80,990 2021 85,316.58 2.29% 83,409 2022 88,183.81 2.48% 86,050 2023 90,125.86 2.58% 87,863 2024 92,073.92 2.74% 89,618 2025 93,991.90 2.80% 91,432 2026 96,112.36 2.91% 93,398 2027 97,527.48 3.00% 94,687 2028 99,475.38 3.11% 96,475 2029 101,421.72 3.15% 98,324 2030 103,366.36 3.20% 100,161 2031 105,309.16 3.24% 102,004 2032 107,250.00 3.26% 103,864 2033 109,188.75 3.28% 105,721 2034 111,125.27 3.30% 107,575 2035 113,059.45 3.32% 109,426 2036 114,991.16 3.34% 111,275 2037 116,920.27 3.38% 113,103 2038 118,846.67 3.41% 114,928
Value of Fuel Price Hedge Calculation
Fuel Price Hedge NPV $1,309,623.70 Total DSG (kWh) 68,561,752 Fuel Price Hedge NPV/kWh $0.019
Environmental Benefits Carbon Dioxide Emissions from Natural Gas Consumed in Electricity Production in Michigan
Year Offset Natural Gas Generation (kWh)
Heat Rate of Marginal Plant (Btu/kWh)
Natural Gas Consumed (MMBtu) CO2 (lbs)
2014 1,018,707 7,050 7,182 840,280 2015 1,033,366 7,050 7,285 852,372 2016 1,048,320 7,050 7,391 864,707 2017 1,062,075 7,050 7,488 876,052 2018 1,097,440 7,050 7,737 905,223 2019 1,122,283 7,050 7,912 925,715 2020 1,130,890 7,050 7,973 932,814 2021 1,161,926 7,050 8,192 958,415 2022 1,207,155 7,050 8,510 995,721 2023 1,226,420 7,050 8,646 1,011,612 2024 1,266,591 7,050 8,929 1,044,747 2025 1,289,878 7,050 9,094 1,063,956

36
2026 1,312,900 7,050 9,256 1,082,946 2027 1,335,660 7,050 9,416 1,101,719 2028 1,358,160 7,050 9,575 1,120,278 2029 1,380,401 7,050 9,732 1,138,624 2030 1,402,386 7,050 9,887 1,156,758 2031 1,424,116 7,050 10,040 1,174,682 2032 1,445,594 7,050 10,191 1,192,399 2033 1,466,822 7,050 10,341 1,209,908 2034 1,487,801 7,050 10,489 1,227,213 2035 1,508,534 7,050 10,635 1,244,315 2036 1,529,023 7,050 10,780 1,261,214 2037 1,549,268 7,050 10,922 1,277,914 2038 1,569,273 7,050 11,063 1,294,415
Carbon Dioxide Emissions from Coal Consumed in Electricity Generation in Michigan
Year Offset Coal
Generation (kWh) Heat Rate of Marginal
Plant (Btu/kWh) Coal Consumed
(MMBtu) CO2 (lbs)
2014 1,891,884 11,166 21,125 4,527,041 2015 1,862,673 11,166 20,799 4,457,141 2016 1,833,238 11,166 20,470 4,386,708 2017 1,805,076 11,166 20,155 4,319,318 2018 1,755,375 11,166 19,601 4,200,391 2019 1,716,268 11,166 19,164 4,106,812 2020 1,693,468 11,166 18,909 4,052,256 2021 1,648,310 11,166 18,405 3,944,197 2022 1,589,030 11,166 17,743 3,802,349 2023 1,555,784 11,166 17,372 3,722,796 2024 1,501,702 11,166 16,768 3,593,384 2025 1,464,574 11,166 16,353 3,504,540 2026 1,427,779 11,166 15,943 3,416,495 2027 1,391,316 11,166 15,535 3,329,243 2028 1,355,181 11,166 15,132 3,242,778 2029 1,319,373 11,166 14,732 3,157,094 2030 1,283,890 11,166 14,336 3,072,186 2031 1,248,728 11,166 13,943 2,988,048 2032 1,213,885 11,166 13,554 2,904,675 2033 1,179,360 11,166 13,169 2,822,060 2034 1,145,150 11,166 12,787 2,740,200 2035 1,111,252 11,166 12,408 2,659,087 2036 1,077,665 11,166 12,033 2,578,717 2037 1,044,386 11,166 11,662 2,499,084 2038 1,011,413 11,166 11,293 2,420,183
Social Cost of Carbon
Year Value
(2007 Dollars per Metric Ton)
Value (2014 Dollars
per Metric Ton)
Value (2014 Dollars per
Lbs) 2014 $36.00 $40.32 $0.018 2015 $37.00 $41.44 $0.019 2016 $38.00 $42.56 $0.019

37
2017 $39.00 $43.68 $0.020 2018 $40.00 $44.80 $0.020 2019 $42.00 $47.04 $0.021 2020 $43.00 $48.16 $0.022 2021 $43.00 $48.16 $0.022 2022 $44.00 $49.28 $0.022 2023 $45.00 $50.40 $0.023 2024 $46.00 $51.52 $0.023 2025 $47.00 $52.64 $0.024 2026 $48.00 $53.76 $0.024 2027 $49.00 $54.88 $0.025 2028 $50.00 $56.00 $0.025 2029 $51.00 $57.12 $0.026 2030 $52.00 $58.24 $0.026 2031 $52.00 $58.24 $0.026 2032 $53.00 $59.36 $0.027 2033 $54.00 $60.48 $0.027 2034 $55.00 $61.60 $0.028 2035 $56.00 $62.72 $0.028 2036 $57.00 $63.84 $0.029 2037 $58.00 $64.96 $0.029 2038 $59.00 $66.08 $0.030
Value of Avoided Carbon Dioxide Emissions in Michigan
Year
CO2 Emissions from Offset Fossil Fuel Generation (lbs)
Value of Avoided CO2
Emissions
Environmental Benefits Value
($) 2014 5,367,321 $0.018 $98,162.22 2015 5,309,513 $0.019 $99,802.33 2016 5,251,415 $0.019 $101,378.11 2017 5,195,371 $0.020 $102,935.56 2018 5,105,614 $0.020 $103,751.00 2019 5,032,527 $0.021 $107,379.08 2020 4,985,070 $0.022 $108,899.03 2021 4,902,612 $0.022 $107,097.74 2022 4,798,071 $0.022 $107,251.56 2023 4,734,408 $0.023 $108,233.69 2024 4,638,132 $0.023 $108,388.99 2025 4,568,496 $0.024 $109,082.58 2026 4,499,441 $0.024 $109,719.56 2027 4,430,962 $0.025 $110,300.74 2028 4,363,056 $0.025 $110,826.87 2029 4,295,718 $0.026 $111,298.72 2030 4,228,944 $0.026 $111,717.07 2031 4,162,730 $0.026 $109,967.89 2032 4,097,073 $0.027 $110,314.82 2033 4,031,969 $0.027 $110,610.20 2034 3,967,413 $0.028 $110,854.76 2035 3,903,401 $0.028 $111,049.22 2036 3,839,931 $0.029 $111,194.31 2037 3,776,998 $0.029 $111,290.74 2038 3,714,598 $0.030 $111,339.21

38
Value of Environmental Benefits Calculation
Environmental Benefits NPV $1,581,907.96 Total DSG (kWh) 68,561,752 NPV/kWh $0.023
Reactive Supply & Voltage Control Value of Reactive Supply & Voltage Control Calculation

39

40

41
Stakeholder Interview Questions The Michigan PSC Staff’s Report suggested 3 options for the future of distributed solar power in Michigan: 1) Net Energy Metering 2) VOST with Buy-All/Sell-All Credits 3) VOST with Buy-Net/Credit-Net Credits. Which option is your organization in favor of if any? Why? Are there any alternative options that should also be considered? If Michigan chooses to adopt a VOST:
1. Should the VOST go into effect immediately or should there be a phase-in period where net energy metering is also allowed? Why?
2. Should SolarCurrents and EARP (DTE Energy’s and Consumers Energy’s distributed solar generation incentive program) be uncapped or should they remain capped? Why? If removed, what changes would your organization like to see to net energy metering to facilitate a smooth transition?
3. Should the VOST also apply to commercial and industrial consumers? Why? 4. How should community solar using virtual net energy metering be treated? Why? 5. How should distributed energy storage be treated? Why? 6. Assume the VOST is recalculated annually in a proceeding similar to a rate-case, should
the recalculated rate apply to all solar customers (new and existing) or should the VOST rate be locked in for the length of the solar customer’s contract similar to a feed-in tariff? Why? Should any other control mechanisms, such as a price floor/ceiling or indexing, be used?
7. If Michigan chooses to adopt a VOST where the rate is locked in similar to a feed-in tariff should the rate be fixed or should it include an escalator? Why?
If Michigan decides to complete a state-mandated value-of-solar analysis:
1. What specific value components of distributed solar should be included in the analysis (Ex. Avoided Fuel Cost, Avoided Plant O&M, Avoided Generation Capacity Cost, Avoided Environmental Cost, etc.)? Why?
2. How should the solar integration cost be calculated? Why? 3. What should the lifetime in years of the analysis be? Why?
If Michigan adopts a VOST, what size solar market does your organization expect? How should general rate making and solar policy interact? What other distributed solar policies should Michigan implement? Why? In conclusion, what does your organization recommend as the next step for Michigan?

42
Works Cited 1 U.S. Solar Market Insight Report: 2013 Year-in-Review, GTM Research and Solar Energy Industries Association, 2014. 2 Testimony of Ed Comer of the Edision Electric Institute to the Michigan Public Service 2 Testimony of Ed Comer of the Edision Electric Institute to the Michigan Public Service Commission. Ed. Michigan Public Service Commission., 2014. <http://michigan.gov.proxy.lib.umich.edu/documents/mpsc/May_20_EEI__Value_and_Cost_of_Distributed_Solar_456969_7.pdf> 3 Interview with Sarah Bertram of The Alliance for Solar Choice., 2014. 4 Hansen, Lena, Virginia Lacy, and Devi Glick. A Review of PV Benefit & Cost Studies. Rocky Mountain Institute, 2013. <http://www.rmi.org/Content/Files/eLab-DER_cost_value_Deck_130722.pdf> 5 "Henry Hub Natural Gas Spot Price." <http://www.eia.gov/dnav/ng/hist/rngwhhdm.htm>. 6 Interview with Todd Lorhmann of DTE Energy., 2014. 7 Clean Power Research 8 DTE Energy SolarCurrents 9 Consumers Energy EARP 10 Norris, Benjamin L., Morgan C. Putnam, and Thomas E. Hoff. Minnesota Value of Solar: Methodology. Clean Power Research, 2014. <http://www.ilsr.org/wp-content/uploads/2014/04/MN-Value-of-Solar-from-ILSR.pdf> 11 Lark, Peter J. Michigan’s 21st Century Electric Energy Plan., 2007. (Table 24) < http://www.michigan.gov.proxy.lib.umich.edu/documents/mpsc/energyplan_appendix2_185279_7.pdf> 12 Updated Capital Cost Estimates for Utility Scale Electricity Generating Plants. U.S. Energy Information Administration, 2013. <http://www.eia.gov/forecasts/capitalcost/pdf/updated_capcost.pdf> 13 Calculated by Josh Novacheck under the guidance of Dr. Jeremiah Johnson (UM – Ann Arbor) from
1- "Air Markets Program Data." <http://ampd.epa.gov/ampd/>. 2- "The Emissions & Generation Resource Integrated Database." <http://www.epa.gov/cleanenergy/energy-resources/egrid/>.
14 "Natural Gas (Henry Hub) Physical Futures Quotes Globex." <http://www.cmegroup.com/trading/energy/natural-gas/natural-gas.html>. 15 "Michigan Natural Gas Price Sold to Electric Power Consumers." < http://www.eia.gov/dnav/ng/hist/n3045mi3m.htm> 16 "Powder River Basin Coal (Platts OTC Broker Index) Futures Contract Specs." <http://www.cmegroup.com/trading/energy/coal/western-rail-powder-river-basin-coal-swap-futures_contract_specifications.html>. 17Estimated Rail Transportation Rates for Coal, Basin to State, EIA Data., 2012. <http://www.eia.gov/coal/transportationrates/pdf/table13_basin_state_eia_nominal.pdf> 18 "How much coal, natural gas, or petroleum is used to generate a kilowatthour of electricity?" 2014. <http://www.eia.gov/tools/faqs/faq.cfm?id=667&t=2>. 19 "U.S. Treasury Strips."

43
<http://online.wsj.com/mdc/public/page/2_3020-tstrips.html>. 20 Bloomberg 21 "The Social Cost of Carbon." <http://www.epa.gov/climatechange/EPAactivities/economics/scc.html>. 22 "MICHIGAN State Profile and Energy Estimates." <http://www.eia.gov/state/?sid=MI>. 23 "State CO2 Emissions." <http://www.eia.gov/environment/emissions/state/state_emissions.cfm?src=email>. 24 Gold, Scott. "Irreversible Collapse of Antarctic Glaciers has Begun." The LA Times 2014. <http://www.latimes.com.proxy.lib.umich.edu/science/environment/la-sci-0513-antarctic-ice-sheet-20140513-story.html;>. 25 "How much carbon dioxide (CO2) is produced when different fuels are burned?"Web. <http://www.eia.gov/tools/faqs/faq.cfm?id=73&t=11>. 26 Technical Update of the Social Cost of Carbon for Regulatory Impact Analysis. Interagency Working Group on Social Cost of Carbon, United States Government, 2013. < http://www.whitehouse.gov/sites/default/files/omb/assets/inforeg/technical-update-social-cost-of-carbon-for-regulator-impact-analysis.pdf> 27 Stetz, Thomas, Frank Marten, and Martin Braun. "Improved Low Voltage Grid-Integration of Photovoltaic Systems in Germany." IEEE Transactions on Sustainable Energy 4.2 (2013) 28 Tufon, Christopher, et al. A Tariff for Reactive Power. OAK RIDGE NATIONAL LABORATORY, 2008. < http://geosci.uchicago.edu/~moyer/GEOS24705/Readings/OakRidgeReactivePower.pdf > 29 Li, F. Fran, et al. A Preliminary Analysis of the Economics of using Distributed Energy as a Source of Reactive Power Supply. Department of Energy’s Office of Energy Efficiency and Renewable Energy, Distributed Energy Program, 2006. <http://info.ornl.gov/sites/publications/files/Pub1771.pdf> 30 Available Transfer Capability Definitions and Determination . North American Electric Reliability Council, 1996. <http://www.westgov.org/wieb/wind/06-96NERCatc.pdf> 31 Michigan Public Service Commission, “Michigan Public Service Commission Solar Working Group – Staff Report.” June 30, 2014 <http://www.michigan.gov/documents/mpsc/solar_report_2014_461573_7.pdf>.