University of Houston Students and the 2016 Election after the 2016 presidential election, the...
66
University of Houston Students and the 2016 Election April 2017
Transcript of University of Houston Students and the 2016 Election after the 2016 presidential election, the...
University of Houston Students and the 2016 Election
April 2017
Graduate College of Social Work University of Houston Students & the 2016 Election Hobby School of Public Affairs
i
TABLE OF CONTENTS
List of Figures ................................................................................................................................. ii List of Tables .................................................................................................................................. v Executive Summary ........................................................................................................................ 1 I. Objective .................................................................................................................................... 4 II. Method of Analysis ................................................................................................................... 4 III. Findings..................................................................................................................................... 6 V. Summary .................................................................................................................................. 58
Graduate College of Social Work University of Houston Students & the 2016 Election Hobby School of Public Affairs
ii
LIST OF FIGURES
Figure 1 Voter Registration 7
Figure 2 Voter Turnout in a 2016 Democratic or Republican Primary or Caucus for President 9
Figure 3 Vote Choice in the 2016 Primary Elections
Figure 4 Voter Turnout in the 2016 Presidential Election 11
Figure 5 Reasons for Nonvoting 12
Figure 6 Vote Choice in the 2016 Presidential Election 13
Figure 7 The Influence of Candidates’ Stances on Economy on Individual Vote Choice 16
Figure 8 The Influence of Candidates’ Stances on Terrorism on Individual Vote Choice 17
Figure 9 The Influence of Candidates’ Stances on Foreign Policy on Individual Vote Choice 18
Figure 10 The Influence of Candidates’ Stances on Health Care on Individual Vote Choice - 19
Figure 11 The Influence of Candidates’ Stances on Gun Policy on Individual Vote Choice - - 20
Figure 12 The Influence of Candidates’ Stances on Social Security on Individual Vote Choice 21
Figure 13 The Influence of Candidates’ Stances on Supreme Court Appointments on Individual Vote Choice 22
Figure 14 The Influence of Candidates’ Stances on Treatment of Racial, Ethnic Minorities on Individual Vote Choice 23
Figure 15 The Influence of Candidates’ Stances on Trade Policy on Individual Vote Choice - 24
Figure 16 The Influence of Candidates’ Stances on Environment on Individual Vote Choice - 25
Figure 17 The Influence of Candidates’ Stances on Minimum Wage on Individual Vote Choice 26
Figure 18 The Influence of Candidates’ Stances on Immigration on Individual Vote Choice 27

Graduate College of Social Work University of Houston Students & the 2016 Election Hobby School of Public Affairs
iii
LIST OF FIGURES CONTINUED
Figure 19 The Influence of Candidates’ Stances on College Affordability on Individual Vote Choice 28
Figure 20 The Influence of Candidates’ Stances on Primary and Secondary Education on Individual Vote Choice 29
Figure 21 The Influence of Candidates’ Stances on Criminal Justice on Individual Vote Choice 30
Figure 22 Interest in Politics 31
Figure 23 Pay Attention to Political Campaigns 32
Figure 24 Express Opinion about Politics on a Website, Blog, or on Social Media 33
Figure 25 Express Opinion about a Campaign or Candidate on a Website, Blog, or on Social Media 34
Figure 26 Read Newspaper for Information on Politics and Current Events 35
Figure 27 Watch TV News or Listen to the Radio for Information on Politics and Current Events 36
Figure 28 Read News on the Internet about Politics and Current Events 37
Figure 29 Watch the Presidential Debates 38
Figure 30 Watch the Vice-Presidential Debates 39
Figure 31 Watch the November 2016 Election Returns 40
Figure 32 Use the Internet to Research a Candidate’s Positions or View Speeches by a Candidate 41
Figure 33 Wear a Campaign Button or Shirt, Put a Campaign Sticker on the Car, or Place a Sign in the Window or in front of the Residence 42
Figure 34 Try to Talk to People and Explain Why They should Vote for or against One of the Parties or Candidates 43
Figure 35 Friend or Join a Group Related to a Presidential Candidate or Political Party on a Social Networking Site 44
Figure 36 Share Photos or Videos about a Campaign or Candidate on Social Media 45
Figure 37 Attend Any Political Meetings, Rallies, Speeches, Dinners, or Things Like That in Support of a Particular Candidate 46
Graduate College of Social Work University of Houston Students & the 2016 Election Hobby School of Public Affairs
iv
LIST OF FIGURES CONTINUED
Figure 38 Contribute Money to a Republican Candidate or Political Party 47
Figure 39 Contribute Money to a Democratic candidate or Political Party 48
Figure 40 Work or Volunteer for a Candidate or Party 49
Figure 41 Contact a Newspaper, Radio, or TV Talk Show to Express Opinion on an Issue 50
Figure 42 Contact or Visit Someone in Government Who Represents the Community 51
Figure 43 Participate in Political Activities such as Protests, Marches, or Demonstrations 52
Figure 44 Whether Parents or Guardians Have Ever Encouraged the Respondent to Vote 53
Figure 45 How Often the Parents Wanted to Hear the Respondent’s Opinions about Current Events and Politics, Even if They Differed from Their Own 54
Figure 46 Whether the Respondent’s Political Views Are Aligned with, not Aligned or Somewhere in between with the Parents 55
Figure 47 Party Identification 56
Figure 48 Political Ideology 57

Graduate College of Social Work University of Houston Students & the 2016 Election Hobby School of Public Affairs
v
LIST OF TABLES Table 1 Demographic Characteristics of the Respondents 6 Table 2 Reasons for Nonregistration 8 Table 3 Cross Tabulation Analysis of Vote Choice by Gender 14 Table 4 Cross Tabulation Analysis of Vote Choice by Race/Ethnicity 15

Graduate College of Social Work University of Houston Students & the 2016 Election Hobby School of Public Affairs
1
Ⅰ. Executive Summary Immediately after the 2016 presidential election, the Graduate College of Social Work and the Hobby School of Public Affairs conducted an online survey to better understand University of Houston undergraduates’ political participation. The questions were specifically designed to achieve the following:
• Understand voting behavior among young people such as turnout in the primary and general elections, vote choice and the importance of various issues in influencing individual voting decisions.
• Understand the extent to which young people demonstrate interest in politics such as
interest in politics, attention to political campaigns, and getting information about politics through various channels.
• Understand young people’s participation in campaign activities such as watching debates, persuading people to vote for or against a particular party or candidate, sharing photos or videos about a campaign or candidate on social media, attending political meetings or rallies, contributing money to a party or candidate, and working or volunteering for a party or candidate.
• Understand young people’s non-electoral participation such as contacting mass media to express an opinion, contacting government officials, and participating in political activities such as protests, marches, or demonstrations.
• Understand how young people interact with their parents with regard to voting and political discussion.
• Understand young people’s party identification and political ideology. A brief highlight of the survey results follows:
• A large majority of the respondents are registered to vote (80.6 percent) and cast ballots (79.5 percent of those registered) in the 2016 general election. By contrast, close to two-fifths of registered respondents (39.9 percent) voted in the primary elections.
• Among those registered voters who did not vote in the 2016 election, half of them (50
percent) identify the reason as having no time.
• Almost three-fourths of the respondents who voted (74.2 percent) in the general election voted for Hillary Clinton, whereas 17 percent voted for Donald Trump.

Graduate College of Social Work University of Houston Students & the 2016 Election Hobby School of Public Affairs
2
• More than four-fifths of the respondents view the candidates’ stances on the following issues as either very important or fairly important in influencing their voting decisions: treatment of racial, ethnic minorities (87.9 percent), economy (85.6 percent), health care (81.9 percent), and immigration (80.5 percent). In contrast, issues such as trade policy (62.1 percent), Social Security (56.9 percent), and minimum wage (56.7) were considered relatively less important in influencing students’ voting decision.
• A majority of the respondents are either very interested (20.6 percent) or somewhat interested (57.7 percent) in politics. Moreover, more than half of the respondents pay attention to political campaigns either very frequently (23.3 percent) or frequently (30.3 percent).
• The majority of the respondents did not express opinions about politics or a campaign or a candidate on a website, blog, or on social media during 2016. About half of the respondents (49.9 percent) did not express views about politics on a website, blog, or on social media, whereas slightly more than half of the respondents (51.7 percent) did not express views about a campaign or candidate on a website, blog, or on social media.
• The respondents use TV, radio and internet more frequently than newspapers to get information about politics and current events. In 2016, more than half of the respondents read news on the internet about politics and current events either very frequently (30 percent) or frequently (26.7 percent), whereas 46.6 percent of the respondents watch TV news or listen to the radio for information on politics and current events either very frequently or frequently. By contrast, only 20.4 percent of the respondents read newspapers for information on politics and current events either very frequently or frequently.
• A very large majority of the respondents (88.9 percent) watched the presidential debates, but only about one-fourth of the respondents (25.2 percent) watched the vice-presidential debates. Nearly four-fifths of the respondents (79.3 percent) watched the returns of the 2016 presidential election.
• Nearly half of the respondents used the internet to research a candidate’s positions or view speeches by a candidate either very frequently (24.3 percent) or frequently (24.0 percent) during 2016.
• The absolute majority of the respondents never engaged in the following campaign activities during the 2016 campaign: contributing money to a Republican candidate or political party (92.7 percent), working or volunteering for a candidate or party (90.2 percent), contributing money to a Democratic candidate or political party (88.6 percent), wearing a campaign button or shirt, putting a campaign sticker on the car, or placing a sign in the window or in front of one’ residence (81.2 percent), attending political meetings, rallies, speeches, or dinners (80.5 percent), friending or joining a group related to a presidential candidate or political party on a social networking site (70.0 percent),

Graduate College of Social Work University of Houston Students & the 2016 Election Hobby School of Public Affairs
3
and sharing photos or videos about a campaign or candidate on social media (56.0 percent).
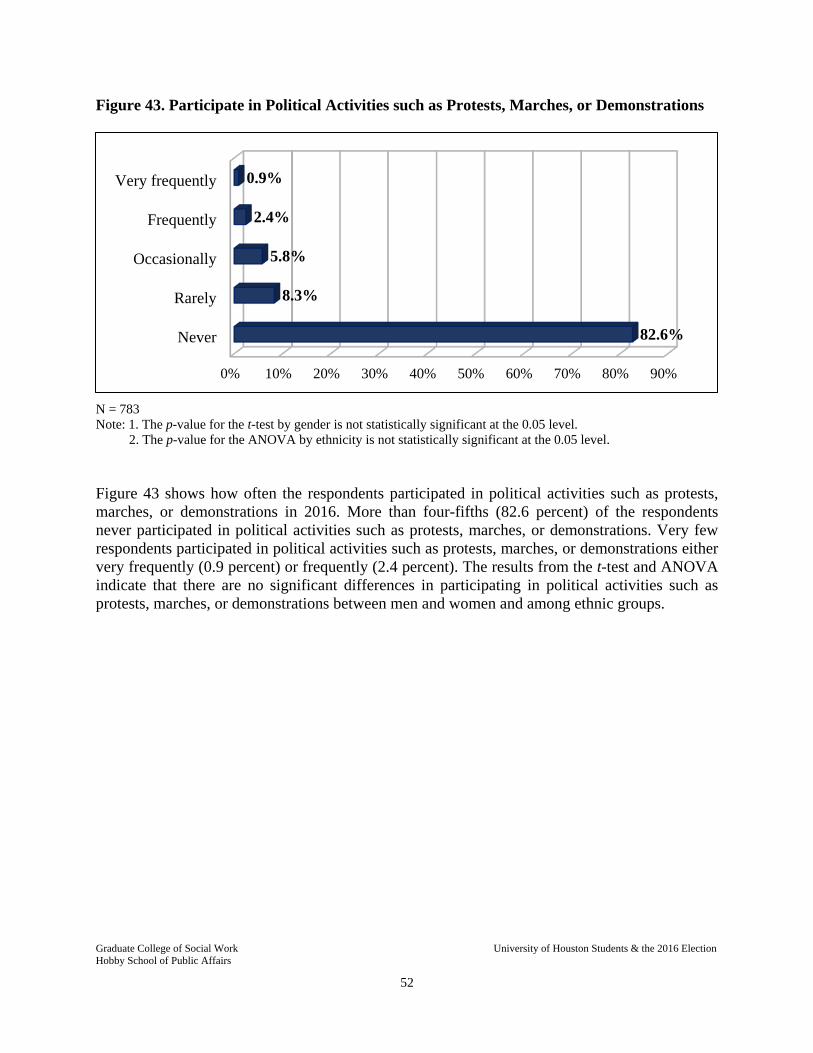
• An absolute majority of the respondents never engaged in the following non-electoral activities during the 2016 campaign: contacting a newspaper, radio, or TV talk show to express an opinion on an issue (89.4 percent), contacting or visiting someone in government who represents the community (85.4 percent), and participating in political activities such as protests, marches, or demonstrations (82.6 percent).
• Almost three-fourths of the respondents (74.3 percent) indicate that their parents or guardians have encouraged them to vote, and about two-fifths of the respondents (39 percent) express that, for the most part, their political views are aligned with their parents. Only 14.4 percent of the respondents report that their parents want to hear their opinions about current events and politics, even if they differ from their own.
• More than half of the respondents (55.5 percent) identify with the Democratic Party, whereas nearly one-fourth of the respondents (24.0 percent) identify with the Republican Party. Another 20.5 percent of the respondents self-identify as Independent.
• The majority of the respondents (44.8 percent) describe their political ideology as liberal, whereas about two-fifths of the respondents (39.4 percent) think of their political ideology as moderate. Only 15.8 percent of the respondents identify themselves as politically conservative.

Graduate College of Social Work University of Houston Students & the 2016 Election Hobby School of Public Affairs
4
I. Objective The University of Houston Graduate College of Social Work – Hobby School of Public Affairs survey was conducted to better understand political engagement among young people. Much of the understanding of young people’s participation derives from Election Day exit poll data and national surveys. While these data provide a good overview of how young people as a whole vote, this study looks at potential differences between diverse groups of college-attending young people in a contentious presidential election. Conducted at the University of Houston, the second most ethnically diverse major research university in the U.S., this study provides a unique look at how the most diverse generation of Americans votes and engages in other political activities. These data are important for several reasons:
• Millennials are the most diverse generation in U.S. history and the largest living generation. These data can help us better understand their political leanings as they become a larger presence in the electorate.
• Texas, a presidential election powerhouse with 38 electoral votes, is a majority urban state. These data help us better understand political participation and political orientation specifically among a diverse urban millennial population.
• These data also provide insight into the political issues of most importance to a diverse college population. Politicians, corporations, and community leaders who want to be seen as responsive to this group will benefit from these data. According to this study, the top three issues of students’ concern are the treatment of racial/ethnic minorities, the economy, and health care.
Ⅱ. Method of Analysis The questionnaire was designed by Suzanne Pritzker and Kenya Minott with the Graduate College of Social Work and Renée Cross with the Hobby School of Public Affairs. The data collection was completed by Chris Mainka with the Hobby School of Public Affairs’ Survey Research Institute1, and the analysis was completed by Ching-Hsing Wang and Kwok-Wai Wan with the Hobby School of Public Affairs. The online survey was administered by the Survey Research Institute from November 9-16, 2016, and was conducted using Computer Aided Web Interviewing (CAWI) software by Voxco2, a global provider of web interviewing software. The survey design used is a paging system, which minimizes scrolling and is frequently recommended for longer surveys.3 1 See http://www.uh.edu/class/hobby/cpp/polling/. 2 See www.voxco.com. 3 Couper, Mick P. Designing Effective Web Surveys. New York: Cambridge Press, 2008.

Graduate College of Social Work University of Houston Students & the 2016 Election Hobby School of Public Affairs
5
A total of 1321 University of Houston students enrolled in U.S. Government (POLS 1337), a state-mandated course that must be completed by all undergraduates regardless of major, were asked to complete the online survey in class. Close to 900 students (895) completed the survey, which results in a total response rate of 67.8 percent. Since 108 out of the 895 respondents were not citizens of the United States, we excluded these non-citizen respondents from this analysis so consequently the effective number of observations is 787. Using a sample size of 787, the margin of sampling error is +/- 3.45 percentage points at the 95 percent confidence level.4 In addition, the respondent’s race/ethnicity is representative of the overall undergraduate population without weighting.5 An analysis of the responses to the survey questions is found in the following section. We primarily report the results for single variable frequency analysis. According to the attribute of each variable, we also conducted the chi-square test, t-test or analysis of variance (ANOVA) by gender and race/ethnicity. The chi-square test is used to determine if there is a significant relationship between two categorical variables. The t-test is used to assess whether the means of two groups are statistically different from each other, whereas the ANOVA is used to determine whether the means of three or more groups are significantly different. However, for the sake of brevity, we do not report the detailed tables for the chi-square test, t-test or ANOVA, and simply state the test results in terms of significance.
4 For information about margin of sampling error, see the explanation by the American Association of Public Opinion Research at http://www.aapor.org/Education-Resources/Election-Polling-Resources/Margin-of-Sampling-Error-Credibility-Interval.aspx. 5 The undergraduate population by race/ethnicity for the fall 2016 semester was provided by the University of Houston’s Office of Institutional Research. See http://www.uh.edu/ir/.

Graduate College of Social Work University of Houston Students & the 2016 Election Hobby School of Public Affairs
6
Ⅲ. Findings Table 1. Demographic Characteristics of the Respondents Demographic characteristics N % Gender Female 375 48.2% Male 403 51.8% Age Under 25 748 95.0% Over 25 39 5.0% Race/Ethnicity Caucasian 195 24.8% Hispanic 208 26.4% African American 75 9.5% Asian American 210 26.7% Other 99 12.6% Academic Level Freshman 372 47.3% Sophomore 245 31.1% Junior 131 16.7% Senior 39 5.0% Table 1 reports the demographic characteristics of the respondents. Females comprise 48.2 percent of the respondents while 51.8 percent are male. Ninety-five percent of the respondents are under the age of 25 and nearly half of the respondents (47.3 percent) are freshmen. Slightly more than one-fourth of the respondents (26.7 percent) are Asian Americans, closely followed by Hispanics (26.4 percent) and whites (24.8 percent). African Americans form 9.5 percent of the respondents.

Graduate College of Social Work University of Houston Students & the 2016 Election Hobby School of Public Affairs
7
Figure 1. Voter Registration
N=787 Note: 1. The p-value for the chi-square test of the relationship between voter registration and gender is not
statistically significant at the 0.001 level. 2. The p-value for the chi-square test of the relationship between voter registration and ethnicity is
statistically significant at the 0.01 level. Figure 1 shows that slightly more than four-fifths of the respondents (80.6 percent) are registered to vote. In addition, we examine whether gender and ethnicity are associated with voter registration. The result from the chi-square test shows that gender has no influence on whether an individual is registered to vote. However, ethnicity is significantly associated with whether an individual is registered to vote. Specifically, whites have the highest voter registration rate (89.2 percent), whereas Asian Americans have the lowest voter registration rate (74.8 percent).
0%
10%
20%
30%
40%
50%
60%
70%
80%
90%
Yes No
80.6%
19.4%

Graduate College of Social Work University of Houston Students & the 2016 Election Hobby School of Public Affairs
8
Table 2. Reasons for Nonregistration
Reasons for Nonregistration Yes No
I did not have time to register 47 (30.7%)
106 (69.3%)
I recently moved, and am no longer registered
17 (11.1%)
136 (88.9%)
I forgot to register 45 (29.4%)
108 (70.6%)
My vote does not make a difference 18 (11.8%)
135 (88.2%)
I do not care about politics 20 (13.1%)
133 (86.9%)
The candidates did not speak to my interests
40 (26.1%)
113 (73.9%)
I did not know enough about the candidates or issues to vote
29 (19.0%)
124 (81.0%)
I am not eligible to vote in the U.S. 9 (5.9%)
144 (94.1%)
N=153 Table 2 shows the reasons the respondents report for not being registered to vote. Among the 153 respondents who are not registered to vote, 30.7 percent of them say that they did not have time to register and 29.4 percent of them forgot to register. It is noted that slightly more than one-fourth of the non-registered respondents (26.1 percent) indicate that they did not register because the candidates did not speak to their interests.

Graduate College of Social Work University of Houston Students & the 2016 Election Hobby School of Public Affairs
9
Figure 2. Voter Turnout in a 2016 Democratic or Republican Primary or Caucus for President
N=634 Note: 1. The p-value for the chi-square test of the relationship between voter turnout in the primary election and
gender is statistically significant at the 0.05 level. 2. The p-value for the chi-square test of the relationship between voter turnout in the primary election and
ethnicity is not statistically significant at the 0.05 level. Figure 2 demonstrates whether the respondents voted in a 2016 Democratic or Republican primary or caucus for president. Nearly two-fifths of the respondents (39.9 percent) voted in the primary elections. We examined whether gender and ethnicity are associated with voter turnout in the primary election, and the result from the chi-square test shows that gender is significantly associated with voter turnout in the primary election. In particular, men had a higher turnout rate in the primary elections than women (44.0 percent versus 36.0 percent). The result from the chi-square test shows no relationship between voter turnout in the primary elections and ethnicity.
0%
10%
20%
30%
40%
50%
60%
70%
Yes No
39.9%
60.1%

Graduate College of Social Work University of Houston Students & the 2016 Election Hobby School of Public Affairs
10
Figure 3. Vote Choice in the 2016 Primary Elections
N=253 Note: 1. The p-value for the chi-square test of the relationship between vote choice in the primary elections and
gender is not statistically significant at the 0.05 level. 2. The p-value for the chi-square test of the relationship between vote choice in the primary elections and
ethnicity is statistically significant at the 0.05 level. Figure 3 demonstrates that among those who voted in primary elections, 37.6 percent of the respondents voted for Sanders, whereas 36.4 percent voted for Clinton. The result distinguishes this group from Millennials nationally, where national data indicates that Clinton’s per-state average support in the primaries among this age group was 28 percent, with Sanders receiving a substantially higher level of youth support 6. In contrast, just 10.7 percent of this sample voted for Trump in the primaries. The result from the chi-square test shows no relationship between gender and students’ individual vote choices in the primary elections. However, ethnicity is significantly associated with vote choice in the primary elections. Specifically, African Americans were more likely to vote for Clinton in the primaries, whereas whites were more likely to vote for Sanders. Furthermore, Trump’s youth support in the primary elections mainly came from white students.
6 The Center for Information & Research on Civic Learning & Engagement. (2016). Hillary Clinton and young voters. http://civicyouth.org/wp-content/uploads/2016/08/Hillary-Clinton-and-Young-Voters.pdf.
0.0% 10.0% 20.0% 30.0% 40.0%
Other RepublicanBen Carson
Marco RubioJohn Kasich
Ted CruzDonald Trump
Other DemocratMartin O'Malley
Bernie SandersHillary Clinton
0.8%1.2%
4.0%1.6%
6.7%10.7%
0.8%0.4%
37.6%36.4%

Graduate College of Social Work University of Houston Students & the 2016 Election Hobby School of Public Affairs
11
Figure 4. Voter Turnout in the 2016 Presidential Election
N=634 Note: 1. The p-value for the chi-square test of the relationship between voter turnout in the presidential election and
gender is not statistically significant at the 0.05 level. 2. The p-value for the chi-square test of the relationship between voter turnout in the presidential election and
ethnicity is not statistically significant at the 0.05 level. Figure 4 presents whether the respondents voted in the 2016 presidential election. Nearly four-fifths of the respondents who are registered to vote (79.5 percent) voted in the presidential elections. When examining whether gender and ethnicity are associated with voter turnout in the presidential election, the results from the chi-square tests show that gender and ethnicity are not associated with voter turnout in the 2016 presidential election.
0%
10%
20%
30%
40%
50%
60%
70%
80%
Yes No
79.5%
20.5%

Graduate College of Social Work University of Houston Students & the 2016 Election Hobby School of Public Affairs
12
Figure 5. Reasons for Nonvoting
N=130 Figure 5 shows reasons registered respondents identified for why they did not vote in the 2016 presidential election. Among the 130 registered respondents who did not vote, half of them stated they did not have time to vote, and 17.7 percent of non-voters said they did not vote because no candidate excited them.
0% 10% 20% 30% 40% 50% 60%
No candidate excited me
There was no difference between the candidates
I did not know enough about the candidates or issuesto vote
The candidates did not speak to my interests
I do not care about politics
My vote does not make a difference
I forgot to vote
I did not have time to vote
17.7%
3.1%
7.7%
10.0%
1.5%
5.4%
4.6%
50.0%

Graduate College of Social Work University of Houston Students & the 2016 Election Hobby School of Public Affairs
13
Figure 6. Vote Choice in the 2016 Presidential Election
N=489 Figure 6 demonstrates that among those students who voted in the presidential election, nearly three-quarters (74.2 percent) voted for Clinton, whereas only 17 percent voted for Trump. This result is consistent with the national electoral outcome of Clinton receiving more votes from young voters than Trump, but shows a much larger gap between the two candidates than the nearly 20-point gap found in national exit poll and survey data7.
7 The Center for Information & Research on Civic Learning & Engagement. (2016). Millennials after 2016: Post-election poll analysis. http://civicyouth.org/wp-content/uploads/2017/03/Millennials-after-2016-Post-Election-Poll-Analysis.pdf
0% 10% 20% 30% 40% 50% 60% 70% 80%
Jill Stein
Gary Johnson
Donald Trump
Hillary Clinton
2.9%
5.9%
17.0%
74.2%

Graduate College of Social Work University of Houston Students & the 2016 Election Hobby School of Public Affairs
14
Table 3. Cross Tabulation Analysis of Vote Choice by Gender
Vote Choice Gender Total Male Female
Hillary Clinton 155 (65.7%)
205 (82.3%)
360 (74.2%)
Donald Trump 56 (23.7%)
26 (10.4%)
82 (16.9%)
Gary Johnson 19 (8.1%)
10 (4.0%)
29 (6.0%)
Jill Stein 6 (2.5%)
8 (3.2%)
14 (2.9%)
Total 236 (100.0%)
249 (100.0%)
485 (100.0%)
Note: The p-value for the chi-square test of the relationship between vote choice and gender is statistically significant at the 0.001 level.
Table 3 reports the result of a cross tabulation analysis of vote choice by gender. Slightly more than 82 percent (82.3) of the female respondents voted for Clinton, whereas 65.7 percent of the male respondents voted for Clinton. Additionally, 23.7 percent of the male respondents voted for Trump while only 10.4 percent of the female respondents voted for him. The results from the chi-square test showed that gender is significantly associated with vote choice.
Graduate College of Social Work University of Houston Students & the 2016 Election Hobby School of Public Affairs
15
Table 4. Cross Tabulation Analysis of Vote Choice by Race/Ethnicity
Vote Choice
Race/Ethnicity Total Caucasian Hispanic African
American Asian
American Other
Hillary Clinton
74 (56.1%)
112 (84.2%)
43 (93.5%)
97 (80.8%)
37 (63.8%)
363 (74.2%)
Donald Trump
46 (34.9%)
11 (8.3%)
0 (0.0%)
13 (10.8%)
13 (22.4%)
83 (17.0%)
Gary Johnson
9 (6.8%)
6 (4.5%)
2 (4.4%)
7 (5.8%)
5 (8.6%)
29 (5.9%)
Jill Stein 3 (2.3%)
4 (3.0%)
1 (2.2%)
3 (2.5%)
3 (5.2%)
14 (2.9%)
Total 132 (100%)
133 (100%)
46 (100%)
120 (100%)
58 (100%)
489 (100%)
Note: The p-value for the chi-square test of the relationship between vote choice and ethnicity is statistically significant at the 0.001 level.
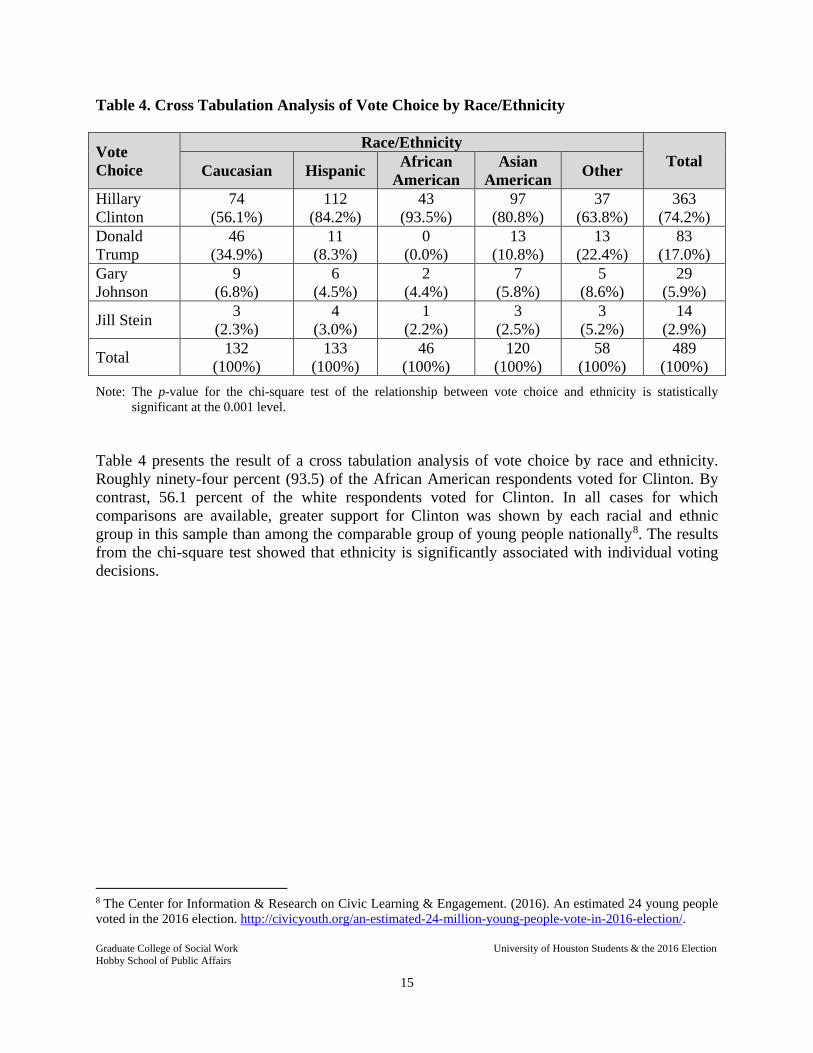
Table 4 presents the result of a cross tabulation analysis of vote choice by race and ethnicity. Roughly ninety-four percent (93.5) of the African American respondents voted for Clinton. By contrast, 56.1 percent of the white respondents voted for Clinton. In all cases for which comparisons are available, greater support for Clinton was shown by each racial and ethnic group in this sample than among the comparable group of young people nationally8. The results from the chi-square test showed that ethnicity is significantly associated with individual voting decisions.
8 The Center for Information & Research on Civic Learning & Engagement. (2016). An estimated 24 young people voted in the 2016 election. http://civicyouth.org/an-estimated-24-million-young-people-vote-in-2016-election/.
Graduate College of Social Work University of Houston Students & the 2016 Election Hobby School of Public Affairs
16
Figure 7. The Influence of Candidates’ Stances on Economy on Individual Vote Choice
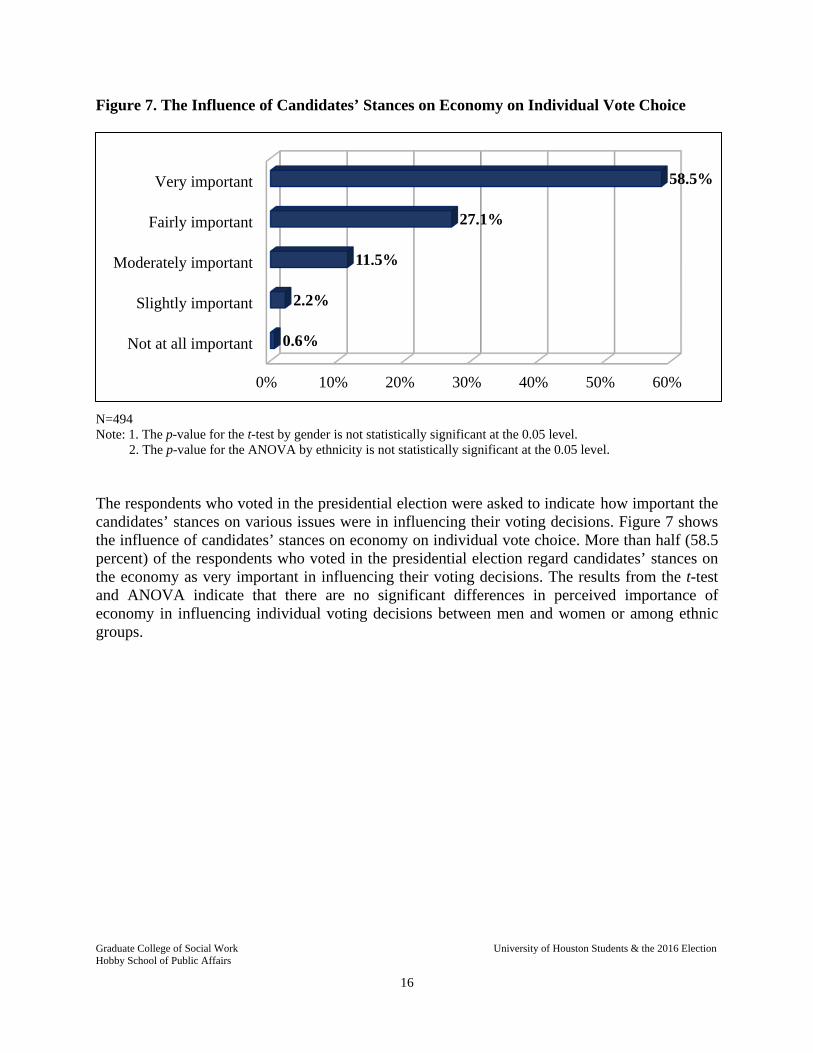
N=494 Note: 1. The p-value for the t-test by gender is not statistically significant at the 0.05 level. 2. The p-value for the ANOVA by ethnicity is not statistically significant at the 0.05 level. The respondents who voted in the presidential election were asked to indicate how important the candidates’ stances on various issues were in influencing their voting decisions. Figure 7 shows the influence of candidates’ stances on economy on individual vote choice. More than half (58.5 percent) of the respondents who voted in the presidential election regard candidates’ stances on the economy as very important in influencing their voting decisions. The results from the t-test and ANOVA indicate that there are no significant differences in perceived importance of economy in influencing individual voting decisions between men and women or among ethnic groups.
0% 10% 20% 30% 40% 50% 60%
Not at all important
Slightly important
Moderately important
Fairly important
Very important
0.6%
2.2%
11.5%
27.1%
58.5%

Graduate College of Social Work University of Houston Students & the 2016 Election Hobby School of Public Affairs
17
Figure 8. The Influence of Candidates’ Stances on Terrorism on Individual Vote Choice
N=487 Note: 1. The p-value for the t-test by gender is statistically significant at the 0.05 level. 2. The p-value for the ANOVA by ethnicity is not statistically significant at the 0.05 level. Figure 8 shows the influence of candidates’ stances on terrorism on their individual vote choices. More than two-fifths (45.4 percent) of the respondents who voted in the presidential election view candidates’ stances on terrorism as very important in influencing their voting decisions. The result from the t-test indicates that there is a significant difference in the perceived importance of terrorism in influencing one’s voting choice between men and women. Specifically, women view candidates’ stances on terrorism as more important in influencing their vote than do men. However, the ANOVA result shows that there is no significant difference in perceived importance of terrorism among ethnic groups. That is, different ethnic groups have similar perceptions about the influence of candidates’ stances on terrorism on their vote choices.
0% 10% 20% 30% 40% 50%
Not at all important
Slightly important
Moderately important
Fairly important
Very important
1.0%
8.0%
16.0%
29.6%
45.4%

Graduate College of Social Work University of Houston Students & the 2016 Election Hobby School of Public Affairs
18
Figure 9. The Influence of Candidates’ Stances on Foreign Policy on Individual Vote Choice
N=493 Note: 1. The p-value for the t-test by gender is not statistically significant at the 0.05 level. 2. The p-value for the ANOVA by ethnicity is not statistically significant at the 0.05 level. Figure 9 demonstrates the influence of candidates’ stances on foreign policy on individual vote choice. More than two-fifths (45.4 percent) of the respondents who voted in the presidential election thought of candidates’ stances on foreign policy as a very important influence on their voting decisions. The results from the t-test and ANOVA indicate that there are no significant differences in the perceived importance of foreign policy on voting decisions between men and women and among ethnic groups. That is, men and women and different ethnic groups have similar perceptions about the influence of candidates’ stances on foreign policy on their vote choices.
0% 10% 20% 30% 40% 50%
Not at all important
Slightly important
Moderately important
Fairly important
Very important
0.4%
3.9%
17.0%
33.3%
45.4%

Graduate College of Social Work University of Houston Students & the 2016 Election Hobby School of Public Affairs
19
Figure 10. The Influence of Candidates’ Stances on Health Care on Individual Vote Choice
N=494 Note: 1. The p-value for the t-test by gender is statistically significant at the 0.01 level. 2. The p-value for the ANOVA by ethnicity is statistically significant at the 0.01 level. Figure 10 shows the influence of candidates’ stances on health care on individual vote choice. More than half (53.4 percent) of the respondents who voted in the presidential election regard candidates’ stances on health care as a very important influence on their voting decision. When examining whether men and women and different ethnic groups have different perceptions about the importance of health care in influencing their voting decisions, the results from the t-test and ANOVA indicate that there are significant differences in perceived importance of health care between men and women and among ethnic groups. In particular, women view candidates’ stances on health care as more important in influencing their vote than men. Moreover, white students think of candidates’ stances on health care as less important in influencing their vote compared to the other ethnic groups.
0% 10% 20% 30% 40% 50% 60%
Not at all important
Slightly important
Moderately important
Fairly important
Very important
1.4%
4.1%
12.6%
28.5%
53.4%

Graduate College of Social Work University of Houston Students & the 2016 Election Hobby School of Public Affairs
20
Figure 11. The Influence of Candidates’ Stances on Gun Policy on Individual Vote Choice
N=493 Note: 1. The p-value for the t-test by gender is statistically significant at the 0.001 level. 2. The p-value for the ANOVA by ethnicity is not statistically significant at the 0.05 level. Figure 11 reports the influence of candidates’ stances on gun policy on individual vote choice. Nearly two-fifths (39 percent) of the respondents who voted in the presidential election regard candidates’ stances on gun policy as a very important influence on their voting decision. When examining whether men and women and different ethnic groups have different perceptions about the importance of gun policy in influencing their voting decisions, the result from the t-test indicates that there is a significant difference in perceived importance of gun policy between genders. Specifically, women view candidates’ stances on gun policy as a more important factor when voting than men. However, the ANOVA result shows that there is no significant difference in perceived importance of gun policy among ethnic groups.
0% 10% 20% 30% 40%
Not at all important
Slightly important
Moderately important
Fairly important
Very important
4.3%
11.0%
18.5%
27.4%
39.0%

Graduate College of Social Work University of Houston Students & the 2016 Election Hobby School of Public Affairs
21
Figure 12. The Influence of Candidates’ Stances on Social Security on Individual Vote Choice
N=494 Note: 1. The p-value for the t-test by gender is statistically significant at the 0.05 level. 2. The p-value for the ANOVA by ethnicity is not statistically significant at the 0.05 level. Figure 12 shows the influence of candidates’ stances on Social Security on individual vote choice. Slightly more than one-fourth of the respondents who voted in the presidential election (26.3 percent) think of candidates’ stances on Social Security as a very important aspect when making their voting decision. Regarding gender differences, the result from the t-test indicates that there is a significant difference in perceived importance of Social Security between men and women. Specifically, women view candidates’ stances on Social Security as more important than do men. However, the result from ANOVA shows that different ethnic groups have similar perceptions about the influence of candidates’ stances on Social Security on their vote choices.
0% 10% 20% 30% 40%
Not at all important
Slightly important
Moderately important
Fairly important
Very important
6.7%
12.8%
23.7%
30.6%
26.3%

Graduate College of Social Work University of Houston Students & the 2016 Election Hobby School of Public Affairs
22
Figure 13. The Influence of Candidates’ Stances on Supreme Court Appointments on Individual Vote Choice
N=489 Note: 1. The p-value for the t-test by gender is not statistically significant at the 0.05 level. 2. The p-value for the ANOVA by ethnicity is not statistically significant at the 0.05 level. Figure 13 reports the influence of candidates’ stances on Supreme Court appointments on individual vote choice. Slightly more than two-fifths (41.5 percent) of the respondents who voted in the presidential election think of candidates’ stances on Supreme Court appointments as a very important aspect to consider when making a voting decision. However, the results from the t-test and ANOVA indicate that That is, men and women and different ethnic groups have similar perceptions about the influence of candidates’ stances on Supreme Court appointments on their vote choices.
0% 10% 20% 30% 40% 50%
Not at all important
Slightly important
Moderately important
Fairly important
Very important
4.9%
9.4%
18.4%
25.8%
41.5%

Graduate College of Social Work University of Houston Students & the 2016 Election Hobby School of Public Affairs
23
Figure 14. The Influence of Candidates’ Stances on Treatment of Racial, Ethnic Minorities on Individual Vote Choice
N=486 Note: 1. The p-value for the t-test by gender is statistically significant at the 0.001 level. 2. The p-value for the ANOVA by ethnicity is statistically significant at the 0.001 level. Figure 14 demonstrates the influence of candidates’ stances on treatment of racial, ethnic minorities on individual vote choice. Nearly three-fourths of the respondents who voted in the presidential election (73.3 percent) regard candidates’ stances on treatment of racial, ethnic minorities as a very important influence on their voting decisions. The results from the t-test and ANOVA indicate that there are significant differences in perceived importance of treatment of racial, ethnic minorities between men and women and among ethnic groups. In particular, women view candidates’ stances on treatment of racial, ethnic minorities as more important when considering the candidates. Moreover, African Americans consider candidates’ stances on treatment of racial, ethnic minorities as more important when determining their vote choice compared to the other ethnic groups. By contrast, white respondents are least likely to view candidates’ stances on the treatment of racial and ethnic minorities as important in affecting their vote.
0% 10% 20% 30% 40% 50% 60% 70% 80%
Not at all important
Slightly important
Moderately important
Fairly important
Very important
1.0%
2.9%
8.2%
14.6%
73.3%

Graduate College of Social Work University of Houston Students & the 2016 Election Hobby School of Public Affairs
24
Figure 15. The Influence of Candidates’ Stances on Trade Policy on Individual Vote Choice
N=488 Note: 1. The p-value for the t-test by gender is statistically significant at the 0.01 level. 2. The p-value for the ANOVA by ethnicity is not statistically significant at the 0.05 level. Figure 15 shows the influence of candidates’ stances on trade policy on individual vote choice. Slightly more than one-fourth (27.5 percent) of the respondents who voted in the presidential election view candidates’ stances on trade policy as a very important influence on their voting decisions. The result from the t-test indicates that there is a significant difference in perceived importance of trade policy between men and women. Specifically, men view candidates’ stances on trade policy as a more important influence on their vote than women. Nevertheless, the result from ANOVA illustrates there is no significant difference in perceived importance of trade policy among ethnic groups.
0% 10% 20% 30% 40%
Not at all important
Slightly important
Moderately important
Fairly important
Very important
3.3%
8.0%
26.6%
34.6%
27.5%

Graduate College of Social Work University of Houston Students & the 2016 Election Hobby School of Public Affairs
25
Figure 16. The Influence of Candidates’ Stances on Environment on Individual Vote Choice
N=492 Note: 1. The p-value for the t-test by gender is statistically significant at the 0.01 level. 2. The p-value for the ANOVA by ethnicity is not statistically significant at the 0.05 level. Figure 16 demonstrates the influence of candidates’ stances on environment on individual vote choice. Nearly two-fifths (39.0 percent) of the respondents who voted in the presidential election view candidates’ stances on the environment as a very important influence on their voting decisions. The result from the t-test indicates that women view candidates’ stances on the environment as a more important influence on their vote than men. However, the result from ANOVA reports that there is no significant difference in perceived importance of the environment among ethnic groups; in other words, different ethnic groups have similar perceptions about the influence of candidates’ stances on environment on their vote choices.
0% 10% 20% 30% 40%
Not at all important
Slightly important
Moderately important
Fairly important
Very important
3.3%
8.3%
18.7%
30.7%
39.0%

Graduate College of Social Work University of Houston Students & the 2016 Election Hobby School of Public Affairs
26
Figure 17. The Influence of Candidates’ Stances on Minimum Wage on Individual Vote Choice
N=496 Note: 1. The p-value for the t-test by gender is statistically significant at the 0.001 level. 2. The p-value for the ANOVA by ethnicity is statistically significant at the 0.01 level. Figure 17 shows the influence of candidates’ stances on minimum wage on individual vote choice. Approximately three-tenths (30.7 percent) of the respondents who voted in the presidential election regard candidates’ stances on minimum wage as a very important influence on their voting decisions. The results from the t-test and ANOVA indicate that there are significant differences in perceived importance of minimum wage between men and women and among ethnic groups. In particular, women view candidates’ stances on minimum wage as more important to influence their vote than men. Whites view candidates’ stances on minimum wage as less important in affecting their vote choices compared to the other ethnic groups.
0% 10% 20% 30% 40%
Not at all important
Slightly important
Moderately important
Fairly important
Very important
5.9%
14.3%
23.2%
26.0%
30.7%
Graduate College of Social Work University of Houston Students & the 2016 Election Hobby School of Public Affairs
27
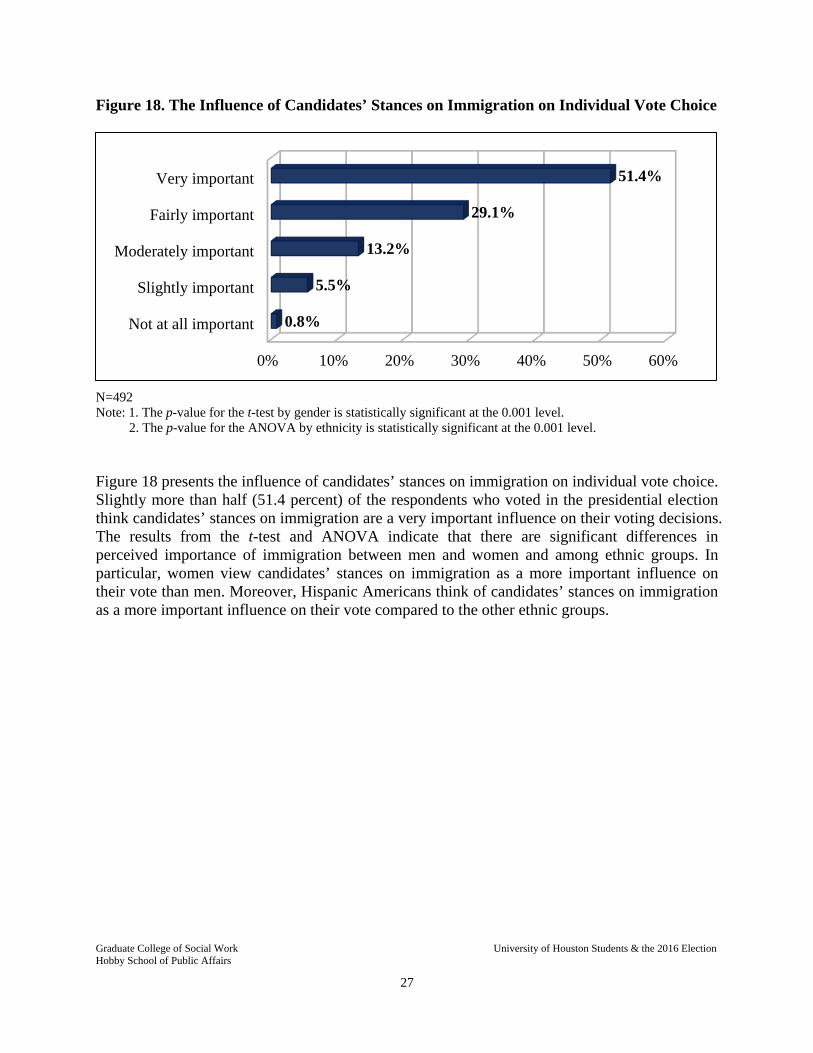
Figure 18. The Influence of Candidates’ Stances on Immigration on Individual Vote Choice
N=492 Note: 1. The p-value for the t-test by gender is statistically significant at the 0.001 level. 2. The p-value for the ANOVA by ethnicity is statistically significant at the 0.001 level. Figure 18 presents the influence of candidates’ stances on immigration on individual vote choice. Slightly more than half (51.4 percent) of the respondents who voted in the presidential election think candidates’ stances on immigration are a very important influence on their voting decisions. The results from the t-test and ANOVA indicate that there are significant differences in perceived importance of immigration between men and women and among ethnic groups. In particular, women view candidates’ stances on immigration as a more important influence on their vote than men. Moreover, Hispanic Americans think of candidates’ stances on immigration as a more important influence on their vote compared to the other ethnic groups.
0% 10% 20% 30% 40% 50% 60%
Not at all important
Slightly important
Moderately important
Fairly important
Very important
0.8%
5.5%
13.2%
29.1%
51.4%
Graduate College of Social Work University of Houston Students & the 2016 Election Hobby School of Public Affairs
28
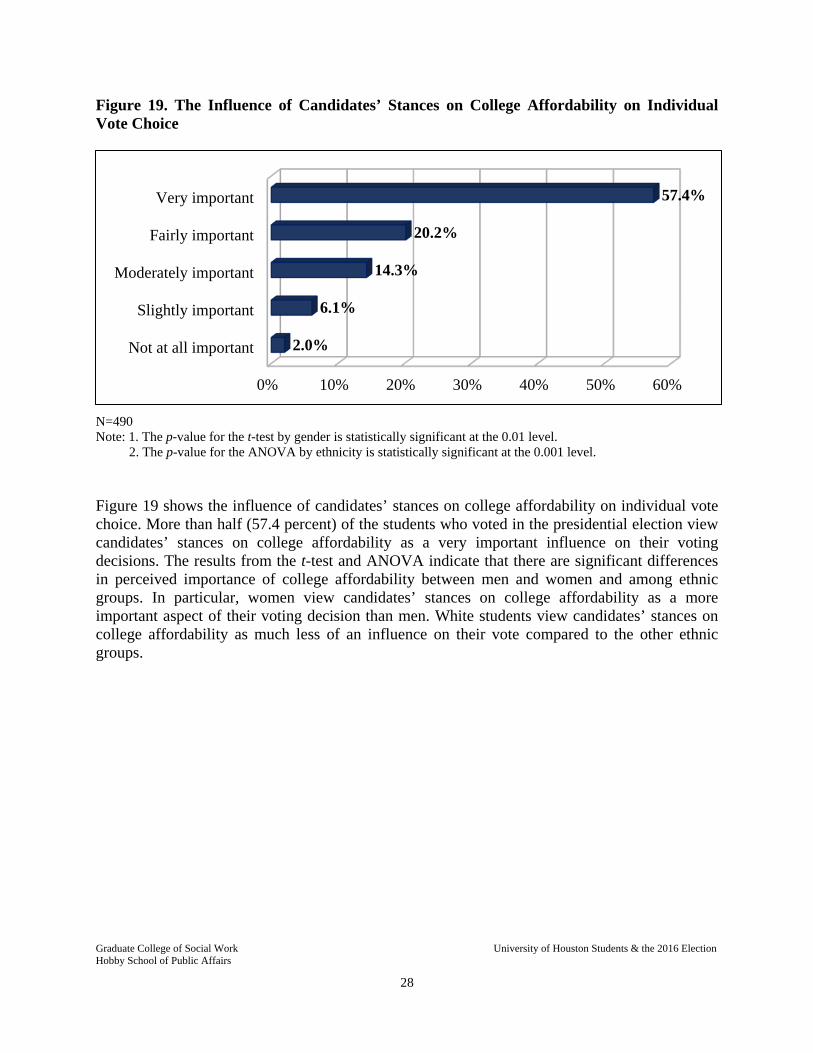
Figure 19. The Influence of Candidates’ Stances on College Affordability on Individual Vote Choice
N=490 Note: 1. The p-value for the t-test by gender is statistically significant at the 0.01 level. 2. The p-value for the ANOVA by ethnicity is statistically significant at the 0.001 level. Figure 19 shows the influence of candidates’ stances on college affordability on individual vote choice. More than half (57.4 percent) of the students who voted in the presidential election view candidates’ stances on college affordability as a very important influence on their voting decisions. The results from the t-test and ANOVA indicate that there are significant differences in perceived importance of college affordability between men and women and among ethnic groups. In particular, women view candidates’ stances on college affordability as a more important aspect of their voting decision than men. White students view candidates’ stances on college affordability as much less of an influence on their vote compared to the other ethnic groups.
0% 10% 20% 30% 40% 50% 60%
Not at all important
Slightly important
Moderately important
Fairly important
Very important
2.0%
6.1%
14.3%
20.2%
57.4%

Graduate College of Social Work University of Houston Students & the 2016 Election Hobby School of Public Affairs
29
Figure 20. The Influence of Candidates’ Stances on Primary and Secondary Education on Individual Vote Choice
N=492 Note: 1. The p-value for the t-test by gender is statistically significant at the 0.05 level. 2. The p-value for the ANOVA by ethnicity is statistically significant at the 0.001 level. Figure 20 reports the influence of candidates’ stances on primary and secondary education on individual vote choice. More than two-fifths (44.7 percent) of the respondents who voted in the presidential election regard candidates’ stances on primary and secondary education as a very important influence on their voting decisions. The results from the t-test and ANOVA indicate that there are significant differences in perceived importance of primary and secondary education between men and women and among ethnic groups. In particular, women view candidates’ stances on primary and secondary education as a more important influence on their vote than men. Hispanic Americans think of candidates’ stances on primary and secondary education as a more important influence on their voting decisions compared to the other ethnic groups, while white respondents are least likely to view candidates’ stances on primary and secondary education as important in affecting their vote.
0% 10% 20% 30% 40% 50%
Not at all important
Slightly important
Moderately important
Fairly important
Very important
1.8%
7.9%
17.3%
28.3%
44.7%
Graduate College of Social Work University of Houston Students & the 2016 Election Hobby School of Public Affairs
30
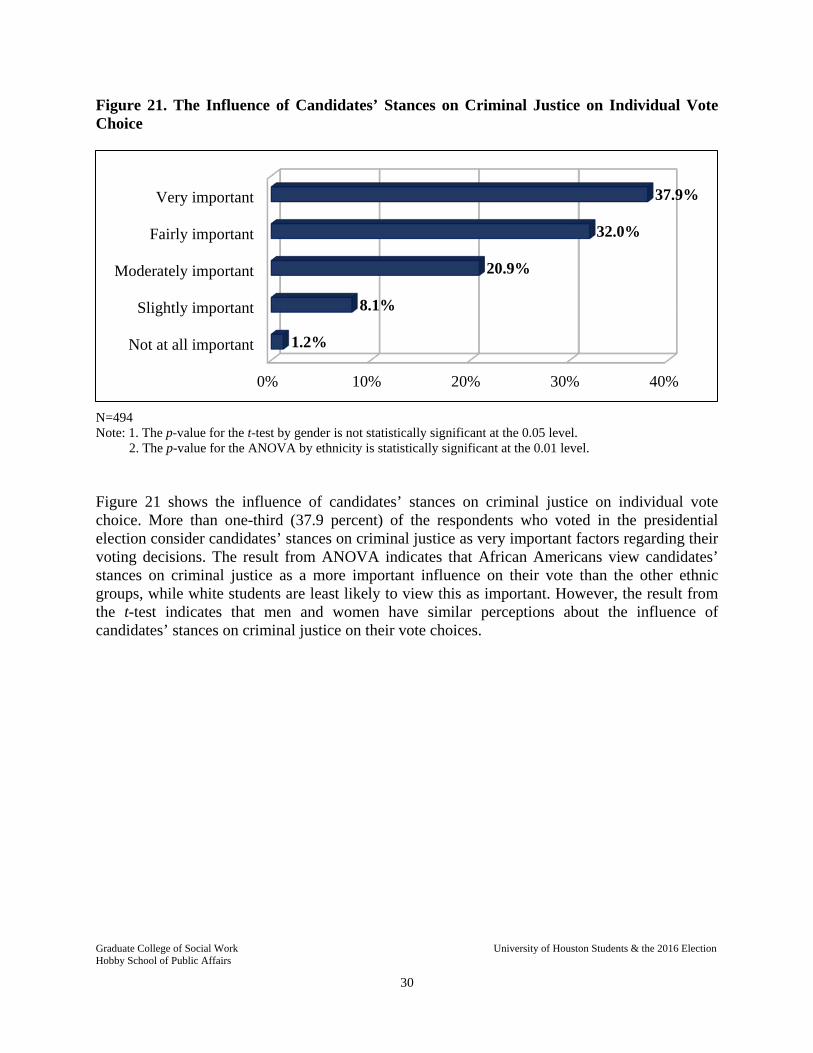
Figure 21. The Influence of Candidates’ Stances on Criminal Justice on Individual Vote Choice
N=494 Note: 1. The p-value for the t-test by gender is not statistically significant at the 0.05 level. 2. The p-value for the ANOVA by ethnicity is statistically significant at the 0.01 level. Figure 21 shows the influence of candidates’ stances on criminal justice on individual vote choice. More than one-third (37.9 percent) of the respondents who voted in the presidential election consider candidates’ stances on criminal justice as very important factors regarding their voting decisions. The result from ANOVA indicates that African Americans view candidates’ stances on criminal justice as a more important influence on their vote than the other ethnic groups, while white students are least likely to view this as important. However, the result from the t-test indicates that men and women have similar perceptions about the influence of candidates’ stances on criminal justice on their vote choices.
0% 10% 20% 30% 40%
Not at all important
Slightly important
Moderately important
Fairly important
Very important
1.2%
8.1%
20.9%
32.0%
37.9%

Graduate College of Social Work University of Houston Students & the 2016 Election Hobby School of Public Affairs
31
Figure 22. Interest in Politics
N=782 Note: 1. The p-value for the t-test by gender is statistically significant at the 0.05 level. 2. The p-value for the ANOVA by ethnicity is statistically significant at the 0.05 level. Figure 22 reports the respondents’ interest in politics. About one-fifth (20.6 percent) of the respondents are very interested in politics, whereas nearly three-fifths (57.7 percent) of the respondents are somewhat interested in politics. The results from the t-test and ANOVA indicate that there are significant differences in interest in politics between men and women and among ethnic groups. In particular, men are more interested in politics than women. White students are more interested in politics compared to the other ethnic groups, whereas African Americans exhibit the lowest level of interest in politics.
0% 10% 20% 30% 40% 50% 60%
Not at all interested
Not very interested
Somewhat interested
Very interested
3.6%
18.2%
57.7%
20.6%
Graduate College of Social Work University of Houston Students & the 2016 Election Hobby School of Public Affairs
32
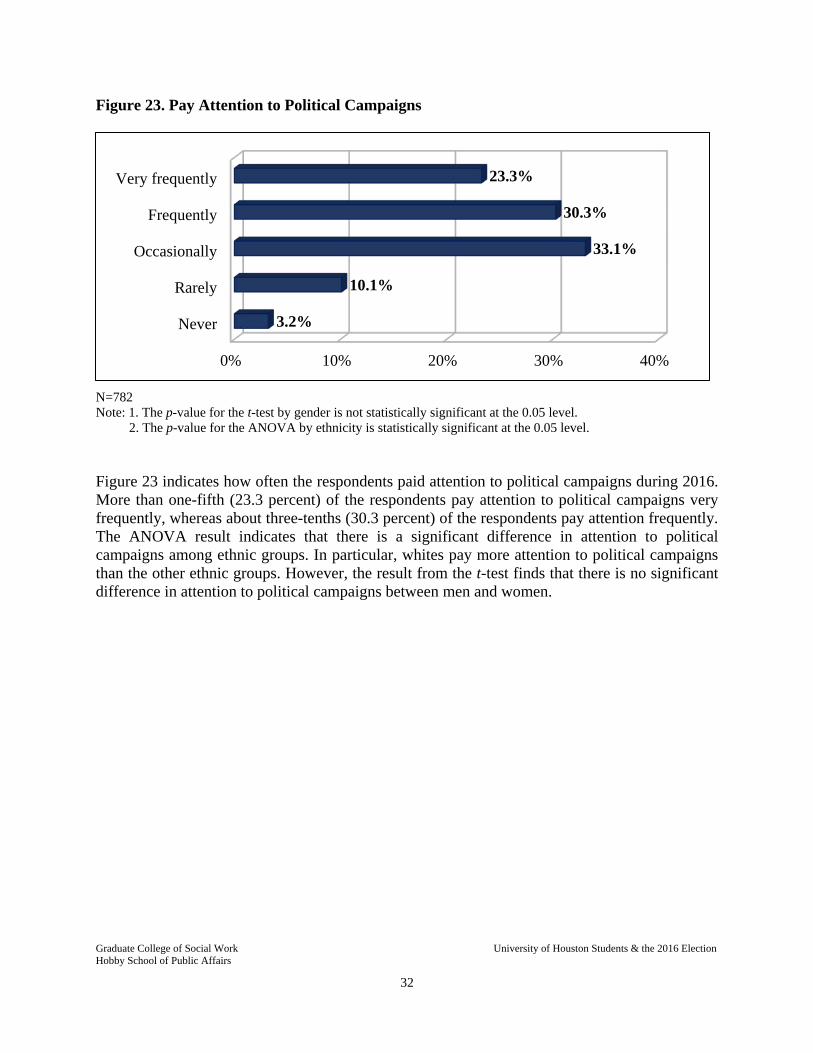
Figure 23. Pay Attention to Political Campaigns
N=782 Note: 1. The p-value for the t-test by gender is not statistically significant at the 0.05 level. 2. The p-value for the ANOVA by ethnicity is statistically significant at the 0.05 level. Figure 23 indicates how often the respondents paid attention to political campaigns during 2016. More than one-fifth (23.3 percent) of the respondents pay attention to political campaigns very frequently, whereas about three-tenths (30.3 percent) of the respondents pay attention frequently. The ANOVA result indicates that there is a significant difference in attention to political campaigns among ethnic groups. In particular, whites pay more attention to political campaigns than the other ethnic groups. However, the result from the t-test finds that there is no significant difference in attention to political campaigns between men and women.
0% 10% 20% 30% 40%
Never
Rarely
Occasionally
Frequently
Very frequently
3.2%
10.1%
33.1%
30.3%
23.3%

Graduate College of Social Work University of Houston Students & the 2016 Election Hobby School of Public Affairs
33
Figure 24. Express Opinion about Politics on a Website, Blog, or on Social Media
N=781 Note: 1. The p-value for the t-test by gender is statistically significant at the 0.001 level. 2. The p-value for the ANOVA by ethnicity is not statistically significant at the 0.05 level. Figure 24 reports how often the respondents expressed their views about politics on a website, blog, or on social media such as Twitter or Facebook during 2016. Approximately half (49.9 percent) of the respondents never expressed their opinions about politics on a website, blog, or social media. By contrast, only one-tenth (10.2 percent) of the respondents express their opinions about politics on a website, blog, or social media very frequently. The result from the t-test indicates that women express their views about politics on a website, blog, or on social media more frequently than men. However, the result from ANOVA demonstrates that different ethnic groups have similar frequencies of expressing opinion about politics on a website, blog, or on social media.
0% 10% 20% 30% 40% 50%
Never
Rarely
Occasionally
Frequently
Very frequently
49.9%
16.8%
14.3%
8.7%
10.2%
Graduate College of Social Work University of Houston Students & the 2016 Election Hobby School of Public Affairs
34
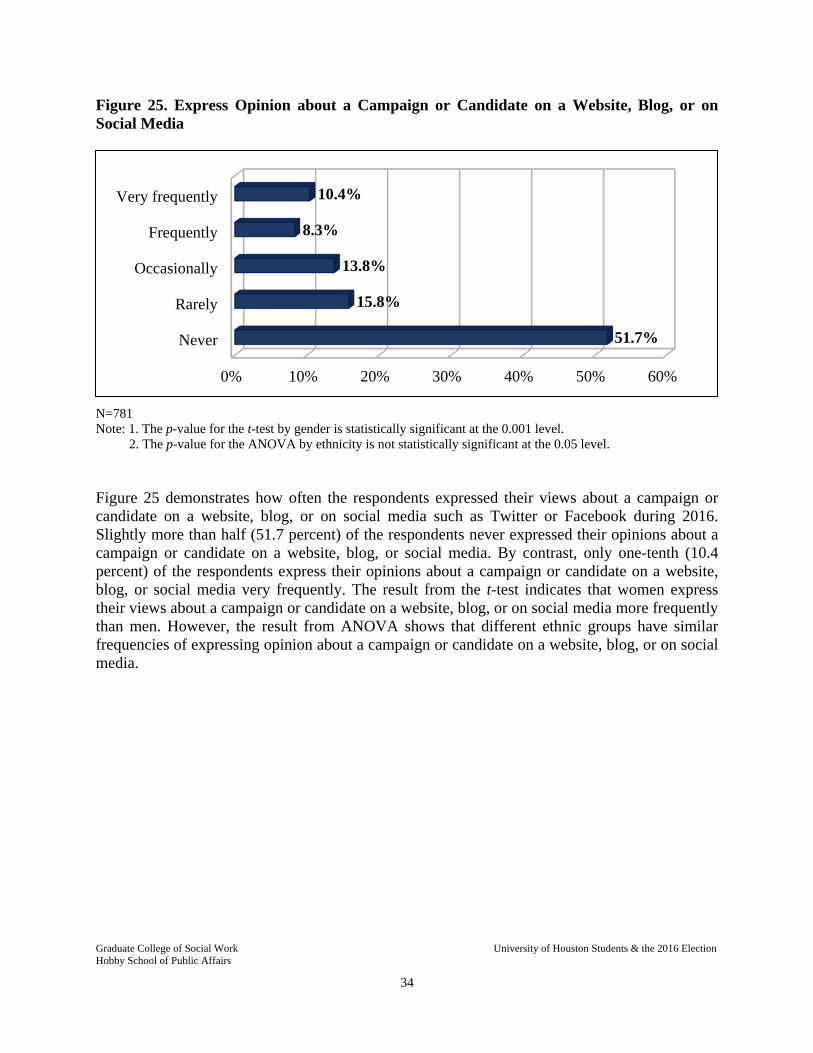
Figure 25. Express Opinion about a Campaign or Candidate on a Website, Blog, or on Social Media
N=781 Note: 1. The p-value for the t-test by gender is statistically significant at the 0.001 level. 2. The p-value for the ANOVA by ethnicity is not statistically significant at the 0.05 level. Figure 25 demonstrates how often the respondents expressed their views about a campaign or candidate on a website, blog, or on social media such as Twitter or Facebook during 2016. Slightly more than half (51.7 percent) of the respondents never expressed their opinions about a campaign or candidate on a website, blog, or social media. By contrast, only one-tenth (10.4 percent) of the respondents express their opinions about a campaign or candidate on a website, blog, or social media very frequently. The result from the t-test indicates that women express their views about a campaign or candidate on a website, blog, or on social media more frequently than men. However, the result from ANOVA shows that different ethnic groups have similar frequencies of expressing opinion about a campaign or candidate on a website, blog, or on social media.
0% 10% 20% 30% 40% 50% 60%
Never
Rarely
Occasionally
Frequently
Very frequently
51.7%
15.8%
13.8%
8.3%
10.4%

Graduate College of Social Work University of Houston Students & the 2016 Election Hobby School of Public Affairs
35
Figure 26. Read Newspaper for Information on Politics and Current Events
N=783 Note: 1. The p-value for the t-test by gender is not statistically significant at the 0.05 level. 2. The p-value for the ANOVA by ethnicity is not statistically significant at the 0.05 level. Figure 26 illustrates how often the respondents read a newspaper for information on politics and current events during 2016. Slightly more than two-fifths (42.0 percent) of the respondents never read a newspaper for information on politics and current events. By contrast, about one-tenth (9.8 percent) of the respondents read newspapers for information on politics and current events very frequently. The results from the t-test and ANOVA indicate that there are no significant differences in reading newspapers for information about politics and current events between men and women and among ethnic groups.
0% 10% 20% 30% 40% 50%
Never
Rarely
Occasionally
Frequently
Very frequently
42.0%
14.3%
23.2%
10.6%
9.8%

Graduate College of Social Work University of Houston Students & the 2016 Election Hobby School of Public Affairs
36
Figure 27. Watch TV News or Listen to the Radio for Information on Politics and Current Events
N=779 Note: 1. The p-value for the t-test by gender is not statistically significant at the 0.05 level. 2. The p-value for the ANOVA by ethnicity is not statistically significant at the 0.05 level. Figure 27 demonstrates how often the respondents watched TV news or listened to the radio for information on politics and current events during 2016. Approximately one-fifth (20.9 percent) of the respondents watch TV news or listen to the radio for information on politics and current events very frequently, whereas about one quarter (25.7 percent) of the respondents do that frequently. The results from the t-test and ANOVA indicate that there are no significant differences in watching TV news or listening to the radio for information on politics and current events between men and women and among ethnic groups.
0% 10% 20% 30%
Never
Rarely
Occasionally
Frequently
Very frequently
12.6%
10.9%
29.9%
25.7%
20.9%

Graduate College of Social Work University of Houston Students & the 2016 Election Hobby School of Public Affairs
37
Figure 28. Read News on the Internet about Politics and Current Events
N=780 Note: 1. The p-value for the t-test by gender is not statistically significant at the 0.05 level. 2. The p-value for the ANOVA by ethnicity is statistically significant at the 0.05 level. Figure 28 shows how often the respondents read news on the internet about politics and current events during 2016. Three-tenths (30.0 percent) of the respondents read news on the internet about politics and current events very frequently, whereas slightly more than one-fourth (26.7 percent) of the respondents do so frequently. The ANOVA result indicates that there is a significant difference in reading news on the internet about politics and current events among ethnic groups. In particular, white students read news on the internet about politics and current events more frequently than the other ethnic groups. The result from the t-test finds no significant difference in reading news on the internet about politics and current events among ethnic groups or between men and women.
0% 10% 20% 30%
Never
Rarely
Occasionally
Frequently
Very frequently
9.0%
8.1%
26.3%
26.7%
30.0%

Graduate College of Social Work University of Houston Students & the 2016 Election Hobby School of Public Affairs
38
Figure 29. Watch the Presidential Debates
N=785 Note: 1. The p-value for the chi-square test of the relationship between watching the presidential debates and gender
is statistically significant at the 0.05 level. 2. The p-value for the chi-square test of the relationship between watching the presidential debates and
ethnicity is not statistically significant at the 0.05 level. Figure 29 shows whether the respondents watched any of the presidential debates. Up to 88.9 percent of the respondents watched the presidential debates. The result of the chi-square test shows that gender is related to watching the presidential debates. A total of 91.3 percent of the male respondents indicate that they watched the presidential debates while only 86.1 percent of the female respondents did likewise. On the other hand, the result from the chi-square test shows that race and ethnicity had no influence on whether an individual watched the presidential debates.
0%
10%
20%
30%
40%
50%
60%
70%
80%
90%
Yes No
88.9%
11.1%

Graduate College of Social Work University of Houston Students & the 2016 Election Hobby School of Public Affairs
39
Figure 30. Watch the Vice-Presidential Debate
N=783 Note: 1. The p-value for the chi-square test of the relationship between watching the vice-presidential debate and
gender is statistically significant at the 0.001 level. 2. The p-value for the chi-square test of the relationship between watching the vice-presidential debate and
ethnicity is not statistically significant at the 0.05 level. Figure 30 presents whether the respondents watched the vice-presidential debate. Only one-fourth (25.2 percent) of the respondents watched the vice-presidential debate. The result of the chi-square test shows that gender is related to watching the vice-presidential debate. A total of 31.5 percent of the male respondents indicate that they watched the vice-presidential debate while only 17.9 percent of the female respondents did likewise. On the other hand, there is no relationship between ethnicity and which students watched the vice-presidential debate.
0%
10%
20%
30%
40%
50%
60%
70%
80%
Yes No
25.2%
74.8%

Graduate College of Social Work University of Houston Students & the 2016 Election Hobby School of Public Affairs
40
Figure 31. Watch the November 2016 Election Returns
N=743 Note: 1. The p-value for the chi-square test of the relationship between watching the November 2016 election
returns and gender is statistically significant at the 0.001 level. 2. The p-value for the chi-square test of the relationship between watching the November 2016 election
returns and ethnicity is not statistically significant at the 0.05 level. Figure 31 demonstrates whether the respondents watched the November 2016 election returns. Close to 80 percent (79.3 percent) of the respondents watched the November 2016 election returns. The result of the chi-square test shows that gender is related to watching the November 2016 election returns. A total of 84.7 percent of the male respondents indicate that they watched the November 2016 election returns while only 72.8 percent of the female respondents did likewise. On the other hand, there is no relationship between ethnicity and watching the November 2016 election returns for the respondents.
0%
10%
20%
30%
40%
50%
60%
70%
80%
Yes No
79.3%
20.7%

Graduate College of Social Work University of Houston Students & the 2016 Election Hobby School of Public Affairs
41
Figure 32. Use the Internet to Research a Candidate’s Positions or View Speeches by a Candidate
N = 782 Note: 1. The p-value for the t-test by gender is not statistically significant at the 0.05 level. 2. The p-value for the ANOVA by ethnicity is not statistically significant at the 0.05 level. Figure 32 shows how often the respondents used the internet to research a candidate’s positions or view speeches by a candidate in 2016. A total of 30.3 percent of the respondents indicate that they occasionally undertake these activities. Another 24.3 percent indicate that they do so very frequently. The results from the t-test and ANOVA indicate that there are no significant differences in using the internet to research a candidate’s positions or view speeches by a candidate between men and women and among ethnic groups.
0% 10% 20% 30% 40%
Never
Rarely
Occasionally
Frequently
Very frequently
8.3%
13.0%
30.3%
24.0%
24.3%

Graduate College of Social Work University of Houston Students & the 2016 Election Hobby School of Public Affairs
42
Figure 33. Wear a Campaign Button or Shirt, Put a Campaign Sticker on the Car, or Place a Sign in the Window or in front of the Residence
N=782 Note: 1. The p-value for the t-test by gender is not statistically significant at the 0.05 level. 2. The p-value for the ANOVA by ethnicity is not statistically significant at the 0.05 level. Figure 33 shows how often the respondents wore a campaign button or shirt, put a campaign sticker on their cars, or placed a sign in their windows or in front of their residence in 2016. Slightly more than 80 percent (81.2 percent) of the respondents never wore a campaign button or shirt, put a campaign sticker on their cars, or placed a sign in their windows or in front of their residence. By contrast, only 4.6 percent of respondent did so very frequently. The results from the t-test and ANOVA indicate that there are no significant differences in undertaking these activities between men and women and among ethnic groups.
0% 10% 20% 30% 40% 50% 60% 70% 80% 90%
Never
Rarely
Occasionally
Frequently
Very frequently
81.2%
7.2%
5.5%
1.5%
4.6%

Graduate College of Social Work University of Houston Students & the 2016 Election Hobby School of Public Affairs
43
Figure 34. Try to Talk to People and Explain Why They should Vote for or against One of the Parties or Candidates
N = 781 Note: 1. The p-value for the t-test by gender is statistically significant at the 0.05 level. 2. The p-value for the ANOVA by ethnicity is not statistically significant at the 0.05 level. Figure 34 shows how often the respondents tried to talk to people and explain why they should vote for or against one of the parties or candidates in 2016. More than one-fourth (28.0 percent) of the respondents never tried to talk to people and explain why they should vote for or against one of the parties or candidates. By contrast, one-tenth (10 percent) of the respondents tried to talk to people and explain why they should vote for or against one of the parties or candidates very frequently. The t-test result indicates that women try to talk to people and explain why they should vote for or against one of the parties or candidates more frequently than do men. However, the ANOVA result indicates that there is no significant difference among ethnic groups in attempts to talk to people and explain why they should vote for or against one of the parties or candidates.
0% 10% 20% 30%
Never
Rarely
Occasionally
Frequently
Very frequently
28.0%
22.5%
24.2%
15.2%
10.0%

Graduate College of Social Work University of Houston Students & the 2016 Election Hobby School of Public Affairs
44
Figure 35. Friend or Join a Group Related to a Presidential Candidate or Political Party on a Social Networking Site
N = 780 Note: 1. The p-value for the t-test by gender is not statistically significant at the 0.05 level. 2. The p-value for the ANOVA by ethnicity is not statistically significant at the 0.05 level. Figure 35 demonstrates how often the respondents “friended” or joined a group related to a presidential candidate or political party on a social networking site such as Facebook during 2016. Seven-tenths of the respondents (70 percent) never friended or joined a group related to a presidential candidate or political party on a social networking site. By contrast, only 5.9 percent of the respondents very frequently friended or joined a group related to a presidential candidate or political party on a social networking site. The results from the t-test and ANOVA indicate that there are no significant differences in friending or joining a group related to a presidential candidate or political party on a social networking site between men and women or among ethnic groups.
0% 10% 20% 30% 40% 50% 60% 70%
Never
Rarely
Occasionally
Frequently
Very frequently
70.0%
10.8%
8.5%
4.9%
5.9%

Graduate College of Social Work University of Houston Students & the 2016 Election Hobby School of Public Affairs
45
Figure 36. Share Photos or Videos about a Campaign or Candidate on Social Media
N = 782 Note: 1. The p-value for the t-test by gender is statistically significant at the 0.001 level. 2. The p-value for the ANOVA by ethnicity is not statistically significant at the 0.05 level. Figure 36 reports how often the respondents shared photos or videos about a campaign or candidate on social media such as Twitter or Facebook in 2016. More than half (56.0 percent) of the respondents never shared photos or videos about a campaign or candidate on social media. By contrast, only 8.1 percent of the respondents very frequently shared photos or videos about a campaign or candidate on social media. The result from the t-test indicates that women share photos or videos about a campaign or candidate on social media more frequently than do men. The result from ANOVA demonstrates that there is no significant difference in sharing photos or videos about a campaign or candidate on social media among ethnic groups.
0% 10% 20% 30% 40% 50% 60%
Never
Rarely
Occasionally
Frequently
Very frequently
56.0%
14.8%
12.9%
8.2%
8.1%
Graduate College of Social Work University of Houston Students & the 2016 Election Hobby School of Public Affairs
46
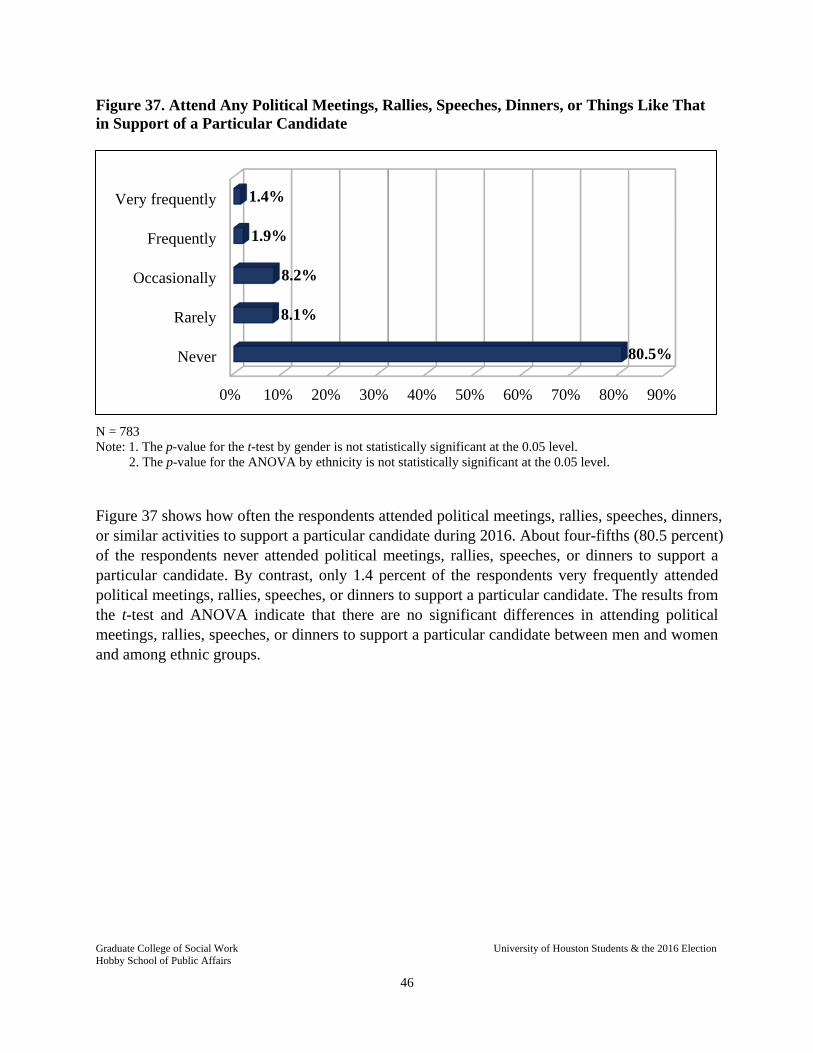
Figure 37. Attend Any Political Meetings, Rallies, Speeches, Dinners, or Things Like That in Support of a Particular Candidate
N = 783 Note: 1. The p-value for the t-test by gender is not statistically significant at the 0.05 level. 2. The p-value for the ANOVA by ethnicity is not statistically significant at the 0.05 level. Figure 37 shows how often the respondents attended political meetings, rallies, speeches, dinners, or similar activities to support a particular candidate during 2016. About four-fifths (80.5 percent) of the respondents never attended political meetings, rallies, speeches, or dinners to support a particular candidate. By contrast, only 1.4 percent of the respondents very frequently attended political meetings, rallies, speeches, or dinners to support a particular candidate. The results from the t-test and ANOVA indicate that there are no significant differences in attending political meetings, rallies, speeches, or dinners to support a particular candidate between men and women and among ethnic groups.
0% 10% 20% 30% 40% 50% 60% 70% 80% 90%
Never
Rarely
Occasionally
Frequently
Very frequently
80.5%
8.1%
8.2%
1.9%
1.4%

Graduate College of Social Work University of Houston Students & the 2016 Election Hobby School of Public Affairs
47
Figure 38. Contribute Money to a Republican Candidate or Political Party
N = 783 Note: 1. The p-value for the t-test by gender is statistically significant at the 0.01 level. 2. The p-value for the ANOVA by ethnicity is not statistically significant at the 0.05 level. Figure 38 demonstrates how often the respondents contributed money to a Republican candidate or political party in 2016. Of respondents, 92.7 percent never gave money to a Republican candidate or political party. Very few respondents contributed money to a Republican candidate or political party either very frequently (0.5 percent) or frequently (1.0 percent). The result from the t-test indicates that men contribute money to a Republican candidate or political party more frequently than women. However, the result from ANOVA demonstrates that there is no significant difference in contributing money to a Republican candidate or political party among ethnic groups.
0% 10% 20% 30% 40% 50% 60% 70% 80% 90% 100%
Never
Rarely
Occasionally
Frequently
Very frequently
92.7%
3.5%
2.3%
1.0%
0.5%

Graduate College of Social Work University of Houston Students & the 2016 Election Hobby School of Public Affairs
48
Figure 39. Contribute Money to a Democratic Candidate or Political Party
N = 782 Note: 1. The p-value for the t-test by gender is not statistically significant at the 0.05 level. 2. The p-value for the ANOVA by ethnicity is not statistically significant at the 0.05 level. Figure 39 shows how often the respondents contributed money to a Democratic candidate or political party in 2016. Similar to the result for donations to a Republican candidate or political party, 88.6 percent of the respondents never contributed money to a Democratic candidate or political party. Very few respondents contributed money to a Democratic candidate or political party either very frequently (1.0 percent) or frequently (1.5 percent). The results from the t-test and ANOVA indicate that there are no significant differences in contributing money to a Democratic candidate or political party between men and women and among ethnic groups.
0% 10% 20% 30% 40% 50% 60% 70% 80% 90%
Never
Rarely
Occasionally
Frequently
Very frequently
88.6%
5.4%
3.5%
1.5%
1.0%

Graduate College of Social Work University of Houston Students & the 2016 Election Hobby School of Public Affairs
49
Figure 40. Work or Volunteer for a Candidate or Party
N = 782 Note: 1. The p-value for the t-test by gender is not statistically significant at the 0.05 level. 2. The p-value for the ANOVA by ethnicity is not statistically significant at the 0.05 level. Figure 40 illustrates how often the respondents worked or volunteered for a candidate or party in 2016. Up to nine-tenths of the respondents (90.2 percent) never worked or volunteered for a candidate or party. Very few respondents worked or volunteered for a candidate or party either very frequently (0.9 percent) or frequently (1.0 percent). The results from the t-test and ANOVA indicate that there are no significant differences in working or volunteering for a candidate or party between men and women and among ethnic groups.
0% 10% 20% 30% 40% 50% 60% 70% 80% 90% 100%
Never
Rarely
Occasionally
Frequently
Very frequently
90.2%
4.1%
3.8%
1.0%
0.9%

Graduate College of Social Work University of Houston Students & the 2016 Election Hobby School of Public Affairs
50
Figure 41. Contact a Newspaper, Radio, or TV Talk Show to Express Opinion on an Issue
N = 782 Note: 1. The p-value for the t-test by gender is not statistically significant at the 0.05 level. 2. The p-value for the ANOVA by ethnicity is not statistically significant at the 0.05 level. Figure 41 shows how often the respondents contacted a newspaper, radio, or TV talk show to express an opinion on an issue in 2016. Nearly 90 percent (89.4 percent) of the respondents never contacted a newspaper, radio, or TV talk show to express an opinion on an issue. Very few respondents contacted a newspaper, radio, or TV talk show to express an opinion on an issue either very frequently (1.4 percent) or frequently (1.3 percent). The results from the t-test and ANOVA indicate that there are no significant differences in contacting a newspaper, radio, or TV talk show to express an opinion on an issue between men and women and among ethnic groups.
0% 10% 20% 30% 40% 50% 60% 70% 80% 90%
Never
Rarely
Occasionally
Frequently
Very frequently
89.4%
5.6%
2.3%
1.3%
1.4%
Graduate College of Social Work University of Houston Students & the 2016 Election Hobby School of Public Affairs
51
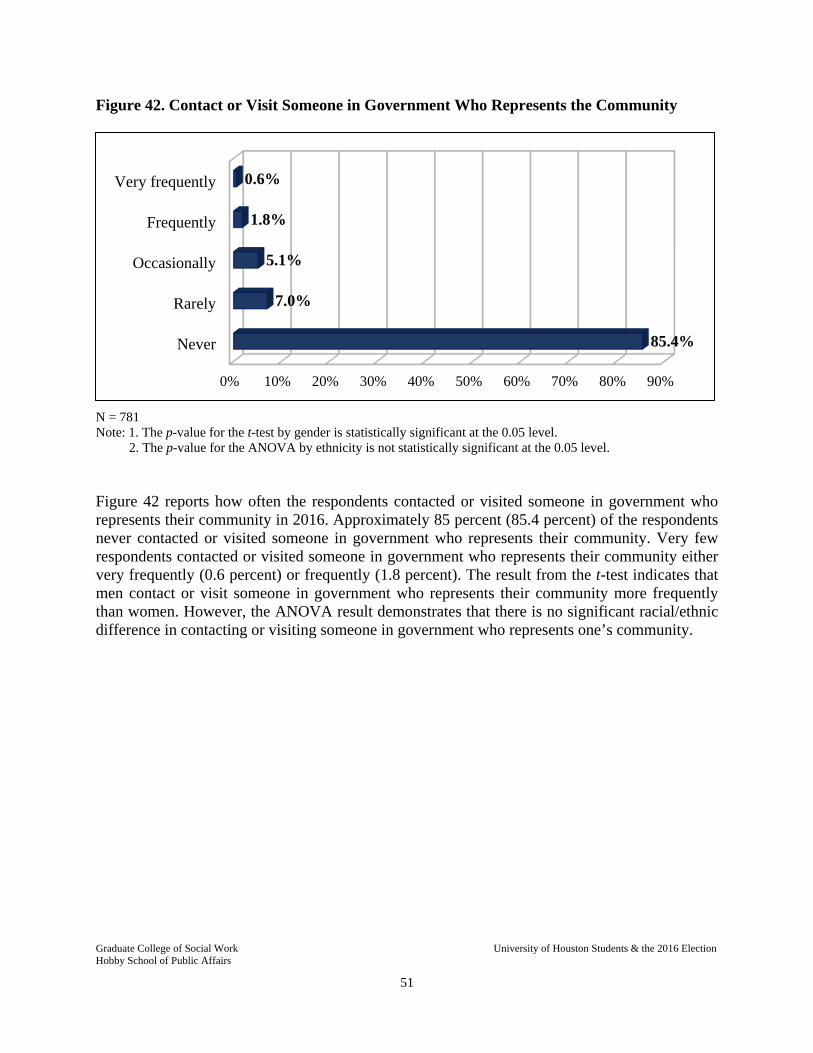
Figure 42. Contact or Visit Someone in Government Who Represents the Community
N = 781 Note: 1. The p-value for the t-test by gender is statistically significant at the 0.05 level. 2. The p-value for the ANOVA by ethnicity is not statistically significant at the 0.05 level. Figure 42 reports how often the respondents contacted or visited someone in government who represents their community in 2016. Approximately 85 percent (85.4 percent) of the respondents never contacted or visited someone in government who represents their community. Very few respondents contacted or visited someone in government who represents their community either very frequently (0.6 percent) or frequently (1.8 percent). The result from the t-test indicates that men contact or visit someone in government who represents their community more frequently than women. However, the ANOVA result demonstrates that there is no significant racial/ethnic difference in contacting or visiting someone in government who represents one’s community.
0% 10% 20% 30% 40% 50% 60% 70% 80% 90%
Never
Rarely
Occasionally
Frequently
Very frequently
85.4%
7.0%
5.1%
1.8%
0.6%
Graduate College of Social Work University of Houston Students & the 2016 Election Hobby School of Public Affairs
52
Figure 43. Participate in Political Activities such as Protests, Marches, or Demonstrations
N = 783 Note: 1. The p-value for the t-test by gender is not statistically significant at the 0.05 level. 2. The p-value for the ANOVA by ethnicity is not statistically significant at the 0.05 level. Figure 43 shows how often the respondents participated in political activities such as protests, marches, or demonstrations in 2016. More than four-fifths (82.6 percent) of the respondents never participated in political activities such as protests, marches, or demonstrations. Very few respondents participated in political activities such as protests, marches, or demonstrations either very frequently (0.9 percent) or frequently (2.4 percent). The results from the t-test and ANOVA indicate that there are no significant differences in participating in political activities such as protests, marches, or demonstrations between men and women and among ethnic groups.
0% 10% 20% 30% 40% 50% 60% 70% 80% 90%
Never
Rarely
Occasionally
Frequently
Very frequently
82.6%
8.3%
5.8%
2.4%
0.9%

Graduate College of Social Work University of Houston Students & the 2016 Election Hobby School of Public Affairs
53
Figure 44. Whether Parents or Guardians Have Ever Encouraged the Respondent to Vote
N = 787 Note: 1. The p-value for the chi-square test of the relationship between being encouraged to vote and gender is not
statistically significant at the 0.05 level. 2. The p-value for the chi-square test of the relationship between being encouraged to vote and ethnicity is
statistically significant at the 0.001 level. Figure 44 illustrates whether the respondents’ parents or guardians have ever encouraged them to vote. A total of 74.3 percent of the respondents indicate that their parents or guardians have encouraged them to vote. The result from the chi-square test shows that gender has no influence on whether the respondents have been encouraged to vote by their parents or guardians. However, race/ethnicity is significantly associated with being encouraged to vote. Specifically, 86.7 percent of whites express that they have been encouraged to vote by their parents or guardians. By contrast, only 55.2 percent of Asian Americans say this.
0%
10%
20%
30%
40%
50%
60%
70%
80%
Yes No
74.3%
25.7%

Graduate College of Social Work University of Houston Students & the 2016 Election Hobby School of Public Affairs
54
Figure 45. How Often the Parents Wanted to Hear the Respondent’s Opinions about Current Events and Politics, Even if They Differed from Their Own
N = 708 Note: 1. The p-value for the t-test by gender is not statistically significant at the 0.05 level. 2. The p-value for the ANOVA by ethnicity is statistically significant at the 0.05 level. Figure 45 illustrates how often the respondents’ parents want to hear about the respondents’ opinions about current events and politics, even if they differed from their own. A total of 32.8 percent of the respondents indicate that their parents occasionally want to hear their children’s opinions about current events and politics. Another 26.3 percent indicate that their parents do so frequently. The ANOVA result indicates that there is a significant difference among racial/ethnic groups. In particular, whites’ parents want to hear their children’s opinions about current events and politics more frequently than the parents of the other racial/ethnic groups. By contrast, Asian Americans parents hear their children’s opinions about current events and politics less frequently than the parents of the other racial/ethnic groups. However, the result from the t-test demonstrates that there is no significant difference between men and women.
0% 10% 20% 30% 40%
Never
Rarely
Sometimes
Often
All the time
8.8%
17.8%
32.8%
26.3%
14.4%
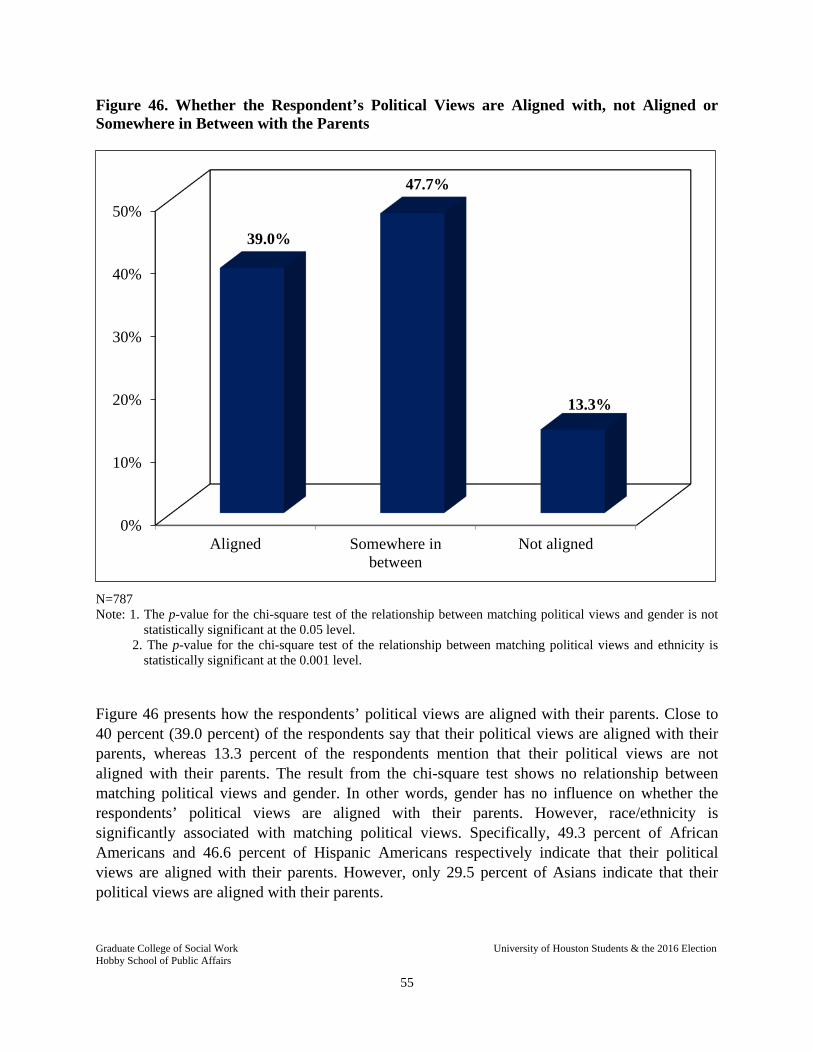
Graduate College of Social Work University of Houston Students & the 2016 Election Hobby School of Public Affairs
55
Figure 46. Whether the Respondent’s Political Views are Aligned with, not Aligned or Somewhere in Between with the Parents
N=787 Note: 1. The p-value for the chi-square test of the relationship between matching political views and gender is not
statistically significant at the 0.05 level. 2. The p-value for the chi-square test of the relationship between matching political views and ethnicity is
statistically significant at the 0.001 level. Figure 46 presents how the respondents’ political views are aligned with their parents. Close to 40 percent (39.0 percent) of the respondents say that their political views are aligned with their parents, whereas 13.3 percent of the respondents mention that their political views are not aligned with their parents. The result from the chi-square test shows no relationship between matching political views and gender. In other words, gender has no influence on whether the respondents’ political views are aligned with their parents. However, race/ethnicity is significantly associated with matching political views. Specifically, 49.3 percent of African Americans and 46.6 percent of Hispanic Americans respectively indicate that their political views are aligned with their parents. However, only 29.5 percent of Asians indicate that their political views are aligned with their parents.
0%
10%
20%
30%
40%
50%
Aligned Somewhere inbetween
Not aligned
39.0%
47.7%
13.3%
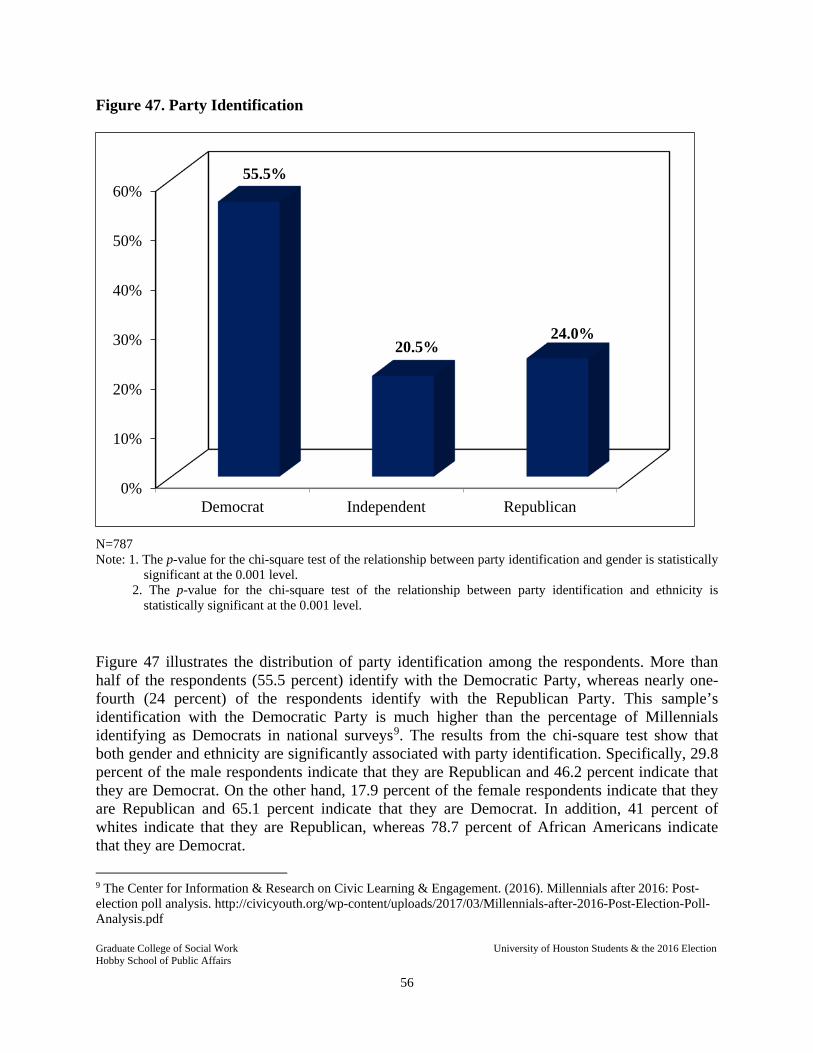
Graduate College of Social Work University of Houston Students & the 2016 Election Hobby School of Public Affairs
56
Figure 47. Party Identification
N=787 Note: 1. The p-value for the chi-square test of the relationship between party identification and gender is statistically
significant at the 0.001 level. 2. The p-value for the chi-square test of the relationship between party identification and ethnicity is
statistically significant at the 0.001 level. Figure 47 illustrates the distribution of party identification among the respondents. More than half of the respondents (55.5 percent) identify with the Democratic Party, whereas nearly one-fourth (24 percent) of the respondents identify with the Republican Party. This sample’s identification with the Democratic Party is much higher than the percentage of Millennials identifying as Democrats in national surveys9. The results from the chi-square test show that both gender and ethnicity are significantly associated with party identification. Specifically, 29.8 percent of the male respondents indicate that they are Republican and 46.2 percent indicate that they are Democrat. On the other hand, 17.9 percent of the female respondents indicate that they are Republican and 65.1 percent indicate that they are Democrat. In addition, 41 percent of whites indicate that they are Republican, whereas 78.7 percent of African Americans indicate that they are Democrat. 9 The Center for Information & Research on Civic Learning & Engagement. (2016). Millennials after 2016: Post-election poll analysis. http://civicyouth.org/wp-content/uploads/2017/03/Millennials-after-2016-Post-Election-Poll-Analysis.pdf
0%
10%
20%
30%
40%
50%
60%
Democrat Independent Republican
55.5%
20.5%24.0%
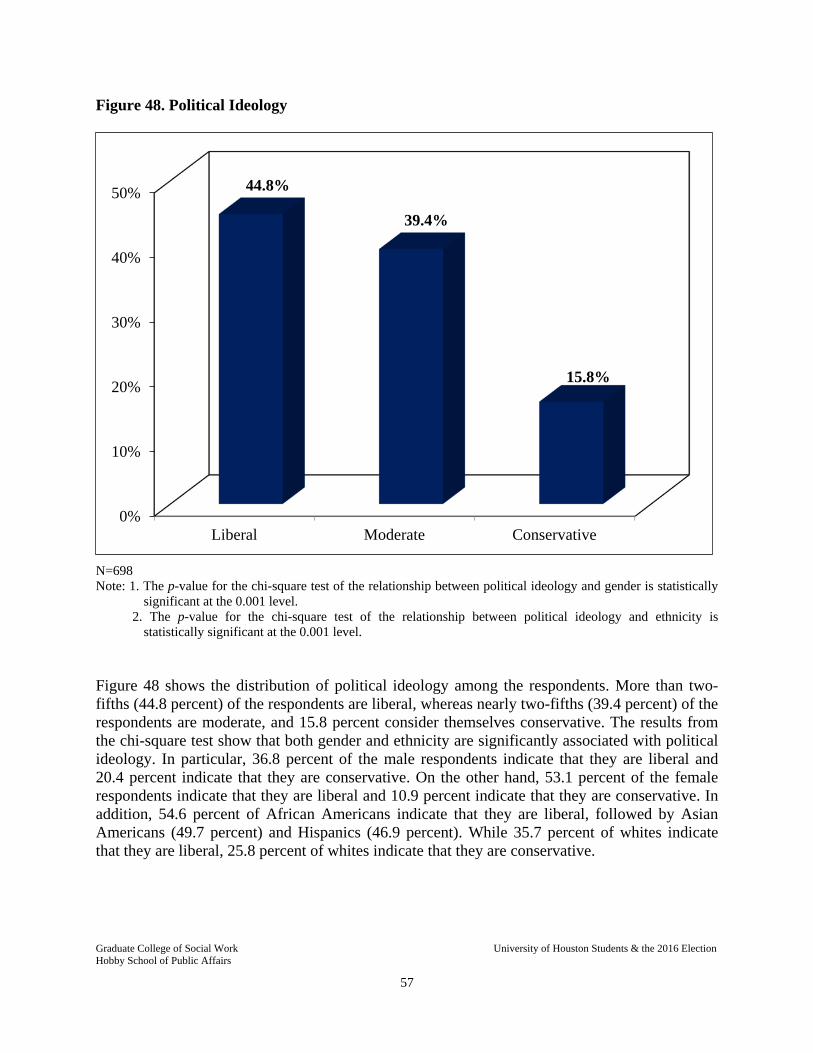
Graduate College of Social Work University of Houston Students & the 2016 Election Hobby School of Public Affairs
57
Figure 48. Political Ideology
N=698 Note: 1. The p-value for the chi-square test of the relationship between political ideology and gender is statistically
significant at the 0.001 level. 2. The p-value for the chi-square test of the relationship between political ideology and ethnicity is
statistically significant at the 0.001 level. Figure 48 shows the distribution of political ideology among the respondents. More than two-fifths (44.8 percent) of the respondents are liberal, whereas nearly two-fifths (39.4 percent) of the respondents are moderate, and 15.8 percent consider themselves conservative. The results from the chi-square test show that both gender and ethnicity are significantly associated with political ideology. In particular, 36.8 percent of the male respondents indicate that they are liberal and 20.4 percent indicate that they are conservative. On the other hand, 53.1 percent of the female respondents indicate that they are liberal and 10.9 percent indicate that they are conservative. In addition, 54.6 percent of African Americans indicate that they are liberal, followed by Asian Americans (49.7 percent) and Hispanics (46.9 percent). While 35.7 percent of whites indicate that they are liberal, 25.8 percent of whites indicate that they are conservative.
0%
10%
20%
30%
40%
50%
Liberal Moderate Conservative
44.8%
39.4%
15.8%

Graduate College of Social Work University of Houston Students & the 2016 Election Hobby School of Public Affairs
58
IV. Summary In November 2016, the Graduate College of Social Work and the Hobby School of Public Affairs interviewed a total of 895 students enrolled in the state-mandated U.S. Government course (POLS 1337) at the University of Houston, thus eliciting a sample demographically representative of the University’s undergraduate student body. The purpose of this study is to understand how the most diverse generation of Americans votes and engages in politics. Excluding 108 of the non-citizen respondents from the analysis, this study’s key findings about this highly diverse, college-attending sample of University of Houston respondents are as follows:
• This population of young people has a high voter registration rate. Close to 81 percent (80.6 percent) of the respondents are registered to vote. While there are no gender differences in voter registration, whites have a higher voter registration rate compared to the other racial/ethnic groups.
• This population of young people had a high voter turnout rate in the presidential election. Approximately 80 percent (79.5 percent) of registered respondents voted in the 2016 presidential election. There are no significant differences in voter turnout between men and women and among ethnic groups.
• The most common reason provided for students not registering to vote is a lack of time to
do so.
• This population of young people was more likely to vote for Clinton in the 2016 presidential election. Seventy-four percent (74.2 percent) of the respondents voted for Clinton, whereas 17 percent voted for Trump. Women were more likely to vote for Clinton than men, and African Americans were more likely to vote for Clinton than the other ethnic groups. Whites were more likely to vote for Trump compared to the other ethnic groups.
• The treatment of racial, ethnic minorities was the most important issue for these millennial voters when making a voting decision. A supermajority (87.9 percent) of the respondents view the candidates’ stances on treatment of racial, ethnic minorities as either very important or fairly important in influencing their voting decisions, followed by the economy (85.6 percent), health care (81.9 percent), and immigration (80.5 percent). By contrast, issues such as trade policy (62.1 percent), Social Security (56.9 percent), and minimum wage (56.7) were considered relatively less important in influencing students’ voting decision.
• There are significant gender differences in the perceived importance of various issues influencing individual voting decisions. Women tend to regard the issues of terrorism, health care, gun policy, social security, treatment of racial and ethnic minorities, environment, minimum wage, immigration, college affordability, and primary and

Graduate College of Social Work University of Houston Students & the 2016 Election Hobby School of Public Affairs
59
secondary education as more important than men. By contrast, men tend to regard the issue of trade policy as more important than women.
• There are significant racial/ethnic differences in the perceived importance of various issues when students made individual voting decisions. African Americans tend to rate the treatment of racial, ethnic minorities and criminal justice as more important than do other racial/ethnic groups. Hispanics tend to place greater emphasis on immigration and primary and secondary education in influencing their vote choices compared to other groups. In contrast, white students rate social welfare and economic access issues like health care, minimum wage, college affordability, primary and secondary education, and criminal justice, as well as the treatment of racial and ethnic minorities, as less important in influencing their vote choice than do racial/ethnic minority young people.
• The voters in this sample display a high level of interest in politics. Close to 80 percent (78.3 percent) of the respondents are either very interested or somewhat interested in politics. Men report more interest in politics than do women. In addition, African Americans have the highest level of interest in politics compared to the other ethnic groups.
• The voters in this sample pay considerable attention to political campaigns but do not
frequently express their opinions about politics or a campaign or candidate on a website, blog, or on social media. White students pay more attention to political campaigns than do the other racial/ethnic groups, whereas women express their opinions about politics or a campaign or candidate on a website, blog, or on social media more frequently than men do.
• Compared to newspapers, the voters in this sample are more likely to rely on TV, radio, and the internet to get information about politics and current events. Forty-two percent of the respondents never read a newspaper for such information during 2016.
• Respondents did not frequently engage in the following campaign activities in 2016: wear a campaign button or shirt, use a campaign sticker or a sign, talk to people and explain why they should vote for or against one of the parties or candidates, friend or join a group related to a presidential candidate or political party on a social networking site, share photos or videos about a campaign or candidate on social media, attend any political meetings, rallies, speeches, and dinners in support of a particular candidate, contribute money to a candidate or political party, and work or volunteer for a candidate or party.
• Respondents did not frequently engage in the following non-electoral political activities: contact a newspaper, radio, or TV talk show to express opinion on an issue, contact or visit someone in government who represents the community, or participate in political activities such as protests, marches, or demonstrations.

Graduate College of Social Work University of Houston Students & the 2016 Election Hobby School of Public Affairs
60
• The respondents in this sample are more likely to identify with the Democratic Party. Slightly over 55 percent (55.5 percent) of the respondents indicate they are Democrats. While both women and men in this sample are more likely to identify as Democrats than as Republicans or Independents, women are more likely to be Democratic than men, whereas men are more likely to be Republican than women. In addition, African Americans are more likely to be Democratic than the other ethnic groups, whereas whites are more likely to be Republican than the other ethnic groups.
• The voters in this sample are more likely to be either liberal or moderate. Nearly forty-five percent (44.8 percent) of the respondents indicate that they are liberal, whereas 39.4 percent indicate that they are moderate. While both women and men in this sample are more likely to identify as liberals or moderates than as conservatives, women are more likely to be liberal than men, whereas men are more likely be either moderate or conservative than women. In addition, African Americans are more likely to be either liberal or moderate than the other ethnic groups.