UNIVERSiTY OF HAWA!'I LIBRARY...UNIVERSiTY OF HAWA!'I LIBRARY TROPICAL CYCLONE ENERGY DiSPERSION IN...
174
UNIVERSiTY OF HAWA!'I LIBRARY TROPICAL CYCLONE ENERGY DiSPERSION IN A BAROCLINIC MODEL AND ITS ASSOCIATED CYCLOGENESIS A DISSERTATION SUMBMITTED TO THE GRADUATE DIVISION OF THE UNIVERSITY OF HAWAII IN PARTIAL FULFILLMENT OF THE REQUIREMENTS OF THE DEGREE OF DOCTOR OF PHILOSOPHY IN METEOROLOGY MAY 2008 BY XuyangGe Dissertation Committee: Tim Li, Chairperson Bin Wang YuqingWang Melinda S. Peng Thomas Giambelluca
Transcript of UNIVERSiTY OF HAWA!'I LIBRARY...UNIVERSiTY OF HAWA!'I LIBRARY TROPICAL CYCLONE ENERGY DiSPERSION IN...

UNIVERSiTY OF HAWA!'I LIBRARY
TROPICAL CYCLONE ENERGY DiSPERSION IN A BAROCLINIC
MODEL AND ITS ASSOCIATED CYCLOGENESIS
A DISSERTATION SUMBMITTED TO THE GRADUATE DIVISION OF THE UNIVERSITY OF HAWAII IN PARTIAL FULFILLMENT OF THE
REQUIREMENTS OF THE DEGREE OF
DOCTOR OF PHILOSOPHY
IN
METEOROLOGY
MAY 2008
BY
XuyangGe
Dissertation Committee:
Tim Li, Chairperson
Bin Wang
YuqingWang
Melinda S. Peng
Thomas Giambelluca

We certify that we have read this dissertation and that, in our opinion, it is
satisfactory in scope and quality as a dissertation for the degree of Doctor of
Philosophy in Meteorology.
DISSERTATION COMMITTEE
Chairperson
ii

ACKNOWLEDGEMENTS
I would like to begin by thanking my advisor Dr. Tim Li. Professor Li has provided
me with tremendous support, enthusiasm and excellent guidance through'the course of
my Ph. D. program. His patience and intelligence made my work here a joy. His
friendship and kindness will not be forgotten. This thesis would not exist without his
guidance. Additionally, thanks are due to my other committee members: Drs. Bin Wang,
Yuqing Wang, Melinda S. Peng and Thomas Giambelluca. I am deeply impressed with
their assistance on excellence of the graduate study and really enjoy many stimulating
discussions with them. Their advice was essential in the framework of this research and
their encouragement was always welcome.
I would also like to thank the faculties in department for their advice and assistance.
In particular I would like to acknowledge Drs. Kevin Hamilton, David Chen, Feifei Jin,
and Matthew McGranaghan for their helpings act as proxies during my comprehensive
examinations and proposal defense. Thanks are also given to Dr. Duane Stevens for
acting as advisor during Dr. Li's sabbatical leave. I am grateful to Dr. Yuqing Wang for
generously letting me use his tropical cyclone model and many helps on numerical
techniques. Dr. Liguang Wu also provided a lot of helpful suggestions during his visit to
the University of Hawai'i at Manoa.
Thanks need to be given to the countless friends who I have made over the years.
Drs. Haiyan Teng, Zhuo Wang, Simon, Cliff, Bo Yang, Yang Yang, Linlin Pan, Jianhua
Lu, Fred Zhang, Xin Zhang, Guangxiao Cao, Qing Bao, Jiaoyi Peng and Ms. Huaiqun
Chen, Chie'shing Chang, Jing Yang, Chunhua Zhou, Mr. Chris Chambers, Bing Fu but
just a few. The good times we have had together help ease the load.
iii

Finally, I would like to thank my family. Special thanks go to my parents, Shan'long
Ge and Lian'hua Ge, and parents-in-law, Xin'geng Zhou and TIao'nong Yu. Your love is
a driving force in my life. I would like to offer my love and thanks to my wife, Xiaqiong
Zhou and my son, Yuan Ge. Your love and support knows no bound. I am truly the
luckiest person in the world to have been blessed with such a family.
iv
TABLE OF CONTENTS
ACKNOWLEDGMENTS ......................................................................... .iii
ABSTRACT ......................................................................................... viii
LIST OF TABLES ................................................................................... x
LIST OF FIGURES ................................................................................... xi
Chapter 1 Introduction ................................................................................................ 1
1.1 Backgrounds ........................................................................................................ 1
1.2 Motivations ................................................................................. 7
Chapter 2 Model ........................................................................................................... 9
2.1 Model descriptions ........................................................................ 9
2.2 Initial conditions ................................................................................................. 11
Chapter 3 Tropical cyclone energy dispersion in an environment at rest ...... 13
3.1 Introduction ................................................................................ 13
3.2 Experiment Designs ..................................................................... .14
3.3 Structure and evolution features of the simulated 3D wave train .................. 15
3.4 Development of an asymmetric outflow jet .......................................... .19
3.5 Impacts of the upper-level jet on 3D energy dispersion ............................ 21
3.6 Roles of diabatic heating ................................................................. 26
3.7 Conclusions and discussions ............................................................ 29
Chapter 4 Tropical cyclone energy dispersion under vertical shears ............ 51
4.1 Introduction ............................................................................... .51
4.2 Model and experiment designs ........................................................ .52
v

4.3 Numerical results ........................................................................ .53
4.4 Conclusions .............................................................................. 59
Chapter 5 Tropical cyclone energy dispersion and self-maintenance
mechanism of synoptic-scale wave trains .......................................... 73
5.1 Introduction ............................................................................... 73
5.2 Model strategy ............................................................................ 77
5.3 Numerical Results ........................................................................ 79
5.3.1 ITCZ breakdown in a quiescence environment ............................... 79
5.3.2 TCED in a quiescence environment... .......................................... 81
5.3.3 Interaction between a TC and an idealized ITCZ on anf-plane ............. 83
5.3.4 Interaction between TC and ITCZ on a beta-plane ........................... 84
5.3.5 Roles of diabatic heating in the synoptic-scale wave train .......•.......... 86
5.4 Conclusions and discussions ............................................................ 87
Chapter 6 Tropical cyclogenesis Prapiroon (2000) associated with Rossby
wave energy dispersion ................................................................................ 1 04
6.1 Introduction .............................................................................. 104
6.2 Observed evolution of the pre-Prapiroon circulation .............................. 106
6.3 Methodology ............................................................................ 110
6.4 Numerical Results ...................................................................... 114
6.5 Roles of the outflow layer of pre-existing TC ..................................... 117
6.6 Discussion and conclusion ............................................................ 123
vi

Chapter 7 Summary and future works ................................................. 142
7.1 Major results ........................................................................... 142
7.2 Future works ........................................................................... 146
REFERENCES .................................................................................. 148
vii

ABSTRACT
The 3D Rossby wave energy dispersion of a TC is studied using a baroclinic
primitive equation model. The numerical results demonstrate more complex 3D energy
dispersion characteristics than 2D barotropic dynamics. A key feature associated with the
formation of 3D wave train is a downward propagation of the relative vorticity and
kinetic energy. The upper anticyclonic circulation rapidly induces an intense asymmetric
outflow jet in the southeast quadrant, which influences the lower-level Rossby wave
train formation. On one hand, the outflow jet exerts an indirect effect on the strength of
lower-level wave train through changing in TC intensity and structure. On the other hand,
it triggers downward energy propagation, which may further enhance the lower level
Rossby wave train formation
A remarkable asymmetry appears in the perturbation growth of the wave train in the
presence of vertical wind shears. That is, an easterly (westerly) wind shear confines the
wave to the lower (upper) level. It is suggested that the vertical shear may impact the
Rossby wave train development through both the barotropic-baroclinic mode coupling
and the modulation of the group velocity by the mean flow through a "Doppler shift
effect". The destabilization of Rossby wave train by regional easterly vertical shears has
important implications.
The interaction between a tropical cyclone and idealized intertropical convergence
zone (ITCZ) is investigated. Once a TC develops in the ITCZ region which satisfies
barotropic and baroclinic instability, the southeastward energy dispersion from the TC
may accelerate ITCZ breakdown, and the interaction between the convective heating and
the perturbation circulations may lead to the generation of new tropical cyclone to the
viii

east. Through repeating of the above process, a synoptic-scale wave train oriented in the
northwest-southeast direction can be generated and self-maintained.
A case study on typhoon Prapiroon (2000) is performed to examine the role of
TCED in the following cyc10genesis in nature. Sensitivity experiments suggest that the
previous TC would modulate the large-scale environmental circulations, thus affect the
formation of its sequential storm.
ix

LIST OF TABLES
TABLE PAGE
3.1 List of major numerical experiments ......................................................... 32
4.1 List of major numerical experiments ........................................................ 61
4.2 The lower level Rossby wave train strength at day 7 ..................................... 62
5.1 Descriptions of the major numerical experiments ......................................... 89
6.1 Description of numerical experiments designs ....................................................... 126
x

LIST OF FIGURES
FIGURE PAGE
3.1 Surface pressure field (left panel, unit: hPa) and 850 hPa wind and vertical mean cloud mixing ratio (shaded, unit: 10,,1 glkg) pattern of a Rossby wave train in the box area at day 10 (right panel). Horizontal distance has a unit of 100 km ............... 33
3.2 Wmd fields at different sigma levels at day 10. (0, 0) denotes the TC center ........................................................................................... 34
3.3 The time evolution of vertical radius cross-sections of relative vorticity (unit: JU5 S"I)
along the northwest-southeast axis (Le., the dashed line in the left panel of Fig 3.1). The number at the upper-right of each panel indicates the time of day ............... 35
3.4 Same as Fig.3.3 except for kinetic energy (unit: m2 s"2) .................................. 36
3.5 Same as Fig.3 .3except for relative humidity fields (unit: %) ........................... 37
3.6 Same as Fig.3 except at the northwest quadrant .......................................... 38
3.7 The time-radius section ofKE (unit: m2 8,,2) in the upper (0=0.2) and lower (0=0.8)
levels along a southeastward axis (the dashed line in Fig .3.1) ........................ 39
3.8 The time evolution of the outflow layer (0=0.15) circulation. From the left to right represent wind and relative vorticity (shaded) fields at day 2, 3, 5 respectively .................................................................................. .40
3.9 The east-west vertical cross section of relative vorticity (left panel; JU5S·
1) and
tangential wind (right panel; ms"/) of TCs across the interface for Beta_High (top panel) and Beta_Low (Bottom panel) at day 4. The y-axis shows the vertical sigma levels. "0" in x-axis represents TC center ............................................................... .41
3.10 Low-level (0=0.9) circulations in the CTL, Beta_High and Beta_Low experiments at day 6. Areas with positive relative vorticity are shaded ............................. 42
3.11 The PV fields in CTL (left panel, unit: O.IPVU), Beta_High (middle) and Beta_Low (right panel) at day 6 ....................................................................... .43
3.12 Tune evolutions of MSLP (unit: hPa) in CTL (thick solid), BETA_HIGH (dotted) and BETA_LOW (thin solid) (upper panel) and difference in the symmetric tangential winds between CTL and BETA_LOW (CTL minus BETA_LOW, left-bottom panel) and tangential wind profile for CTL (solid line) and BETA_LOW (dashed line) at day 6 (right-bottom panel, unit: m S·I) ................................. 44
xi

3.13 The lowest-level symmetric components of tangential wind profile (ms·J) in
Beta_High (solid line) and in f-plane (dashed line) experiments at day 5 ............ .45
3.14 Potential temperature-radius cross sections of E-P flux vectors and their divergence averaged from day 3 to 5 (contour, unit: 0.5 X1rf Pa m2 [('J S·2) for CTL (top panel), BETA_illGH (middle) and BETA_LOW {bottom panel). The horizontal and vertical components are scaled by 1 X 10 .. 9 and 1 X W S
, respectively ............... .46
3.15 Simulated wind fields in the CTL (left panel) and DRY (right panel) experiments at day 5 .......................................................................................... .47
3.16 The vertical-radius cross sections of symmetric component of tangential and radial winds (unit: m s .. J) in the CTL and DRY experiments at day 4 ....................... .48
3.17 Rossby wave trains induced by TCs with stronger intensity (left-bottom) and larger size (right-bottom) at day 4. Top panel shows the initial tangential wind profiles of two TCs. The solid (dashed) line represents TC with stronger intensity (larger size), respectively ............................................................................. ; .... .49
3.18 Schematic diagram illustrating possible mechanisms responsible for the 3D Rossby wave train development The thick solid arrows indicate barotropic Rossby wave dynamics, and the dotted arrows indicate the influence of the upper tropospheric circulation .................................................................................... 50
4.1 The vertical profiles for easterly (left panel) and westerly (right panel) wind shears. The y-axis is vertical sigma levels, and x-axis shows the zonal wind speed (unit: ms .. l ) ..................•............•.•••••••.......••••••••••......•••••••••••••••••••••••••••• 63
4.2 The vertical distributions of the zonal mean flows at day 5 in the ESH (left panel) and WSH (right panel) cases .................................................................... 64
4.3 Wmd fields in CTRL (left panel), ESH (middle panel) and WSH (right panel) at different sigma levels from the upper to lower level at day 7. The domain averaged mean flows at each level are removed in both WSH and ESH. The point (0, 0) represents the TC center. Horizontal distance has a unit of 100 km. The domain-averaged mean flows at each level have been removed ...................... 65
4.4 TIme evolutions of the vertical-radius cross sections of relative vorticity (1 x1(J5 s .. J) of CTRL (top panel), ESH (middle panel) and WSH {bottom panel) along the northwest-southeast oriented axis. The number in the upper-right of each panel indicates the time of day ..................................................................... 66
4.5 Potential tempemture-radius cross sections of E-P flux vectors and their divergence (contour, unit: O.5X1rf Pa m2 [('J S·2) for CTRL (top panel), ESH (middle) and WSH (bottom panel) at Day 4. The horizontal and vertical component are scaled by 1 X1(J9 and 1 X](J5, respectively .......................................................... 67
xii

4.6 The barotropic wind components obtained by a vertical average in CTRL (left), ESH (middle) and WSH (right panel) ........................................................... 68
4.7 Wmd fields in W5 (left panel) and E5 (right panel) at lower level (sigma=0.8) at day 7. The domain-averaged mea winds at each level have been removed ............... 69
4.8 The barotropic wind components in W5 (left) and E5 (right panel) .................... 70
4.9 Same as Fig. 4.3 except in ESH05 and WSH05 ............................................ 71
4.10 Time evolutions of the vertical-radius cross sections of relative vorticity (lxl(J5 S·/) in WSH05 (upper panel) and ESH05 (bottom panel) along the northwest-southeast oriented axis. The number in the upper-right of each panel indicates the time of day ....................................................................................................... 72
5.1 Tune evolution of the unfiltered 850hPa wind fields. The shaded areas show the positive relative vorticity. The cape A, B, C represent the TCs: Megi, Chaba and Aere, respectively ........................................................................... 90
5.2 Time evolution of synoptic scale wave train represent by the filtered 850hPa wind fields .......................................................................................... 91
5.3 The mean background flows conducted by 15-day mean centered on August 15th• The
shaded area shows the postive relative vorticity ........................................ 92
5.4 Horizontal map of E-vectors calculated based on Trenberth et al. (1986). The E-vectors are summed over a 15-day period centered on 15 August 2004 .......... 93
5.5 The low-level idealized mean zonal wind fields represent large-scale monsoon shear line (top panel), and the vertical-latitude cross-section of mean zonal wind (ms· l
;
bottom panel). Here the horizontal distance is 100 km, and domain center "0" represents the 10"N .......................................................................... 94
5.6 Meridional profile of the mean PV of the zonally oriented monsoon shear lineIITCZ ..................................................................................... 95
5.7 Tune evolution of the lower level wind vector superposed by SLP (unit: hPa; left panel) and relative vorticity (positive areas are shaded; unit: J(J5S·I; right panel) fields for PITCZ experiment ................................................................ 96
5.8 Time evolution ofSLP (hPa) and lower-level wind field ofTCEDO .................... 97
5.9 The time-radius section ofKE (unit: m2s-2) in the upper (cr=O.2) and lower (cr=O.8) levels along a southeastward axis (the dashed line in Fig. 5.8) for TCEDO ......... 98
5.10 Same as Fig. 5.7 except for ITCED_F ..................................................... 99
xiii

5.11 Same as Fig. 5.8 except for ITCED_BO ................................................... 100
5.12 Vertical radius cross sections of meridional wind (unit: ms"/) along the northwest -southeast axis (Le., the dashed line in Fig. 5.11) in ITCED_BO ..................... I01
5.13. Same as Fig. 5.8 except for ITCED_Bl.. ............................................... 102
5.14. Same as Fig. 5.8 except for DRy ......................................................... 103
6.1 Time sequences of synoptic-scale surface wind patterns associated with the Rossby wave energy dispersion of Typhoon Bills. "A" represents the center location ofBilis that formed on 18 August 2000. "B" represents the center location of a new TC named Prapiroon that formed on 26 August 2000 in the wake of the Rossby wave train of Bilis ................................................................................ .127
6.2 Horizontal map of E-vectors calculated based on Trenberth et al. (1986). The E-vectors are summed over an ll-day period centered on 20 August 2000. The black dot represents the previous TC center ............................................ 128
6.3 The observed 150hPa wind vector (ms·/ ) and relative vorticity (unit: 10.5 s"/) fields (top panel) and vertical-radius cross-section of relative vorticity fields along a northwest-southeast oriented axis (bottom panel) at 1200 UTC 22 August 2000. Areas with positive" are shaded ......................................................... 129
6.4 The evolution characteristics of TMI data (unit: mm/hour) superposed by 3-8-day filtered 850 hPa wind field on (a) 23 August, (b) 24 August, (c) 25 August and (d) 26 August, respectively ..................................................................... 130
6.5 The separation of the large-scale analysis surface pressure field (hPa) and wind fields (m S"l) (a) into the environmental field (b) and the disturbance field (c) at initial time 0000 UTC 22 August. The box in (b) shows the domain where the variables are replaced by filtered data in EXP _ NPTC ............................................ 131
6.6 (a) The tracks of the Cn]TC and observed from JTWC (with typhoon symbol). (b) The time evolutions of MSLP of observation (thick dashed line), Cn]TC(solid line) and EXP _NPTC (thin dot-dashed line) ........................................... 132
6.7 The evolution of surface pressure fields (hPa) in the CTL ]TC run .................. 133
6.8 Same as Fig. 6.7 except in the EXP _ NPTC run ........................................... 134
6.9 The evolution of vorticity fields (areas greater than 1 xlO-4s"1 are shaded) in cn ]TC during a 24h period (top panel), and the time-radius cross-section of the symmetric component of 850 hPa relative vorticity (unit: IU5
S·/) within a radius of 450 km in cn ]TC (bottom panel) .................................................... 135
xiv

6.10 (a) 200 hPa horizontal distribution of the residual of nonlinear balance equation (&mE, unit: lO-9 S-2). (b) the vertical cross section of &mE along the thin line in (a). Shade area represents the jet core region ... _ ...................................... .136
6.11 The 150hPa divergence field (~ 2xlO-5 S-I are shaded) and total velocity of jet core
region (contour interval: 5 ms-/) in ClL]TC (a) and EXP _NPTC run (b) in 24th August ........................................................................................ 137
6.12 The vertical-radius cross section of vertical motion (contour, unit: 1(12 ms-/) and relative humidity (shaded; %) in ClL]TC (left panel) and EXP_NPTC (right panel) along the dashed line in Fig.6.10. The shaded areas indicate value greater than 70%, and the thick lines delineate the top jet core ............................... 138
6.13 Radial-time cross section of 200 hPa EFC (contour interval: 4 ms-I day-I) in ClL PTC (left panel) and EXP NPTC (right panel) run. The shaded areas indicate
- I 1-value greater than 4 ms- day- ......•..••...............................•..............•.. 139
6.14 Vertical-radius cross-section of radial wind (m S-/) in the ClL]TC (left panel) and EXP_NPTC (right panel) at 1200 UTC 24 August ..................................... 140
6.15 Potential temperature vs. radius cross sections of E-P flux vectors and their divergence at 0600 UTC 24 August (a) and 1200 UTC 25 August 2000 (b) in ClL ]TC. The vertical component (eddy heat flux) of E-P flux is scaled by I xl ct. Contour interval is 3xIrt Pa m2
KI s-2 ••••••••••••••••••••••••••••••••••••••••••••••••• .141
xv

1.1 Background
CHAPTER 1
INTRODUCTION
Tropical cyclones, also popularly known as hurricanes or typhoons, are among the
most spectacular and deadly geophysical phenomena. Technically, a tropical cyclone is a
cyclone that originates over tropical oceans and is driven principally by the heat transfer
from the ocean. Mostly for the purpose of providing useful warnings, tropical cyclones
are categorized according to their maximum wind speed, defined as the maximum speed
of the wind at an altitude of lO m, averaged over lO min (except in the United States,
where a 1 min average is conventional). Tropical cyclones in their formative stage, with
maximum winds of 17 ms-! or less, are known as tropical depressions; when their wind
speeds are in the range of 18 to 32 ms-I, inclusive, they are called tropical storms,
whereas tropical cyclones with maximum winds of 33 ms-! or greater are called
hurricanes in the western North Atlantic and eastern North Pacific regions, typhoons in
the western North Pacific, and severe tropical cyclones elsewhere.
The challenge of understanding tropical cyclogenesis has been an area of great
interest in tropical meteorology for over 50 years. The earliest investigators recognized
the critical role that deep, moist, convective updrafts must play in overcoming the
inhibition to organized vertical motion caused by the strong static stability of the
atmosphere, even in the tropics (Malkus and Riehl 1960; Riehl and Ma1kus 1961; Gray
1968). Gray (1968) showed that genesis only occurs in environments characterized by

sma1l vertical shear of the horizontal wind and also favors regions of relatively large
cyclonic low-level vorticity. He later established a set of conditions that are apparently
necessary (though by no means sufficient) for genesis (Gray 1979). In addition to the two
aforementioned factors, Gray argued that larger values of the Coriolis parameter, the heat
content of the upper ocean (reflecting the depth of the ocean mixed layer), and the
relative humidity of the middle troposphere all favor geneses.
Theories to explain the feedback between deep convections and the surrounding
large-scale motions were developed that explained TC genesis as a fundamental
instability of the tropical atmosphere to sma1l perturbations (Charney and Eliaseen 1964;
Ooyarna 1982). These ideas were ultimately found to be inconsistent with the observation
that only a smaIl fraction of seemingly appropriate tropical disturbances make the
transition to a tropical cyclone. In the last 25 years, the widely-held view has evolved to
the idea that TC genesis can be thought of as a "finite-amplitude" instability, in that a
pre-existing disturbance of some strength, such as an easterly wave, monsoon depression,
or even a baroclinic cyclone is required for genesis (McBride 1981; McBride and Zehr
1981; Frank 1987; Rotunno and Emanuel 1987; Emanuel 1989).
With the understanding that genesis requires a pre-existing disturbance of sufficient
amplitude, the natural question has turned to how such a "sufficient" disturbance forms in
the first place, and how to differentiate between the many "sufficient-appearing"
disturbances that do and do not become tropical cyclones. Numerous observations have
showed that there are many routes to generate disturbances, including nearly classic
barocIinic development (Bosart and BartIo 1991), interaction of easterly waves or other
lower level disturbances with tropical upper tropospheric disturbances (Ramage 1959,
2

Sadler 1976, Montgomery and Farrell 1993), and the accumulation of wave energy in the
diffluent large-scale flows (Shapiro 1977, Sobel and Bretherton 1999).
Furthermore, some studies (Dickinson and Molinari 2002; Zhou and Wang 2007)
showed that the disturbance may be from a mixed Rossby-gravity wave packet. Chen and
Frank (1993) and Ritchie and Holland (1997) suggested mesoscale vortices formed in
some mesoscale convective systems (MCSs) might develop under favorable conditions
into tropical cyclones. The merger and/or axisymmetrization of pre-existing vortices are a
possible or perhaps necessary step in this process. Based on observations of TC genesis
in the Pacific, Ritchie and Holland (1997) and Simpson et al. (1997) proposed that the
formation and then merger of mesoscale vortices generated by convective complexes,
with scales of 100 to 200 kIn, can lead to a single mesoscale convective vortex that may
then develop into a tropical cyclone. Davis and Bosart (2001) found that a similar process
was at work, mostly on smaller scales (perhaps 20-40 km), in a mesoscale model
simulation of the formation of Hurricane Diana (1984). As computing power and
observational technologies have allowed for both the observation and simulation of
smaller and smaller scales, the vortex merger concept has focused more closely on much
smaller vortices associated with individual convective events or even individual updrafts.
When the grid spacing of the Diana simulation was decreased from 9 to 3 kIn, Davis and
Bosart (2002) and Hendricks et al. (2004) found a close correlation between convective
updrafts and vorticity anomalies, and that the mesoscale vortex that later developed into
the primary circulation appeared to develop from the interactions and merger of the
positive vorticity anomalies. Hendricks et al. (2004) introduced the notion of "vortical hot
towers" (VHTs) that are strong cumulus updrafts that generate strong vorticity anomalies
3

of both positive and negative sign. They proposed that VHTs have an important and
possibly necessary role in TC genesis, by generating the larger-valued positive vorticity
anomalies that then organize and coalesce into the smaller-scale (as compared to the
surrounding mesoscale), and the stronger vortex eventually becomes the core of a
developing cyclone. They also proposed that the process of "diabatic vortex merger" was
important, whereby interacting, like-signed vortices initiate new convective updrafts that
then accelerate the merger process.
The enhancement of mid-level vorticity by the stratiform precipitation and the
consequential low-level cooling and saturation were also realized as important in the
aforementioned papers of Ritchie and Holland (1997) and Simpson et al. (1997). Another
element of their arguments was that the merger of mid-level, mesoscale vortices leads to
a greater penetration depth of the circulation, thus increase the low-level vorticity. Based
on observations of the genesis of Hurricane Guillermo, Bister and Emanuel (1997)
proposed that the key process leading to genesis was the saturation and cooling of the
lower and middle levels of the mesoscale convective vortex, due to detrainment,
precipitation and evaporative cooling. While also a necessary consequence of
maintaining thermal wind balance as the mid-level vortex strengthens, lowering of the
temperature in the middle and lower levels serves two additional purposes toward TC
genesis: it brings the lower atmosphere closer to saturation, and it destabilizes the lower
atmosphere to moist convection from boundary layer parcels that have had time to
"recover" from the last downdraft. As the atmosphere approaches "near" saturation from
the boundary layer up to the middle and upper levels, each successive updraft is
associated with less and less downdrafts and precipitation cooling, leading to a rapid
4

increase in low-level vorticity by the convergence and stretching. Once each convective
updraft can cause a significant increase in the low-level wind field, the wind-induced
surface heat exchange (WISHE) feedback will amplify the intensity and duration of the
next updraft, leading to steady or mpid intensification of the cyclone. In a study of the
same storm and two others in the same region, Raymond et al. (1998) also found that the
vorticity was maximized in the middle levels before genesis, and that genesis was
preceded by an increase in the mid-level humidity and a decrease in the fraction of
downdraft mass flux.
Besides the above tropical cyc10genesis scenarios, another interesting scenario is the
tropical cyclogenesis from a Rossby wave train induced by a pre-existing TC. The
connection between TC energy dispersion (TCED) induced Rossby wave train and
tropical cyclogenesis has been suggested (e.g., Fmnk 1982; Davidson and Hendon 1989;
Holland 1995; Briegel and Fmnk 1997; Ritchie and Holland 1997; Li and Fu 2006).
Holland (1995) numerically showed that sequential TCs might be generated due to TCED
in the west North Pacific. While the TC moves northwestward due to the mean flow
steering and the planetary vorticity gradient, Rossby waves emit energy southeastward.
As a result, a synoptic-scale wave train with alternating anti-cyclonic and cyclonic
vorticity perturbations forms in its wake. A new tropical cyclone will likely develop in
the cyclonic circulation region under favomble environmental conditions. In the
following section, we will review the previous studies on the Rossby wave energy
dispersion, and then propose my scientific questions.
Investigations on the energy dispersion of a barotropic vortex (e.g., Anthes 1982;
Flierl 1984; Chan and Williams 1987; Luo 1994; Carr and Elsberry 1995; McDonald

1998; and many others) indicated that an intense tropical cyclone (TC) is subject to
Rossby wave energy dispersion in the presence of the planetary vorticity gradient, namely,
the beta effect. While a TC moves westward and poleward due to the beta effect (which
induces asymmetric ''ventilation'' flow over the TC core), Rossby waves emit energy
eastward and equatorward. As a result, a synoptic-scale wave train with alternating
anticyclonic and cyclonic vorticity perturbations forms in its wake.
Using a non-divergent barotropic model, Carr and Elsberry (1995) examined the
establishment of the Rossby wave train induced by energy dispersion processes. They
noted that the dispersion of a cyclonic vortex involves both the linear (beta term) and
nonlinear (advection term) processes. In the beginning, the initial axisymmertry of the TC
precludes any nonlinear vorticity advection since the relative vorticity isolines and
streamfunction contours are parallel. Thus, only the linear j3v term contributes to the
relative vorticity tendency, with an absolute minimum (maximum) to the east (west) of
the TC. This associated j3-induced ridging to the eastern side and troughing to the west
then compresses the eastern side and stretches the western side of the vortex, respectively.
As this distortion occurs, isolines of vorticity and streamfunction are no longer parallel,
which generally produces negative (positive) relative vorticity advection in the southern
(northern) semicircle. The largest negative relative vorticity advection is to the southeast
of the TC center and has a magnitude several times that of the I3v term. As a result, the
associated maximum ridging is to the southeast of the TC and a Rossby wave train
pattern is generated eventually. In short, it is the combination of the two processes that
determines the wavelength and orientation of a Rossby wave train. It has also been
demonstrated that the tropical cyclone energy dispersion (TCED) may affect both the
6
motion and structure of the TC. Carr and Elsberry (1995) suggested that TCED might
lead to a sudden poleward tum for some special TC cases.
Using satellite products from the QuikSCAT, Li and Fu (2006) revealed the
horizontal structure of Rossby wave train pattern associated with energy dispersion of a
pre-existing typhoon over the western North Pacific. As the QuikSCAT products provide
only the near-surface winds, it cannot reveal the vertical structure of the wave train. Most
previous TCED studies are also confined in the barotropic dynamical framework (Flierl
1984; Chan and Williams 1987; Luo 1994; Carr and Elsberry 1995; and among many
others). Studies with the three-dimensional (3D) models have mainly focused on TC
motion within 3-5 days before the significant energy propagation occurs (e.g., Wang and
Li 1992; Shapiro et al. 1992; Wang and Holland 1996a, b). Therefore, the 3D Rossby
wave train formation is not well understood and needs further examinations.
1.2 Motivations
In reality, a TC has a strong baroclinic structure with upper (lower) level
anticyclonic ( cyclonic) circulation. Therefore, the barotropic model cannot describe the
moist diabatic process that is essential for the maintenance of the TC circulation. In this
study, a baroclinic primitive equation model is used to understand the evolution and
structure characteristics of the 3D Rossby wave train induced by the TCED, with a focus
on the connection between the upper and lower tropospheric asymmetric circulations. An
understanding of the 3D Rossby wave train may give insights into the fundamental
mechanisms responsible for TC formation, which may help to improve cyclogenesis
forecasting capability.
7

The overall goal of this research is to understand how the 3D Rossby wave train
associated with a pre-existing mature TC forms and how does it trigger a new TC in the
wake. After examining the Rossby wave train in a resting environment, we will examine
how the TCED and its associated cyclogenesis are modulated by the environmental flows.
By specifying various basic state flows, we can understand the evolution characteristics
ofTCED in different environmental flows. A particular interest is how the TCED-induced
Rossby wave leads to a new TC.
The dissertation is organized as the follow. In chapter 2, the models used are
descried briefly. In chapter 3, the formation of Rossby wave train associated with a 3D
baroclinic vortex in an environment at rest is investigated. In chapter 4, TCED in various
environmental flows such as flows with different vertical shears are explored. In chapter
S, the connection between tropical cyclone energy dispersion and synoptic-scale wave
trains is examined. A possible self-maintained synoptic-scale wave train can be triggered
through continuing tropical cyclogenesis triggered by the interaction between TCED and
large-scale ITCZ. In chapter 6, a real case simulation is performed to examine the nature
of TC genesis associated with TCED scenario. Particular interest is to verify the possible
mechanisms accounting for the interactions between a developing tropical disturbance
and the preexisting TC in nature. Finally, some major conclusions and remaining
questions are presented in chapter 7.
8

2.1 Model descriptions
CHAPTER 2
MODELS
Both simple TC model (TCM3) and real operational prediction systems (MM5) are
used in this study. The simple TC model (TCM3) has been widely used to study the
different aspects of TC dynamics. Since it is much easier to specify the initial conditions.
and change the model code such as specifying different beta (t) plane, we can use this
simple model in the idealized numerical simulations. In a real case simulation, it requires
the both realistic boundary and initial conditions, and the complicated parameterization
schemes such as radiation scheme to reproduce the realistic atmosphere state. Due to its
complexity, it requires more powerful model such as MM5 or WRF with sophisticated
modeling software and meteorological data.
The simple numerical model used in this study is the uniform grid version of the
triply nested, movable mesh primitive equation model-TCM3. A detailed description of
the model can be found in Wang (1999, 2001, 2002a). The model is a hydrostatic
primitive equation model formulated in Cartesian coordinates in the horizontal plane with
a (pressure normalized by the surface pressure) vertical coordinate. The model consists
of 21 layers in the vertical from 0=0 to 0= 1 with a higher resolution in the planetary
boundary layer (PBL). The layer interfaces are placed at 0=0.0, 0.04, 0.07, 0.09, 0.11,
0.14, 0.17, 0.21, 0.27, 0.35, 0.45, 0.55, 0.65, 0.74, 0.82, 0.88, 0.93, 0.96, 0.984. 0.994.
9

and 1.0. The model prognostic variables are placed on the Arakawa A grid. Tune
integration in the dynamic stage is performed by one step of the Euler-backward method
followed by multiple steps of second-order leapfrog schemes. Here the Euler-backward
scheme is used to suppress the high frequency noise associated with the unstaggered grid
and computation mode associated with the leapfrog scheme. The full time integration is
concluded with a physical process stage. The time integration scheme and the
second-order finite differencing scheme used in the model conserve both mass and energy.
The forward-in-time upstream advective scheme developed by Wang (1996) has a third
order accuracy for time dependent and non-uniform flow with very weak dissipation,
very sma1l phase error and good shape-preserving properties (WU 1999).
The model physics include an E-£ turbulence closure scheme for sub-grid scale
vertical mixing above the surface layer (Langland and Liou 1996), a modified
Monin-Obukhov scheme for the surface flux calculations (Fairall et al. 1996), an explicit
treatment of mixed ice phase cloud microphysics (Wang 1999,2001), and a fourth-order
horizontal diffusion with a deformation-dependent diffusion coefficient. The model
prognostic variables consist of zonal and meridional winds, surface pressure, temperature,
turbulence kinetic energy and its dissipation rate, and mixing ratios of water vapor, cloud
water, rain water, cloud ice, snow and graupel. This model has been used for studies of
various aspects of tropical cyclones (e.g., Wang et al. 2001; Wang 2002b, c).
Although TCM3 provides movable mesh and triply nested functions, we use a
single mesh with a uniform grid spacing of 30 km to reduce the potential mesh interface
effect on the structure of the wave train. The horizontal mesh consists of 271 x201 grid
points, so that the model domain covers an area of 8100 km by 6000 km centered at 18"N.
10

A strong damping is specified at a sponge layer near the model lateral boundaries to
minimize artificial wave reflection into the model interior. At this resolution, the mass
flux convective parameterization scheme (TIedtke 1989) is used to calculate the effect of
subgrid-scale cumulus convection.
In Chapter 6, the fifth-generation Pennsylvania State University-National Center for
Atmospheric Research Mesoscale model (MM5) is employed to conduct a real case
simulation. This model solves the nonlinear, primitive equations using Cartesian
coordinates in the horizontal and a terrain-following sigma coordinate in the vertical. It is
widely used in the both operational forecasting and meteorological research community
(Dudhia 1993; Grell et al. 1994). In this case study, the model consists of 23 layers in the
vertical with the model top at 50 hPa. The domain has a uniform horizontal resolution of
30 km, and Betts-Miller convective scheme (Betts and Miller 1986) is used to
parameterize the sub-grid scale heating. The Blackadar bulk formulation (Hong and Pan
1996) is used for the boundary layer process. SST field comes from the NCEP/NCAR
global analysis and updates with the model integration. The NCEP/NCAR analysis also
provides the first-guess fields for the initial condition of the experiment.
2.2 Initial conditions
Since our goal is to understand the internal dynamics of 3D energy dispersion of a
mature TC, we focus on the evolution of TC on a beta-plane in a quiescent environment.
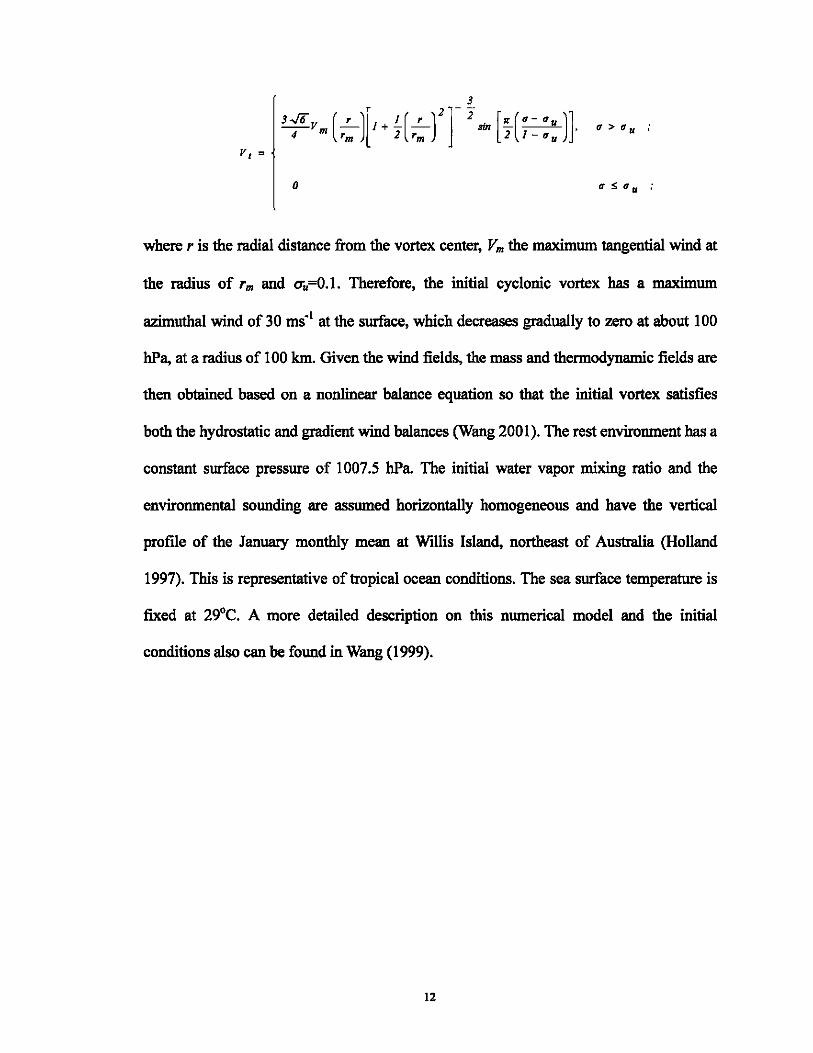
The initial axis-symmetric bogus vortex has a radial and vertical tangential wind profile
as follows:
11
3
3~Vm [,: J[J+ f[,: rr 2 am [T[;= :: J]. q> ••
V, ~
o
where r is the radial distance from the vortex center, Vm the maximum tangential wind at
the radius of rm and 0".=0.1. Therefore, the initial cyclonic vortex bas a maximum
azimuthal wind of 30 ms- l at the surface, which decreases gradually to zero at about 100
hPa, at a radius of 100 km. Given the wind fields, the mass and thermodynamic fields are
then obtained based on a nonlinear balance equation so that the initial vortex satisfies
both the hydrostatic and gradient wind balances (Wang 2001). The rest environment bas a
constant surface pressure of 1007.5 hPa. The initial water vapor mixing ratio and the
environmental sounding are assumed horizontally homogeneous and have the vertical
profile of the January monthly mean at Willis Island, northeast of Australia (Holland
1997). This is representative of tropical ocean conditions. The sea surface temperature is
fixed at 29°C. A more detailed description on this numerical model and the initial
conditions also can be found in Wang (1999).
12

CHAPTER 3
THREE-DIMENSIONAL TROPICAL CYCLONE ENERGY
DISPERSION IN AN ENVIRONMENT AT REST
3.1 Introduction
As we discussed in the Chapter 1, the aspects such as horizontal structure of TCED
are well understood within barotropic dynamics framework. Using satellite products from
the QuikSCAT, Li and Fu (2006) revealed the horizontal structure of Rossby wave train
pattern associated with energy dispersion of a pre-existing typhoon over the western
North Pacific. As the QuikSCAT products provide only the near-surface winds, it cannot
reveal the vertical structure of the wave train. Most previous TCED studies are also
confined in barotropic dynamical frameworks (Flierl1984; Chan and Williams 1987; Luo
1994; Carr and Elsberry 1995; and among many others). The vertical structure of wave
train has not been examined yet. Studies with the three-dimensional (3D) models have
mainly focused on TC motion within 3-5 days of the model simulation before the
significant energy propagation occurs (e.g., Wang and Li 1992; Shapiro et al. 1992; Wang
and Holland 1996a, b). In reality, a TC has a baroclinic structure with upper level
anticyclonic circulation and lower level cyclonic circulation. With regard to this aspect,
the differential of inertial instability and beta-effect with elevation will lead to distinct
evolution characteristics at different vertical levels. Therefore, it is important to
investigate the formation of Rossby wave train for a 3D baroclinic vortex, with a special
attention on the connection of upper and lower tropospheric asymmetric circulations.
13
It is well known that the moist diabatic process is essential for maintaining the TC
circulation. Wang and Li (1992) suggested that the vertical coupling by convective
heating might maintain an integral circulation system with cyclonic vorticity below and
anticyclonic vorticity aloft. Wang and Holland (1996) showed that the motion and
evolution of the diabatic vortex could substantially differ from that of adiabatic vortex.
Moreover, barotropic model cannot describe the moist diabatic process that is essential
for maintaining the TC circulation. Since TCED is sensitive to the structure of TC, it is
speculated that the energy dispersion of diabatic vortex will differ from that of adiabatic
one. Thus, it is important to investigate the possible roles of diabatic heating in the
development of 3D Rossby wave train.
This chapter is organized as follows. The experimental designs are described in
section 3.2. The 3D structure and evolution characteristics of the TCED-induced Rossby
wave train are presented in section· 3.3. The generation of the upper-tropospheric
asymmetric outflow jet is discussed in section 3.4. In section 3.5, the impact of the
upper-level jet on the 3D energy dispersion is examined. The role of diabatic heating in
forming the Rossby wave train is examined in section 3.6. Major findings and discussions
are summarized in the last section.
3.2 Experiment Designs
Four major numerical experiments are designed (see Table 3.1). The benchmark
experiment (CTL) is a case with diabatic heating on the beta plane. The DRY experiment
is a case without diabatic heating. In the presence of diabetic heating, the BETA_HIGH
and BETA_LOW are cases where the beta effect is included only in the upper and the
14
lower troposphere, respectively. By comparing the CTL with the other cases, we will
investigate the roles ofvertical coupling between the upper- and lower-levels and diabatic
heating in the formation of 3D Rossby wave train. Each experiment is run for 10 days.
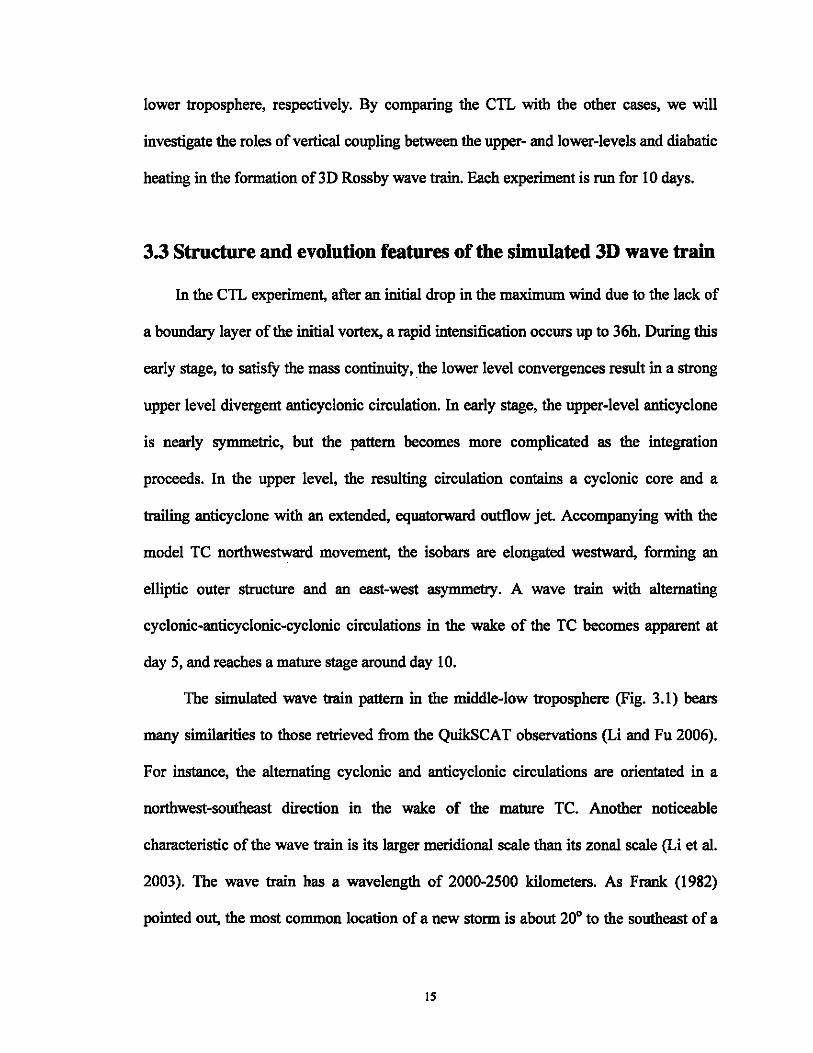
3.3 Structure and evolution features of the simulated 3D wave train
In the CTL experiment, after an initial drop in the maximum wind due to the lack of
a boundary layer of the initial vortex, a rapid intensification occurs up to 36h. During this
early stage, to satisfy the mass continuity, ,the lower level convergences result in a strong
upper level divergent anticyclonic circulation. In early stage, the upper-level anticyclone
is nearly symmetric, but the pattern becomes more complicated as the integration
proceeds. In the upper level, the resulting circulation contains a cyclonic core and a
trailing anticyclone with an extended, equatorward outflow jet. Accompanying with the
model TC northwestward movement, the isobars are elongated westward, forming an
elliptic outer structure and an east-west asymmetry. A wave train with alternating
cyclonic-anticyclonic-cyclonic circulations in the wake of the TC becomes apparent at
day 5, and reaches a mature stage around day 10.
The simulated wave train pattern in the middle-low troposphere (Fig. 3.1) bears
many similarities to those retrieved from the QuikSCAT observations (Li and Fu 2006).
For instance, the alternating cyclonic and anticyclonic circulations are orientated in a
northwest-southeast direction in the wake of the mature TC. Another noticeable
characteristic of the wave train is its larger meridional scale than its zonal scale (Li et al.
2003). The wave train has a wavelength of 2000-2500 kilometers. As Frank (1982)
pointed out, the most common location of a new storm is about 20° to the southeast of a
15
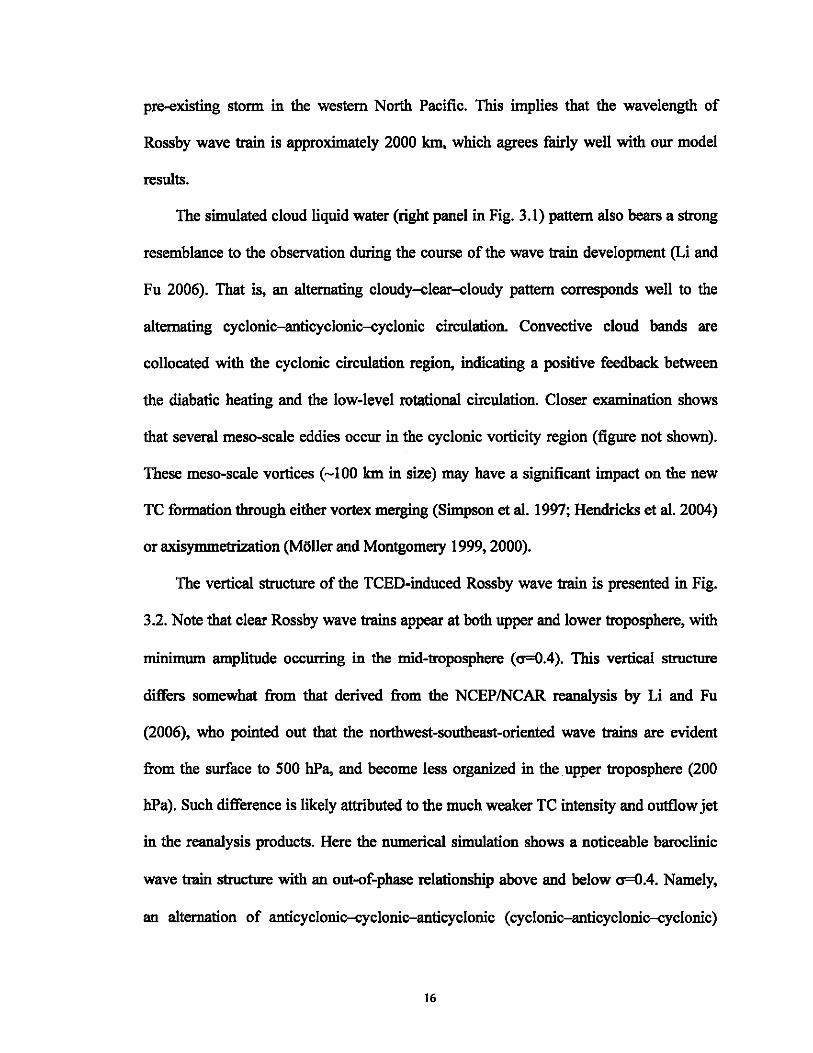
pre-existing storm in the western North Pacific. This implies that the wavelength of
Rossby wave train is approximately 2000 kIn, which agrees fairly well with our model
results.
The simulated cloud liquid water (right panel in Fig. 3.1) pattern also bears a strong
resemblance to the observation during the course of the wave train development (Li and
Fu 2006). That is, an alternating cloudy-dear--cloudy pattern corresponds well to the
alternating cyclonic-anticyclonic--cyclonic circulation. Convective cloud bands are
collocated with the cyclonic circulation region, indicating a positive feedback between
the diabatic heating and the low-level rotational circulation. Closer examination shows
that several meso-scale eddies occur in the cyclonic vorticity region (figure not shown).
These meso-scale vortices (-100 kIn in size) may have a significant impact on the new
TC formation through either vortex merging (Simpson et al. 1997; Hendricks et al. 2004)
or axisymmetrization (M6ller and Montgomery 1999,2000).
The vertical structure of the TCED-induced Rossby wave train is presented in Fig.
3.2. Note that clear Rossby wave trains appear at both upper and lower troposphere, with
minimum amplitude occurring in the mid-troposphere (0=0.4). This vertical structure
differs somewhat from that derived from the NCEP/NCAR reanalysis by Li and Fu
(2006), who pointed out that the northwest-southeast-oriented wave trains are evident
from the surface to 500 hPa, and become less organized in the. upper troposphere (200
hPa). Such difference is likely attributed to the much weaker TC intensity and outflow jet
in the reanalysis products. Here the numerical simulation shows a noticeable baroclinic
wave train structure with an out-of-phase relationship above and below 0=0.4. Namely,
an alternation of anticyclouic--cyclonic-anticyclonic (cyclonic-anticyclonic--cyclonic)
16

circulation occurs at the upper (lower) levels. The generation of the baroclinic Rossby
wave train results primarily from the baroclinic TC structure induced by the diabatic
heating. The upper level wave branch has larger amplitude but is shallower than the lower
level counterpart, which is mainly due to the shallower anticyclonic outflow layer in the
upper troposphere.
To illustrate the temporal evolution of the Rossby wave train, we display the time
sequence of the vertical-radius profiles of relative vorticity fields along a
northwest-southeast oriented axis (i.e., the dashed line in the left panel of Fig. 3.1,
roughly the axis of the wave train) following the TC motion (Fig. 3.3). To highlight the
Rossby wave train in the wake, the vertical-radius cross section is presented only from
the radial distance of 500 km to 3000 km away from the TC center. Initially, a weak
positive relative vorticity perturbation develops in the upper troposphere (0=0.15). This
positive perturbation intensifies and extends gradually both outward and downward. For
instance, the region of relative vorticity greater than 0.5xl0-5 S-1 (shaded area) reaches the
PBL at day 7. Thereafter, a positive vorticity perturbation centers at the radius of 2200
km in the PBL, coinciding with the low-level cyclonic circulation region of the Rossby
wave train (Fig. 3.2). The vorticity perturbations at the southeast quadrant appear to tilt
northwestward with height. As a result, a first-baroclinic mode vertical structure appears
in the wave train.
Similar downward development features appear in the kinetic energy (KE= u2
+v2
; 2
as shown in Fig. 3.4) and PV fields. For example, a KE maximum center associated with
an upper tropospheric outflow jet initially occurs at 0=0.15, then extends progressively
both outward and downward (the center does not move outward). The outward and
17

downward energy propagation will lead to a tilting of the maximum KE band towards the
TC center with height.
The evolution of the relative humidity (RH) associated with the Rossby wave train is
displayed in Fig. 3.5. The middle-low level RH is little disturbed before day 6. Thereafter,
a deep moist layer with high RH develops rapidly over the positive vorticity region of the
wave train. For example, the 50% contour of RH reaches cr=O.3 in the cyclonic
circulation region at day 10. This deep moist layer is primarily attributed to the enhanced
convective activities, since the cyclonic vorticity at the PBL may enhance upward
moisture transport through Ekman pumping. The enhanced convective heating may
further intensify the low-level cyclonic vorticity within the Rossby wave train.
The time sequence of relative vorticity at the northwest quadrant is also examined.
Similar to the southeast quadrant, a maximum vorticity perturbation occurs at the upper
levels (Fig. 3.6). However, there is no downward penetration of the vorticity, and no
lower level Rossby wave train develops. The preferred southeast quadrant for the wave
train development is attributed to the asymmetry of the Rossby wave energy propagation
(Chan and Williams 1987; Luo 1994). Li et al. (2003) argued that the larger (smaller)
meridional (zonal) length scale of the wave train is essential for the southeastward energy
propagation. Based on the Rossby wave dispersion relationship, wave energy propagates
eastward when the meridional wavelength exceeds the zonal wavelength, and an opposite
sign of the zonal and meridional wavenumber (corresponding to a northwestward phase
speed) leads to a southward energy propagation component. The combination of these
two factors leads to a southeastward energy propagation. The southeastward energy
dispersion is clearly demonstrated in terms of the time-radius cross section of KE
18

(Fig.3.7). The KE at both upper and lower levels propagates southeastward, radiating
away from the TC center. Note that at the upper level, a secondary KE maximum center
develops much faster (day 1) compared with that at the lower level (about day 6).
To summarize, while the basic features of the lower level wave train resemble those
derived from the barotropic dynamic framework, new features associated with 3D TCED
are revealed That is, a positive vorticity perturbation associated with outflow jet is
generated first at the upper levels, followed by a downward propagation. Given the
complex 3D energy dispersion characteristics, the following questions need to be
addressed: What results in the asymmetric upper-level outflow jet? What role does this
outflow jet play in the development of the lower level wave train? And what causes the
vertical tilting of the Rossby wave train? These questions are explored in the subsequent
sections.
3.4 Development of an asymmetric outflow jet
The TCED-induced Rossby wave train is an essentially beta-induced asymmetric
circulation. Compared with the barotropic vortex, one salient feature in the baroclinic TC
is the more complex upper level circulation. Figure 3.8 illustrates how an upper outflow
jet is generated In the early stage, the upper-level circulation is approximately symmetric.
It is the energy dispersion that leads to the development of an asymmetric intense outflow
jet at the southeast quadrant. Slightly outside of this outflow jet is a narrow belt of
positive vorticity. This upper outflow jet is confined within a shallow layer between
0=0.1 and 0.3, with maximum amplitude at 0=0.15 (about ISO bPa, Fig. 3.4).
19
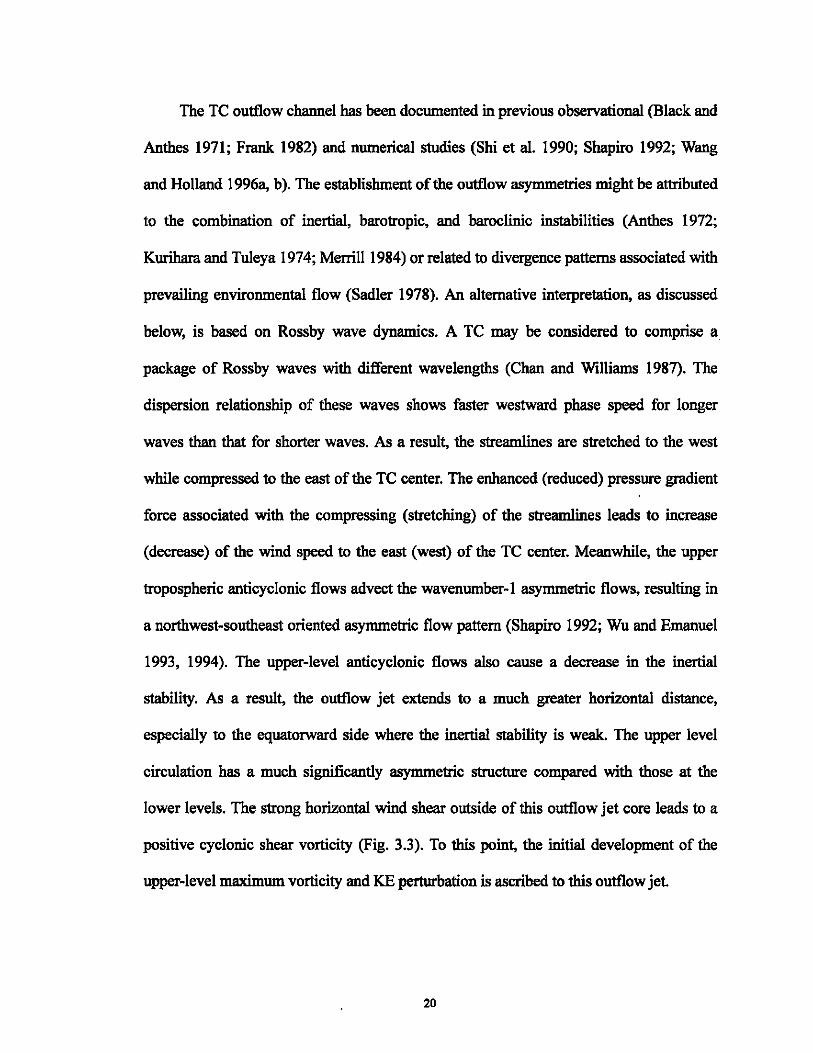
The TC outflow channel has been documented in previous observational (Black and
Anthes 1971; Frank 1982) and numerical studies (Shi et al. 1990; Shapiro 1992; Wang
and Holland 199630 b). The establishment of the outflow asymmetries might be attributed
to the combination of inertial, barotropic, and barocJinic instabilities (Anthes 1972;
Kurihara and Tuleya 1974; Merrill 1984) or related to divergence patterns associated with
prevailing environmental flow (Sadler 1978). An alternative interpretation, as discussed
below, is based on Rossby wave dynamics. A TC may be considered to comprise a
package of Rossby waves with different wavelengths (Chan and Williams 1987). The
dispersion relationship of these waves shows faster westward phase speed for longer
waves than that for shorter waves. As a result, the streamlines are stretched to the west
while compressed to the east of the TC center. The enhanced (reduced) pressure gradient
force associated with the compressing (stretching) of the streamlines leads to increase
(decrease) of the wind speed to the east (west) of the TC center. Meanwhile, the upper
tropospheric anticyclonic flows advect the wavenumber-l asymmetric flows, resulting in
a northwest-southeast oriented asymmetric flow pattern (Shapiro 1992; Wu and Emanuel
1993, 1994). The upper-level anticyclonic flows also cause a decrease in the inertial
stability. As a result, the outflow jet extends to a much greater horizontal distance,
especially to the equatorward side where the inertial stability is weak. The upper level
circulation has a much significantly asymmetric structure compared with those at the
lower levels. The strong horizontal wind shear outside of this outflow jet core leads to a
positive cyclonic shear vorticity (Fig. 3.3). To this point, the initial development of the
upper-level maximum vorticity and KE perturbation is ascribed to this outflow jet
20

3.5 Impacts of the upper-level jet on 3D energy dispersion
In section 3.3, we illustrate the different evolution features ofupper and lower wave
branches. For a baroclinic vortex, away from the TC core region, the tangential wind
decreases with height and radius, and the inertial stability decreases both outward and
upward. Hence, the upper-level asymmetric circulation develops more rapidly and
extends further outward, especially equatorward, due to lower inertial stability associated
with the anticyclonic flow and the smaller Coriolis parameter. On the other hand, the
stronger lower level cyclonic flows result in a much larger inertial instability, thus the
circulations are less asymmetric and more concentrated in the TC core region (Smith and
Montgomery 1995). Therefore, the lower (larger) inertial instability may lead to faster
(slower) development of upper (lower) level wave branch, which may partly account for
the downward development shown in section 3.3.
For the 3D TCED, key questions are how the upper and lower-level wave trains are
related and what role the outflow jet plays in the formation of lower-level wave trains. To
address these questions, two additional experiments are designed (see table 1). In
Beta_High, we specify a beta plane «-plane) above (below) 0=0.3. In Beta_Low, an
f-plane (beta plane) is applied above (below) 0=0.3. The reason to choose 0=0.3 as a
turning point is because the outflow layer is usually confined above this level. By
specifying an upper levelf-plane, we can remove the asymmetric outflow jet so that the
upper tropospheric influence is suppressed. By specifying an f-plane below 0=0.3, we
filter out the lower level barotropic Rossby wave energy dispersion while retaining the
asymmetric upper-level outflow jet. Therefore, by comparing these two experiments with
21

ClL, we may learn the relative roles of the upper and lower asymmetric circulations in
the formation of the 3D Rossby wave train.
The removal of the beta term in either lower or upper layers may create a
discontinuity and sharp vertical gradients of the planetary vorticity. To examine this
possible "side" effect, we have closely examined the vertical cross section of various
meteorological variables (such as vorticity, temperature, geopotential height) across the
interface. Our diagnostics show that no significant "noise" or "disturbances" occur at the
interface (Fig. 3.9). It is likely that the vertical diffusion in the model may have smoothed
or reduced the discontinuity. To further check this potential problem, we further conduct
sensitivity experiments in which a transition layer (i.e., the Coriolis parameter changes
linearly from sigma=0.3 to sigma=O.5) is specified. The results show no significant
difference from our previous simulations. That is, the results are qualitatively similar as
long as the turning point is between 0=0.3 and 0.5.
Figure 3.10 displays the lower level wave train patterns at day 6 in the three
experiments. The Rossby wave train pattern is hardly discernable in Beta_High, whereas
it is clearly presented in both ClL and Beta_Low, although the strength of the wave train
is greater in ClL. The difference among the three experiments can be further
demonstrated in terms of the PV fields (Fig. 3.11). In ClL, wave trains with an
alternating PV trough and ridge appear at both upper and lower levels. In Beta_Low, a
weaker lower level wave-like pattern is identified. The upper level PV is approximately
symmetric about the TC center, indicating no upper wave train. In Beta_High, along with
an upper-level asymmetric outflow jet and its associated PV perturbation band, the upper
level wave is obvious at the southeast quadrant. However, the lower level PV is nearly
22

symmetric and is confined within the TC core region, thus no lower level wave exists.
The results indicate the importance of the beta effect in the generation of the wave train.
The difference in the strength of wave trains between CTL and Beta_Low is likely
ascribed to the upper level influence. That is, an intense asymmetric outflow jet exists in
CTL, whereas no such an entity in Beta_Low. The outflow channel has been realized to
affect the TC intenSity (Black and Anthes 1971; Frank 1977; Holland 1983; Merrill 1988;
Rappin 2004). As shown in Fig. 3.12, the TC intensity (represented by central minimum
sea level pressure, MSLP) is much weaker in Beta_Low than in CTL. For instance, the
MSLP is 970hPa (945 hPa) in Beta_Low (CTL) at day 6. Moreover, comparison of the
azimuthally mean tangential winds (cr=O.9) reveal that both the TC strength and size are
larger in CTL as well. It suggests that a near-symmetric upper-level flow leads to a
weaker TC (Beta_Low), and an asymmetric outflow jet favors a more intense TC (CTL).
TCED depends greatly on the TC size/structure (Flier et aI. 1983; Chan and Williams
1987; Carr and Elsberry 1995) and intensity (Li and Fu 2006). Therefore, a weaker
Rossby wave train in Beta_Low is likely due to the weaker TC intensity and smaller size
in the absence of an upper-level outflow jet. It is consistent with the composite study by
Merri11 (1988), who summarized the outflow layer differences between intensifying and
non-iritensifying hurricanes (see their Fig. 11) and found that the outflow layer with an
"open" ("closed',) streamlines pattern corresponds to intensifying (non-intensifying)
cases. To assert that the weaker TC is due to the absence of the beta effect-induced
asymmetric outflows, an additionalf-plane simulation is conducted. The result shows that
the simulated TC in Beta_High has a stronger tangential wind (-52 ms-I) than that in the
f-plane simulation (-45 ms-I) (Fig. 3.13). Meanwhile, the beta-plane storm has a
23

relatively larger size than the f-plane storm. This supports our claim that the upper level
outflow may influence the TC intensity and size.
In Emanuel (1986), the TC secondary circulation is treated as an idealized Carnot
heat engine where energy input by air-sea interaction is balanced by frictional dissipation
in the boundary layer and outflow layer (energy is drained expanding the outflow
anticyclone against the ambient cyclonic rotation of the environment). Rappin (2004)
suggested symmetric expansion led to large energy expenditures that were manifested in
large anticyclonic kinetic energies. Asymmetric expansion into regions of weak resistance
led to stna11 energy expenditures and therefore stna11 anticyclonic kinetic energies. To this
point, the larger energy expenditures in Beta_Low will result in a weaker TC. However,
how the asymmetric outflow jet influences the TC size through the extent of the
secondary circulation is unclear. To clarify this issue, we need further study.
To demonstrate the impact of the upper tropospheric circulation on the energy
dispersion, the E-P flux is used to diagnose the wave energy propagation and the
wave-mean flow interaction (Schubert 1985; Molinari et a1. 1995; Chen et a1. 2003).
Following Molinari et a1. (1995), the E-P flux divergence is written as
V F I a 2 ( )' , a ,arp' . = ---r auL "L +-p -rar ao a..t;
where F a [ _ r( CT1h )'lIL p' aai '] is the E-P flux vector, which is calculated on cylindrical
coordinates, and the overbar represents the azimuthal mean. IT = _ ap is the eo
, , pseudodensity, uLand v L are the storm-relative radial and tangential winds,
, respectively, e is the potential temperature, IJI is the Montgomery streamfunction, and A.
is the azimuthal angle. The radial component of the E-P flux represents the eddy angular
24

momentum flux, while the vertical component is the eddy heat flux. Parallel to the wave
group velocity, the E-P flux vectors illustrate the wave energy propagation.
Figure 3.14 shows the radius-a cross sections of E-P flux vectors and their
divergence averaged from day 3 to 5 for the three experiments. In both CTL and
Beta_High, the greatest eddy activities appear on the 355K surface near the radius of
outflow jet, indicating the dominant eddy angular momentum fluxes in the upper levels.
Much weaker wave activities exist at the same a surface in Beta_Low. Meanwhile, the
largest V· F occurs in CTL and Beta_High at the 700km radius, where the anticyclonic
outflow is the largest. This implies that eddy activities are closely related to the
development of the upper level outflow jet. The larger upper level E-P flux vector implies
that the upper wave branch has a larger energy propagation speed than that of lower
levels, which is consistent with faster (slower) development of upper (lower) level wave
train. As expected, the slower response at the lower levels may explain partially the
downward development. Of particular interest is a significant difference in the lower
level energy propagation between CTL and Beta_High. In CTL, below the outflow layer
(say 6=355k), the E-P flux indicates both outward and downward energy propagation. In
Beta_High, the E-P flux shows weak downward propagation from the outflow layer, and
no horizontal energy propagation exists at the lower levels in the absence of the beta
effect. By the same reason, much weaker upper level eddy activities are observed in the
Beta_Low as the beta effect is excluded there. Note that no vertical component of the E-P
flux vectors can be identified in the middle-low troposphere, indicating no downward
energy propagation. Nevertheless, the low-level beta effect induces outward energy
propagation (bottom panel of Fig. 3.14), agrees well with the barotropic dynamics.
25

The results above suggest that the generation of 3D Rossby wave train is more
complicated than the pure barotropic dynamics. In a baroclinic TC, besides the outward
barotropic energy dispersion, the upper outflow layer circulation will induce downward
energy propagation. Therefore, both outward and downward energy propagation will
result in the downward-tilted development of the Rossby wave train (Fig. 3.4). While the
barotropic dynamics of the beta effect is essential for the generation of Rossby wave
trains, the upper level outflow jet may further enhance the lower level wave trains. For
example, in Beta_Low, the wave train cannot develop fully without the upper level
influence. Given that the E-P flux applied here only describes the azimuthal mean
contributions of asymmetric circulations, it may underestimate the wave activity flux at
the southeast quadrant. Despite of this weakness, comparisons of the wave activities in
these three experiments help to gain insights into how the upper tropospheric circulation
influences the 3D Rossby wave train.
3.6 Roles of diabatic heating
In this section, we will examine the role of diabatic heating in the TCED process. It
is well realized that the convective heating plays a major role in maintaining the TC
circulation system with cyclonic vorticity below and anticyclonic vorticity aloft. The
evolution of a diabatic vortex could substantially differ from that of an adiabatic one
(Wang and Li 1992, Wang and Holland 1996a). Given that TCED is sensitive to the
vertical structure of a TC, it is important to see how the energy dispersion characteristics
might change when the diabatic heating is turn off. A DRY experiment is designed in
which the model physics are turned off after 48 hours and the integration continues for
another 6 days.
26

Figure 3.15 displays the simulated Rossby wave train at day 5 (3 days after
diabatic heating is turned oft). A clear lower level wave train with alternating
cyc1onic-anticyclonic-cyclonic circulations appears in the wake, whereas such a feature is
hardly identified at that time in CTL. It indicates that the wave train forms much faster in
the absence of the diabatic heating. Meanwhile, a significant difference between CTL and
DRY is the evolution of outflow layer circulation. After initially spinning up, the vortex
has the same structure as that of CTL at day 2. An upper outflow jet is generated and
stretches from the vortex core to several hundred kilometers to the southwest. Once
diabatic heating is turned off, the outflow jet decays rapidly (Fig. 3.15). It suggests that
the diabatic heating will maintain the outflow jet against the energy dispersion. Figure
3.16 compares the vertical and radial profiles of azimuthally mean tangential and radial
winds between CTL and DRY. As expected, there is no clear upper-level anticyclonic
circulation in the DRY experiment. Furthermore, the lower-level maximum tangential
wind at day 4 is about 40 ms- l in CTL but only 25 ms- l in DRY, whereas the radius of
maximum wind increases from 90 km in CTL to 150 km in DRY. The weakening in the
primary circulation is accompanied by the suppressed secondary circulation.
The following two factors may explain the earlier development of the Rossby wave
train in DRY. One is related to change of the TC inflow in the outer region. As we know,
the inflow may modulate the Rossby wave group velocity through a "Doppler shift"
effect. Although significant low-level radial inflow occurs within a few hundred
kilometers of the center, weak inflow (i.e., -0.25 ms-!) is still present in the outer region
(-2000 km) in CTL. In sharp contrast, no significant radial inflow is found in DRY. As
the Rossby wave energy disperses southeastward, the group velocity is opposite to the
27

mean radial inflow (V,) in the lower troposphere. As a result, the total group velocity
(Cg +V,) will be reduced in the southeast quadrant. Given the stronger low-level inflow
in cn, the total group velocity would be smaller, indicating slower energy propagation
and thus a longer period for the development of the low-level wave train in cn than in
DRY.
Secondly, previous non-divergent barotropic studies have shown that the energy
dispersion is more sensitive to the size of a vortex rather than its intensity (e.g., Carr and
Elsbeny 1995). With the sudden vanishing of the diabatic heating, the TC secondary
circulation collapses rapidly and is accompanied by a decrease in maximum tangential
wind and an increase in the radius of maximum wind. According to Carr and Elsberry
(1995), the extent to which the vortex resists asymmetric forcing is proportional to V,;" R:,."
(here V IJIQ% is the maximum tangential wind at the radius of Rma:c). Given that V ma:c is 40
(25) ms·I and Rma:c is 90 (150) kIn in cn (DRY), the value of V,;" is 4.9xl0-9 m-Is-I in R:,."
cn, which is nearly 4 times larger than that in DRY (1.1xl0·9 m-Is-I). Therefore, the
vortex in DRY is more susceptible to the beta-induced dispersion and thus a faster
establishment of the wave train. To further examine this size effect, we conduct two
additional Beta_Low experiments with no diabatic processes. The initial vortex has a
maximum wind of 30 ms·I at a radius of 100 kIn in the first experiment and a weaker
intensity (V max=20 ms·I) at a larger radius of 300 kIn in the second experiment (see the
upper panel of Fig. 3.17). The bottom panel of Fig. 3.17 displays the simulated low-level
Rossby wave trains at day 4. It is clear that the Rossby wave train is significantly stronger
in the case with a larger TC size, supporting the argument above.
28

3.7 Conclusions and discussions
Previous studies on TC energy dispersion were confined to a barotropic
framework. In this study, we applied a baroclinic model to examine the characteristics of
3D TCED-induced Rossby wave trains in a quiescence environment. While a baroclinic
TC moves northwestward due to the beta effect, Rossby waves emit energy
southeastward. This leads to the formation of a synoptic-scale wave train in its wake. The
simulated 3D wave train exhibits a noticeable baroclinic structure with alternating
cyclonic-anticyclonic-cyclonic (anticyclonic-cyclonic-anticyclonic) circulation in the
lower (upper) level.
A noteworthy feature associated with the 3D TCED is the downward propagation of
the relative vorticity and kinetic energy. This evolution feature is beyond the 2D
barotropic dynamics, and possible mechanisms responsible for this 3D TCED-induced
Rossby wave train are illustrated in Fig. 3.18. Due to the vertical differential inertial
stability, the upper level wave train develops faster than the lower level counterpart. As a
result, an intense asymmetric outflow jet is established in the upper level. This beta-effect
induced strong asymmetry in the upper level may further influence the lower level
Rossby wave train through the following two processes. On one hand, the outflow jet
triggers downward energy propagation, leading to the strengthening of the lower level
Rossby wave train. On the other hand, it exerts an indirect effect on the lower level wave
train strength by changing the TC intensity and structure.
To investigate the relative role of the lower-level Rossby wave energy dispersion
and the upper tropospheric impact, two sensitivity experiments (Beta_High and
Beta_Low) are conducted. In Beta_Low, the upper asymmetric outflow jet is filtered out
29

in the absence of the upper level beta effect. As a result, the downward energy
propagation is hardly discerned and the lower level wave train is much weaker. In
Beta_High, the lower level wave train is hardly identified when the lower level beta
effect is excluded. The comparison of the control and sensitivity experiments above
reveals that the development of the upper asymmetric outflow jet results in a more
intense TC with a relatively larger size. This further strengthens the lower level Rossby
wave train as the energy dispersion is sensitive to the TC intensity and size (Carr and
Elsbeny 1995). The numerical results indicate that barotropic Rossby wave dynamics is
essential for the lower level wave train development, while the upper tropospheric
asymmetry due to the beta effect has a significant additional impact.
To summarize, the 3D TCED-induced Rossby wave train reveals more complex
features than the barotropic dynamics (Fig. 3.16). Although the evolution features have
helped extending the Rossby wave energy dispersion beyond the barotropic dynamics,
further studies one needed for the dependence of the 3D Rossby wave dynamics on
pertinent environmental parameters. For example, the growth mechanism of diabatic
Rossby wave is sensitive to the magnitude of environmental barocIinicity and moisture
content (Moore and Montgomery 2005).
Previous investigators (e.g., Frank 1982; Davidson and Hendon 1989; Briegel and
Frank 1997; Ritchie and Holland 1997; Li and Fu 2006) have suggested the significance
of TCED-induced wave train. The southeastward energy dispersion induces an alternative
cyclone-anticyclone-cyclone wave train, with prolific meso-scale convective systems
embedded in the cyclonic circulation region. The interactions among the meso-scale
vortices, wave train and large-scale environmental flows may result in TC formation
30

through wave scale contraction, vortex merger and absorption of the convectively
generated vortices in the vicinity. Furthermore, due to the lower inertial stability, the
upper outflow jet will have a large areal extension and possibly modulate the large-scale
environmental conditions (Le., vertical wind shear), thus influence the sequential genesis.
Investigations of the 3D Rossby wave train in idealized and realistic background flows
will be reported in the sequential chapters.
3(

Table 3.1 List of major numerical experiments
Experiment Symbol Descriptions
CTL Moist process; Beta plane
DRY Dry process; Beta plane
BETA HIGH Moist process; beta (j) plane above (below) 0=0.3
BETA_LOW Moist process;f(beta) plane above (below) 0=0.3
32

--,-> (x JOOkm) 3
2.5
2.25
2
1.75
1.5
1.25
Figure 3.1 Surface pressure field (left panel, unit: hPa) and 850 hPa wind and vertical
mean cloud mixing ratio (shaded, unit: 10.1 g/kg) pattern of a Rossby wave train in
the box area at day 10 (right panel). Horizontal distance has a unit of 100 km.
33

o -5g " .... ",,,,,,.> ........ ".>,.,
lt~~3.;:;~ '" ,. "7 ., -10
-15
-20
-30
o
-5
-10
-15
••• 7. 4" V '" 0( •• yy,,"
.,." y <
.",,,~
• "'OCt" .£ .. " .. C .... .<,. ..
.... ",.,of.,
{
""'''''''''''''"77> +'" "' ... A".,., "f'" > .. "'" .... "' .... .,.,> ."'''.''''''''''''> ."' ............. ,'"
.... ,. ...... .to ... .,.,,. '" ...... ,..,,."' .. .,." ..... ., )0 '" '" '"
>.J."''''''',. ."'&-'''''' ........ ,..,
• .,,, l"A
.... 1."',.
... L .... _ .. L,.,. II """ I" ,"""''' .. ,.,. ...
-25 :::;:
J~~~~~~~~~~~~~~~.:i'~'~'~.:J ........ -30
... ..... 'CT ,. ... .,7',.
o ,+_A..,."''''''''''''' _:111-1 to. .. " .... Ito A ., ., " ,. •• ."., ...... .,'1,,.
...... .., ,.. ........ ., ., '7 ....... ,), .. ~ -- .... .,.,., ~"" II .. " " fI .. 'It .. ., '7 .,
~ ~~: : ,. .. : : : I : : : : ~ : ~ ~ .......... '" '" ... , ".. JII .... .,)o., Y Y
•• "'''.111 ... ". t", .. .,,,,.",,,, Jo ••• +", •• /IIJt ;"1 ... ""'''"''" "'''., ..... fII.~ f·"''"''' .... " .. ",,,,,,, <".... ...""' .... ",, :::;:;:tl'1:~~::~~~ /II .. 1If' ....... L " ~'1' A L ........ t.. C 4.4-." '"'7.)lJl .. ,. .... _ .. ",,<
-5
-10
-15
-20
-25
-30 -5 o 5 10 15 20 25 30
(x100kril)
1"'1""''' .. .,."" >",. ...... " .. .,.,.,." ... ,. ..... "'''.,.,.", ... 11. .. • ........ ""7" tI .,. It." II' .... "" ., ,. ,. _II V "''' ..... .",.'"
'" .. • .. .,7>'" ++".,7,).'"
I'i:~:~~
f .. .,,.,,, ... f .. 1 ,). ... ",
f 4., '" ", ", 14.,,,,..,.., 14.1 ",..,..,
r:~~::: 1. 7 "",,,, ", ,..,,)...,..,.., .., Jill.,"' .... '" ,_,'",,'-.'_"7 ..... '" ... .,.",
« • .~,."'".".". ... .,,.» «"",·""".,7>,).
<. .... •• .... 17>,). ....... "' ........ ,.>,).
+ ...... ,.,).,). + .... >,).'"
...,>"'ol ... .,>"'''' ".,>",,,, "1>"'''' • ., > .. ., ·1,)..., ", ... .1 ., ", ., 1 ol .., ..,
·1.1.., ", iI.,., ",.., -,'a,TO -_., ....
1.,.,» .,.,,.>,). "1'>,). 117>.lt. 411 >,). 41'1>..a .... .,"''' .... ., "' .. ·1> "' ... ... ,). ""., ... .1 .. ., ..... "'.,
.. "' .... '" .... "'",
.. "'". ... ... •••
~'."':r. -:,.., .. .. .1 ..... .
••
---6
Figure 3,2 Wmd fields at different sigma levels at day 10, (0,0) denotes the TC center.
34

0
i~ :t- 10 20
0.2 r·J:/\ : ,
0.4 ! ( \ 0 :1
0.6 " :: , '
O.B 1\ , ,
.: \ 5 1 0
40 4.5
0.2 3.5
3 0.4
2.5 0.6
2
O.B 1.5
1 1 0
0.5 0.2
0.4
0.6
O.B
1
(x I OOkm)
Figure 3.3 The time evolution of vertical radius cross-sections of relative vorticity
(1 x ](J5 s") along the northwest-southeast axis (i.e., the dashed line in the left panel
of Fig. 3.1). The number at the upper-right of each panel indicates the time of day.
35

o ~~------------~
0.2
0.4
0.6
0.8
1
2 4 8 10 20 40 80 100 2 00
Figure 3.4 Same as Fig. 3.3 except for kinetic energy (unit: m } so}) .
36
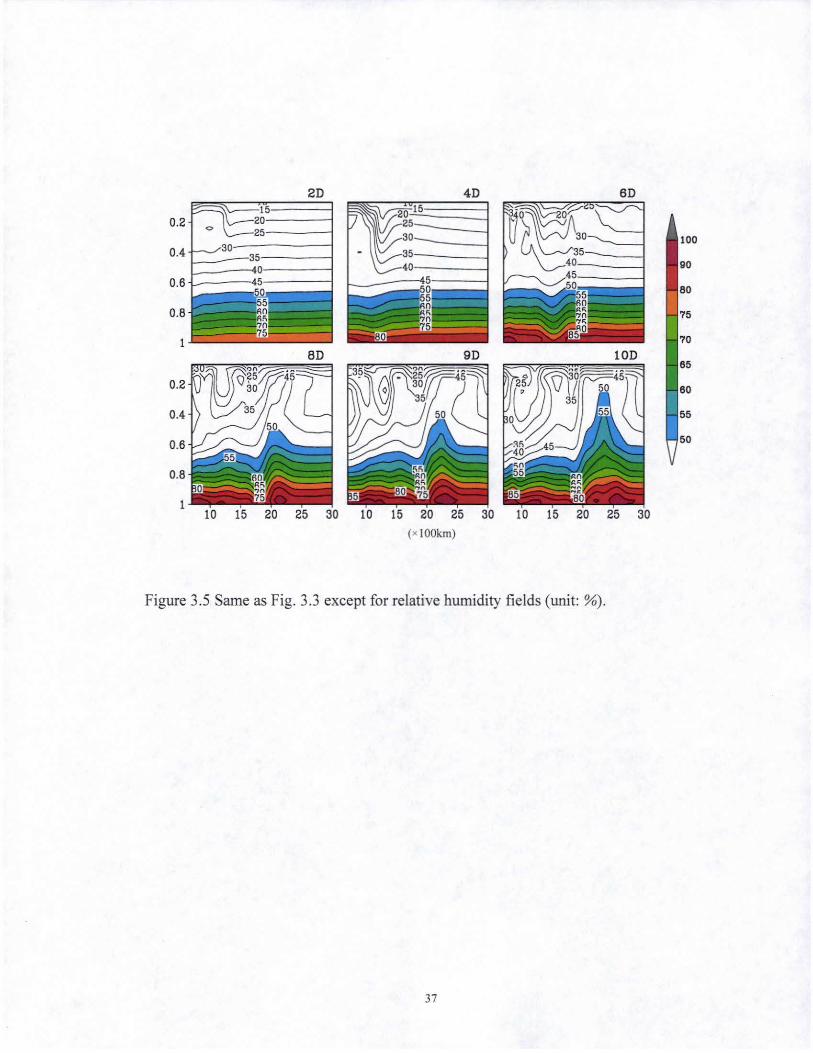
20 40 60
20 15 0.2
15
~~O o 25
-----./30 -35
-'0 45 1----t5~---j
25-__ --1 30 ____ -1 35 ____ -{
40--__ -{ 0.4
0.6 50
~~----------< 45
100
90
80
~~-"'-cJ-----r_~.· : .. :,.'¥ J;'~P'!::1!ir~·\,
0.8 ... - ~"'" - -. 75
70
85
80
55
50
(x IOOkrn)
Figure 3.5 Same as Fig. 3.3 except for relative humidity fie lds (unit: %).
37
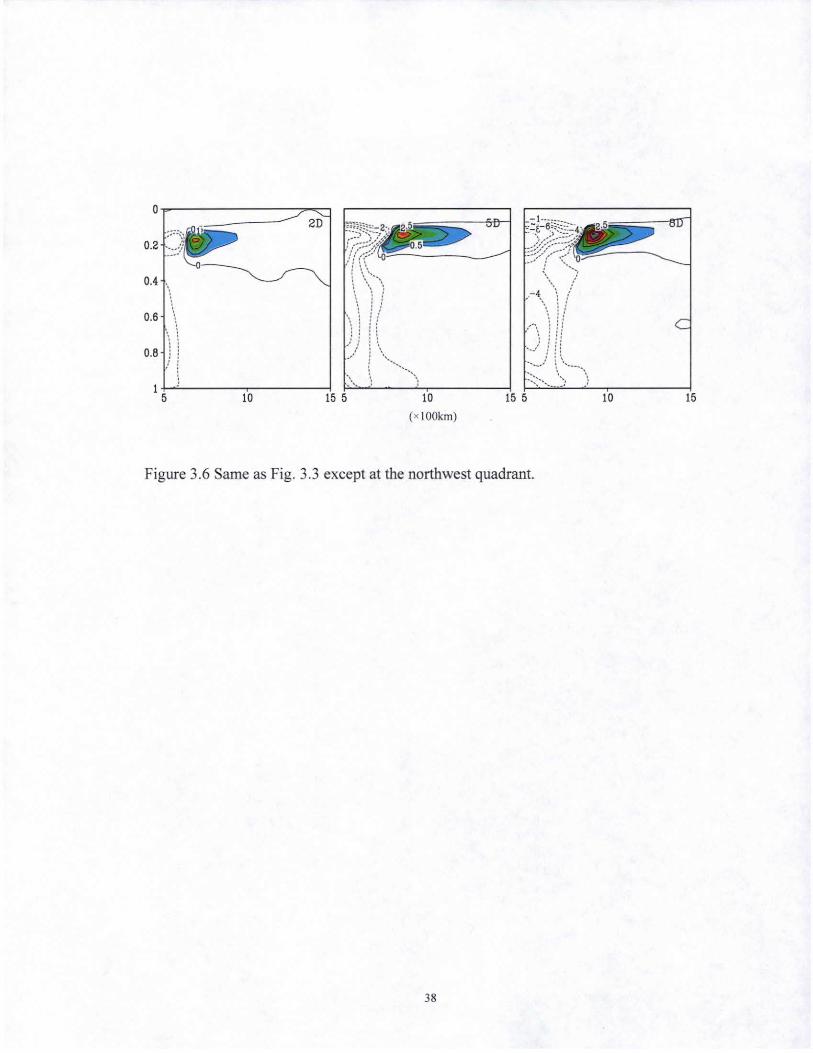
o~------------~~
0.2 ~:.;:::;~ 0.4 \:
O 6 .,
. ,\ \ !
0.8 ))
2D
c
: .t: \. \ .\: --:: "" '.~:, ) lt5~------~lcO------~155~~----~10~------~155~~~-L--10~------~15
(x IOOkm)
Figure 3.6 Same as Fig. 3.3 except at the northwest quadrant.
38

200
•• .. 20
,. Sigma=O.2 8
• • •
Radius (x IOOkm)
Figure 3.7 The time-radius section of KE (unit: m2s-2) in the upper (cr=O.2) and lower
(cr=O.8) levels along a southeastward axis (the dashed line in Fig. 3.1).
39

20~~~~~~~--~ ::::: ~ : :: : ; Pi}, }: ..
• ,. l> ). .... ...... .. » ..
10 .. 'to .. 4 ...... .. '" 10
o o
-10 -10
- 20 ........ It- or ... .. .,. " . .... ,.. " • ....... .. ... " ........ ., -20
v ... , ..
- 20 - 10 o 10 20 ~
10
: : : : : : : : ~ : : : : : :DiY): • » » :> ). .. .. ......
(x JOOkm)
.. ..... .. '" '" .. " ~ ........ '" .. "
.. . . . ..
Figure 3.8 The time evolution of the upper outflow layer (cr=O.IS) circulation. From the
left to right represent wind and relative vorticity (shaded) fields at day 2, 3, -5,
respectively.
40
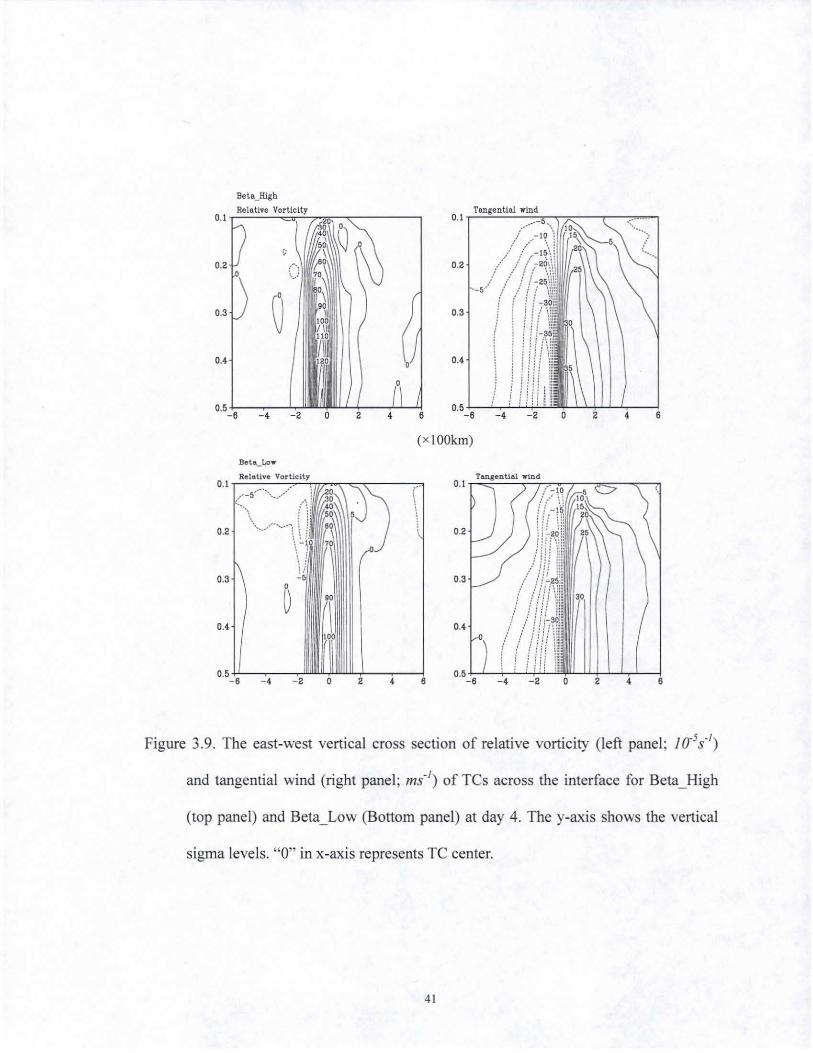
(x IOOkm)
BIllt.Il_Lo ...
0.1 r::R."'I.::::tivc..:._V.::"'-;tic"-":;'-m--..,.-=....--__ -=
- 4
Figure 3.9. The east-west vertical cross section of relative vorticity (left panel; 1O·5s")
and tangential wind (right panel ; ms") of TCs across the interface for Beta_High
(top panel) and Beta_Low (Bottom panel) at day 4. The y-axis shows the vertical
sigma levels. "0" in x-axis represents TC center.
41

CTL
3
Bela_High
?
//////'
:
~ .......................................... ,,/ /' /' /' /' .I'
I---"-~----"""""''''''''''''''''./ ./' /" ..". """ SM ~-------/~~~ :I' ~ ~ __ .--. _____ ".
« Iookm) :1
Bela Low
" , ,
, / , / , ,
3
, -I ,
0.75
0.5
0.25
o
figure 3.10 Low-level (cr=0.9) circulations in the CTL, Beta_High and Beta_Low experiments at day 6. Areas with positive
relati ve vorticity are shaded.
42
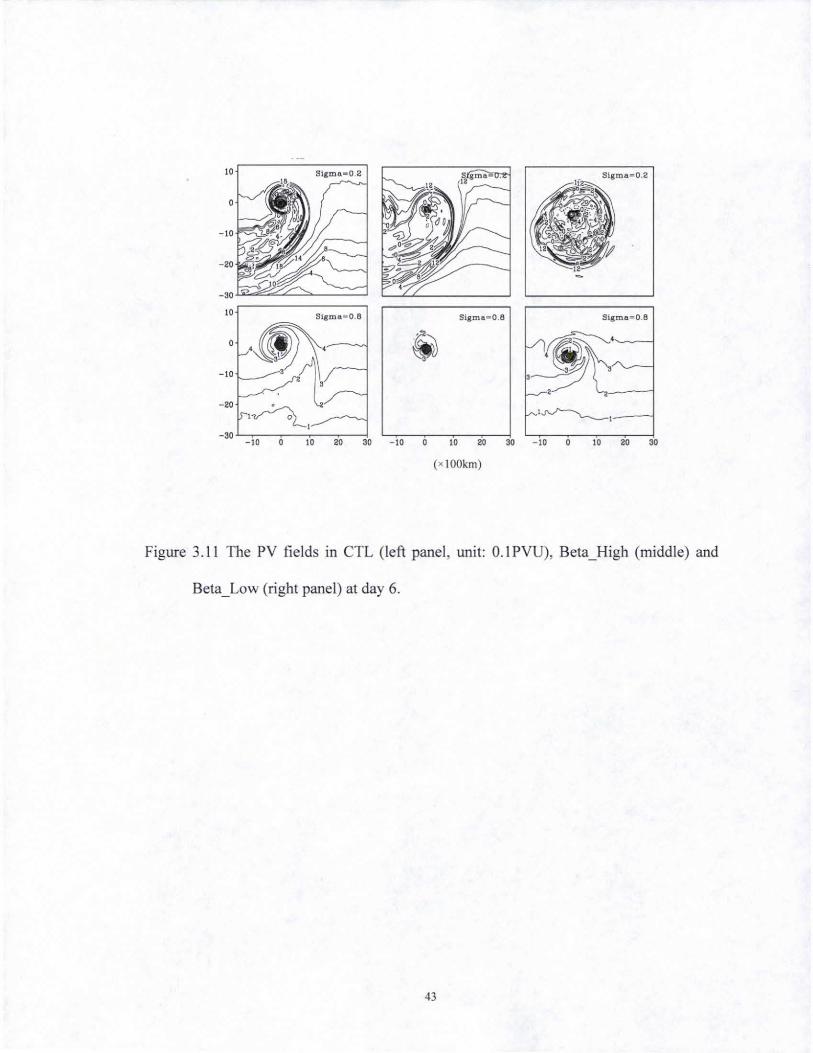
Sigma", o.e Siama~O .8 Siama=O.e
•
~ i» .$t -I.
-2. 1~1 I~I
-30 -I. • I. 2. ,. - I. • I. 20 ,. - I. • I. 2. ,.
(x JOOkm)
Figure 3.11 The PV fie lds in CTL (left panel, unit: 0.1 PVU), Beta_High (middle) and
Beta_Low (right panel) at day 6.
43

980
970
960
950
940
930
920 0 2 4 6 (D ay)
50 Day 6
40
(\ 30 I \
-;; I \ • e, 20 I \
I "-"-
10 '-"-
--- -- ---0 0 3 6 9 12
Radius (x IOOkm)
Figure 3.12 Time evolutions of MSLP (unit: hPa) in CTL (thick solid), Beta_High (dotted)
and Beta_Low (thin solid) (upper panel) and difference in the symmetric
tangential winds between CTL and Beta_Low (CTL minus Beta_Low, left-bottom
panel) and tangential wind profile for CTL (solid line) and Beta_Low (dashed line)
at day 6 (right-bottom panel, unit: m s-').
44

GO
\ \
30
20
10
\ \ \ \
", '-___ ----1 ---10
(x100km)
Figme 3.13 The lowest-level symmetric components of tangential wind profile (ms·/) in
Beta_High (solid line) and in f-plane (dashed line) experiments at day 5.
45

~~~~~~-'~~~~~~?r. ~?~~7
~ 1<-' 7.~""'" ..... ! . ... ... ... 340
sao sao ... .... 31&
.. ., "1
'" ., ..,
3" t----I.---':r--....... ...,:-~~12:i;-~""-;I;:-. ~-----:\1B "?
Radius (x1ookm)
Figure 3.14 Potential temperature-radius cross-sections of E-P flux vectors and
divergence averaged from day 3 to 5 ( 0.5 Xl if Pa m2 Kl s·2) for CTL (top panel),
Beta_High (middle) and Beta_Low (bottom panel). The horizontal and vertical
components are scaled by 1 XJ(J·9 and 1 XU!5, respectively.
46

-20 ...
• • • •
• • • •
· . • • • ••
to .. .. 4 .. ,. ...... .. .. .. .. .. .. .... ..
f f ".. .. .. .. f , III • • .. .. .. ..
• •
• ,,. II ...... ..
1 , •• ...... .. .. 1 , •• ........ .. I ~ ... ...."I.. .. ,. _ " .. .. . .. ~.. .
t : : : .. : : .. : ! • .. , .... 'II .... III ...
\ - .. • • .. III III III f .. .. , ~ ~ • ~ • • III III III • ..
Slgma""O.9 .. " ........ • • •
• . . . • · .' • •• · , .
• •• .. .... ,. Of
• • · .. .. .. .. 'II" "c ..
.. III .. II
••• • •
•
•
• • • • •
. , . •
• • •
-B
•
• • • ••
• • •
• ••
• • • · .
•
DRY
-10
-20
-20
(xIOOkm)
Figure 3.15 Simulated wind fields in the CTL (left panel) and DRY (right panel)
experiments at day 5.
47

r
1
Vr
4 8 Radius (x 1 OOkm)
Figure 3.16 The vertical-radius cross sections of symmetric component of tangential and
radial winds (unit: m S·/) in the CTL and DRY experiments at day 4.
48

• • •
• •
• • • •
•
• ~ " tl · . • • · · • •
•
20
" 15 ,
10
6
o
, , \
\ \
-5}-__ -,-__ ---,::--_--:!, o 6 10 15
" . .. . ~ .. " • ~ •• to
n;: •
•
I •• I •
• · .. • · .. • • • • • • • • · •
• • •
Radius (x1001an)
• •
~
10 ~
10
Figure 3.17 Rossby wave trains induced by TCs with stronger intensity (left-bottom)
and larger size (right-bottom) at day 4. Top panel shows the initial tangential
wind profiles of two TCs. The solid (dashed) line represents TC with stronger
intensity (larger size), respectively.
49

Upper anticyclonic
circulation
Baroclinic TC
~ Lower cyclonic
circulation
Barotropic energy dispersion
Upper level outflow jet
Modulation of Downward energy
propagation intensity/size
• Barotropic energy dispersior Lower level wave train
Figure 3.18 Schematic diagram of 3D energy dispersion in a baroclinic IC
50
CHAPTER 4
TROPICAL CYCLONE ENERGY DISPERSION UNDER
VERTICAL SHEARS
4.1 Introduction In chapter 3, we focus on the pure beta-effect induced 3D energy dispersion in a
quiescent environmental flow. The resuit shows that the Rossby wave has a baroclinic
structure, and there is a connection between the upper and lower tropospheric wave
perturbation. However, this study examines the energy dispersion of a baroclinic TC
under a resting environment. How and to what extent the environment flow modulates the
wave train development is unclear. An observational study by Li and Fu (2006) reveals
that for the western North Pacific (WNP) TCs, the Rossby wave trains are only observed
west of 160"E where the mean easterly shear is pronounced. The easterly and westerly
shears have a significant effect on equatorial Rossby waves (Wang and Xie 1996). That is,
the baroclinic and barotropic modes are coupled in such a way that the two modes are
nearly in phase in the westerly shear, whereas they are 1800 out of phase in the easterly
shear. Therefore, an easterly (westerly) shear leads to the amplification of Rossby wave
responses in the lower (upper) level. Besides the ''Doppler shift effect" through different
mean flows, it is important to explore how the vertical shear of the mean zonal flows
impacts the growth and evolution characters of the Rossby wave train induced by TCED.
51

The chapter is organized as follows. In section 4.2, a brief description of the model
and experimental design is given. This is followed by the presentation of the model
simulation results and physical interpretation in section 4.3. The concluding remarks are
given in section 4.4
4.2 Model and experiment designs
The model (TCM3) used here is a hydrostatic primitive equation model formulated
in the Cartesian horizontal coordinates and 0' (pressure normalized by the surface
pressure) vertical coordinate. The details of the model description and its capability in
simulating baroclinic TCs are documented by Wang (2001). In this study, a 30 kIn
horizontal resolution with 201x201 grid points centered at 18"N is applied. At this
intermediate resolution, a mass flux convective parameterization scheme (Tiedtke 1989)
is used to calculate the effect of subgrid-scale cumulus convection. The initial
axisymmetric vortex has a radial and vertical tangential wind profIle as follows:
3
3 ~ V m (r: J [I + ~ (r: r r 2 sin [~ (; = :: Jl a > au
o
where r is the radial distance from the vortex center, Vm the maximum tangential wind at
the radius of rm and 0-,,=0.1. Therefore, the initial cyclonic vortex has a maximum
azimuthal wind of 30 rus-I at a radius of 100 kIn at the surface, decreasing gradually to
zero at about 100 hPa.
Seven experiments are designed (Table 4.1). The first control experiment (CTRL) is
designed to examine 3D energy dispersion in a quiescent environmental flow. To study
52

the vertical shear effect, we conduct two constant-vertical-shear idealized experiments in
which the zonal basic flow is only a function of height and does not change with the
zonal and meridional directions (Fig. 4.1). In the easterly (westerly) shear experiment, a
shear strength of 10 ms·! [i.e., linearly decreasing (increasing) of the zonal wind from 5
(-5) ms·! at surface to -5 (5) ms·! at the top] is specified. To confirm the vertical shear
effect, two experiments with a uniform mean westerly (W5) and easterly (E5) flow with a
magnitude of 5 ms·! are conducted, respectively. Furthermore, two additional
experiments with different vertical shear profiles (WSH05 and ESH05) are conducted to
test how the energy dispersion is sensitive to the shear strength.
To check whether the constant vertical shear mean flow is a solution of the primitive
equation model, we calculated the domain averaged zonal mean flows at each level.
Figure 4.2 illustrates the vertical distribution of the mean flows at day 5 for the ESH (left
panel) and WSH (right panel) case. The results show that the model is able to keep to a
large extent the initial vertical shear of the mean flow in both the ESH and WSH cases,
indicating that the constant vertical shear mean flow is a solution of the primitive
equation model.
4.3 Numerical results
In CfRL, the model is initialized with a TC-like vortex on a beta-plane in an
environment at rest, which is the same as that in Chapter 3. The model TC moves
northwestward due to the beta-effect induced "ventilation flow" advecting the core vortex.
After a rapid intensification for a period of about 36h, the model TC reaches a
quasi-equilibrium state. Meanwhile, it is evident that the isobars are elongated westward,
forming an elliptic outer structure. A weak wave train with alternating
53

cyclonic-anticyclonic-cyclonic circulations starts to develop in the TC wake at day 5. The
horizontal patterns of the TCED-induced Rossby wave train at different sigma level are
presented in Fig. 4.3(a). The lower level pattern is quite similar to those retrieved from
the QuikSC,6J observations (Li and Fu 2006). The northwest-southeast orientated wave
train has a wavelength of 2000-2500 kilometers. The wave trains appear clearly in both
upper and lower troposphere, with the alternation of anticyclonic-cyclonic-anticyclonic
(cyclonic-anticyclonic-cyclonic) circulation in the upper (lower) levels. The 'amplitude of
the wave train is minimized the mid-troposphere. Moreover, the upper level wave train
has larger amplitude but is shallower than the lower level counterpart. These features are
attributed to the differential dynamic effect of inertial stability and stratification with
elevation in a baroclinic TC (Chapter 3). Figures 4.3(b) and (c) show the simulated
Rossby wave train under easterly and westerly vertical shears. To compare more clearly
with CTRL, the domain averaged mean flows at each level have been removed. In the
easterly wind shear (ESH) case, the lower level wave train is strengthened, whereas the
upper level wave train weakens significantly. No obvious wave-like pattern is observed in
the upper level. In a sharp contrast, in the westerly wind shear (WSH) case, the upper
level wave train is significantly enhanced, while the lower level counterpart is hardly
identified. The results show that TCED process is greatly modulated by the
environmental flows.
To further demonstrate the difference, we present the time evolutions of
radius-vertical cross sections of relative vorticity along the axis of the wave train at the
southeast quadrant (Fig. 4.4). To highlight the wave train section, we only show the radial
distance from 500 km to 3000 kIn. In CTRL, a positive relative vorticity perturbation
54

initially develops in the upper troposphere (0'=0.15), and thereafter intensifies and
propagates. both outward and downward. The region of relative vorticity greater than
O.5x10·s S·l (shaded area) reaches the planetary boundary layer (PBL) at day 6,
coinciding with a cyclonic circulation center of the lower level wave train. A
northwestward-tilting vorticity belt connects the upper and lower level wave trains. The
northwestward-tilting vorticity belt appears in neither ESH nor WSH case. In WSH, a
positive vorticity center occurs in the upper level first, and then penetrates into the middle
level. However, it could not reach the lower level. In ESH, a positive vorticity center
develops in the lower level at day 4, and this lower level development seems
"disconnected" to the upper level vorticity center. The lower level cyclonic perturbation
further enhances itself through the Ekman-pumping induced boundary layer convergence
and through the moisture-convection-circulation feedback. As a result, the vorticity
perturbation grows upward, which is different from a downward development in CTRL
and WSH experiments.
A possible cause of the downward-tilting development in CTRL is attributed to the
differential inertial stability and beta-effect with elevation in a baroclinc TC (Chapter 3).
An upper (lower) level anticyclonic (cyclonic) circulation leads to weaker (stronger)
inertial stabilities. As a result, the upper-level wave train develops much faster than these
in the middle-low levels. The slower responses in the lower levels may partially explain
this downward development. Another possible mechanism is through the downward
Rossby wave energy dispersion. Due to the lower inertial stability, the upper-tropospheric
anticyclonic circulation rapidly induces an intense asymmetric outflow jet in the
southeast quadrant, which further affects the lower level wave train through downward
55

energy dispersion. To demonstrate this process, an E-P flux (F " [ - r( aUL )'vi, p'~: 'J )
on a cylindrical coordinate is applied to illustrate the energy propagation of the Rossby
waves (Molinari et aI. 1995; Chen et aI. 2003). Figure 4.5 shows the radius-8 (potential
temperature) cross sections of E-P flux vectors and their divergence
"F 1 0 2 ( )' , 0 ,0'1/' •. = ---r GUL vL +-p -( r or of) OA.) averaged at day 4. In all three experiments, the
greatest eddy activities appear on the 355K surface where the TC outflow jet is located.
Note that the strong wave-mean flow interaction and large outward energy propagation
occur in the upper outflow layer, which is consistent with the fast growth of the upper
level wave train. In CTRL, along with the outward energy propagation, downward
pointing vectors occur below the outflow layer (say 8=355k), indicating downward
energy propagation. Both the outward and downward energy dispersion may account for
the downward-tilting development as shown in Fig. 4.4(a). Of particular interest is an
outward (inward) energy dispersion in the lower level in ESH (WSH), which is likely
associated with the background mean flow.
The stronger wave train responses in the lower (upper) level in ESH (WSH) are
possibly attributed to the following two processes. The first is attributed to the interaction
of baroclinic and barotropic Rossby modes in the presence of the background vertical
shear. As shown in CTRL, the wave train exhibits the gravest baroclinic mode with an
out-of-phase flow field in the upper and lower levels. In the presence of the vertical shear,
a barotropic mode may be excited due to the baroclinic forcing. To verify this hypothesis,
the barotrpoic components of three experiments are calculated. The results show that the
barotropic component of wave train is more significant in both WSH and ESH than that
56
in CTL (Fig. 4.6). The baroclinic and barotropic modes are coupled in such a way that the
two modes are nearly in phase in the westerly shear, whereas they are 1800 out of phase
in the easterly shear. Therefore, an easterly (westerly) shear leads to the amplification of
Rossby wave responses in the lower (upper) level (Wang and Xie 1996). The asymmetric
responses in wave characteristics may be further strengthened by Ekman-pumping
induced boundary layer moisture convergence through the circulation-convection
feedback. The second process is likely attributed to the modulation of the Rossby wave
group velocity by the background mean flow through a "Doppler shift effect". Given that
a TC emits energy southeastward in both upper and lower levels in a resting environment,
the mean westerly (easterly) flow may enhance (reduce) the total group velocity and thus
accelerate (slow down) the wave train formation. Because of this group velocity
modulation, the lower level Rossby wave train develops much slower or is greatly
suppressed in WSH compared to that in ESH.
To further verify the mechanisms above, we conduct two sensitivity experiments
with uniform mean westerly (W5) and easterly (W5) flows with a magnitude of 5 ms·1•
Comparisons between the experiments with uniform mean flows and vertical shears may
help understand the roles of the vertical shears in the wave train formation. To represent
the strength of the Rossby wave train (Table 4.2), the low-level (cr=O.8) mean relative
vorticity is obtained by averaging within an area of 1000 kmxlOoo km center on the
cyclonic circulation in the wave train (see the dotted box in Fig. 4.7 for an example).
Note that the lower level wave train is stronger in W5 than in E5 (Fig. 4.7). Given that no
vertical shear is presented in both the cases, it supports the hypothesis that the westerly
mean flow may enhance the group velocity and energy dispersion through the "Doppler
57

shift effect". Of particular interest is that the strength of the lower level wave train is
stronger (weaker) in ESH (WSH) than W5 (E5). This points out that the vertical shear
further enhances the asymmetry in the wave train response. The weaker barotropic
components in both E5 and W5 also suggest that a weaker vertical coupling in the
absence of the vertical shear effect (Fig. 4.8). Along with the "Doppler shift effect". the
experiments under vertical shears include the barotropic-baroclinic mode coupling
mechanism. Therefore. the difference between these two groups is attributed to this
vertical shear effect. For example. as there is similar lower level westerly wind in W5 and
ESH. the difference in the strength of wave trains is approximately due to the effect of the
vertical shear. With this regard, the difference in the strength between W5 (6.1x10⁻⁶s-l)
and ESH (12.6x10⁻⁶S-I) is significant, indicating an important role of the
barotropic-baroclinic mode coupling. By the same reasoning. the vertical shear effect
may account for the weaker Rossby wave train in WSH compared with that in E5.
To test the sensitivity of Rossby wave train formation to the vertical wind shear
proflles. we further conduct two experiments. In the new easterly shear (ESH05)
experiment, shear strength of 5 ms-Ilinearly decreasing from 0 at surface to -5 ms-I at the
top is specified. Likewise. in the new westerly shear case (WSH05). the zonal wind
linearly increases from 0 at the surface to 5 ms-I at the top of the model. The results again
show a similar asymmetric characteristic. that is. an easterly ( westerly) shear confmes the
maximum amplitude of the wave train to the lower (upper) level (Fig. 4.9; Fig. 4.10).
Nevertheless. the amplitude of the asymmetric wave train responses is weaker due to the
reduced vertical shear strength. suggesting the importance of the vertical shear in
modifying the wave characteristics. For example. the lower level wave train strength in
58

ESH05 is weaker than that in ESH. Since the coupling between barocIinic and barotropic
modes is proportional to the vertical shear strength (Wang and Xie 1996). a smaller
vertical shear would result in a weaker barotropic response thus a weaker lower-level
wave train. Furthermore, in the absence of the lower level background westerly, the group
velocity is greatly reduced, which slows down and weakens the lower level wave train
development.
4. 4 Conclusions
In this study, the 3D tropical cyclone energy dispersion under various
environmental flows is explored using a baroclinic model. Due to the differential inertial
stability and beta effect with elevation, the simulated wave train exhibits a clear
barocIinic structure with alternating anticyclonic-cyclonic-anticyclonic
(cyclonic-anticyclonic-cyclonic) circulations in the upper (lower) level in an environment
at rest. A remarkable asymmetry of the wave train growth appears in the presence of
easterly and westerly vertical shears. An easterly (westerly) shear confines the maximum
amplitude of the wave train to the lower (upper) level. It is suggested that the vertical
shear may impact the Rossby wave train development through both the
barotropic-baroclinic mode coupling and the modulation of the group velocity by the
mean flow through a "Doppler shift effect". Sensitivity experiments with uniform mean
flows are conducted to confirm the above mechanistns. Under an easterly shear, a
barotropic Rossby mode is generated in such a way that it enhances the lower level wave
amplitude; meanwhile, the lower level westerly wind may accelerate the southeastward
energy dispersion and enhance the wave train strength. Both processes favor the lower
level Rossby wave train development. Once the lower level wave train is strengthened, it
59

may reinforce itself through the Ekman-pumping induced PBL moisture
convergence/divergence and the convection-circulation feedback.
The enhancement of the Rossby wave train by background easterly vertical shears
might have an important implication. During the boreal summer, significant easterly wind
shears exist over the western North Pacific (WNP) monsoon region, thus providing a
favorable large-scale environment for the Rossby wave train formation and development.
The effect of the easterly wind shear on the tropical WNP cyclogenesis was emphasized
recently by Molinari et al. (2007). Therefore, the current study may improve
understanding of the roles of TCED in tropical cyclogenesis (Holland 1995; Li et al. 2006)
and the origin of the summertime synoptic wave trains over the WNP (Lau and Lau 1990;
Chang et al. 1996).
Numerous studies have examined the relationship between simple structured,
environmental flows and subsequent simulated tropical cyclone intensity change (peng et
al. 1999; Frank and Ritchie, 2001; Wong and Chan 2004; many others). The interactions
of the TC with different background flows will affect the TC structure and intensity
change. Therefore, it will affect the Rossby wave energy dispersion since it is sensitive to
the TC intensity and structure. Meanwhile, the TCs will have different speeds in different
environmental flows. It is possible that this difference in the TC motion may be an
important reason that results in the Rossby wave train strength under different mean
background flows. Future studies are needed to elucidate more details regarding the
effects of different strength, and structure, of vertical wind shear and how this affects the
energy dispersion thus the intensity and structure of tropical cyclones of different
intensities.
60
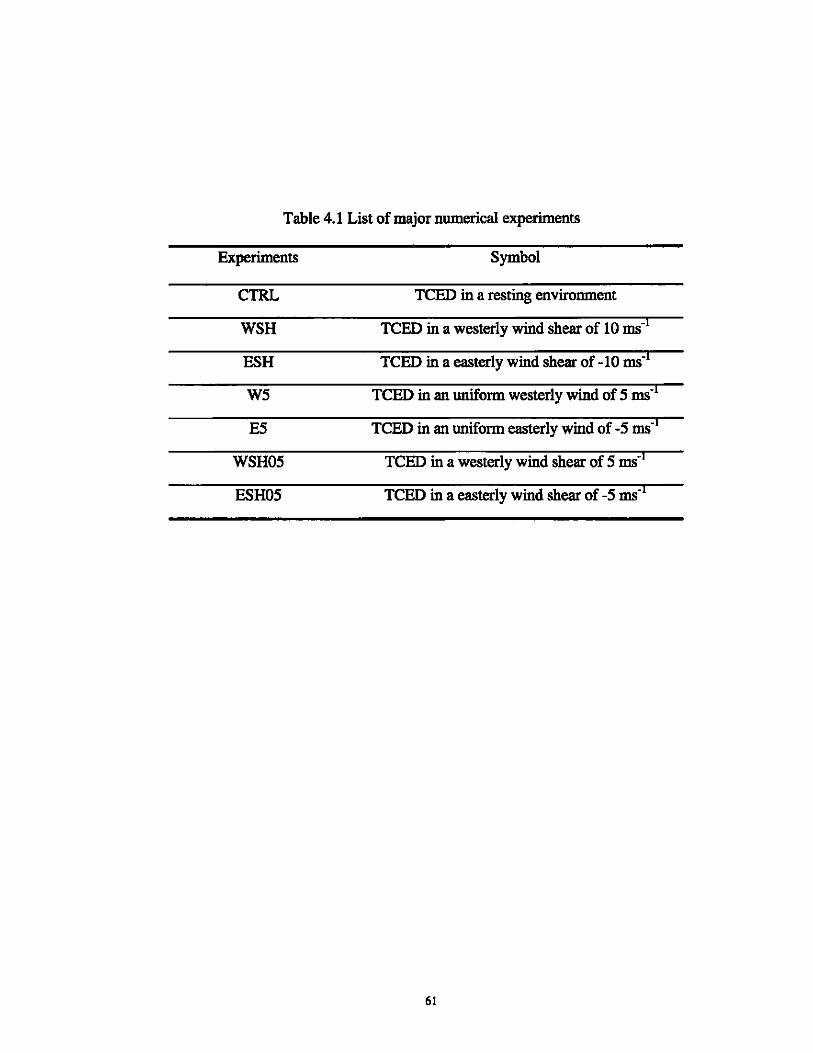
Table 4.1 List of major numerical experiments
Experiments Symbol
CTRL TeED in a resting environment
WSH TeED in a westerly wind shear of 10 ms-I
ESH TeED in a easterly wind shear of -10 ms-I
W5 TCED in an uniform westerly wind of 5 ms·1
E5 TCED in an uniform easterly wind of -5 ms- I
WSH05 TeED in a westerly wind shear of 5 ms-I
ESH05 TeED in a easterly wind shear of -5 ms- I
61

Table 4.2 The lower level Rossby wave train strength at day 7
Experiments
ESH
WSH
E5
W5
Mean relative vorticity (unit: 1 xli?i)
62
12.6
1.7
4.3
6.1

Vertical Profile For Easterly wind shear VerUcaJ Profile For Westerly wind shear
0.2 0.2
0.4 0.4
0.8 0.8
0.8 0.8
-8 -4 -2 2 4 6 -6-4-80246
Figure 4.1 The vertical profiles for ESH (left panel) and WSH (right panel) wind shears.
The y-axis is vertical sigma levels, and x-axis shows the zonal wind speed (ms-1).
63

o Or---------------~__,
0.2 0.2
0.4 0.4
0.6 0.6
0.6 0.6
1 1~~~~~~~~~~ -7 -6 -5 -4 -3 -2 -1 0 1 2 3 4 5 -5 -4 -3 -2 -1 0 1 2 3 4 6
Figure 4.2 The vertical distributions of the zonal mean flows in ESH (left panel) and
WSH (right panel) at day 5.
64

(a)CfRL (b)ESH (c)WSH
:--.--------
.. ,,····· .. "111· .. •• -20 ...... • •••• ",.111 •••
.. .... ..... '" r II; .. ..... .. ...... ". .. " ... - ... "" .. .. ••• "rt""".,,,,,,,,, _80L-______________ ~
.... .. .. .. .. .. of ., 'f' "" "-~""'. ... '" ... .. .. .. ~ .. .. " ............. " of .,
~ ... " .. ., .. : ... , .......... " ............. ,,,,, ....... .. '"." ....... "."!, ........... . ........ "' .. ,. .. I"., ...... .. .... " _" .•. " ." '" -'f. ~ ~ .. " .. ~ ............. III '" .. to ..... ..
"'., ....... 1_. 1 ......... " -20 .......... " ........... .. .............. , f • .. .. .. .. .. .. .. ........ of ~ .. _. "" 'II ..
.-...-----...:="""
-20
~ ..... • • • · . )i:" · . • • . . . · . • •
0 .... " .... ., • • ~"~.~. It • .. \\ .... "~'.
-10 ---- • \ \ 11- • .. ,1f .... J.+~A. • ...... J'~\ .' • • .. "" ........... " .... • .. .
.. .... .. .. .. .. .. .. .. ... .. .. ... .. .. ... ....
\.. .. .. .. . . -IO~=::~ : ~ n ; : : ~.~:, I'Hf.~
: : : ,I) ~'~v.~~ : : ". ....... , .... ~ )1'+'11 .. ...... , .. ....., /''''''''
o
-20
........... . -"' ......... " .................... _",,... -80 I::.~.~.:.~.t:.:;;.-: '-·-·llli·ii·m:·ii·=1·f.1!·Il-30t::~~~::-::·::·~-::':"':':-:':::::::::I
.. ........ .... ,,;I'/'~, .... .. .. ...... . ""'~" ... .
..... ......... " ...... ". '" "'"~'" ~r '" .. ........ .... .. rt
. .... " " .. .. , " -20 ... "" . . . . .
................ '" ........... ~ ,
•
~ ......... .. • •
, . • •
. . • •
• •
•
Figure 4.3 Wmd fields in CTRL (left panel), ESH (middle panel) and WSH (right panel)
at different sigma levels from the upper to lower level at day 7. The domain
averaged mean flows at each level are removed in both WSH and ESH. The point
(0, 0) represents the TC center. Horizontal distance has a unit of 100 km. The
domain-averaged mean flows at each level have been removed.
65

10 20 30
ESH 0
0.2
~~ 0.4 0.,5 I '
0.6 .l\ ... O.B .. '.
10 20
Figure 4.4 Time evolutions of the vertical-radius cross sections of relative vorticity
(1 x l (J5 s-') of CTRL (top panel), ESH (middle panel) and WSH (bottom panel)
along the northwest-southeast oriented axis. The nwnber in the upper-right of each
panel indicates the lime of day.
66

~~~~ .... ~~~ 340 ... 03 • ... sao 8l&
. ..
Ut 18
Figure 4.5 Potential temperature-radius cross sections of E-P flux vectors and their
divergence (contour, O.5Xlrl Pa m2 Kl s·2) for CTRL (top panel), ESH (middle)
and WSH (bottom panel) at Day 4. The horizontal and vertical components are
scaled by 1 XJ(J·9 and 1 Xl(J5, respectively.
67

-..
\ ~ ... . ~ \ \ ' .. .
\ \ } . . , ~ \ . ~~~~~.", ~ i . .. , , , , . -. ..... • .. , 4 , i
.. • .. ··' .. "'1· ···.f'''''I' ..••...•
.,f·"'111 •••••••• ... f , ••••• .. , , ...... .. " " "., ... " , , I
.. f'.". .... '~ •
........ .. • • • f , ••• f ••••
......... , • f ••• . . . .. . . . . . . . , . · ........... . · ...... . · ...... . · ...... . -~L---~~---. .. C-----m .. ----~=
.-
•
-10
....... ~,\, ... : ..... t .. ,\, ••••••••
;.\\p .... :::
"" ::J}}\l\~~W .' t" .... _.... ll'",<",t" .. ... ", ..... -...-'" J" ... "
~"\' .. -~-' .... ", ... " .\\, ...... -~.,.,'.,', ... ' .. .",~ .... ----.,.,.,.,~.~, .. .~, ..... ~~~."", .... -..... ~ . ....... --" .. ,' ..... .. ---.. , ....... ,,,,,. f ..... .. . ......... ."..,...,.. .... - ..... " .... .. ...
---."..,...". .... ---------------.... , ........ --------------........ " ......... -------~--m .- =
Figure 4.6 The barotropic wind components obtained by a vertical average in CTRL (left),
ESH (middle) and WSH (right panel)
68

W5 E5
- 20
-30 ~-,----~~~~~~ o 10 20 30 o 10 30 20
Figure 4.7 Wind fields in W5 (left panel) and E5 (right panel) at lower level (sigma=O.8)
at day 7. The domain-averaged mea winds at each level have been removed.
69
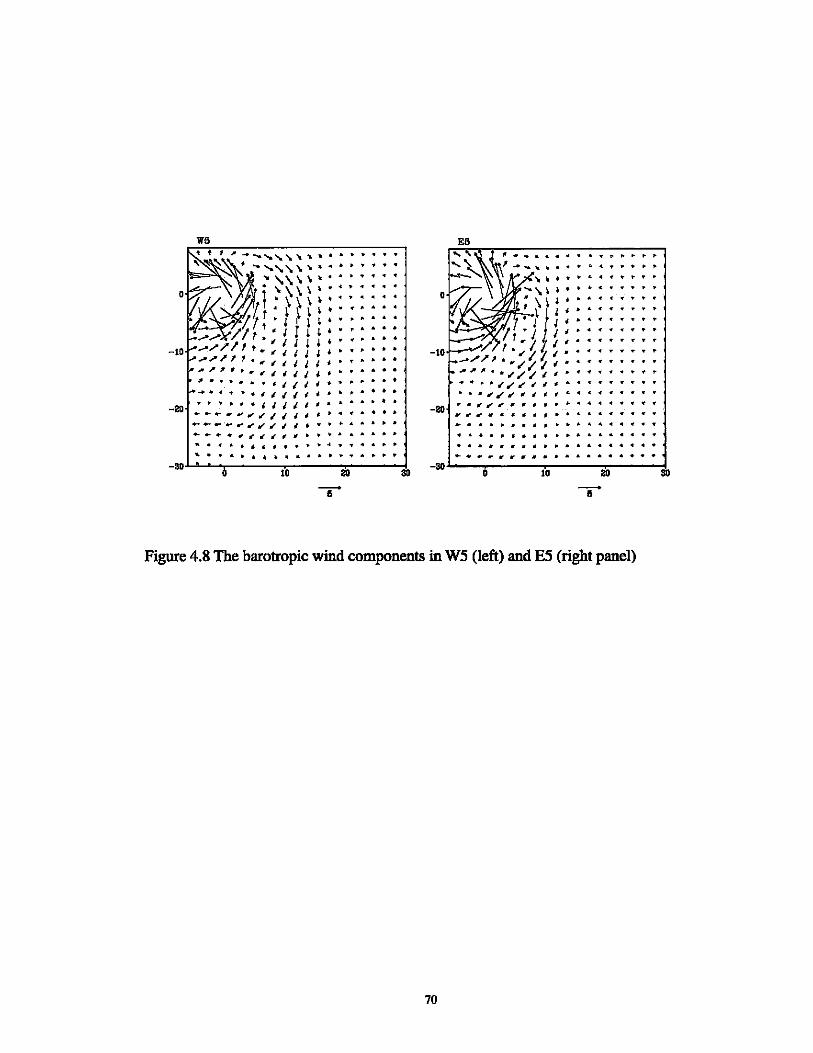
o
-10
-20 ............ ""'~ -- .......... """'... .. " " rf rf
• • • . . , , , ,
. . .. .. . . " ..
,
, • • •• I •
• • •
, . • •
••
• • • • • •
• • • • • •
-2D~~~------~1~0------~2O~------~2D
, .. ''I. • • • ; ~r • • 7' j i ,
'/ • I , , I. I ,
_/'/'1 ""~l ' -"'//1 I ..... """"',/,//~ .. .. ~.~.,"''' , . .. .. " ,,'" '" . , • • ..",,, • • • -20 .. . • •
• • •
• . . .. ...... " , " " ~~---r------~10~----~2O~----~2D
Figure 4.8 The barotropic wind components in W5 (left) and E5 (right panel)
70

_ .. .. " l' '" .l .... ..
~ " ,. " .. .. o • • ., ....
-10
l' <C '" ~ ~ " o ........ l( .... " "-
" .... " ........ " j~~~~~~~ ................ ... ''II " .. ., <II' C ... " " -10 '/ •• ,. ............. .
all'Jf .. ,, ..... c .... a.
.,.,.""'''''111''· .. • ... '' ..... .. "'. of. " .. IL ............ " "
-20 1"'" " II ... j,. 1" .... '" ........ ..
.. • '" .. " C to .... 'I" ... " .. "
'" . . " ... .. .. .. .. .. ... .. .. " * • " .. .. .. .. .. .. " .. .. .. ..
-30~~0----~10~--~2'-0--~3·0
-5
o
-10
-20
~......... III
11'~<---"".::~.,r--------
.. " ,. ..... l- <II. .. ..
". ..... .to ..
.. .. .. .. .. ... ¥ '" ... ., '"
-30 ....... ~---------'
-~ .. .. ,. ,. ,. .. ,. .. .... ,. .... .. o .. II .......... ..
-~I?-t-......... \ ....... . ",,,,/Irt ; : : ! : : : : : Ifft .... " ... 'II" ........ 'rt ... _" ........ ,..,,,
-10
.. t ...... ., ,. ...... '" .... .. ... .. .. • • ,. ......... or .... ..
-20 ..... " ..... '" .......... " " .. " <r .. C ............... " ... ..
J, .l ..................... " ..
-30 ....... """""I0--":'10~--":2~0 ~~30'
Figure 4.9 same as Fig. 4.3 except in WSH05 (left panel) and ESH05 (right panel).
71

WSH05 O ~----------~~
0.2
0.6
O.B
1 20 30 10 20 30
ESH05 a
0.2
0.4
0.6
O.B
1 20
Fig. 4.10 Time evolutions of the vertical-radius cross sections of relative vorticity (unit:
I x /O-5 S-I ) of WSHOS (upper panel) and ESHOS (bottom panel) along the
northwest-southeast oriented axis. The number in the upper-right of each panel
indicates the time of day.
72
CHAPTERS
TROPICAL CYCLONE ENERGY DISPERSION AND
SELF-MAINTENANCE MECHANISM OF SYNOPTIC-SCALE
WAVE TRAINS
5.1 Introduction
Observations show that bver 80% of tropical cyclones over the western North
Pacific (WNP) form in the intertropical convergence zone (ITCZ) or to the eastern end of
the monsoon trough, where both the large-scale circulation and active cumulus
convection are favorable to the formation of synoptic-scale disturbances or tropical
cyclones (Gray 1968). Meanwhile, the northwest-southeastward orientated synoptic scale
wavetrains are often observed in summer (Lau and Lau 1990; Chang et al. 1996). These
wavetrains generally propagate northwestward along the confluence zone of the mean
flow, which extends from the equatorial western Pacific to Southeast Asia. The
wavetrains have a typical wavelength of 2500-3000 Ion and a time scale of 6-10 days.
Efforts have been devoted to the physical mechanisms with regard to the origin of
the wave train. Processes that trigger the synoptic-scale wave train include the barotropic
instability of the tropical easterly flow (Nitta and Yanai 1969), Rossby wave energy
dispersion of a pre-existing mature TC (Holland 1995, Li et al. 2003, Li and Fu 2006, Li
73

et al. 2006), and an equatorial-to-off-equatorial transition of mixed Rossby-gravity (MRG)
waves (Takayabu and Nitta 1993, Liebmann and Hendon 1990, Dickinson and Molinari
2002; Zhou et al. 2007), and scale contraction and energy accumulation of easterly waves
(Tai and Ogura 1987, Kuo et al. 2001, Tam and Li 2006).
Using a linear shallow water model, Aiyyer and Molinari (2003) simulated the
evolution of equatorial MRG waves in an idealized background state similar to the active
phase of the Madden-Julian Oscillation (MIO). Their numerical result suggests that the
asymmetry in the background flow may favor for the transfer of an equatorial
perturbation to off-equatorial disturbance. By specifying a realistic 3D summer mean
flow, Li (2006) examined the origin of the tropical synoptic wave train in a multi-level
baroclinic model. He pointed out that the synoptic wave train might arise from the
instability of the summer mean flow in the presence of a convection-frictional
convergence (CFC) feedback.
Of particluar interest is the origin of the synoptic wave trains and their role in
initiating TC genesis. Chang et al. (1996) examined these synoptic-scale disturbances and
found that many of them are actually tropical cyclones or tropical depressions. To clearly
illustrate such a phenomenon, an example representing tropical-cyclone-induced wave
train is selected. Using NECP/NCAR reanalysis data, we showed that three TCs (Megi,
Chaba and Aere) consecutively formed over WNP (Fig.5.1) during the Mid-August of
2004. Typhoon Megi was initially spotted 260 miles west of Guam on August 11,
strengthening into a tropical storm on August 16 and ultimately into a typhoon on August
74

18 to the southwest of Japan. Chaba formed on August 18 in the open Western Pacific,
strengthening into a tropical storm on August 19 and a typhoon on August 20. Aere
developed into a tropical depression on August 19 about 400 miles west of Guam, and
reached tropical storm on the 20th. Associated with these consecutive TCs, a
wavetrain-like pattern was generated over WNP. To delineate the synoptic time scale
component of this pattern, a 3-8-day band pass filter (Murikami 1980) is also applied.
This synoptic wave train with a wavelength about 3000 km oriented in the
northwest-southeast direction was persistent (Fig. 5.2), which agrees fairly well with
previous studies (Chang et al. 1996: Lau and Lau 1990: Li et al. 2003).
Figure 5.3 represents the mean background flow that is obtained by a IS-day
average centered on August 15, 2004. One salient feature of tropical atmospheric
circulation over the WNP is a large-scale ITCZlmonsoon trough pattern. That is, a
monsoon trough is located over the WNP, and extends eastward to 170"E. This
confluence zone, which is characterized by the low-level convergence and abundant
moisture, is a region favorable for the development of the TCs. In the lower troposphere,
ITCZ convection produces a cyclonic potential vorticity (PV) anomaly that has a reversal
of the meridional PV gradient on its poleward side and therefore satisfies the necessary
condition for combined barotropic and baroclinic instability (Charney and Stem 1962).
The combination barotropic and baroclinic instability in the ITCZ may then either
enhance existing synoptic-scale wave disturbances such as easterly waves or initiate
tropical cyclones (Nieto Ferreira and Schubert 1997, hereafter NFS97; Wang and
7S

Magnusdottir 2(05). The wave trains along with the genesis are embedded in this region,
implying a possible relationship among these three components: the background mean
flow, TCs and the synoptic wave train.
As in Chapter 3, while a TC moves northwestward due to the mean flow steering
and the planetary vorticity gradient, Rossby waves emit energy southeastward. As a result,
a synoptic-scale wave train with alternating anti-cyclonic and cyclonic vorticity
perturbations forms in its wake. It is anticipated that, the southeastward energy dispersion
may disturb the ITCZlmonsoon trough, and then help initiate the release of the
convective and barotropiclbaroclinic instability in this region. To demonstrate this TCED
process, the E-vector (Trenberth et al. 1986) is calculated based on a 15-day-period
centered on 15 August 2004. Figure 5. 4 displays the energy primarily radiates from the
previous mature TCs, although another energy source with relatively small amplitude
comes from the eastern boundary and converges with the former over the genesis location.
The indeed southeastward energy propagation help penurb the monsoon trough region.
The interaction between the convective heating and the perturbation circulation may lead
to the generation of new cyclones. While the new TC forms and moves northwestward,
the ITCZ reformations and rebuilds up the local instabilities. Thus, the repeating of such
processes likely maintains a wave train patttern. The hypothesis suggests a mutual
relation among the low-frequency background flow, the wave train pattern and the TCs.
As suggested by Chang et al. (1996), this type of TCs is likely to have significant
feedbacks on the wave train pattern. To summarize, the wave-like pattern is a part of
76

multi-scale feature including the low-frequency background flow, synoptic wave train
and the TCs. Therefore. it is our major purpose to understand this dynamic process of the
self-maintenance of the wave train through several idealized numerical experiments.
This chapter is organized as the follow. In section 5.2, the model and experiment
designs are introduced. The results of major experiments are shown in section 5.3. A short
snmmary and discussion are presented in section 5.4.
5. 2 Model strategy
The numerical model used in this study is the uniform grid version of the triply
nested, movable mesh primitive equation model-TCM3. A detailed description of the
model can be found in Chapter 2. In this study, the mesh with a uniform grid spacing of
30 km consists of 201x201 grid points, so that the model domain covers an area of 6000
km by 6000 km centered at 1O"N. A strong damping is specified at a sponge layer near
the model lateral boundaries to minimize artificial wave reflection into the model interior.
At this resolution, the mass flux convective parameterization scheme (Tiedtke 1989) is
used to calculate the effect of subgrid-scale cumulus convection.
The initial TC-like vortex is the same as that in Chapter 3, which has a maximum
azimuthally wind of 30 IDS·I at the surface, which decreases gradually to zero at about
100 hPa, at a radius of 100 km. Given the wind fields, the mass and thermodynamic
fields are then obtained based on a nonlinear balance equation so that the initial vortex
satisfies both the hydrostatic and gradient wind balances. The resting environment has a
77
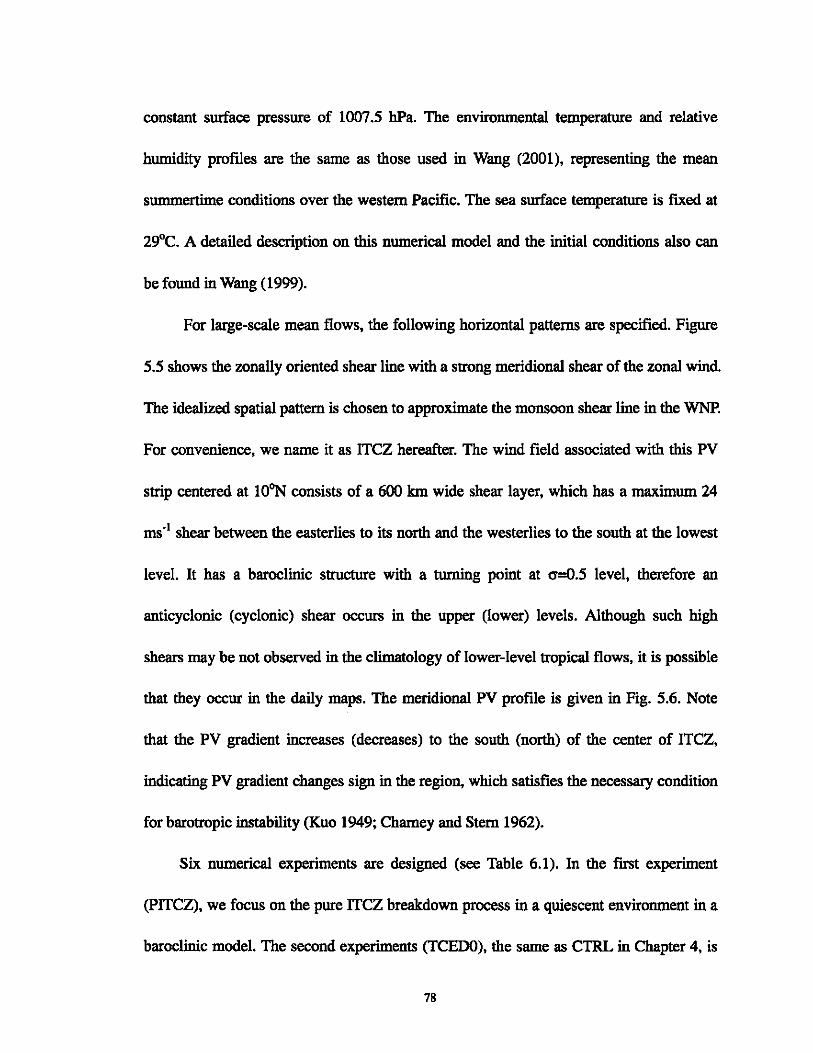
constant surface pressure of 1007.5 hPa. The environmental temperature and relative
humidity profIles are the same as those used in Wang (2001). representing the mean
summertime conditions over the western Pacific. The sea surface temperature is fixed at
29°C. A detailed description on this numerical model and the initial conditions also can
be found in Wang (1999).
For large-scale mean flows. the following horizontal patterns are specified. Figure
5.5 shows the zonally oriented shear line with a strong meridional shear of the zonal wind.
The idealized spatial pattern is chosen to approximate the monsoon shear line in the WNP.
For convenience. we name it as ITCZ hereafter. The wind field associated with this PV
strip centered at 1O"N consists of a 600 kIn wide shear layer. which has a maximum 24
ms -I shear between the easterlies to its north and the westerlies to the south at the lowest
level. It has a baroclinic structure with a turning point at 0-=0.5 level. therefore an
anticyclonic (cyclonic) shear occurs in the upper (lower) levels. Although such high
shears may be not observed in the climatology of lower-level tropical flows. it is possible
that they occur in the daily maps. The meridional PV profIle is given in Fig. 5.6. Note
that the PV gradient increases (decreases) to the south (north) of the center of ITCZ.
indicating PV gradient changes sign in the region, which satisfies the necessary condition
for barotropic instability (Kuo 1949; Charney and Stem 1962).
Six numerical experiments are designed (see Table 6.1). In the fIrSt experiment
(pITCZ). we focus on the pure ITCZ breakdown process in a quiescent environment in a
baroclinic model. The second experiments (TCEDO). the same as CTRL in Chapter 4. is
78

the TCED in a quiescence environment The interaction between a TC-like vortex and an
idealized ITCZ on anf-plane is explored in the third experiment (ITCED_F). The reason
to study on an f-plane is to compare results from subsequent beta-plane experiment
(ITCED_BO), by which we can understand the possible role of the energy dispersion in
the formation of wave train pattern. In this study, our strategy is to simply embed a
TC-like vortex in an idealized zonally oriented ITCZ. By investigating the interaction
between TC and ITCZ, we may understand the following questions: How the TC-scale
vortex perturbs the ITCZ breakdown? And how new TCs are generated thus a synoptic
scale wave train pattern is maintained?
The sixth experiment (DRY) is a case the same as ITCED_BO except the diabatic
heating is turned off. The comparison between DRY and ITCED_BO may tell us the roles
of diabatic heating in the formation of synoptic-scale wave train.
5.3 Model Results
5.3.1 ITCZ breakdown in a quiescent environment
The idea of ITCZ breakdown is quite straightforward. Numerous studies (Guinn and
Schubert 1993; NFS97; Wang and Magnusdottir 2005) have been devoted to investigate
such phenomena. Using a nonlinear barotropic model, NFS97 found that a zonally
oriented ITCZ could break down into a series of tropical disturbances in just a few days,
which is due to the barotropic instability of the mean flow. Tropical cyclones may later
79
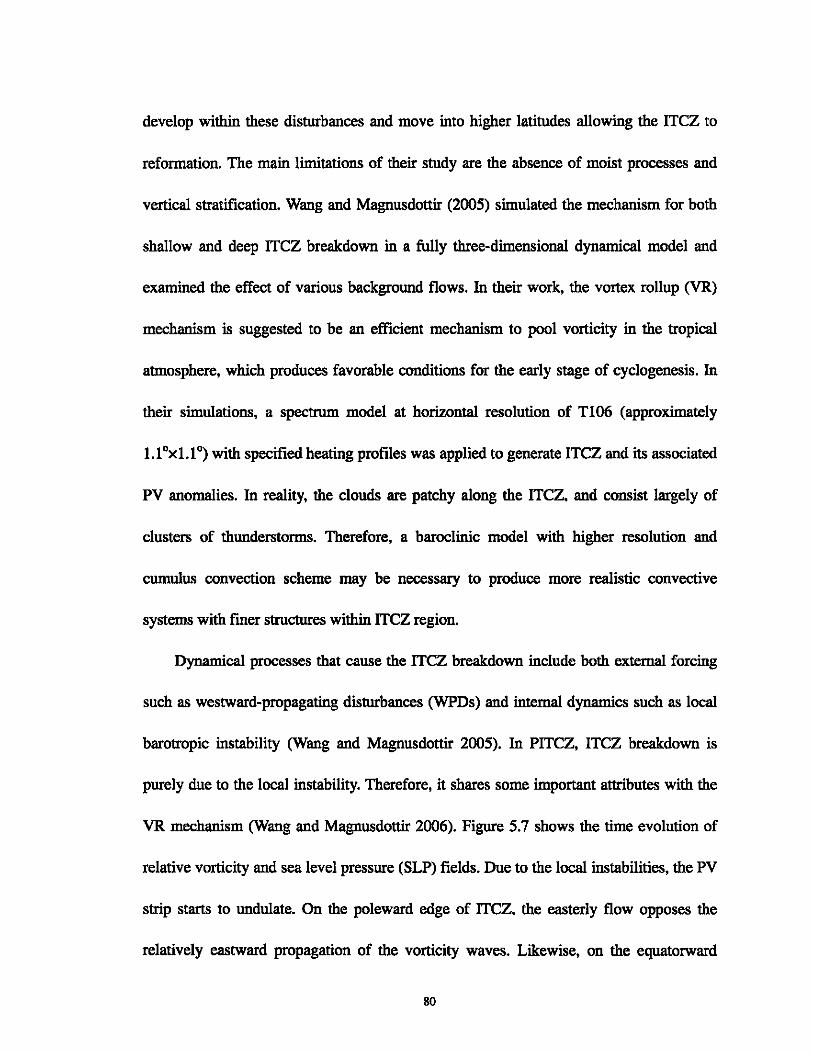
develop within these disturbances and move into higher latitudes allowing the ITCZ to
reformation. The main limitations of their study are the absence of moist processes and
vertical stratification. Wang and Magnusdottir (2005) simulated the mechanism for both
shallow and deep ITCZ breakdown in a fully three-dimensional dynamical model and
examined the effect of various background flows. In their work, the vortex rollup (VR)
mechanism is suggested to be an efficient mechanism to pool vorticity in the tropical
atmosphere, which produces favorable conditions for the early stage of cyclogenesis. In
their simulations, a spectrum model at horizontal resolution of Tl06 (approximately
1.1 Ox 1.1 ") with specified heating profiles was applied to generate ITCZ and its associated
PV anomalies. In reality, the clouds are patchy along the ITCZ. and consist largely of
clusters of thunderstorms. Therefore, a baroclinic model with higher resolution and
cumulus convection scheme may be necessary to produce more realistic convective
systems with fmer structures within ITCZ region.
Dynamical processes that cause the ITCZ breakdown include both external forcing
such as westward-propagating disturbances (WPDs) and internal dynamics such as local
barotropic instability (Wang and Magnusdottir 2(05). In PITCZ, ITCZ breakdown is
purely due to the local instability. Therefore, it shares some important attributes with the
VR mechanism (Wang and Magnusdottir 2(06). Figure 5.7 shows the time evolution of
relative vorticity and sea level pressure (SLP) fields. Due to the local instabilities, the PV
strip starts to undulate. On the poleward edge of ITCZ. the easterly flow opposes the
relatively eastward propagation of the vorticity waves. Likewise, on the equatorward
80

edge of PV strip the westerly flow opposites the relative westward propagation of the
vorticity wave. These counterpropagating waves phase lock and amplify (Hoskins et al.
1985; NFS97), and the PV strip eventually breaks down into several disturbances. On
plots of the near-surface vorticity field, elongated positive vorticity patches line up at
certain latitude. During breaking, the vorticity is pooled in this region, and while pooling,
the value of vorticity increases.
The results above indicate that the ITCZ is inherently a dynamical entity that may
break down without interactions with any external disturbances. The disturbances
produced from an individual ITCZ breakdown are usually nearly equal-sized weak,
which is consistent with the observational study (Wang and Magnusdottir, 2006).
5.3.2 TCED in a quiescence environment
To understand the 3D energy dispersion in a mature TC, we spin up an initial
axisymmetric TC on a beta-plane in a quiescent environment. After a rapid intensification
for about 36h, the model TC shows a slowly varying stage during which the minimum
sea level pressure oscillates with time. As a result of the beta-drift, the model TC
propagates northwestward. Meanwhile, it is evident that the isobars are elongated
westward, forming an elliptic outer structure and an east-west asymmetry (Chan and
Williams 1987). A weak wave train with alternating cyc1onic-anticyc1onic-cyc1onic
circulations starts to develop in the wake, and reaches a mature stage around day 10. The
detail is discussed in Chapter 3. The simulated wave train pattern in the lower
81

troposphere (Fig. 5.8) bears many similarities to those retrieved from the QuikSCAT
observations (Li and Fu 2006). For instance. it is orientated in the northwest-southeast
direction. with a wavelength of 2000-2500 kilometers. Another noticeable characteristic
of the wave train is its larger meridional scale than its zonal scale (Li et al. 2003).
Meanwhile. the southeastward energy dispersion is clearly shown in our simulation in
terms of the time-radius cross section of KE (Fig. 5.9). The KE at both upper and lower
levels propagates southeastward, radiating away from the TC center. Frank (1982)
pointed out that the most common location of a new storm is about 20· to the southeast of
a pre-existing storm in the western North Pacific. It implies that the wavelength of
Rossby wave train is approximately 2000 km. which agrees fairly well with our model
results.
Further integration shows that the TC energy dispersion alone fails to reproduce the
successive development of new TCs. which agree with both observational (Li and Fu
2(06) and numerical studies (Li et al. 2006). In reality. not all TCED-induced Rossby
wave trains fmally lead to cyclogenesis. and favorable background (dynamic and
thermodynamic) conditions may set the preferred timing and location for cyclOgenesis.
Therefore. the synoptic-scale wave train cannot be generated and self-maintained in the
absence offavorable large-scale environmental conditions.
82

5.3.3 Interaction between a TC and an idealized ITCZ on an/-plane
In this section, the interaction between the TC-like vortex and the mean flow is
examined first on anf-plane. Usingf-plane will filter out the beta effect-induced Rossby
wave energy dispersion. Therefore, by comparing with the subsequence beta-plane
experiment, we may learn the effect of the energy dispersion in the sequential new TC
formation.
In ITCED_F, a TC is initially embedded in the central latitude of the ITCZ, and then
acts to perturb the ITCZ, leading to the development of synoptic-scale disturbances in the
ITCZ. That is. the PV strip starts to undulate and is sheared into two major thin outer
bands since day 4 (Fig. 5.10). Thereafter, eddies continuously rotate cyclonically and are
sheared into two major vorticity bands. Meanwhile, the PV filaments become thinner and
longer and wrap around the cyclone. As suggested by Guinn and Schubert (1993), the PV
filaments that form during ITCZ breakdown may be organized as the outer spiral bands
of hurricanes. As the integration progresses, the filaments of high PV detach, or merge
and are possibly absorbed by the TC. This axisymmetrization process agrees fairly well
with the results by Lander and Holland (1993) and Ritchie and Holland (1993). Once
weak and small disturbances are generated, it gives the TC a better chance of distorting
and collecting the adjacent smaller ones. Note that two large disturbances are located to
the east and west end of the model domain at day 10. This suggests that the disturbances
are much symmetric to the TC since it is stationary on anf-plane with a zero mean flow.
83

5.3.4 Interaction between TC and ITCZ on a beta-plane
As discussed above, while a TC moves northwestward due to the beta effect or the
advection of the mean flow, it will emit energy southeastward. As a result, a Rossby wave
train with alternating cyclonic and anticyclonic circulation will be generated in its wake.
Once the energy disperses eastward and is accumulated in the ITCZ region. perturbations
will amplify due to the local instability associated with the unstable ITCZ. Figure 5.11
shows the time evolution of SLP in the ITCED _BO experiment. While the TC moves
northwestward, the ITCZ starts to undulate and a weak disturbance (represented by A)
breaks off from the PV strip and occurs to its east side at day 5. Thereafter, this weak
depression moves northwestward following the previous mature TC, and a second
disturbance (represented by B) is generated to the eastern end at day 7, which eventually
intensifies into a strong tropical cyclone at day 10. Associated with these TCs activities, a
clear Rossby wave train oriented in the northwest-southeast forms, which resembles some
basic observed features such as the orientation and wavelength. Figure 5.12 represents the
vertical-radius cross sections of the meridional wind along the axis of the wave train. It
has nearly barotropic structure in the middle-low troposphere. Above a=O.3 level, a
fOlWard tilting becomes increasingly prominent. This slight northwestward tilting is in
agreement with previous observational studies (e.g., Lau and Lau 1990; Chang et al.
1996). Previous studies have shown that, during the boreal summer over tropical western
Pacific, the synoptic scale wave trains tilt northwestward with elevation. In Chapter 3, we
have proposed that such a northwestward tilting may result from the different phase
84
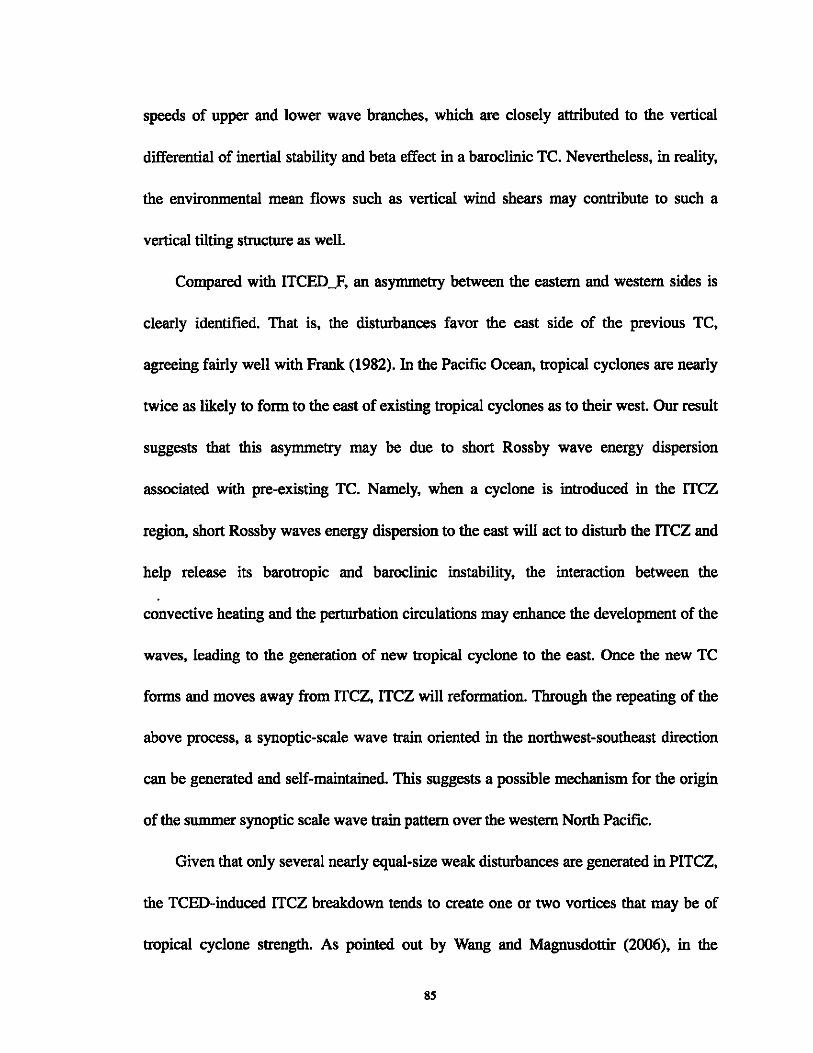
speeds of upper and lower wave branches, which are closely attributed to the vertical
differential of inertial stability and beta effect in a baroclinic TC. Nevertheless, in reality,
the environmental mean flows such as vertical wind shears may contribute to such a
vertical tilting structure as well.
Compared with ITCED_F, an asymmetry between the eastern and western sides is
clearly identified. That is, the disturbances favor the east side of the previous TC,
agreeing fairly well with Frank (1982). 1n the Pacific Ocean, tropical cyclones are nearly
twice as likely to form to the east of existing tropical cyclones as to their west. Our result
suggests that this asymmetry may be due to short Rossby wave energy dispersion
associated with pre-existing TC. Namely, when a cyclone is introduced in the ITCZ
region, short Rossby waves energy dispersion to the east will act to disturb the ITCZ and
help release its barotropic and baroclinic instability, the interaction between the
convective heating and the perturbation circulations may enhance the development of the
waves, leading to the generation of new tropical cyclone to the east. Once the new TC
forms and moves away from ITCZ, ITCZ will reformation. Through the repeating of the
above process, a synoptic-scale wave train oriented in the northwest-southeast direction
can be generated and self-maintained. This suggests a possible mechanism for the origin
of the summer synoptic scale wave train pattern over the western North Pacific.
Given that only several nearly equal-size weak disturbances are generated in PITCZ,
the TCED-induced ITCZ breakdown tends to create one or two vortices that may be of
tropical cyclone strength. As pointed out by Wang and Magnusdottir (2006), in the
85

presence of the external forcing such as the WPDs, ITCZ breakdown may form 1-2
cyclones, whereas the VR mechanism may have been neglected because the produced
disturbances are rather weak and dissipate quickly. To this point, the TCED acts as an
external forcing that enhances the local instability thus results in a strong disturbance.
An interesting question arises here is how sensitive is the TC location to the ITCZ
for a new cyclogenesis? The ITCED_Bl experiment is conducted to answer this question.
We keep the same initial conditions as ITCED _BO except the initial TC vortex is placed
600 Ian north of the center latitude of ITCZ. Since the TC is located at the mean easterly
flow, it moves westward faster than that in ITCED_BO. Similarly, the ITCZ starts to
undulate and a weak disturbance breaks off from the PV strip to the east side on day 2
(Fig. 5.13). Thereafter, this weak disturbance further intensifies and eventually develops
into a tropical cyclone at day 5. A second disturbance is generated to its east side. and a
clear Rossby wave train oriented in the northwest-southeast direction forms. Even though
the locations of the sequential geneses are different from ITCED_BO, the wave train
pattern is comparable in its overall structure, indicating that wave train pattern is not very
sensitive to the initial TC location as long as it is located in the vicinity of the ITCZ.
5.3.5 Roles of diabatic heating in the synoptic-scale wave train
In this section, we will examine the role of diabatic heating in the generation of
synoptic-scale wave train. To illustrate the role of the convective heating, a parallel
experiment (DRY) is conducted in the absence of diabatic processes. As the integration
86

progresses, the undulations amplify through barotropic instability, causing the portion of
the PV strip to break down into several vortices (Fig. 5.14). By day 5, two weak
disturbances with almost equal size are generated to the east side. Although the
disturbances can maintain throughout the entire simulation, they are far below the TC
intensity, which agrees with the barotropic dynamic (NFS97). Since PV cannot be
concentrated in the absence of diabatic heating, the intensity of the simulated wave train
is much weaker. This suggests that the primary source for the TCs and synoptic wave
train is the latent heating associated with penetrated deep convections. Therefore, the
tropical cyclogensis associated with ITCZ breakdown involve an interplay of barotropic,
baroclinic, and moist physical processes.
5.4 Conclusions and discussions
The interaction between a large-scale monsoon shear linelITCZ and a TC is
investigated using a three-dimensional primitive baroclinic model. Once a TC develops in
the ITCZ region, the southeastward energy dispersion from the TC may disturb ITCZ
thus enhance the local instabilities. Cumulus convection can be organized in the region of
cyclonic circulations, and thus a new TC forms. Through repeating of this process, a
synoptic-scale wave train can be generated and self-maintained. The results suggest the
interaction among the low-frequency background flow, synoptic wave train and the TCs,
which is likely to provide one possible mechanism for the origin and self-maintenance of
87

the summer synoptic scale wave train pattern over the western North Pacific. Moreover,
our numerical results clearly demonstrate an asymmetric tendency in their cyclogenesis
locations, which confirm the hypothesis by NFS97 that Rossby wave energy dispersion
and/or ITCZ breakdown may cause the observed tendency for new tropical storms to
form to the east of pre-existing ones (Frank 1982). Numerous studies (Yanai 1961: Chang
1970; Kuo et aI. 2001; many others) suggested the westward-propagation waves such as
easterly waves are possible external forcing in triggering TC genesis. in this study, the
TCED may be another possible the mechanism. Of course, these mechanisms will work
together in nature.
We only specify an idealized monsoon shear line, and sensitivity tests of different
large-scale mean flows such as confluence zone on this mechanism need to be conduced.
Moreover, in reality, when TCs move into higher latitudes allowing the ITCZ to reform in
just a few days. Unfortunately, our simple model cannot capture the ITCZ reformation.
More complicated GeM model with realistic environmental flows will be used in our
future work.
88

Symbol
PITCZ
TCEDO
ITCED_F
ITCED_BO
ITCED_BI
DRY
Table 5.1 Descriptions of the major numerical experiments
Experiment descriptions
Pure ITCZ breakdown
TCED in a quiescent environment
TC-ITCZ interaction onj-plane
TC-ITCZ interaction on beta-plane
Same as ITCED_BO except initial TC 600 km to the north of ITCZ
Same as ITCED_BO except without diabatic heating
89
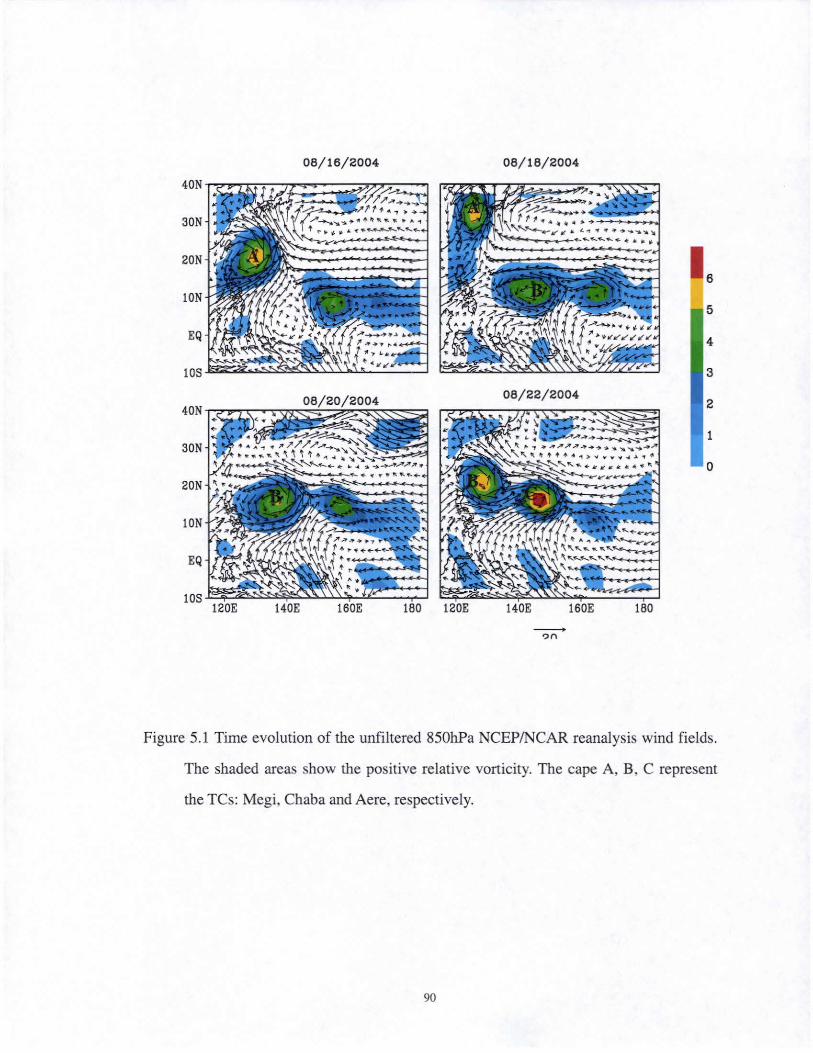
08/ 16/ 2004
ZON
ION
EQ
lOS
08/ 18/2004
08/ 22/2004
-? n
6
5
4
3
1
o
Figure 5.1 Time evolution of the unfiltered 850hPa NCEPINCAR reanalysis wind fields .
The shaded areas show the positive relative vorticity. The cape A, B, C represent
the TCs: Megi, Chaba and Aere, respectively.
90

08/16/2004 08/17/2004 08/18/2004
06/19/2004 08/20/2004 08/21/2004
SON
20N
10N
•• *~ •••• ~.~~?~ EQ
140£ 180B -10
Figure 5.2 Time evolution of synoptic scale wave train represent by the filtered 850 hPa
wind fields.
91

15-Day-Runnlng mean of (U.V) center on 08/15/2004
#~,~~~~~~----~~~~~~,~ \., ....... -----~~, .. . '-~,".,", ... ~,. .-., ...... 1'1 1'1 II .. 11.,. .. " 2
", ......... " ..... ,. ......... C-C-40
1.5
1
0.5
~
20
Figure 5.3 the mean background flows conducted by 15-day mean centered on August 15.
2004. The shaded area shows the positive relative vorticity.
92
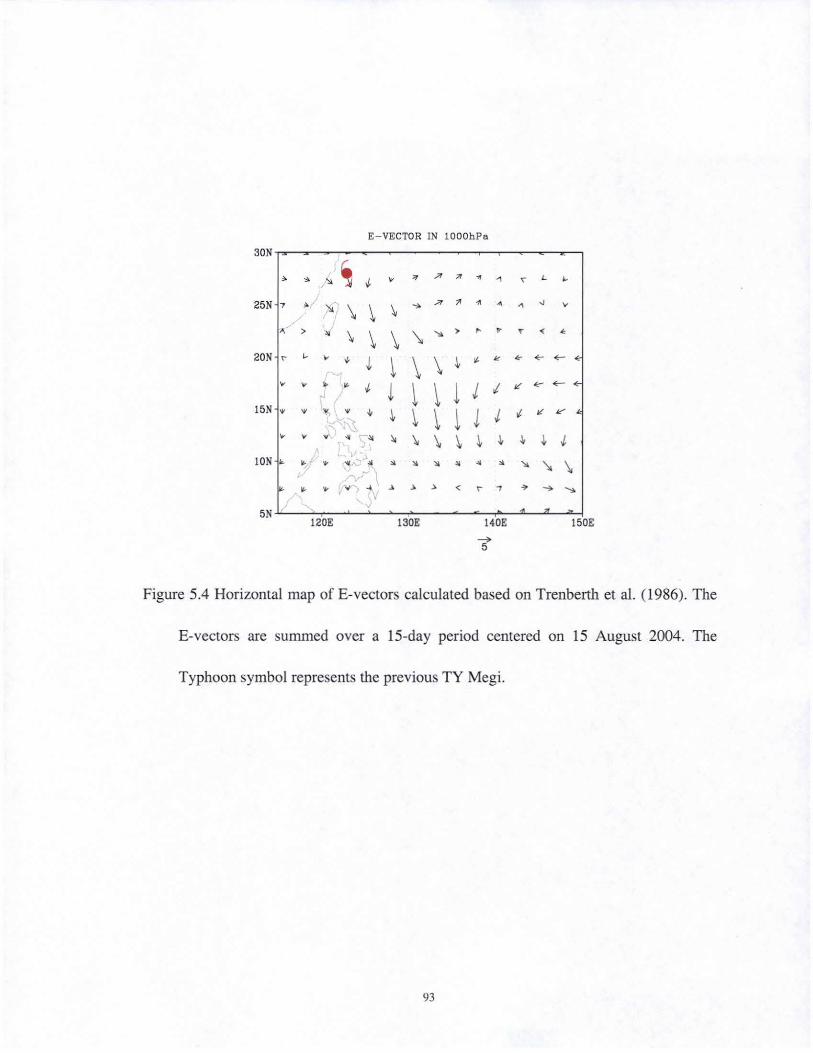
E-VECTOR IN 1000hPa
30N
• ~ j" , ~ '" ~ " ~ • " < .. ..
Z5N 7 . 1 "' J \ ~ \ ... -'" " • • , oJ V
/ • > " \ ~ \ \. " > , • • < • ZON < " '" • t ~ \ \ ~ • " k <- <-- •
'" '" '" • J, 1 ~ ~ 1 J , "' .... <-~ -15N • • • •
'" ~ ~ \ 1 J J " " '" ," .~ '" '" .. · r. .. '\, '), \ ~ ~ ~ ~ J , iON l.. ",, / ... -i.- .l
" • " • • • • • " " \,
'" • '" -.r ) .. , > > < < 7 '> -> --. '. J
, 5N / ~
1Z0E 130E 140E 150E
--> 5
Figure 5.4 Horizontal map of E-vectors calculated based on Trenberth et al. (1986). The
E-vectors are summed over a IS-day period centered on 15 August 2004. The
Typhoon symbol represents the previous TY Megi.
93
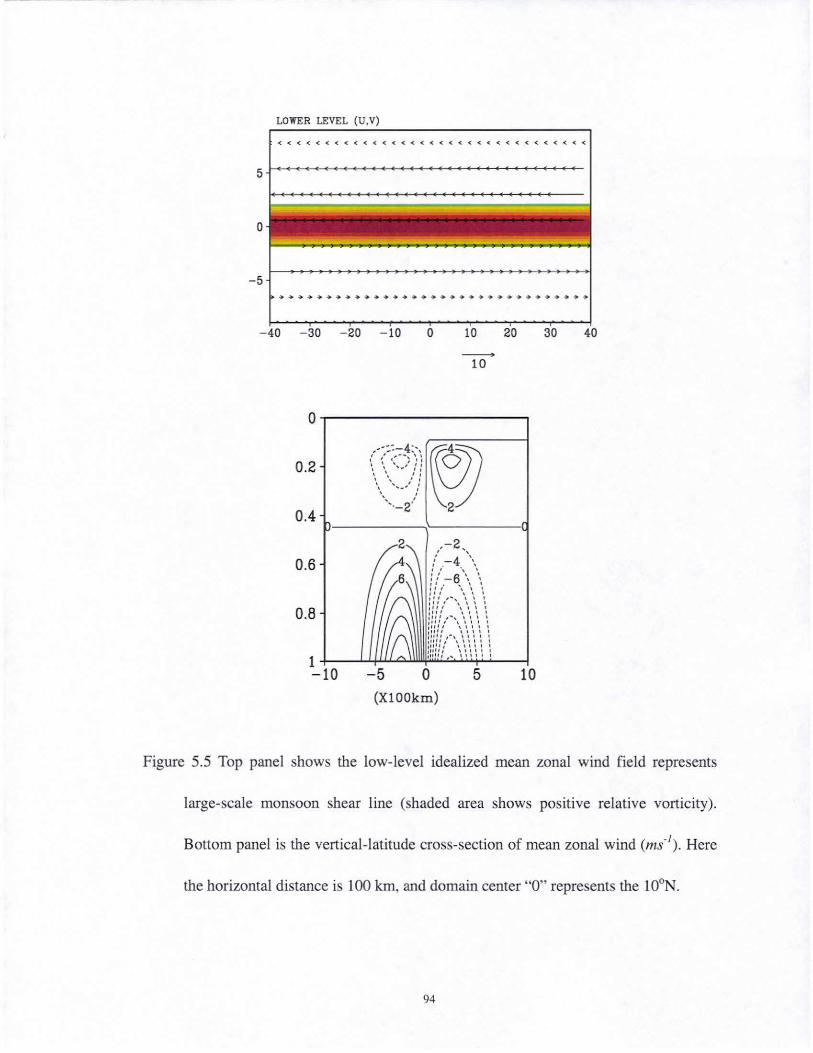
o
-5
LOWER LEVEL (U.V)
««««««««««««««««<
~
10
o~--------------~
0.2
0.4
.- -::-4:-. ~4~ .... --, " (@ ~ .. '.~ / :: , . ~ " " '. , , " '. ' .. ./,' \'''- - 2/ 2
p---------~~---------a
0.6
0.8
1 -t----'-LfL.L.L..J;;;w.I - 10 - 5 0
(X1 00km)
5 10
Figure 5.5 Top panel shows the low-level idealized mean zonal wind field represents
large-scale monsoon shear line (shaded area shows positive relative vorticity) .
Bottom panel is the vertical-latitude cross-section of mean zonal wind (ms-') . Here
the horizontal distance is 100 km, and domain center "0" represents the lOoN.
94
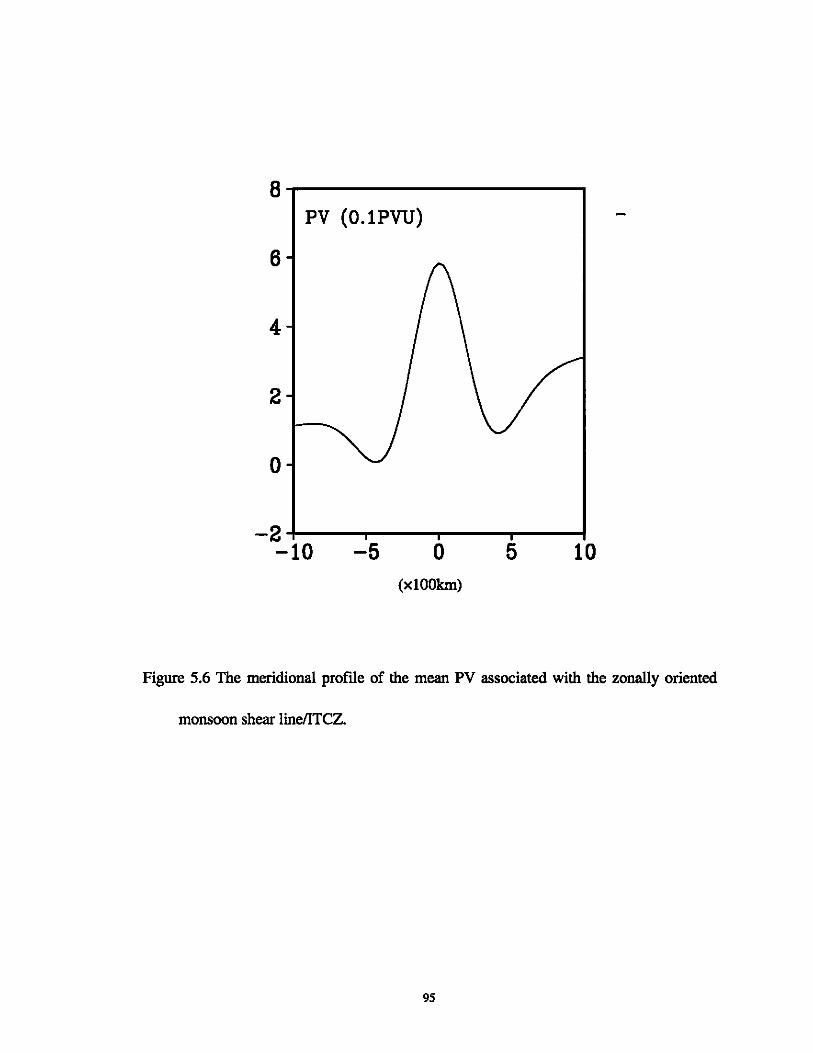
8~------------------~ PV (O.lPVU)
6
4
2
o
-2+---~----~----r---~ -10 -5 o 5 10
(xlOOkm)
Figure 5.6 The meridional profile of the mean PV associated with the zonally oriented
monsoon shear linelITCZ.
95

DAY 1 ' «~~~~"'~"'~<~~1"11~1~~ ~~ "~~'CCCC ""~~" ~~ ....... .
20 :::::::!::::~::=~~~~:~:~~:: •• « ••••• < ••••••••••••••• ~~ ••••••• •• cc ••••••••• • .. • .. •••
10 ::::::::;:;:;;:::::::::::: ~
~;;~~·~·~·~·~I00~;~I~~~·~·~·~·~·~·~·~·~I~~;I~;~O;~·~~~ o •••••••••• ---1007..........- .. 4 4 .. = 1
••••••• ~ ••• ~ ?, ... ,. ? • •• ••• - 10 • 1 1 1 • ••• 1 • 1 •••• 1 .. . . ....... . ............... ~ ..... ~ • • • •• A. · . . . .. " ................... .
• •••• A .. ........ A •• •• • •••••••
- 20 ." •.• " .... . ........................... . ....... " ... " ........ ... . ~ ... . · . . . ........... ....... . ........... ................ ... . DAY fi
• .. 1007· ........ . ......... .
::::; ~ ;:~iO(h·· ... . 20 ................ . ............. .
.. .. .. .. .. .. .. .. • .. • • • • • • • • • • • • • • < ••
.. .. .. .. .. .. .. .. .. .. < c • c ••• •••• •••• • •
DAY I
20
10
0
· 10
·20
DAY 11
20
10
0
· 10
- 20 o.
20
10
0
Figure 5.7 Time evolution of the lower level wind vector superposed by SLP (unit: hPa;
left panel) and relative vorticity (positive areas are shaded; unit: JO.5 s"1; right panel)
fields in PITCZ experiment.
96

20
10
o
-10
-20
10
o
-10
-20
20
10
o
-10
-20
DAY 2 '1 ,. ., ., ., ,. ~ ~ ). ,. ,. ? "1 "1 ., ~., ~ ~ ~ ~ ~ ~ v v v v ~ ~ ~ ~ ~ ? ,. ., 7 ~ ., '1" ~ ~ ~ ~ V V V ~ 01. ~ ~ ,. ,. .,
~ '" V V ~ '" ~ ~ " ., ., ""''''' V~.aolol~>.,., "'''lAo( ",\IV 01"),.,),,,.,
,. ,. ., '" V .., '" "' ). ,. ,. .1 V Y ....... ..\ "' ,. > .. V .., 50 Y ., 01. '" .1 '"
... ." '" '" " .. y "" '" '" .\ ol
..I .. '" " A" ". Y ... '" " -I. "
.. .. .. .. A ,. ... y ., .a '" .a "" " '" .. '1 ,. V ." " " " .. " .1 .. .. .., '" '" .. .a .. '" .a " " ,. ., 01 .1 " .. '" " " »>).,...... >44"444> ,. ,. ,. ,. ,. ,. • • • • • • • "I ., ., .a " '" .a .1 .1 .1 ,.
". ,. ,. ,. ,. ,. ,. ,. ,. ~ ~ ., ., "I ., ". " .a " '" .1 > .l ,.
,.',..,7.,.,.,., ... .,.,.,.,.,"''1 ~V"'J.>.l" ,..,.,.,.,.,.,"' .. " "'",. flo roo t' T C (,..(. "'1" > ,. .. ,. A A,.,.""""" to <r T C' < < < « 'l' "A,. T t' t' r ,. ,. t' t' t' t' T T '" < '" 0( < « 0( 0( « " T t'
DAY 8
• • • • • • • • • • • • • •
• > • ., " I" C' < t. &. " " .,,. 'C'.to L ,. " .I.
,. 0( to t. ... " ,. A .c, '- '" > 01 ., " L V -'
'I" "" T " '" ,. ,. t' ,. t' < y ,.
.. V ,. t' t' or L 01 .1
... t' T t' <" ., .1 ".
,"<"\''''1.1» ."'<t'",,»
.. .. \0 « ,. .. ., '1 ,. ,.
.. .... If '" " " '" ., ,. ). ...... I- A " " " ., ,. ,.
•• .,.+ ...... "'''''''''1111'· •• ." ... ..,.... .. ... e.,.A"""".,» ......... "'v .......... '-"'''',.,.,,'''> v ........... >V .......... "'y.,,,,.,.,.,.,.Cll' .. ,.,.,.,.,..1., ............ .">""""",.,,Lt. ,. ,. ,. ,. > ~ ~ ~ ~ ~ " • ~ 4 > ., ~ ~ ~ ~ ~ ~ ~ ~
>l''''~ "''''~\iI'~" .... ~''',..,'f~ ,.~<~~
~ t" t" \" " " ,. ,. ,. ~ t" t" L ~ ~ ,. ~ ~ ~ ,. ,. ~ ~
t" ~ A A A ~ ~ , ~ ~,. A ~ ~ ,. < ~ ~
AA~t"'~" AAAt"~""
.. A " " ". " ~ • " ., V ". " "
f .. " ,. .. V " l-
t f '" .:. " " " ". t .... '" .... ". .. '" ,. L 10 .. '" .. " " > '" '" " " ',., ... "" > '" '" ,. ,. ., ., • '. \. .... 01 ... '" .to ,. ., ~ ". '9 ~ "'9 '" 01 ....... '" .31,.,,\""'.... .~.,II~ • .,~..a" ..... > ~ .... 100" ....... "..,""~11.7 ......... ".,. ,.,.10'" ...... ",,,,,,11,,« .. ,. ...... ,,,,,,. ,., " ......... ",. ,.11''''11.,,> "~ .. ,,,.,. \"<"" ... ""04"'~"." ... ",.<"'''~ol'''> \"<'-"" ......... "« ... ,."'\"<,,,. ..... "',.
--+ 5
Figure 5.8 Time evolution of SLP and lower-level wind field in TCEDO.
97

10
B
6 200
eo 4 .,
20 2
10
Sigma""' O.2 • 0 • 10
• 2
B
6
4
2
0
Figure 5.9 The time-radius section of KE (m2 S ·2) in the upper (0=0.2) and lower (0=0.8)
level along a southeastward axis (the dashed line in Fig. 5.8) in TCEDO.
98
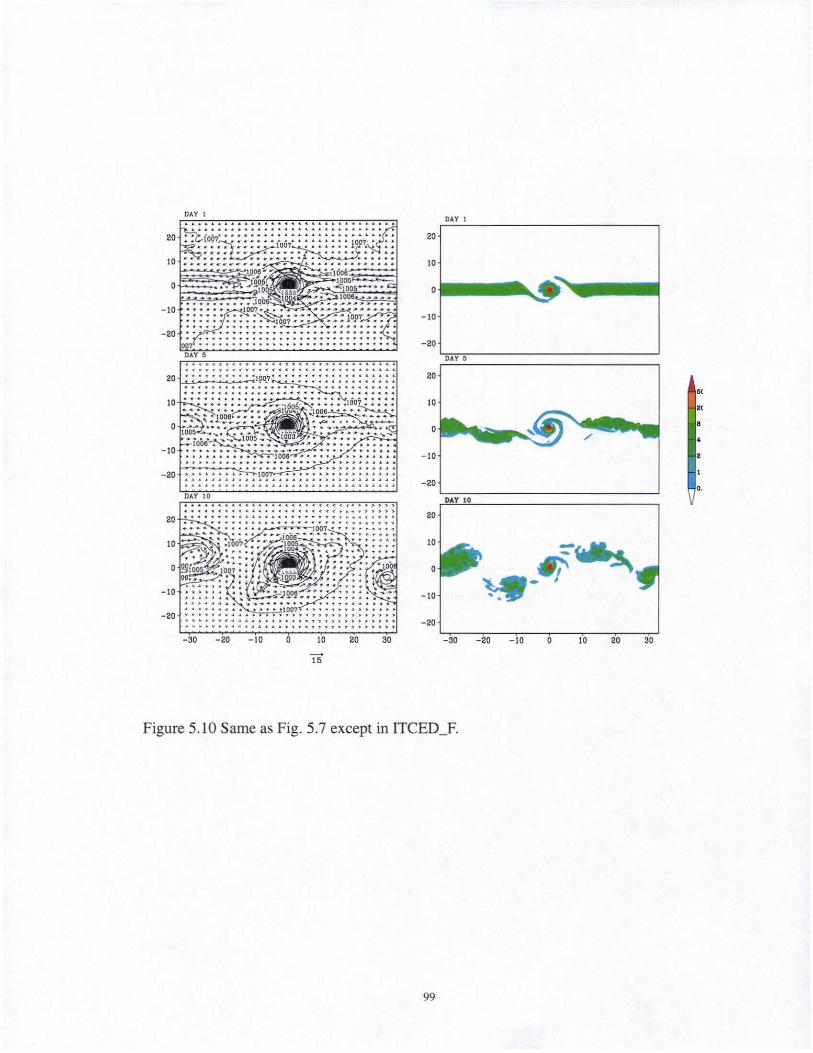
DAY t DAY t
2.
I •
• -I.
-2. DAY 5
~
"
,.
Figure 5.10 Same as Fig. 5.7 except in ITCEDJ.
99

DAY 1 DAY 7
• • • . • • • • • , , , • • • • • • • • , , , • , ,
, , , , , , · • •
· • • , -10 • • · • • • • • • · • • , · · · · • • • • • • • • • -20 • • • • • • • • • • • •
Figure 5. 11 Same as Fig. 5.8 except in ITeED_BO.
100

V-Wind
0.2
0.4
0.6
0.8
1
Figure 5.12 vertical radius cross-sections of meridional wind (unit: m s" ) along the
northwest-southeast axis (i.e. , the dashed line in Fig. 5.11) in ITeED_BO.
101

20
10
o
-10
,. ,.. " ., ., '7 ., 'J .., ., ., ., ., ., '" ,.. " 0( 0( 4. 0(
",.",..",,..,.,.,.,.,77.,.., "C'-'-L C t' ~ .., .... t. " " 0( L Y ~ .> ,. ,. ., ., " "" r. " < ,",\/,,,, .... ,,,,,4. I-V-Io,..,.,., "","&0
• v • v
,. ,. ,. ,. /to It. '" ". ,.. ,. ,. ,. ,. ,. ,. ... ,. ,.
. " . < " •
.. ,. ., .,. ,. ,. ...... ,. ,. ,. ..... ,. ...
,. ,. .. ,. .. ,. ,. .. po .. ,. ,.
-20~~~ ______________ ~ __________ -J
30~--~~~~--------~~---------,
10 •
< "''''<t''''''''''' """'L'1.
,.1.<",.,.,,"'''''''''''1, '<""'1'<4.1.1.4
< < <
o ~.,,,,,.rr ,. '" , '7 .., '" ,.
'l"t'",.,,<'tCC<4.« -10
.. " ............... cc<ce"''''' ... " ., ., ., .. .. ., .. ., ., ., ., ., ., ., ., ., ., ., .,
-20
Figure 5.13 Same as Fig. 5.8 except in ITeED _B 1.
102

DAY 1
• • • • > > • • • • • • • y
20 • > • • > • > • • • • • • • • • • > > • • > • • • • • > • • • • • • • • • • • • 10
> > • • • • • • • • • > • • • • • • • • • •
0 ..,. ....... ..,. .... > > > > >. • • > > • -10 • • y. • " L • • " y .y
> • • • > • • y • y " . , , • • •• • L Y " Y Y , • • • • • • • y> , , • < • L • • • y
-20 . ., . ., • • L • • • • • L <- •. .. .< L • • • L L .10 •. t.. , • • • • • • < • • < < < • • • • • • • • • • , ? • • • • < • • • • • • • • • < < • • • L •
20
10
0
-10 • • • • • • • , • • • • • • • • • • • • • • • • • • y • , 1 • • • • • L • • > > ,
-20 • .c_ c .t. • < « « " «
• • • • • • · , • • • < < • • • • • 1 1 • • • • • • •• > , , 1 • • • • • • • • • , , • • 'f' 't' 'f' \", ., , , , , , 1 1 • • • • • • • • · , • • •
--+ 15
Figure 5.14 Same as Fig. 5.8 except in DRY.
103

CHAPTER 6
TROPICAL CYCLOGENESIS PRAPIROON (2000)
ASSOCIATED WITH ROSSBY WAVE ENERGY DISPERSION
6.1 Introduction
Tropical cyclones (TC) are very complicated atmospheric systems because of their
multiple-scale interactions involved. Studies to date have gained considerable insights
into the mechanisms of their formation or genesis. Gray (1979) investigated the
environmental conditions around the cyclogenesis regions and found that six physical
parameters are important for the potential TC genesis. Ooyama (1964; 1982) stressed the
importance of cooperative feedbacks between disturbances and the latent heat released by
convective clouds. Emanuel (\986) proposed the wind induced surface heat flux
excbange (WISHE) mechanism. Both of those two mechanisms require that the
disturbance should reach a threshold intensity, so that it is capable of intensifying into a
mature tropical cyclone due to itself induced air-sea interaction. Thus, a crucial question
on how the disturbance with finite amplitude is generated remains unclear.
As discussed in Chapter 1, numerous observations have showed that there are many
routes to generate tropical disturbances, including nearly classic baroclinic development
(Bosart and Bartlo 1991), interaction of easterly waves or other lower level disturbances
with tropical upper tropospheric disturbances (Ramage 1959, Sadler 1976, Montgomery
104
and Farrell 1993), and accumulation of wave energy in diffluent large-scale flow (Shapiro
1977. Sobel and Bretherton 1999). Dickinson and Molinari (2002) showed that the
disturbance maybe from a mixed Rossby-gravity wave packet. Ritchie and Holland (1997)
hypothesized the growth of a circulating tropical disturbance occurs via the merger of
smaller-scale vortices that may have been formed in tropical mesoscale convective
systems (MCSs). Chen and Frank (1993) suggested that mesoscale vortices formed in
some MCSs might develop into tropical cyclones under favorable conditions. Recently,
Montgomery et al. (2003) proposed that the TC genesis maybe due to "vortical hot
towers" with high vertical vorticity, and the merger of eddies produce rapidly a
disturbance with finite amplitude, which is necessary for WISHE mechanism. The
connection between TC genesis and the Rossby wave energy dispersion (TCED) from a
pre-existing TC has been suggested by previous investigators (e.g., Frank 1982; Davidson
and Hendon 1989; Briegel and Frank 1997; Ritchie and Holland 1997; Li and Fu 2006).
As described in the pervious chapters, while the TC moves northwestward due to the
mean flow steering and the planetary vorticity gradient, Rossby waves emit energy
eastward and southward. As a result, a synoptic-scale wave train with alternating
anti-cyclonic and cyclonic vorticity perturbations forms in its wake.
In reality, only small percentage of TC genesis events in WNP is identified as being
associated with energy dispersion from a pre-existing cyclone. Whether or not a Rossby
wave train can finally lead to cyclogenesis depends on large-scale dynamic and
thermodynamic conditions. Li et al. (2006) simulated the cyclogenesis events associated
lOS

with the TCED. Their results indicate that TC energy dispersion alone in a resting
environment does not lead to cyclogenesis, suggesting the important role of the wave
train-mean flow interaction. Moreover, Ross and Kurihara (1995) pointed out that a
previous hurricane can significantly change the large-scale environmental field, thus
possibly the evolution of other tropical disturbances within the influenced region. It is
important to investigate the extent to which a previous TC contributes to the large-scale
environment thus a sequential TC genesis. A better knowledge of how the pre-existing
TC affects the new one is an important component of understanding of the hurricane
dynamics and improving our ability to forecast actual storms.
The purpose of this chapter is to examine the TCED-induced genesis process by
simulating an individual case, Typhoon Prapiroon (2000). This Chapter is organized as
the follows. In section 6.2, observed evolution of the pre-Prapiroon circulation is briefly
introduced. Model description and experiments designs are documented in section 6.3.
Section 6.4 illustrates the comparisons between a pair of model simulations with and
without the pre-existing TC, respectively. Possible roles of the pre-existing TC in the
sequential genesis are proposed in section 6.5. Finally, conclusion and discussion are
given in section 6.6.
6.2 Observed evolution of the pre-Prapiroon circulation
An example of the TCED scenario is the genesis of Typhoon Prapiroon in the
western North Pacific on 26 August 2000. To display the synoptic-scale wind structures
106

prior to TC formation, a band-pass filter method is employed to retrieve 3-8 day signals
from QuikSCAT satellite data. The selection of 3-8 day bandwidth is based on Lau and
Lau (1990, 1992), who noted a significant synoptic-scale wave spectrum appearing in this
frequency band in the WNP. Figure 6.1 shows the evolution of Rossby wave trains
associated with a pre-existing typhoon (TY) Bilis, which formed on 18 August. On 22
August, TY Bilis was located to the northeast of the Philippines, and a clear Rossby wave
train with alternating cyclonic and anticyclonic vorticity circulation was wel1 developed
in its wake. It was orientated in a northwest-southeast direction with a wavelength of
about 3000 kilometers. One day later. TY Bills made landfall on the southeast coast of
China and rapidly dissipated within 48 hours. Nevertheless, its wave train still existed
and led to tropical cyclone Prapiroon in the northwest of Yap Island at 1800UTC 24
August. The observation shows that the Prapiroon developed at about 20· to the east of
the pre-existing TY Bills. which agrees with Frank (1982). He found that when WNP
typhoons first reach typhoon intensity, the most common location for new ones is about
IS· _20· to the east of the pre-existing storms. It also agrees fairly with previous studies
(Ritchie and Hol1and 1997; Li and Fu 2006), in which they pointed out that the typical
wavelength of the TCED-included Rossby wave train is about 2500 kIn.
Trenberth et a1. (1986) found that a clear evidence of the Rossby wave energy
dispersion can be demonstrated using an E-vector. In this study, the E-vector is calculated
based on an II-day-period average centered on 20 August 2000. indicating the direction
of energy dispersion around that time. Figure 6.2 i11ustrates that there is a southeastward
107

propagation of Rossby wave energy that primarily radiates from the previous mature TC.
In addition, there is another energy source with relatively smaIl amplitude coming from
the eastern boundary and converges with the one coming from the west near the genesis
location.
The observed 150hPa wind vector and relative vorticity fields at 1200 UTC 22
August 2000 are shown in Fig. 6.3. An elongated outflow jet core with maximum
velocity exceed 35 m S·l originates from an area to the northwest of the TY Bills,
extending in a clockwise direction to the southwest. A stronger cyclonic shear vorticity
perturbation forms beyond the outflow jet core. This structure agrees with other
observational studies (Black and Anthes 1971; Frank 1977; McBride 1981) and
numerical results (Shi et a1. 1990; Wang and Holland 1996). This steady asymmetric
structure remains nearly unchanged in the following days until the TY Bills made landfall
and then decayed. The vertical-radius cross section of relative vorticity fields along a
northwest-southeast oriented axis (Le., the dashed line) bears many similarities as our
idealized numerical simulation in Chapter 3. For instance, a clear positive vorticity
anomaly emerges near 200hPa, which is attributed to the upper TC outflow jet. The
positive vorticity perturbation tilts northwestward with elevation, and connects with the
lower level disturbance in the wake. In Chapter 3, we suggest that the vertical tilting
might be attributed to the differential beta-effect with elevation in a baroclinic TC. To
summarize, the case bears many similarities as previous idealized study, suggesting that
this genesis event is closely associated with TCED mechanism.
108

Using the Tropical Rainfall Measuring Mission (TRMM) Microwave Imager (TMI)
data, the features of the precipitation structure of TC Prapiroon is qualitatively viewed
(Fig. 6.4). Initially, there are prolific but scattered convective cells around the genesis
area where corresponds to the cyclonic circulation in the wave train. Li and Fu (2006)
identified the horizontal structure cloud patterns during the course of the wave train
development. That is, an alternating cloudy-dear-cloudy pattern corresponds to the
alternating cyclonic-anticyclonic-cyclonic circulation. Convective systems concentrate
in the cyclonic circulation region, implying a positive feedback between the diabatic
heating and the rotational circulation. After a period of weak and disorganized convective
activity, those convective cells move closer and merge into several larger MCSs. For
instance, several significantly well-organized convective systems were identified at
OOOOUTC 24 August. Thereafter, these convection systems propagate slowly poleward,
rotate cyclonically about each other, and converge. At approximately 1800 UTC 25
August, it became a tropical depression with a well-organized structure; namely, a
dominant convective center and somewhat cyclonically rotating outer rainbands. During
this process, small-scale patches of vorticity introduced continually into the flow field of
a larger-scale vortex are quickly axisymmeterized, by which feed their energy into the
vortex scale flow. On the late 27 August, a strong tropical stOrtn emerged.
With the enhanced OMS images, we also find that a loosely organized area of
convections first becomes a depression and then intensifies into a strong tropical stortn
(not shown). Vigorous convections developed during this process and were marked by
109
merging and interaction of a number of MCSs within the tropical depression circulation.
In short, the development of, and intensification of MCSs were important components of
the genesis processes of TC Prapiroon. It has been well recognized that scattered
convective elements could develop into smaIl vortices, which subsequently merge into a
large tropical depression (Ritchie and Holland 1997; Harr et al. 1996; Gray 1998). This
process is essentially stochastic, but the degree of stochasticity can be reduced by the
continued interaction of the meso-scale systems or by a favorable environmental
influence (Yamasaki 1989; Simpson et al. 1997). Thus, a question arises here as to how
the pre-existing TC influences the TC genesis by modulating the meso-scale convective
systems. In addition, whether the existence of the parent TC can modulate the large-scale
environment condition, thus exert significant effects upon the genesis of the new storm?
Therefore, it is our primary goal to investigate the possible roles of the previous TC in the
following genesis event. This hopefully can give us an insight into the fundamental
mechanisms responsible for the TC formation as well as lead to improve forecasting
ability of those storms.
6.3 Methodology
The fifth-generation Pennsylvania State University-National Center for
Atmospheric Research Mesoscale model (MM5) is employed in this case simulation. The
domain centered at (20 "N, I 45 DE) is on Mercator map projection and the domain size is
271x201 with a uniform grid spacing of30 km. Thus, it entirely covers the genesis region
110

of the WNP basin. There are 23 uneven Sigma levels with higher resolution in the PBL.
The top of the model is set to 10 hPa The Betts-miller cumulus parameterization scheme
is used in this study.
The initial and boundary conditions are obtained from 6-hourly National Center for
Environmental PredictionlNationai Center for Atmospheric Research (NECPINCAR)
reanalysis dataset. The analysis fields, including geopotential height, winds, temperature,
and moisture at different pressure levels and with horizontal resolution of 2.5 °x2.S 0, are
interpolated to the model grid points. The model integration begins at OOOOUTC 22
August when TC Prapiroon was still in a stage of loosely organized convective cells. The
simulation is terminated at l200UTC 27 August, shortly after the time Prapiroon
develops into a strong tropical storm.
Because our objective is to elucidate the role of the pre-existing TC in the
cycIogenesis in its wake, a pair of simulations is designed to identify the TCED-induced
genesis process (Table 6.1). The approach is to compare the two simulations with
different initial conditions: one with the previous TC (CTI.]TC) and the other without
(EXP _NPTC). The CTI.]TC run is designed to reproduce the "realistic" TC genesis
process, and the second sensitivity experiment (EXP _NPTC) is conducted by removing
the previous TC The differences between the two simulations will show the extent of TC
influence on the following storm.
The best track estimated the MSLP of pre-existing TY Bilis is about 920 hPa and the
maximum wind speed is about 110 knots at 0000 UTC 22 August. However, its MSLP is
III

only 1002 hPa in the NCEP/NCAR reanalysis. Although this weak TC can be spun up
during the integration, this large error will have a significant effect on the intensity and
motion of the following TC Prapiroon. Moreover, to maintain a strong upper outflow jet
requires a TC with a significant intensity. It is now widely recognized that specifying a
bogus TC can improve the structure of the initial vortex (Kurihara et al. 1993). Therefore,
the crudely resolved tropical cyclone in the large-scale analysis is replaced by a bogusing
vortex with maximum tangential wind of 55 m S·I. The results show that it leads to a
substantial improvement of the simulated storm in terms of the track and structure.
At initial time, a weak tropical depression was identifiable and about 2500 km away
from the previous TY Bilis (Fig. 6.5a). The vorticity field indicated that this tropical
disturbance was situated over a broad area of positive vorticity (not shown). It is possible
that the TCED mechanism can trigger such an initial disturbance (Davidson and Hendon
1989; Briegal and Frank 1997; Ritchie and Holland 1997; Li and Fu, 2006). In the WNP,
it satisfies both barotropic and baroclinic instabilities in the monsoon trough region. Once
a TC develops in the vicinity of the monsoon trough, its southeastward energy dispersion
helps release the local instabilities in this area. Meanwhile, the wave train associated with
energy dispersion is a slow developing process. David and Hendon (1989) have shown
that many of the vortex strengthening events related to downstream development
processes may take up to 10 days to develop fully. Our idealized numerical results show
that it takes about a week for Rossby wave train to develop fully in the wake of a
pre-existing TC through energy dispersion in a resting environment (Chapter 3). In this
112

study, it indicates a time period of 5-10 days between these two individual TC
developments, consistent with the composite study of Frank (1982).
To evaluate the dependence of the genesis process on the previous TC, we conduct
second experiment (EXP _NPTC) by removing the previous TC. For this purpose, we
applied the scheme proposed by Kurihara et al. (1993) that used appropriated nwnerical
filters to extract the vortex from the large-scale analysis. Any original scalar field h, such
as the surface pressure, zonal and meridional components of wind, temperature, or
mixing ratio of water vapor, can be separated into the basic field hs and the disturbance
field hD by using a filtering operator: h=hs+hD' where hs represents the large-scale
general features in the analysis and hD represents the disturbance field. Next, the analyzed
vortex hav is isolated and removed from the disturbance field with the use of a cylindrical
filter. The environmental field, hE, is then defined by recombining the remaining
non-hurricane disturbance field with the basic field: hE=hs+(hTrhav). Because storm
and environment cannot be uniquely separated, this separation contains some ambiguity.
Nevertheless, the basic fields and the disturbance fields are separated successfully (Fig.
6.5). The next step consists of replacing the variables h over the domain (see the box in
the Fig. 6.5b, where is covered by the previous TCs) by the filtered large-scale data hE. In
addition, a smoothing technique is used to minimize the gap between the box and outer
regions.
113
6.4 Numerical Results
Figure 6.6a shows the comparison of the track and intensity of the ClL]TC from
the observation. Observed Typhoon track and intensity are the best-track data form the
Joint Typhoon Warning Center (JTWC). The simulated track is determined based on the
centriod of a solid body (Reasor and Montgomery 2001; Jones 2004) defined as
1 ( Xc' Yc ) = II p( x. y )dxdy (II xp( x. y )dxdy • II yp( x. y )dxdy ),
where P is the surface pressure, and the double integrals are calculated over a circle
area with a radius of 750 km centered on the location of minimum surface pressure. In
the ClL]TC run, the tropical depression occurs slightly to the north of the observed
location. Despite of this discrepancy, the track of the simulated storm agrees reasonably
well with observation since it captures the major feature of motion such as westward
initially and north turning. Because we focus on the genesis, the issue on track change is
beyond our scope.
The time evolution of simulated intensity is presented in Fig. 6.6b. Compared with
the observation, the storm in ClL_PTC intensifies somewhat more rapidly. That is, its
MSLP is about 5hPa lower than the observed during this integration. Despite of this
discrepancy, the trend of intensity change of the simulated storm agrees reasonably well
with the observation. As expected, that evolution features such as intensity and motion in
EXP _NPTC are fairly distinct from the ClL]TC run. For instance, since 23 August, the
storm intensifies more slowly in EXP _ NPTC than that in CTL _ PTC. As a result, at 0000
114
UTC 27 August, the MSLP is only about 1004 hPa in EXP_NPTC, indicating a 15hPa
weaker than that in CTL ]TC. The comparison between CTL ]TC and EXP _NPTC may
illustrate the contributions by the pre-existing TC to this genesis event
Figure 6.7 displays the evolution of sea level pressure pattern of CTL]TC run.
Initially, a weak tropical depression dominated in the wake of pre-existing TY Bilis. At
0000 UTC 23 August, three separated depressions with MSLP of 1009hPa emerge in this
region. The two stronger vortices survive and gradually intensify during the following
12m. This SLP pattern is very close to the observation from NCEP/NCAR reana1ysis data
even with coarse resolution (not shown). Namely, in the genesis region, three weak
depressions with isolated SLP center are obvious. It suggests that prolific mesoscale
vortices prevail in this region at pre-tropical cyclone stage. However, in the EXP _ NPTC
run (Fig. 6.8), only a weakly predominated disturbance evolves during the early stage,
and less vigorous meso-scale convective activities. Numerous literatures have pointed out
the importance of interactions among mesoscale vortices during the cyc10genesis process
(Ritchie and Holland 1997; Harr et al. 1996; Simpson et al. 1997; Mllller and
Montgomery 1999, 2000). It has been shown that small-scale patches of vorticity
introduced into the flow field of a larger-scale vortex were quickly axisymmetrized, in
the process feeding their energy into the vortex scale flow. It is important to understand
what modulate these mesoscale convective systems in this genesis event.
As shown in Fig. 6.7, since August 23, two major convective systems propagate
slowly poleward, rotate cyclonically about each other, and converge. They merged
115

eventually in the early-26 August to form a tropical storm. To clearly demonstrate such
vortex merger process, we display the evolution of vorticity fields during a 24-h period
from 1200 UTC August 25 to 1200 UTC August 26 (Fig. 6.9). Two distinct MCSs
develop accompanying with cyclonic rotation around each other. As the Vortex A
becomes dominant and subsequently evolves into the core of TC, the vortex B is sheared
into the developing its outer circulation to form a major rainband. This process has been
extensively investigated (Lander and Holland 1993; and reference therein). It occurs by a
reverse cascade in which a larger/more intense vortex exerts a shearing deformation on
nearby perturbations, which merge with it to produce a lager system.
To further shed light on this vortex merger process, the time-radius cross section of
symmetric component of 850hPa relative vorticity within a radius of 450 km is calculated
(Fig. 6.9). Since 1200 UTC 23 August, a positive vorticity perturbation propagates
inward gradually, and eventually merges with the inner core region around 1200 UTC 25
August. Thereafter, the pre-cyclone disturbance intensifies rapidly. Inccontrast, no such
vorticity merge occurs in EXP _ NPTC (not shown). It can be conceivable that the inward
propagation of vorticity source can lead to an increase of the low-level convergence near
the disturbance's center, thus a rapid intensification in CTL_PTC.
Compared with EXP _ NPTC, CTL ]TC experiment reveals prolific meso-scale
convective activities contributed to this cyclogenesis. In the presence of previous TC, its
energy dispersion will lead to an altemating cyclonic-anticyclonic-cyclonic Rossby wav
train pattern. It is likely that prolific convective activities may concentrate within the
116
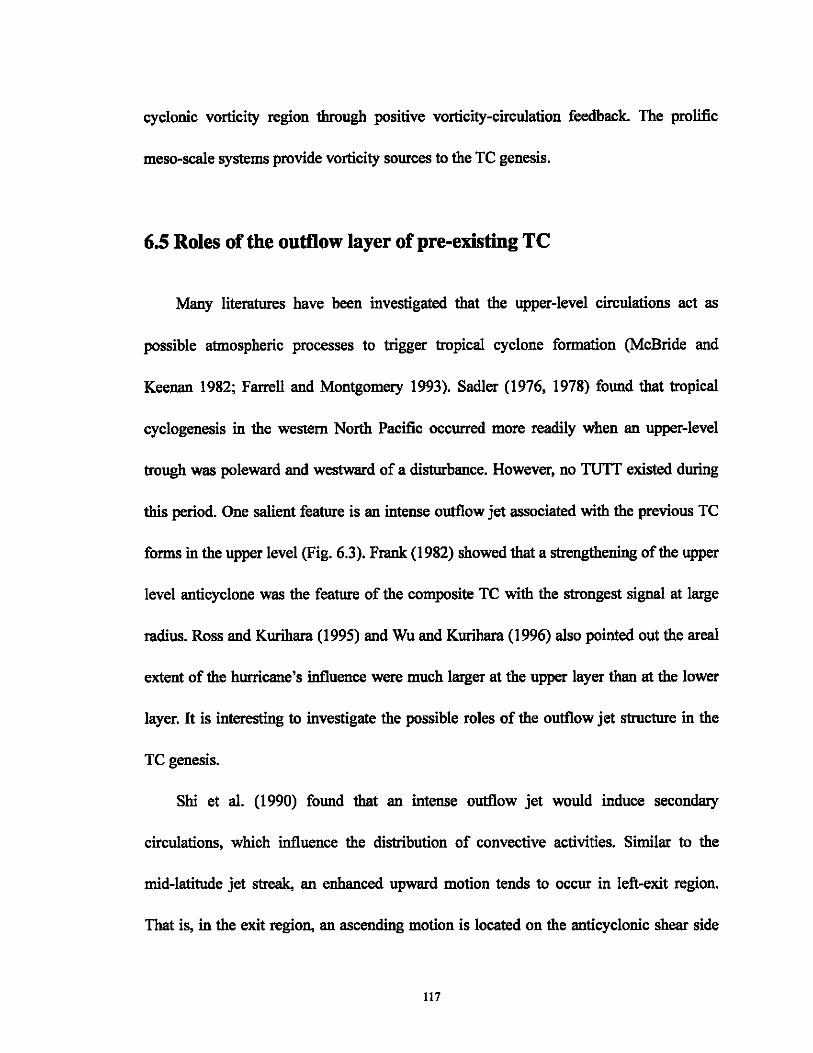
cyclonic vorticity region through positive vorticity-circulation feedback. The prolific
meso-scale systems provide vorticity sources to the TC genesis.
6.5 Roles of the outflow layer of pre-existing TC
Many literatures have been investigated that the upper-level circulations act as
possible atmospheric processes to trigger tropical cyclone formation (McBride and
Keenan 1982; Farrell and Montgomery 1993). Sadler (1976, 1978) found that tropical
cyclogenesis in the western North Pacific occurred more readily when an upper-level
trough was poleward and westward of a disturbance. However, no TUTI existed during
this period. One salient feature is an intense outflow jet associated with the previous TC
forms in the upper level (Fig. 6.3). Frank (1982) showed that a strengthening of the upper
level anticyclone was the feature of the composite TC with the strongest signal at large
radius. Ross and Kurihara (1995) and Wu and Kurihara (1996) also pointed out the areal
extent of the hurricane's influence were much larger at the upper layer than at the lower
layer. It is interesting to investigate the possible roles of the outflow jet structure in the
TC genesis.
Shi et al. (1990) found that an intense outflow jet would induce secondary
circulations, which influence the distribution of convective activities. Similar to the
mid-latitude jet streak, an enhanced upward motion tends to occur in left-exit region.
That is, in the exit region, an ascending motion is located on the anticyclonic shear side
117
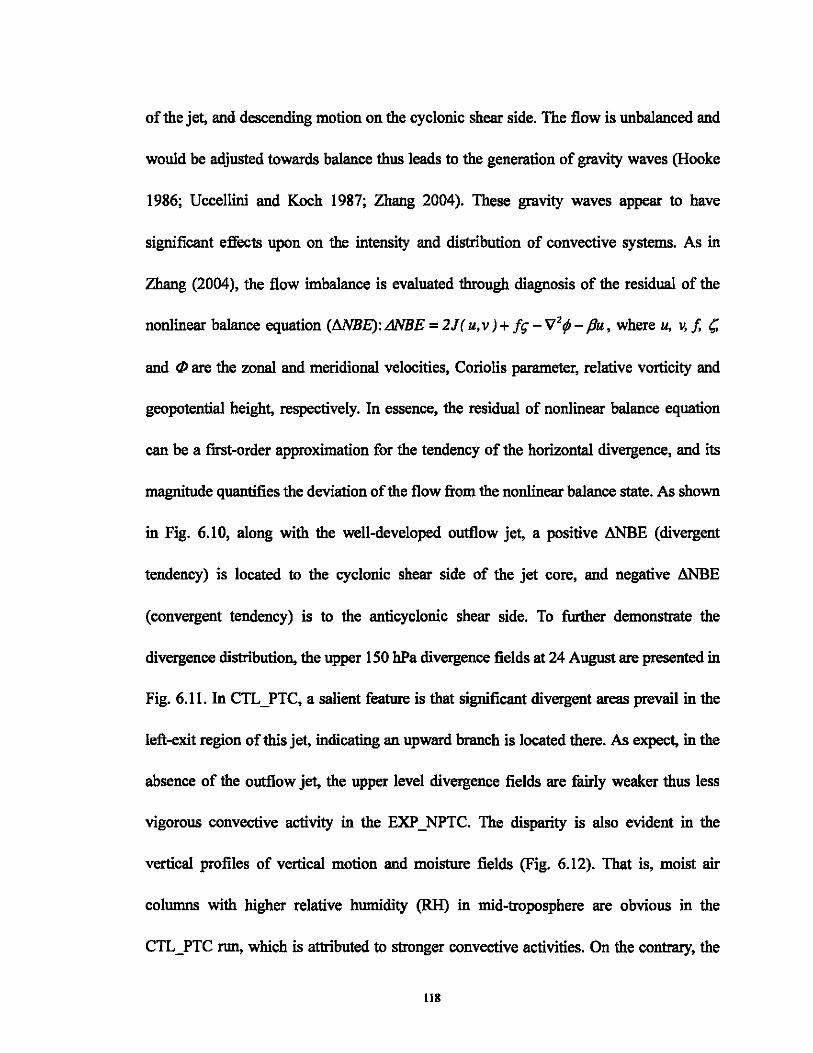
of the jet, and descending motion on the cyclonic shear side. The flow is unbalanced and
would be adjusted towards balance thus leads to the generation of gravity waves (Hooke
1986; Uccellini and Koch 1987; Zhang 2004). These gravity waves appear to have
significant effects upon on the intensity and distribution of convective systems. As in
Zhang (2004), the flow imbalance is evaluated through diagnosis of the residual of the
nonlinear balance equation (MVlJE): LWBE = 2J( u, v ) + fq - V2¢J - flu, where u, v, f, ,
and f/) are the zonal and meridional velocities, Coriolis parameter, relative vorticity and
geopotential height, respectively. In essence, the residual of nonlinear balance equation
can be a first-order approximation for the tendency of the horizontal divergence, and its
magnitude quantifies the deviation of the flow from the nonlinear balance state. As shown
in Fig. 6.10, along with the well-developed outflow jet, a positive &ffiE (divergent
tendency) is located to the cyclonic shear side of the jet core, and negative &ffiE
( convergent tendency) is to the anticyclonic shear side. To further demonstrate the
divergence distribution, the upper 150 hPa divergence fields at 24 August are presented in
Fig. 6.11. In CTL 'yTC, a salient feature is that significant divergent areas prevail in the
left-exit region of this jet, indicating an upward branch is located there. As expect, in the
absence of the outflow jet, the upper level divergence fields are fairly weaker thus less
vigorous convective activity in the EXP _ NPTC. The disparity is also evident in the
vertical profiles of vertical motion and moisture fields (Fig. 6.12). That is, moist air
columns with higher relative humidity (RH) in mid-troposphere are obvious in the
CTL_PTC run, which is attributed to stronger convective activities. On the contrary, the
118
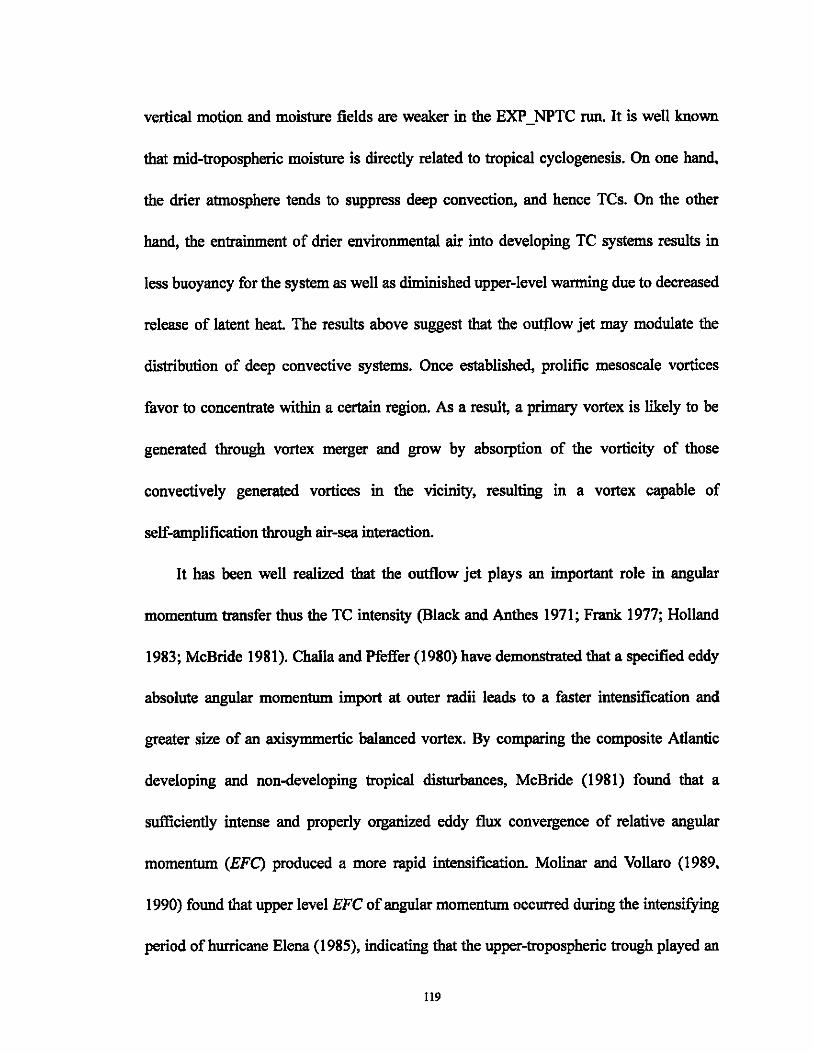
vertical motion and moisture fields are weaker in the EXP NPTC run. It is well known
that mid-tropospheric moisture is directly related to tropical cyclogenesis. On one hand,
the drier atmosphere tends to suppress deep convection, and hence TCs. On the other
hand, the entrainment of drier environmental air into developing TC systems results in
less buoyancy for the system as well as diminished upper-level warming due to decreased
release of latent heat The results above suggest that the outflow jet may modulate the
distribution of deep convective systems. Once established, prolific mesoscale vortices
favor to concentrate within a certain region. As a result, a primary vortex is likely to be
generated through vortex merger and grow by absorption of the vorticity of those
convectively generated vortices in the vicinity, resulting in a vortex capable of
self-amplification through air-sea interaction.
It has been well realized that the outflow jet plays an important role in angular
momentum transfer thus the TC intensity (Black and Anthes 1971; Frank 1977; Holland
1983; McBride 1981). Challa and Pfeffer (1980) have demonstrated that a specified eddy
absolute angular momentum import at outer radii leads to a faster intensification and
greater size of an axisymmertic balanced vortex. By comparing the composite Atlantic
developing and non-developing tropical disturbances, McBride (1981) found that a
sufficiently intense and properly organized eddy flux convergence of relative angular
momentum (EFC) produced a more rapid intensification. Molinar and Vollaro (1989,
1990) found that upper level EFC of angular momentum occurred during the intensifying
period of hurricane Elena (1985), indicating that the upper-tropospheric trough played an
119
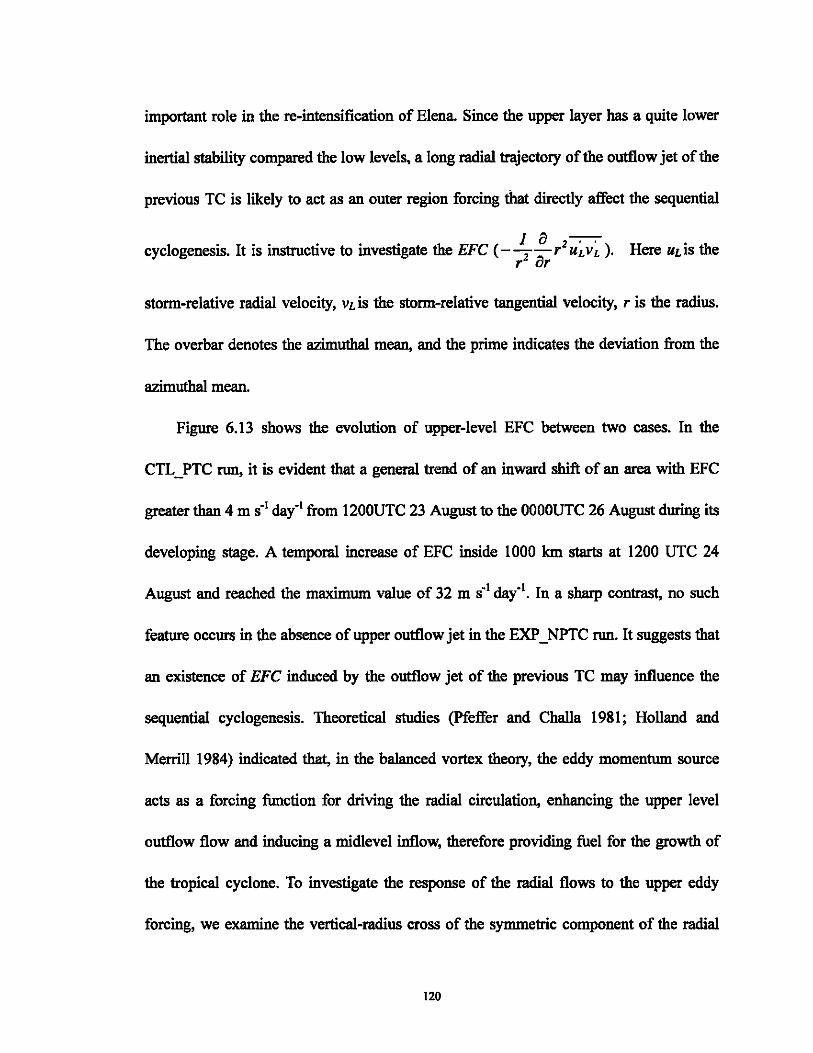
important role in the re-intensification of Elena Since the upper layer has a quite lower
inertial stability compared the low levels, a long radial trajectory of the outflow jet of the
previous TC is likely to act as an outer region forcing that directly affect the sequential
cyclogenesis. It is instructive to investigate the EFC (-4!.r2 u~v~). Here uds the r or
stonn-relative radial velocity, vLis the stonn-relative tangential velocity, r is the radius.
The overbar denotes the azimuthal mean, and the prime indicates the deviation from the
azimuthal mean.
Figure 6.13 shows the evolution of upper-level EFC between two cases. In the
CTL]TC run, it is evident that a general trend of an inward shift of an area with EFC
greater than 4 m S·I day·1 from 1200UTC 23 August to the OOOOUTC 26 August during its
developing stage. A temporal increase of EFC inside 1000 km starts at 1200 UTC 24
August and reached the maximum value of 32 m S·I day-I. In a sharp contrast, no such
feature occurs in the absence of upper outflow jet in the EXP _ NPTC run. It suggests that
an existence of EFC induced by the outflow jet of the previous TC may influence the
sequential cyclogenesis. Theoretical studies (Pfeffer and Cha1la 1981; Holland and
Merrill 1984) indicated that, in the balanced vortex theory, the eddy momentum source
acts as a forcing function for driving the radial circulation, enhancing the upper level
outflow flow and inducing a midlevel inflow, therefore providing fuel for the growth of
the tropical cyclone. To investigate the response of the radial flows to the upper eddy
forcing, we examine the vertical-radius cross of the symmetric component of the radial
120

wind (Fig. 6.14). At 0000 UTC 25 August, in the CTL]TC run, a strong but shallow
outflow (4 m S·I) is established in the 200 hPa with a deep return inflow with a magnitude
of about 1 IDS-I in the mid-troposphere between 400 and 500hPa As the eddy source
approached the storm core, this associated midlevel inflow could produce spinup. Once
established, this enhanced secondary circulation may invigorate the core region
convections, and provide an inward contraction of the maximum wind region, and thus
intensification. In the EXP_NPTC run, no well-organized eddy flux of momentum is
identified. Therefore, a considerable weaker upper level outflow flows and no obvious
mid-tropospheric inflows occur. To summarize, a proper eddy forcing associated with the
upper layer circulation of previous TC will act as a catalyst for TC formation (ChalIa and
Pfeffer 1998).
Since the E-P flux and its divergence are good indicators of the wave propagation
and wave-mean flow interaction, it has been widely used in large-scale dynamics and has
been extended to hurricane studies (Schubert 1985; Molinari et aI. 1995, 1998; Wu and
Cheng 1999; Chen and Yau 2001). The E-P flux divergence can be written as
'(7 F 1 a 2( )" a , a",' v' =---r GUL VL +-p--r ar ae aA.
where F EI [_ r( audvl, p' G!i''] is the E-P flux vector, CT = - 8p is the pseudodensity; e, , GAo 8e
'1/ are the potential temperature and Montgomery streamfunction, respectively. The radial
component of B-P flux represents the angular momentum flux, while the vertical
component is the heat flux. An outward-pointing arrow represents inward eddy flux of
121

cyclonic angular momentum, and a downward-pointing arrow shows outward eddy heat
flux. When V . F > 0, eddy activity is producing increasing cyclonic mean angular
momentum in the tropical cyclone. Figure 6.15 gives radius-9 cross sections ofE-P flux
vectors and their divergence. The cross-sections show that large eddy activity remained in
the narrow outflow layer throughout the interaction. The E-P flux vectors were nearly
horizontal within 1200 km of the center, indicating that eddy angular momentum fluxes
were playing a much larger role at the level of maximum eddy activity than eddy heat
fluxes. At 0600 UTC 24 August, the impact of eddy activity as measured by V· F was
greatest on the 355K surface at the radius of the 900 km, indicating that the mean
cyclonic angular momentum is produced in the outflow layer. By 1200 UTC 25 August,
the center of positive E-P flux divergence has a significant 300km inward shift,
suggesting an accumulation of azimuthal mean cyclonic angular momentum. Thereafter,
the magnitude of maximum E-P flux divergence decreases when it moves to the stonn
center. This process is very close to the hurricane-TUTI interaction (Molinari et al 1995,
1998; Wu and Cheng 1999 and many others), although the magnitude is slightly weaker
in this case. Along with the E-P flux changes, the tangential winds of vortex increase
substantially. Therefore, the E-P flux further reveals that the upper layer asymmetries
have contribution to the intensification of the stonn through the interaction between eddy
and mean vortex.
122
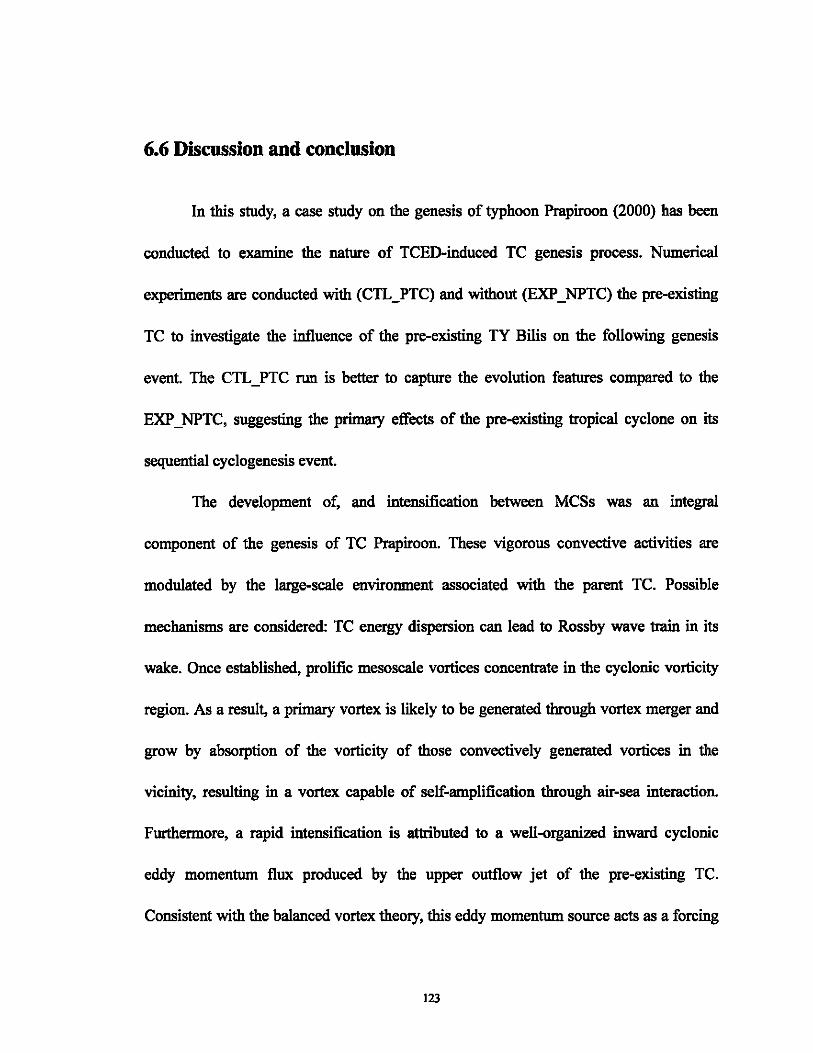
6.6 Discussion and conclusion
In this study, a case study on the genesis of typhoon Prapiroon (2000) has been
conducted to examine the nature of TCED-induced TC genesis process. Numerical
experiments are conducted with (CTL]TC) and without (EXP _NPTC) the pre-existing
TC to investigate the influence of the pre-existing TY Bills on the following genesis
event The CTL_PTC run is better to capture the evolution features compared to the
EXP _ NPTC, suggesting the primary effects of the pre-existing tropical cyclone on its
sequential cyclogenesis event.
The development of, and intensification between MCSs was an integral
component of the genesis of TC Prapiroon. These vigorous convective activities are
modulated by the large-scale environment associated with the parent TC. Possible
mechanisms are considered: TC energy dispersion can lead to Rossby wave train in its
wake. Once established, prolific mesoscale vortices concentrate in the cyclonic vorticity
region. As a result, a primary vortex is likely to be generated through vortex merger and
grow by absorption of the vorticity of those convectively generated vortices in the
vicinity, resulting in a vortex capable of self-amplification through air-sea interaction.
Furthermore, a rapid intensification is attributed to a well-organized inward cyclonic
eddy momentum flux produced by the upper outflow jet of the pre-existing TC.
Consistent with the balanced vortex theory, this eddy momentum source acts as a forcing
123

function for driving the radial circulation, enhancing the upper level outflow flow and
inducing a midlevel inflow, therefore providing fuel for the growth of the new tropical
cyclone.
In reality, over the WNP monsoon region, once a TC develops in the vicinity of the
monsoon troughIITCZ, it moves poleward and westward due to the planetary vorticity
gradient and mean flows steering, and emits energy southeastward to form a
synoptic-scale wave train with alternating regions of anticyclonic and cyclonic vorticity
perturbations. The perturbation energy, being accumulated in the confluence zone, helps
release the barotropicibaroclinic instability in the ITCZ. Cumulus convection is organized
in the region of cyclonic circulation, amplifYing the disturbances through the
convection-frictional convergence feedback. In this study, another possible mechanism is
proposed to emphasize the upper tropospheric influence. The upper outflow layer
circulation of the previous TC to the west of the disturbance provides an effective
outflow channel and induces an upper level EFC of angular momentum, which
contributes to a new TC development. It agrees with the idealized numerical study in
Chapter 3, in which we point out the upper tropospheric influence in the formation of 3D
Rossby wave train.
To summarize, the interaction of the upper-tropospheric system such as an outflow
jet can result in a robust divergent channel and produce a strong upper level eddy forcing,
which is conducive to TC intensification; however, the approach of the outflow jet may
result in an enhanced vertical wind shear, which has been well confirmed to be a
124
generally negative influence in the TC formation. We believe that the location of the
tropical disturbance relative to the previous one may be an important factor in
determining the sequential TC formation. As demonstrated by Frank (1982), when WNP
typhoons first reach typhoon intensity, the most common location for a pre-existing storm
is about 15°_20° to the west of the new one. It suggests that the previous TC may
modulate the sequential TC genesis event through changing the large-scale environmental
conditions. 1n this study, we only conduct an individual case simulation, and thus the
results remain speculative. Meanwhile, the results may vary from case to case, since TC
energy dispersion is likely to depend on the particular large-scale environmental flows as
well as the TC structure. Therefore, it is more helpful to composite study on the common
dynamical features of TCED-induced genesis.
125

Table 6.1 Description of numerical experiments designs
CTL PTC TC genesis in the presence of the previous TC
EXP _NPTC Same as CTL]TC except excluding the previous TC
126

Figure 6.1 Time sequences of synoptic-scale surface wind patterns associated with the
Rossby wave energy dispersion of Typhoon Bills. "A" represents the center location
of Bilis that formed on 18 August 2000. "B" represents the center location of a new
TC named Prapiroon that formed on 26 August 2000 in the wake of the Rossby
wave train ofBilis.
127
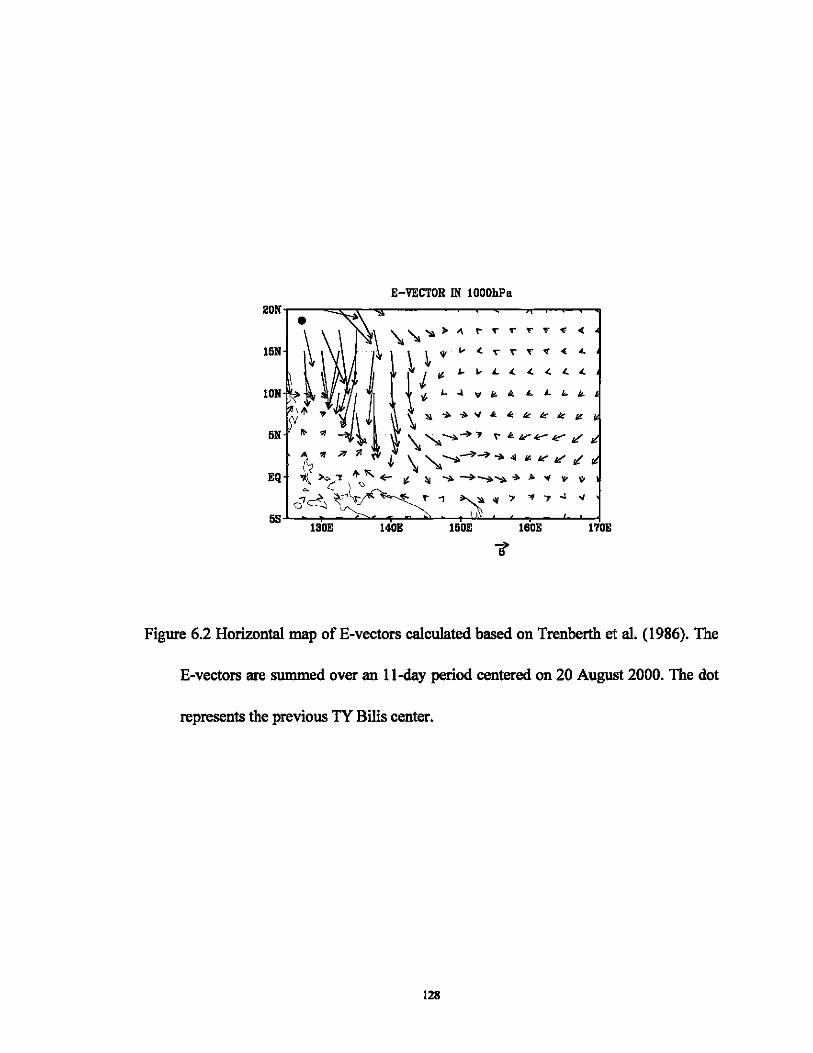
E-VECTOR IN IOOOhPa
Figure 6.2 Horizontal map ofE-vectors calculated based on Trenberth et al. (1986). The
E-vectors are summed over an 11-day period centered on 20 August 2000. The dot
represents the previous TY Bills center.
128

150hPa 1200UTC22AUG 35 N ,....,.~..."...,"""""
30N
25N
20N
15N
ION 5N ,,,,,,,,,,v,,, EQ
5S 1
100
200
300
,-. 400 " . 0-.c; '-" 500
600
700
800
---+ 20
1200UTC 22AUG
Ix I OOkm\
14
12
10
8
6
4
1
Figure 6.3 The observed 150 hPa wind vector (m s") and relative vorticity (lxlO·5 s·l)
fields at 1200 UTe 22 August 2000 (top panel), and the vertical·radius
cross-section of relative vorticity fields (bottom panel) along a northwest-southeast
oriented axis (the dashed line).
129

Figure 6.4 The evolution characteristics of TMI data (unit: rnmIhour) superposed by
3-8-day filtered 850 hPa wind fields on (a) 23 August (b) 24 August (c) 25 August
and (d) 26 August, respectively.
130

30NTn~~~~~~~~~~~~
25N~~~ 20N
15N ~~~
10N ~-"""'
5N 1'&.:l.....,',:J
EQ 5shl~~b~~~~~ 30N~--~--~--~--~------,
25N
20N
-> 10
Figure 6.5 The separation of the large-scale analysis surface pressure field (bPa) and
wind fields (ms-/) (a) into the environmental field (b) and the disturbance field (c) at
initial time 0000 UTC 22 August. The box in (b) shows the domain where the
variables are replaced by filtered data in EXP _NPTC.
13l

10N l20E l30E
1015
1010 ---1005 '-.-.. ..
1000
995
990
985
(a)
l40E
(b)
-.. -. -'--. --, ........ -.. .. , ,~ ,
--,
9~UG 23AUG 24AUG 25AUG 25AUG 27AUG 2000
Figure 6.6 (a) tracks of the Cn]TC simulation and the observation from JTWC (with
typhoon symbol). (b) Time evolutions of MSLP (bPa) of observation (thick dashed
line), Cn_PTC run (solid line), and EXP _NPTC (thin dot-dashed line).
132

OOOOUTC 23AUG 1200UTC 23AUG 1200UTC 24AUG 20N
101 16N
ION
UN
EQ
1301 14IIE 1301 1301 14IIE 1301 120E 130E 14IIE IUDE
Figure 6.7 The evolution of surface pressure fields (hPa) in CTL]TC run.
133

OOOOUTC 23AUG 20N 1014
15N 10lB
ION
'" 5N W EQ
150E OOOOUTC 26AUG
5ON~~r=~~~~-r,
25N
20N
15N
ION
1200UTC 23AUG
1012
0
lS0E 140E OOOOUTC 26AUG
120E 130E
1200UTC 24AUG
fi3 ~IOIO 0
~ ~ ~.ofo 00·
1&DE 12DE lSDE l40E 1200UTC 28AUG
120E 150B 140E
Figure 6.8 Same as Fig. 6.7 except in EXP _NPTC run.
134
0
l&OE
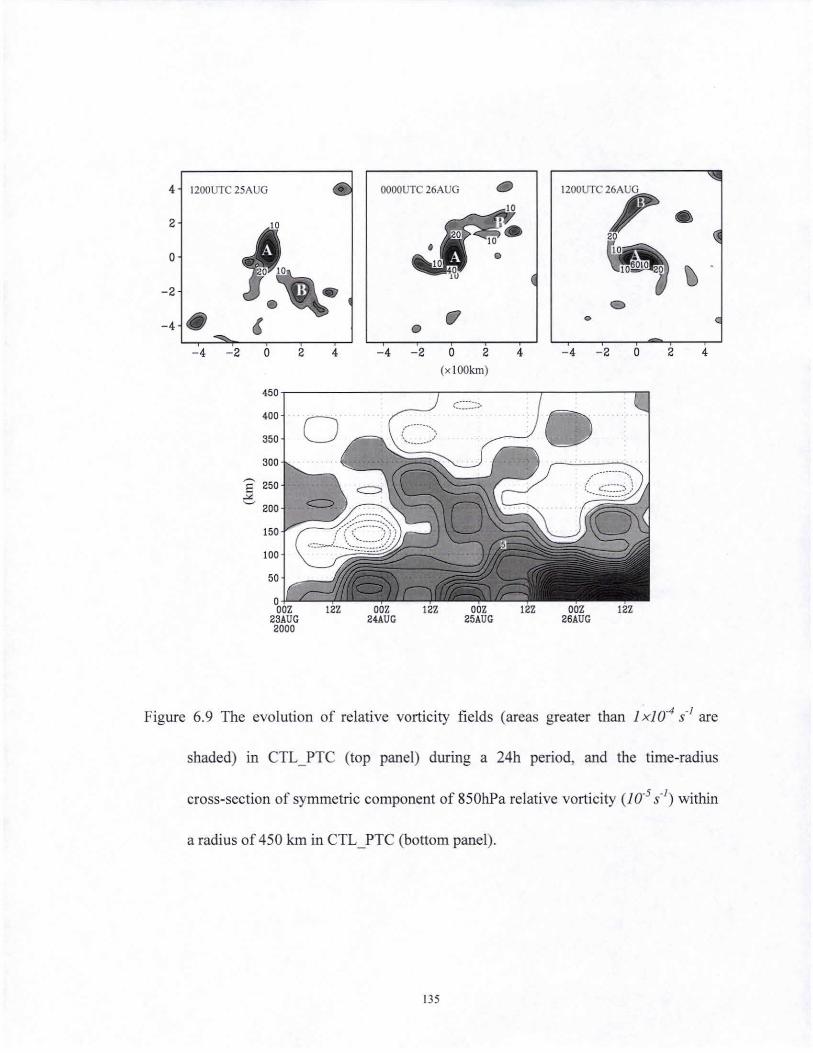
4 1200UTC 25AUG OOOOUTC 26AUG 1200UTC
2 • 0
-2
• 0 -4 •
- 4 - 2 0 2 4 -4 -2 0 2 4 - 4 - 2 0 2 4 (x IOOkrn)
Figure 6.9 The evolution of relative vorticity fields (areas greater than 1 x iO·4 s" are
shaded) in CTL]TC (top panel) during a 24h period, and the time-radius
cross-section of symmetric component of 850hPa relative vorticity (10-5 s") within
a radius of 450 km in CTL ]TC (bottom panel).
I35

100
200
300
400
500
600
700
800
900 I :
1000
Figure 6.10 (a) 200 hPa horizontal distribution of the residual of nonlinear balance
equation (~BE, unit: 1 x JO-9 S·2) . (b) The vertical cross section of ~NBE along
the thin line in (a). Shade area represents the jet core region.
136

30N \ (b~; • , •
' t) , '-25N .' ..
, .. 20N ..
'.;~ " " "
5N • EQ~C£~~~~--~~--~~
1208 130E 1408 150E
Figure 6.11 The 150hPa divergence field Co? 2xlO·5 S·l are shaded) and total velocity of jet
core region (contour interval: 5 ms· l) in CTL]TC (a) and EXP _ PTC run (b) at
1200UTC 24 August.
137

100 100
200 200
300 300
400 400
500 500
600 600
700 700
800 800
900 900
1000 1000
Figure 6.12 The vertical-radius cross section of vertical motion (contour, unit: 10-2 m S-I)
and relative humidity (shaded; %) in CTL]TC (left panel) and EXP _NPTC (right
panel) run on 24 August along the dashed line (A--B) in Fig. 6.1 J. The shaded
areas indicate value greater than 70%, and the thick line delineate the top jet core.
138
-
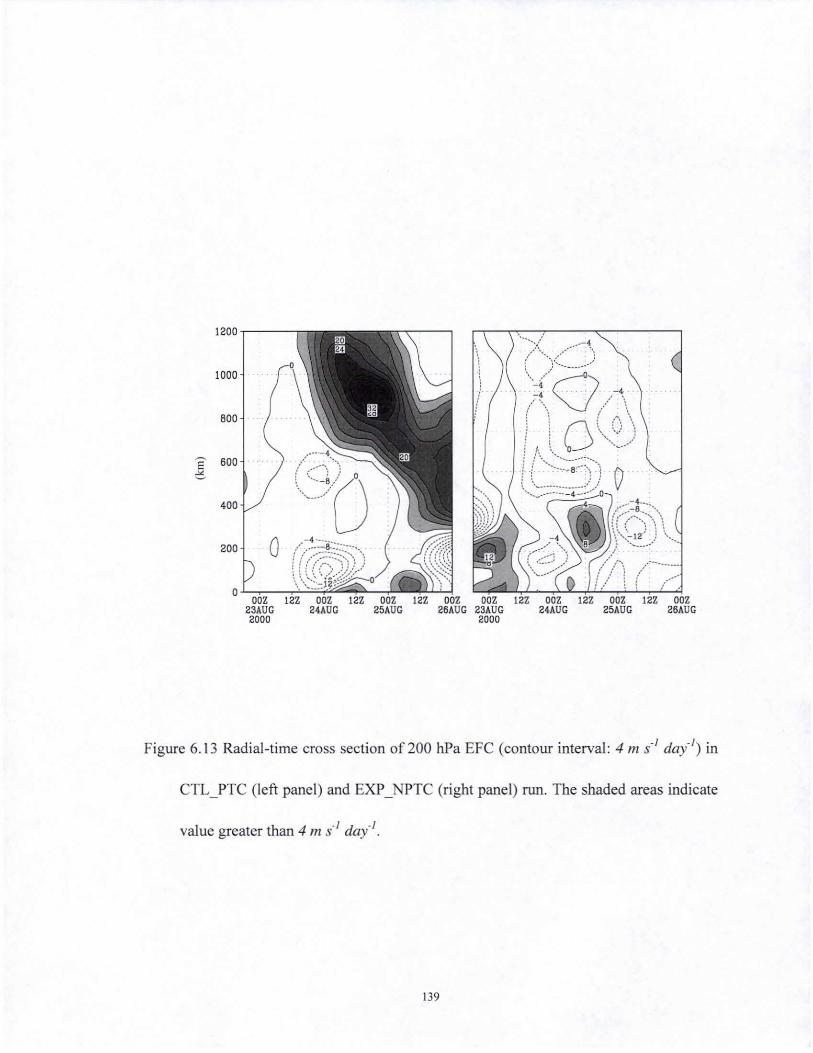
1200-.---,
1000
BOO
E 600 ~
400
200
Figure 6.13 Radial-time cross section of 200 hPa EFC (contour interval: 4 m {I day"l) in
CTL]TC (left panel) and EX? _NPTC (right panel) run. The shaded areas indicate
value greater than 4 m s·1 day"'-
139

100
200
300
400 ~ m
""' 500 .<: '-'
600
700
600
900
. .... -1 ···· " . ". (' ,/
.......... .' ./
--" - 1'-
I
o ~ o~
o 200 400 600 800 1000 1200
non')
Figure 6,[4 Vertical-radius cross-section of radial wind (m S· /) in CTL]TC (left panel)
and EXP _NPTC (right panel) at 1200 UTC 24 August.
140
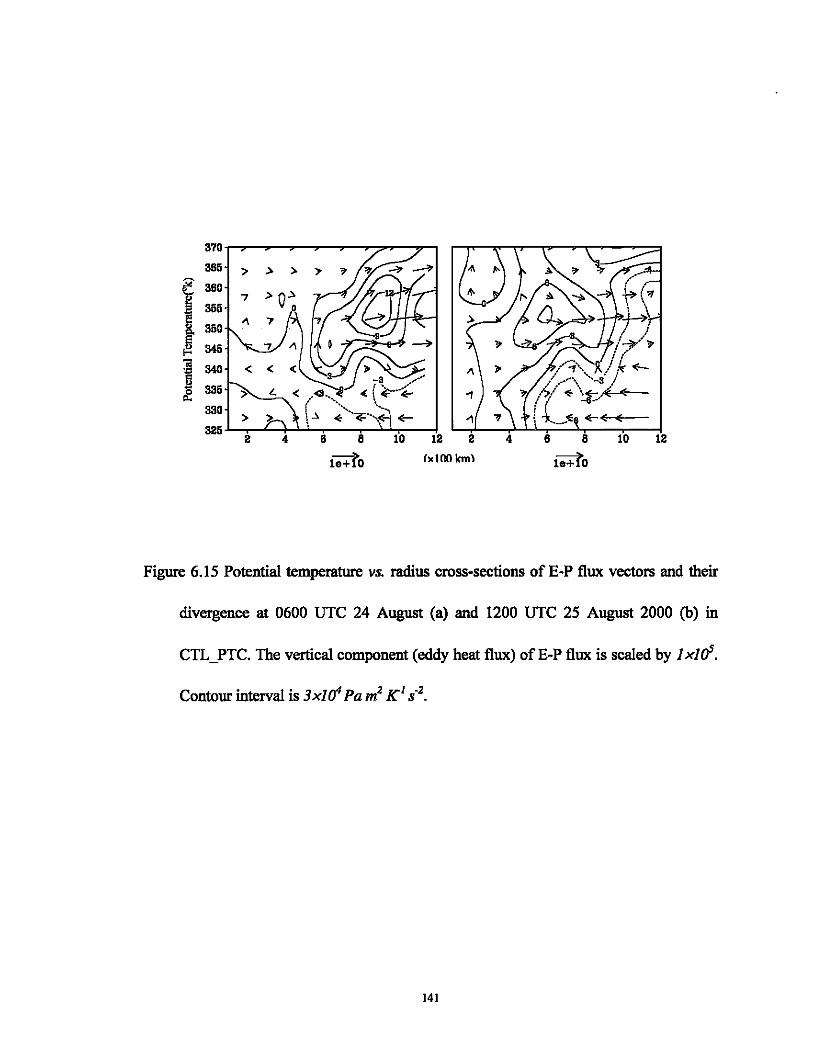
370
365 > > > >
i 360
355
350
~ 345
] 340 1\
!l 335 If )' "1
330 > >- " ~EE
325 2 4 12 2 4 6 8 10 12
leAO (.100 Ion) le+tO
Figure 6.15 Potential temperature vs. radius cross-sections of E-P flux vectors and their
divergence at 0600 UTC 24 August (a) and 1200 UTC 25 August 2000 (b) in
CTL]TC. The vertical component (eddy heat flux) ofE-P flux is scaled by 1 xlrf.
141

CHAPTER 7
SUMMARY AND FUTURE WORKS
7.1 Major results
It has long been recognized that a Rossby wave train can be induced by tropical
cyclone energy dispersion in a barotropic dynamics framework. In this study, we use a
baroclinic model further to examine the 3D TCED-induced Rossby wave train processes
and its induced tropical cyclogenesis. Some major findings are summarized as the
follows:
(1) While a baroclinic TC moves northwestward due to the beta effect, Rossby
waves emit energy southeastward. This leads to the formation of a synoptic-scale wave
train in its wake in a few days in an environment at rest. This simulated 3D wave train
pattern exhibits a noticeable baroclinic structure with alternating
cyc1onic-anticyclonic-cyclonic (anticyc1onic-cyclonic-anticyclonic) circulation in the
lower (upper) level. A noteworthy feature associated with 3D TCED is a downward
development. That is, a concentrated vorticity band is generated first in the upper levels
in the southeast quadrant, and then followed by a downward development. One possible
reason is due to much smaller inertial instability that may lead to faster and stronger
development of the upper-level wave branch. Once an intense asymmetric outflow jet is
142

generated on the equatorward side, it may further impact the development of the
lower-level Rossby wave train. The upper-level influences are two-folds: on one hand,
the development of the outflow jet results in a more intense TC with relatively larger size,
thus affecting the strength of the Rossby wave train since the energy dispersion is
sensitive to the TC intensity and size; on the other hand, the E-P flux analysis shows an
indeed downward propagation of the Rossby wave energy, connecting the upper
tropospheric jet to the lower level wave train circulation. Therefore, while the baroropic
energy dispersion is essential for wave train formation, the upper troposphere may
modulate the lower level Rossby wave train formation.
(2) A sensitivity experiment reveals that a sudden removal of diabatic heating may
result in an increase of Rmax and a significant reduction of the lower level inflow, both of
which favor the initial wave train development. The folIowing two factors may explain
the earlier development of the Rossby wave train in DRY. One is related to change of the
TC inflow in the outer region. As we know, the inflow may modulate the Rossby wave
group velocity through a "Doppler shift" effect. Secondly, previous non-divergent
barotropic studies showed that the energy dispersion is more sensitive to the size of a
vortex rather than its intensity (e.g., Carr and Elsberry 1995). While the diabatic heating
is sudden turned off, the TC secondary circulation colIapses rapidly, accompanied by a
decrease in maximum tangential wind speed and an increase in the radius of maximum
wind. Therefore, the vortex in DRY is more susceptible to the beta-induced dispersion
and thus an initiaIIy faster establishment of the wave train.
143

(3) The TeED under various environmental flows is explored using a baroclinic
model. Due to the differential inertial stability and beta-effect with elevation, the
simulated wave train exhibits a baroc1inic structure with alternating
cyclonic-anticyc1onic-cyclonic (anticyclonic-cyc1onic-anticyc1onic) circulations in the
lower (upper) levels in an environment at rest. A remarkable asymmetry appears in the
perturbation growth in the presence of different vertical wind shears. That is, an easterly
(westerly) wind shear confines the wave to the lower (upper) levels. It is suggested that
the vertical shear may impact the Rossby wave train development through both the
barotropic-baroclinic mode coupling and the modulation of the group velocity by the
mean flow through a "Doppler shift effect". Under an easterly shear, a barotropic Rossby
mode is generated in such a way that it enhances the lower level wave amplitude;
meanwhile, the lower level westerly wind may accelerate the southeastward energy
dispersion and strengthen the wave train strength. Both the processes favor the lower
level Rossby wave train development. Once the lower level wave train is strengthened, it
may reinforce itself through the Ekman-pumping induced PBL moisture convergence and
the convection-circulation feedback. Hence, the destabilization of Rossby wave train by
regional easterly vertical shears might have an important implication. During the boreal
summer season, large easterly wind shears exist over the western North Pacific (WNP),
thus provides a favorable large-scale environment for Rossby wave train formation
through setting up the preferred asymmetric growth characteristic.
144

(4) The interaction between the large-scale monsoon shear linelITCZ and TC is
investigated in terms of a 3D primitive baroclinic model. Once a TC develops in the
ITCZ region where satisfies barotropic and baroclinic instability, the southeastward
energy dispersion from the TC may accelerate ITCZ breakdown. Cumulus convection
can be organized in the region of cyclonic circulation, and thus a new TC forms. Through
repeating of the above process, a synoptic-scale wave train can be generated and
self-maintained. The results suggest a possible mechanism for the origin of the summer
synoptic scale wave train pattern over the western North Pacific (Yanai 1961; Chang
1970; Kuo et al. 2001; many others). The results also confirm the hypothesis by NFS97
that Rossby wave energy dispersion and/or ITCZ breakdown may cause the observed
tendency for new tropical storms to form to the east of existing ones. Our numerical
results clearly demonstrate such an asymmetric tendency in their cyclogenesis locations.
(5) A real case typhoon Prapiroon (2000) has been conducted to examine the nature
of TCED-induced TC genesis process. Sensitivities experiments are conducted with and
without the pre-existing TC to investigate the influence of pre-existing TC on the
following genesis event. The development of, and intensification between MCSs was an
integral component of the genesis of TC Prapiroon. These vigorous convective activities
are modulated by the large-scale environment associated with the pre-existing TC. The
possible mechanisms are considered: TC energy dispersion can lead to Rossby wave train
it its wake. Once established, prolific mesoscale vortices concentrate in the cyclonic
vorticity region, and amplifY through the convection-frictional convergence feedback.
145

Under favorable large-scale conditions, a primary vortex is likely to be generated through
vortex merger and grow by absorption of the vorticity of those convectively generated
vortices in the vicinity, resulting in a vortex capable of self-amplification through air-sea
interaction. Furthennore, intensification is attributed to a well-organized inward cyclonic
eddy momentum flux produced by the upper outflow jet of the pre-existing TC.
Consistent with the balanced vortex theory, this eddy momentum source acts as a forcing
function for driving the radial circulation, enhancing the upper level outflow flow and
inducing a midlevel inflow, therefore providing fuel for the growth of the tropical cyclone.
The results above suggest that the upper tropospheric influence would play roles in the
sequential genesis event That is, the upper outflow circulation of the pre-existing TC to
the west of the disturbance provides an effective outflow channel and induces an upper
level EFC of angular momentum, which contribute to new TC development.
7.2 Future works
To summarize, the 3D TCED-induced Rossby wave train reveals more complex
features than those provided by traditional barotropic dynamics. Some new evolution
features may help rectify some deficiencies found in the barotropic dynamics, further
study is required to investigate other important points regarding the Rossby waves. For
instance, is there an optimal mode of the downward energy propagation in affecting the
lower-layer Rossby wave dispersion? What are the preferred vertical and horizontal
scales for the horizontally and vertically coupled 3-D wave train?
146

Numerous studies have examined the relationship between simple structured,
environmental flows and subsequent simulated tropical cyclone intensity change (peng et
al. 1999; Frank and Ritchie, 2001; Wong and Chan 2004; many others). The interactions
of the TC with different background flows will affect the TC structure and intensity
change. Future studies are needed to elucidate more details regarding the effects of
different strength, and structure, of vertical shear and how this affects the energy
dispersion thus the intensity and structure of tropical cyclones of different intensities.
The real case study points out that the previous TCED induced upper tropospheric
influence may be conducive to a sequential TC intensification. However, the approach of
the outflow jet would lead to an enhanced vertical wind shear, which has been well
confirmed to be a generally negative influence in the TC formation. It is believe that the
location of the tropical disturbance relative to the previous one may be an important
factor in determining the sequential TC formation (Frank 1982). Since we only conduct
an individual case simulation, thus the results remain speculative. Meanwhile, the results
may vary from case to case, since TC energy dispersion is likely to depend on the
particular large-scale environmental flows as well as the TC structure. Therefore, it is
more helpful to composite study on the common dynamical features of TCED-induced
genesis.
147

REFERENCES
Aiyyer, A. R., and J. Molinari, 2003: Evolution of mixed Rossby-gravity waves in
idealized MJO environments. 1. Atmos. Sci., 60, 2837-2855.
Anthes, R. A., 1972: Development of asymmetries in a three-dimensional numerical
model of the tropical cyclone. Man. Wea. Rev., 100, 461-476.
__ , 1982: Tropical cyclone: their evolution, structure and effects. Meteor. Mongr.
Amer. Meteor. Soc., 41, 208.
Black, P. G., and R. A. Anthes, 1971: On the symmetric structure of the tropical cyclone
outflow layer. 1. Atmos. Sci., 28, 1348-1366.
Briegel, L. M., and W. M. Frank. 1997: Large-scale influences on tropical cyclogenesis in
the western North Pacific. Man. Wea. Rev., 125, 1397-1413.
Carr, L. E., and L. R. Elsberry, 1995: Monsoonal interactions leading to sudden tropical
cyclone track changes. Man. Wea.Rev., 123,265-290.
Challa, M., and R. L. Pfeffer, 1980: Effects of eddy fluxes of angular momentum on
model hurricane development. 1. Atmos. Sci., 37, 1603-1618.
Challa, M. and R. L. Pfeffer, 1998: Can eddy fluxes serve as a catalyst for hurricane and
typhoon formation? 1. Atmos. Sci., 55, 2201-2219.
Chan, J. C. L., and R. T. Williams, 1987: Analytical and numerical studies of the
beta-effect in tropical cyclone motion, Part I: Zero mean flow. 1. Atmos. Sci., 44,
1257-1265.
148

Chang, C. P. and J. M. Chen, P. A Harr, and L. E. Carr, 1996:
Northwestward-propagating wave patterns over the tropical western north Pacific
during summer. Mon. Wea. Rev., 124, 2245-2266.
Chen, S. S. and W. M. Frank, 1993: A numerical study of the genesis of extratropical
convective mesovortices. Part I: Evolution and dynamics. J. Atmos. Sci., SO,
2401-2426.
Chen, Y. S., G Brunet, and M. K. Yau, 2003: Spiral bands in a simulated hurricane. Part
II: wave activity diagnostics. J Atmos Sci., 60, 1239-1256.
Davidson, N.E., and H. H. Hendon, 1989: Downstream development in the southern
hemisphere monsoon during FGGE/WMONEX. Mon. Wea. Rev., 117, 1458--1470.
Dickinson, M. and J. Molinari, 2002: Mixed Rossby-gravity waves and western Pacific
tropical cyclogenesis. Part I: Synoptic evolution. J. Atmos. Sci., 59, 2183-2196.
Dudhia, J. 1993: A nonhydrostatic version of the Penn StatelNCAR mesoscale model:
Validation tests and simulation of an Atlantic cyclone and cold front. Mon. Wea.
Rev.. 121. 1493-1513.
Emanuel, K. A, 1986: An air-sea interaction theory for tropical cyclone: Part I: Steady
state maintenance. J. Atmos. Sci., 43, 585-604.
--. C. DesAutels, C. Holloway, and R. Korty, 2004: Environmental control of tropical
cyclone intensity. J. Atmos. Sci., 61, 843--858.
149

Fairall, C. W., E. F. Bradley, D. P. Rogers, J. B. Edson, and G S. Young, 1996: Bulk
parameterization of air-sea fluxes in TOGA COARE. J. Geophys. Res.. 101.
3747-3767.
Fiorino, M. J., and R. L. Elsberry, 1989: Some aspects of vortex structure related to
tropical cyclone motion. J. Atmos. Sci., 46, 975-990.
FlierI, GR., M. E. Stern, and J. A. Whitehead, 1983: The physical significance of
modons: Laboratory experiments and general integral constraints. Dyn. Atmos.
Oceans., 7, 233-263.
__ , 1984: Rossby wave radiation from a strongly nonlinear warm eddy. J. Phys.
Oceanogr., 14,47-58.
Frank, W. M., 1977: Structure and energetics of the tropical cyclone, Part I: storm
structure. Mon. Wea. Rev., lOS, 1119-1135.
__ , 1982: Large-scale characteristics of tropical cyclones. Mon. Wea. Rev., 110,
572-586.
Frank, W. M., and E. A. Ritchie, 1999: Effects of environmental flow upon tropical
cyclone structure. Mon. Wea. Rev., 127, 2044-2061.
Frank, W. M., and E. A. Ritchie, 2001: Effects of vertical wind shear on hurricane
intensity and structure. Mon. Wea. Rev., 129, 2249-2269.
Ge. X. Y .• T. Li .. Y. Wang, and M. Peng, 2008: Tropical cyclone energy dispersion in a
three-dimensional primitive equation model: upper tropospheric influence. J. Atmos.
Sci .. (in press)
150

Gray, W. M., 1968: Global view of the origin of tropical disturbances and storms. Man.
Wea. Rev., 96, 669-700.
Gray, W. M., 1998: The formation of tropical cyclone. Meteor. Atmos. Phys., 67, 37-69.
Grell, GA., J. Dudhia and D. R. Stauffer, 1994: A description of the fifth-generation
Penn StateINCAR mesoscale model (MM5). NCAR Technical Note,
NCAR/TN-398+STR,117pp.
Guinn, T. A and W. H. Schubert, 1993: Hurricane spiral bands. J. Atmos. Sci., 50,
3380-3403.
Hack, J. J., W. H. Schubert, D. E. Stevens, and H.-C. Kuo, 1989: Response of the Hadley
circulation to convective forcing in the ITCZ. 1. Atmos. Sci., 46, 2957-2973.
Harr, P. A. and R. L. Elsberry, 1996: Structure of a mesoscale convective system
embedded in Typhoon Robyn during TCM-93. Man. Wea. Rev., 124, 634-652.
Hendricks, E. A, M. T. Montgomery, and C. A. Davis, 2003: On the role of "vertical"
hot towers in the formation of tropical cyclone Diana (1984). J. Atmos. Sci., 61,
1209-1232.
Holland, G J., and R.T. Merrill, 1984: On the dynamics of tropical cyclone structural
changes. Quart. J. Roy. Meteor. Soc., 109, 187-209.
Holland, G J., 1995: Scale interaction in the Western Pacific monsoon. Meteorol. Atmos.
Phys., 56, 57-79.
Hoskins, B. J., M. E. McIntyre, and A W. Robertson, 1985: On the use and significance
of isentropic potential vorticity maps. Quart. J. Roy. Meteor. Soc., ill, 877-946.
151

Hooke, W. H., 1986: Gravity waves. Mesoscale Meteorology and Forecasting. P. S. Ray,
Ed., Amer. Meteor. Soc., 272-288.
Jones, S. C., 2000: The evolution of vortices in vertical shear. m: Baroclinic vortices.
Quart. J. Roy. Meteor. Soc., 126, 3161-3186.
Kurihara, Y., and R. E. Thleya, 1974: Structure of a tropical cyclone developed in a
three-dimensional numerical simulation model. J. Atmos. Sci .• 31. 893-919.
Kuo, H.-L., 1974: Further studies of the parameterization of the influence of cumulus
convection on large-scale flow. 1. Atmos. Sci., 31. 1231-1240.
Kuo, H.-C., J.-H. Chen, R. T. Williams and C. -Po Chang, 2001: Rossby wave in zonally
opposing mean flow: Behavior in northwest Pacific summer monsoon. 1. Atmos.
Sci., 58, 1035-1050.
Lander, M., and G. J. Holland, 1993: On the interaction of tropicalcyclone-scale vortices.
I: Observations. Quart. J. Roy. Meteor.Soc .. Il9, 1347-1361.
Langland, R. H., and C. S. Liou, 1996: Implementation of an E-& parameterization of
vertical subgrid-scale mixing in a regional model. Mon. Wea. Rev., 124, 905-918.
Lau, K.-H., and N.-C. Lau, 1990: Observed structure and propagation characteristics of
tropical summertime synoptic scale disturbances. Mon. Wea. Rev.,Il8, 1888--1913.
___ " and , 1992: The energetics and propagation dynamics of tropical
summertime synoptic-scale disturbances. Mon. Wea. Rev., 120, 2523-2539.
Li, T., B. Fu, X. Ge, B. Wang, and M. Peng, 2003: Satellite data analysis and numerical
simulation of tropical cyclone formation, Geophys. Res. Lett., 30, 2122-2126.
152

__ , and B. Fu, 2006: Tropical cyclogenesis associated with Rossby wave energy
dispersion of a pre-existing typhoon. Part I: Satellite data analyses. J. Atmos. Sci .•
63, 1377-1389.
__ , X. Ge, B. Wang, and T. Zhu, 2006: Tropical Cyclogenesis Associated with Rossby
Wave Energy Dispersion of a Pre-existing Typhoon. Part II: Numerical Simulations.
J. Atmos. Sci., 63,1390-1409.
Li, T., 2006: Origin of the summertime synoptic-scale wave train in the western North
Pacific. JAtmos.Sci., 63,1093-1102.
Liebmann, B .• and H. H. Hendon, 1990: Synoptic-scale disturbances near the equator. J.
Atmos. Sci., 47, 1463-1479.
Luo, Z., 1994: Effect of energy dispersion on the structure and motion of tropical cyclone.
Acta. Meteor. Sinica., 8, 51-59.
McBride, J. L. and R. Zehr, 1981: Observational analysis of tropical cyclone formation.
Part II: Comparison of non-developing versus developing systems. J. Atmos. Sci.,
38, 1132-1151.
McDonald, N. R., 1998: The decay of cyclonic eddies by Rossby wave radiation. J. Fluid.
Mech., 36, 237-252.
Merrill, R. T., 1984: Structure of the tropical cyclone outflow layer. Proc. 15th Con! on
Hurricanes and Tropical Meteorology, Miami. FL. Amer. Meteor. Soc., 421-426.
Merrill, R. T., 1988: Environmental influences on hurricane intensification. J. Atmos. Sci.,
45,1678-1687.
153
Molinari, J., and D. Vollaro, 1989: External influences on hurricane intensity. Part I:
Outflow layer eddy angular momentum fluxes. J.Atmos. Sci., 46, 1093-1105.
__ , and D. Vollaro, 1990: External influences on hurricane intensity. Part II: Vertical
structure and response of hurricane vortex. 1. Atmos. Sci., 47, 1902-1918.
__ , S. Skubis, and D. Vollaro, 1995: External influences on hurricane intensity. Part
ill: Potential vorticity structure. J. Atmos. Sci., 52, 3593-3606.
Moller, J. D., and M. T. Montgomery, 1999: Vortex Rossby waves and hurricane
intensification in a barotropic model. J. Atmos. Sci., 56,1674-1687.
__ , and __ , 2000: Tropical cyclone evolution via potential vorticity anomalies in a
three-dimensional balance model. J. Atmos. Sci., 57, 3366-3387.
Moore, R. W., and M. T. Montgomery, 2005: Analysis of an idealized three-dimensional
diabatic Rossby vortex: A coherent structure of the moist baroclinic atmosphere. 1.
Atmos. Sci., 62, 2703-2725.
Montgomery, M. T., and B. F. Farrell, 1993: Tropical cyclone formation. J. Atmos. Sci.,
SO,285-310.
Nieto Ferreira, R. and W. H. Schubert, 1997: Barotropic aspects of ITCZ breakdown.
1.Atmos. Sci., 54, 261-285.
Nitta, T., and M. Yanai, 1969: A note on the barotropic instability of the tropical easterly
current. J. Meteor. Soc. Japan, 47, 127-130.
Ooyarna, K. V., 1964: A dynamical model for the study of tropical cyclone development.
Geophys. Int., 4, 187-198.
154
Ooyama, K., 1982: Conceptual evolution of the theory and modeling of the Tropical
Cyclone. J. Meteor. Soc. Japan., 60, 369-380.
Peng, M. S., B-F. Jeng, and R. T. Williams, 1999: A numerical study on tropical cyclone
intensification. Part I: Beta effect and mean flow effect. J. Atmos. Sci., 56,
1404-1423.
Pfeffer, R. L., and M. Challa, 1981: A numerical study of the role of eddy fluxes of
momentum in the development of Atlantic hurricanes. J. Atmos. Sci., 38,
2392-2398.
Rappin, E.D., 2004: The role of envrionmental inertial stability in tropical cyclone
intensification. PhD thesis, Dept. of Atmospheric and Oceanic Sciences,
University of Wisconsin-Madison. 106pp.
Ritchie, E. A. and G. J. Holland, 1993: On the interaction of tropical-cyclone-scale
vortices II: Discrete vortex patches. Quart. J. R. Met. Soc., 119, 1363-1379.
Ritchie, E. A., and G. J. Holland, 1999: Large-scale patterns associated with tropical
cyclogenesis in the western Pacific. Mon. Wea. Rev., 127,2027-2043.
Ritchie. E. A. and G. J. Holland, 1997: Scale interactions during the formation of
Typhoon Irving. Mon. Wea. Rev., 125, 1377-1396.
Ross, R. J., and Y. Kurihara, 1995: A numerical study on influences of Hurricane Gloria
(1985) on the environment. Mon. Wea. Rev., 123, 332-346.
Sadler, J. C., 1978: Mid-season typhoon development and intensity changes and the
tropical upper tropospheric trough. Mon. Wea. Rev., 106, 1137-1152.
155

Sadler, J. C., 1976: A role of the tropical upper tropospheric trough in early season
typhoon development Mon. Wea. Rev .• 104. 1266-1278.
Schubert, W. H., 1985: Wave, mean-flow interactions, and hurricane development.
Pre prints, 16th Conf. on Hurricanes and Tropical Meteorology, Houston, TX,
Amer. Meteor. Soc., 140-141.
Shapiro, L. J., 1977: Tropical storm formation from easterly waves: A criterion for
development. J. Atmos. Sci., 34, 1007-1021.
Shapiro, L. J., and K. V. Ooyama, 1990: Barotropic vortex evolution on a beta plane. J.
Atmos. Sci .• 47.170-187.
Shapiro, L. J., 1992: Hurricane vortex motion and evolution in a three-layer modeL J.
Atmos. Sci., 49, 140-153.
Shi, J. J., W. S., Chang, and S. Raman, 1990: A numerical study of the outflow of
Tropical Cyclones. J. Atmos. Sci. ,47, 2042-2055.
Simpson, J., E. Ritchie, G J. Holland, J. Halverson, and S. Stewart, 1997: Mesoscale
interactions in tropical cyclone genesis. Mon. Wea. Rev., 125,2643-2661.
Smith, G B. and M. T. Montgomery, 1995: Vortex axisymmetrization and its dependence
on azimuthal wavenumbers or asymmetric radial structure changes. Quart. J. Roy.
Meteor. Soc., 121, 1615-1650.
Smith, R. K.. and W. Ulrich. 1990: An analytical theory of tropical cyclone motion using
a barotropic model. J. Atmos. Sci., 47, 1973-1986.
156

Sobel, A. H., and C. S. Bretherton, 1999: Development of synoptic-scale disturbances
over the summertime tropical northwest Pacific. J. Atmos. Sci., 56, 3106-3127.
Tai, K. S., and Y. Ogura, 1987: An observational study of easterly waves over the eastern
Pacific in the northern summer using FGGE data. J. Atmos. Sci., 44, 339-361.
Takayabu, Y.N., and T. Nitta, 1993: 3-5 day disturbances coupled with convection in the
tropical Pacific Ocean. J. Meteor. Soc. Japan, 71, 221-245.
Tarn, C.-Y., and T. Li, 2006: The origin and dispersion characteristics of the observed
summertime synoptic-scale waves over the western Pacific. Mon. Wea. Rev .. 134,
1630-1646.
Tiedtke, M., 1989: A comprehensive mass flux scheme for cumulus parameterization in
large scale models. Mon. Wea. Rev., 117, 1779-1800.
Uccellini, L. W., and S. E. Koch, 1987: The synoptic setting and possible source
mechanisms for mesoscale gravity wave events. Mon. Wea. Rev., 115,721-729.
Wang, B. and X. Li, 1992: The beta-drift of three dimensional vortices: A numerical study.
Mon. Wea. Rev., 120, 579-593.
___ " and T. Li, 1994: Convective interaction with boundary-layer dynamics in the
development of a tropical intraseasonal system. J. Atmos. Sci., 51, 1386-1400.
___ " and X. Xie, 1996: Low-frequency equatorial waves in sheared zonal flow. Part I:
Stable waves. 1. Atmos. Sci., 53, 449-467.
Wang, Y., 1999: A triply-nested movable mesh tropical cyclone model with explicit cloud
microphysics. MRC Research Rep. 74, Bureau of Meteorology Research Centre, 81
157

pp. Available from Bureau of Meteorology Research Centre, Melbourne, Victoria
3001. Australia.
__ , 2001: An explicit simulation of tropical cyclones with a triply nested movable
mesh primitive equation model: TCM3. Part I: Model description and control
experiment. Mon. Wea. Rev., 129, 1370-1394.
__ , 2oo2a: An explicit simulation of tropical cyclones with a triply nested movable
mesh primitive equation model: TCM3. Part II: Some model refinements and
sensitivity to cloud microphysics parameterization. Mon. Wea. Rev., 130,
3022-3036.
__ , 2002b: Vortex Rossby waves in a numerically simulated tropical cyclone. Pan I:
Overall structure, potential vorticity and kinetic energy budgets. J. Atmos. Sci., 59,
1213-1238.
__ , 2oo2c: Vortex Rossby waves in a numerically simulated tropical cyclone. Part I:
Role in tropical cyclone structure and intensity changes. J. Atmos. Sci., 59,
1213-1238.
__ , J.D. Kepert, and aJ. Holland, 2001: The effect of sea spray evaporation on tropical
cyclone boundary layer structure and intensity. Mon. Wea. Rev., 129,2481-2500.
__ , and a J. Holland, 1996a: Beta drift of baroc1inic vortices. Part I: Adiabatic vortices.
J. Atmos. Sci., 53, 411-427.
__ , and a J. Holland, 1996b: Beta drift of baroclinic vortices. Part II: Diabatic vortices.
J. Atmos. Sci., 53, 3737-3756.
1S8

Wang, C.-C., and G Magnusdottir, 2006: The ITCZ in the Central and Eastern Pacific on
Synoptic Timescales. Mon. Wea. Rev.,I34, 1405-1421.
Wang, C.-C., and G Magnusdottir, 2005: ITCZ breakdown in 3-dimensional flows. J.
Atmos. Sci., 62,1497--1512.
Wu, C. -C., and H. J. Cheng. 1999: An observational sludy of environmental influences
on the intensity changes of typhoons Flo (1990) and Gene (1990). Mon. Wea. Rev.,
127,3003-3031.
Wu, C-C., and K. A. Emanuel, 1993: Interaction of a baroclinic vortex with background
shear: Application to hurricane movement J. Atmos. Sci., 50, 62-76.
__ , and __ , 1994: On hurricane outflow structure. J. Atmos. Sci., 51, 1995-2003.
Wong, M. L. M., and J. C. L. Chan, 2004: Tropical Cyclone Intensity in Vertical Wmd
Shear. J. Atmos. Sci., 61, 1859-1876.
Xie, X. and B. Wang, 1996: Low-frequency equatorial waves in vertically sheared zonal
flows. Part II: unstable waves. J. Atmos. Sci., 53, 3589-3605.
Zhang, F., 2004: Generation of mesoscale gravity waves in the upper-tropospheric jet
front systems. J. Atmos. Sci .. 61, 440-457.
Zhou, X. and B. Wang, 2007: Transition from an Eastern Pacific Upper-Level Mixed
Rossby-Gravity Wave to a Western Pacific Tropical Cyclone, Geophys. Res. Lett.,
doi: 1O.102912007GL031831.
159