University of Groningen Transparency in the pharmaceutical ... · Transparency in the...
71
University of Groningen Transparency in the pharmaceutical industry - A cost accounting approach to the prices of drugs Broekhof, Martijn IMPORTANT NOTE: You are advised to consult the publisher's version (publisher's PDF) if you wish to cite from it. Please check the document version below. Document Version Publisher's PDF, also known as Version of record Publication date: 2002 Link to publication in University of Groningen/UMCG research database Citation for published version (APA): Broekhof, M. (2002). Transparency in the pharmaceutical industry - A cost accounting approach to the prices of drugs. s.n. Copyright Other than for strictly personal use, it is not permitted to download or to forward/distribute the text or part of it without the consent of the author(s) and/or copyright holder(s), unless the work is under an open content license (like Creative Commons). Take-down policy If you believe that this document breaches copyright please contact us providing details, and we will remove access to the work immediately and investigate your claim. Downloaded from the University of Groningen/UMCG research database (Pure): http://www.rug.nl/research/portal. For technical reasons the number of authors shown on this cover page is limited to 10 maximum. Download date: 14-06-2018
-
Upload
vuongduong -
Category
Documents
-
view
221 -
download
1
Transcript of University of Groningen Transparency in the pharmaceutical ... · Transparency in the...

University of Groningen
Transparency in the pharmaceutical industry - A cost accounting approach to the prices ofdrugsBroekhof, Martijn
IMPORTANT NOTE: You are advised to consult the publisher's version (publisher's PDF) if you wish to cite fromit. Please check the document version below.
Document VersionPublisher's PDF, also known as Version of record
Publication date:2002
Link to publication in University of Groningen/UMCG research database
Citation for published version (APA):Broekhof, M. (2002). Transparency in the pharmaceutical industry - A cost accounting approach to theprices of drugs. s.n.
CopyrightOther than for strictly personal use, it is not permitted to download or to forward/distribute the text or part of it without the consent of theauthor(s) and/or copyright holder(s), unless the work is under an open content license (like Creative Commons).
Take-down policyIf you believe that this document breaches copyright please contact us providing details, and we will remove access to the work immediatelyand investigate your claim.
Downloaded from the University of Groningen/UMCG research database (Pure): http://www.rug.nl/research/portal. For technical reasons thenumber of authors shown on this cover page is limited to 10 maximum.
Download date: 14-06-2018

Transparency in the pharmaceutical industry
A cost accounting approach to the prices of drugs
Martijn Broekhof
EC 121
2002
Rijksuniversiteit Groningen Wetenschapswinkel voor Economie


Transparency in the pharmaceutical industry
A cost accounting approach to the prices of drugs
Martijn Broekhof
Groningen, January 2002
Community Research Center Economics, University of Groningen Coördinator: drs. F.J. Sijtsma Supervisory lecturer: drs. P.C.G. Molenaar Inquirer: Health Action International – Europe Address: Community Research Center Economics PO box 800 9700 AV Groningen tel: 050-3633754 fax: 050-3637337 E-mail : [email protected] Internet : http://www.eco.rug.nl/wewi
CIP-GEGEVENS KONINKLIJKE BIBLIOTHEEK, DEN HAAG Transparency in the pharmaceutical industry – A cost accounting approach to the prices of drugs, Martijn Broekhof, Groningen: Community Research Centre Economics (Publications of the Community research Centre Economics EC 121) - With references. ISBN 90-5803-018-0 NUGI 681 Copyright 2002 Wetenschapswinkel voor Economie, Rijksuniversiteit Groningen, Groningen. Niets uit deze uitgave mag worden vermenigvuldigd en/of openbaar gemaakt door middel van druk, fotokopie of op welke andere wijze dan ook, zonder voorafgaande schriftelijke toestemming van de uitgever. All rights preserved. No part of this publication may be reproduced in any form, by print or photoprint, microfilm or any other means, without written permission by the publishers. Druk: Universiteitsdrukkerij Rijksuniversiteit Groningen

ABSTRACT
Wewi/RuG 3
Abstract
The WTO TRIPS agreement grants pharmaceutical companies patent rights on new innovative drugs. Patents give these companies the opportunity to charge higher prices for their drugs in order to recover their R&D expenses. For developing countries this is one of the reasons why people in developing countries do not have good access to drugs. In this context this paper was written. The aim of this paper was to examine the problem above from a cost-accounting perspective. To clarify the position of the different actors in the field the first part of the paper describes the broader scope of the problem. Here the characteristics of the pharmaceutical industry, a model for drug prices and the role of the WTO TRIPS agreement are described. The second part of the paper gives a conceptual framework of cost accounting techniques. Also an empirical study is done after the use of these techniques in practice. The question this paper aimed to answer was: ‘how does the industry calculate it cost prices and can they improve the accuracy of their cost prices?’ Considering the pharmaceutical industry with its high indirect costs and innovative character one would expect innovative and state-of-the-art cost accounting principles. In this research that expectation has not come true.

TRANSPARENCY IN THE PHARMACEUTICAL INDUSTRY
Wewi/RuG 4

PREFACE
Wewi/RuG 5
Preface This paper is part of a study carried out by the Community Research Centre Economics of the University of Groningen. Health Action International (Europe) approached the Research Centre with the request to investigate the transparency of the pharmaceutical industry in general and the prices of drugs in developing countries more specifically. Luckily I was part of the group of students who participated in this project. During the summer I spent most of my time at a then unfamiliar desk behind a university laptop. Now months later my work finally is finished and both the desk and laptop have become close friends. During the time I spent working on the subject, there have been changes in the situation. The latest of those are that GlaxoSmithKline has offered HIV/AIDS medication for free to developing countries and a pact of developing countries has ensured a broad interpretation of the WTO TRIPS agreement at the WTO conference in Qatar. I hope this will be the beginning of a more promising time for those that suffer from diseases, while cures are available. I would like to thank Pieter Molenaar, my supervisor. He corrected and criticised my work during a though period in my life. His comments proved to be of great help. I would also like to thank Elise Kamphuis and Frans Sijtsma, both counsellors for the Research Centre, for talking me into the project and helping me along the way, constantly presenting me new interesting articles… and for introducing me to the laptop and the desk. Finally I would like to thank my father, who unexpectedly died this summer, for his role in my years of study. He made me go on when I lost hope of ever graduating. Groningen, January 2002 Martijn Broekhof

TRANSPARENCY IN THE PHARMACEUTICAL INDUSTRY
Wewi/RuG 6

TABLE OF CONTENTS
Wewi/RuG 7
Table of contents
Abstract ...............................................................................................................................3
Preface ...............................................................................................................................5
Table of contents ........................................................................................................................7
Chapter 1 Introduction ...........................................................................................................9
Chapter 2 Broader scope of the problem..............................................................................13
§ 2.1 The four key components which influence access to drugs ........................................13
§ 2.2 Characteristics of the pharmaceutical industry............................................................15
§ 2.2.1 The market structure.............................................................................................15
§ 2.2.2 Profits and prices ..................................................................................................17
§2.2.3 Research and development ....................................................................................18
§ 2.3 The generic industry ....................................................................................................20
Chapter 3 Pillar four – affordable prices ..............................................................................21
§ 3.1 Model of drug prices....................................................................................................21
§ 3.2 Intellectual property rights and the WTO TRIPS agreement ......................................22
Chapter 4: Theoretical concept of cost price calculation ......................................................25
§ 4.1 The allocation of indirect costs....................................................................................25
§ 4.2 Cost calculation methods.............................................................................................27
§4.2.1 Standard costing ....................................................................................................27
§ 4.2.2 Life-cycle costing .................................................................................................29
§ 4.2.3 Activity based costing ..........................................................................................30
§ 4.2.4 Target costing en kaizen costing ..........................................................................32
§ 4.3 Application of the theory to the pharmaceutical industry ...........................................33
Chapter 5 Field survey: cost-price methods used in the pharmaceutical industry ...............35
§ 5.1 Introduction to the survey............................................................................................35
§ 5.2 Research specifics........................................................................................................35
§ 5.3 Presentation of results..................................................................................................38
§ 5.4 Conclusions from the results .......................................................................................40
§ 5.4.1 The ABC-paradox ................................................................................................40
Chapter 6 Conclusion and recommendations for further study............................................43
References .............................................................................................................................45

TRANSPARENCY IN THE PHARMACEUTICAL INDUSTRY
Wewi/RuG 8
Annex 1: The economics of health care ...................................................................................49
Annex 2: Offers of donation/price reductions of antiretroviral drugs up to 15 April 2001 .....51
Annex 3: Market Shares of the pharmaceutical and car industry.............................................53
Annex 4: Comparison of shareholders equity ..........................................................................55
Annex 5: Out-of-pocket payments ...........................................................................................57
Annex 6: Private-public health care .........................................................................................59
Annex 7: Overview of costs in the pharmaceutical industry....................................................61
Annex 8: Survey form ..............................................................................................................63
Annex 9: The respondents of the survey ..................................................................................65
Publications ..............................................................................................................................67
Werkdocumenten......................................................................................................................68
INTRODUCTION
Wewi/RuG 9
Chapter 1 Introduction In the past year the issue of “equal access to drugs for all people”1 has been frequently in the news. Especially the Court Case of the South African government versus pharmaceutical manufacturers’ association (PMA) has been the topic of many debates. In that case a group of 39 pharmaceutical companies issued a lawsuit against the government of South Africa. They had taken South Africa to court over its Medicines and Related Substances Act. The main issue was Amendment 15(c), which states: “The minister may prescribe conditions for the supply of more affordable medicines in certain circumstances so as to protect the health of the public […].” Although this national legislation is in line with a broad interpretation of the Trade Related aspects of Intellectual Property Rights-agreement (TRIPS) adopted by the World Trade Organisation (WTO) during the Uruguay Rounds in 1995, the PMA saw it as a threat to their patented position. During the early stages of the court case, which had started in 1998, the PMA seemed to be victorious. However, due to media intervention, the PMA capitulated in response to global denunciation of their lawsuit in April 2001. The South-African court case caused the world to focus on the problem of access to drugs for the poor. Many non-governmental organisations (NGO’s) claim that drug prices are too high in developing countries because of patent rights and that people therefore do not have access to essential, life-saving drugs. Patent rights would give pharmaceutical companies a monopolistic position and allow them to sell their products well above the market equilibrium price in competition2. The pharmaceutical industry on the other hand claims prices are as high as they are, because of the high cost of research for and development of new drugs. They claim patent protection is necessary to ensure new incentives for research and that an abolishment of the system of patent protection would take away these incentives and would restrain the industry to engage in this research. The discussion on this matter is very complex. The aim of this research is therefore to clarify the views of different parties; to clarify the provisions of TRIPS and the possibilities it leaves open for developing countries. Furthermore, to look at the problem from a new point of view (the problem has not been viewed from a cost accounting perspective before) to provide a solution that might possibly take us a step closer to solving the problem of access to drugs for the poor.
1 Access to medication for diseases like malaria, HIV/AIDS and other tropical diseases has been a problem in developing countries for many a year. Developed countries, however do have full access. The problems arising from this inequality have been grouped under the header “equal access to drugs for all people” or “access to (essential) drugs for the poor” or something like that. 2 In a competitive market, prices will stabilise at a level equal to the marginal cost of production, when the supply and demand for a product are in balance. This is called the ‘equilibrium price’. In a monopolistic market prices can sustain a higher level, for manufacturers do not have to deal with price competition. For the pharmaceutical market this is even more so, since the product involved can be life-savings. See also Annex 1: the economics of health care.

TRANSPARENCY IN THE PHARMACEUTICAL INDUSTRY
Wewi/RuG 10
This research will focus on the position of the pharmaceutical industry. The main topic that will be discussed is whether the pharmaceutical industry can more accurately calculate their cost prices and thereby create more just prices of drugs in developing countries. To be able to answer this question the broader scope of the problem will first be displayed, thus establishing the grounds for discussion of the matter. This is done in Chapter 2. First, the pillars of health care in developing countries will be discussed in paragraph 2.1. This section will elaborate on the four components of the policy framework that is deemed necessary to ensure access to essential medicines in developing countries. Since the discussion on access to drugs got higher on the political agenda, it has become more mature and balanced. The solely focus on prices of drugs is evolving to a broader focus on both affordable prices and rational selection of drugs, foreign financing of developing countries’ health care and reliable health care and supply systems. In paragraph 2.2 the characteristics of the pharmaceutical industry will be discussed. First, the market structure is discussed, then comments are made with regard to prices and profits and finally research- and development (R&D) in the industry is more closely regarded. The last paragraph of this chapter is about the generic industry. This industry is often called the ‘copy-cat’ industry, since generic producers are copying off-patent drugs and often sell them at prices below those of the original brand. After having defined the broader scope of the problem, chapter three will focus on the relevant component of the framework for this investigation: affordable prices. This chapter will focus on how prices of drugs are composed, in paragraph 3.1, and will discuss the role of the WTO TRIPS agreement in both the policies of the pharmaceutical industry and developing countries, in paragraph 3.2. This chapter will also show factors, which influence prices, both from inside the pharmaceutical industry as well as from outside the industry. In chapter 4 this research reaches its main topic: cost prices of drugs. Here, in paragraph 4.1, a theoretical approach to calculation of cost prices is given. Some important theoretical cost price calculation methods will be elaborated on. The methods described are standard costing, kaizen costing and target costing, life cycle costing and activity based costing (ABC). These techniques are not fully comparable in terms of use and do not exclude each other, but using or not using them will have its effect on the accuracy of the cost price of a medicine. In paragraph 4.2 these methods will be placed in the context of the pharmaceutical market. In chapter 5 the results of a survey on the actual use of cost calculation methods in practice, done by the author, will be presented. This survey was done in the summer of 2001 amongst a number of pharmaceutical companies. The survey gives an indication of how the industry is dealing with indirect costs like R&D-costs and marketing-costs in their cost price. Paragraph 5.1 will introduce the survey. In paragraph 5.2 the survey specifics will be described. Paragraph 5.3 will present the actual results of the survey. In paragraph 5.4 conclusions will be made with regard to the survey outcome, showing the possibility of improving the accuracy in calculating cost prices. In paragraph 5.4.1 this research will elaborate on the

INTRODUCTION
Wewi/RuG 11
paradoxical situation between the theoretical advantages of one of the described methods, namely ABC, and the non-use of the method in reality. Chapter 6 summarises this paper and presents its conclusions. Also recommendations for future research will be made.
TRANSPARENCY IN THE PHARMACEUTICAL INDUSTRY
Wewi/RuG 12

BROADER SCOPE OF THE PROBLEM
Wewi/RuG 13
Chapter 2 Broader scope of the problem § 2.1 The four key components which influence access to drugs In the 2000 workshop organised by the World Health Organisation (WHO) and the World Trade Organisation (WTO) the four key components, or pillars, of the ‘access framework’3 were discussed.4 Each of these pillars is considered important in ensuring access to essential drugs in developing countries. The first pillar is called ‘rational selection’. This component of the framework deals with the selection of drugs that are most essential for public health and should therefore be accessible prior to all other drugs. The concept of the WHO essential drug list comes into play here. This WHO model-list contains 306 cost-effective drugs5, which are considered to cater for the health needs of the majority of the population. The WHO Expert Committee defines essential drugs as follows:
Essential drugs are those drugs that satisfy the health care needs of the majority of the
population; they should therefore be available at all times in adequate amounts and in the
appropriate dosage forms, and at a price that individuals and the community can afford.6 Lately this list was updated to include HIV/AIDS treatment by adding zidovudine and the combination cocktail. The WHO selection of essential drugs should be used by national governments. With this list national governments can create a cost-effective national essential drug list, based on evidence by the WHO. The second pillar is ‘sustainable and adequate financing’. Health care budgets in developing countries are, for various reasons, minimal. Better regulation of health care policy is needed. A higher priority for health care budgeting must be established in order to be able to ensure access to drugs. But besides the willingness of the governments of the least-developed countries to prioritise the health care budget, the ability to do so must be created. The poorest countries do not have the resources needed and therefore external assistance is critical for improving access to drugs. In the WHO/WTO workshop it was argued that additional financial aid ranging from 12-15 billion dollar to a more moderate 4,5 billion dollar a year must come from the developed world to tackle only the three major diseases (Malaria, HIV/AIDS and tuberculoses) in the developing world. The need for this financial impulse in
3 The policy framework that is deemed necessary to ensure access to essential medicines in developing
countries in the future. 4 Report on the workshop on differential pricing and financing of essential drugs, WTO OMC, April 2000,
www.wto.org/english/tratop_e/TRIPS_e. 5 On the basis of a comparison with other drugs on the market, the WHO makes considerations of “value for
money” regarding drugs. The least costly drugs with adequate quality make it to the WHO-list of essential drugs.
6 WHO Expert Committee on Essential Drugs, November 1999.
TRANSPARENCY IN THE PHARMACEUTICAL INDUSTRY
Wewi/RuG 14
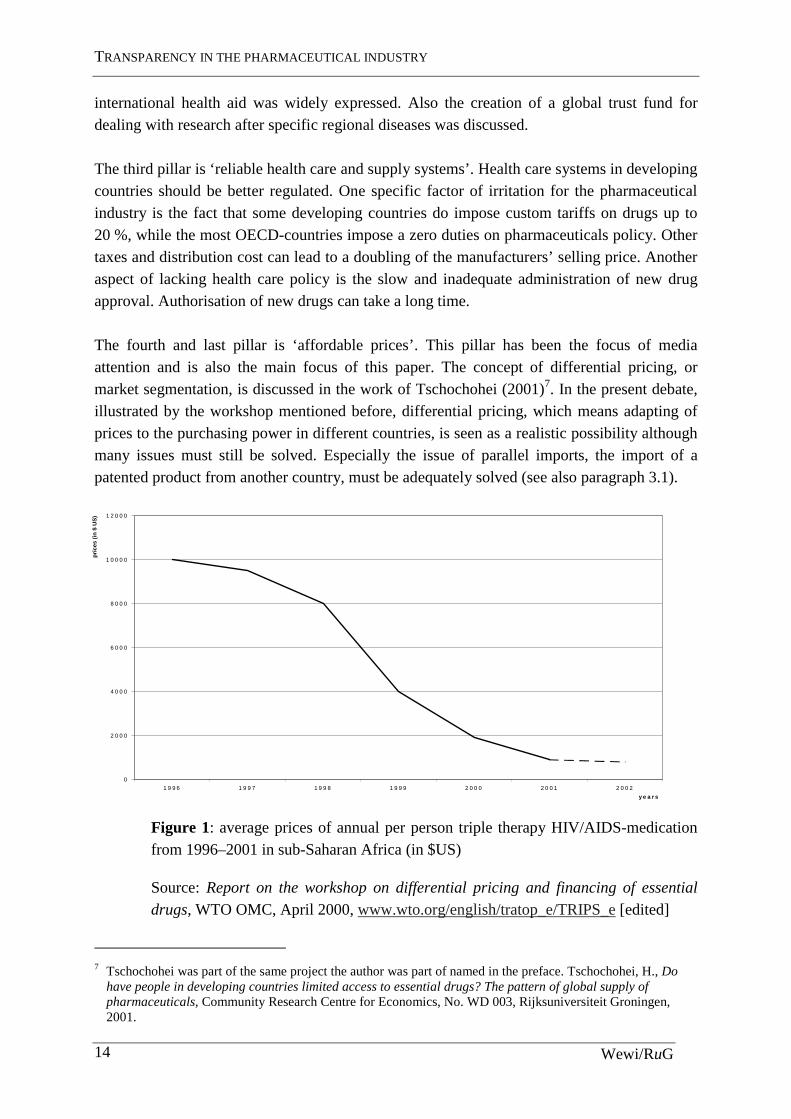
international health aid was widely expressed. Also the creation of a global trust fund for dealing with research after specific regional diseases was discussed. The third pillar is ‘reliable health care and supply systems’. Health care systems in developing countries should be better regulated. One specific factor of irritation for the pharmaceutical industry is the fact that some developing countries do impose custom tariffs on drugs up to 20 %, while the most OECD-countries impose a zero duties on pharmaceuticals policy. Other taxes and distribution cost can lead to a doubling of the manufacturers’ selling price. Another aspect of lacking health care policy is the slow and inadequate administration of new drug approval. Authorisation of new drugs can take a long time. The fourth and last pillar is ‘affordable prices’. This pillar has been the focus of media attention and is also the main focus of this paper. The concept of differential pricing, or market segmentation, is discussed in the work of Tschochohei (2001)7. In the present debate, illustrated by the workshop mentioned before, differential pricing, which means adapting of prices to the purchasing power in different countries, is seen as a realistic possibility although many issues must still be solved. Especially the issue of parallel imports, the import of a patented product from another country, must be adequately solved (see also paragraph 3.1).
Figure 1: average prices of annual per person triple therapy HIV/AIDS-medication from 1996–2001 in sub-Saharan Africa (in $US)
Source: Report on the workshop on differential pricing and financing of essential
drugs, WTO OMC, April 2000, www.wto.org/english/tratop_e/TRIPS_e [edited]
7 Tschochohei was part of the same project the author was part of named in the preface. Tschochohei, H., Do
have people in developing countries limited access to essential drugs? The pattern of global supply of pharmaceuticals, Community Research Centre for Economics, No. WD 003, Rijksuniversiteit Groningen, 2001.
0
2 0 0 0
4 0 0 0
6 0 0 0
8 0 0 0
1 0 0 0 0
1 2 0 0 0
1 9 9 6 1 9 9 7 1 9 9 8 1 9 9 9 2 0 0 0 2 0 0 1 2 0 0 2
y e a r s
pri
ces
(in
$ U
S)
BROADER SCOPE OF THE PROBLEM
Wewi/RuG 15
Since the discussion on prices of drugs heated up about a year ago, prices of HIV/AIDS medication have been dropping dramatically. Figure 1, presented at the WHO/WTO workshop, shows the dramatic fall in prices of HIV/AIDS-medication in sub-Saharan Africa. Factors that have contributed to the in fall in prices of this type of medicationwere UN interference, local generic production and media interference (especially during the South African court case) 8. The latest price reductions in HIV/AIDS-medication, both triple drug cocktails and sole drugs, are shown in annex 2. Although major reductions in prices have been realised, the advocates of price reductions are now faced with the reality that even at these low prices, the poorest still cannot afford these drugs. Focus solely on affordable prices is therefore inadequate to solve the problem.
§ 2.2 Characteristics of the pharmaceutical industry In this section the specific characteristics of the pharmaceutical industry will be examined to establish the context in which the industry operates. First, the market structure will be discussed. Second, comments are made with regard to prices and profits. Third, the R&D of the industry will be more closely regarded. The chapter ends with a section on the generic industry, since generic producers form a special group within the industry.9
§ 2.2.1 The market structure
The market structure of the pharmaceutical industry has the characteristics of both a multinational oligopolistic nature and a highly competitive one. The pharmaceutical industry can be regarded as an oligopolistic industry for the following reasons, argues MacIntyre.10 First, there are a relatively small number of large, internationally operating companies who are responsible for the bigger part of the world market. The 100 largest companies account for 90 % of the total world sales. Second, the entry to the market is limited by the patent system. Once a company has got a patent on a drug, no other manufacturer can enter the market for the patented period of twenty years.11 MacIntyre also argues that the entry is limited by the intensive marketing activities that are undertaken by the innovative industries to establish brand loyalty. Smaller and starting companies do not have the resources to match the expenses and will have difficulty conquering a market position. Third, MacIntyre argues, the ability of the pharmaceutical companies to affect the price of products, as a result of the patent system is very high. This also has its influence on the profit
8 Triple treatment medication is the best treatment for HIV/AIDS at the moment. It consists of a cocktail of
three different drugs. 9 Taggart, J., The world pharmaceutical industry , Routledge, Chapman and Hall, London, 1993. 10 McIntyre, Key issues in the pharmaceutical industry, John Wiley & Sons Ltd., Chichester, 1999. 11 Patented period under TRIPS; see paragraph 3.1.

TRANSPARENCY IN THE PHARMACEUTICAL INDUSTRY
Wewi/RuG 16
level. This is considered significantly higher in the market for pharmaceuticals than in other markets. From these points it is clear that the larger companies do have the leading powers of oligopolistic companies. They dominate the market by investing intensively in R&D and marketing and create an environment in which their positions are hard to attack. Still the industry has its competitive side too. Fist, the purely quantitative definition of an oligopolistic market is when the world leading four companies control 40 % of the market (Scherer, 1970).12 According to this definition the pharmaceutical industry is not oligopolistic since the four leaders only account for 14,8 % of the world market for pharmaceuticals (in 1995). In comparison, in the car industry the four leaders have a 54,7 % market share (in 1991).13 This argument must however be regarded as disputable since the ratios do not take into account the different markets for different drugs. On the anti-cancer drug market for example the accumulated market share of he four leaders mounts up to two thirds.14 Also the substitution between cars is much higher. Second, the stability in the pharmaceutical industry shows the power of successful R&D. The market positions are by no means stable. A successfully deployed drug can grant a company a safe position while the patent lasts, generating high profit margins and good market penetration. When the patent does expire, however, the prices will fall dramatically and so will the market shares and profit margins. The competition on R&D and the struggle for a good product ‘pipeline’, meaning a good series of different R&D-projects, is enormous. The third point is closely connected to the second point. Pharmaceutical companies are heavily depending on only a few products. The five-product ratio, or the total of the five leading drugs compared to the total sales, varies from 26 % for Hoechst to 70 % for Glaxo.15 In cost accounting terms a 20 – 80 principle is often recognised. 20 % of the products are responsible for 80 % of the profits. In the case of Hoechst this rule is applicable. In the Glaxo case, however, one product alone represents 50 % of sales and the 20 – 80 rule does in fact, over apply. Although it is easy enough to determine the most profitable drugs, it is a lot harder to detect the less profitable. The activity based costing method described in chapter 4 does give companies the opportunity to do so, yet the fact remains that there seems to be a high dependency on a few high-profit products in the industry. This is one factor that makes the industry vulnerable.
12 Scherer, F.M., Industrial Market Structure and Economic Performance, Rand McNally College Publishing Chicago, 1970. 13 see Annex 3: Market Shares of the pharmaceutical and car industry. 14 McIntyre, A., Key issues in the pharmaceutical industry, 1999. 15 Scrip Yearbook, PJB publications ltd., London 1995.

BROADER SCOPE OF THE PROBLEM
Wewi/RuG 17
§ 2.2.2 Profits and prices
It is often heard that there is no price competition in the pharmaceutical industry due to the patent protection and the price-inelasticy of the buying powers. When facing the decision whether or not to buy a life-saving or even quality of life improving drug, the price will play a minor role.16 With regard to patented products one can say that price competition is non-existent. The pharmaceutical industry is pressurised by media and public opinion and there are some restrictions under TRIPS, but the bigger part of patented products do not receive media attention and the provisions in TRIPS are never easy to apply17. So the industry can charge very high prices without having to worry about competitors challenging them. The extent of international (media) attention and its effect on prices of drugs is visible in the table in annex 2. This table shows the price reductions and donation offers for antiretroviral drugs18 made by pharmaceutical manufacturers made up till April 15, 2001. These offers were made to developing countries. Once a patent expires, the situation changes. Generic drugs enter the market and price competition commences. A recent study by Pérez-Casas shows that the minimum price for HIV/AIDS-medication [generic product] is, on average 82 % less than the US-price [brand product].19 Pérez-Casas shows that generic products force the price of medication downward. In regard to the price-inelasticy of the buyers of drugs, it must be noted that governments in both developing and developed countries, have become more cost conscience since drug costs became an increasing large factor within health expenses. They might prescribe the cost-effective generic drug rather than the more expensive brand product as the standard for the public health sector. The private buyers will, if informed correctly and if the drug is available, be more likely to buy the cheaper product. As for profits, they are high in the industry. Recent figures indicate that the industry as a whole has a very high profit margin. Fortune magazine estimates the average profit margin in 1999 on 18,6 % of sales. Compared to other sectors this is quite high. The banking industry had a margin of 15,6 %, and the other sectors vary from 0.5 % to 12,1 %.20 To examine the validity of this statement we could take a look at the internal rate of return (IRR). The IRR is defined as the real interest rate earned on an investment over the course of its economic life (Drury, 1992).21 Or, in other words, the IRR is the discount rate which causes the net present value of an investment to be zero. The cost of capital rate is the cost of not investing capital but putting it to the bank. Any investment yields a certain return on investment. If we consider
16 Feldstein, P.J., ‘The pharmaceutical industry’, Health Care Economics, 1988, ed. See also annex 1: the economics of health care. 17 See paragraph 3.1 about TRIPS. 18 Antiretroviral drugs are the drugs used to create the cocktail used in the AIDS/HIV treatment. 19 Pérez-Casas, ‘HIV/AIDS medicines pricing report. Setting objectives: is there a political will?’, 2000,
www.accessmed-msf.org . 20 M. Angell, ‘Aan wie is de farmaceutische industrie verantwoording verschuldigd?’, Geneesmiddelenbulletin,
issue 2, feb. 2001, pp. 13-24. 21 Drury, Management and Cost accounting, Chapman & Hall, London, 1992.

TRANSPARENCY IN THE PHARMACEUTICAL INDUSTRY
Wewi/RuG 18
the returns on the pharmaceutical R&D spending, these are above the average cost of capital, but the figures do not show the expected great margin. The IRR for the pharmaceutical industry equals 11,1 % compared to the cost of capital rate of 10,5 %.22 Grabowski and Vernon did this research in 1990, using data from the 1980’s. Another reason the industry gives for the higher profit margins is that the R&D investment has such a high risk that banks will not invest in the industry. Therefore, the industry is fully dependent on the private investors. They demand high revenue for their risky investment and those demands lead to higher profits.23 There is an indication that this argument does hold, since both for GlaxoSmithKline and for AstraZeneca the financial statement reveals much higher shareholders equity, than for instance the Shell financial statement. In the Stada financial statement (a generic producer) the level is higher than in the Shell statement, yet not halfway as high as in the statements of the innovative producers.24
§2.2.3 Research and development
Research and development for new chemical entities (NCE), the base elements for new drugs, form a dominant factor in the pharmaceutical industry. Together with marketing expenses the costs involved with R&D form the main determinants of the cost prices of drugs. It is interesting to look at the revenues of R&D expenditures. Figure 2 shows the relationship between a company’s R&D expenditures and its subsequent sales from new drug introductions. What is notable is that there is hardly any correlation to be found. There is much variation in the scatter of points around the ‘best-fitted’ regression line. This is especially true for the group of large firms with R&D outlays between $US 300 and $US 500 million. This, at least, shows the larger innovative companies have to deal with a high degree of variability in their returns on R&D and cannot predict the financial outcome of their investment. In previous work Grabowski and Vernon also examined the temporal pattern of new drug sales outcomes across firms. One of the main findings then was that there was a high degree of variability from one period to the next in the performance of new drug sales for individual firms.25
22 Grabowski H, Vernon J, ‘Innovation and structural change in pharmaceuticals and biotechnology’, Industrial
Corporate Changes, Issue 3 1990, pp. 435-49. 23 McIntyre, 1999. 24 GlaxoSmithKline Annual Review 2000; AstraZeneca Annual Report & Form 20-F 2000; N.V. Koninklijke
Nederlandse Petroleum Maatschappij, Verkort Verslag 2000; Stada Annual Report 2000. See also annex 4.

BROADER SCOPE OF THE PROBLEM
Wewi/RuG 19
Figure 2: Sales for 1988 to 1992 new drug introductions plotted against 1983 to 1985 mean research and development expenditures for 18 multinational pharmaceutical companies
Source: Grabowski, Vernon, 2000
Summarising it seems that the oligopolistic side of the industry is overshadowing the competitive side. The extreme monopolistic position that a manufacturer gains once a patent is granted is a dominating characteristic of the industry and although the fight for patents by investing heavily in R&D is fierce and competitive, it does not seem to outweigh the returns on patented products. Investing in R&D is very unstable and risky and the returns are by no means secure. This probably explains why the industry is more dependent on private investment. The position of the industry is in a way very vulnerable. When the R&D is successful and results in a patented product, its position is stable for some time, but when it is unsuccessful, its position will be much weaker. It is interesting for future research to elaborate on the work of Grabowski and Vernon by investigating the returns on R&D over a longer period of time for the big investors ($300 million plus) thus enabling a more profound judgement.
25 Grabowski H, Vernon J., ‘Innovation and structural change in pharmaceuticals and biotechnology’, 1994, pp.
435-49.

TRANSPARENCY IN THE PHARMACEUTICAL INDUSTRY
Wewi/RuG 20
§ 2.3 The generic industry This section is about the generic industry. This industries’ characteristics are very different from the innovative industry. This is mainly because the generic industry is involved in copying non-patented products. Generic producers do not invest in R&D the way the innovative industry does.26 Their R&D are limited to analysing existing drugs in order to reproduce them. The generic market has is not protected by patents and therefore is in fact a competitive market. Prices are also competitive. The copying of off-patent drugs is in no way illegal. Once a product gets off patent the technological knowledge encapsulated in the drug has become public property. Generic producers that copy patented products create the international disturbance. In India no product patents are granted. One can only get a (production-) process patent, which virtually undermines the possibility to gain a patented (monopoly) position for changes in production can be small and identical products can be produced differently. Indian generic producers like Cipla are producing and selling (antiretroviral) drugs at prices well below those of brand drugs, which are patented in other parts of the world. They do not have to earn back the R&D investments involved. This is why the advocates of the innovative industry are so upset about the generic producers. It must however be noted that this situation is temporarily as India is bound to comply with the rules of TRIPS within in a few years. Summarising, this chapter showed the grounds on which the discussion on access to drugs is held. The broader scope of the problem of access to drugs has been outlined. The chapter ended with the characteristics of the pharmaceutical industry, both generic and innovative. The innovative pharmaceutical industry has its competitive side, but with regard to patents, is highly monopolistic. In competing for these monopolistic positions the innovative industry is engaging in highly risky research and has to deal with high stakes. Again the industry is quite dependent on the monopoly positions. This dependency shows its vulnerability. The generic industry is a competitive market in all its aspects. The first part of the chapter outlined the four pillars of health care. This research will now move on the to examining the last of those pillars: affordable prices.
26 It must be noted at this point that the generic industry in India has invested in building up its own R&D
programme and has succeeded in developing their first NCE in 2001. Tschochohei (2001) argues that this is in line with the Product Life Cycle Theory of Vernon (1966), which states that young companies start of copying the market leaders since they are not able to invest in expensive R&D. Once having secured a market share the companies can further challenge the leaders in other area’s.

PILLAR FOUR – AFFORDABLE PRICES
Wewi/RuG 21
Chapter 3 Pillar four – affordable prices
This chapter will define the underlying model of drug prices. This will be done in paragraph 3.1. This model is a sort of blueprint and strives to clarify the way drug prices are built up. It focuses on factors, which influence the price level, both from inside the industry as from outside. Paragraph 3.2 will elaborate on the WTO TRIPS agreement. This agreement does grant the industry patents, but leaves some room to manoeuvre for the governments involved.
§ 3.1 Model of drug prices
The prices of drugs are influenced by many factors, both within the company which is putting it to market as by third parties like governments, local agents, health care personnel and such. The factors that influence the price most are given in table 1.
Table 1: model of prices of drugs
Factor Influential party
Direct costs & indirect cost of production27 Manufacturer Profit margin Manufacturer / TRIPS
Manufacturer’s selling price
Tariffs taxes Government Health care personnel Health policy Local agents and middlemen Health care system Distribution costs International aid Cost of containment, etc.
Market / retailer price
Table 1 shows the extent to which pharmaceutical industries can influence price. They calculate a cost price based on direct and indirect costs. The way these costs are calculated will be discussed further in chapter 4. On top of the cost price a profit margin will be calculated to form the basic price or manufacturer’s selling price of the product. Off patent drugs are entering a competitive market and will be getting a lower profit margin than patented drugs, which are entering a virtually monopolistic market. The profit margin is therefore influenced severely by the TRIPS agreement. In paragraph 3.2 the influence of TRIPS will be discussed more thoroughly. Once the manufacturer sells its drugs, the price level will be influenced further by the other costs named in table 1. Tariffs are still set by some developing countries in contrary to most OECD countries, which committed themselves to a zero-trade policy on pharmaceuticals. The influence of tariffs can be quite substantial, since they can mount up to 20 % of the manufacturers’ selling price.28 Besides tariffs, taxes
27 See paragraph 4.1 ev. 28 Report on the workshop on differential pricing and financing of essential drugs, WTO OMC, 2000.

TRANSPARENCY IN THE PHARMACEUTICAL INDUSTRY
Wewi/RuG 22
and local distribution costs are the reason prices are known to double once they finally reach the patient. The above is a producer approach to prices. A problem, which is closely related to price policy, but is more related to the consumer side, is the out-of-pocket payment for health care. This factor of health policy is another reason why drugs are so expensive in some developing countries. As the figure in annex 5 shows, the out-of-pocket payment is at a disturbing higher level in developing countries. Out-of-pocket payment, or payment at the time of treatment, is mainly caused by the fact that health care is often in private hands as can be seen in the figure in annex 6. The most common private finance mechanism is out-of-pocket payment, made at the time people seek care, rather than as a prepayment or insurance scheme, usually used by the public sector. Furthermore, the private sector is not a non-profit sector and therefore is charging higher prices for drugs and treatment, than the public sector would.29 One could also reason that privatising public sectors, the way it is done in Western Europe, might lead to a more efficient and cost effective sector. Yet, this argument does not seem to hold in the health care sector, as privatisation of health care will lead to lacking care for those who cannot afford it. The health care sector needs governmental interference. Although not further investigated in this research, the health care system is of importance to health care and the prices of drugs. As the health care systems have been recognised by the WTO and World Health Organisation (WHO), there should be put a lot of effort in improvement of these systems.
§ 3.2 Intellectual property rights and the WTO TRIPS agreement The WTO Trade Related Aspects of Intellectual Property Rights (TRIPS) allows for the protection of new inventions by granting patent rights. This section will elaborate on the provisions created by TRIPS and the way different parties interpret these provisions. A patent is a title that grants an exclusive right to manufacture and use of the invented product. Furthermore the patent gives the negative right to prevent others from producing, using, importing or selling the patented product without permission. Patents are not granted internationally, but are granted by each country individually. The TRIPS agreement, however, holds some rules to which WTO member states must comply30: 1. The member states must grant a patent to any new pharmaceutical, or pharmaceutical process, that
fulfils the criteria of novelty, inventiveness and usefulness, for a minimum period of 20 years. This implies that once TRIPS applies in a member state, the holder of the patent is able to defend his right by legal means. Not granting a patent by a member can result in sanctioning by the WTO.
29 WTO secretariat, More equitable pricing for essential drugs: What do we mean and what are the issues?,
background paper for the WTO WHO workshop on equitable pricing, Switzerland, 2001. 30 Velasquez, Bouket, Globalization and Access to Drugs: Implications of the WHO/TRIPS Agreement, World
Health Organization, Januari 1999, www.who.int.

PILLAR FOUR – AFFORDABLE PRICES
Wewi/RuG 23
2. Developing countries are allowed a transition period of 5 to 10/11 years to bring their national regulation in accordance with TRIPS. These transaction periods will end in 2000 and 2005/2006.
TRIPS does, however, give member states some freedom in modifying their regulations. Limited exceptions to the patent holder rights are allowed, given that these exceptions are limited, duly justified and not unreasonably affect the patent holder’s interest. Article 7 and 8 state the grounds for these exceptions: 1. Article 7: ‘the protection and enforcement of intellectual property should contribute to
[…] the transfer and dissemination of technology, to the mutual advantage of producers
and users […]. 2. Article 8: ‘members may […] adopt measures to protect public health and nutrition, and
to promote the public interest in sectors of vital importance to their socio-economic and
technological development […]. Appropriate measures […] may be needed to prevent
abuse of intellectual property rights by the right holders […]. So, if a patent holder does not comply with the obligations of article 7 or if member states feel public health is at stake, art. 31, a so-called ‘compulsory license’ can be granted to a local producer in order to gain access to a specific medicine. TRIPS does moreover, not prohibit imports from a country where the drugs are much cheaper. This is a result of the so-called ‘exhaustion of rights’, as described in art. 6. Once the patent holder has put its product on the market it loses the right over the actual product, while holding the exclusive right on the manufacturing and distribution. This allows member states to import a patented product from another country, where the patent holder already put the product to market. This is called parallel imports. Each member state can decide for itself whether or not to apply this principle of exhaustion of rights. It is argued that the exhaustion of patent rights should only be allowed when the patent holder has not been meeting local demands at reasonable prices.31 TRIPS is the reason why pharmaceutical innovators are so keen on finding new drugs. The agreement clearly provides a better regulation than the previous international agreements. The prospect of a 20-year monopoly position is very lucrative and so the pharmaceutical industry strives for patent rights on their discovered drugs. Still, TRIPS also gives member states some rights of protection of their position. Compulsory licenses can be granted and parallel imports can take place. In the court case in South Africa as discussed in the introduction, the South African government had incorporated TRIPS into national legislation, in a broad definition, which made it easier to issue a compulsory license. The pharmaceutical companies went to court, but gave in, in the end, because they were not sure about their chances of success.
31 Remiche B, ‘Les brevet pharmaceutiques dans les accords du GATT: l’enjeu?’, Revue Internationale de droit
Economique, 1996.

TRANSPARENCY IN THE PHARMACEUTICAL INDUSTRY
Wewi/RuG 24
TRIPS does not specifically name ground for granting compulsory licensing and the interpretation of the agreement has therefore lately been the issue of many discussions. For instance, the interpretation of TRIPS will be one of the main topics of the WTO Ministerial Conference in Doha, November 2001. During a preparatory meeting for the WTO Doha conference in Qatar, taking place in The Hague, Friday 12 October 2001, delegates from developing countries argued that all rules and regulations in TRIPS, which allow for broad interpretation, come with strings attached. A broad interpretation would imply that compulsory licences can be issued quite easily and on many different grounds. For instance, one might be issued as a precautionary measure for warding of a possible future health crisis. The advocates of the pharmaceutical industry, usually the USA, Canada and Switzerland, are defending a narrow interpretation of the agreement.32 A narrow interpretation would be very strict. Only in case of extreme emergency, after all other options have been tried a compulsory license may be issued. A broad interpretation would surely restrain the power of the pharmaceutical industry, while a narrow interpretation would enforce their position. Summarising, one can say that prices can be influenced by many factors. From outside there are numerous. Tariffs, taxes, government health policy, international aid and more have been named in the first paragraph of this chapter. This paragraph did not strive to be complete, but merely to name the most important factors. For the pharmaceutical industry there are two factors of policy that influence the price. One is the TRIPS agreement discussed in the last paragraph, which allows pharmaceutical companies to apply for patents, thus enabling the industry to set their prices at monopolistic levels. The second is the calculation of cost prices, discussed briefly in paragraph 3.1. The next chapter and the rest of this research will more closely investigate the role and ways of calculating cost prices for drugs.
32 The author was present at the meeting: A TRIPS Agenda for development: Meeting food, health and
biodiversity needs, organised by The Netherlands Ministry for Foreign Affairs and The Quaker United nations Office Geneva on 12 October 2001, The Hague.
THEORETICAL CONCEPT OF COST PRICE CALCULATION
Wewi/RuG 25
Chapter 4: Theoretical concept of cost price calculation This chapter introduces and discuss a range of theoretical concepts on cost-price calculation. Paragraph 4.1 discusses the concept of indirect cost allocation and allocation of specific indirect costs in the pharmaceutical industry. Paragraph 4.2 discusses different methods of cost calculation and some applications for the pharmaceutical industry.
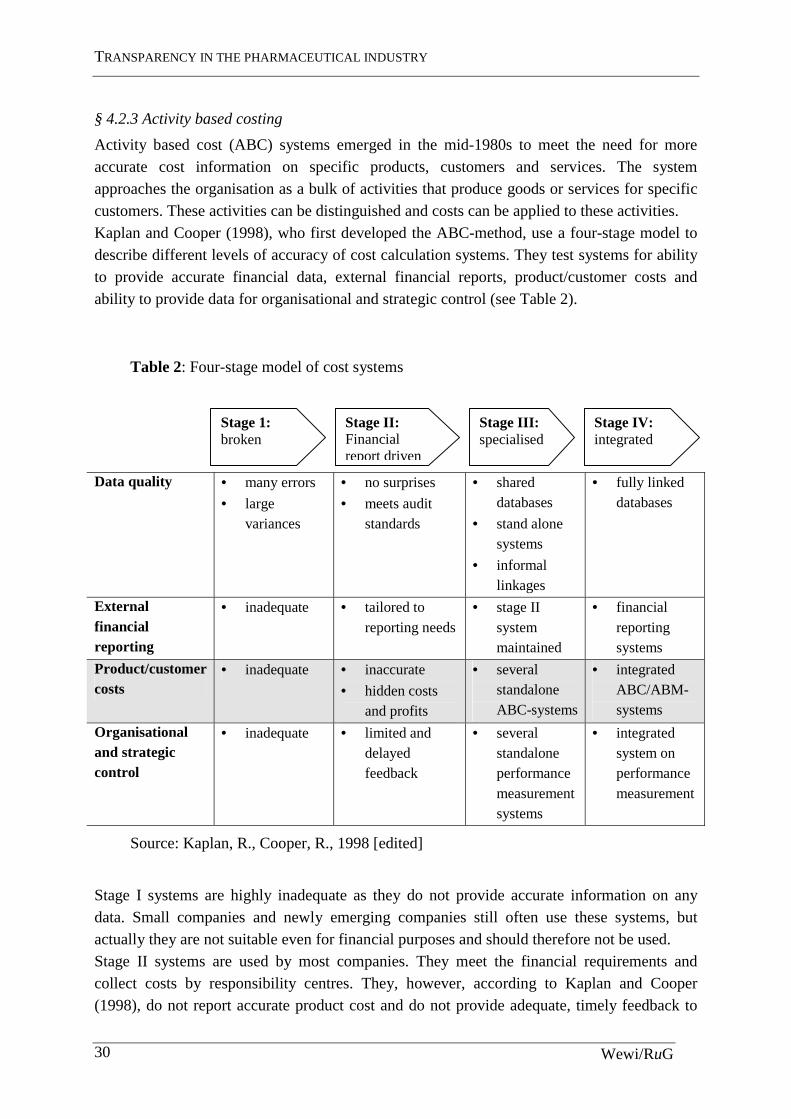
§ 4.1 The allocation of indirect costs As any other industry the pharmaceutical industry has to deal with the allocation of indirect costs. Annex 7 shows the relative importance of different types of costs in the cost structure of some pharmaceutical companies. The percentages named here are based on 1989 figures. In figure 3, an overview of the most important costs in the industry is given and whether or not they are usually mentioned in financial statements. The figure highlights the difficulty in analysing financial statements of pharmaceutical companies. Large indirect cost pools like sales, administration and marketing costs are usually grouped together under the header ‘selling, general and administrative expenses’ or ‘marketing and administrative expenses’. This makes the financial statements very non-transparent and one can only estimate the actual costs involved in, for example, marketing. But also the other costs named in figure 3 under the heading ‘selling, general and administrative expenses’ are non-traceable and one can only estimate them.

TRANSPARENCY IN THE PHARMACEUTICAL INDUSTRY
Wewi/RuG 26
Mentioned in FS*
Sales / turnover X
Direct costs: X
Cost of material X Cost of direct labour X
Indirect costs:
Distribution costs
Marketing and administration expenses/ Selling, general and administrative expenses:
X
Management costs
Costs of local agents
Registration costs
Sponsoring of (educational) projects
Legal costs
Supporting staff (ex. Administration)
R & D X
Figure 3: overview of typical direct and indirect costs for the pharmaceutical industry. *The last column mentions whether or not they are named in the regular financial statements of the industry.
What can be said about the costs of the pharmaceutical industry is that they are for a major part indirect. The two major indirect cost pools are R&D and marketing expenses. The innovative pharmaceutical industry is spending much of their resources, both absolute and relative to other industries, on R&D of new pharmaceutical products. Recent studies indicate a spending of 15 % of global sales on R&D, amounting up to $30 billion, compared to $26 billion in the public sector (universities and government projects).33 They also indicate a still rising trend in R&D-spending of approximately 10 % (of R&D spending) a year.34 As said before, it is hard to estimate the exact expenditures on marketing, but the figures clearly indicate massive expenditures. Annex 7 indicates expenses between 20 % and 37 %; new figures are even higher. For example, Pfizer spend 39,2 % of 1999’s sales on marketing and administration, and Pharmacia-Upjohn equals that figure.35 At first sight the costs mentioned above appear to be indirect and cannot be allocated to a specific product. They are made for the benefit of the complete product range. When one, however, takes a closer look at these costs it is possible to further specify them, giving them a
33 Lee, K., ‘Strengthening governance for global health research: the countries that most need health research
should decide what should be funded’, British Medical Journal, 30 September 2000. 34 U.S. Congress, Office of Technology Assessment, Pharmaceutical R&D: costs, risks and rewards, U.S.
Government Printing Office, February 1993. 35 M. Angell, ‘Aan wie is de farmaceutische industrie verantwoording verschuldigd?’, Geneesmiddelenbulletin,
issue 2, feb. 2001, pp. 13-24.

THEORETICAL CONCEPT OF COST PRICE CALCULATION
Wewi/RuG 27
more direct instead of indirect character. R&D-related costs can be often allocated to the drug that comes out of the research-pipeline and makes it to the market. Marketing costs are made for a specific product or brand, or for a certain region. In the context of this research it is important to understand this principle since it might explain why drugs should be sold at a lower cost price-level in the developing world. To be more precise: it seems that, when the industry strives for accurate and just cost prices of their products, R&D-related costs and marketing costs are but a small part of the cost price of drugs in developing countries. Most marketing costs are made for the developed countries since they have the purchasing power and liberty to choose between brands and most R&D is done after western diseases.36 The calculation of cost prices will be the subject of the rest of this paper. As said before, this chapter elaborates on some theoretical approaches to calculating cost prices. In paragraph 4.2 the following methods are described: standard costing, life cycle costing, activity based costing and kaizen and target costing. The reason for choosing these methods is due to their usefulness in dealing with the specific pharmaceutical characteristics on the one hand (life cycle costing, activity based costing, target & kaizen costing) and their widespread use on the other hand (standard costing). After having described the use of the methods, paragraph 4.3 continues with an application of the theory to reality. In chapter 5 the results of a survey concerning the actual use of the described methods will be presented.
§ 4.2 Cost calculation methods
§4.2.1 Standard costing
Standard costing is a relatively simple method for calculating the cost price of products. It is most suitable in organisations whose activities are very standardised. Most manufacturing companies with repetitive production processes find this method adequate. It is a lot harder to apply this method to organisations with a non-repetitive production process. The basic principle of this method is to set a standard cost for direct costs (materials and labour) and a standard for indirect costs (overhead). There are basically two approaches to set standards for direct costs. One is to look at historic figures; the other is to perform so called engineering studies. The first approach traces historical records to set material and labour standards based on historical averages. The problem with this approach is that historical figures include historical inefficiencies. When done properly this method should eliminate inefficiencies in labour and material usage by tightening the budgets by incorporating a percentage deficiency. The second approach uses specific studies of the operation processes to gain insight in the actual labour and material usage of different processes. The process is also closely observed and controlled. The downside of this approach is that it is costly and takes a lot of time.
36 The Global Forum for Health Research estimates that less than 10 % of research funds are spent on the
diseases that account for 90 % of the global burden of disease. (Lee, K., ‘Strengthening governance for global health research: the countries that most need health research should decide what should be funded’, British Medical Journal, 30 September 2000, pp. 775-6).

TRANSPARENCY IN THE PHARMACEUTICAL INDUSTRY
Wewi/RuG 28
Lauderman and Schaeberle (1983) showed that in the US 43 % of the larger companies used historical data, while 67 % used engineering studies. Some used a combination of both.37 For indirect costs other approaches are needed. Indirect costs can be split into variable overhead, costs that are not directly related to the cost object, but which do vary with activity (e.g. electricity use), and fixed overhead, which do not vary with activity (e.g. rent). Usually variable overhead rates are estimated based on historical relationships between changes in overhead costs and activity. These rates usually are linked to machine hours or labour hours. Fixed overhead rates are usually budgeted for a certain period, charged to a certain cost centre and then divided over all cost objects or products. The basic standard cost system appears as in figure 4.
Figure 4: overview of the standard cost system
Source: Kaplan, R., Cooper, R., 1998
37 Lauderman, Schaeberle, ‘The cost accounting practices of firms using standard costs’, Cost and Management
accounting, Issue 4, 1983.

THEORETICAL CONCEPT OF COST PRICE CALCULATION
Wewi/RuG 29
§ 4.2.2 Life-cycle costing
The life-cycle costing method focuses on the importance of the initial phases of the production process. Life cycle costing (LCC) establishes all costs that will be made in the life cycle of the product. This method focuses on future cost control.38 In the fist phase in LCC is the product creation process. In the pharmaceutical industry all innovation expenses (R&D) are made in this phase. In this phase a customer requirement specification is to be created in order to be able to optimally serve the needs of the market. This specification indicates the needs and wishes of customers and strives to create a product that will optimally serve the customer. Once the technical specifications of a product are defined a target costing method (see: paragraph 4.2.4) can be used to establish a cost price. The second phase in LCC is the actual product life cycle. Here the classical phases ‘introduction’, ‘expansion’, ‘satisfaction’ and ‘retrieval’ are taken into account. In the introduction phase the product is introduced to the market. This phase is associated with low volume, innovative customers, little competition and little growth. The product will show fast growth in the expansion phase. Furthermore this phase is associated with higher volume, ‘early adopting’ customers and increasing competition. The satisfaction phase is characterised by little growth, high volume, solid customer base and full competition. The retrieval phase finally indicates the downfall of the product. It shows decreasing volume, decreasing customer base and decreasing competition. Two important factors in this LCC-phase are ‘time to market’ (TTM) and ‘time to volume’ (TTV). TTM attends the question when to approach the market with a new product (introduction phase). There are four determinants to answer this question namely: 1. product performance; 2. cost per product; 3. costs of development; 4. introduction date. These determinants interact with each other to determine the optimal release date. In paragraph 4.3 few of these interactions for the pharmaceutical industry will be discussed. TTV tends the question of how long it will take to get production to the required level (expansion phase). If the product is successful, the logistics and production must keep up with the increasing demand for the product.
In the latter stages of the product life cycle (satisfaction phase and retrieval phase) the kaizen costing method (see: paragraph 4.2.4) can be used to control and decrease costs.
38 Tilleman, K., van der Wal, H., ‘Life Cycle Costing en Management’, Praktijkboek financieel management,
september 2000.
TRANSPARENCY IN THE PHARMACEUTICAL INDUSTRY
Wewi/RuG 30
Stage IV: integrated
§ 4.2.3 Activity based costing
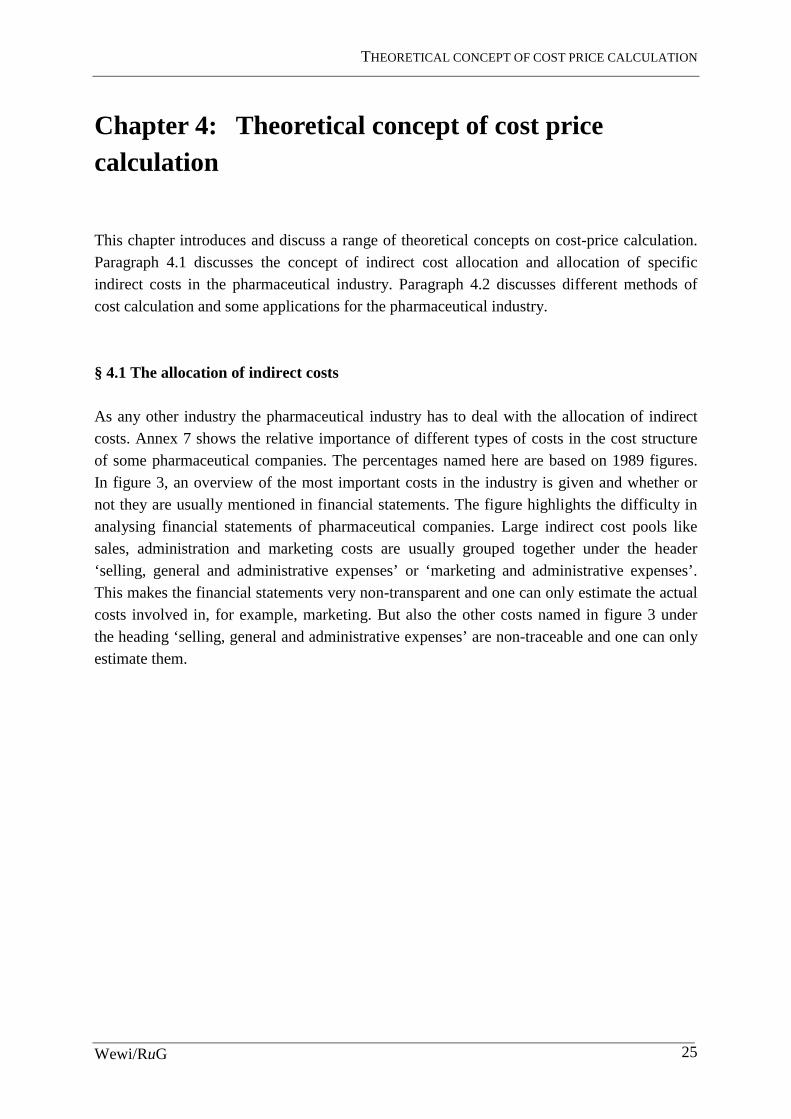
Activity based cost (ABC) systems emerged in the mid-1980s to meet the need for more accurate cost information on specific products, customers and services. The system approaches the organisation as a bulk of activities that produce goods or services for specific customers. These activities can be distinguished and costs can be applied to these activities. Kaplan and Cooper (1998), who first developed the ABC-method, use a four-stage model to describe different levels of accuracy of cost calculation systems. They test systems for ability to provide accurate financial data, external financial reports, product/customer costs and ability to provide data for organisational and strategic control (see Table 2).
Table 2: Four-stage model of cost systems
Data quality • many errors
• large variances
• no surprises
• meets audit standards
• shared databases
• stand alone systems
• informal linkages
• fully linked databases
External financial reporting
• inadequate • tailored to reporting needs
• stage II system maintained
• financial reporting systems
Product/customer costs
• inadequate • inaccurate
• hidden costs and profits
• several standalone ABC-systems
• integrated ABC/ABM-systems
Organisational and strategic control
• inadequate • limited and delayed feedback
• several standalone performance measurement systems
• integrated system on performance measurement
Source: Kaplan, R., Cooper, R., 1998 [edited]
Stage I systems are highly inadequate as they do not provide accurate information on any data. Small companies and newly emerging companies still often use these systems, but actually they are not suitable even for financial purposes and should therefore not be used. Stage II systems are used by most companies. They meet the financial requirements and collect costs by responsibility centres. They, however, according to Kaplan and Cooper (1998), do not report accurate product cost and do not provide adequate, timely feedback to
Stage 1: broken
Stage II: Financial report driven
Stage III: specialised

THEORETICAL CONCEPT OF COST PRICE CALCULATION
Wewi/RuG 31
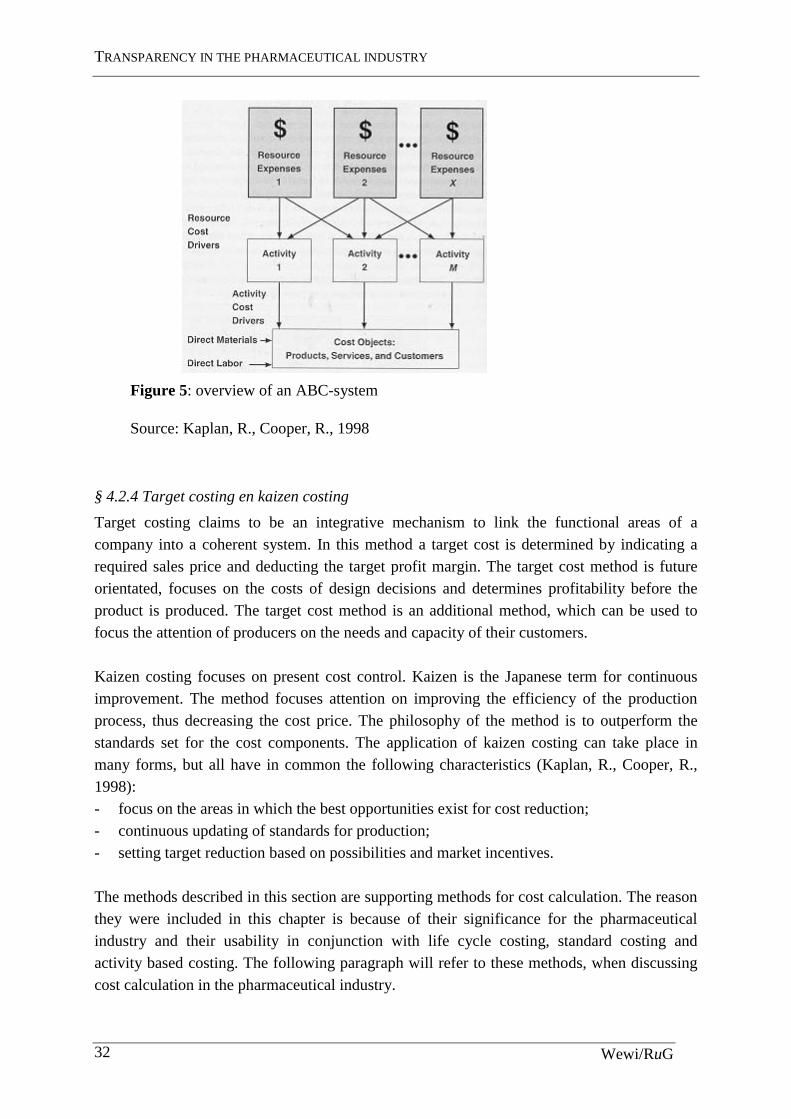
managers and employees. The standard cost system described above is marked as a stage II system. Stage III systems do provide more accurate information. They use ABC systems to collect data from the regular financial system and in combination with other information use that data to provide more accurate information on costs of activities, processes and products. They furthermore provide timely and accurate, both financial and non-financial information to managers and employees. Stage IV systems combine ABC systems and operational feedback thus forming an enterprise wide system, which distributes the right information at the right time to the right people. This study focuses on the differences between stage II systems (standard costs) and stage III systems (ABC-systems) and will furthermore concentrate on the third line from table 1, the costs of products and the costs and profits of customers, since these aspects are most interesting for the subject. For direct, variable costs the ABC-systems use the same methods as the standard cost systems. They set standards and directly allocate these costs to cost objects. The main difference is the allocation of indirect, overhead costs. The ABC-systems do, as pointed out above, apply costs to activities. To do this an organisation should first determine activities that take place in the organisation and create an activity dictionary in which all the activities are listed. These activities can vary from scheduling production orders to introduce new
products. When the organisation has composed a set of activities, which define every major activity in the organisation, it must determine how much the organisation is spending on each of these activities. To do this resource cost drivers must be selected to link expenses to activities. The next step is to determine the organisation’s products, services and customers. This might seem simple, but this step determines why the organisation is performing the determined activities and to what purpose the organisation is working. The last step is to select activity cost drivers that link activity cost to the selected products, services and customers. To perform this last step a choice must be made between transaction drivers, which are the least expensive drivers but also the least accurate, duration drivers, which calculate the time used to perform an activity and intensity drivers, which charge the resources to each time an activity is performed. In figure 5, an overview of the activity based costing system is shown. However seeming identical to the standard cost schedule, the above has shown that it uses a very different approach to allocate indirect costs to products.
TRANSPARENCY IN THE PHARMACEUTICAL INDUSTRY
Wewi/RuG 32
Figure 5: overview of an ABC-system
Source: Kaplan, R., Cooper, R., 1998
§ 4.2.4 Target costing en kaizen costing
Target costing claims to be an integrative mechanism to link the functional areas of a company into a coherent system. In this method a target cost is determined by indicating a required sales price and deducting the target profit margin. The target cost method is future orientated, focuses on the costs of design decisions and determines profitability before the product is produced. The target cost method is an additional method, which can be used to focus the attention of producers on the needs and capacity of their customers. Kaizen costing focuses on present cost control. Kaizen is the Japanese term for continuous improvement. The method focuses attention on improving the efficiency of the production process, thus decreasing the cost price. The philosophy of the method is to outperform the standards set for the cost components. The application of kaizen costing can take place in many forms, but all have in common the following characteristics (Kaplan, R., Cooper, R., 1998): - focus on the areas in which the best opportunities exist for cost reduction; - continuous updating of standards for production; - setting target reduction based on possibilities and market incentives. The methods described in this section are supporting methods for cost calculation. The reason they were included in this chapter is because of their significance for the pharmaceutical industry and their usability in conjunction with life cycle costing, standard costing and activity based costing. The following paragraph will refer to these methods, when discussing cost calculation in the pharmaceutical industry.

THEORETICAL CONCEPT OF COST PRICE CALCULATION
Wewi/RuG 33
§ 4.3 Application of the theory to the pharmaceutical industry The standard cost systems are not optimal for dealing with the characteristics of the pharmaceutical industry. They have two major limitations. First, they do not report on actual costs of processes and products. Second, they do not provide sufficient information to control costs and monitor efficiency. As said before the focus will be on the first limitation and leave the second for further research. The standard costs system does identify the short-term variable costs. They separate between fixed and variable costs and therefore facilitate short-term cost control. They do however not capture other costs related to design and development or marketing and selling accurately. Furthermore, these systems treat many expenses as fixed or periodic expenses, while those expenses, in fact, do vary with volume or other conditions. For the pharmaceutical industry this implies that cost prices are not as accurate as they could be. R&D and marketing costs are not allocated optimally. Defining different markets could lead to better allocation of marketing costs and a more accurate cost price. With regards to R&D-expenses such segmentation is harder to implement is these systems. Life cycle costing can enrich the standard cost systems by adding a focus on the customer and the cost of drug development. Regarding the differences between the market for developing countries and the market for developed countries, LCC can change the way in which pharmaceutical companies approach these markets. Understanding the capacity of customers helps developing solutions for these customers. Low-budget drug packages, e.g. HIV/AIDS cocktails, are suitable for the developing countries and in that way these markets can become profitable. Target costing methods should be used to determine the target price that can be set for these countries. The philosophy behind this method is extremely suitable for the developing world market. By making an assessment of the buying power and wishes of the consumers in these market the industry can determine the target price, target cost and assess of the amount of R&D they can use for this market. Both innovative and generic producers could furthermore apply the principle of kaizen costing to reduce the direct cost and indirect cost of producing drugs, thus increasing their profits in both the developing as the developed market. ABC systems focus on activities rather than responsibility centres, traces costs of using resources, rather than supplying resources and uses a richer set of cost drivers to more accurately show the effects of complex production for assigning costs to cost objects. In stead of abandoning the standard cost system, the ABC systems enriches the standard cost system to provide a more accurate cost price. The philosophy of the ABC-system is very simple. If one deploys activities towards certain products or groups of products, customers or groups of customers, than charge those products and customers for the costs related to that activity. For the pharmaceutical industry this might have some far-reaching consequences. If a certain drug is produced for a certain group of customers, the R&D costs and the selling and marketing costs will not only be charged to the created drug, but to the purposed group of customers. If, for some reason, the drug will also be fit to serve another group of customers, in another
TRANSPARENCY IN THE PHARMACEUTICAL INDUSTRY
Wewi/RuG 34
region, not only the marketing expenses should not be charged to that group, but one might reason that also the R&D costs should not be charged to these customers, as they were not part of the purposed group. In other words: is it correct that customers in developing countries pay for the R&D-costs, or marketing costs for that matter, of a product that was never designed for the market of developing countries? From an ABC point of view, the answer to this question should be ‘no’, evidently. Developing countries should not be charged with these costs. They should be charged with a cost price that is accurate and just and not most favourable. ABC provides the tools to construct a more accurate cost price. R&D and marketing costs are charged to the consumers for whom they are made. This would leave the developing world with a situation of ‘natural’ price differentiation, not a political decision but a company decision based on accurate information and accurate allocation of indirect costs. Given the characteristics of the industry (highly innovative and high indirect costs) one should expect ABC to have gained ground on more traditional cost price methods like standard costing. In the next chapter the use of methods in practice will be investigated.

FIELD SURVEY: COST-PRICE METHODS USED IN THE PHARMACEUTICAL INDUSTRY
Wewi/RuG 35
Chapter 5 Field survey: cost-price methods used in the pharmaceutical industry
§ 5.1 Introduction to the survey The theory discussed in the last chapter might provide a part of solution for unfair prices in developing countries. The pharmaceutical industry can calculate cost prices accurately using the right techniques. Large indirect cost pools like R&D and marketing expenses can be allocated to the cost object for which they were done. But is the theoretical best method used in practice? To test this, a survey amongst international pharmaceutical companies was carried out. The survey tried to answer the questions of familiarity with the techniques described in the chapter above, the actual use of the techniques in practice and the allocation of indirect costs.
§ 5.2 Research specifics The population of respondents The population about which this survey wanted to make generalised comments is the international pharmaceutical industry in general, including both generic and innovative producers.
The operational population The focus was put on the international and national manufacturers that were producing HIV/AIDS drugs, still both generic and innovative.
The selection of respondents The selection of 36 respondents was based on information about the producers of HIV/AIDS drugs from a report by a joint UNICEF, UNAIDS Secretariat, WHO/HTP, MSF project.39 This report was, amongst other things, about manufacturing antiretrovirals and in this report pharmaceutical companies that provided these drugs were named. These 36 respondents were deemed to be a good representation of the whole industry. They were addressed by e-mail. In total 36 different producers were addressed of which 11 were generic and 25 were innovative producers. Another selection was made from these 36 respondents. Those who did have a division in the Netherlands were selected to be contacted by telephone to increase the response. 13 of the selection did have such a division.
39 UNICEF, UNAIDS Secretariat, WHO/HTP, MSF, Sources and prices of selected drugs and diagnostics for
people living with HIV/AIDS, May 2001.
TRANSPARENCY IN THE PHARMACEUTICAL INDUSTRY
Wewi/RuG 36
The people who did respond were working as members of the financial staff of the Dutch division of their company. For Pharmacia-Upjohn this was the Management Accountant, for GlaxoSmithKline it was the chief accountant, for Centrafarm and for Abbott this were the heads of the financial department.
Method of data acquirement After the selection of 36 producers was made, these producers were first addressed by e-mail. In the e-mail they were asked to co-operate with a research done by the author concerning familiarity with and use of known cost price calculation methods in the pharmaceutical industry. Attached to the e-mail were the survey questions. From this round only 1 positive response came back. The 13 producers with a Dutch division were then contacted by telephone. Five reacted positively, of those 3 were sent an e-mail and 2 were sent a letter that included the survey questions. Those who had not responded to the first e-mail by the end of July, excluding the companies contacted by telephone, were sent another e-mail, reinforcing the request to co-operate. This was a group of 22 companies. Those who did not respond to the second e-mail, in case 20 respondents, were considered to be non-respondents. In annex 9 an overview of the respondents is given. To verify the information provided by the respondents, the financial statements were reviewed. However, these did not reveal any information on cost price calculation.
Declaration for the non-response In total 16 companies (44.4 % of total) did respond both positively and negatively. Unfortunately, once the survey was received, most respondents did not want to participate. In the end only 4 companies (Pharmacia-Upjohn, GlaxoSmithKline, Centrafarm and Abbott) (11 % of total) reacted positively, meaning they answered the questions and returned the form. The other 12 (33 % of total) were not willing or able to participate. The reason why 20 respondents did not react at all remains unclear. The 12 companies who responded negatively gave the following reasons: - lack of time due to holidays and work pressure. This argument cannot hold for the
questionnaire sec, as the survey would take probably 5 minutes to fill in and was held very comprehensible on purpose.
- there were questions regarded as confidential information. This argument probably says more about the sensitivity of the subject than about the actual questions. It feeds the suspicion that the industry does not likely reveal its ways. The questions were directed at use of and familiarity with methods and not at confidential policy decisions.
- no interest in participating, without further argumentation. ‘t Hart in his book ‘Onderzoeksmethoden’ (trans. ‘research methods’) recalls the analysis of De Leeuw (1992) and Swanborn (1991) about non-response. They estimates the average response to a survey by post at 66 % (De Leeuw, 1992) and 40-80 % (Swanborn, 1991). Response to telephonic surveys was on average 66 % (De Leeuw, 1991) and 80 %

FIELD SURVEY: COST-PRICE METHODS USED IN THE PHARMACEUTICAL INDUSTRY
Wewi/RuG 37
(Swanborn, 1991). Taking these figures into account, a response of 44.4 % on the e-mail survey, a medium that is relatively new for doing research, was within the estimates of Swanborn for postal surveys. If, however, the negative responses are taken into account, the response drops to 11 %, which is low according to all standards. The low response to this survey is likely to be a combination of factors. First, the medium
e-mail has proven not to be ideal for contacting respondents. Although it is fast and easy to reach companies world-wide this way, e-mails might get stuck in mailboxes or be treated as junk mail or simply be ignored. The response to telephone-calls proved to be significantly higher and should have been used more intensively. Second the pharmaceutical industry seems to be over-sensitive on the subject.
Time-span This survey was done in July and August of 2001. During this period the respondents were addressed. The first round of e-mails was sent between July 3 and July 14, the second round of e-mails was sent between August 6 and August 10, to the respondents who had not respondents until that day. In August the non-respondents, who did have a division in The Netherlands, were contacted by telephone.
Survey-questions The survey consisted of a number of questions concerning familiarity with different techniques, actual usage of different techniques, the way of allocating marketing costs and the way of allocating R&D costs. In annex 8 the survey questions are listed. The questions were formulated to gain insight in the policy of the company, globally. Question 1 asks about the familiarity with the techniques described above. Although the ‘product centre method’ is listed here, it is not discussed in this chapter 4, since it is a Dutch method with is in many ways similar to the ABC method. It was decided not to include the method any further, for the additional value of this method for this research was not significant. Question 2 asks what method the respondents actually use. This is the most interesting question since it gives insight in the industry. Question 3 was added because there was on forehand some worry about the amount of response. If the respondents were aware of the regular method used by the industry this would give a better view of the industries’ used method. Question 4 and 5 were taken in as indicators for the allocation of indirect costs. Because the choice of method used for cost price calculation leaves some room to manoeuvre in allocation of indirect costs, these questions could clarify exact choices. If, for example, a manufacturer would allocate the costs of marketing efforts to single products or group of products, but not to regions it would mean the indirect costs are subjective to further specification to cost objects. The answers given would give a basic idea of the correct allocation of the indirect costs. Both theoretically and politically, one would expect the respondents to pick the last answers, since they are the most just ones. Question 6 is taken in to make sure the answers are given in a global context, not a national one. Question 7 leaves room for the respondents to give their views on their choice of method.
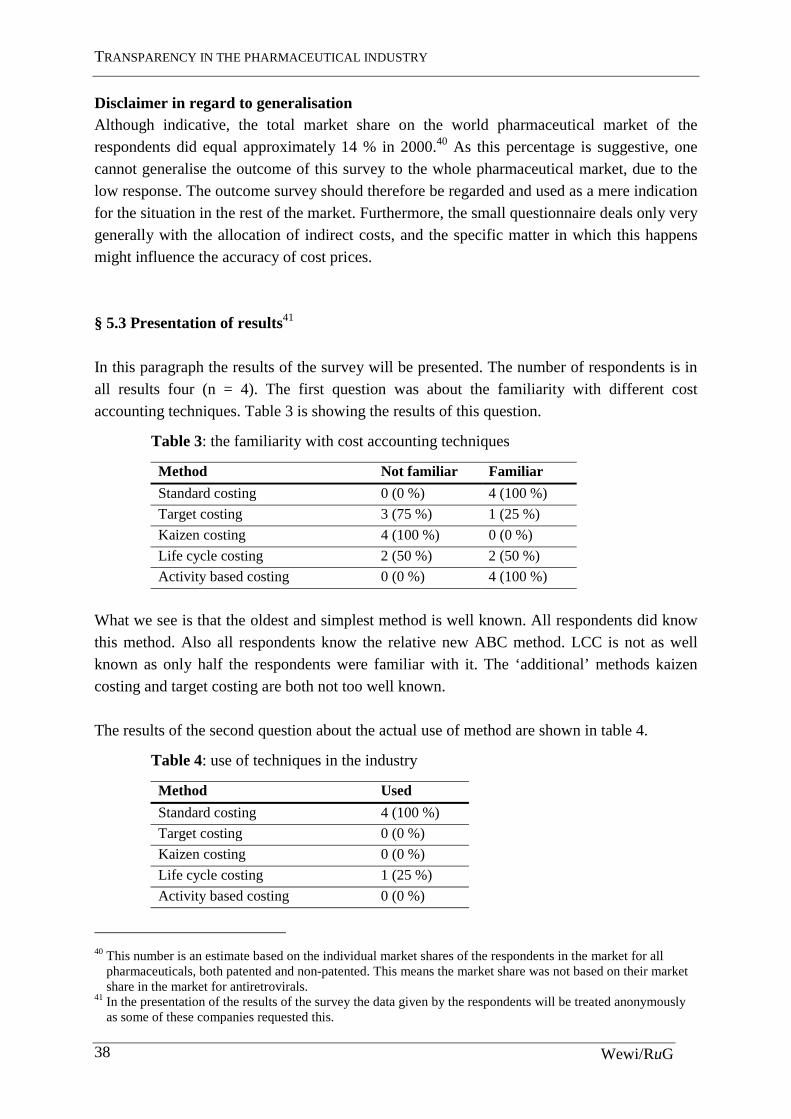
TRANSPARENCY IN THE PHARMACEUTICAL INDUSTRY
Wewi/RuG 38
Disclaimer in regard to generalisation Although indicative, the total market share on the world pharmaceutical market of the respondents did equal approximately 14 % in 2000.40 As this percentage is suggestive, one cannot generalise the outcome of this survey to the whole pharmaceutical market, due to the low response. The outcome survey should therefore be regarded and used as a mere indication for the situation in the rest of the market. Furthermore, the small questionnaire deals only very generally with the allocation of indirect costs, and the specific matter in which this happens might influence the accuracy of cost prices. § 5.3 Presentation of results41 In this paragraph the results of the survey will be presented. The number of respondents is in all results four (n = 4). The first question was about the familiarity with different cost accounting techniques. Table 3 is showing the results of this question.
Table 3: the familiarity with cost accounting techniques
Method Not familiar Familiar
Standard costing 0 (0 %) 4 (100 %)
Target costing 3 (75 %) 1 (25 %)
Kaizen costing 4 (100 %) 0 (0 %)
Life cycle costing 2 (50 %) 2 (50 %)
Activity based costing 0 (0 %) 4 (100 %)
What we see is that the oldest and simplest method is well known. All respondents did know this method. Also all respondents know the relative new ABC method. LCC is not as well known as only half the respondents were familiar with it. The ‘additional’ methods kaizen costing and target costing are both not too well known. The results of the second question about the actual use of method are shown in table 4.
Table 4: use of techniques in the industry
Method Used
Standard costing 4 (100 %)
Target costing 0 (0 %)
Kaizen costing 0 (0 %)
Life cycle costing 1 (25 %)
Activity based costing 0 (0 %)
40 This number is an estimate based on the individual market shares of the respondents in the market for all
pharmaceuticals, both patented and non-patented. This means the market share was not based on their market share in the market for antiretrovirals.
41 In the presentation of the results of the survey the data given by the respondents will be treated anonymously as some of these companies requested this.
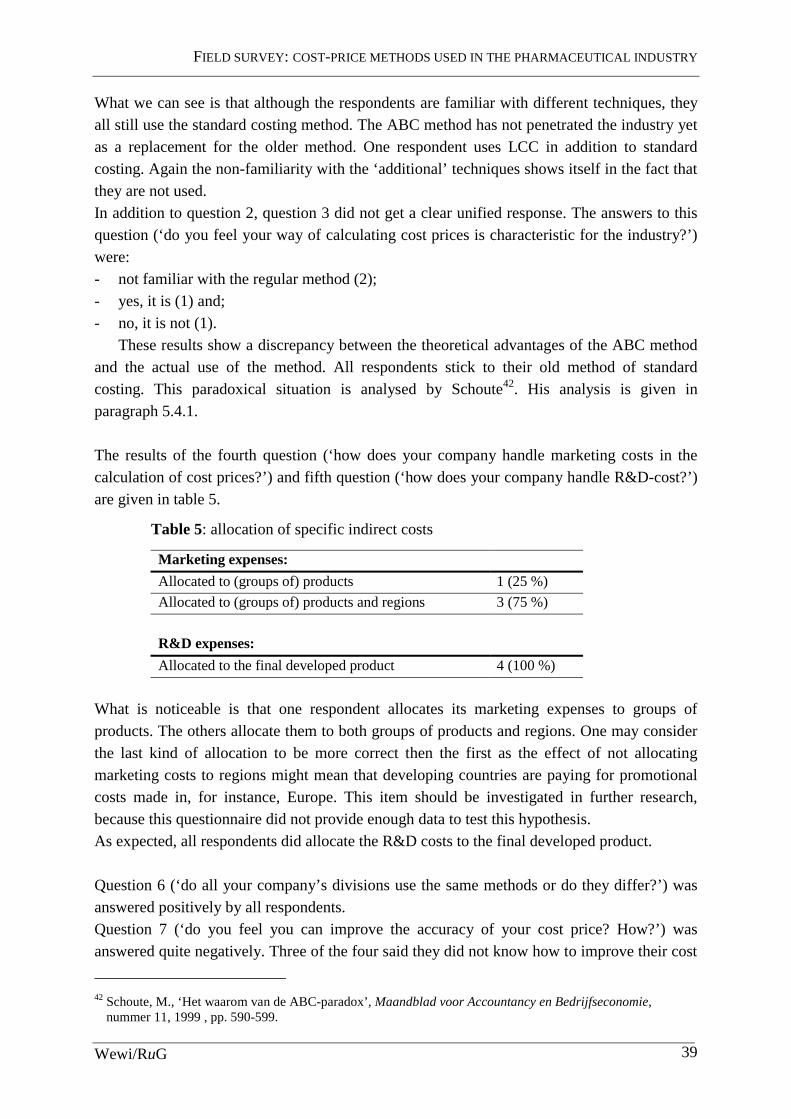
FIELD SURVEY: COST-PRICE METHODS USED IN THE PHARMACEUTICAL INDUSTRY
Wewi/RuG 39
What we can see is that although the respondents are familiar with different techniques, they all still use the standard costing method. The ABC method has not penetrated the industry yet as a replacement for the older method. One respondent uses LCC in addition to standard costing. Again the non-familiarity with the ‘additional’ techniques shows itself in the fact that they are not used. In addition to question 2, question 3 did not get a clear unified response. The answers to this question (‘do you feel your way of calculating cost prices is characteristic for the industry?’) were: - not familiar with the regular method (2); - yes, it is (1) and; - no, it is not (1).
These results show a discrepancy between the theoretical advantages of the ABC method and the actual use of the method. All respondents stick to their old method of standard costing. This paradoxical situation is analysed by Schoute42. His analysis is given in paragraph 5.4.1. The results of the fourth question (‘how does your company handle marketing costs in the calculation of cost prices?’) and fifth question (‘how does your company handle R&D-cost?’) are given in table 5.
Table 5: allocation of specific indirect costs
Marketing expenses:
Allocated to (groups of) products 1 (25 %)
Allocated to (groups of) products and regions 3 (75 %)
R&D expenses:
Allocated to the final developed product 4 (100 %)
What is noticeable is that one respondent allocates its marketing expenses to groups of products. The others allocate them to both groups of products and regions. One may consider the last kind of allocation to be more correct then the first as the effect of not allocating marketing costs to regions might mean that developing countries are paying for promotional costs made in, for instance, Europe. This item should be investigated in further research, because this questionnaire did not provide enough data to test this hypothesis. As expected, all respondents did allocate the R&D costs to the final developed product. Question 6 (‘do all your company’s divisions use the same methods or do they differ?’) was answered positively by all respondents. Question 7 (‘do you feel you can improve the accuracy of your cost price? How?’) was answered quite negatively. Three of the four said they did not know how to improve their cost
42 Schoute, M., ‘Het waarom van de ABC-paradox’, Maandblad voor Accountancy en Bedrijfseconomie,
nummer 11, 1999 , pp. 590-599.

TRANSPARENCY IN THE PHARMACEUTICAL INDUSTRY
Wewi/RuG 40
price calculation and the last said it might take in more variables without specifying those. The fact that the respondents do not think they can improve the calculation of their cost price, while being familiar with a more accurate method like ABC is also quite paradoxical.
§ 5.4 Conclusions from the results Summarising the results from this survey one can say that the pharmaceutical industry is still using the standard costing method for calculating the cost price, while being familiar with the theoretical better ABC method. This paradoxical situation is analysed below. Yet, some reservations must be stated. The response was low and question 3 did not provide more knowledge of the regular method used in the industry. It is therefore hard to conclude that the industry is en masse using a non-accurate method. Still, as said before, some of the giants in the industry participated in the survey and one should expect them to be using the method generally used in the pharmaceutical industry. The fact remains that the respondents are capable of calculating a more accurate cost price, using a more accurate mechanism like ABC. Furthermore, one of the respondents is capable of better allocation of marketing costs even without changing to ABC. Marketing costs are best allocated to regions, because they are made for certain regions and thus certain consumers. It seems very sensible to do this. Let us now take a closer look at why the ABC method is not used more frequently.
§ 5.4.1 The ABC-paradox
The development and use of ABC-systems in practice is not as high as one should expect from the theoretical advantages the method promises. In the literature this paradoxical situation is known as the ABC-paradox. Schoute (1999) analyses this situation43. Theory provides three factors, which are of influence on potential use of ABC. These are familiarity with the method, contextual factors and economic feasibility of implementation. Regarding familiarity the potential users of ABC can be separated in three categories. In the first category are companies that are not familiar with ABC. The second holds companies that are familiar, but have not (yet) implemented ABC. The third category contains companies that have implemented ABC or are implementing it. The pharmaceutical industry, considering the outcome of the survey seems to be in the second category. The ABC-method is more suitable and has a higher chance of successful implementation if the companies are faced with the following contextual factors: - Cost structure. Companies with higher indirect costs are more suitable. Bjørnenak (1997)
has investigated this theoretical assumption and in reality the ABC adopters do have a significant higher percentage indirect costs44. The pharmaceutical industry is faced with high indirect costs of marketing and R&D.
43 Schoute, M., ‘Het waarom van de ABC-paradox’, 1999, pp. 590-599. 44 Bjørnenak, T., ‘Diffusion and accounting: the case of ABC in Norway’, Management Accounting Research, Vol. 8, pp. 3-17.

FIELD SURVEY: COST-PRICE METHODS USED IN THE PHARMACEUTICAL INDUSTRY
Wewi/RuG 41
- Product diversity. High product diversity was assumed to positively influence the adoption of ABC, but the Bjørnenak study showed in reality this assumption did not hold. ABC adopters did not have a significantly higher diversity. The pharmaceutical industry does have high product diversity, but the results of Bjørnenak show the indifference of this characteristic.
- Competition. High competition is assumed to have a positive effect. As shown in chapter one, the pharmaceutical industry has both highly competitive, as well as oligopolistic/monopolistic aspects. On this assumption the industry is therefore also indifferent.
The economic feasibility is depending on a cost – benefit analysis, the cost of implementation should not exceed the benefit of more accurate information, accurateness of the information provided by the system, design of the ABC-system and social acceptance. The factors of economic feasibility has not been investigated in this study, for they represent the management accounting aspect of ABC, while the focus of this study is on the cost price aspect of the method. We can see that the pharmaceutical industry has the characteristics to successfully implement the ABC method. It is both familiar with the method and has the contextual factors (high indirect cost and high product diversity). Schoute presents us three possible explanations for not implementing ABC. These might be applicable to the pharmaceutical industries’ position: - The innovative power of the organisation. High complexity and interaction between
company sections have a positive effect on the power to innovate. Formalised structures work counterproductive. Pharmaceutical companies might not have the power to innovate their account system and therefore might be unable to implement the ABC-system. This argument is not too strong since the pharmaceutical industry is a high-tech, state of the art industry and one would expect them to have the power to innovate.
- High cost of implementation. Implementing an ABC-system does imply high costs. Costs of creating activity dictionaries, tracing costs to activities and informing employees must be compared to uncertain future profits from more accurate information and thus better decision-making. The pharmaceutical companies might have made the decision not to implement ABC based on this argument.
- Management co-operation. The ABC-method must be carried by the whole organisation and cannot be implemented top-down. This broad acceptance of the system or rather lack of acceptance might be the reason for pharmaceutical companies not to implement an ABC-system.

TRANSPARENCY IN THE PHARMACEUTICAL INDUSTRY
Wewi/RuG 42

CONCLUSION AND RECOMMENDATIONS FOR FURTHER STUDY
Wewi/RuG 43
Chapter 6 Conclusion and recommendations for further study
This paper has dealt with the question whether or not the pharmaceutical industry is capable of calculating more accurate cost prices. This question must be answered affirmative. The calculation of cost prices of drugs is mostly done with the standard costing method, while this conservative method does not render the most accurate cost price possible. The ABC method would render a more accurate cost price and should be used to more specifically allocate indirect costs, like marketing and research and development expenses. In chapter one of this paper the background of the problem has been described. In this chapter the incentive for this research, the South African Court Case, has been described. The pharmaceutical industry challenged the South African government for implementing the international regulation of the WTO TRIPS agreement in a broad way. The government was forced to pay high prices for drugs and the national legislation would allow an easier way to issue compulsory licenses, thus dodging the patent right. The high drug prices and the apparent injustice that this court case laid bare led to the main question answered in this paper: is the pharmaceutical industry capable of calculating more accurate prices? Chapter two elaborated on the broader scope of the problem needed to provide an answer to the main question. The key components, or pillars, of health care, which are recognised in respect to the problem of access to drugs for all peoples, have been discussed. Rational selection, sustainable financing, good health care systems and affordable prices are all part of the problem of access to drugs. The three pillars, which have not been investigated in this study, should be the bases of future research. This research has focused on the last pillar: affordable prices. The chapter than elaborated on the characteristics of the pharmaceutical industry. The industry has both competitive and oligopolistic sides to it. The innovative industry is faced with a patent system that can grant high prices and profits for a sustained period of time. The industry is furthermore faced with high costs of R&D. R&D should be the subject of future study in order to be able to make a more profound judgement about the stability of it. In the end the chapter shortly touched upon the role of the generic industry. This branch of the industry has no patents to worry about and therefore functions more like a regular industry, meaning it is quite competitive. In chapter three this paper narrows its focus on the last pillar: affordable prices. The underlying model of drug prices was presented in the first paragraph. This model showed the influence of policy on prices of drugs. The pharmaceutical industry seemed able to influence the price in cost calculation policy and profit margin policy and the governments and other parties influenced the price by introducing tariffs, taxes and other price-increasing policies. In paragraph 3.2 the TRIPS agreement was shown to be a burden for developing countries. Yet

TRANSPARENCY IN THE PHARMACEUTICAL INDUSTRY
Wewi/RuG 44
there were possibilities for developing countries to use the liberty granted in the agreement to limit the powers of patent holders. The discussion on TRIPS was shown to be mostly a discussion on interpretation. In chapter four different accounting techniques were discussed. The standard costing has shown to be a conservative method and the industry could be expected to use other techniques to come to a more accurate cost price and better decisions on research projects. ABC seems to be the most accurate method for calculating cost prices since it allocates indirect costs best to cost objects. In paragraph 4.2 the described cost price calculation methods were viewed in the context of the pharmaceutical market. A standard costing method or ABC method in combination with LCC might lead to better policy decisions and a combination of target costing and kaizen costing might lead to innovations and further cost price reductions. ABC seems to be providing a natural differential price, since cost prices will naturally differ between countries. Indirect costs, which are made for the benefit of the western economies mostly, are allocated more accurately and therefore will increase the price in these economies, while the price will decrease in developing countries. ABC has shown to be the best method for calculating the most accurate cost price, theoretically at least. In chapter five the results of a survey amongst pharmaceutical companies was presented. Standard costing is still most widely used to calculate costs of drugs. But most the respondents did allocate marketing costs to regions and products, thus creating a more accurate cost price. Yet, the respondents were familiar with ABC, which would allocate marketing costs even better and would allocate R&D-costs more accurately. The paradoxical situation of being familiar with ABC, but not use it, lead to the description of a theoretical concept called the ABC-paradox. Three possible reasons were examined why the pharmaceutical industry has not adopted ABC. The response to the survey was low however and therefore additional research into this subject is necessary. Follow-up research should be more specific. It should investigate the variables used in the calculation of the cost price and the specific grounds for allocation of cost prices. Also research might focus on gaining more transparency in the actual cost calculation methods used by doing a survey that gains higher response. This paper has focused on a small part of the problem, while striving to be as complete as possible in describing the problem. It has presented a possible solution to a small part of the problem, namely the prices of drugs. The focus was on cost prices and ways to calculate them, when a large share of indirect costs has to be allocated. It seems that the accuracy of cost price calculation can be improved. Considering the pharmaceutical industry with its high indirect costs and innovative character one would expect innovative and state-of-the-art cost accounting principles. In this research that expectation has not come true.

REFERENCES
Wewi/RuG 45
References
Abbot, F.M., The TRIPS Agreement, access to medicines ant the WTO ministerial
Conference, Quaker UN Office, September 2001, http://hostings.diplomacy.edu/quaker. Angell, M., ‘Aan wie is de farmaceutische industrie verantwoording verschuldigd?’, Geneesmiddelenbulletin, issue 2, feb. 2001, pp. 13-24. Bjørnenak, T., ‘Diffusion and accounting: the case of ABC in Norway’, Management
Accounting Research, Vol. 8, pp. 3-17. Bouma, J.L., van Helden, J., Management accounting en economische organisatie theorie, Academic Service, Schoonhoven, 1994. Drury, C., Management and Cost accounting, Chapman & Hall, London, 1992. Feldstein, P.J., ‘The pharmaceutical industry’, Health Care Economics, 1988, ed. Grabowski H., Vernon, J., ‘Innovation and structural change in pharmaceuticals and biotechnology’, Industrial Corporate Changes, Issue 3, 1994, pp. 435-49. Grabowski H., Vernon, J., ‘The Distribution of Sales Revenues from Pharmaceutical Innovation’, Pharmacoeconomics, Issue 18, 2000. Grabowski, H., Vernon, J., ‘Effective patent life in pharmaceuticals’, International Journal of
Technology Management, Vol. 19, 2000, pp. 98-117. ’t Hart, H., et al., Onderzoeksmethoden, Boom, Amsterdam, 1998. Horngren, C.T., et al., Management and Cost Accounting, Prentice Hall Europe, 1999. Jacobzone, S., Pharmaceutical policies in OECD-countries: reconciling social and industry
goals, OECD, April 2000. Kaplan, R., Cooper, R., Cost & Effect: Using integrated cost systems to drive profitability and
performance, Harvard Business School Press, Boston, 1998. Lauderman, J. , Schaeberle, M., ‘The cost accounting practices of firms using standard costs’, Cost and Management accounting, Issue 4, 1983.

TRANSPARENCY IN THE PHARMACEUTICAL INDUSTRY
Wewi/RuG 46
Lee, K., ‘Strengthening governance for global health research: the countries that most need health research should decide what should be funded’, British Medical Journal, 30 September 2000, pp. 775-6. MacIntyre, A., Key issues in the pharmaceutical industry, John Wiley & Sons Ltd., Chichester, 1999. Moriarity, A., Cost accounting, John Wiley & Sons Ltd., Chichester, 1991. Perez-Casas, C., ‘HIV/AIDS drugs pricing report: Setting objectives: is there a political will’, July 2000, available from http://msf.org/advocacy/assessmed/reports/2000/07/aidspricing. Remiche B, ‘Les brevet pharmaceutiques dans les accords du GATT: l’enjeu?’, Revue
Internationale de droit Economique, 1996. Saxenian, H., ‘Getting the most out of pharmaceutical expenditures’, HRO working papers, Issue 37, 1994. Scherer, F.M., Industrial market structure and economic performance, Rand McNally college publishing company, Chicago, 1970. Schoute, M., ‘Het waarom van de ABC-paradox’, Maandblad voor Accountancy en
Bedrijfseconomie, nummer 11, 1999 , pp. 590-599. Scrip Yearbook, PJB publications ltd., London 1995. Taggart, J., The world pharmaceutical industry, Routledge, Chapman and Hall, London, 1993. Tschochohei, H., Do have people in developing countries limited access to essential drugs?
The pattern of global supply of pharmaceuticals, Wetenschapswinkel voor Economie, No. WD 003, Rijksuniversiteit Groningen, 2001 Tilleman, K., van der Wal, H., ‘Life Cycle Costing en Management’, Praktijkboek financieel
management, september 2000. UNICEF, UNAIDS Secretariat, WHO/HTP, MSF, ‘Sources and prices of selected drugs and diagnostics for people living with HIV/AIDS’, May 2001, available from: www.accessmed-msf.org. U.S. Congress, Office of Technology Assessment, Pharmaceutical R&D: costs, risks and
rewards, U.S. Government Printing Office, February 1993.

REFERENCES
Wewi/RuG 47
Velasquez, Bouket, ‘Globalization and Access to Drugs: Implications of the WHO/TRIPS Agreement’, World Health Organization, January 1999, www.who.int. WTO OMC, ‘Report on the workshop on differential pricing and financing of essential drugs’, April 2000, www.wto.org/english/tratop_e/TRIPS_e. WTO secretariat, More equitable pricing for essential drugs: what do we mean and what are
the issues?, background paper for the WTO WHO workshop on equitable pricing, Switzerland, 2001, www.wto.int/medicines/docs/par/equitable_pricing.doc. World Health Report 2000, Health systems: improving performance, World Health Organization, Switzerland, 2000.

TRANSPARENCY IN THE PHARMACEUTICAL INDUSTRY
Wewi/RuG 48

ANNEX 1
Wewi/RuG 49
Annex 1: The economics of health care45 This annex is about the economics of health care. It will point out the difference between a normal market for goods and the market for drugs. It also points out the difference prices of drugs can theoretically make. Furthermore it undermines two arguments often heard made by advocates of the pharmaceutical industry. And finally it highlights the non-precision of the patent system to reach its goal. In a competitive market a producer will supply a product as long as the price the consumer is willing to pay, exceeds the marginal cost of production. Price and desirability determine the quantity a consumer is willing to buy. Assuming a product is desirable, as its price falls, more consumers will buy the product and vice versa. By charging high prices, a producer will undermine its own well being because new producers can enter the market at a lower price, thus driving him out. The condition in which demand and supply are in balance is called ‘equilibrium’ and the corresponding price is the ‘equilibrium price’. A patent will protect a producer by blocking the entry of other producers, thus allowing him to charge prices above the marginal cost of production for an extended period of time. The ability to charge a higher price is influenced by factors as the availability of substitute products and the extent to which consumers are willing to shift to alternative products. Besides this basic demand and supply structure, there are contextual factors. Automobiles are not sold if there are no roads, no gasoline or no driver’s licenses. These factors influence the price elasticity of a product. Applying this basic economic to the pharmaceutical market we are faced with the difference that drugs can be life-saving or essential. Let us consider that option. The desirability of such a drug is extremely high. In fact, a person could be assumed to be willing to pay any price for a drug, when his life is depending on the access to that drug. Persons with unlimited resources are therefore likely to be very insensitive to the price level. Those with limited resources however are purely restricted from entering the market by the price. They are extremely sensitive to the price changes at the downside, for it would able them to extend their lives. A holder of a patent on life saving drugs like HIV/AIDS drugs, are in the position to charge very high prices without fear of competitors entering the market. An ‘equilibrium price’ is not found at the level of marginal cost of production, but at a much higher level. Only high-income consumers are able to buy the product, thus granting the pharmaceutical industry their high profit margin. Lowering the price would open up a bigger market, but their profit margin would not be optimal.
45 this annex draws heavily from an annex from: Abbot, F.M., the TRIPS Agreement, access to medicines ant the
WTO ministerial Conference, Quaker UN Office, September 2001, available from: http://hostings.diplomacy.edu/quaker.

TRANSPARENCY IN THE PHARMACEUTICAL INDUSTRY
Wewi/RuG 50
The argument often heard made by the industries’ advocates that no matter how low the price people can still not buy them, is false. It is opposing basic market principles to assume lowering prices would not attract extra buyers. Automobile manufacturers are engaging in price competition in virtually all markets. Although the availability of roads is an external factor of influence, it does not prevent manufacturers from doing this. There is no reason to expect the drugs market to behave any differently, if not for patents. The lack of health care policy, or water provisions is therefore also a false argument made by the advocates of the industry. Granting patents is a very imprecise tool. It is supposed to protect the market from intruders in order for the developer of the drug to recover R&D expenses. Yet, it does more than just that. There is no direct relationship between these costs and the profits made from patents. The industry is engaging heavily in marketing activities that are also recovered by profits from patents. There is no apparent justification for allowing patent-based pricing to generate income for marketing activities. This is particularly evident for essential and life-saving drugs that do not require marketing or advertisement.

ANNEX 2
Wewi/RuG 51
Annex 2: Offers of donation/price reductions of antiretroviral drugs up to 15 April 2001 Source: Sources and prices of selected drugs and diagnostics for people living with
HIV/AIDS, May 2001, www.unaids.org
Individual drug offers announced (both offers made in response to the Expression of Interest launched in October 2000 and publicly announced offers)
Manufacturer Generic Name Brand name (*) Generic Innovati
ve
Announced discount price/day (in US$)
Abacavir Ziagen GlaxoSmithKline X N/A Abacavir Hetero X 10.64 Delavirdine Rescriptor Upjohn-Pharmacia X N/A Didanosine (ddI) Videx Bristol-Myers Squibb X 0.85 Didanosine (ddI) Cipla X 1.60 Didanosine (ddI) Aurobindo X 0.52 Efavirenz Stocrin/
Sustiva Merck/Dupont X 1.37
Efavirenz Stocrin/ Sustiva
Merck/Dupont (for Brazil) X 2.52
Efavirenz Hetero X 3.23 Efavirenz Aurobindo X 1.33 Indinavir Crixivan Merck X 1.64 Indinavir Crixivan Merck (for Brazil) X 2.82 Indinavir Hetero X 6.30 Indinavir Cipla X 5.04 Lamivudine (3TC)
Epivir GlaxoSmithKline X 0.63
Lamivudine (3TC)
Hetero X 0.27
Lamivudine (3TC)
Lamivir Cipla (to not-for-profit programmes)
X 0.30
Lamivudine (3TC)
Aurobindo X 0.25
Nelfinavir Viracept Roche X 9.8946 Nelfinavir Hetero X 6.16 Nevirapine Nevimune Cipla (to not-for-profit
programmes) Cipla (for Uganda)
X 0.54 0.80
Ritonavir Norvir Abbott X N/A Ritonavir Hetero X 11.78 Saquinavir softgel
Fortovase Roche X 6.5847
46 For each single pack purchased, one extra pack is delivered free of charge (for Sub-Saharan Africa only). 47 For every 100 packs purchased, 15 extra packs delivered free of charge (for Sub-Saharan Africa only).

TRANSPARENCY IN THE PHARMACEUTICAL INDUSTRY
Wewi/RuG 52
Saquinavir softgel
Hetero X 2.72
Saquinavir hardgel
Invirase Roche X 11.92
Saquinavir hardgel
Aurobindo X 6.78
Stavudine (d4T) Zerit Bristol-Myers Squibb X 0.15 Stavudine (d4T) Hetero X 0.13 Stavudine (d4T) Stavir Cipla (to not-for-profit
programmes) X 0.11
Stavudine (d4T) Aurobindo X 0.13 Zalcitabine (ddC) Hivid Roche X 3.90 Zalcitabine (ddC) Hetero X 0.12 Zidovudine (ZDV)
Retrovir GlaxoSmithKline X 1.49
Zidovudine (ZDV)
Hetero X 0.53
Zidovudine (ZDV)
Zidovir Cipla X 0.84
Zidovudine (ZDV)
Aurobindo X 0.50
Combination offers announced Lamivudine, zidovudine and nevirapine
Cipla (to not-for-profit programmes + Nigeria)
X 0.96
Lamivudine, zidovudine and nevirapine
CIPLA offer to Governments X 1.64
Lamivudine, zidovudine and nevirapine
Aurobindo offer to Governments
X 0.81
Lamivudine, stavudine and nevirapine
Hetero offer to Governments X 0.95
Lamivudine+zidovudine (Combivir)
GlaxoSmithKline (for developing countries)
X 2.00
Lamivudine+zidovudine (Duovir)
CIPLA (for Uganda) X 1.52
Note: This list shows the price reductions offered on HIV/AIDS medication by the pharmaceutical industry. The first column shows the generic name of the medication. The second shows the brand name for the innovative producer. The third shows the manufacturer and whether it is generic or innovative. The fourth column shows the discount in dollars per day for a full year treatment. Not all drugs do have a generic product. For those that do we can see that both generic and innovative producers offer price discounts. But since generic products are already at a much lower price level their prices remain far below the innovative industry. One could argue the innovative producers only offer discounts in order to keep a hold on the market, since reducing the price will not optimise the profit margin, as shown in annex 1. However this hypothesis cannot be proven right or wrong on the data from the above table alone. Further research is necessary.

ANNEX 3
Wewi/RuG 53
Annex 3: Market Shares of the pharmaceutical and car industry
Company name Market share
Glaxo Wellcome 4,7 %
Merck 3,5 %
Hoechst Marion Roussel 3,5 %
Bristol Meyers Squibb 3,1 %
Total 14,8 %
Figure x: market shares of the top four pharmaceutical companies in 1995 (figures from: Financial Times, 1996)
(Source: MacIntyre, Key issues in the pharmaceutical industry, 1999)
Company name Market share
Volkswagen 16,5 %
Fiat 13,3 %
General Motors 12,7 %
Ford 12,2 %
Total 54,7 %
Figure x: market shares of the top four car companies in 1991(figures from: Financial Times, 1991)
(Source: MacIntyre, Key issues in the pharmaceutical industry, 1999)

TRANSPARENCY IN THE PHARMACEUTICAL INDUSTRY
Wewi/RuG 54

ANNEX 4
Wewi/RuG 55
Annex 4: Comparison of shareholders equity
GlaxoSmithKline In share
Shareholders’ equity 11,489 86 %
Total assets 13,343
Source: GlaxoSmithKline Annual Review 2000
AstraZeneca In share
Shareholders’ equity 9,521 83 %
Total assets 11,537
Source: AstraZeneca Annual Report & Form 20-F 2000
Shell In share
Shareholders’ equity 1,217 3 %
Total assets 35,742
Source: N.V. Koninklijke Nederlandse Petroleum Maatschappij, Verkort Verslag 2000
Stada (in liason with cetrafarm) In share
Shareholders’ equity 90,854 12 %
Total assets 788,881
Source: Stada, Annual Report 2000

TRANSPARENCY IN THE PHARMACEUTICAL INDUSTRY
Wewi/RuG 56

ANNEX 5
Wewi/RuG 57
0 20 40 60 80 100
Burkina
Cambodia
Cameroon
Cote Ivoire
Ethiopia
Georgia
India
Myanmar
Nigeria
Pakistan
VietNam
Australia
Canada
France
Germany
Japan
Norway
Spain
UK
USA
%
Annex 5: Out-of-pocket payments as % total health expenditure is more important in low income countries
Source: World Health Report 2000. Health systems: improving performance. World Health
Organization, Geneva, Switzerland, 2000
TRANSPARENCY IN THE PHARMACEUTICAL INDUSTRY
Wewi/RuG 58

ANNEX 6
Wewi/RuG 59
Annex 6: Public and private shares in health financing differ in high and low income countries
Source: World Health Report 2000. Health systems: improving performance. World Health
Organization, Geneva, Switzerland, 2000
0% 20% 40% 60% 80% 100%
Burkina
Cambodia
Cameroon
Cote Ivoire
Ethiopia
Georgia
India
Myanmar
Nigeria
Pakistan
VietNam
Australia
Canada
France
Germany
Japan
Norway
Spain
UK
USA
Public Private

TRANSPARENCY IN THE PHARMACEUTICAL INDUSTRY
Wewi/RuG 60

ANNEX 7
Wewi/RuG 61
Annex 7: Overview of costs in the pharmaceutical industry
Company name
Mer
ck
Abb
ot
Pfiz
er
Gla
xo/W
ell
com
e48
Hoe
chst
Sales / turnover 100 % 100 % 100 % 100 % 100 % Direct costs: 23,7 % 48 % 36 % Cost of material Cost of direct labour Indirect costs: Distribution costs Marketing and administration expenses/
Selling general and administrative expenses:
30,7 % 20% 37 %
Management costs Supporting staff (ex. administration) R & D 11,5 % 9 % 9 % 13 % 14 %
Figure: overview of typical direct and indirect costs for the pharmaceutical industry; percentages based on 1989 figures49
Notes:
• The Health Forum estimates the total spending on R&D at $30 billion, or 15 % of the
industries global sales in 1993.50
• R&D expenditure has been rising at about 10 % a year.51
48 Glaxo Holdings figures combined with Wellcome Inc. figures. Later GlaxoWelcome fused with SmithKline Beecham to form GlaxoSmithKline 49 Taggart, J., The world pharmaceutical industry , Routledge, Chapman and Hall, London, 1993 50 Kelley Lee, ‘Strengthening governance for global health research: the countries that most need health research should decide what should be funded’, British Medical Journal, 30 September 2000, pp. 775-6 51 U.S. Congress, Office of Technology Assessment, Pharmaceutical R&D: costs, risks and rewards, U.S. Government Printing Office, February 1993

TRANSPARENCY IN THE PHARMACEUTICAL INDUSTRY
Wewi/RuG 62

ANNEX 9
Wewi/RuG 63
Annex 8: Survey form 1. Are you familiar with the following cost accounting techniques?
Type yes no
Activity based costing
Life cycle costing
Target costing
Kaizen costing
Standard costing
Production centre method
2. Is your company using any of the technique mentioned above to calculate your internal
cost price? If so, which does it use? 3. Do you feel your way of calculating the cost price is characteristic for the total
pharmaceutical industry? If not, why? 4. How does your company handle marketing costs in the calculation of cost prices?
a. equally divided over all products b. divided over regions tot which they apply c. divided over (groups of) products for which marketing costs are made d. divided over both regions and (groups of) products
5. How does your company handle R&D-cost
a. allocated to the product developed and commercialised b. allocated to all products
6. Do all the divisions of your company, worldwide, use the same methods or do they differ? 7. Do you feel you can improve the accuracy of your cost price? If so, how?

TRANSPARENCY IN THE PHARMACEUTICAL INDUSTRY
Wewi/RuG 64

PUBLICATIONS
Wewi/RuG 65
Annex 9: The respondents of the survey Company name Type Reaction Medium Generic Innovative Positive Negative None E-mail Phone positive reactions 1st 2nd Abbott 1 1 1 1 (a.p.) 1 GlaxoSmithKline 1 1 1 1 (a.p.) 1 Pharmacia & Upjohn 1 1 1 1 (a.p.) 1 Centrafarm BV 1 1 1 no reaction Cipla 1 1 1 1 Aurobindo 1 1 1 1 Bayer 1 1 1 1 Bristol-Myers Squibb 1 1 1 1 Combino Pharm 1 1 1 1 CP Pharmaceuticals 1 1 1 1 Ecobi 1 1 1 1 FDC Limited 1 1 1 1 GPO 1 1 1 1 KRKA 1 1 1 1 Laboratorio Chile S.A. 1 1 1 1 Laboratorios PISA 1 1 1 1 Laboratorios 1 1 1 1 Medispan 1 1 1 1 Sanofi-Synthélabo 1 1 1 1 Schering 1 1 1 1 Nova Nordisk 1 1 1 1 Grunentahl 1 1 1 1 Aventis 1 1 1 1 Astamedica 1 1 1 1 negative reactions Confidential information Astrazeneca 1 1 1 Letter 1 Byk Gulden 1 1 1 Letter 1 Organon 1 1 1 1 Solvay Pharma BV 1 1 1 1 not interested Nycomed Amersham Cygne 1 1 1 1 Merck 1 1 1 1 no time Pfizer 1 1 1 1 Samchully 1 1 1 1 Pharmamed 1 1 1 1 Boehringer Ingelheim BV 1 1 1 1 Roche 1 1 1 1
Wyeth-Lederle 1 1 1 1
totals 11 25 4 12 20 36 22 13 a.p.= after phonecall 36 36 (+3)

TRANSPARENCY IN THE PHARMACEUTICAL INDUSTRY
Wewi/RuG 66

PUBLICATIONS
Wewi/RuG 67
Publications52
EC 96 E. Beumers, Beslissende (f)actoren voor hennepteelt, onderzoek naar het achterwege blijven van hennepteelt voor de papierindustrie in de Veenkoloniën, 1997.
EC 98-I K.J. Driessen, Internationale uitbesteding door de KLM, 1997. EC 98-II A.M.S. den Ouden, H.B.G. Gelling, Economische betekenis van een groeiend Schiphol voor
bedrijven, 1997. EC 99 M.B.W. Hazewinkel, R.T. Postma, Financiering monumentenzorg, onderhoud versus
restauratie, 1997. EC 100 R. Enting, Subsidieverdeling voor het stads- en streekvervoer: doelstellingsbewust?, 1997. EC 101 R. Schultink, Lokale Agenda 21, beleid en indicatoren voor duurzaamheid, 1997. EC 102 drs. F.J. Sijtsma, drs. D. Strijker, M.L.A.W. Hoefsloot, Duurzame ontwikkeling in het
Waddengebied, een methode voor het afwegen van economie, natuur, milieu en landschap, 1998.
EC 103 drs. M.J.H. van Onna, Kwaliteitsmeting in de economische wetenschap, een goede econoom is meer dan een goede onderzoeker, 1998.
EC 104 A. Heine, M. Maatman, Maatschappelijk verantwoord ondernemen, een analyse van de jaarverslagen van de 25 grootste Nederlandse ondernemingen, 1998.
EC 105 R. Hilgenga, Kennisvergroting in het Roemeense midden- en kleinbedrijf, de rol van de ontwikkelingsprogramma’s van de Europese Unie, 1998.
EC 105 ing. K. Bettels, drs. F.J. Sijtsma, Het Emssperrwerk, een evaluatie op duurzaamheid van een waterkering in de Ems, 1998.
EC 107 J.W. Boven, Markt voor natuurvoeding: een supermarkt, de toekomstige ontwikkeling van het netwerk van biologische voedingsmiddelen, 1998.
EC 108 J. Idema., Stock Markets in Transition Economies, the case of the Tallinn stock exchange, Estonia, 1998.
EC 109 P.A.M. Lohle, Arbeidspool, een (arbeidsmarkt)instrument om flexibiliteit en bestaande zekerheid te combineren, 1999.
EC 110 A.P. Postma, drs. F.J. Sijtsma, drs.T.M. Stelder en drs. D. Strijker, De concurrentie-kracht van Weststellingwerf, een economisch-ruimtelijk perspectief, 1999.
EC 111 R. de Veer, Bank stability in transition economics, case study Estonia, 1999. EC 112 R.J. Suhlman, m.m.v. drs. F.J. Sijtsma, Financiering van monumentale kerken – Verkenning
van de effecten van overheidsbeleid, 1999. EC 113 H. Dijk, Ware Woorden of Schone Schijn? – De betrouwbaarheid van uitlatingen over
Maatschappelijk Verantwoord Ondernemen, 1999. EC 114 W. Dijkstra, Water zonder grenzen, internationalisering van de Nederlandse watersector,
1999. EC 115 R.P. Brouwer en O.P. Smid, Magnesiumproductie in de Eemsmond, vorming van clusters
van bedrijvigheid rondom magnesiumproductie, 1999. EC 116 A.P. Postma, Ecologische voetafdruk, betekenis en bruikbaarheid, 2000. EC 117 G. Ypma, Een onderzoek naar streekgbonden producten in het Waddengebied, 2000. EC 118 G. Molema en P. Olthof, Vermarkting van dorplandschappen, 2001.
52 Publicaties in de reeks Publicaties van de Community Research Centre for Economics hebben een EC
nummer, krijgen een ISBN nummer en worden uitgebracht op klein formaat, gebonden. Publicaties uitgebracht in de werkdocumenten reeks, hebben een WD nummer, krijgen geen ISBN nummer en worden uitgebracht op A4 formaat met een metalen ringband.
TRANSPARENCY IN THE PHARMACEUTICAL INDUSTRY
Wewi/RuG 68
EC 119 D. de Jong, Verstand van Zaken? - Over wetenschap, waarheid en verwaring, 2001. EC 120 E. Brunink, S. Jansen, M. Kasper, drs. E. Kamphuis (red.), Formule TrendBreuk voor EKO-
verkoop: Trendy of Trend?, 2001. Werkdocumenten
WD 1 drs. Frans J. Sijtsma, Prof. dr. P.H. Pellenbarg en drs. K.G. Lugtenborg, Naar een goed besluit over vier Friese musea, 2000.
WD 2 drs. Elise Kamphuis (red.), Komt EKO van de grond?, De verwerkingscapaciteit van biologische producten in Noord Nederland, 2000.
WD 003 H. Tschochohei, Do people in developing countries have limited access to essential drugs? Wetenschapswinkel Economie, 2001.
WD 004 C. Boersma, Economic issues of antimalarial diagnostics and therampeutics in sub-Saharan Africa, 2001.