University of Groningen Modelling and analysis of human ... · Modelling and analysis of human...
272
University of Groningen Modelling and analysis of human collaboration processes in organizations Stuit, Marco IMPORTANT NOTE: You are advised to consult the publisher's version (publisher's PDF) if you wish to cite from it. Please check the document version below. Document Version Publisher's PDF, also known as Version of record Publication date: 2011 Link to publication in University of Groningen/UMCG research database Citation for published version (APA): Stuit, M. (2011). Modelling and analysis of human collaboration processes in organizations Groningen: University of Groningen, SOM research school Copyright Other than for strictly personal use, it is not permitted to download or to forward/distribute the text or part of it without the consent of the author(s) and/or copyright holder(s), unless the work is under an open content license (like Creative Commons). Take-down policy If you believe that this document breaches copyright please contact us providing details, and we will remove access to the work immediately and investigate your claim. Downloaded from the University of Groningen/UMCG research database (Pure): http://www.rug.nl/research/portal. For technical reasons the number of authors shown on this cover page is limited to 10 maximum. Download date: 11-06-2018
Transcript of University of Groningen Modelling and analysis of human ... · Modelling and analysis of human...

University of Groningen
Modelling and analysis of human collaboration processes in organizationsStuit, Marco
IMPORTANT NOTE: You are advised to consult the publisher's version (publisher's PDF) if you wish to cite fromit. Please check the document version below.
Document VersionPublisher's PDF, also known as Version of record
Publication date:2011
Link to publication in University of Groningen/UMCG research database
Citation for published version (APA):Stuit, M. (2011). Modelling and analysis of human collaboration processes in organizations Groningen:University of Groningen, SOM research school
CopyrightOther than for strictly personal use, it is not permitted to download or to forward/distribute the text or part of it without the consent of theauthor(s) and/or copyright holder(s), unless the work is under an open content license (like Creative Commons).
Take-down policyIf you believe that this document breaches copyright please contact us providing details, and we will remove access to the work immediatelyand investigate your claim.
Downloaded from the University of Groningen/UMCG research database (Pure): http://www.rug.nl/research/portal. For technical reasons thenumber of authors shown on this cover page is limited to 10 maximum.
Download date: 11-06-2018

Modelling and analysis of human collaboration processes in organizations
Marco Stuit

Publisher: University of Groningen Groningen The Netherlands Printer: Ipskamp Drukkers B.V. Enschede The Netherlands ISBN: 978-90-367-4916-9 (printed version) 978-90-367-4917-6 (electronic version) Copyright © Marco Stuit, 2011 All rights reserved. No part of this publication may be reproduced, stored in a retrieval system of any nature, or transmitted in any form or by any means, electronic, mechanical, now known or hereafter invented, including photocopying or recording, without prior written permission of the author.

Modelling and analysis of human collaboration processes in organizations
Proefschrift
ter verkrijging van het doctoraat in de
Economie en Bedrijfskunde aan de Rijksuniversiteit Groningen
op gezag van de Rector Magnificus, dr. E. Sterken, in het openbaar te verdedigen op
donderdag 12 mei 2011 om 13.15 uur
door
Marco Stuit
geboren op 28 oktober 1980 te Groningen

Promotor: Prof. dr. ir. J.C. Wortmann Copromotor: Dr. N.B. Szirbik Beoordelingscommissie: Prof. dr. G. Wagner Prof. dr. ir. A. Verbraeck
Prof. dr. ir. C.T.B. Ahaus

Contents
CHAPTER 1 ..................................................................................................................... 1
INTRODUCTION & RESEARCH METHODOLOGY ............................................................................. 1 1.1. MOTIVATION .................................................................................................................. 2 1.2. KEY DEFINITIONS & ASSUMPTIONS ..................................................................................... 6 1.3. RESEARCH OBJECTIVE, QUESTION & SCOPE .......................................................................... 6 1.4. THE AGENT PARADIGM .................................................................................................... 8 1.5. RESEARCH METHODOLOGY ............................................................................................. 10
1.5.1. Case study research .......................................................................................... 10 1.5.2. Design science research guidelines .................................................................. 11 1.5.3. The design science research framework ........................................................... 17
1.6. READER’S GUIDE ........................................................................................................... 19 Chapter 2 .................................................................................................................... 19 Chapter 3 .................................................................................................................... 20 Chapter 4 .................................................................................................................... 21 Chapter 5 .................................................................................................................... 21 Chapter 6 .................................................................................................................... 22 Chapter 7 .................................................................................................................... 22
CHAPTER 2 ................................................................................................................... 23
AGENT‐ORIENTED MODELLING AND VERIFICATION OF HUMAN COLLABORATION PROCESSES ................ 23 ABSTRACT .......................................................................................................................... 24 2.1. INTRODUCTION ............................................................................................................. 25 2.2. CASE STUDY ................................................................................................................. 28 2.3. THE TALL MODELLING LANGUAGE ................................................................................... 30
2.3.1. Preliminaries and requirements ....................................................................... 30 2.3.2. Diagrams, graphical syntax, and semantics ..................................................... 31 2.3.3. Formal definition: TALL process diagrams ....................................................... 42 2.3.4. Modelling guidelines and tool support ............................................................. 46
2.4. VERIFICATION OF THE THCP MODEL ................................................................................ 50 2.4.1. The need for design‐time verification ............................................................... 50 2.4.2. A design‐time verification method for agent‐driven HCPs ............................... 51
2.5. TRANSLATION OF THE THCP MODEL TO A HIERARCHICAL COLOURED PETRI NET ........................ 52 2.5.1. Translation: Formal definition .......................................................................... 52 2.5.2. TALL2HCPN: From the THCP model to a hierarchical CP net ............................ 64
2.6. THE VERIFICATION ACTIVITY ............................................................................................ 66 2.6.1. Verification analysis ......................................................................................... 66 2.6.2. Verification reporting and correction ............................................................... 70
2.7. DISCUSSION ................................................................................................................. 71 2.8. RELATED WORK: AGENT‐BASED MODELLING ..................................................................... 74
2.8.1. Agent‐based modelling languages for system design ...................................... 74 2.8.2. Agent‐driven workflow and the use of Petri nets ............................................. 76
2.9. CONCLUSIONS .............................................................................................................. 79
CHAPTER 3 ................................................................................................................... 83

AN ALGORITHM TO INTEGRATE LOCAL INTERACTION DIAGRAMS IN HUMAN COLLABORATION PROCESSES 83 ABSTRACT .......................................................................................................................... 84 3.1. INTRODUCTION ............................................................................................................. 85 3.2. THE TALL MODELLING LANGUAGE .................................................................................... 87 3.3. PRODUCT‐CENTRIC CASE EXAMPLE ................................................................................... 89 3.4. GLOBAL CONSTRUCTION ALGORITHM................................................................................ 93 3.5. APPLICATION OF THE GLOBAL CONSTRUCTION ALGORITHM ................................................. 104 3.6. DISCUSSION ............................................................................................................... 106 3.7. CONCLUSIONS ............................................................................................................ 108
CHAPTER 4 ................................................................................................................. 109
DISCOVERY AND ANALYSIS OF EMAIL‐DRIVEN COLLABORATION PROCESSES ..................................... 109 ABSTRACT ........................................................................................................................ 110 4.1. INTRODUCTION ........................................................................................................... 111 4.2. THEORETICAL FOUNDATION .......................................................................................... 114
4.2.1. Message threading ......................................................................................... 114 4.2.2. The TALL modelling language ........................................................................ 115
4.3. THE EMAIL INTERACTION MINING METHOD ..................................................................... 117 4.3.1. Requirements analysis .................................................................................... 117 4.3.2. Activity 1: Manual pre‐processing .................................................................. 117 4.3.3. Activity 2: Identification of interactions and their composition relations ...... 119 4.3.4. Activity 3: Identification of routing relations between interactions ............... 124 4.3.5. Activity 4: Identification of actors and roles ................................................... 128 4.3.6. Activity 5: Post‐processing ............................................................................. 132
4.4. TOOL SUPPORT ........................................................................................................... 133 4.5. CASE STUDY ............................................................................................................... 136
4.5.1. Case description ............................................................................................. 136 4.5.2. Data collection ............................................................................................... 137 4.5.3. Application of the EIM method ...................................................................... 137
4.6. METHOD EVALUATION: MODEL IMPACT & UTILITY ........................................................... 138 4.6.1. Preliminaries ................................................................................................... 138 4.6.2. Architectural design of the Service Bus infrastructure ................................... 142 4.6.3. Disk capacity management ............................................................................ 143 4.6.4. Installation communication manual .............................................................. 144 4.6.5. Communication and escalation ...................................................................... 144 4.6.6. Managerial implications................................................................................. 145
4.7. RELATED WORK: TOWARDS MANAGING E‐MAIL ............................................................... 146 4.8. DISCUSSION ............................................................................................................... 148
4.8.1. Contribution and generalization .................................................................... 148 4.8.2. Assumptions about user behaviour ................................................................ 149 4.8.3. Limitations ...................................................................................................... 151 4.8.4. Interaction‐centric modelling ......................................................................... 153
4.9. CONCLUSIONS ............................................................................................................ 155
CHAPTER 5 ................................................................................................................. 157
A BUSINESS PROCESS STUDY OF HUMAN COLLABORATION ........................................................... 157

ABSTRACT ........................................................................................................................ 158 5.1. INTRODUCTION ........................................................................................................... 159 5.2. MODELLING SHORTCOMINGS ........................................................................................ 161
5.2.1. The interaction shortcoming .......................................................................... 161 5.2.2. The local view shortcoming ............................................................................ 162
5.3. THE TALL MODELLING LANGUAGE ................................................................................. 163 5.4. CASE STUDY ............................................................................................................... 165
5.4.1. Case description ............................................................................................. 165 5.4.2. Agents and roles ............................................................................................. 166 5.4.3. Organizational problem ................................................................................. 167 5.4.4. Interaction and behaviour modelling ............................................................. 168
5.5. PRACTICAL RESULTS ..................................................................................................... 173 5.6. DISCUSSION ............................................................................................................... 175 5.7. CONCLUSIONS ............................................................................................................ 178
CHAPTER 6 ................................................................................................................. 179
MULTI‐VIEW INTERACTION MODELLING OF HUMAN COLLABORATION PROCESSES ............................ 179 ABSTRACT ........................................................................................................................ 180 6.1. INTRODUCTION ........................................................................................................... 181 6.2. THEORETICAL BACKGROUND .......................................................................................... 183
6.2.1. The TALL modelling language ........................................................................ 183 6.2.2. Related work .................................................................................................. 185
6.3. CASE STUDY ............................................................................................................... 187 6.3.1. Case description ............................................................................................. 187 6.3.2. The HNO care pathway .................................................................................. 188
6.4. APPLICATION OF THE MULTI‐VIEW INTERACTION MODELLING METHOD ................................ 190 6.4.1. Preliminaries ................................................................................................... 190 6.4.2. Business domain analysis ............................................................................... 191 6.4.3. Capture and modelling of local interaction views .......................................... 197 6.4.4. Integration of local interaction views ............................................................. 200
6.5. BUSINESS VALUE: PRACTICAL RESULTS ............................................................................ 202 6.5.1. Compliance analysis ....................................................................................... 202 6.5.2. Communication and training .......................................................................... 205
6.6. EVALUATION .............................................................................................................. 206 6.7. DISCUSSION ............................................................................................................... 208 6.8. CONCLUSIONS ............................................................................................................ 209
CHAPTER 7 ................................................................................................................. 213
DISCUSSION & CONCLUSIONS ............................................................................................... 213 7.1. CROSS‐CASE ANALYSIS ................................................................................................. 214 7.2. TALL MODELLING GUIDELINES ...................................................................................... 218 7.3. CONCLUSIONS ............................................................................................................ 223
7.3.1. Research contributions ................................................................................... 223 7.3.2. Future research directions .............................................................................. 229
APPENDICES .............................................................................................................. 233

APPENDIX A – PSEUDO CODE E‐MAIL INTERACTION MINING METHOD .................................. 234 APPENDIX B – EMAIL ETIQUETTE RULES .......................................................................... 240
REFERENCES .............................................................................................................. 241
SAMENVATTING (DUTCH SUMMARY) ........................................................................ 259
DANKWOORD (ACKNOWLEDGEMENTS) ..................................................................... 261

Chapter 1
Introduction & Research Methodology

Chapter 1
2
1.1. Motivation
he field of Business Process Management (BPM) is concerned with concepts, methods, and techniques to support the design, administration, configuration, enactment, and analysis of business processes (Jeston &
Nelis, 2006; van der Aalst, 2004; Weske, 2007). A business process is the combination of a set of activities or tasks within an enterprise with a structure describing their logical order and dependence whose objective is to produce a desired result (Aguilar-Savén, 2004). Traditionally, BPM is concerned with production workflows, which are well-structured and repetitive business processes that are usually performed in a single organization (Weske, 2007). Examples of production workflows are routine (administrative) business processes like order handling or insurance claim processing. In most cases, a standard process model is defined once to serve as an executable specification for a process-aware Information Technology (IT) system in order to provide automated enactment of the process (Dumas, van der Aalst, & ter Hofstede, 2005). The IT system uses the prescriptive model to control the execution of the tasks or activities in the process. In this way, a multitude of similar cases (e.g. a hundred orders or insurance claims) follows the same process structure (i.e. the process is instantiated one hundred times by the system). Alternatively, the prescriptive model can be implemented in a set of organizational protocols. In both cases, the organizational goal is to handle cases in an effective and efficient way. Because the workflow process is executed in a step-wise discrete fashion for each case that runs through the process, some authors denote production workflows as mechanistic (Melão & Pidd, 2000) or deterministic (Lindsay, Downs, & Lunn, 2003) business processes.
Contemporary BPM is increasingly concerned with collaborative business processes (Liu, Li, & Zhao, 2009). The term collaborative business process is mostly used in inter-organizational contexts. Therefore, these processes can also be referred to as inter-organizational workflows (van der Aalst, 2000a). In an inter-organizational context, a collaborative business process combines two or more public processes to describe the high-level activities of partners who are involved in a business-to-business (B2B) collaboration (Weske, 2007; White, 2004). The private (internal) business processes of the partners usually contain more detail. The public activities can be considered the “touch-points” between the partners, which define the communicative activities that are visible to the public. The corresponding process model is a so-called interconnection model in which the observable (public) activities or tasks of the different partners are described and
T

Introduction & Research Methodology
3
related via message flow (Decker & Weske, 2011). Although the degree of repetition is lower, the purpose of such a model is usually to implement it in an IT system to ensure interoperability between the partners through the coordination of the cross-organizational information flows (Ghattas & Soffer, 2009; Liu, Li, & Zhao, 2009; Norta & Eshuis, 2010; Rajsiri, Bénaben, Lorré, & Pingaud, 2010; Weske, 2007).
The structure of organizations has become increasingly flatter, less hierarchical, more fluid, and even virtual (Gratton, 2004). A key word in this context is workplace collaboration (IBM Corporation, 2008; Shaw, 2007). Human interactions like meetings, conversations, consultations, or discussions increasingly characterize the contemporary workplace. Rosen (2007) lists four key trends that are changing the business landscape and that are fuelling the demand for richer interactions within and among organizations of all sizes:
1. Technological: convergence of video, voice, and data over the Internet protocol;
2. Economic: exploiting the best talent at the best price regardless of geography;
3. Cultural: the desire for instant feedback and the expectation of immediacy; 4. Regulatory: complying with new federal, state, and local laws.
Following these trends, the number of interactions and interaction channels has increased substantially within organizations. Human collaboration and interaction constitute an essential part of a modern organization’s business activities. Although human interactions are adopted in practice as an effective way to collaborate, organizations do not define – let alone manage - them as a business process. This is remarkable since human interactions consume a lot of time in daily work practice. The net result is that human interaction structures in organizations remain largely implicit; there exists no process definition of human interactions in organizations. Consequently, the part of the business activity associated with human interactions remains opaque, and is not amenable to systematic design, analysis and management. The empirical studies that are part of this thesis further corroborate this point.
Within organizations, many business activities are formalized into workflows (e.g. order handling, insurance claim processing, ordering equipment) or inter-organizational workflows (e.g. e-commerce processes between suppliers and customers). Most BPM studies are technology-oriented with a focus on the implementation of workflow processes in workflow management systems (Houy,

Chapter 1
4
Fettke, & Loos, 2010). Although several workflow studies focus on unstructured work processes that require more flexibility in their execution (Goedertier, Haesen, & Vanthienen, 2008; van der Aalst & Weske, 2005; van der Aalst, Pesic, & Schonenberg, 2009), the desired process flexibility is built into the architecture of the supporting IT system. Carr (2003) states that businesses have overemphasized the role of IT while they underestimate the importance of a clear understanding and critical analysis of their human processes. This thesis argues that extant research and practice in the BPM field does not properly address the class of problems associated with the modelling and analysis of human interactions in organizations. Here, the goal of process modelling is not primarily software support or automation but in the first place to capture and define accurately the essence of collaboration, as a necessary basis for analysis and improvement.
Although there are numerous BPM tools, techniques and methods, one common feature is to capture and define existing business processes. In this feature, business process modelling plays a crucial role (Lin, Yang, & Pai, 2002). Business process modelling constitutes the essence of BPM (Weske, 2007), and is aimed at the identification and definition of business processes (Jimenez, 2009). Process definition is mostly done in models using graphical modelling languages. The huge focus and investment in the study of workflow processes has produced proven process modelling tools. Pervasive graphical process modelling languages like BPMN (White, 2004), WS-BPEL (OASIS, 2007), Petri nets (Desel, 2005), UML activity diagrams (Dumas & ter Hofstede, 2001; Eshuis, 2002), EPCs (Scheer, Thomas, & Adam, 2005), and IDEF0 (Mayer, Painter, & deWitte, 1992) are used for the modelling of both intra- and inter-organizational workflows. In essence, a workflow model specifies which tasks in a process need to be executed and in what order (van der Aalst, 1998). The model is structured and well-defined in the sense that the collection of tasks in the business process and their ordering relations are formalized in a task execution sequence (Wang & Wang, 2006). As indicated above, the primary purpose of a workflow model is to implement it in an IT system to enable automated process support.
Existing graphical workflow-based process modelling languages, which are the most commonly applied in the BPM field, focus on the definition of task flows (i.e. tasks and their ordering relations). Although most of them (now) provide notations to model collaboration and/or interaction, they have not been designed with interaction in mind. Therefore, they offer only basic support for the modelling of interaction structures. In most of these languages, interactions are modelled

Introduction & Research Methodology
5
through the specification of message exchange, that is, they are modelled as mere ‘connected’ communicative tasks that are mixed with the specification of the non-communicative tasks. In the case of numerous interactions with many participants, it becomes difficult to see, in a workflow model, where interaction takes place, between whom, and what the relations are between the interactions (Stuit & Wortmann, 2010). Hommes (2004) explains that flowchart or graph-based notations, which are adopted by most workflow-based process modelling languages, do not work well for large diagrams where users have to model interactions between a wide range of actors. Several authors confirm that existing graphical (workflow-based) process modelling languages are appropriate for modelling business processes that display complex task flows (i.e. workflow processes) but are less appropriate for modelling business processes that involve the interaction of a multitude of actors (Barjis, 2007; De Backer, Snoeck, Monsieur, Lemahieu, & Dedene, 2009; Hommes, 2004; Melão & Pidd, 2000; Ryu & Yücesan, 2007; Stuit & Wortmann, 2010).
It becomes clear that current process modelling approaches do no suit the modelling of those processes that require intensive interaction of humans for their completion, so called artistic (Hall & Johnson, 2009) or human-driven business processes (Harrison-Broninski, 2010). In this thesis, such processes are referred to as Human Collaboration Processes (HCPs), which consist of a process structure of related human interactions (see Section 1.2 for a complete definition). In HCPs, collaboration instead of task sequence determines the nature of the business activity (Harrison-Broninski, 2005). Thus, the core problem is that existing languages are task-centric instead of interaction-centric.
Based on the above, this thesis argues that there is a demand for novel modelling tools for the explicit design and modelling of HCPs in organizations. This thesis contributes to the graphical representation of HCPs as a necessary precursor for their proper analysis and improvement. More specifically, this thesis presents a novel graphical and formal business process modelling approach, named TALL, inspired by the agent paradigm. The core component of the approach is the TALL (The Agent Lab Language) modelling language. Using the language, the organizational context in which a HCP occurs is seen as a multi-agent environment in which different agents or actors behave in interactions to coordinate their work. The language explicitly recognizes the interaction (performed by multiple actors), instead of the task (performed by a single actor), as the core activity in collaborative organizational work.

Chapter 1
6
1.2. Key Definitions & Assumptions
In this thesis, a HCP is defined as a collaborative purposeful effort between
agents who perform several related interactions, in which they may play different roles, to coordinate their work. Thus, the collaborative effort consists of a process structure of human interactions. A human interaction is operationally defined as a reciprocal business act between two or more agents (i.e. interaction participants) directed towards a common goal or benefit. In line with Kolfschoten, de Vreede, Briggs, and Sol (2010), who explore (the design of) collaboration in detail, this means that interaction is a key condition for successful collaboration. The authors mention that without interaction, participants cannot define their goal, commit to it, or attune their behaviours toward goal attainment. Depending on the media and communication channel, human interactions can be of different types: synchronous/asynchronous, verbal/non-verbal, physical/virtual etc. Moreover, depending on the involved agents, human interactions can be intra- or inter-organizational. Thus, HCPs are concerned with both intra- and inter-organizational human work practice. This means they are different from the collaborative business processes discussed in Section 1.1, which are concerned with high-level (public or external) inter-organizational activities of partners (i.e. organizations).
This research joins research on collaboration engineering (de Vreede & Briggs, 2005; de Vreede, Kolfschoten, & Briggs, 2006; Kolfschoten, Briggs, Appelman, & de Vreede, 2004; Kolfschoten, Briggs, de Vreede, Jacobs, & Appelman, 2006; Kolfschoten, de Vreede, Briggs, & Sol, 2010) in its key assumption that collaboration processes can be and need to be explicitly designed, structured, and managed to maximize the focus of purposeful effort.
1.3. Research Objective, Question & Scope
The main research objective of this thesis is to present, apply, develop, and evaluate the TALL modelling approach for HCPs. The approach consists of the TALL modelling language and several modelling methods that utilize the language. Section 1.5.2 provides the complete list of components that make up the approach. The specific research objectives are:
to present and develop an interaction-centric business process modelling approach, which is both graphical and formal;
to investigate whether real-life HCPs can be effectively identified, modelled, analysed, and improved using this approach.
Correspondingly, the following research question guides this research.

Introduction & Research Methodology
7
Main research question:
How to effectively identify, model, analyse, and improve human collaboration processes in organizations? The extensive ground covered by BPM is divided between representatives from two communities: business administration and computer science. Business administration professionals are interested in improving the operations of companies. Two communities in computer science are interested in business processes. Researchers with a background in formal methods investigate structural properties of processes. The software community is interested in the technical realization of business processes in software systems (Weske, 2007).
In a wider context, a TALL business process modelling effort is the first phase in the lifecycle of a HCP, which involves everything from business process modelling to automated support and monitoring of a HCP by a software system. The typical elements of a business process lifecycle are illustrated in Figure 1-1. In this thesis, the focus is on the use of the TALL modelling approach for business process modelling purposes, which covers HCP identification, modelling, analysis, and improvement activities. This thesis demonstrates that the approach is an innovative, effective, and useful tool to facilitate these activities. Thus, the scope of this research is the Design and Analysis phase (see Figure 1-1).
Figure 1-1. Business Process Lifecycle. Source: (Weske, 2007).

Chapter 1
8
Because of the overall focus on applied business process modelling with the goal to improve the understanding and functioning of HCPs in organizations, the contribution of this thesis lies mainly at the business administration side of BPM. Section 1.5 details the applied orientation of this research by discussing the research methodology. This thesis does cover computer science topics related to BPM. For example, Chapter 2 extends the TALL modelling approach with a novel verification method for structural model checking of HCPs. Moreover, in the broader scope of a HCP’s entire lifecycle, the goal of the interaction-centric TALL modelling approach is to inform the development and deployment of multi-agent systems - where the TALL models can reside and be executed - for intelligent IT support of humans in their interactions using software agents (Roest & Szirbik, 2009). Subsequent chapters - Chapter 2 in particular – discuss in more detail the (planned) use of the TALL models in a multi-agent system development context. Because of the focus of this thesis on business process modelling, system implementation discussions are always concerned with a business-level view (i.e. how the models can be used in a multi-agent system development context rather than how the models can be implemented in a multi-agent system).
The TALL modelling language includes diagrams to model both static (i.e. organizational modelling) and dynamic (i.e. process modelling) aspects of a business domain. This makes TALL a business process modelling language instead of a process modelling language (Barjis, 2007). Chapter 2 introduces all diagrams of the language. It is important to mention that this thesis mainly concentrates on the application, development, and evaluation of the process diagrams in the language. Moreover, the language separates between generic process participants (i.e. roles) and specific process participants (i.e. agents) as resources in a HCP. This distinction is discussed and illustrated in this thesis. However, a detailed discussion on resource management (e.g. classification of resources, availability of resources, resource scheduling and allocation) is beyond the scope of this thesis because of the focus on process modelling.
1.4. The Agent Paradigm
The development of the TALL modelling approach is inspired by the agent paradigm (Kelemen, 2003; Luck, McBurney, Shehory, & Willmott, 2005). The agent paradigm is the lens through which the application domain is observed. A lens reflects the way of thinking or ‘Weltanschauung’ of an approach (Seligmann, Wijers, & Sol, 1989). As mentioned in Section 1.1, using the approach, the

Introduction & Research Methodology
9
organizational context in which a HCP occurs is seen as a multi-agent environment in which different agents behave in interactions to coordinate their work. This is a paradigm shift in BPM research and practice. Most pervasive process modelling approaches are inspired by the workflow paradigm (Fischer, 1995), as highlighted in Section 1.1. Section 1.5.2 explains in more detail how the selected lens influenced the initial design of the approach. This section continues with explaining the rationale behind the use of the selected lens. This rationale is related to (1) the nature and characteristics of HCPs, and (2) the envisaged technology to support (the execution of) HCPs.
The paradigm shift fits well the fundamentally different nature of HCPs; collaboration instead of task sequence determines the nature of the working activity. In a HCP, the process participants do not perform work according to pre-defined tasks but act in empowered roles in which they carry their own local decision and control power. Interaction is required because skills, responsibilities, authorities, and resources are distinct and distributed. This is the work in which humans, who use their mental and social skills, interact with a variety of colleagues both within and outside the organization in a highly complex manner (Harrison-Broninski, 2005). A HCP is collaborative, distributed, dynamic, and often complex. These characteristics match well an agent-oriented view. The process participants can be seen as autonomous agents that perform local behaviours, but must collaborate in interactions to reach individual and joint business goals. Multi-agent systems research has a history of focusing on distributed, decentralized abstractions that have been applied to solve many problems that require the interaction of multiple intelligent entities (Zambonelli & Omicini, 2004). The essential features of agents include autonomy, learning, abilities to perceive, reason and proactively act in their surrounding environments, as well as the capability to cooperate and communicate with other agents to solve complex problems (Nwana, 1996; Wooldridge & Jennings, 1995; Wooldridge, 2009).
The second reason for the selected lens is related to the envisaged technology to support HCPs defined with the TALL modelling language. As discussed in Section 1.1, the focus in organizations has been mainly on workflow processes and their implementation in workflow management systems for automation purposes. For HCPs, automation is difficult because the execution of the tasks and interactions is largely emergent. This is the result of the autonomy of the human participants. In this situation, a workflow system that prescribes the execution of tasks in the business process is not effective and unwanted. On the other hand, it is possible to

Chapter 1
10
develop intelligent software agents that can take over or support some of the tasks of the humans in their interactions, as indicated in Section 1.3.
1.5. Research Methodology
The research objective posed in Section 1.3 requires the empirical application, development, and evaluation of a novel business process modelling approach for HCPs. To achieve this objective, this thesis performs Case Study Research (CSR) with strong Design Science Research (DSR) characteristics. Thus, the applied research methodology integrates DSR (Hevner, March, Park, & Ram, 2004; Vaishnavi & Kuechler Jr., 2008) and CSR (Dul & Hak, 2008; Yin, 2003). More specifically, this thesis reports on several case studies using and evaluating the TALL modelling approach in real-life contexts, which are positioned within a DSR framework. Section 1.5.1 explains and justifies the use of CSR. After, Section 1.5.2 elaborates on the DSR characteristics of this research. Finally, Section 1.5.3 presents the adopted DSR framework.
1.5.1. Case study research
The TALL modelling approach is in the early stages of development and is intended to be a useful tool for the BPM community. Therefore, a close connection with reality is considered important to make sure the approach is effective and purposeful to address practical problems. CSR allows the approach to be developed and evaluated in the context of application in close collaboration with the people in the field (Gibbert, Ruigrok, & Wicki, 2008; van Aken, 2004).
A case study is defined as an empirical inquiry that investigates a contemporary phenomenon within its real-life context (Yin, 2003). The author mentions that case studies are preferred when the focus is on a contemporary set of events within its real-life context. Dul and Hak (2008) add that most authors consider CSR a useful research strategy (a) when the topic is broad and highly complex, (b) when there is not a lot of theory available, and (c) when context is very important. Eisenhardt (2007) mentions that case studies emphasize the rich, real-world context in which the phenomenon of interest occurs. Finally, Siggelkow (2007) argues that CSR allows to get closer to theoretical constructs in order to unravel their dynamics as they play out in their real-life context. These statements or conditions hold true for research that concerns business process modelling. The TALL modelling activity requires the in-depth study of HCPs in their real-life contexts.

Introduction & Research Methodology
11
This thesis includes four case studies, which are presented in chronological order in Chapter 2, Chapter 4, Chapter 5, and Chapter 6. The outline of thesis chapters in Section 1.6 previews the case organizations and the selected HCPs in each of the four case studies. The purpose of the case studies is twofold: (1) to extend the TALL modelling approach based on real-life application and/or (2) to evaluate the utility of the approach in practice cases. The case study in Chapter 2 illustrates the initial design of the TALL modelling language and contributes to the development of the TALL modelling approach with a novel design-time verification method for HCPs. The case studies in Chapter 4, Chapter 5, and Chapter 6 all extend the TALL modelling approach (see Section 1.6 for more detail) and provide a practical contribution in the form of HCP improvement opportunities for the case organization (i.e. demonstration of situated utility). Therefore, these three case studies are referred to as evaluation case studies in the remainder of this thesis. The main goal of an evaluation is to build an argument for an artefact’s utility (Hevner, March, Park, & Ram, 2004). In this thesis, the artefact is the TALL modelling approach.
1.5.2. Design science research guidelines
The reason to integrate the CSR in this thesis with DSR is threefold. First, in contrast to other research approaches, DSR does not take the artefact as given; it allows the development of novel artefacts. Second, DSR is fundamentally a problem-solving paradigm with a clear applied orientation, like CSR (Gregor & Hevner, 2011). DSR allows the success of designed artefacts to be evaluated with respect to the utility they provide to solve identified organizational problems. Framing research activities to address business needs assures research relevance (Hevner, March, Park, & Ram, 2004). The case studies are used as an evaluation method, which complies with DSR (Hevner, March, Park, & Ram, 2004). Houy, Fettke, and Loos (2010) mention that in design science case study approaches are the most commonly used method to evaluate BPM artefacts by testing their feasibility in a real-world application context. Rosenkranz and Holten (2011) add that practice descriptions of successful and effective applications of modelling methods can be used to evaluate methods. Third, DSR provides many research frameworks to guide specific research projects with explicit attention for scientific rigor besides (practical) relevance (Gregor & Hevner, 2011). In summary, DSR allows the development of the approach based on a sound theoretical foundation while at the same time the practical utility and effectiveness of the approach can be

Chapter 1
12
evaluated using empirical methods (Hevner, March, Park, & Ram, 2004; Vaishnavi & Kuechler Jr., 2008; Venable, 2006).
Hevner, March, Park, and Ram (2004) provide seven guidelines on how to conduct, evaluate, and present DSR. Before the adopted DSR framework is presented in Section 1.5.3, the following elucidates the DSR characteristics of this research by explaining how this thesis relates to these guidelines - as inspired by Rosenkranz and Holten (2011).
Guideline 1 - Design as an artefact
The TALL modelling approach is the main artefact developed in thesis. The approach consists of the following developed components and supporting software tools1:
1. The TALL modelling language and the Visual Editor (all chapters); 2. The design-time verification method and TALL2HCPN (Chapter 2); 3. The global construction algorithm and Local IS Integrator (Chapter 3); 4. The e-mail interaction mining method and E-mail Interaction Miner
(Chapter 4); 5. The two-phase modelling method for local agent behaviour specification
and analysis within a HCP’s interactions (Chapter 5); 6. The multi-view interaction modelling method and Local IS Integrator
(Chapter 6); 7. A set of TALL modelling guidelines: a list of modelling activities that
relates the language and methods above in order to support modellers in the usage and application of the approach (Chapter 7).
Hevner, March, Park, and Ram (2004) state that DSR must produce a viable artefact in the form of a construct, model, method, or instantiation. First, this thesis provides agent-oriented constructs (see guideline 4 for more detail) to support the graphical representation of HCPs. In DSR, constructs are the conceptual vocabulary in which problems and solutions are defined (March & Smith, 1995). Second, the TALL modelling language provides diagrams (read: models) in which the constructs are related. In DSR, models use constructs to represent a real world situation (Hevner, March, Park, & Ram, 2004). Third, the listed methods (i.e. the set of modelling guidelines is also a method artefact) enable and/or support the application of the language. Fourth, the four case studies show how the TALL
1 For the development of the software tools, the researcher worked in close collaboration with several programmers, mostly students from the University of Groningen.

Introduction & Research Methodology
13
modelling approach is instantiated in real-life application contexts. In DSR, an instantiation is the realization of a construct, method, or model in an environment (Vaishnavi & Kuechler Jr., 2008). Instantiations show that constructs, models, or methods can be implemented in a working system; they demonstrate feasibility (Hevner, March, Park, & Ram, 2004). In this regard, the software tools, as implemented technological solutions, contribute to the feasibility of the approach and its design decisions. The TALL modelling approach and its components are elaborated in the remainder of this thesis.
Guideline 2 - Problem relevance
Hevner, March, Park, and Ram (2004) state that the objective of DSR is to develop artefacts to address important and relevant business problems. Section 1.1 motivates that human interactions are performed well in practice but organizations do not define – let alone manage - them as a business process. Moreover, Section 1.1 argues that current process modelling approaches have shortcomings to model HCPs since they are task-centric rather than interaction-centric. The case studies in this thesis further corroborate these points. Because of these points, HCPs in organizations are not amenable to proper process design, analysis, and improvement. This thesis takes on the challenge to present, develop, and evaluate the TALL interaction-centric business process modelling approach to solve identified organizational problems. This is the relevant problem addressed by this research.
Guideline 3 - Design as a search process
Hevner, March, Park, and Ram (2004) state that design is effectively a search process to discover an effective solution to a problem. As mentioned in Section 1.5.1, this research uses case studies for the development and evaluation of the TALL modelling approach. With regard to the development of the approach, the process employed in each case study consists of two main steps.
In the first step, the organizational problem (i.e. business needs and requirements) is identified in an exploratory phase. More specifically, the study of preliminary documentation and meetings with organizations’ members confirms the existence of organizational problems related to human interactions. This means cases are selected based on their substantive significance (Ragin, 1999). According to Eisenhardt (1989), it makes sense to choose cases in which the process of interest is “transparently observable” since the number of cases that can be studied is limited. Siggelkow (2007) agrees it is often desirable to choose a particular

Chapter 1
14
organization precisely because it is very special in the sense of allowing one to gain certain insights that other organizations would not be able to provide. The identification of the organizational problem is important since it also forms the basis for the evaluation (see guideline 5).
In the second step, the TALL modelling approach is applied and extended to address the organizational problem. In this regard, the four case studies can be seen as multiple design cycles in which the approach is instantiated and developed. Each instantiation (read: application) allows empirical findings to be integrated with the ongoing development of the approach. The list of components presented under the first guideline shows that each chapter (read: case study) contributes to the development of the approach.
Guideline 4 - Research rigor
Hevner, March, Park, and Ram (2004) state that rigor is achieved by appropriately applying foundations and methodologies from the existing knowledge base in the development and evaluation of the design artefact.
With regard to methodologies, as indicated before, case studies are used to develop and evaluate the TALL modelling approach. Within the case studies, proven data collection, validation, and process analysis methods are used. CSR allows the use of several data collection methods (Dubé & Paré, 2003). The data collection methods used in this thesis are desk study of organizational documentation, interviews with process participants, and key informant consultations. Face validation is used to validate the effectiveness of the TALL diagrams created in the three evaluation case studies. Face validation asks reality owners or subject matter experts whether a model accurately reflects reality and meets user expectations (Illgen & Gledhill, 2001; Pace, 2004; Sargent, 2007). Bridgeland and Zahavi (2009) mention that the goal of a process analysis is to reap business value from models, using them to discover new insights. In the evaluation case studies, the process analysis takes the form of an improvement analysis, which is a qualitative analysis (i.e. visual inspection) intended to find improvement opportunities (Bridgeland & Zahavi, 2009).
With regard to foundations, the development of the TALL modelling approach draws on literature and knowledge from both the BPM and multi-agent systems research fields.

Introduction & Research Methodology
15
Business process management research As discussed under the second guideline and in Section 1.1, shortcomings of existing pervasive workflow-based process modeling approaches are used as motivation for the development of the TALL modeling approach. Upcoming chapters (and their case studies) further motivate and justify the development of the approach with regard to existing BPM research and practice. Multi-agent systems research The main component of the TALL modelling approach is the TALL modelling language. The use of the agent paradigm as the lens to observe the application domain, as discussed in Section 1.4, influenced the development of the language. More specifically, the initial design of the language draws from existing theoretical concepts from multi-agent systems research to provide a theoretical foundation to its design. The power of the agent paradigm is that it provides a strong unified foundation of process participants (i.e. agents), the roles they play (i.e. agent roles), their activities (i.e. agent behaviours), and the interactions between them (i.e. agent interactions). These are the four main language concepts. Since these concepts are foundational to the language, it follows the language is agent-oriented. In turn, the interaction-centricity of the language results from the agent-orientation. Interactions are central to multi-agent systems; it is the raison d'être for having multiple agents in the first place (Wooldridge, 2009). The four case studies will confirm that the four main agent-oriented concepts are indeed a useful abstraction for real-life HCP design and modelling.
Chapter 2 presents a case study to illustrate the initial design of the language. There, it is shown how the four main language concepts form the basis for the graphical syntax, semantics, and diagrams of the language. Because of the applied orientation of this thesis, the reader is referred to other publications (Stuit, 2006; Stuit & Szirbik, 2006; Stuit & Szirbik, 2007; Stuit, Szirbik, & de Snoo, 2007; Stuit, Szirbik, & Wortmann, 2007a; Stuit, Szirbik, & Wortmann, 2007b; Stuit & Meyer, 2008; Szirbik & Stuit, 2009; Szirbik, Stuit, & Meyer, 2009) for more details on the (agent-oriented) design rationale behind the design of the TALL modelling approach2.
2 For instance, Stuit and Szirbik (2007) elaborate on the rationale behind the interaction concept, which is an intangible concept that is reified (i.e. a symbol is introduced to capture its presence) for HCP design and modelling. That paper also explains the need for hierarchical organization of interactions to model a HCP’s interaction structure. Moreover, the paper discusses the ontological distinctions between agents and roles.

Chapter 1
16
Guideline 5 - Design evaluation
Hevner, March, Park, and Ram (2004) state that the goal of DSR is utility, which must be demonstrated via well-executed evaluation methods. As indicated before, case studies are used as the evaluation method to assess the utility of the TALL modelling approach in solving the organizational problem. The essence of DSR is the creation of a purposeful artefact that yields utility for the specified problem domain (Hevner, March, Park, & Ram, 2004).
In each evaluation case study, the target HCP is identified and modelled using the TALL modelling approach. Next, face validation is used to make sure that the TALL diagrams correctly capture reality. Finally, actionable managerial insights in the form of HCP improvement opportunities are pinpointed and discussed based on a process analysis of the created diagrams. Thus, face validation and improvement analysis are used to build an argument for the utility of the approach in these cases. The main evaluation criterion is the performance of the approach in several real-life HCP (re)design situations.
This type of evaluation is not very formal, but it is a critical first step in the development of a practically useful modelling approach. Hevner, March, Park, and Ram (2004) add that this type of evaluation trades off formal evaluation for relevancy, which is effective in the initial stages of a novel artefact. In this regard, this thesis lays a good foundation for formal evaluation - for instance by testing the TALL modelling approach in comparative research or experiments against other process modelling approaches. This work is planned for the future (see Section 7.3.2).
Guideline 6 - Research contribution
Hevner, March, Park, and Ram (2004) state that effective DSR must provide new and interesting contributions. Besides the use of the knowledge base (see guideline 4), this thesis also contributes to existing foundations in the knowledge base. The contribution of this thesis to the knowledge base is the TALL modelling approach as a design artefact, and the evaluation results that stem from its application. This research extends the BPM field with an approach for HCP identification, modelling, analysis, and improvement in organizations. Evaluation results comprise practical results (i.e. HCP improvement opportunities), and contributions to the development of the approach and theory development.
The TALL modelling approach is innovative in the BPM field. As mentioned under the fourth guideline, the approach draws on foundations in the knowledge

Introduction & Research Methodology
17
base of BPM and multi-agent systems research. Theoretical justification is important especially because of the abundance of available modelling approaches in the BPM community. The main distinction the approach makes is the integration of the process- and agent-orientation, which results in its interaction-centricity. Existing process modelling approaches are not based on theories in which interactions stand central.
Guideline 7 - Research communication
Hevner, March, Park, and Ram (2004) state that DSR must be presented effectively to both practitioners and academics. The presentation of this thesis communicates knowledge on the relevance and importance of this research in general, and the nature and applicability of the TALL modelling approach in particular. Therefore, it offers a sound foundation for further research and practice by both practitioners and academics. With the set of TALL modelling guidelines that is presented in Chapter 7, practitioners and academics are able to use the approach within specific (organizational) contexts. The results of the case studies in upcoming chapters further demonstrate the practical relevance of the approach for practitioners.
1.5.3. The design science research framework
This thesis follows the general methodology for DSR as described by Vaishnavi and Kuechler Jr. (2008) and depicted in Figure 1-2. This thesis is organised after the phases in this framework. The first phase is Problem Awareness and provides the motivation for a research effort. As discussed in Section 1.1 and the second guideline in Section 1.5.2, the problem addressed by this research has high (practical) relevance.
The second phase is Suggestion. This phase considers the identified problem apart from the business environment. Suggestions for a problem solution are abductively drawn from the existing knowledge base for the problem area, which provides theoretical foundations and methodologies (Hevner, March, Park, & Ram, 2004; Vaishnavi & Kuechler Jr., 2008). As the fourth guideline in Section 1.5.2 discusses, this research draws the validity of the TALL modelling approach on foundations in the knowledge base of BPM and multi-agent systems research. This phase results in the main concepts of the TALL modelling language: interactions, behaviours, agents, and roles.
The third phase is Development. This phase implements an initial design of the artefact based on the suggested solution. This thesis starts with a tentative design in the form of the core graphical and formal components of the TALL modelling

Chapter 1
18
approach in Chapter 2 and Chapter 3. These chapters use a case study and a process example respectively to provide an (empirical) exemplar of the embodiment of the theories and models (Scapens, 2004).
Figure 1-2. The design science research framework adopted in this thesis. Based on (Hevner, March, Park, & Ram, 2004; Vaishnavi & Kuechler Jr., 2008).
The fourth phase is Evaluation. The TALL modelling approach is applied in four case studies, which each provide evaluation results. Each case study provides theoretical insights related to the findings and experiences obtained in the specific application, and contributes to the ongoing development of the approach. As Figure 1-2 shows, the former flows back to the knowledge base whereas the latter flows back to the development phase. Furthermore, the three evaluation case studies in Chapter 4, Chapter 5, and Chapter 6 provide practical results, which flow back to the organizational environment where the business need was initially observed (see Figure 1-2).
The fifth phase is Conclusion. In this phase, the results of the (design) research effort are consolidated and written up. This thesis concludes with a cross-case analysis of the evaluation case studies and a discussion of the main research contributions in Chapter 7.

Introduction & Research Methodology
19
1.6. Reader’s Guide
This thesis is organized in seven chapters. Chapters 2 to 6 are the main constituents of this thesis. Each of these chapters corresponds to a manuscript that is either accepted for publication or currently under review at a journal. Therefore, these chapters are readable as individual contributions. Yet, the chapters are closely related and have been edited to improve the overall consistency of the thesis. Besides the included manuscripts, results of this research appear in several other publications (Stuit, 2006; Stuit & Szirbik, 2006; Stuit & Szirbik, 2007; Stuit, Szirbik, & de Snoo, 2007; Stuit, Szirbik, & Wortmann, 2007a; Stuit, Szirbik, & Wortmann, 2007b; Stuit & Meyer, 2008; Szirbik & Stuit, 2009; Szirbik, Stuit, & Meyer, 2009).
On a high level, Chapters 2 to 6 are all concerned with the four business process modelling activities, which constitute the scope of this thesis (see Section 1.3): HCP identification, modelling, analysis, and improvement. As explained with the DSR research framework, the direction chosen in this thesis is to first present the theoretical foundation of the TALL modelling approach (i.e. the core graphical and formal components) in Chapter 2 and Chapter 33. After, Chapter 4, Chapter 5, and Chapter 6 present the three evaluation case studies. The following briefly outlines the core content of each chapter and mentions the corresponding manuscripts. Besides this content, each of the chapters presents related work and discussion relevant for the subject in the particular chapter.
Chapter 2
Corresponding manuscript: “Marco Stuit and Nick B. Szirbik, Towards agent-based modelling and verification of collaborative business processes: An approach centred on interactions and behaviours, International Journal of Cooperative Information Systems, 18(3/4), 2009”. The first part of this chapter introduces the diagrams, graphical syntax, and formal semantics of the TALL modelling language. Throughout this chapter, a HCP studied at a Dutch gas transport company, concerned with the provision of gas transport services, is used for illustration of the language. The second part of this
3 The sections in Chapter 3 to Chapter 6, which introduce the notations and diagrams of the TALL modelling language, have been kept despite the fact that they repeat some of the text from Chapter 2 in particular. This to retain the possibility for individual reading of each chapter. Readers, who read this thesis from beginning to end in the included order, may skip the following sections about the modelling language: Section 3.2, Section 4.2.2, Section 5.3, and Section 6.2.1.

Chapter 1
20
chapter extends the TALL modelling approach with a design-time verification method. The method translates a HCP defined with the TALL modelling language to a hierarchical coloured Petri net. This enables the identification of structural process design errors in the obtained Petri net using proven analysis techniques. Moreover, the verification method allows the rollback and correction of the errors in the TALL models. The method is applied in the case study and verification results are discussed. These results are more theoretical than the results of the process (improvement) analyses that are performed in the three evaluation case studies in Chapter 4, Chapter 5, and Chapter 6. However, the issue of verification is practically very relevant since it allows important observations on structural properties of business processes, which are useful to detect deficiencies or mismatches in real-life HCPs.
Since the TALL modelling language is inspired by the agent paradigm, as discussed in Section 1.4, this chapter mainly positions the language with regard to related work in the multi-agent system community. In line with this focus, this chapter also discusses in more detail the use of the language for the development of multi-agent systems that support HCPs.
Chapter 3
Corresponding manuscript: “Marco Stuit and Gerben G. Meyer, Agent interaction modelling based on product-centric data4: A formal method to improve enterprise interoperability, In: K. Fischer, J.P. Müller, J.J. Odell, and A.J. Berre (Eds.), Agent-Based Technologies and Applications for Enterprise Interoperability, Lecture Notes in Business Information Processing, 25, pp. 197-219. Heidelberg, Berlin, Germany: Springer, 2009”. This chapter introduces an algorithm, named the global construction algorithm. This algorithm can integrate multiple local interaction views, which agents have of a HCP, into a global interaction view of the HCP. The TALL modelling language is used to graphically represent both the local and global interaction views. A process example, concerned with a simplified collaborative supply chain, is used to explain and exemplify the algorithm. The algorithm constitutes an important theoretical addition to the TALL modelling approach. More specifically, it is the
4 The term product-centric data is only relevant for the local context of Chapter 3. Therefore, it is explained in Chapter 3.

Introduction & Research Methodology
21
core component of the multi-view interaction modelling method that is introduced and applied in a case study of a healthcare HCP in Chapter 6.
Chapter 4
Corresponding manuscript: “Marco Stuit and Hans Wortmann, Discovery and analysis of email-driven business processes, Information Systems, Under Review (2nd round after Moderate Revision)”. This chapter focuses on e-mail as the medium of interaction. It presents a novel email interaction mining method to discover email-driven HCPs, as an extension of the TALL modelling approach. The method adopts the TALL modelling language to visualize discovered e-mail interactions including their composition and routing relations, their participants, and their attributes in an interaction-centric process model. In a case study at a Dutch gas transport company, the method is applied to a HCP concerned with the e-mail communication in a specific IT project. Business process improvements for the case organization are suggested after a qualitative analysis of the output model. Moreover, evaluation results comprise contributions to theory and language development. The language development is an extension of the interactions in the language with attributes that are relevant for interaction instances. An interaction instance is a specific execution of an interaction with its own interaction data.
Chapter 5
Corresponding manuscript: “Marco Stuit and Hans Wortmann, A collaboration process study with application of agent interaction and behaviour diagrams, In: W.W. Smari and W.K. McQuay (Eds.), Proceedings of the 2010 International Symposium on Collaborative Technologies and Systems, pp. 302-313. Washington, DC, USA: IEEE Xplore, 2010”. This chapter performs a case study of a HCP at a Dutch municipality. The selected HCP comprises the collaborative work of the employees concerned with youngsters who drop out from school. The chapter elicits shortcomings of existing graphical workflow-based process modelling languages in the modelling of HCPs. In the case study, the TALL modelling language is applied and shown to address these shortcomings. Evaluation results comprise actionable insights for the municipality after a qualitative analysis of the TALL models, and contributions to theory development and development of the TALL modelling approach. The

Chapter 1
22
chapter extends the approach with a two-phase modelling method for local agent behaviour specification and analysis within a HCP’s interactions.
Chapter 6
Corresponding manuscript: “Marco Stuit, Nick Szirbik, Hans Wortmann, and Jan Roodenburg, Multi-view interaction modelling of human collaboration processes: A business process study of head and neck cancer care in a Dutch academic hospital, Journal of Biomedical Informatics, Under Review (2nd round after Moderate Revision)”. This chapter introduces and applies an extension of the TALL modelling approach based on a case study at a Dutch academic hospital. The extension is a novel modelling method, named multi-view interaction modelling. The selected HCP concerns the human interactions between healthcare workers in a multidisciplinary medical team involved in the head and neck oncology care pathway. The effectiveness and usefulness of the method to collect and formalize the tacit domain knowledge of the involved healthcare workers in individual TALL interaction diagrams is demonstrated. In a second phase, the method makes use of the global construction algorithm from Chapter 3 to integrate the multiple local interaction diagrams into a single global interaction diagram. This global diagram provides a consolidated overview of the interactions in the healthcare HCP. A qualitative analysis of the global diagram is shown to realize business value through the identification of several desirable HCP improvement opportunities.
Chapter 7
This chapter ends the thesis with the following. First, it presents a cross-case analysis in which the results from the three evaluation case studies are used to build support for several scientific statements about the TALL modelling approach. Second, based on the modelling experience from the four case studies, this chapter presents the set of TALL modelling guidelines. This set provides a list of modelling activities to support modellers in the usage and application of the TALL modelling approach. Finally, this chapter concludes the thesis with a discussion of the main contributions, evaluation results, and possible future research directions.

Chapter 2
Agent-oriented modelling and verification of human collaboration processes
This chapter is an edited version of the manuscript: Marco Stuit and Nick B. Szirbik. Towards agent-based modelling and verification of collaborative business processes: An approach centred on interactions and behaviours. International Journal of Cooperative Information Systems, 18(3/4), 2009.

Chapter 2
24
Abstract
his chapter presents an interaction-centric business process modelling language, named TALL, based on agent-oriented concepts. The language is both formal and graphical. Existing agent-oriented modelling languages,
developed in the multi-agent community, focus heavily on software implementation issues. This chapter argues that (networks of) organizations, which elect or envisage multi-agent systems for the support of human collaboration processes (HCPs), should start with a proper process-oriented understanding of the collaborative work practice of the agents in the business domain under consideration. The TALL modelling language introduces a novel diagram to represent the wide range of human interactions in a HCP as a hierarchy of role-based interactions in a tree structure. In the tree structure, human interactions have both composition and routing relations to each other. The behaviours owned by the agents playing the roles in the tree are specified in separate process diagrams. A HCP studied in the context of a case study at a Dutch gas transport company is used to illustrate the modelling language. Explicit (agent-oriented) process models can and should be verified using formal methods. In the business process management community, design-time verification of a process definition is considered vital to ensure the structural correctness and termination of a business process. The proposed modelling language is enhanced with a design-time verification method. The direction taken in this research is to combine the interaction tree and the associated agent behaviours into a verifiable hierarchical coloured Petri net to take advantage of its well-defined (execution) semantics and proven (computerized) verification techniques. The design-time verification method consists of three steps: (1) the translation of the TALL diagrams to a hierarchical coloured Petri net, (2) the identification of process design errors, and (3) the correction and rollback of process design errors to the TALL diagrams. The translation technique is implemented in a software tool that outputs the hierarchical coloured Petri net in a format that can be loaded in the widely used CPN Tools software package. Verification results are discussed for the case study models.
T

Agent-oriented modelling and verification of human collaboration processes
25
2.1. Introduction
Pervasive graphical process modelling languages like BPMN (White, 2004), WS-BPEL (OASIS, 2007), Petri nets (Desel, 2005), UML activity diagrams (Dumas & ter Hofstede, 2001; Eshuis, 2002), EPCs (Scheer, Thomas, & Adam, 2005), and IDEF0 (Mayer, Painter, & deWitte, 1992) create structured well-defined process models. In these languages, the collection of tasks or activities in the business process is ordered in a strict pre-defined execution sequence that is performed in an imperative way (Pesic & van der Aalst, 2006). Such languages are appropriate for modelling business processes that display complex activity or task flows but are less appropriate for modelling business processes that involve the interaction of a multitude of actors (Barjis, 2007; De Backer, Snoeck, Monsieur, Lemahieu, & Dedene, 2009; Hommes, 2004; Melão & Pidd, 2000; Ryu & Yücesan, 2007).
Nowadays, Information Technology (IT) systems that support human collaboration processes (HCPs), which usually run across internal (e.g. team, departmental) and external (e.g. organizational) boundaries are becoming popular to foster horizontal collaboration and information sharing. In HCPs, collaboration instead of task sequence determines the nature of the business activity. According to (Harrison-Broninski, 2005), collaborative activity simply does not match in any way the underlying “parallel flowchart” paradigm of current mainstream process notations and languages. Thus, novel modelling tools are required.
An increasing number of research efforts (Binder, Constantinescu, Faltings, Haller, & Türker, 2006; Buhler & Vidal, 2005; Ehrler, Fleurke, Purvis, & Savarimuthu, 2006; Verginadis & Mentzas, 2008; Yan, Maamar, & Shen, 2001) apply agents in the business process management domain by creating agent-oriented workflow management and business process management systems. These approaches offer more process flexibility, which is important for the application of business process support and automation in less structured application domains. There seems to be an opportunity for IT support by building software agents for support of (human) collaborative work practice (Partsakoulakis & Vouros, 2006). The agent paradigm promotes autonomous action and decision-making, which makes it relevant for modelling and implementing distributed business processes (Taveter & Wagner, 2002). However, most of these agent-oriented business process approaches are directed at the use of agents as part of the architecture and/or infrastructure associated with the system. Thus, the focus is on the use of agents as a technology rather than as a (business process) modelling framework.

Chapter 2
26
Well-known agent-oriented software engineering methodologies like MaSE (DeLoach, Wood, & Sparkman, 2001), Prometheus (Cheong & Winikoff, 2006; Padgham & Winikoff, 2003; Padgham & Winikoff, 2004), Tropos (Bresciani, Perini, Giorgini, Giunchiglia, & Mylopoulos, 2004), Gaia (Wooldridge, Jennings, & Kinny, 2000), and MESSAGE (Caire, et al., 2001; Caire, et al., 2002) support the agent system development process from analysis and design to implementation. Dedicated agent-based modelling languages are core components of these methodologies. Other agent-based modelling languages include, amongst others, AUML (Bauer, Müller, & Odell, 2001; Odell, Van Dyke Parunak, & Bauer, 2000), AORML (Wagner, 2003), AML (Cervenka, Trenanský, Calisti, & Greenwood, 2005; Cervenka, Trenanský, & Calisti, 2006; Trenanský & Cervenka, 2005), and OPM/MAS (Sturm, Dori, & Shehory, 2003). All these agent-based languages are information systems modelling techniques, and are not fully and easy applicable to business process design and analysis. In general, they are focused on system specification instead of business process specification.
As process-aware IT systems (Dumas, van der Aalst, & ter Hofstede, 2005) grow in scale and complexity (e.g. multi-agent systems), business process modelling becomes increasingly crucial to model and understand the business processes to be supported. Therefore, this chapter stresses that organizations that
elect or envisage agent technology for HCP support should start with a proper understanding of the work practice of the agents in the business domain under consideration.
This chapter consists of two main parts. The first part presents the TALL modelling language, a graphical and formal interaction-centric business process modelling language, inspired by the agent paradigm. The development of the language is motivated by the need for novel modelling tools for (agent-driven) HCPs. The main innovation of TALL is that it is a business process modelling language, based on agent-oriented concepts and notations. Thus, the language is more suited for business process modelling than the agent-based languages, which focus mainly on system specification. In the language, HCPs are addressed in two ways. On a high level, an interaction diagram is used to visualize inter-agent interactions in a tree layout. In the interaction diagram, a HCP is conceived as a structure of role-based interactions in which agents behave and coordinate their work. Individual agent behaviours are specified in process models, which are owned by the agents who are assigned to play the roles in the interaction diagram.

Agent-oriented modelling and verification of human collaboration processes
27
The logical step after a HCP has been modelled with TALL is to implement it in a multi-agent system for execution purposes. However, fundamental flaws in the agent behaviours should be identified before these are used for further design and/or implementation. For instance, to directly code the behaviours of software agents in a multi-agent system that supports the HCP. Design-time verification is concerned with determining whether a process model exhibits certain desirable structural properties before it is used for execution (Wynn, Verbeek, van der Aalst, ter Hofstede, & Edmond, 2009). Verification is essential in collaborative business settings (De Backer, Snoeck, Monsieur, Lemahieu, & Dedene, 2009; Ryu & Yücesan, 2007) where the design and run-time complexity of the process increases because agents perform their local behaviours autonomously when engaged in interactions.
The second part of this chapter is devoted to an execution-platform-independent design-time verification method. This method is focused on the structural correctness and compatibility of the agent behaviours that perform the interactions in a given HCP5. The direction taken in this research is to translate the TALL HCP (THCP) model (i.e. the combined interaction and behaviour diagrams) into a hierarchical Coloured Petri (CP) net to take advantage of its well-defined (execution) semantics and proven (computerized) verification techniques. The verification method is able to verify the structural composition of individual agent behaviours into the interactions that form a HCP. The user can experiment with a specific set-up of agent behaviours to check if they contain no design errors and inconsistencies, and send each other the required messages to complete the interactions. After correction, this results in a coordinated set-up of the agents that avoids deadlock and livelock situations6, which is a necessary and desirable property of agent systems (Nwana, Lee, & Jennings, 1996). The design-time verification method enhances the quality and reliability of the THCP model and the (future) multi-agent system that supports the HCP. After verification, the agent behaviours can be subject to further analysis, design, simulation, and/or implementation.
5 A HCP model is structurally correct if there exists, for each interaction in the HCP, at least one (collaborative) scenario that can successfully end through a specific set-up of agent behaviours. Section 2.4 discusses the design-time verification method in more detail. 6 Deadlock refers to a state of affairs in which further action between two or more agents is impossible. On the contrary, livelock refers to a scenario where agents continuously act (e.g. exchange tasks), but no progress is made (Nwana, Lee, & Jennings, 1996).

Chapter 2
28
The TALL modelling language and the supporting verification method are useful in the field of requirements engineering for multi-agent systems7. This chapter is not concerned with the question how TALL’s semantics can be implemented by an (existing) agent platform. Each platform may attach its own semantics to an input process specification or may not even have formal execution semantics to run process models. A TALL-focused evaluation of agent platforms is beyond the scope of this chapter.
The remainder of this chapter is structured as follows. Section 2.2 introduces a case study of a real-life HCP that is used throughout this chapter to illustrate the language and verification method. Next, Section 2.3 presents TALL. After, Section 2.4 introduces the proposed verification method. Section 2.5 describes the set of translation functions that translate the THCP model to a hierarchical CP net. Next, Section 2.6 describes formal verification of the hierarchical CP net and the correction of the THCP model based on the verification results. After, Section 2.7 provides a discussion. Section 2.8 presents related work. Finally, Section 2.9 gives conclusions and highlights future work.
2.2. Case Study
A case study of a real-life HCP at Gasunie Transport Services Inc. (GTS), concerned with the provision of gas transport services (from now on: the GTS process), is used to illustrate the TALL modelling language and the design-time verification method. GTS agreed to participate in a case study where the authors received access to company documentation and received permission to meet with process experts and participants. Thus, the primary form of data collection was desk study, and interviews8 with process experts and participants.
The liberalization of the gas market in The Netherlands on July 1, 2005 implied a strict separation between the trade and transport of natural gas. The national Dutch gas infrastructure company NV Nederlandse Gasunie was split into two autonomous companies, a gas transport company named Gasunie, and a purchasing and sales company for natural gas named GasTerra. The main activity of Gasunie is to manage, maintain, and adjust the gas transport system. The division GTS of Gasunie is responsible for the management, operation, and development of the
7 A single superior solution is not advocated with TALL. Existing agent-based languages and development paradigms can be used to describe different aspects of a multi-agent system in more detail or to finally build the software agents. 8 The interviews had the form of informal iterative consultations. Therefore, this chapter does not discuss in detail the interview process.

Agent-oriented modelling and verification of human collaboration processes
29
national gas transport grid on an economic basis. GTS provides gas transport services in order to promote a well-functioning liberalized gas market. Transport services are mainly requested by shippers, the largest customer group of GTS. A shipper is a company that uses the grid to transport gas. As soon as a shipper concludes a transport contract with GTS, it is regarded a supplier of gas to end-users (i.e. the actual users of gas like residential consumers, businesses, or industries).
The GTS process provides shippers with several gas transport-related services9. Service provisioning has become increasingly electronic in recent years. GTS uses a web-enabled ERP system to offer certain services to shippers. Still, several services have to be requested manually by fax or e-mail through an application form that is downloaded at the website of GTS. These services are called ‘offline’ services and are handled manually. Moreover, certain online services require considerable manual effort. The manual service requests require collaboration between the shipper and GTS, and between the (technical, legal, financial etc.) employees within GTS. Because of the complexity of the service request, the vast amount of data that needs to be verified, the specific requirements of certain shippers and the involvement of multiple departments, continuous human interaction is required.
The GTS process has been simplified to take into account a non-disclosure agreement but also for the purpose of explanation and illustration. Nevertheless, the key aspects of the process are still present. The case study focuses on a fragment of the GTS process that is concerned with a selection of transport services:
Booking of Entry/Exit Capacity: GTS uses an entry-exit system for the national gas transmission grid, in which the gas enters the grid at entry points and leaves the grid at exit points. Shippers can book both entry- and exit transport capacity;
Reduction of Contracted Capacity: A shipper can reduce the contracted capacity by 20% free of charge;
Shift of Capacity: A shift of capacity allows capacity that was booked for a particular exit point to be transferred to another exit point for a specified period.
9 For a description of all the transport services that can be booked by shippers, the website of GTS can be consulted: http://www.gastransportservices.nl/en/homepage.

Chapter 2
30
As part of the booking process for entry/exit capacity, GTS performs a technical capacity check a financial availability check. Most of the capacity checks can be executed by the ERP system since the requested capacity is simply compared with the available capacity. However, in certain areas of the transport grid, network points are clustered and influence each other. The complexity of the capacity check for such network points requires an employee of the back office (i.e. the capacity planner) to perform a manual capacity check. The manual check requires interaction with other employees. The same human-based scenario can apply to the financial check that checks the creditworthiness of shippers. The financial position of a shipper is dependent on the bookings already made by the shipper. With complex bookings, like the one above, the financial check needs to be performed manually by an accountant.
2.3. The TALL Modelling Language
2.3.1. Preliminaries and requirements
Contemporary organizations are complex collaborative networks (Camarinha-Matos & Afsarmanesh, 2005). The business processes of such organizations involve more people who collaborate both within and across the organization. TALL is inspired by the agent paradigm to model HCPs. The organizational context in which a HCP occurs is seen as a multi-agent environment in which different agents behave in interactions to coordinate their work. The main modelling concepts in the language are agents, roles, behaviours, and interactions. The language explicitly recognizes the interaction as the core activity in collaborative organizational work.
The initial design of the TALL modelling language rests on five requirements for HCP modelling, which are related to the four main language concepts. A business process is a flow of process elements. In a HCP, the core process element is the interaction. An interaction can be arbitrarily complex or nested. In this regard, a HCP consists of a process structure of related composite and simple (i.e. non-composite) interactions. The first requirement is that the language must be able to model both interaction flow and composition. The second requirement is that the language must allow to identify the agents in the business domain under consideration. Agents are part of a formal structure within their organization, which is usually based on the structure of official roles or job titles. It is the role that assigns certain responsibilities to an agent, requires their involvement in interactions, and requires the execution of tasks (i.e. behaviours). Therefore, the

Agent-oriented modelling and verification of human collaboration processes
31
third requirement is that the language should specify roles in interactions as to divide responsibilities and ensure interaction completion. Roles can be played by multiple agents and an agent can play multiple roles in a given HCP. The fourth requirement is that the language separates between agents and roles. The interaction provides the context in which agents perform their behaviours (by playing roles) and communicate with other agents. The fifth requirement is that it should be possible to specify the local (communicative) behaviours of the agents in a given interaction.
With regard to process modelling, TALL separates between multi-agent interaction specification and single agent behaviour specification. The Interaction Structure (IS) diagram introduces a higher-level notion of process that establishes the role-based interaction structure of a given HCP in which the agents behave. A set of Agent Behaviour (AB) diagrams specify the individual local behaviours of the agents that are assigned to the roles in the IS diagram. In this way, the IS diagram separates the definition of process-wide behaviour (i.e. multi-agent system behaviour) from the possible ways to perform that behaviour.
The use of explicit process models is in line with a process-oriented approach. On the one hand, this is different from existing agent-based languages that are used mostly for software modelling. On the other hand, existing graphical process modelling languages are not agent-oriented, and do not address properly collaboration and interaction (Stuit & Wortmann, 2010). Moreover, in TALL, agent behaviour specification is done from a local viewpoint using explicit process models in the form of the AB diagrams. Other process modelling approaches do not model explicitly the local views or beliefs an agent has about an interaction (Stuit, Szirbik, & de Snoo, 2007; Stuit & Wortmann, 2010). Traditional business process modelling takes a monolithic view; the modeller sees the entire business process from a central view and creates a monolithic process definition. In such a process definition, a lack of consistency between the agent behaviours is not allowed.
2.3.2. Diagrams, graphical syntax, and semantics
Figure 2-1 shows how TALL’s main modelling concepts (i.e. agents, roles, interactions, and behaviours) are graphically visualized and connected. Interactions are depicted as flattened hexagons with their names as labels. Roles are depicted as ellipses, have their names as labels, and are attached to the lines outgoing the hexagon. Agents are depicted as rounded rectangles, have their names as labels, and are assigned to play roles. In the IS diagram, behaviours are depicted as

Chapter 2
32
chevrons (i.e. arrow rectangles), carry an agent-role label, are owned by the adjacent agent, and are detailed in an AB diagram.
Figure 2-1. Abstract example of TALL’s main modelling constructs. Agents that play ‘connected’ roles interact by performing their individual local behaviours.
Agents and roles
From a modelling perspective, all the interaction participants in a given HCP are viewed as agents whose nature can be individual (human or software agent) or collective (synthetic agent). Human agents represent the people that make up an organization. Software agents are software applications that run on computer platforms, and autonomously carry out certain activities within the business process on behalf of a human or synthetic agent. Other IT systems like (legacy) enterprise information systems can also be modelled as software agents, and be exposed as agents by transduction or wrapping (Genesereth & Ketchpel, 1994).
Most organizations do not have an empty IT landscape. Agents are deployed in an environment with legacy systems. The inclusion of legacy systems in the modelling exercise as software agents allows the modeller to capture the current IT landscape and helps to mark applications that are affected by (i.e. that have to be transduced or wrapped to enable agent communication) the introduction of the possible future multi-agent system. A software agent can also be assigned to a passive object, like a chair (physical entity) or an order (information entity). Synthetic agents (Carley, 2002) are composite agents that consist of zero or more internal (human, software, or synthetic) agents, and typically represent organizations or organizational units. Synthetic agents have their own (organizational level) behaviours, that is, their behaviours are not simply the behavioural aggregate of their constituents. This is useful when the internal agents are not known at design time, or when it is hard or impossible to identify the behaviours of the constituent agents in detail. The latter is especially true with complex human behaviours. An example, in which the synthetic agent concept is useful, is when a project team (i.e. a synthetic agent) is assigned to a role in an interaction with a client. In this case, the abstract behaviour of the project team can be studied and modelled as a single entity, and a software agent can be created to directly support some of the teams’ activities. It is not

Agent-oriented modelling and verification of human collaboration processes
33
necessary to study the detailed behaviours of the (possibly unknown) project members.
The structural composition of synthetic agents is shown in the TALL Agent Structure (AS) diagram. This diagram helps to identify the agents in the business domain under consideration. Figure 2-2 shows a possible composition of the high-level synthetic agent that represents GTS. A line between two agents indicates software agent ownership. Graphically, icons that appear in the top-left corner of the agent symbol are used to distinguish between the three agent types: circles represent human agents, squares represent existing software agents, and triangles represent synthetic agents.
Figure 2-2. The composition of the synthetic agent GTS.
In TALL, an interaction does not exist without at least two roles being bound to it. Several authors share this view. According to (Genilloud & Wegmann, 2000), a role that does not interact with other roles is of no interest. Zambonelli, Jennings, and Wooldridge (2001) mention that agent-to-agent interactions are well identified and localized in the definition of the role; it is the role that requires a given form of interaction behaviour. Ferber and Gutknecht (1998) specify valid interactions only between roles. Odell, Van Dyke Parunak, and Fleischer (2003) indicate that roles provide the building blocks for agent social systems and the requirements by which agents interact. In TALL, roles are placeholders for the agents. They serve as bridges or intermediaries between interactions and the agents playing them. Thus, a role is directly linked to an interaction and is an independent object separate from the agent that is assigned to play a specific role. This view of roles is based on the work of Steimann (2000a; 2000b; 2001). A given role may be played multiple agents and a specific agent may play multiple roles in one or more interactions in the HCP under study. For simplicity reasons, roles can be thought of as generic participant types instead of specific participants (i.e. agents). The roles in an

Chapter 2
34
interaction also represent division of responsibility. The roles in the IS diagram are determined and named at design time.
In the IS diagram, the modelled agents are agent instances. Other diagrams in TALL can represent agents at a more generic level. The meta-concept of the language is agent group, which is similar to an extent to agent type (Stuit & Szirbik, 2007). An agent group can be statically related to a role in various ways. In the AS diagram (see Figure 2-2), a special kind of anonymous instance (i.e. the prototypical agent instance, like anAccountant) can be used. When a multi-agent system enacts the IS diagram for real-life HCP support, it is likely that the roles are filled dynamically by the agents at execution time. However, at design time, agents may be assigned to play the roles to show a prescriptive IS diagram (i.e. these are the agents that can or must play the roles). In the context of this chapter, the inclusion of agents in the IS diagram and the explicit formalization of their local behaviours in AB diagrams enables design-time verification of the agent behaviours (see Section 2.4).
Agent interaction modelling
The IS diagram of the GTS process is shown in Figure 2-3. The IS diagram represents an interaction tree: it is a hierarchical set of role-based (parent and child) interactions. Interactions are related to other interactions through composition (one interaction being part of another) and routing (one interaction must be completed before, in parallel with, or instead of another interaction).
Each interaction in the IS diagram appears at a certain level in the tree. The root level, which starts at the top, is level zero. Parent interactions are interactions that have sub-interactions (read: child interactions) in the tree. A collection of child interactions (i.e. sibling interactions) constitutes a parent interaction according to certain routing constraints. The supported routing types are sequential routing (SEQ), parallel routing (PAR), and exclusive (non-deterministic) choice (XOR). Type SEQ indicates that all children of the parent interaction execute in an ordered sequence. There is a strict dependency between the interactions. Type PAR indicates that all children execute in parallel, there is no strict dependency between the interactions. The interactions can be performed at the same time (i.e. true concurrency) or in an arbitrary order (i.e. an unordered sequence). Type XOR indicates that a non-deterministic choice is made to execute only one of the children at a time.

Agent-oriented modelling and verification of human collaboration processes
35
Figure 2-3. The IS diagram of the GTS process.

Chapter 2
36
Decision rules can be attached to the routing types to enable rule-based execution of a set of sibling interactions. Type XORd uses the decision rule to make a deterministic choice for only one of the children. In (van der Aalst, ter Hofstede, Kiepuszewski, & Barros, 2003), the authors introduce the multi-choice routing pattern that can choose multiple alternatives from a given set of alternatives. This pattern corresponds to an OR-split in which one or more of the child interactions are executed at a time (i.e. an inclusive choice is made). However, when two or three are executed, it is not clear if these children are executed in a sequence or in parallel. The types SEQd and PARd address this issue. Based on the evaluation of the decision rule, an inclusive choice can be made for one or more of the children. When two or more are executed, they are performed in a sequence or in parallel. Figure 2-4 illustrates all supported routing types.
Figure 2-4. The routing types supported in the IS diagram.
Graphically, routing types appear below parent interactions like in Figure 2-3. Iterative routing can be specified by attaching a single child to a parent interaction with routing type SEQd. The decision rule specifies the iteration and enforces the repeated execution of the single child (and its children, sub children, and so on). An example is the Plan Booking Request interaction in Figure 2-3. Based on the evaluation of the decision rule, the Plan Booking Request interaction is executed at least once and continues until a certain condition holds (like the java “do-while” construct), or the interaction is executed a certain number of times through a counting loop (like the java “for” loop). In the GTS process, when a booking request is being planned, both the network point for which the booking request is made and the requesting shipper is blocked. Another booking request on the same
Sequential Routing
Parallel Routing
Exclusive Conditional
Routing
Decision Rule
No Decision Rule XOR SEQ PAR
PARdSEQdXORd

Agent-oriented modelling and verification of human collaboration processes
37
network point or by the same shipper is put in a queue. Planning attempts are made until the booking has been successfully planned.
Adams, ter Hofstede, Edmond, and van der Aalst (2006) mention that in most workflow management systems the degree of parallelism is fixed in the process definition. It is not possible to concurrently execute selected parts of the workflow process a variable number of times. Although iteration can be used to execute parts a variable number of times, according to the authors, this results in the sequential execution of inherently parallel tasks. The PARd routing type with a single child enables the parallel execution of a predefined number of maximum occurrences of the single child. Again, the child must be executed at least once.
Overall, the routing type SEQd uses the decision rule to select N-out-of-M (e.g. 2 out of 3) sequential interactions or to iterate a single child interaction. The routing type PARd uses the decision rule to select N-out-of-M parallel interactions or to enable the parallel execution of a specified number of maximum occurrences of a single child interaction. Thus, the SEQd and PARd routing types allow the specification of optional and repetitive interactions. Graphically, for the SEQ(d) and PAR(d) routing types, the sibling interactions are laid out linearly in the order of execution with the first interaction on the left.
The formal definition of the IS diagram (see Section 2.3.3) discusses the use of the decision rules in more detail. Figure 2-3 shows that the root interaction consists of the three main interactions described in Section 2.2: Booking of Entry/Exit Capacity, Reduction of Contracted Capacity, and Shift of Capacity. Each of these interactions has child interactions. When the capacity or the financial check yields a negative result, the Cancel Booking Request interaction is performed. In this case, the Complete Booking Request interaction (and its children) is not executed. During enactment of the IS diagram by a multi-agent system, this decision is made by the agent that evaluates the decision rule attached to the XORd routing type defined on the Evaluate Booking Request interaction. The Perform Automatic Capacity Check interaction mainly consists of activities that are executed by the GTS ERP system without any user involvement. The ERP system is actually working on the processing of the booking request. Thus, its work is modelled as an interaction with two roles: Transaction System and Booking Request. During execution, the GTS ERP system plays both roles.
The leafs of the interaction tree are named elementary interactions and are executed by agents that perform their behaviours. Completion of a set of elementary sibling interactions implies completion of the parent interaction

Chapter 2
38
according to the specified routing relation. This bottom-up process continues until the root interaction completes. Thus, by convention, completion or composition is read bottom-up while routing between sibling interactions is read from left to right.
In Figure 2-3, certain roles have been grouped on higher levels in the interaction tree. Grouping of roles in the IS diagram is a modelling convenience that helps to avoid role clutter as parent interactions collect the roles of their child interactions. The modeller can use the TALL Role Structure (RS) diagram (Stuit, Szirbik, & Wortmann, 2007b) (see Figure 2-5) to clarify the role grouping and/or to depict a reporting structure in the business domain under consideration. The AS and RS diagrams support the TALL modelling activity. Both diagrams help to structure the organizational environment in which the HCP occurs. This makes TALL a business process modelling language instead of only a process modelling language (Barjis, 2007).
Figure 2-5. The composition of roles at GTS.
Agent behaviour modelling
Figure 2-6 shows a segment of the IS diagram in Figure 2-3 that focuses on the Register Booking Request interaction. The human agent Shipper X and the software agent GTS ERP System are assigned to the roles Customer and Transaction System10. Both agents own a behaviour that is used to perform the interaction. In the IS diagram, the behaviours of the agents, which are playing the roles attached to the elementary interactions, are indicated by chevron symbols (see Figure 2-6). Chevron symbols represent the local behaviours of the agents on an abstract level
10 In a HCP, most interactions are performed between humans. This example is to illustrate that besides human agents it is possible to specify software agents as interaction participants, and also to model their behaviours (see below). The GTS ERP system could also be modelled as a synthetic agent and its modules as software agents for instance when it is desired to make explicit interactions between humans and certain ERP modules as part of the HCP.

Agent-oriented modelling and verification of human collaboration processes
39
and appear at the tail of the agent-role connector, adjacent to their owner agent. Chevrons have agent-role labels as their names. The agent-role label is a concatenation of the agent name (the owner), a colon, and the role name. The interaction to which the behaviour applies is apparent from the position of the chevron symbol. Each chevron symbol is a compact representation of an AB diagram that details the behaviour of the owner agent.
Figure 2-6. A fragment of the IS diagram of the GTS process in which two agents provide a behaviour to perform the Register Booking Request interaction.
SE
Q
Cu
stom
er
pla
ys
Tra
nsa
ctio
nS
yste
m
pla
ys
Pe
rfo
rmA
vaila
bili
tyC
hec
k
Eva
lua
teB
oo
kin
gR
eq
uest
Re
gis
ter
Bo
oki
ng
Re
que
st
GT
S E
RP
Sys
tem
:T
rans
actio
nS
yste
m
GT
S E
RP
Sys
tem
Sh
ipp
er
X
Shi
ppe
r X
:C
usto
mer

Chapter 2
40
Figure 2-7 shows the two AB diagrams that detail the chevron symbols in Figure 2-6. The two agents use these behaviours to perform the Register Booking Request interaction. An AB diagram is a swimlane that captures the intended behaviour of its owner agent. It depicts the internal states of the agent, and the communicative and non-communicative activities that cause it to change states. Each swimlane is marked with the agent-role label of the corresponding chevron. The messages sent and received by the agent are modelled explicitly as message places (see Figure 2-7).
Figure 2-7. The AB diagrams of the agents that are playing the roles attached to the Register Booking Request interaction in Figure 2-6.

Agent-oriented modelling and verification of human collaboration processes
41
AB diagrams are based on the Behaviour net formalism (Meyer & Szirbik, 2007a), an extension of the CP net formalism with the message place type. Message places enable the flow of tokens between the different agent behaviours in an interaction. In other words, different agent behaviours in an interaction communicate with each other through message exchange. The labels of message places act as their type names. These type names are useful to determine on which message place an incoming message is placed (e.g. the Booking overview message that is received by Shipper X). Message exchange is peer-to-peer, that is, if a certain agent sends the same message to two agents the (outgoing) message place is modelled twice in the AB diagram of this agent. This chapter assumes that any labels local to the agents are based on a common shared ontology of the business domain under consideration. Thus, agents use similar type declarations for matched message places and assign the same semantic meaning to these type names.
One or more modellers create AB diagrams. Data about human agent behaviours is preferably collected through one-to-one interviews with the involved process participants. Alternatively, non-intervening observation, study of organizational documentation (e.g. procedures, protocols, norms), and/or key informant consultations may be used. One or more of these data collection methods can also be employed to gather data about software agent behaviours (i.e. legacy system’s activities). Coarse-grained modelling of legacy systems’ activities in AB diagrams exposes their generic functionalities and interaction touch points. This helps to understand how humans interact with IT systems as part of the HCP under study. Moreover, it helps to clarify the boundaries between the HCP under study and the automated business processes (i.e. workflows). As mentioned before, also the behaviours of synthetic agents can be modelled in AB diagrams. In a multi-agent system development context, the formalized (human) behaviours can be used as executable specifications to directly code the behaviours of software agents that support the humans.
An agent can own multiple AB diagrams for each interaction in which it is involved. The associated chevron symbols may be drawn inside the owner agent. This means each agent can have a knowledge base of applicable behaviours in the form of AB diagrams. In the IS diagram, only the AB diagram that is selected for usage in an interaction is depicted (as in Figure 2-6). During enactment of the IS diagram by a multi-agent system, agents can make contextual run-time choices from their knowledge base of AB diagrams. The agents need to be implemented with a selection mechanism to identify and select an AB diagram for a given

Chapter 2
42
interaction. Based on the individual behaviour of an agent, there is no certainty that the behaviour(s) of the other agent(s) in the same interaction are matching the behaviour of the agent. If the agent behaviours are matching, the behaviours are said to be aligned. In aligned agent behaviours, the message places are exactly matched by number and type name (as in Figure 2-7).
The formalization of human, software, and synthetic agent behaviours in AB diagrams makes these behaviours explicit, which makes them amenable to analysis. As mentioned in Section 2.1, this chapter performs verification analysis to investigate the structural correctness and compatibility of the agent behaviours that perform a given interaction. For simple (intra-organizational) interactions with relatively simple agent behaviours or with only two involved agents, the modeller can manually achieve alignment by making sure each sending message place has a corresponding receiving message place of the same type in an AB diagram of another agent that is party in the interaction. However, for more complex interactions, with many inter-agent behavioural interdependencies or in modelling exercises where multiple modellers (from different organizations or organizational units) are involved, manual alignment is too difficult and error-prone. Using the proposed design-time verification method (see Section 2.4), the combined agent behaviours that result from the integration of the AB diagrams owned by the agents involved in a given (elementary) interaction can be verified for structural correctness and alignment. This implies that after any corrections and/or modifications, the execution of such an interaction is the coordinated execution of all the aligned agent behaviours involved.
AB diagrams allow beliefs about the contribution expected from other agents in the same interaction to be modelled. This allows an expected interaction to be modelled from the viewpoint of one agent. In this case, the AB diagram depicts the intended behaviour of the owner agent and the expected behaviours of other agents. Such an AB diagram is represented as a multi-swimlaned Behaviour net including message exchange points, and is named interaction beliefs in TALL. More detail about the interaction belief concept can be found in (Stuit, Szirbik, & de Snoo, 2007).
2.3.3. Formal definition: TALL process diagrams
The role of the graphical syntax, as presented in Section 2.3.2, is to allow easy interpretation of the diagrams by business users (Oude Luttighuis, Lankhorst, van de Wetering, Balb, & van den Berg, 2001). This section presents the formal definition that underlies the TALL process diagrams. This formal semantics not

Agent-oriented modelling and verification of human collaboration processes
43
only enables (future) execution of the diagrams in a multi-agent system, but also makes TALL more than simply a diagrammatic convention. Explanations of the individual parts of the formal definition are given immediately below it.
Definition 1 (IS and AB diagrams). The THCP model is a tuple (I, LI, <I, RT, R, LR, RI, A, LA, AR, AT, DR, AV, LAV, O):
a) I is the non-empty set of interactions and
b) LI: ILabelsI is the interaction labelling function that assigns a label to
each interaction and
c) <I I I is a relation such that:
<I is a partial ordering of I;
for any iI the set {sI | s <I i} is well-ordered;
L0 = {i0} with Lx = {iI | ht(i) = x} and ht(i) = |{sI | s <I i}|.
d) RT: I{SEQ, SEQd, PAR, PARd, XOR, XORd} is the routing type
function that assigns a routing type to each interaction. e) R is the non-empty set of roles and
f) LR: RLabelsR is the role labelling function that assign a label to each
role and
g) RI: RI is the role-interaction function that connects roles to
interactions. h) A is the set of agents and
i) LA: ALabelsA is the agent labelling function that assign a label to each
agent and
j) AR: AR is the agent-role function that assigns agents to roles and
k) AT: A{H, S, Y} is the agent type function that maps each agent to a
generic agent type: Human, Software, or sYnthetic.
l) DR: IDDRS is the decision rule function that assigns a decision rule set
DRS to each interaction that applies a decision rule with: ID = {iI | RT(i){XORd, SEQd, PARd}.
m) AV is the set of agent behaviours and
n) LAV: AVLabelsAV is the agent behaviour labelling function that
assigns a label to each agent behaviour and
o) O: AVA is the ownership function that assigns agents (read: owners) to
each agent behaviour.

Chapter 2
44
(a&b&c) The IS diagram is a graphical representation of an interaction tree. The interactions in the set I are the nodes in the tree that form the HCP under study. The set I is required to be non-empty because the root interaction is always defined for any HCP. Interactions in the IS diagram are denoted by interaction labels. Each interaction in the tree has a unique id. Therefore, interactions with identical labels, which are assigned by the labelling function LI, are allowed. Identically labelled interactions are different by their position and are unrelated when executed.
The partial ordering relation <I connects parents and their children, that is, it is a set of ordered pairs (i, s) where the first element is a parent interaction iI and the second element is a child interaction sI. The nodes in the tree immediately greater than (or succeeding) a node are called its children. The node immediately less than (or preceding) a node is called its parent (if it exists). Any node lesser than a node is an ancestor and any node greater than a node is a descendant. The partial ordering <I represents distance from the root and the well-ordering requirement ensures that each node has at most one parent, and therefore at most one grandparent, and so on. Nodes with no ancestors are roots: {iI | sI: s <I i}. Elementary interactions are nodes with no descendants: EI = {iI | sI: i <I s}. For any node, its set of ancestors is well-ordered. Hence, an ordinal that denotes height can be associated to any node: ht(i) = |{sI | s <I i}|. In this way, the x-th level of the tree is defined to be the set: Lx = {iI | ht(i) = x}. Consequently, L0 denotes the root level in the tree. The set L0 is required to be a singleton set to make sure there exists only one root interaction i0. Whenever a <<I b in I (i.e. interaction a is an immediate predecessor of interaction b), interaction a is placed higher than b in the IS diagram and there is a line drawn from interaction a to b (called an edge). In this way, movement downwards indicates succession. Graphically, the lines between each parent and its direct children converge in the routing type symbol that graphically appears below each parent.
Two auxiliary functions are defined to navigate the IS diagram. The function children(i) returns the set of direct children (i.e. immediate successors) of interaction i: children(i) = {sI | i <<I s}. Logically, the set children(i) is empty for an elementary interaction. The function parent(i) is used to denote the parent of interaction i: iI: [parent(i) = {sI | s <<I i}].
(d) Formally, each routing type is defined on a parent interaction. Graphically, in the IS diagram, routing types appear below parent interactions. The function rank
SI , based on Eshuis and Grefen (2008), is used to indicate the (sequential)
order of two or more children of parents with routing type SEQ or SEQd: SI = {s

Agent-oriented modelling and verification of human collaboration processes
45
children(i) | RT(i){SEQ, SEQd} |children(i)| > 1}. Graphically, in the IS diagram, the sequential order is determined by the relative horizontal positions of the child interactions, starting at rank zero and increasing with one unit from left to right.
(e&f&g) The set R contains all the roles that are relevant to the set of interactions I. Each interaction iI is required to have at least two roles attached: I = {iI | 2 rR: (r, i)RI}. Since the root interaction is always defined, the set R is required to be non-empty. The function RI connects roles to interactions such that each role rR belongs to an unique ordered pair (r, i) in RI. Whenever (r, i)RI, there is a line drawn between r and i in the IS diagram. When multiple agents play the same role in a given interaction, they are assigned to a single occurrence of that role.
(h&i&j&k) The set of agents A is built by identification of the agents in the business domain under consideration. Each agent is a human, software, or synthetic agent. Agents are denoted by agent labels. The function AR connects agents to roles such that each agent aA belongs to an unique ordered pair (a, r) in AR. Whenever (a, r)AR, there is a directed line drawn between a and r in the IS diagram. This line always carries the annotation plays (see Figure 2-6).
(l) The set ID contains all interactions with a routing type that needs to dynamically apply a decision (XORd, SEQd, and PARd). This decision can be generically expressed as a “rule”, called here decision rule. The function DR assigns a decision rule set to each interaction iID. The decision rule set manages the control flow of the direct child interactions of interaction i at runtime. A decision rule set can be viewed as a pseudo-workflow that is built upon implicit, explicit, and eventual formal business rules (Business Rules Group, 2000). In the abstract formal definition of the IS diagram, it is not necessary to specify the concrete syntax in which the rules are specified internally to the agents. The concrete syntax depends on the formal (rule-based) framework that is used to build the multi-agent system.
The business domain under consideration can adopt a multi-agent system for distributed HCP support that enacts the IS diagram, the associated (agreed upon) business rules, and coordinates the distributed agent behaviours. Based on the decoupling between the multi-agent interaction specification and the single agent behaviour specification (IS diagram vs. AB diagrams), all the decision rule sets should be separated from the agents. Moreover, they should be explicitly represented, as well as (possibly) dynamically inspectable and modifiable (Ricci,

Chapter 2
46
Omicini, & Denti, 2002). In this way, each decision rule set can be considered the formal expression of the business logic available and known to all agents involved in the execution of a certain HCP.
(m&n&o) The set AV contains all agent behaviours in the business domain under consideration. Graphically, the elements (read: agent behaviours) in this set appear in a compact form (as chevron symbols) in the IS diagram and as detailed agent behaviours (read: Behaviour nets) in the AB diagrams. Although agents can own multiple AB diagrams for the same interaction, the formal definition focuses on the behaviours selected and used by the agents to perform the interactions. These are also the relevant behaviours for design-time process verification (see Section 2.4). Agent behaviour labels are agent-role labels that mark the chevron symbols in the IS diagram and the swimlanes in the AB diagrams. Ownership of agent behaviours is set by the function O that assigns agent behaviours to agents such that each agent behaviour belongs to an unique ordered pair (av, a) in O. Agents that play a role, select and use one agent behaviour to perform the interaction. The composition RI AR of the functions AR and RI is a function from
the set of agents A to the set of interactions I: RI AR: AI. A pair (a, i) is only a
member of the composition if there exists a role rR and an agent aA that is connected to that role, and if the role is connected to the interaction iI: {(a, i)A I | rR: (a, r)AR (r, i)RI}. Whenever (a, i)RI AR, the selected agent behaviour (i.e. chevron symbol) is drawn at the agent side of the agent-role line with its arrowhead connected to the line (as in Figure 2-6). The auxiliary function ReturnAV(i) returns the subset of agent behaviours that are owned and selected by the role-playing agents involved in the elementary interaction iEI: ReturnAV(i) =
{avAV | aA: (av, a)O (a, i)RI AR iEI}. Logically, ReturnAV(i)AV.
2.3.4. Modelling guidelines and tool support
Modelling guidelines
Modellers can use the following guidelines to apply the TALL diagrams and the design-time verification method presented in this chapter. Understand the business domain under consideration The (lead) modeller builds an AS diagram of the agents in the business domain under consideration. The highest-level synthetic agent is the agent that contains the business entities, which form the team operating the HCP. These business entities

Agent-oriented modelling and verification of human collaboration processes
47
make up the first level of synthetic agents. In this way, the synthetic agent concept guides thinking in the initial modelling phase when the existing agents in the business domain are being identified. Next, lower-level synthetic agents (e.g. teams or departments) and the human agents that are members of the synthetic agents are identified. This activity may include an analysis of the current IT landscape to identify any software applications that interact with human agents or that may need to communicate with the (future) multi-agent system. These software applications are modelled as software agents in the AS diagram. Collect the necessary data The input to the TALL modelling activity is organizational documentation, interviews with process participants and/or experts, and any other data collection methods. The process participants play an important role because they are knowledgeable about the interactions and behaviours performed by them and colleagues, and the interrelations between all these interactions. Thus, the modelling effort is most advantageous when the business domain under consideration allows the human process participants to be actively involved. The modeller(s) has(have) the task to collect (local) process knowledge from the humans and formalize it in an IS diagram and associated AB diagrams. Build the IS diagram In this activity, the modeller(s) build(s) an IS diagram based on the collected knowledge/data. Since interactions and roles are strongly related, they can be modelled and named in parallel. Alternatively, a RS diagram can be created first (and updated later) to inform the creation of the IS diagram. The IS diagram is built using a top-down or bottom-up approach:
Top-down approach: start with the overall root interaction of the HCP and, based on the collected knowledge/data, decompose it in child interactions with the correct routing relations. Continue the decomposition process as long as child interactions can be identified;
Bottom-up approach: based on the collected knowledge/data, make a list of interactions and compose these into an IS diagram with correct routing relations.
In practical modelling exercises, a combination of these approaches is typically used.

Chapter 2
48
Assign agents to the roles and build AB diagrams For verification and execution purposes, it is sufficient to assign agents to the roles of elementary interactions only11. If any new agents are identified in this activity, the (lead) modeller updates the initial AS diagram. The modeller(s) detail(s) the behaviours of human, software and/or synthetic agents in AB diagrams. For human agents, this is preferably based on local process knowledge collected during one-to-one interviews. The intermediate output after this activity is an IS diagram and several AB diagrams that specify the agent behaviours. All diagrams can be validated together with (key) people from the business domain under consideration to check if the models reflect reality and user expectations. Translate the THCP model into a verifiable hierarchical CP net The proposed design-time verification method relies on existing formal methods and associated computer tools to determine the structural correctness of the THCP model (i.e. the combined interaction and behaviour diagrams). The entire THCP model is translated to a hierarchical CP net for verification purposes. Sections 2.4 to 2.6 explain in detail the verification method. Use CPN Tools to verify the hierarchical CP net This research adopts the CPN Tools software package (Jensen, Kristensen, & Wells, 2007) to execute formal verification of the CP net produced by the verification method. The TALL2HCPN translation software tool (see Section 2.5.2), which implements the set of translation functions that translate the THCP model to a hierarchical CP net (see Section 2.5.1), produces a CP net format that can be directly loaded in CPN Tools.
Toolset
A software toolset has been developed to support the TALL modelling language. The toolset includes the TALL Visual Editor that allows the user to build and manipulate TALL diagrams. The toolset is freely available from the software section on http://www.agentlab.nl/. The editor stores the diagrams and its modelling elements, including basic layout, positioning and relations between elements, in an associated database. Figure 2-8 shows the IS diagram of the GTS process in the editor without roles. In the drawing window, any element can be directly selected and moved. Moreover, the Visual Editor allows expand-and-
11 For descriptive purposes, agents can be assigned to any interaction in the IS diagram.

Agent-oriented modelling and verification of human collaboration processes
49
collapse navigation of complex interaction structures using a tree view control. To create and manipulate AB diagrams, the user can start a Behaviour net editor directly from the drawing window through a double click on an inserted chevron symbol. On save, a created AB diagram is stored in an XML-format in the database and linked to the specific chevron symbol. The Behaviour net editor is described in more detail in (Meyer & Szirbik, 2007b).
Figure 2-8. Screenshot of the TALL Visual Editor that shows the IS diagram of the GTS process.

Chapter 2
50
2.4. Verification of the THCP Model
2.4.1. The need for design-time verification
A HCP consists of many interacting agents that use their local behaviours to execute parts of the process autonomously. The design complexity of HCPs and the many execution interdependencies between the agents spurs the need for formal verification at design time. As mentioned in Section 2.1, design-time verification is concerned with determining whether a process model exhibits certain desirable structural properties before it is used for execution (Wynn, Verbeek, van der Aalst, ter Hofstede, & Edmond, 2009). Thus, the verification in this chapter is concerned with structural model checking. Section 2.4.2 defines structural correctness in more detail. A coherent and coordinated set-up of the agents is required, a setup in which the agent behaviours contain no structural design errors and inconsistencies. This means that the agents send each other the required messages to complete their behaviours, the interactions and thus the HCP instance. In a structurally correct model, each sending message place in one agent behaviour has a corresponding receiving message place in the behaviour of another agent. A HCP instance is a single enactment of a HCP, which is managed according to an IS diagram. A HCP instance is created when the IS diagram is initiated by an agent that is triggered12. Although an IS diagram can be used to manage a majority of HCP instances, each HCP instance is independently controlled and has its own process state and identity.
A multi-agent system is a complex system with high investment and critical requirements. A coherent and coordinated set-up of the agents, ensured at design time, enhances the reliability and quality of the process definition and the (future) multi-agent system that uses these process definitions to provide HCP support. Corrections made at process execution time can be very costly. Not only the flawed agent behaviours may need to be corrected and/or modified but also certain parts of running HCP instances may need to be redone, or even the whole HCP instance may need to start over, sometimes by applying costly rollback procedures. In the
12 A trigger is the recognition of some predefined set of circumstances associated with the operation of the entire process, which causes a particular action to be taken (WfMC, 1999). In an agent context, triggers can be seen as events that are perceived by the agents and cause them to initiate certain actions (Wagner, 2003). Either an external trigger (i.e. a communicative event like receiving a message) or an internal trigger (i.e. a non-communicative event like perceiving or sensing the status of an object) may activate an agent. Of course, event processing involves much more detail, that is, some form of internal agent processing is required in order for the agent to know how to react when facing a specific trigger.

Agent-oriented modelling and verification of human collaboration processes
51
case of several HCP instances being active simultaneously, or if performing certain activities is costly or is required to be timely, correcting agent behaviours at execution time is detrimental. Moreover, it may displease partners or customers, especially in distributed business settings where malfunctioning affects several organizations or organizational units.
2.4.2. A design-time verification method for agent-driven HCPs
The proposed design-time verification method consists of three sequential steps: (1) the translation of the THCP model to a hierarchical CP net, (2) the identification of process design errors in the hierarchical CP net, and (3) the correction and rollback of process design errors to the THCP model. Section 2.5 details the first step, and Section 2.6 details the second and third phase. The remainder of this section introduces relevant terminology.
In the first step, the THCP model is translated to a hierarchical CP net. In this way, the analysis power of CP nets can be leveraged and existing computer tools, which implement proven verification techniques, can be used. A single hierarchical CP net that combines the IS and AB diagrams is produced by the translation. In this way, a single executable model is obtained that can be checked for proper termination and completion. As mentioned in Section 2.3.2, the execution of an elementary interaction is the coordinated execution of the involved agent behaviours. After translation, the verification method checks the structural compatibility of the combined agent behaviours that have to complete a certain elementary interaction. Structural compatibility is ensured when the combined agent behaviours are structurally correct.
There are different ways to define structural correctness. The notion of sound workflow nets (van der Aalst, 1997; van der Aalst, 2000b), a special subclass of Petri nets, expresses correctness criteria that any workflow process should satisfy. A workflow is named sound, if and only if, it satisfies the following criteria:
Option to complete: for each token put in the start place, one (and only one) token eventually appears in the end place;
Proper completion: when a token appears in the end place, all the other places are empty;
No dead transitions: for each transition, it is possible to move from the initial state to a state in which the transition is enabled.
These correctness criteria are relevant to any executable business process model. Therefore, the proposed verification method uses the notion of soundness to check

Chapter 2
52
the structural correctness and compatibility of the agent behaviours in a given HCP. The verification method is execution-platform-independent and is concerned with design-time verification. The latter means that the method verifies the model before it is executed, and before full data and control features are added. Design-time verification ensures that there exists a scenario, which can successfully end through a specific set-up of agent behaviours for a certain interaction. At execution time, agents deal with a wide range of parameters and environmental factors. This may cause run-time errors and prevent proper HCP completion even if a model was found to be structurally correct at design time. In (De Backer, Snoeck, Monsieur, Lemahieu, & Dedene, 2009), the authors make an analogy with a labyrinth. At design time, it is verified whether there is a path that leads to the exit. At execution time, the interacting agents should try not to engage in a death-end path. This research is concerned with the former only. By performing model-based verification at design time, potential problems can be identified and resolved before the model is put into use (Wynn, Verbeek, van der Aalst, ter Hofstede, & Edmond, 2009).
2.5. Translation of the THCP Model to a hierarchical coloured Petri net
2.5.1. Translation: Formal definition
The formal definition consists of eleven translation functions (from now on: the translation technique) that map the IS diagram and the associated AB diagrams for a given HCP into a single hierarchical CP net (from now on: the produced CP net)13. The functions use the following notations from the formal definition of (hierarchical) CP nets (Jensen, 1994; Jensen, 1997):
a) is the finite set of non-empty types also called colour sets, P is the finite
set of places, T is the finite set of transitions, A is the finite set of arcs, S
if the finite set of subnets or pages, SNT is the set of substitution
nodes, and PNP is the set of port nodes. Places and transitions are both
referred to as nodes in a Petri net. In a hierarchical CP net, the substitution node or transition is the most important hierarchy construct (drawn as a
13 The formal definition of the THCP model, as presented in Section 2.3.3, is defined directly on its graphical syntax and is the starting point for the translation. Alternatively, the syntax of TALL could be translated to the syntax of hierarchical CP nets that already has a formal semantics. This is unwanted since hierarchical CP nets are neither agent-oriented nor interaction-centric. Moreover, ambiguities in the TALL diagrams, caused by the lack of a formal definition, can result in faulty Petri net models.

Agent-oriented modelling and verification of human collaboration processes
53
double-bordered transition). A substitution transition acts as the parent transition of a subpage that contains the detailed behaviour of the activity represented by the substitution transition;
b) C is the colour function that is defined from P into . C maps each place
to a colour set; c) SA is the page assignment function that is defined from SN into S. SA
relates substitution transitions to their subpages such that no page is a subpage of itself;
d) PA is the port assignment function. PA is defined from SN into binary relations that relate socket places on the super page (the places that surround the substitution transition) with port places on the corresponding subpage;
e) PT is the port type function that is defined from PN into {in, out, i/o, general};
f) ST is the socket type function that maps from pairs of socket places and substitution transitions into {in, out, i/o}. Related socket and port places must have matching socket and port types, and conceptually represent the same place (i.e. they always have identical markings);
g) N is the node function that is defined from A into P TT P. Thus, N maps each arc into a pair where the first element is the source node and the second the destination node;
h) In(x) returns the set of input nodes for a node x: In(x) = {x’X | a: N(a) = (x’, x)} and Out(x) returns the set of output nodes for a node x: Out(x) = {x’X | a: N(a) = (x, x’)}.
In addition, the following notations are introduced to support the translation technique:
LF is the hierarchical CP net Labelling Function. LF: XV where X = P
TA and V is a set of labels;
Net elements are augmented with a page index to refer to the elements on a specific page in the produced CP net. For example, Ps is used to denote the places and Ts is used to denote the transitions on page s. The page index is omitted when referring to the elements of the entire produced CP net;
There exists a one-to-one correspondence between the set SN of the produced CP net and the set of interactions I in the IS diagram. Based on
this, two bijective functions are defined: map1: ISN and map2: SNI.

Chapter 2
54
The former returns the corresponding substitution transition tSN of interaction iI while the latter returns the corresponding interaction iI of substitution transition tSN.
As Section 2.4.2 explains, the verification method abstracts away from data and control features. This impacts the routing types XORd, SEQd, and PARd, which make deterministic choices based on an evaluation of the data conditions in the attached decision rules. Therefore, the translation technique represents these deterministic choices as non-deterministic choices (see Figure 2-9).
Figure 2-9. Unfolding transitions to produce non-deterministic choices.
The following translation functions are augmented with figures for clarification (Figure 2-10 to Figure 2-13). In these figures, the socket type of a place is written in a small rectangle that appears below the place, at the right or left side, which indicates the transition on which the socket type is defined. The port type of a place is written in a small circle that appears below the place. Place labels are written inside the circles and (substitution) transition labels are written inside the squares.
Definition 2 (Translation Technique). The translation technique is formally defined by a set of eleven translation functions.
Translation Function 1 (RTF): Root Interaction Suppose: iI iL0. Then interaction i is the root interaction i0. The Root Translation Function RTF maps i0 into a page s*S (called the prime page) that contains substitution transition t1SNs with adjacent input and output places such that:
xnPs In(t1) = x1 Out(t1) = x2 ST(x1, t1) = in ST(x2, t1) = out LF(xn) = pn LF(t1) = map2(t1).

Agent-oriented modelling and verification of human collaboration processes
55
The prime page s* serves as the start page of the entire produced CP net. All the other pages are subpages of s*. Figure 2-10 shows three examples of the translation of a root interaction A using the function RTF.
In the IS diagram, routing applies to sibling interactions that are completed according to the routing type of their parent interaction i. The function children(i) returns the children of interaction i. The subsequent translation functions 2 to 8 translate, for each routing type, the sibling interactions into a subpage that manages the corresponding control flow.
Translation Function 2 (STF): Sequential Routing Suppose: iI RT(i){SEQ}. The Sequential Translation Function STF maps children(i) into a subpage sS that contains a finite non-empty sequence of substitution transitions t1, t2, …, tmSNs with adjacent input and output places such that:
k{1, .., |children(i)|}:[xnPs In(tk) = xk Out(tk) = xk+1 ST(xk, tk) = in ST(xk+1, tk) = out x1, xm+1PNs PT(x1) = in PT(xm+1) = out LF(xn) = pn LF(tk) = map2(tk)].
Figure 2-10a illustrates the translation of a set of sequential child interactions using the function STF. In the specific example of Figure 2-10a, children(i) contains three interactions. Translation Function 3 (SCF): Sequential Conditional Routing Suppose: iI RT(i){SEQd} |children(i)| > 1. The Sequential Conditional translation Function SCF maps children(i) into a subpage sS that contains a finite non-empty sequence of substitution transitions t1, t2, …, tmSNs with adjacent input and output places, and artificial control flow tasks for inclusive conditional sequential splitting- and joining-behaviour such that14:
k{1, .., |children(i)|}:[xnPs ynTs\SNs In(tk) = xk*2In(xk*2) = yk In(yk) = x(k*2)-1 Out(x(k*2)-1) = yk*2 (Out(tk), Out(yk*2) = x(k*2)+1) ST(xk*2, tk) = in ST(x(k*2)+1, tk) = out x1, x(m*2)+1PNs PT(x1) = in PT(x(m*2)+1) = out LF(xn) = pn LF(yn) = tn LF(tk) = map2(tk)].
Figure 2-10b illustrates the translation of a set of conditional sequential child interactions using the function SCF. As explained, the SEQd routing type is an OR-
14 In the translation functions, the * sign is the multiplication operator.

Chapter 2
56
split in which one or more interactions are executed at a time. When two or more interactions are enabled, they are executed in a sequence. On the subpage A#1 in Figure 2-10b, a non-deterministic choice is made either to execute the substitution transition tk or to bypass it.
Figure 2-10. Examples of the translation of a set of three sequential interactions (top), three conditional sequential interactions (middle), and a single child interaction that is iterated (bottom).

Agent-oriented modelling and verification of human collaboration processes
57
Translation Function 4 (SIF): Sequential Iterative Routing Suppose: iI RT(i){SEQd} |children(i)| = 1. Then children(i) is a singleton set {z}. The Sequential Iterative translation Function SIF maps children(i) into a subpage sS that contains substitution transition t1SNs with adjacent input and output places, and artificial control flow tasks for looping behaviour such that:
xnPs ynTs\SNs In(t1) = x1 Out(t1) = x2 Out(x2) = y1, y2Out(y1) = x1 Out(y2) = x3 ST(x1, t1) = in ST(x2, t1) = out(x1, x3PNs) PT(x1) = in PT(x3) = out LF(xn) = pn LF(yn) = tn LF(t1) = map2(t1).
Figure 2-10c illustrates the translation of a single child interaction B using the function SIF. At place x2, a choice is made either to repeat or not repeat t1. Because the choice to repeat transition t1 is non-deterministic, t1 can potentially be repeated infinitely and cause the entire hierarchical CP net (read: the HCP instance) to get locked in an endless loop. The definition of soundness assumes a notion of fairness, which means it is assumed that iteration does not violate the soundness requirements by postponing transition t2 indefinitely. The fairness assumption is reasonable since all choices are made (implicitly or explicitly) by agents that share and pursue a common (business) goal.
Translation Function 5 (PTF): Parallel Routing Suppose: iI RT(i){PAR}. The Parallel Translation Function PTF maps children(i) into a subpage sS that contains a finite non-empty sequence of substitution transitions t1, t2, …, tmSNs with adjacent input and output places, and artificial control flow tasks for parallel splitting- and joining-behaviour such that:
k{1, .., |children(i)|}: [xnPs ynTs\SNs In(tk) = xk+1Out(tk) = xk+m+1 In(xk+1) = y1 In(y1) = x1 Out(xk+m+1) = y2Out(y2) = x(m*2)+2 ST(xk+1, tk) = in ST(xk+m+1, tk) = out (x1, x(m*2)+2PNs) PT(x1) = in PT(x(m*2)+2) = out LF(xn) = pn LF(yn) = tn LF(tk) = map2(tk)].
Figure 2-11a illustrates the translation of a set of parallel child interactions using the function PTF. The transition y1 is used to produce tokens for all of the input nodes of the parallel substitution transitions tk. Similarly, the transition y2 is used to synchronize the parallel paths.

Chapter 2
58
Figure 2-11. Example of the translation of a set of three parallel interactions (top), three conditional parallel interactions (middle), and a single child that is performed a certain pre-defined number (5 in this example) of times in parallel (bottom).
Translation Function 6 (CPF): Conditional Parallel Routing Suppose: iI RT(i){PARd} |children(i)| > 1. The Conditional Parallel translation Function CPF maps children(i) into a subpage sS that contains a finite non-empty sequence of substitution transitions t1, t2, …, tmSNs with adjacent input and output places, and artificial control flow tasks for inclusive conditional parallel splitting- and joining-behaviour such that:
k{1, .., |children(i)|}: [xnPs ynTs\SNs In(tk) = xk+4Out(tk) = xk+m+4 In(xk+4) = yk*2 In(yk*2) = xk+1 In(xk+1) = y1In(y1) = x1 Out(xk+1) = y(k*2)+1 Out(y(k*2)+1) = xk+7 Out(xk+7) = y(m*2)+2 Out(y(m*2)+2) = x(m*3)+2 ST(xk+4, tk) = in ST(xk+m+4, tk) =

Agent-oriented modelling and verification of human collaboration processes
59
out (x1, x(m*3)+2PNs PT(r1) = in PT(x(m*3)+2) = out LF(xn) = pn LF(yn) = tn LF(tk) = map2(tk)].
Figure 2-11b illustrates the translation of a set of inclusive conditional parallel child interactions using the function CPF. The working of the PARd routing type is related to the SEQd routing type since it is also an OR-split that makes a choice between one or more children. However, when two or more interactions are enabled, they are executed in parallel. The subpage A#1 in Figure 2-11b first uses the transition y1 to enable parallel execution of all the children. Next, a non-deterministic choice is made either to execute the substitution transition tk or to bypass it. When the substitution transitions tk are not executed, the bypass route makes sure that the flow can continue by producing the needed tokens for the synchronizing transition y8.
Translation Function 7 (PIF): Parallel Iterative Routing Suppose: iI RT(i){PARd} |children(i)| = 1. Then children(i) is a singleton set {z}. The integer n is a counter that indicates how many times the single child should be performed in parallel. The Parallel Iterative translation Function PIF maps children(i) into a subpage sS that contains a finite non-empty sequence of substitution transitions t1, t2, …, tmSNs with adjacent input and output places, and artificial control flow tasks for parallel splitting- and joining-behaviour such that:
k{1,.., n}: [xnPs ynTs\SNs In(tk+1) = xk+1 Out(tk) = yk+m+1 In(xk+1) = y1 In(y1) = x1 Out(xk+m+1) = y2 Out(y2) = x(m*2)+2 ST(xk+1, tk) = in ST(xk+m+1, tk) = out (x1, x(m*2)+2PNs) PT(x1) = in PT(x(m*2)+2) = out LF(xn) = pn LF(yn) = tnLF(tk) = map2(tk)].
Figure 2-11c illustrates the translation of a single child interaction B using the function PIF. This translation is identical to the PAR routing type except that the number of parallel paths depends on the value of the counter. Interaction B needs to be performed at least once. In the TALL2HCPN translation software tool (see Section 2.5.2), the number of the counter is fixed arbitrarily at five and can be changed by the user in the TALL Visual Editor.
Translation Function 8 (ECF): Exclusive Conditional Routing Suppose: iI RT(i){XOR, XORd}. The Exclusive Conditional translation Function ECF maps children(i) into a subpage sS that contains a finite non-empty sequence of substitution transitions t1, t2, …, tmSNs with adjacent input and

Chapter 2
60
output places, and artificial control flow tasks for non-deterministic exclusive selective splitting- and joining-behaviour such that:
k{1, .., |children(i)|}: [xnPs ynTs\SNs In(tk) = xk+1Out(tk) = xm+2 In(xk+1) = yk In(yk) = x1 ST(xk+1, tk) = inST(xm+2, tk) = out (x1, xm+2PNs) PT(r1) = in PT(r2) = outLF(xn) = pn LF(yn) = tn LF(tk) = map2(tk)].
Figure 2-12 illustrates the translation of a set of exclusive conditional child interactions using the function ECF. The translation of the XORd routing type is the same.
Figure 2-12. Example of the translation of a set of three non-deterministic exclusive conditional child interactions.
Translation Function 9 (ABF): Agent Behaviour Translation
Suppose: iEI ReturnAV(i) . Then interaction i is an elementary interaction
with associated AB diagrams. The AB diagrams are returned by the function ReturnAV(i). The Agent Behaviour translation Function ABF uses the following notations:
s is the start place and f is the final place of the Behaviour net avAV that represents the intended behaviour of an agent such that: s, fPav and In(s),
Out(f) = ;
The output of ABF is the (sub)page sS. This page s is a union of the Behaviour nets avReturnAV(i). Hence, the net elements of s consist of all the combined elements of these Behaviour nets15:
15 Ts is the finite set of transitions, Ps is the finite set of places, MPs is the finite set of message places, FIs is the finite set of incoming arcs that connect (message) places and transitions, and FOs is the finite set of outgoing arcs that connect transitions and (message) places.

Agent-oriented modelling and verification of human collaboration processes
61
Ts = ( )av ReturnAV i
Tav , Ps = ( )av ReturnAV i
Pav , MPs = ( )av ReturnAV i
MPav , and As =
( )av ReturnAV i FIavFOav;
MPS is the set of message places for sending messages and MPR is the set of message places for receiving messages: MPSs = {mpMPs | Out(mp) =
}, MPRs = {mpMPs | In(mp) = } and MPSsMPRs = ;
MPM is the Message Place Matching function. It is defined from MPSs into MPSsMPRs. MPM relates message places for sending to message places for receiving such that:
Related message places appear in two agent behaviours involved in the same interaction: (mps, mpr)MPM(mps): [ iEI av1, av2ReturnAV(i) mpsav1 mprav2;
Related message places have identical data types: (mps, mpr)MPM(mps): [C(mps) = C(mpr)].
ABF maps ReturnAV(i) into a single “behavioural” subpage sS that details the behaviour of the substitution transition corresponding to the elementary interaction i. This subpage s contains the combined Behaviour nets and artificial control flow tasks (and adjacent input and output places) for parallel splitting and joining of the Behaviour nets such that:
k{1, .., |ReturnAV(i)|}: [xnPs yn, znTs In(sk) = y1In(y1) = x1 Out(fk) = y2 Out(y2) = x2 (x1, x2PNs) PT(x1) = in PT(x2) = out (p, p’)MPM(p): [(p, p’)Ps Out(p) = zn In(p’) = zn] p(PsMPs)\xn: LF(p) = LF(pav) tTs\{yn, zn}: LF(t) = LF(tav) LF(x1) = S LF(x2) = F LF(y1) = t1LF(y2) = t2 LF(zn) = dn.
Figure 2-13 illustrates the translation of an IS diagram where three agents bring behaviours to perform the elementary interaction C. The function ABF translates the AB diagrams into a single page C#2 that contains the three combined agent behaviours. Figure 2-13 shows that ABF connects pairs of matching message places to a shared transition that acts as a synchronization point between the agent behaviours. Message places are matched based on a simple rule. Each sending message place of an agent is matched with a receiving message place of another agent in the same interaction that has the same message type. If there are two agents with such a receiving place, only one pair is created since communication is considered to be peer-to-peer. Message places that do not have a matching message

Chapter 2
62
place are not attached to a shared transition. If such message places exist, the agent behaviours are not aligned. This can be resolved during the verification process where the behaviours can be corrected or modified (see Section 2.6.2). In the relatively simple example of Figure 2-13, all message places are exactly matched by type name and number, which results in four pairs of matched sending and receiving message places.
Figure 2-13. Example of the translation of an elementary interaction C and its associated AB diagrams.
Translation Function 10 (EIF): Pruning of Elementary Interactions The previous translation functions translate the interactions in the IS diagram into substitution transitions in the produced CP net. However, if elementary interactions have no associated AB diagrams, the corresponding substitution transitions have no subpages. IA is the set of elementary interactions that have no associated agent
behaviours: IA = {iI | iEI ReturnAV(i) = }. The Elementary Interaction

Agent-oriented modelling and verification of human collaboration processes
63
pruning Function EIF turns all substitution transitions that correspond to interactions in the set IA into “normal” transitions such that:
iIA: [map1(i)T SN\map1(i) pP: ST(p, map1(i)) = ].
Translation Function 11 (PLF): Page Labelling The function PLF is the Page Labelling Function. It is defined from S (the finite set of pages) into a set of page labels Z such that:
s = s*PLF(s*) = Root#0. The prime page s* receives Root#0 as its page
name.
s s*PLF(s) = LF(t)^#^ht(map2(t))+1 with tSN and SA(t) = s.
The operator ^ is the concatenation operator for text strings. Each page that is not the prime page is assigned a page label, which is a string concatenation of the label of the substitution transition on the super page of s, the # sign, and the interaction level or height on which interaction i appears (increased with 1). The requirement SA(t) = s makes sure that the label of the correct substitution transition is used, that is, the substitution transition that has page s as its subpage. Figure 2-14 shows the hierarchical CP net that results from the application of the translation technique to the IS diagram of the GTS process, as shown in Figure 2-3. All sets of sibling interactions are translated into subpages (from now on: interaction pages). The lowest-level “behavioural” subpages that contain the combined agent behaviours have not been included for reasons of brevity.

Chapter 2
64
Figure 2-14. The hierarchical CP net-form of the global IS diagram of the GTS process.
2.5.2. TALL2HCPN: From the THCP model to a hierarchical CP net
This research uses CPN Tools as an execution engine to enable computerized verification of the produced CP net. CPN Tools is an industrial strength computer tool that builds on CP nets16. The tool provides a rich set of resources for modelling, simulating, and validating systems where concurrency, communication,
16 CPN Tools can be downloaded from http://cpntools.org/

Agent-oriented modelling and verification of human collaboration processes
65
and synchronization play a major role (Jensen, Kristensen, & Wells, 2007). A tool named TALL2HCPN (here HCPN stands for Hierarchical Coloured Petri Net) implements the translation technique. TALL2HCPN is available as a plugin in the TALL Visual Editor. The bottom right part of Figure 2-15 shows the user interface of TALL2HCPN.
Figure 2-15. Screenshot of the TALL Visual Editor showing the drawing window, and the main window of the TALL2HCPN translation software tool.
TALL2HCPN takes its input from the currently active model database. The user can select a specific IS diagram and start the translation. During execution, TALL2HCPN queries the database to extract the elements of the selected diagram and automatically creates an XML-file that can be directly loaded in CPN Tools. The XML file created by TALL2HCPN contains the hierarchical CP net (its pages and page structure), the port assignment that links the pages, and the net elements for each page. CPN Tools requires all places to be typed and requires all arcs to carry an arc expression that evaluates to the type of the adjacent place. Therefore, TALL2HCPN assigns the empty colour set E to all places and the variable e to all arcs in the produced CP net. Tokens of type E are considered uncoloured or black tokens that carry no data (Jensen, 1994). Figure 2-16 shows the (partial) output of TALL2HCPN in CPN Tools for the THCP model shown in Figure 2-8 and Figure 2-15.

Chapter 2
66
Figure 2-16. Screenshot of CPN Tools in which the hierarchical CP net produced by TALL2HCPN for GTS is loaded.
2.6. The Verification Activity
2.6.1. Verification analysis
In the second step of the proposed verification method, verification analysis is performed to identify process design errors in the agent behaviours. CPN Tools is equipped with verification techniques. The state space analysis feature of CPN Tools is used to verify the soundness of the behavioural pages (i.e. the combined agent behaviours for each elementary interaction) in the hierarchical CP net produced by TALL2HCPN. When the state space tool in CPN Tools is applied, a state space graph is automatically calculated for all the pages in a (hierarchical) CP net17. From a state space graph, it is possible to answer a large set of verification questions concerning a CP net (Jensen, Kristensen, & Wells, 2007). CPN Tools
17 State spaces compute all reachable states and state changes in a CP net, and represent these as a directed graph where nodes represent states and arcs represent occurring events (Jensen, Kristensen, & Wells, 2007).

Agent-oriented modelling and verification of human collaboration processes
67
provides verification feedback in the form of a state space report that can be saved by the user on command. CPN Tools also allows the user to write query functions in CPN ML18 to investigate more specific properties using the state space tool. For this research, the state space report is sufficient since it provides the necessary feedback to check the three soundness requirements introduced and listed in Section 2.4.2. The verification activity to check the three soundness requirements, by using the state space report, is demonstrated for the Reduction of Contracted Capacity#2 behavioural page (see Figure 2-14). This verification activity is inspired by the soundness analysis procedure using CPN Tools described in (Gottschalk, van der Aalst, Jansen-Vullers, & Verbeek, 2007). Figure 2-17 shows the state space report with the relevant results for the specific page.
Figure 2-17. Excerpt of the state space report focused on the Reduction of Contracted Capacity#2 behavioural page in the produced HCP net for GTS.
18 CPN Tools uses the CPN ML functional programming language for declarations and net inscriptions.

Chapter 2
68
To test the first soundness requirement Option to complete, the list of dead markings is checked. Figure 2-17 shows that there exist three dead markings with node numbers 46, 406, and 479. These node numbers correspond to nodes in the state space graph generated by CPN Tools. CPN Tools can show the corresponding marking (i.e. the distribution of tokens over the places in the net) when the node descriptor for a node is expanded.
A HCP instance completes when a token appears on the output socket place on the root page in the produced CP net (this is the end state). In this case, all the underlying (interaction and behavioural) pages have successfully completed. Inspection of the node descriptor for node 46 revealed a token to be present on the end place p2 on the root page and on place p11 on the page Provision of Transport Services#1 (see Figure 2-14). These two places have identical markings because of the port assignment. This dead marking is expected since it corresponds to the end state of the HCP instance. However, the node descriptors for nodes 406 and 479 revealed non-empty (read: dead) markings on the behavioural page Reduction of Contracted Capacity#2. Clearly, these tokens are not in the end state of the HCP instance.
The State Space to Sim tool in CPN Tools is used to transfer the nodes that contain dead markings to the net simulator. Here, the design errors can be identified and the problem area(s) pinpointed in a certain agent behaviour. Transfer of nodes 406 and 479 to the net simulator, and subsequent analysis of the net structure revealed several flaws on the page Reduction of Contracted Capacity#2:
a) The first error is related to the scenario in which the capacity planner disapproves the request for reduction. In this case, the capacity planner simply ends the interaction without sending any message to the other agents. Thus, these agents wait endlessly for messages that are never received;
b) The second error is related to the scenario in which the capacity planner approves the request for reduction. When the customer receives the final contract and approval letter, it can either accept and sign both documents, or decide to reject them. The latter decision cancels the request for reduction. In this case, the behaviour of the customer needs to end by placing a token in its end place. In the current net structure, there is no separate path that properly ends the customer’s behaviour;
c) The third error occurs because the secretary agent does not have a separate path to handle the rejection, which means its behaviour is not ended properly. Therefore, the secretary’s behaviour deadlocks in the case of a
Agent-oriented modelling and verification of human collaboration processes
69
rejection since it also waits for the signed acceptance letter and contract that never arrives.
Correction of these three errors is required to complete the Reduction of Contracted Capacity interaction. After correction (Section 2.6.2 describes how to do this), the state space graph can be generated again to (re)check for soundness. If the state space report contains only the dead marking that corresponds to the end state of the HCP instance, the first soundness requirement is satisfied for the produced CP net. In general, when a token is encountered in a dead marking other than the end state of the produced CP net, the model is unsound and the non-empty (dead) markings should be inspected.
The second soundness requirement Proper completion is tested with the help of the root page in the produced CP net. The output socket place on the root page acts like a termination place that enforces Proper completion. This place only contains a token if all the underlying pages successfully completed. If this place contains no token when the HCP instance indicates completion, this means tokens reside in a state other than the end state, which is detected by the test for the first soundness requirement. The third soundness requirement No dead transitions is satisfied when there are no dead transition instances in the state space report (see Figure 2-17). Overall, the state space report that results from the application of the state space tool to the produced CP net for the GTS process revealed several process design errors in the agent behaviours on the Reduction of Contracted Capacity#2 behavioural page. This means that this page is unsound; the agent behaviours on this page are structurally incompatible.
The net elements of the interaction pages of a produced CP net always contain the same fixed (and sound) elements produced by the translation functions. The point is that it is sufficient to perform soundness checking on the behavioural pages. If all the behavioural pages are sound (and safe) then all their super pages (i.e. interaction pages) are also sound (and safe). This statement is based on the following theorem in (van der Aalst & van Hee, 2002): “If we have two sound and safe workflow nets V and W and we have a task t in V which has precisely one input and one output place, then we may replace task t in V by W and then the resulting workflow net is sound and safe again”. In the produced CP net, all the substitution transitions contain precisely one input and output place. Therefore, each substitution transition can be replaced by the net on its subpage without invalidating soundness.

Chapter 2
70
2.6.2. Verification reporting and correction
The third step of the proposed verification method is concerned with the rollback of the identified errors to the THCP model. For the moment, the correction of errors (i.e. agent behaviour redesign) is manual. The (lead) modeller identifies the soundness related errors in CPN Tools and, due to the ownership relation that is kept during translation19, he/she can identify those behaviours that contain the errors. The modeller then has two choices in terms of how the correction of the agent behaviours (i.e. the AB diagrams) is done.
The first option is to correct the error(s) in CPN Tools, generate the state space graph again, check if the errors have been resolved, adjust the initial AB diagram(s) in the TALL Visual Editor that led to the error(s), and send it back to the source agent. The second option is to pinpoint the problem area in CPN Tools, identify the agent(s) that is(are) responsible for the error(s), and communicate the error(s) to the respective agent(s) using the analysis report produced by CPN Tools as a feedback mechanism. These agents then have to send back a new version of their AB diagrams, and the modeller can check if the new models lead to a sound hierarchical CP net after applying the translation technique again. This is a typical distributed problem-solving situation. A middle solution is to send back to the agents a potential solution for correction (in the form of a structurally correct behaviour) to help them find better behaviours. The first reporting scheme takes away from the autonomy of the agents, but it is fast and effective. The second can be slow due to repetition of trial-and-error cycles of local redesign and central verification, but the agents have the autonomy to change their behaviours as they see fit.
The errors on the page Reduction of Contracted Capacity#2 were corrected using the first option. The corrected behaviours in CPN Tools have been used to correct the AB diagrams of the involved agents. In this specific case, the verification activity led to changes (i.e. improvements) in the behaviours of the customer, secretary, and capacity planner agents. After correction, the agent behaviours that perform the Reduction of Contracted Capacity interaction are structurally compatible. The errors in these agent behaviours demonstrate the importance of design-time verification. For example, in the case when the agent playing the role of capacity planner does not inform the other agents, the other agents have no way of knowing that the request for reduction was disapproved. In
19 The individual agent behaviours are marked in the behavioural pages of the produced HCP net by an agent-role label that appears above the behaviours.

Agent-oriented modelling and verification of human collaboration processes
71
real-life distributed business settings, where HCPs typically run, such deadlock situations occur easily since each agent uses its own local behaviour to perform its part in the process autonomously.
2.7. Discussion
The practical value of the TALL modelling language is that it provides for definition of a HCP’s multi-agent interaction structure (i.e. interactions, their composition and routing relations, their roles, and their participants or role-playing agents) and the local individual behaviours exhibited by the agents that perform the interactions. This makes the HCP explicit and amenable to valuable process analysis. Moreover, the language allows for organizational modelling of the business domain with the AS and RS diagrams. Based on this, the language meets the requirements mentioned in Section 2.3.1.
The ability to perform verification analysis to check the soundness of the THCP model is considered a desirable feature, as argued in Section 2.4.1. To enable soundness checking, the proposed verification method builds on the strong formalism and analysis capabilities of (hierarchical) CP nets. The method can be used as a tool by a business modeller, whose role is either to design new HCPs, either to identify and correct flaws in existing processes.
Like the proposed verification method, related research presents transformations from existing modelling languages (e.g. (A)UML, EPCs, BPMN) to Petri nets in order to exploit their strong analytical methods and computer tools (Ryu & Yücesan, 2007; Cabac & Moldt, 2005; Dijkman, Dumas, & Ouyang, 2008). The reader is referred to (De Backer, Snoeck, Monsieur, Lemahieu, & Dedene, 2009; Ryu & Yücesan, 2007) for a detailed discussion of several such transformations. In (De Backer, Snoeck, Monsieur, Lemahieu, & Dedene, 2009), the authors mention that in most approaches to verify a (collaborative) business process, a translation to a modelling language that supports formal analysis is used. In an agent-based system or model, the main difficulty is to decide what to verify and to what extent. The presented translation technique is different from other transformations in that it includes the multiple local behaviours of the agents involved in a HCP. In this way, the proposed verification method enables the verification of the structural correctness and compatibility of the combined agent behaviours that perform the (elementary) interactions. Most importantly, the method allows design errors to be traced back to individual agent behaviours. De Backer, Snoeck, Monsieur, Lemahieu, and Dedene (2009) argue that just computing global behaviour without

Chapter 2
72
mechanisms for tracing back potential difficulties to individual (local) business processes is not sufficient in practice.
The proposed verification method uses state space analysis to verify soundness. One of the disadvantages of using state space analysis is that it is not possible to obtain a full state space for very large and complex nets (Jensen, Kristensen, & Wells, 2007). In the proposed verification method, the number of tokens on the places in the produced CP net is bounded to one because each HCP instance is independently controlled. Model checking is decidable for bounded models (Eshuis, 2002). Moreover, the separation between interaction and behavioural pages allows the formal verification to be restricted to the most important aspects of the produced CP net, that is, the agent behaviours that perform the elementary interactions.
After rollback of the identified errors to the TALL diagrams, the verified TALL diagrams (i.e. IS and AB diagrams) can be used as sound executable specifications that can be subject to further analysis, design, simulation, and/or implementation. In a multi-agent system development context, the objective is to develop software agents for intelligent IT support of humans in their workplace interactions. Ongoing research is concerned with the use of business process gaming to develop these software agents. For this purpose, a series of tools form an integrated process gaming environment called the Agent Growing Environment (AGE) (Roest & Szirbik, 2009). The TALL diagrams drive the simulation, development, and deployment of software agents in AGE where gaming sessions (i.e. interactive simulations of the business process) are played with human experts or stakeholders from the business domain under consideration. The function of the IS diagram in these gaming sessions is to coordinate the enactment of the HCP by keeping track of the execution of interactions. At first, the interactions in the gaming sessions are completely performed by the humans. The AGE simulation environment logs the behaviours exhibited by the humans in AB diagrams. Next, software agents are developed based on the logged behaviours of the humans. This process is called “growing” the agents. Thus, the humans act as “instructors” to the software agents. The software agents are then brought into the game in new rounds of gaming sessions. Each round of gaming sessions will bring more automation to the game. This finally results in the situation where the software agents can take over some of the work of the humans in the (simulated) interactions.
Implementation of the proposed verification method as a “verification service” is the subject of further research in AGE. In this way, the behaviours of the human

Agent-oriented modelling and verification of human collaboration processes
73
and software agents in the gaming sessions can be checked for structural correctness and compatibility before the HCP is enacted in real-life. Successful scenarios can be discovered for one or more interactions, that is, the verification service cannot only be invoked for full HCP instances but also partial IS diagrams or individual interactions can be verified. In AGE, the verification method becomes more of an execution service instead of a design-time service. Currently, the verification reporting and correction is a manual step (see Section 2.6.2). One of the main requirements to make the gaming sessions effective in enacting a successful scenario using the valuable input of the human instructors is to automate the identification of the agents that invalidate soundness, and to automate the manual procedures of rollback to the TALL diagrams.
In a next phase of the HCP lifecycle, the business domain under consideration can adopt a multi-agent system to deploy the developed software agents in reality. The discovered successful scenarios, in terms behaviour models, can be used as sound specifications for the development of the software agents that make up the multi-agent system. Moreover, the multi-agent system can make use of the IS diagram to monitor and trace the interactions being executed in real-life. During execution, the IS diagram is a (partly) emergent artefact. Interactions may take place that were not modelled in the IS diagram, or modelled interactions may not occur. An algorithm has been developed that allows dynamic (structural) change of the IS diagram (Stuit & Meyer, 2009). This algorithm can be implemented in the multi-agent system to update the IS diagram in real time. After execution, the updated IS diagram serves as an execution log of the interactions in the HCP.
The internal processing component of the software agents in terms of process structure and execution code can be based on the verified AB diagrams. However, the use of explicit process models for the agents should not invalidate completely the autonomy of the agents. Especially in real-life, the majority of HCP instances require on-the-fly modification of behaviours because of the dynamic nature of the business context and the agents. Associated research explains how agents are implemented with alignment policies that enable them to dynamically modify their behaviours without invalidating (local) soundness (Meyer & Szirbik, 2007a). These alignment policies can be used during both design and execution time. Behavioural updates or even new behaviours can be introduced by modification of existing sound behaviour specifications. Changes to agent behaviours do not have ripple effects on the IS diagram because of the clear separation between interactions and behaviours in TALL.

Chapter 2
74
The use of the Behaviour net formalism for the internal processing component of the software agents does not restrict the applicability of the TALL diagrams to AGE. Several agent platforms require the communication architecture of a multi-agent system to be based on accepted standards (i.e. FIPA ACL) to ensure interoperability, but allow freedom in the formalism used for the individual processing component (i.e. the application-dependent behaviour) of the agents. For instance, the agent platform JADE imposes standards only for the external behaviour of the system components but leaves open the implementation details and the internal architectures (Bellifemine, Caire, Poggi, & Rimassa, 2003).
It is important to mention that a single superior general-purpose language is not advocated with TALL. Existing agent-based languages and development frameworks should be used to describe different aspects of a multi-agent system for HCP support, and to eventually build the software agents. Examples are the use of rule-based engines, agent development platforms and associated programming languages, agent communication architectures etc. The TALL-based set of descriptions should be considered as complementary to these, not as alternatives.
2.8. Related Work: Agent-Based Modelling
The TALL modelling language is inspired by the agent paradigm. The process diagrams in the language are concerned with the representation of agent interaction and behaviour. This section compares TALL to existing (agent-based) modelling languages concerned with agent interaction and behaviour specification. A comparison with several pervasive process modelling languages in the business process management community can be found in (Stuit & Szirbik, 2007).
2.8.1. Agent-based modelling languages for system design
A multitude of agent-oriented software engineering methodologies has appeared of which the most well-known are: MaSE (DeLoach, Wood, & Sparkman, 2001), Prometheus (Cheong & Winikoff, 2006; Padgham & Winikoff, 2003; Padgham & Winikoff, 2004), Tropos (Bresciani, Perini, Giorgini, Giunchiglia, & Mylopoulos, 2004), Gaia (Wooldridge, Jennings, & Kinny, 2000), and MESSAGE (Caire, et al., 2001; Caire, et al., 2002). Agent-based modelling languages are core components of these methodologies and many of them incorporate the same basic constructs as TALL (i.e. agents, roles, interactions, and behaviours). The most closely related modelling languages in terms of purpose or modelling constructs are the TROPOS language and MESSAGE. In addition, other agent-based modelling languages

Agent-oriented modelling and verification of human collaboration processes
75
include AUML (Bauer, Müller, & Odell, 2001; Odell, Van Dyke Parunak, & Bauer, 2000), AORML (Wagner, 2003), and AML (Cervenka, Trenanský, Calisti, & Greenwood, 2005; Cervenka, Trenanský, & Calisti, 2006; Trenanský & Cervenka, 2005). These agent-based modelling languages are UML-driven languages that include agent interaction and activity models. The interaction models are usually interaction protocols that specify the structured message exchange between agents and some constraints on the content of messages whereas the activity models specify the private plans, actions, or tasks of a single agent.
The agent interaction protocol (AIP) (Odell, Van Dyke Parunak, & Bauer, 2001)
allows hierarchical ordering using the UML package notation. This implies that an AIP can contain other AIPs, which allows for nesting. This nesting has similarities with TALL since a structure of nested interaction protocols can be seen as a tree. Within an AIP, a UML sequence diagram describes the inter-agent transactions that are needed to implement the protocol, in terms of sequencing and eventual message branching. The lifeline of a receiving agent of a multiple branched message has to follow the same logical expression. This is done (probably) to avoid deadlocks, but it is very rigid. When nested, the lower level of detail can use UML activity diagrams, state diagrams, sequence diagrams, or collaboration diagrams. This makes the tree very diverse in terms of representations. This notation is clearly semi-formal and cannot be used for design-time verification. The AIP is a software-engineering concept, and its high degree of variety can confuse a business modeller and its stakeholders. Another similarity to TALL is that at the lowest level of detail, an activity diagram can represent the behaviour of an agent. The AIPs, which include the message exchange between agents, are fixed at design time, and the agent behaviours are selected at runtime. In TALL, the specification of the message exchange structure is done, from a local perspective, in the AB diagrams. Thus, a fixed pattern of message exchange is not imposed on the interaction level. Moreover, the IS diagram relates interactions through both routing and composition. The UML sequence diagram does not reveal how an interaction is related to other interactions as part of a business process. Consequently, the IS diagram provides a better basis for process design, analysis, and improvement.
The TROPOS modelling language uses AIPs to represent (synchronous) communication between agents. Moreover, plans, as ways to achieve an individual agent’s goals can be detailed by representing them with UML activity diagrams. A step forward in MESSAGE is the decoupling between generic interactions and the

Chapter 2
76
way they are performed and structured, and the explicit guidelines provided to support the modelling exercise. However, the interaction view in MESSAGE does not present a process-oriented view of interactions with composition and routing relations. In addition, MESSAGE provides no explicit support for process verification.
Sturm, Dori, and Shehory (2003) describe an enhanced version of the OPM modelling framework called OPM/MAS that is specifically suited for agent systems. Although a good alternative for the UML-driven languages, OPM/MAS is a system modelling framework that addresses a number of essential software engineering issues (like accessibility and expressiveness aspects), and is useful primarily for system architects and developers. In (Hahn, Madrigal-Mora, & Fischer, 2008), the authors present the PIM4Agents metamodel for agent systems that abstracts from the specific requirements of existing agent-oriented software engineering methodologies, programming languages, and platforms. PIM4Agents is focused on the specification of software services and interfaces required by certain agent platforms. Thus, it deals with system and implementation details instead of business process concepts. In sum, all of the languages and frameworks discussed in this section focus on software development activities for agent systems. They provide a set of behavioural, functional, and structural views on the architectural design of the system and its components (i.e. agents). From the start, the goal is to derive system functionalities instead of describing business processes.
2.8.2. Agent-driven workflow and the use of Petri nets
JBees (Ehrler, Fleurke, Purvis, & Savarimuthu, 2006; Savarithmu, Purvis, & Purvis, 2005) is an agent-based workflow management system that uses CP nets as its process definition formalism. The JBees system implements a distributed network of autonomous agents each responsible for certain work associated with the running workflow process. A top-level CP net is separated in subnets, which are managed and executed by different agents. ADEPT (Jennings, Faratin, Norman, O'Brien, & Odgers, 2000; Jennings, Faratin, Norman, O'Brien, Odgers, & Olty, 2000) provides an infrastructure for the (conceptual) design and implementation of agent-based business process management systems. The different components of a business process are each represented by an autonomous agent. Automated negotiation is used for coordination and management of agent dependencies. Both in JBees and ADEPT, agents must adhere to a pre-defined negotiation protocol, which suffers from the same limitations as the AIPs discussed in Section 2.8.1. Moreover, there is no explicit support for design-time process verification.

Agent-oriented modelling and verification of human collaboration processes
77
Brahms (Sierhuis, Clancey, & van Hoof, 2007) is a modelling and simulation environment for analysing and supporting human work practice in organizations with intelligent software agents. The core of the Brahms model is the activity model that is dependent on internal reasoning, interaction with other agents, and interaction with the environment. WADE (Caire, 2008) is a software platform (built on top of JADE) that facilitates the development of distributed agent applications. WADE agents are embedded with lightweight workflow engines to execute tasks defined as workflows. Both Brahms and WADE are implementation frameworks that lack graphical representations to which business modellers can relate. These frameworks are not useful for business analysts or architects that want to capture, model, analyse, and/or improve HCPs.
Calisti and Greenwood (2008) present a goal-oriented approach towards business processes that consists of a process modelling language, named GO-BPMN, and a business process management system, named LS/ABPM. A strength of GO-BPMN is the clear orientation towards business people. The GO-BPMN language makes a clean separation between goals and the plans that achieve them. At first, processes are described as goal hierarchies. Every leaf goal is then linked to one or more plans that achieve the goal by execution of functional tasks. Likewise, the elementary (or leaf) interactions in the TALL IS diagram are performed by two or more agent behaviours. The IS diagram allows the interactions between participants to be made explicit using a hierarchical tree layout. GO-BPMN allows to specify goal hierarchies instead of interaction hierarchies. A goal describes motivation (i.e. internal behaviour) whereas an interaction describes a collaborative activity (i.e. external behaviour) (Jennings, Faratin, Norman, O'Brien, & Odgers, 2000). The GO-BPMN models are directly executable in the run-time environment of the LS/ABPM suite. This allows the user to test the model but an option to verify either the goal hierarchy or the plans is not offered. Testing shows the presence of errors but not their absence (Eshuis & Grefen, 2008). Finally, the agent-orientation of the entire approach resides mainly in the architecture of the system (and not in the modelling language) in which each process instance is interpreted and run by a software agent.
Several researchers (Adams, ter Hofstede, Edmond, & van der Aalst, 2006; Buhler & Vidal, 2005; Chang & Scott, 1996; Chen & Chung, 2006; Hawryszkiewycz & Debenham, 1998; Huang, Trappey, & Yao, 2006; Joeris, 2000; Palacz & Marinescu, 2000; Singh & Huhns, 1999; Tarumi, Kida, Ishiguro, Yoshifu, & Asakura, 1997; van der Aalst, Barthelmess, Ellis, & Wainer, 2001;

Chapter 2
78
Verginadis & Mentzas, 2008; Wang & Wang, 2005; Yan, Maamar, & Shen, 2001) present or argue in favour of agent-oriented workflow approaches or systems. A (compact) overview is provided by (Thimm & Will, 2004). In essence, most of these approaches focus on the use of agents as part of the architecture and/or infrastructure associated with the workflow management system, or focus on internal agent (implementation) details. Some of these works (Buhler & Vidal, 2005; Joeris, 2000; Palacz & Marinescu, 2000) allow for a (graphical) representation of agent behaviours using Petri nets, which enables validation and verification. However, their graphical representations are limited to the specification of agent behaviours using traditional task-centric process models. In such models, interaction representation is weak, as argued in Section 2.3.1. In these languages, it is not possible to model multi-agent interactions separately from the single agent behaviours.
Other related research is concerned with the application of different types of Petri nets to the agent domain. This research includes:
the use of CP nets and CPN Tools to model and/or analyse agent interaction protocols, and agent negotiation processes (Bacarin, van der Aalst, Madeira, & Medeiros, 2007; Billington & Gupta, 2007; Hanachi & Sibertin-Blanc, 2004);
the use of (hierarchical) CP nets (and other Petri net variants) to study and analyse multi-agent system plans (Oliveira de Almeida, da Silva, Perkusich, & de Barris Costa, 2005; Xu, Volz, Loerger, & Yen, 2002);
the use of CP nets to study agent social systems or social aspects (Costa Miranda & Perkusich, 1999; Weyns & Holvoet, 2002);
the use of CP nets (and other Petri net variants) to specify and analyse agent interaction and behaviour, or to specify the structure of distributed software systems (Camargo-Santacruz, Frausto-Solís, & Ramos-Quintana, 2005; Decker & Weske, 2007; Köhler, Moldt, & Rölke, 2001; Lian & Schatz, 2008; Lin & Norrie, 2001; Miyamoto, Sakamoto, & Kumagai, 2007; Moldt & Wienberg, 1997).
In these Petri net-based approaches, the focus is not on business processes modelling and/or analysis. Their emphasis is on system interaction and behaviour, and (agent) implementation details.

Agent-oriented modelling and verification of human collaboration processes
79
2.9. Conclusions
This chapter argues that the development of multi-agent systems for the support of HCPs via software agents should start with a proper (agent-oriented) understanding of the work practice of the agents in the business domain under consideration. On the one hand, existing agent-based development methodologies and modelling languages are software engineering approaches that focus on system specification instead of business process specification. On the other hand, existing business process modelling languages do not provide effective notations that suit the characteristics of HCPs. Most notably, their representation of the process structure of interactions in a HCP is weak, and they do not allow to model explicitly the individual local behaviours of the interaction participants.
The first part of this chapter presents an interaction-centric business process modelling language for HCPs, named TALL, inspired by the agent paradigm. The main modelling concepts in the language are agents, roles, interactions, and behaviours. To model a HCP, TALL separates between the high-level multi-agent interaction structure and the single agent behaviours that perform the interactions. The former is depicted in the Interaction Structure diagram that allows for hierarchical description of interactions, their composition and routing relations, and their roles in a tree layout. This diagram scopes the interaction context in which the agents behave. The local agent behaviours are represented in Agent Behaviour diagrams. The novelty of the language is that it is in line with a process-oriented approach (in which business processes are explicitly described) but with a focus on interactions and behaviours, which results from the agent-orientation. A visual editor is available to create and manipulate TALL diagrams. A case study of a real-life HCP at a Dutch gas transport company is used to illustrate the language.
Explicit process models can be verified using formal methods. This is the subject of the second part of this chapter. The autonomous behaviours of the agents and their situated nature may give rise to structural incompatibilities that can prevent proper completion of a HCP instance. Therefore, design-time verification is considered necessary to ensure the existence of a successful scenario that can complete a given HCP. A design-time verification method is presented that allows to verify the structural correctness and compatibility of the combined agent behaviours that perform the interactions in the HCP. The proposed verification method translates the Interaction Structure diagram and associated Agent Behaviour diagrams to a hierarchical coloured Petri net. This enables the application of proven computerized analytical methods and tools for Petri nets. An

Chapter 2
80
implemented software tool converts the TALL diagrams, created in the visual editor, into a Petri net format specific to the widely used CPN Tools software package. After translation, the state space analysis feature of CPN tools is used to identify process design errors in the agent behaviours, which are then rolled back to the TALL diagrams. The result is a set of verified Agent Behaviour diagrams that can be used for further analysis, design, simulation, and/or implementation purposes. The proposed verification method is applied to some of the agent behaviours from the case study and the results are discussed. Overall, the method allows business modellers to enhance the reliability and quality of the TALL HCP design, and the (future) multi-agent system that uses the design to provide HCP support.
There are limitations to the TALL modelling language as it currently stands. Further work remains to be done to apply and test the language both in theory and in practice. Feasibility of the language is to be demonstrated by an evaluation of TALL against a generic set of (interaction) patterns (Barros, Dumas, & ter Hofstede, 2005; van der Aalst, ter Hofstede, Kiepuszewski, & Barros, 2003). This allows to prove that the IS diagram is expressive enough to model common process modelling patterns.
TALL is not a general-purpose modelling language but is to be used in conjunction with other languages and (agent-oriented) development frameworks. In this regard, TALL can be the starting point for many possible research directions and applications. With regard to IT support, ongoing work is directed towards the link between the TALL modelling language and the software agent development process in AGE. In this context, future work is concerned with the enactment of the IS diagram to coordinate gaming sessions (i.e. interactive simulations of the business process with human participants/experts) to develop software agents for intelligent IT support of humans in their workplace interactions. In AGE, attention is to be given to the rollback of design errors in an automated way and the implementation of the verification method as a service that can be invoked both at design and implementation time.
In the near future, several other research directions are to be explored. First, the IS diagram currently supports composition and routing relations between interactions. Several other relations are to be investigated, in particular resource, goal, and data dependencies. Related to resource dependencies, the nature of roles and agent groups is to be investigated in more detail as a way to make sure that the role-playing agents in the IS diagram are authorized and skilled to do so. This

Agent-oriented modelling and verification of human collaboration processes
81
requires a more elaborated mechanism for authorizations, and an explicit representation of role permissions and agent groups. Agent groups are generic sets of agents with similar skills. Related to goal dependencies, an explicit representation of goals is currently missing in the language. There is a strong conceptual link between business processes, interactions, agents, and goals. Future work intends to explore the nature and applicability of this link. Related to data dependencies, data compatibility between interactions is to be explored to make sure that data can traverse from interaction to interaction when the IS diagram is enacted (see below).

Chapter 2
82

Chapter 3
An algorithm to integrate local interaction diagrams in human collaboration processes
This chapter is an edited version of the manuscript: Marco Stuit and Gerben G. Meyer. Agent interaction modelling based on product-centric data: A formal method to improve enterprise interoperability. In: K. Fischer, J.P. Muller, J.J. Odell, A.J. Berre (Eds.), Agent-Based Technologies and Applications for Enterprise Interoperability, Lecture Notes in Business Information Processing, 25, pp. 197-219. Heidelberg, Berlin, Germany: Springer, 2009.

Chapter 3
84
Abstract
his chapter shows how organizations can use product-centric data to produce local interaction representations of the interactions with and between their partners. An interaction-centric business process modelling
language named TALL, which is both graphical and formal, provides notations and diagrams to create these representations. A novel algorithm is introduced that enables partners to automatically integrate multiple local interaction diagrams into a global interaction diagram. This global interaction diagram improves enterprise interoperability since it increases overall process visibility. A process example of a simplified collaborative supply chain is used to exemplify the algorithm.
T

An algorithm to integrate local interaction diagrams in human collaboration processes
85
3.1. Introduction
Nowadays, there is an ongoing trend towards the provision of business processes that are collaborative of nature. Such business processes are provided by autonomous partners, which together deliver complex products and/or services in a collaborative network (Camarinha-Matos & Afsarmanesh, 2005; Moitra & Ganesh, 2005; Zacarias, Pinto, Magelhães, & Tribolet, 2009). This is explicitly shown by the emergence of new organizational forms like the networked or virtual enterprise (Jagdev & Thoben, 2001). The distributed nature of collaborative business settings is a good match for agent technology (Presley & Liles, 2001; Taveter & Wagner, 2002). The autonomous partners in such business settings can be seen as agents that execute certain tasks locally, while the interactions between the partners can be seen as interactions in a multi-agent system. To capture these interactions, the TALL modelling language has been developed (Stuit & Szirbik, 2007; Stuit & Szirbik, 2009; Stuit & Wortmann, 2010). TALL is an interaction-centric business process modelling language, based on agent-oriented concepts and notations, to model the process structure of interactions that makes up a human collaboration process (HCP). The algorithm presented in this chapter adopts the language to create graphical interaction diagrams.
The manufacturing industry is increasingly moving from a supplier-driven to a customer-driven market. This transition is a great challenge to the manufacturing process itself since it must be more flexible and robust as well as demonstrate enhanced scalability (Bussmann & Schild, 2000). Supply chains are evolving to keep in line with these developments. This is particularly shown by the move from conventional location-centric supply chains to product-centric supply chains (Holmström & Främling, 2006), as shown in Figure 3-1. A conventional supply chain is based on a systems design that is focused on location-specific material accounts and transactions between locations. In contrast, a product-centric supply chain is based on a systems design that tracks and controls individual products independently of the location and the ownership of the product individual. Callon, Méadel, and Rabeharisoa (2002) explain that product-centric control makes explicit the role of the product as the coordinating entity in the delivery of customized products and services.

Chapter 3
86
Figure 3-1. Location-centric (left) and product-centric supply chains (right). Source: (Holmström, Kajosaari, Främling, & Langius, 2009).
Product-centric control is the focus of the TraSer project20, in which control efforts are directed at individual products of the value-adding (supply) network. The idea behind product-centric control is that individual products and their components are the basic entities in the information system rather than orders, production orders, or shipment batches. In the TraSer approach, each product is labelled with an RFID or barcode, which contains an ID@URI code (Huvio, Grönvall, & Främling, 2002). With this ID@URI code, each product carries a unique identification number (ID), as well as a reference (Uniform Resource Identifier) to the location of a database where product-centric data is stored. In this way, each partner in the supply chain can access this data, which results in product visibility throughout the supply chain.
Product-centric data is information that is linked to individual products to meet information management needs of partners and/or customers at the level of the individual product (and its components). Such needs usually arise in supply networks for tracking and logistics control (Kärkkäinen, Ala-Risku, & Främling, 2003). To collect and share product-centric data, peers can directly interact with an information-based representation of a product. This information-based representation acts like an interface to a company-specific database that stores and maintains the product-centric data. The connection between the physical product and the information-based representation is usually made using a tag (e.g. RFID tag) and a reader (e.g. a handheld RFID reader) (Meyer, Främling, & Holmström, 2009).
20 http://www.traser-project.eu

An algorithm to integrate local interaction diagrams in human collaboration processes
87
The product visibility that results from the use of product-centric control in the network does not imply process visibility. This chapter proposes to use product-centric data to identify the multiple interactions between the different partners in a supply chain. Together these interactions form a HCP. Currently, none of the partners has a global view of the entire HCP in the supply chain, as each partner only has data about their interactions with direct partners. To increase interoperability between the partners, it is considered beneficial to build a global interaction diagram, which gives and end-to-end overview of the HCP. By using the product-centric data available in the supply chain, each partner is enabled to identify and model the local interactions of partners in local interaction diagrams. This chapter presents a novel algorithm, named the Global Construction Algorithm (GCA), which enables partners to automatically integrate the local interaction diagrams into a global interaction diagram. This global interaction diagram realizes improved understanding and insight in the supply chain’s HCP for a given partner. The goal of GCA is to build a minimal global interaction diagram where interactions from different local interaction diagrams are merged when there is no conflict. A conflict indicates the existence of alternative local views on the same interaction. GCA assumes a common shared ontology in the business domain under consideration. Ontology matching is outside the scope of this chapter.
This chapter is structured as follows. Section 3.2 introduces the notations of the TALL interaction diagrams. Next, Section 3.3 shows an example HCP, concerned with a simplified supply chain, in which product-centric data is used to build local interaction diagrams. After, Section 3.4 presents GCA. Section 3.5 applies GCA to the case example. After, Section 3.6 presents a discussion together with future work. Finally, Section 3.7 gives conclusions.
3.2. The TALL modelling language
TALL is an interaction-centric business process modelling language inspired by the agent paradigm (Stuit & Szirbik, 2007; Stuit & Szirbik, 2009; Stuit & Wortmann, 2010). The language is both formal and graphical. The organizational context in which a HCP occurs is seen as a multi-agent environment in which different agents behave in interactions to coordinate their work. The language explicitly recognizes interaction as the core activity in collaborative organizational work.
The TALL Interaction Structure (IS) diagram represents the interactions in a given HCP. In the IS diagram, interactions are represented by flattened hexagons, and are related to other interactions through composition (one interaction being

Chapter 3
88
part of another) and routing (one interaction must be completed before, in parallel with, or instead of another interaction). Figure 3-2 shows an example of an IS diagram in which interaction X is decomposed in two child interactions. Formally, the IS diagram is a tree with a single root interaction. This implies that each interaction appears at a certain level or height in the tree. The root interaction, which appears at the top, has height zero. Roles, which are depicted as ellipses, are connected to the lines outgoing the hexagon (see Figure 3-2). In TALL, an interaction does not exist without at least two roles being bound to it. For simplicity, a role can be thought of as a generic participant type rather than a specific agent who plays a role in an interaction. Roles also represent division of responsibility in the process. Roles are specified for each elementary interaction (i.e. interactions without children) and then collected bottom-up as in Figure 3-2.
Figure 3-2. Agent interaction modelling in the TALL modelling language.
The routing relations supported in the IS diagram are sequential routing (SEQ), parallel routing (PAR), and exclusive choice (XOR). Child interactions are linked to their parent interaction by a routing symbol that indicates the routing relation between a given set of sibling interactions. As Figure 3-2 shows, the routing symbol is a circle, which graphically appears below parent interactions. With sequential routing, there is a strict dependency between the interactions (i.e. an ordered sequence). With parallel routing, the interactions can be performed at the same time (i.e. true concurrency) or in an arbitrary order (i.e. an unordered sequence). Decision rules can be attached to the routing types to enable rule-based execution of interactions. Graphically, a (non-empty) decision rule set is depicted by attaching a subscripted letter d to the routing type (as in Figure 3-2). Decision rules can for instance be used to achieve an exclusive deterministic choice (XORd),

An algorithm to integrate local interaction diagrams in human collaboration processes
89
or to make an inclusive choice for N-out-of-M direct children. In the latter case, when N 2, the children are executed in sequence (SEQd) or in parallel (PARd). Graphically, for the SEQ and PAR routing types (with or without decision rules), sibling interactions are laid out linearly in the order of execution with the first interaction on the left. In Figure 3-2, interactions X-1 and X-2 are performed in sequence to complete interaction X. Interaction X-2 is completed by either interactions X-3 or X-2. In general, a parent interaction completes when its child interactions complete according to the specified routing relation. Thus, by convention, completion or composition is read bottom-up while routing between sibling interactions is read from left to right. In this chapter, the IS diagram is used to represent the interactions between agents in a supply chain.
A visual editor is available for the TALL modelling language to build and manipulate TALL diagrams. Moreover, a software tool, named Local IS Integrator (LISI), which works on the database created by the visual editor implements GCA. All software tools are freely available from the software section on http://www.agentlab.nl/.
3.3. Product-Centric Case Example
This section presents an example HCP from the perspective of one agent in a supply chain. The example HCP is used to illustrate how this one agent can build a global IS diagram of the supply chain using local process information (i.e. interactions this agent has with its direct partner agents) and product-centric data, which is linked to individual products. The example HCP is a simplified supply chain, based on (Collins, Aruachalam, Sadeh, Eriksson, Finne, & Janson, 2006), in which agents have the shared goal of delivering Personal Computers (PCs) to end customers. Figure 3-3 shows a high-level picture of the example HCP.
Figure 3-3. The simplified collaborative supply chain.
Supplier of HDDs
Supplier of CPUs
…
Manufacturer Retailer Customer

Chapter 3
90
In this supply chain, several supplier agents deliver computer parts to a manufacturer agent, who assembles the computer(s), and ships them to a retailer agent. The retailer agent sells the assembled computer(s) to a customer. Here, the focus is on the view of the retailer agent in the example HCP. The retailer can build a (local) IS diagram of its interactions with its direct partner agents. This diagram is shown in Figure 3-4. The roles are omitted in this diagram for clarity reasons. However, the agents are playing their given roles as supplier, manufacturer, retailer, or customer. As can be seen in the diagram, the root interaction of the retailer agent is Deliver PCs, which is also the common shared goal of the entire supply chain. To achieve this goal (i.e. to complete the Deliver PCs interaction), the retailer interacts with the manufacturer (interaction Manufacturer-Retailer) and with the customer (interaction Retailer-Customer). With regard to the Manufacturer-Retailer interaction, the retailer agent interacts with the manufacturer to order PCs and later on to receive the shipments of PCs. The interaction with the customer is a bit more complex, it consists of a partially ordered set of interactions, in which a quote is requested by the customer, a quote is sent to the customer, and if the customer accepts the quote, an order and shipment of the PCs follows.
Figure 3-4. The IS diagram of the retailer.

An algorithm to integrate local interaction diagrams in human collaboration processes
91
To improve the insight of the retailer agent in the example HCP, the retailer agent can build local IS diagrams from the perspective of the other agents in the supply chain by generalizing over available product-centric data. Table 3-1 shows an example of product-centric data of an individual product in the supply chain. The product-centric data provides partial information about the interactions in which the other agents are involved, as the product-centric data per product individual only contains information about product location and shape changes including the time when these changes happened. Based on this, the local IS diagrams that are input to GCA are assumed to be incomplete.
Table 3-1. Example of product-centric data. Product‐ID Time Type Location
123456 10.01.2008 12:34 Shipment Manufacturer X
123456 15.01.2008 13:35 Assemble Manufacturer X
123456 20.01.2008 14:36 Shipment Retailer Y
123456 25.01.2008 15:37 Shipment Customer Z
From the product-centric data only the interactions with and between partners can be identified. The activities executed by the partners to perform the interactions remain private knowledge. Furthermore, confidentiality is provided to partners as they can decide to share or withhold certain product-centric data. The number of interactions identified from the product-centric data is higher in business settings where trust between partners is high. In such settings, partners feel less inhibition to share product-centric data (or any other information) throughout the supply chain. Trust between partners is usually built up in long-term supplier-customer relationships. In case of complex products, product-centric data of the components of the product can also be retrieved, at least if the data of the components is stored with or linked to the product data.
As mentioned before, a partial IS diagram from the perspective of the manufacturer agent can be built by the retailer agent, based on the available product-centric data. Figure 3-5 illustrates this diagram for the example HCP. Such a diagram can be built by using a set of simple rules, based on the location changes of the product, as well as the physical changes made to the product. A physical change is modelled as an interaction, as it can be considered an interaction between the manufacturer and the product. An example is the interaction Assemble PCs in Figure 3-5.

Chapter 3
92
Figure 3-5. The IS diagram of the manufacturer from the retailer’s viewpoint.
This diagram only reveals when products are shipped between agents, when products are changed, and in which order this occurs. Therefore, an interaction is allowed to have a single child, since the interactions that are identified based on the product-centric data can be incomplete like for instance the Manufacturer-Retailer interaction in Figure 3-5. The Customer-Manufacturer interaction does only occur when one or more of the delivered PCs need to be repaired by the manufacturer agent. Thus, a decision rule that can check this condition is attached to the SEQ routing type that graphically appears below the Deliver PCs interaction (see Figure 3-5). If one or more of the PCs need to be repaired, all four interactions on level one in the tree occur in sequence. If not, N-out-of-M children occur in sequence. In this specific example, the latter case means that three out of four children occur in sequence.
In a similar way, an IS diagram from the perspective of the customer agent can be created by the retailer agent. This diagram is shown in Figure 3-6. Again, based on the product-centric data, only the shipments of and physical changes to the product are revealed.
Deliver PCs
SEQd
Manufacturer-Retailer
Supplier-Manufacturer
SEQ
...
Ship PCs to Retailer
SEQ
Ship PCs to Manuf.
Repair PCs
PAR
Ship HDDs to Manuf.
Ship CPUs to Manuf.
Assemble PCs
Customer-Manufacturer
Ship PCs to Customer

An algorithm to integrate local interaction diagrams in human collaboration processes
93
Figure 3-6. The IS diagram of the customer from the retailer’s viewpoint.
3.4. Global Construction Algorithm
This section introduces the formal aspects of GCA, which can integrate a set of local IS diagrams into a global IS diagram. As explained in the previous section, each partner agent involved in a product-centric supply chain can use product-centric data to identify agent-to-agent interactions. Each agent builds a set of local IS diagrams (in which each set can be different), representing its own interactions as well as interactions other agents are performing. This is considered necessary as agents (e.g. in a supply chain) are not always willing to exchange their process definitions.
Figure 3-7 shows the input and output of GCA graphically. The algorithm expects a global IS diagram GI (Global Input), which only contains the root interaction i0. The root interaction represents the common shared goal of the HCP under study. Furthermore, GCA expects a set of local IS diagrams LI (Local Input) that are to be merged. Each local IS diagram is based on the same root interaction i0. GCA outputs a global diagram GO (Global Output). As explained before, the goal of the algorithm is to build a minimal interaction diagram GO where the interactions, from the diagrams that are being compared, are merged when there is no conflict. Conflicts are detected by the function CONFLICT (see below).

Chapter 3
94
Figure 3-7. Illustration of the input and output of the global construction algorithm.
GCA uses some notations from the formal definition of the TALL IS diagram (Stuit & Szirbik, 2009). Here, these notations are explained informally:
I is the set of interactions that forms an IS diagram;
LI(i) is a function that assigns a label to each interaction from the set I. Although interactions can share labels in the same diagram, each interaction is unique. Thus, interactions with identical labels are completely unrelated when executed;
RT is the routing type function that assigns a routing type to each interaction from the set I. The function RT indicates how a set of sibling interactions is routed to complete their parent interaction. As Section 3.2 explains, the supported routing types are SEQ, PAR, and XOR with or without decision rules;
The partial ordering relation <i I I connects parent interactions to their
child interactions. Graphically, a line is drawn between a parent and each direct child. These lines converge in the routing type symbol that graphically appears below each parent interaction (as in Figure 3-2);
DR(i) is a function that assigns a decision rule set to each interaction. As Section 3.2 explains, graphically the routing type is augmented with a subscripted letter d if the decision rule set is non-empty;
The set R contains all roles that are relevant to the set of interactions I;
RI is a function that connects roles to interactions. Graphically, this is depicted by a connector line between a role and an interaction (as in Figure 3-2);
LR(r) is a function that assigns a label to each role from the set R;
i0 denotes the root interaction;
children(i) is a function that returns the set of direct child interactions of the parent interaction i;
parent(i) is a function that returns the parent of the interaction i;
ht(i) is a function that returns the height of interaction i.

An algorithm to integrate local interaction diagrams in human collaboration processes
95
In addition, some new operators and notations are used in GCA, as an extension of the formal definition in (Stuit & Szirbik, 2009):
1. an operator for the union of two IS diagrams is needed. If IS1 and IS2 are two IS diagrams, then the union of IS1 and IS2 is an IS diagram ISIS1 IS2 = IS1 IS2 such that: II1 I2 = I1 I2, <I <I1 <I2 = <I1<I2, RR1 R2 = R1R2, RIRI1 RI2 = RI1RI2. The union of the set of interactions and the set of roles includes the union of the interaction attributes (label, routing type and decision rule set) and role attributes (label). Hence, if I1 and I2 are two sets of interactions then the union of I1 and I2 is an interaction set II1 I2 = I1 I2 such that: LI1 I2 = LI1LI2, RTRT1 RT2 = RT1RT2, DRDR1 DR2 = DR1DR2. Similarly, if R1 and R2 are two sets of roles then the union of R1 and R2 is a role set RR1 R2 = R1R2 such that: LR1 R2 = LR1LR2;
2. subtree(i) is a function that returns a segment or subtree of the IS diagram
with root i. Thus, subtree(i) IS (see Figure 3-8);
3. comp(i) is a function that returns a single component of the IS diagram. In other words, it returns a subtree with the single interaction i. A component comprises an interaction, and all its attributes and roles;
4. clone(i) is a function that returns a new interaction with all attributes and roles of i. In other words, it creates a copy of the component i;
5. dum: I{TRUE, FALSE} is a function that is used by GCA to
differentiate between ‘normal’ interactions and dummy interactions. Dummy interactions are introduced during execution of GCA to act as the parent of identically labelled interactions, which the algorithm cannot merge because of a conflict. Such interactions are alternative views on the same interaction. This implies that all children of a dummy interaction have identical labels. Initially, the default setting for all interactions is FALSE: iI: dum(i);
6. IH is an ordered set in which all interactions iI are ordered according to the binary relation R = {(i1, i2) | i1I i2I ht(i1) ht(i2)}. Effectively, this means that the interactions in the set IH are ordered according to their height in an ascending order;
7. elements are augmented with an index GI, GO, or li indicating that the element appears in the global input diagram, the global output diagram or in the local diagram under consideration. For instance, interaction i0
GO is the root interaction that appears in the global output diagram.

Chapter 3
96
Figure 3-8. Illustration of the input (left) and output (right) of the subtree function when applied to interaction C.
GCA is listed in Table 3-2. The algorithm is expressed in pseudo-code, which uses set-theoretic notation mixed with the control structures of conventional high-level programming languages.

An algorithm to integrate local interaction diagrams in human collaboration processes
97
Table 3-2. The Global Construction Algorithm. 1: function CONSTRUCT (GI,LI)
2: begin
3: GO := GI
4: for each liLI do
5: for each iIHli do
6: if isubtree(parent(i)li)GO then
7: inew := clone(i)li
8: GO := GO {comp(inew)}
9: <IGO := <I
GO {(parent(i)li, inew)}
10: else if conflict(subtree(i)GO, subtree(i)
li) then
11: idum := j: jIGO i = j dum(j)
12: if idum then
13: idum := clone(i)GO
14: DR(idum) :=
15: dum(idum) := TRUE
16: GO := GO {comp(idum)}
17: <IGO := <I
GO {(parent(i)GO, idum)}
18: <IGO := <I
GO \ {(parent(i)
GO, i
GO)}
19: <IGO := <I
GO {(idum, iGO)}
20: iconflict := clone(i)li
21: comp(idum)GO := comp(idum)
GO comp(iconflict)GO
22: RT(idum) := XOR
23: GO := GO {comp(iconflict)}
24: <IGO := <I
GO {(idum, iconflict)}
25: else
26: comp(i)GO := comp(i)
GO comp(i)li
27: return GO
28: end
GCA is contained into a main for each-loop (Lines 4-27) that in each iteration compares GO (= GI, see Line 3 in Table 3-2) to a local IS diagram liLI. During the comparison, the algorithm searches for commonalities (i.e. overlapping views) and/or differences (i.e. alternative or complementary views) between GO and li by comparing (labels of) the interactions in both diagrams. If possible, GCA merges interactions in both diagrams. In any case, GCA produces a new (integrated) global IS diagram GO that serves as input for the next iteration. This global IS diagram is compared with the next local diagram from LI, until all the local IS diagrams have been processed. In the end, GCA produces a global IS diagram GO in which all local IS diagrams are integrated.
GCA first assigns GI to GO (Line 3). Inside the main for each-loop (Lines 4-27), an inner for-each loop (Lines 5-26) processes one by one all the interactions

Chapter 3
98
from the local IS diagram li under consideration according to the ordering in the set IH. This means that GCA starts with the root interaction in the local IS diagram li that has height zero. Next, the algorithm continues with the interactions that have height one (i.e. the direct child interactions of the root interaction), and so on until all the interactions in the local IS diagram li have been processed. Three cases can apply to the interaction ili that is being processed.
Case 1: Interaction ili does not exist in the same segment or subtree of GO (Line 6) The if statement in Line 6 of GCA tests whether interaction ili should be added to GO. Interaction ili is added to GO when ili does not exist in the subtree of its parent in GO. When the condition in Line 6 is true (i.e. case one applies), a clone of ili is created (Line 7), the clone is added to GO (Line 8), and the clone is connected to the correct parent in GO (Line 9).
Figure 3-9 shows a generic example (without roles) in which the condition in the if statement in Line 6 is true for interaction Dli. In this specific example, interaction Dli does not exist in the subtree of its parent in GO, that is, the subtree of AGO. Therefore, the component Dli is added to GO. In Figure 3-9, GOold and li are the two IS diagrams being compared. Both diagrams show the incomplete local interaction view of an agent, which is build based on product-centric data. In this regard, each IS diagram represents a specific incomplete part of the overall HCP in the product-centric supply chain. The local IS diagram of the first agent shows that interactions B and C occur in parallel to complete interaction A. The local IS diagram of the second agent shows that interactions C and D occur in parallel to complete interaction A. Based on the assumption that local IS diagrams are incomplete, it is sufficient to perform interaction A once in GOnew. In this regard, the two agents provide complementary views with an overlap (i.e. interaction C) that are integrated to create a more complete interaction view. In the output diagram, GCA has merged the overlap. It is important to note that, merging only occurs when the views of agents are not conflicting. Case 2 discusses how GCA deals with a conflict situation.

An algorithm to integrate local interaction diagrams in human collaboration processes
99
Figure 3-9. A generic example of a Global Input diagram (GOold), a local input diagram (li), and a Global Output diagram (GOnew). The example illustrates the case in which interaction Dli is added to GOnew since it does not exist in GOold.
Case 2: Interaction ili exists in the same segment or subtree of GO, and generates a conflict situation (Line 10) If the condition in Line 6 is false, which means interaction ili has a counterpart iGO in the same segment of GO, GCA continues with the else if statement in Line 10. This else if statement tests whether there is a conflict between the interactions iGO and ili. A conflict is detected by the function CONFLICT that is listed in Table 3-3.
GO
old
GO
new
li
PA
RA
BC
PA
RA
BC
PA
RA
CD
D

Chapter 3
100
Table 3-3. The function CONFLICT. 1: function CONFLICT (sGO,sli)
2: begin
3: if RT(i0GO)GO RT(i0
li)li then
4: return TRUE
5: else
6: X := children(i0li)li
7: Y := X GO
8: for each jY do
9: if ht(j)GO ht(j)
li then
10: return TRUE
11: return FALSE
12: end
In general, a conflict means that the interactions being compared cannot be merged since they are alternative views on the same interaction. Hence, GCA keeps both interactions (iGO and ili) in the global output diagram. A new interaction idum (dummy interaction) is introduced (Line 13) to act as the parent of iGO and ili. Since idum carries the decision rule set of iGO (i.e. it is a clone of interaction iGO, see Line 13), Line 14 empties the decision rule set of idum. Next, Line 16 adds idum including all its attributes and roles to GO. GCA then assigns idum as parent interaction of iGO (Line 19). In the scenario in which iGO already has a parent, Lines 17 and 18 make sure that this parent is detached as parent of iGO and instead is assigned as parent of idum. Any newly introduced dummy interaction is assigned TRUE by the function dum(i) (Line 15). Together with Lines 11 and 12, this prevents that in a future iteration another dummy interaction is introduced in GO for the same two interactions. Since idum acts as parent of iGO and ili, the next step is to add ili to GO. To this end, Line 20 first creates a clone of ili named iconflict. After, Line 23 adds iconflict to GO and Line 24 assigns iconflict as a child interaction of idum. Line 21 assigns the union of the components of iGO and iconflict to the dummy interaction idum. In this way, the combined roles of its child interactions are attached to idum. Since the direct child interactions of idum are different views on the same interaction, idum is assigned the routing type XOR by Line 22. The use of a different routing type than XOR would imply that the conflict interactions are executed more than once.
The function CONFLICT receives as input, from GCA, the subtrees of iGO and ili (i.e. sGO and sli, see Table 3-3). This means that the root interactions in the function CONFLICT are (the currently being processed) interaction ili and its counterpart iGO. A conflict arises in two situations. First, when the routing types of iGO and ili are different (Line 3 in Table 3-3), they are considered alternative views

An algorithm to integrate local interaction diagrams in human collaboration processes
101
on the same interaction. In this case, the CONFLICT function returns TRUE (Line 4 in Table 3-3). This is the first conflict situation. Second, when the routing types of iGO and ili are not different, the CONFLICT function builds a set X that contains all child interactions of i0
li (Line 6 in Table 3-3), and builds a set Y that contains all interactions that are members of both X and the set of interactions in sGO (Line 7 in Table 3-3). For all the interactions in the set Y, the CONFLICT function then tests whether these interactions occur on the same level (i.e. height) in sGO and sli. In other words, the function checks whether the children of i0
li have counterparts in sGO that occur on another level. If there are no such counterparts, there is no conflict and the function returns FALSE (Line 11 in Table 3-3). However, if there are such counterparts (Line 9 in Table 3-3) then i0
GO and i0li are considered
alternative views on the same interaction and the function returns TRUE (Line 10 in Table 3-3). The latter forms the second conflict situation.
Figure 3-10 shows a generic example in which the interactions AGO and Ali are in conflict because they have different routing types (i.e. the first conflict situation). A new (dummy) interaction with the same label and the routing type XOR is introduced in GOnew to act as the parent of AGO and Ali.
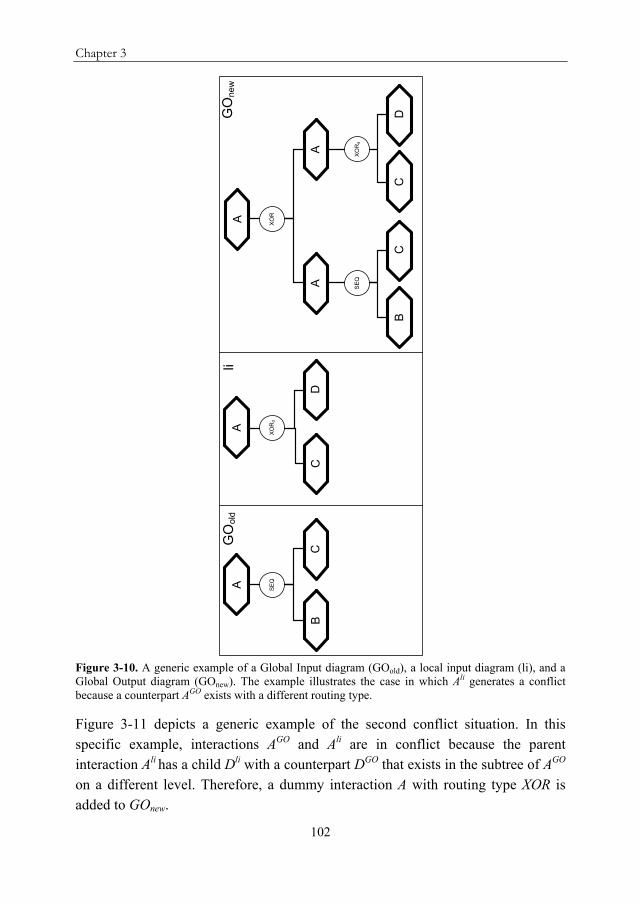
Chapter 3
102
Figure 3-10. A generic example of a Global Input diagram (GOold), a local input diagram (li), and a Global Output diagram (GOnew). The example illustrates the case in which Ali generates a conflict because a counterpart AGO exists with a different routing type.
Figure 3-11 depicts a generic example of the second conflict situation. In this specific example, interactions AGO and Ali are in conflict because the parent interaction Ali has a child Dli with a counterpart DGO that exists in the subtree of AGO on a different level. Therefore, a dummy interaction A with routing type XOR is added to GOnew.
A SE
Q
C
GO
old
GO
new
A
SE
Q
C
li
XO
Rd
A
XO
Rd
A
DC
D
A
XO
R
B
BC

An algorithm to integrate local interaction diagrams in human collaboration processes
103
Figure 3-11. A generic example of a Global Input diagram (GOold), a local input diagram (li), and a Global Output diagram (GOnew). The example illustrates the case in which Ali generates a conflict because it has a child interaction that occurs on a different level in the subtree of its counterpart AGO .

Chapter 3
104
Case 3: Interaction ili exists in the same segment or subtree of GO, and there is no conflict situation (Line 25) From here, any line numbers refer to Table 3-2 again. If ili exists in the same segment of GO but there is no conflict, the statement in Line 26 is executed. In this case, the components of iGO and ili are merged so that their roles and attributes are properly integrated. Figure 3-9 includes an example of this case. In Figure 3-9, parent interaction Ali has a child interaction Cli with a counterpart CGO in the subtree AGO. However, in this case there is no conflict between AGO and Ali because CGO and Cli occur on the same level in GOold and li. Thus, in this case, it is unnecessary to introduce a dummy interaction and keep both AGO and Ali in the output diagram.
3.5. Application of the Global Construction Algorithm
This section applies GCA to the example HCP described in Section 3.3 and shows the output global IS diagram. The retailer agent in the supply chain can run GCA with the different local IS diagrams it has created based on the available product-centric data (as shown in Figure 3-4, Figure 3-5, and Figure 3-6) as input. Figure 3-12 shows the output diagram. This global IS diagram shows the example HCP starting from the supplier, until the product reaches the customer, and afterwards, when optionally a product (i.e. PC) is returned by the customer for repair by the manufacturer. Despite its simplicity, the example demonstrates several important features of GCA.
First, the example shows how complementary views on an interaction are integrated when a given interaction appears in the local diagram li under consideration but does not appear in the global diagram GO. This reflects the first case in GCA. An example of such an interaction is the Assemble PCs interaction from the manufacturer diagram (see Figure 3-5), which does not appear in the retailer diagram (see Figure 3-4). A clone of this interaction is created, the clone is added to GO, and connected to the same parent in GO (see Figure 3-12).

An algorithm to integrate local interaction diagrams in human collaboration processes
105
Figure 3-12. The output of the global construction algorithm for the retailer agent in the example HCP.

Chapter 3
106
Second, the example shows how GCA deals with a conflict situation, that is, the second case in the algorithm. In the example, the retailer diagram (Figure 3-4) and the customer diagram (Figure 3-6) both include the Retailer-Customer interaction. The Ship PCs to Customer interaction, which is a child of the Retailer-Customer interaction in the customer diagram, also exists on a different level in the subtree of the Retailer-Customer interaction in the retailer diagram. Because of this, the function CONFLICT returns TRUE since the two Retailer-Customer interactions are considered alternative views on the same interaction. GCA keeps both views in the output diagram, and adds a new (dummy) parent interaction for both views. In this way, the ordering constraints of both views are preserved. Since both views are alternative descriptions of the same interaction, the new parent interaction is assigned the XOR routing type (see Figure 3-12).
Third, the example shows how GCA deals with the third case. For instance, when the root interactions in the retailer and manufacturer diagrams are being compared, a conflict does not arise. These interactions have similar routing types and the children of the Deliver PCs interaction in the manufacturer diagram do not occur on a different level in the retailer diagram. Thus, the CONFLICT function returns FALSE and GCA executes the statement in Line 26 (see Table 3-2). This statement integrates the attributes and roles of both interactions. This includes the decision rule sets of both interactions, which explains the SEQd routing type of the Deliver PCs-interaction in the global output diagram.
3.6. Discussion
In a HCP, typically, no agent has a complete view of all the interactions that occur in the process. Each agent has its own local situated view of the process. This view can be made explicit in a local IS diagram. To obtain a global view of the HCP, the local IS diagrams can be integrated using GCA. The local IS diagrams can be build based on product-centric data like in the example HCP. Here, the output global IS diagram provides the retailer agent with an end-to-end overview of the interactions in the product-centric supply chain.
For other HCPs, which are performed in business settings where no product-centric data is available, the value of GCA is its ability to integrate a set of local IS diagrams, owned by different agents. More specifically, a modeller can capture and model the local (i.e. restricted and incomplete) interaction views of the process participants (read: agents) in local IS diagrams. These local IS diagrams are created separately (and concurrently when multiple modellers are involved) for each agent.

An algorithm to integrate local interaction diagrams in human collaboration processes
107
Next, GCA can be used to integrate the local IS diagrams into a global IS diagram. In this way, the tacit domain knowledge of agents can be formalized in local diagrams and be used to build a global diagram. Taking into account the local interaction views of the agents has the potential to minimize the gap between the actual HCP and the modelled HCP. The global IS diagram makes the interactions in the HCP under study explicit, and amenable to proper analysis and improvement.
In a process execution environment, the role of the global IS diagram could be to enact and/or monitor the execution of the interactions in a given HCP. The diagram could serve as a coordination structure for the activities executed by the distributed agents to perform the interactions, and hereby improve process interoperability and alignment. For this, the agents need to adopt a multi-agent system in which the global IS diagram can reside. The realization of such a multi-agent system is part of future research. An interesting research direction is the use of GCA at process execution time. During HCP execution, it should be possible for agents to initiate interactions that are not part of the IS diagram to ensure process flexibility in highly dynamic contexts. The algorithm can be used at runtime to make sure that local changes are reflected in the (global) IS diagram. In this way, on-the-fly structural modification of the IS diagram can be realized.
GCA can be improved by enhancing the CONFLICT function. First, an enhanced version of the CONFLICT function could, in some cases, return FALSE even if two interactions with identical labels have different routing types. For instance, the PAR routing type is quite weak in the sense that it allows interactions to be executed at the same time or in an arbitrary order. Therefore, it could be possible to merge two interactions with identical labels with routing types PAR and SEQ. Second, the function should, in some cases, be able to merge alternative views with identically labelled interactions occurring on different levels (i.e. the second conflict situation in GCA). Currently, the Retailer-Customer interactions in the retailer diagram (Figure 3-4) and the customer diagram (Figure 3-6) are considered alternative views because a descendant of these interactions (i.e. the Ship PCs to Customer interaction) appears on a different level in both diagrams. Although it is likely that both diagrams are concerned with the same Retailer-Customer interaction, it is also possible that for instance the shipment in the customer diagram refers to a secondary shipment. In this case, the Retailer-Customer interactions are different interactions. The direction chosen with GCA is to represent the views of all the agents so that no information is lost, even though

Chapter 3
108
this can lead to redundant interactions in the global output diagram. Therefore, the output diagram in Figure 3-12 shows both Retailer-Customer interactions. In line with the general goal of GCA to create a minimal interaction representation, future research intends to investigate ways to minimize redundancy in the output diagram. Related to this, a possible future enhancement to GCA would be a pruning feature, which compresses the global output diagram by removing redundant interactions. Besides redundancy that can result from alternative views, redundancy can also occur when an interaction has the same routing type as its parent interaction. Often, such an interaction can be deleted and its child interactions can be directly connected to its parent interaction.
3.7. Conclusions
In product-centric supply chains, coordination and control efforts are aimed at individual products. In these supply chains, product owners store product-centric data in a database that is associated to each product individual. When this database is made accessible to partners (e.g. via a product interface), product visibility is achieved in the supply chain.
This chapter presents an example HCP of the interactions between partners in a simplified product-centric supply chain. The purpose of the example is threefold. First, it shows how a partner can use product-centric data to identify its own interactions and the interactions of other partners in the supply chain. Second, it shows how to formalize the identified interactions in local interaction diagrams for each partner. Finally, it shows how a novel algorithm is used to automatically integrate the local interaction diagrams in a global interaction diagram. The focus is on the exemplification of the formal components and workings of the algorithm. The goal of the algorithm is to build a minimal global interaction diagram where the interactions from the local interaction diagrams are merged when there is no conflict. A conflict indicates the existence of alternative local views on the same interaction. The interaction diagrams are visualized with an interaction-centric business process modelling language named TALL. The global interaction diagram increases process visibility, and benefits process alignment and operability in the HCP under study.

Chapter 4
Discovery and analysis of email-driven collaboration processes
This chapter is an edited version of the manuscript: Marco Stuit and Hans Wortmann. Discovery and analysis of e-mail-driven business processes. Information Systems, Under Review (2nd round after Moderate Revision).

Chapter 4
110
Abstract
-mail is used as the primary tool for business communication and collaboration. This chapter presents a novel email interaction mining method to discover and represent email-driven business processes. An
email-driven business process is perceived as a human collaboration process that consists of interactions between people who may each play different roles. The notion of message threads (i.e. sets of e-mail messages that are replies to each other) is used as the fundamental building block to construct the interactions in the email-driven business process. The proposed method adopts an interaction-centric business process modelling language to visualize the discovered email-driven business process. The method identifies message threads from an e-mail archive, and constructs an interaction-centric process model based on the temporal order and similarity of the threads. Process-related information is extracted from e-mail header fields. A software tool, named Email Interaction Miner, implements the proposed method. A case study is used to apply and evaluate the method on a set of e-mails collected from a Dutch gas transport company. The evaluation results are discussed. These results comprise business process improvement options for the case organization, and contributions to theory and language development.
E

Discovery and analysis of email-driven collaboration processes
111
4.1. Introduction
Nowadays, being involved in interactions through e-mail is a common occurrence in both people’s professional and personal lives. E-mail is so important for the work of employees that it has become a “habitat”, the central place from which work is received, managed and delegated in organizations (Duchenaut & Bellotti, 2001). In business settings, most e-mail messages involve collaborative tasks. These tasks involve interactions with colleagues both within and across the organization to coordinate collaborative work (Dredze, Lau, & Kushmerick, 2006; Duchenaut & Bellotti, 2001; Khoussainov & Kushmerick, 2005; Kushmerick, Lau, Dredze, & Khoussainov, 2006; Uden, Kumaresan, & Salmenjoki, 2007; van der Aalst & Nikolov, 2008; Whittaker, 2005). Since their employees spend a significant amount of time communicating through e-mail, organizations are starting to recognize the importance of e-mail in business process management (Duchenaut & Bellotti, 2001; Kushmerick & Lau, 2005; Moran, Cozzi, & Farrell, 2005; Padilla, 2008). E-mail contains interactions that are an important part of a company’s business processes. Kushmerick and Lau (2005) confirm that many e-mail messages are a manifestation of a user’s participation in a business process.
Most collaborative human work that is performed through e-mail is not managed as a business process. It is just adopted by all as the most efficient and effective way to collaborate, and to get the work done. The result is that interaction via e-mail occurs out of context with a company’s business processes. The corollary of this reality is that companies have insufficient insight in the business process associated with human e-mail communication.
A popular way to discover process models from already executed processes is process mining. Process mining is concerned with the quantitative analysis of event logs of Information Technology (IT) systems to obtain meaningful knowledge about business processes that are hidden or hard-coded in the information system (van der Aalst, van Dongen, Herbst, Maruster, Schimm, & Weijters, 2003). Recent work on process mining (van der Aalst & Nikolov, 2008) directly relates to and motivates the research presented in this chapter. The authors show how event logs are created from the widely used e-mail client Microsoft (MS) Outlook. Their approach focuses on the discovery of workflow processes from e-mail logs.
In a workflow process, the collection of tasks in the business process is formalized in an execution sequence (Wang & Wang, 2005). Thus, a workflow process definition specifies which tasks in the process need to be executed and in what order (van der Aalst, 1998). The process mining approach in (van der Aalst &

Chapter 4
112
Nikolov, 2008) links individual e-mails to pre-defined task names to derive the workflow. The task name is assumed to be included in the message subject, either through an explicit tag or through a partial subject match. Besides the work on process mining of e-mail logs, few attempts have been made to discover and represent email-driven business processes. There is a noticeable lack of research into methods and tools in this specific research field. Related works are mostly concerned with the creation of useful tools to help individual users manage their e-mail. These include tools that provide task-oriented user interfaces (Bellotti, Ducheneaut, Howard, & Smith, 2003; Dredze, Lau, & Kushmerick, 2006; Gwidzka, 2002; Whittaker, 2005), novel visualization techniques for e-mails and/or threads (Kerr, 2003; Popolov, Callaghan, & Luker, 2000; Rohall, et al., 2004; Venolia, Dabbish, Cadiz, & Gupta, 2001; Venolia & Neustaedter, 2003; Yates, Orlikowski, & Woerner, 2003), and automatic e-mail classification (Dredze, Lau, & Kushmerick, 2006; Dredze & Wallach, 2008; Khoussainov & Kushmerick, 2005; Kushmerick & Lau, 2005; Minkov, Balasubramanyan, & Cohen, 2008). These individual user tools are not concerned with email-driven business processes.
The main contribution of this chapter is a novel Email Interaction Mining (EIM) method to discover and represent email-driven business processes. The method perceives an email-driven business process as a human collaboration process (HCP) that consists of a process structure of related and intermittent e-mail interactions between human participants who may each play different roles. In the remainder, such a business process is referred to as an email-driven HCP. In the EIM method, the interactions in the email-driven HCP are constructed from message threads. A message thread is a set of e-mail messages, which are replies to each other (Palme, 1998). Together the messages are seen as a series of contributions that form an interaction. Thus, threads and their resulting interactions - as opposed to individual e-mails and their resulting tasks as in (van der Aalst & Nikolov, 2008) - are the fundamental building blocks of the discovered email-driven business process. This is based on the rationale that an e-mail is primarily about interaction with other persons. Several researchers (Lewis & Knowles, 1997; Popolov, Callaghan, & Luker, 2000; Rohall, et al., 2004; Whittaker & Sidner, 1996) agree that e-mail messages should be viewed as elements of a conversation rather than as independent elements. Based on the temporal order and similarity of the identified threads, the EIM method builds an interaction-centric process model in which interactions have routing and composition relations.

Discovery and analysis of email-driven collaboration processes
113
The key difference between a HCP and a workflow process is that interaction instead of task sequence determines the nature of the business activity (Harrison-Broninski, 2005). This distinction is similar to one of the key differences between web service orchestration and choreography. Whereas an orchestration organizes a set of structured tasks as an executable workflow process, a choreography is essentially a collaboration process in which interactions are the fundamental building blocks (Dijkman & Dumas, 2004; Erl, 2005; Pelz, 2003). The focus on threads allows the email-driven HCP to be discovered from a set of conventional e-mail messages that do not contain any explicit workflow information or tags in the subject lines.
Based on the above, the research objective of this chapter is to develop the EIM method, which can effectively discover and represent email-driven HCPs from a given set of e-mail messages where threads become interactions in the output model. The method should be a useful tool in the sense that it allows organizations to obtain desirable insights into the business activity related to the email-driven HCP under study. To achieve the research objective, this chapter demonstrates how the novel EIM method, which adopts the TALL modelling language (Stuit & Szirbik, 2007; Stuit & Szirbik, 2009) to visualize human interaction structures, realizes actionable insights in a real world email-driven HCP. These insights take the form of HCP improvement opportunities. Design science research is undertaken to (1) develop the EIM method and to (2) extend the formal semantics of the TALL Interaction Structure (IS) diagram that is used to visualize the interactions in the email-driven HCP under study. Design science research emphasizes problem solving through the construction of novel artefacts, and allows the effectiveness of these artefacts to be evaluated against practical utility using empirical methods (Hevner, March, Park, & Ram, 2004; Vaishnavi & Kuechler Jr., 2008; van Aken, 2004). The chosen empirical method to evaluate the EIM method is a case study of an email-driven HCP at a Dutch gas transport company.
This chapter is structured as follows. Section 4.2 presents the theoretical foundation that informs the design of the EIM method. Next, Section 4.3 uses an illustrative example to demonstrate the design of the method and the output model (i.e. IS diagram). Section 4.4 presents supporting software tools. Section 4.5 presents the case study. This section first introduces the Dutch gas transport company and then reports on the application of the EIM method to a set of e-mails collected from this company. After, Section 4.6 evaluates the method with regard to the business value of the output model. Section 4.7 presents related work.

Chapter 4
114
Section 4.8 provides a discussion and highlights future work. Finally, Section 4.9 gives conclusions.
4.2. Theoretical Foundation
4.2.1. Message threading
E-mail clients support different sorting orders to help people organize their e-mail messages. Typically, e-mail messages are sorted by date. Most e-mail clients offer the option to view a set of e-mail messages by conversation or thread. Threads are sets of messages, which are replies to each other that together form a conversation (Lewis & Knowles, 1997; Loshin, 1999; Palme, 1998). The messages within a thread are usually sorted by date, and are usually grouped together in parent-child relations based on who replied to whom. Messages can be direct or indirect replies to the initial e-mail message in a thread (i.e. the root e-mail). In this way, a thread often results in a tree structure (Resnick, Hansen, Riedl, Terveen, & Ackerman, 2005). Venolia and Neustaedter (2003) define a thread as the tree of messages that grows with the reply operation.
E-mail clients support threading differently. The simplest algorithm for threading e-mail messages is threading by subject. Using threading by subject, e-mail messages with the same subject line are grouped in the same thread. MS Outlook uses this criterion to group e-mails in threads. The use of only the subject line can lead to problems as popular subjects like “Hi” or “Report”, or other common subjects lead to threads of otherwise unrelated e-mails. Some e-mail clients offer the option to group messages by subject only if the messages start with the prefix “Re:”. The use of this option improves threading by subject. However, if people change the subject line of a reply message, this does not provide desirable results. In such a situation, users reply to an earlier message but actually introduce a new (related) topic. To deal with this issue, e-mail messages contain other header fields, besides the subject line, which can be used to recognize if an e-mail is a reply to another e-mail. Header fields are necessary for any standards-compliant e-mail message and contain information such as where the message came from, where it is going, when it was sent, and more (Loshin, 1999). A standard document, RFC 2822 (IETF, 2001), of the Internet Engineering Task Force defines several e-mail header fields, which are useful for recognizing threads:
Message-ID: contains a single globally unique message identifier, which is issued by the host (i.e. the system that runs the e-mail server) generating the message;

Discovery and analysis of email-driven collaboration processes
115
In-Reply-To: contains the message identifier of the message to which the current message is a reply (i.e. the parent message);
References: contains a list of the unique message identifiers of all the messages in the sequence, from the current message back to the root e-mail.
For instance, the algorithm used by the e-mail client Mozilla Thunderbird threads messages by subject first and secondarily by analysis of the “References” fields. The latter is called threading by reference. In summary, threading of e-mail messages groups messages together by message subject and/or reference headers.
4.2.2. The TALL modelling language
The development of the TALL modelling language (Stuit & Szirbik, 2007; Stuit & Szirbik, 2009; Stuit & Wortmann, 2010) is motivated by the need for new languages to model human interaction structures in HCPs. Human interactions gain importance now organizations are increasingly enmeshed in a network of business relationships with customers, suppliers, competitors, and other stakeholders. In these collaborative networks, humans are required to interact with colleagues both within and across organizational boundaries (Camarinha-Matos & Afsarmanesh, 2005; Moitra & Ganesh, 2005; Zacarias, Pinto, Magelhães, & Tribolet, 2009).
To properly model HCPs, TALL considers the interaction (performed by multiple actors) instead of the task (performed by a single actor) as the core process element. In the language, the set of interactions that forms a HCP is structured as an interaction tree in the IS diagram. Figure 4-1 shows an example. Interactions are represented by flattened hexagons, and are related to other interactions through composition (one interaction being part of another) and routing (one interaction must be completed before, in parallel with, or instead of another interaction). The routing relations supported in the IS diagram are sequential routing (SEQ), parallel routing (PAR), and exclusive choice (XOR). Child interactions are linked to their parent interaction by a routing symbol that indicates the process flow of sibling interactions (see Figure 4-1). In the IS diagram, a parent interaction completes if all its children complete according to the specified routing relation. Thus, by convention, completion or composition is read bottom-up while routing between sibling interactions is read from left to right. For the SEQ and PAR routing types, the sibling interactions are laid out linearly in the order of execution, with the first

Chapter 4
116
interaction on the left (time ordering21). The IS diagram can be compared to a web service choreography model in which the emphasis is on collaboration and where the completion of an interaction represents progress in the collaboration process (Dijkman & Dumas, 2004; Erl, 2005). In contrast, a workflow-based model can be compared to a web service orchestration model, which essentially depicts an executable workflow process with steps and activities that are connected through certain decision logic (Erl, 2005; Pelz, 2003).
Figure 4-1. Agent interaction modelling in TALL. The IS diagram is a tree with one root interaction and a hierarchical representation of parent and child interactions.
Roles, which are depicted as ellipses, are connected to the lines outgoing the hexagon (see Figure 4-1). In TALL, an interaction does not exist without at least two roles being bound to it (Stuit & Szirbik, 2007; Stuit, Szirbik, & Wortmann, 2007b; Stuit & Szirbik, 2009). A role is an independent object separate from the agent (i.e. process participant) that is assigned to play a specific role. In this regard, roles serve as placeholders for the agents and can be thought of as participant types rather than specific agents. The roles in an interaction also represent division of responsibility within the process. In the IS diagram, rounded rectangles represent agents (see Figure 4-1). Icons that appear in the top left corner of the agent symbol are used to distinguish between different agent types. Circle icons represent human agents (e.g. employees), square icons represent existing software agents (e.g. software applications or IT systems), and triangle icons represent synthetic agents (e.g. business entities like departments or teams). As shown in Figure 4-1, a given 21 An interval time scale is not being represented, rather, time is ordinal. Any sibling that is to the left of another sibling happens either earlier (SEQ or PAR) or at the same time (PAR) but there is no visual indication as to how large the time interval is.
Role 1 Role 2
SEQ
Role 1 Role 2
playsplays
Role 1 Role 3
playsplays
Interaction X-2Interaction X-1
Agent Y Agent X Agent ZAgent X
Interaction X
Agent Y
plays
Role 3

Discovery and analysis of email-driven collaboration processes
117
role may be played by multiple agents, and a specific agent may play several roles in a given process.
4.3. The Email Interaction Mining Method
4.3.1. Requirements analysis
The EIM method takes as input a set of e-mails, groups these e-mails into threads, and produces an IS diagram (from now on: the output model) in which interactions correspond to threads. However, an interaction in the IS diagram is more than a thread. It is a process element with roles and attributes, and it is part of an interaction structure with composition and routing relations to other interactions. This leads to several requirements to the EIM method. From the set of input e-mails, the method must be able:
1. to discover the routing relations between the identified interactions; 2. to discover the composition relations between the identified interactions; 3. to discover relevant interaction attributes (e.g. name, start time, end time,
participants); 4. to discover the roles involved in the identified interactions.
Based on these requirements, the remainder of Section 4.3 uses an illustrative example to demonstrate how the EIM method builds the output model based on the message threads identified from a set of example e-mails. The EIM method consists of five activities, which are described in the following sections 4.3.2 to 4.3.6. Design decisions and the visualization of the output model are discussed as part of these five activities.
4.3.2. Activity 1: Manual pre-processing
The input data for the EIM method is a set of e-mail messages related to a specific project or process in the business domain under consideration. This set of e-mail messages is to be collected from (or provided by) the participants in the project or process under study. To avoid duplicate messages, only received messages are to be collected. The advantage is that the participants can select the relevant messages themselves. In this way, personal messages, messages with nonsense content, and messages related to other processes or projects can be filtered out. Each set of collected messages is to be stored in a single mail folder to be accessed by the EIM method.
Table 4-1 shows the list of e-mail messages related to the illustrative example named Process X including relevant header information. Each message is described

Chapter 4
118
by the name of its sender (“From”), its recipients (“To” and “Cc”), its time of sending (“Date and Time”), its subject (“Subject Line”), and its preceding messages (“References”). Normally, the entities retrieved from the address header fields (i.e. the From, To, and Cc fields) are of type e-mail address (Loshin, 1999). In the illustrative example, first names are used in these fields (see Table 4-1). The IDs of the example emails are not message IDs generated by an e-mail host; they have been generated manually for explanation purposes. The parent message is the message to which a given message is a reply. In the References column, the parent message is the message ID that immediately precedes the current message ID. For example, inspection of the References column for message 7 reveals that its parent message is message 6.
Table 4-1. A set of e-mail messages related to an instance of Process X. Message ID
From To Cc Date and Time
Subject Line
References
1 Herman Marco, Gijs April 14, 9:31
A ‐
2 Marco Herman April 14, 9:48
Re: A <1, 2,>
3 Gijs Herman April 14, 11:15
Re: A <1, 3>
4
Hans
Nick, Peter, Frank
Jeroen, Bert
April 14, 10:37
B ‐
5 Nick Hans April 14, 14:43
Re: B <4, 5>
6 Peter Hans April 15, 9:07
Re: C <4, 6>
7 Frank Peter April 15, 10:51
Re: C <4, 6, 7>
8 Jeroen Hans April 15, 11:03
Re: C <4, 8>
9 Bob Simon April 17, 10:07
D
10 Simon Bob April 17, 12:04
Re: D <9, 10>
11 Gerard Karel, Gerben, Sonja, Thomas
April 17, 16:02
E
12 Sonja Gerard April 18, 16:31
Re: F <11, 12>
13 Thomas Sonja April 23,8:03
Re: F <11, 12, 13>
14 Gerben Gerard April 21, 12:11
Re: G <11, 12, 14>
15 Karel Gerard April 22, 15:02
Re: G <11, 12, 14, 15>
16 Gerard Karel April 22, 16:11
Re: G <11, 12, 14, 16>

Discovery and analysis of email-driven collaboration processes
119
4.3.3. Activity 2: Identification of interactions and their composition relations
Once data collection is completed, the identification of the interactions in the email-driven HCP under study is performed. Interactions are identified based on e-mail threads. In general, each simple thread becomes an interaction in the output model. The EIM method discovers simple threads using threading by subject. Thus, the messages within a simple thread all have the same subject line. Yates, Orlikowski, and Woerner (2003) define simple threads as temporarily bounded sequences of contributions on one topic. Table 4-2 shows the simple threads that are identified from the set of example messages in Table 4-1. There are seven distinct topics (A to G). Threads A and D are normal simple threads. However, simple threads B and C on the one hand and simple threads E, F, and G on the other hand are related to each other by reference. The reference or reply relations between these threads can be traced back in Table 4-1 using the References column:
Message 4 with subject B has replies with subject B (message 5) and subject C (messages 6, 7, and 8);
Message 11 with subject E has replies with subject F (messages 12 and 13) and subject G (messages 14, 15, and 16);
Together the messages in those simple threads that are related by reference form a compound thread. Thus, for instance, messages 11 to 16 together form a compound thread. Such simple threads within a compound thread arise out of divergence, when an initial thread (e.g. E) breaks into multiple threads (i.e. F and G) as participants realize that the issues require different conversational streams with related topics (Yates, Orlikowski, & Woerner, 2003). The EIM method uses threading by reference to discover reference relations between two or more simple threads within a compound thread.
For explanation purposes, the first simple thread within a compound thread is referred to as the root thread. All the subsequent simple threads within the compound thread are referred to as child threads. The parent thread of a child thread is the thread that contains the parent message of the root e-mail of the child thread. The root e-mail is defined as the message that starts a simple thread (e.g. message 1 for thread A and message 6 for thread C, see Table 4-1). A parent thread can be either the root thread or another (higher-level) child thread. In the example, thread B is a root thread with child thread C. Similarly, thread E is a root thread with child threads F and G where F also acts as a parent thread to G. Table 4-2

Chapter 4
120
shows, for each child thread, the name of the parent thread in the Parent thread column.
Table 4-2 shows several other thread attributes. The name of a thread corresponds to the subject line of the thread’s root e-mail. The start time of a thread equals the “Date” header field of the chronologically first message in the thread. The “Date” header field denotes the origination timestamp of an e-mail message, that is, the moment the sender authorized delivery of the message (Loshin, 1999). The end time of a thread equals the “Date” field of the chronologically last message in the thread.
Table 4-2. The simple threads that are identified from the example e-mails including several attributes. Thread Name (class) Initiator Start time End time Parent thread
1 A (normal) Herman April 14, 9:31 April 14, 11:15 ‐
2 B (root) Hans April 14, 10:37 April 14, 14:43 ‐
3 C (child) Peter April 15, 9:07 April 15, 11:03 B
4 D (normal) Bob April 17, 10:07 April 17: 12:04 ‐
5 E (root) Gerard April 17, 16:02 April 17, 16:02 ‐
6 F (child) Sonja April 18, 16:31 April 23, 8:03 E
7 G (child) Gerben April 21, 12:11 April 22, 16:11 F
Based on the above, the simple threads that become interactions in the output model are classified as normal threads (i.e. these are not part of compound threads), root threads, or child threads. The EIM method uses this thread classification to identify different classes of interactions in the output model. This is based on the following three design decisions:
1. normal threads become atomic interactions; 2. child threads become simple interactions; 3. root threads become either simple or complex interactions.
The third design decision depends on the following two scenarios. The reference relation between a root thread and its child thread(s) result(s) in specific composition relations between interactions in the output model. The EIM method uses the scenarios below to determine these composition relations.
Scenario 1 – The root thread contains a single e-mail message In the example, the root thread E consists of a single e-mail message (i.e. message 11 in Table 4-1). There are no replies with the subject line “Re: E”. The child threads F and G are related to each other and to root thread E by reference. In this
scenario, the root thread E is transformed into the complex interaction E that is completed by the simple (parallel) child interactions F and G. The left-hand

Discovery and analysis of email-driven collaboration processes
121
side of Figure 4-2 visualizes this scenario. This design decision reflects the fact that subject E immediately breaks down in subjects F and G. The parallel order of interactions F and G is derived from their timestamps. This is discussed in Section 4.3.4.
Figure 4-2. How simple and complex interactions are identified based on the two different scenarios for compound threads.
Scenario 2 – The root thread contains two or more e-mail messages In the example, the child thread C is related to the root thread B by reference. The difference with the first scenario is that the root e-mail of thread B (i.e. message 4 in Table 4-1) does have a reply with the subject line “Re: B”. Therefore, in this scenario the root thread B is transformed into the simple interaction B, which is a sibling of the simple interaction C. The right-hand side of Figure 4-2 visualizes this scenario. The EIM method introduces an artificial interaction to act as the parent of the (sequential) interactions B and C. The name of this artificial interaction is a string concatenation of the name of the root thread and the string “[Begin]”. In this way, the name of the artificial interaction reflects the fact that the subject line of the root e-mail of the root thread initiates the compound thread. Such an artificial interaction is referred to as interaction class complex begin. Figure 4-3 gives an overview of all the interaction classes that are identified based on the different classes of threads. The last two interaction classes (5 and 6) are introduced and discussed in Section 4.3.4.
As can be seen in Figure 4-2, the name of a (non-artificial) interaction is similar to the name of the corresponding thread. In this way, each interaction is concerned with a single topic, which is reflected by its interaction name. Based on the design decisions above, all simple threads (normal, root, or child) are transformed into specific interaction classes (atomic, simple, complex, complex begin) in the output model. Moreover, reference relations between simple threads are transformed into composition relations between complex and simple interactions (scenario 1), or between complex begin and simple interactions (scenario 2). In both cases, the

Chapter 4
122
complex or complex begin interaction consists of two or more simple interactions that are chained together as siblings, which pursue related topics.
Figure 4-3. From threads to different interaction classes.
Table 4-3 shows all identified interactions for the illustrative example, including their interaction attributes. Interactions 1 to 8 are directly derived from the threads in Table 4-2. Interactions 9 and 10 are special artificial interactions that are explained in the remainder of Section 4.3. This also applies to the interaction attributes.
Table 4-3. The list of identified atomic, simple and complex interactions, and their attributes. Name Class Time Duration
(days, hh:mm)
Participants Parent Number of children
Message size
1 A Atomic Start:April 14, 9:31 End: April 14, 11:15
0 days, 1:44
Active:Herman, Marco, Gijs Passive: Initiator: Herman
9 0 3
2 B [Begin]
Complex Begin
Start:April 14, 10:37 End: April 15, 11:03
1 days, 0:26
Active:Passive: Initiator:
9 2 ‐
Normal threads(threading by subject)
Compound threads
(threading by
reference)
Temporal analysis of threads
Process or project name
Root threads(threading by subject)
Child threads(threading by subject)
1. Atomic(non-artificial)
2. Complex(non-artificial)
4. Simple(non-artificial)
5. Complex Parallel (artificial)
6. Complex Root (artificial)
Threads Interaction Classes
3. Complex Begin (artificial)

Discovery and analysis of email-driven collaboration processes
123
3 B Simple Start:April 14, 10:37 End: April 14, 14:43
0 days, 4:06
Active:Hans, Nick, Peter, Frank Passive: Jeroen, Bert Initiator: Hans
2 0 2
4 C Simple Start:April 15, 9:07 End: April 15, 11:03
0 days, 1:56
Active:Peter, Hans, Frank, Jeroen Passive: Initiator: Peter
2 0 3
5 D Atomic Start:April 17, 10:07 End: April 17, 12:04
0 days, 1:57
Active:Bob, Simon Passive: Initiator: Bob
10 0 2
6 E Complex Start:April 17, 16:02 End: April 23, 8:03
5 days, 16:01
Active:Gerard, Karel, Gerben, Sonja, Thomas Passive: Initiator: Gerard
10 2 1
7 F Simple Start:April 18, 16:31 End: April 23, 8:03
4 days, 15:32
Active:Sonja, Gerard, Thomas Passive: Initiator: Sonja
6 0 2
8 G Simple Start:April 21, 12:11 End: April 22, 16:11
1 days, 4:00
Active:Gerben, Gerard, Karel Passive: Initiator: Gerben
6 0 3
9 [PAR] Complex Parallel
Start:April 14, 9:31 End: April 15, 10:51
1 days, 1:20
Active:Passive: Initiator:
10 2 ‐
10 Process X
Complex Root
Start:April 14, 9:31 End: April 23, 8:03
8 days, 22:32
Active:Passive: Initiator: ‐
‐ 3 ‐

Chapter 4
124
The start- and end times of an atomic or simple interaction match the start- and end times of the corresponding simple or child thread. The start time of a complex interaction, which is a non-artificial interaction (see Figure 4-3) matches the start time of the corresponding root thread. The end time of a complex interaction matches the end time of its chronologically last simple child interaction. For example, the start time of the complex interaction E equals the start time of the root thread E whereas its end time equals the end time of interaction F. For artificial interactions, a different design decision applies since they do not correspond to actual threads. The start time of an artificial interaction matches the start time of its chronologically first simple child interaction. The end time of an artificial interaction matches the end time of its chronologically last simple child interaction. For example, the start time of interaction B [Begin] equals the start time of interaction B whereas its end time equals the end time of interaction C.
4.3.4. Activity 3: Identification of routing relations between interactions
To produce the output model, the foremost challenge is to discover the routing relations between the interactions in the email-driven HCP under study. The EIM method uses the available temporal information to address this challenge. More specifically, the routing relations between interactions are derived from their start- and end times. Based on a temporal analysis of the interaction start- and end times, the EIM method identifies parallel and sequential interactions (see Figure 4-4). For parallel interactions, the end time of the first interaction is greater than or equal to the start time of the second interaction: etA stB. For sequential interactions, the start time of the second interaction is greater than the end time of the first interaction: stB > stA.

Discovery and analysis of email-driven collaboration processes
125
Figure 4-4. Identifying parallel (graph 1 and 2) and sequential (graph 3) interactions by taking into account the given timestamps.
stA
stB
etA
et B
Par
alle
lIn
tera
ctio
n B
Par
alle
lIn
tera
ctio
n A
stA
stB
etB
et A
Par
alle
lIn
tera
ctio
n B
Par
alle
lIn
tera
ctio
n A
stA
stB
et A
etB
Seq
uen
tial
Inte
ract
ion
B
Seq
uen
tial
Inte
ract
ion
A
12
3

Chapter 4
126
For the illustrative example, the temporal analysis results in the IS diagram in Figure 4-5. In general, the temporal analysis consists of two phases. A primary temporal analysis compares the timestamps of the entire set of complex, complex begin, and atomic interactions to identify their routing relations. The simple interactions are excluded from the primary analysis. Thus, in the example, the primary temporal analysis compares the timestamps of interactions A, B [Begin], D, and E. The start time of the complex begin interaction B [Begin] lies within the time span of interaction A (i.e. graph one in Figure 4-4). Thus, interactions A and B [Begin] are parallel interactions. Interactions D and E occur sequentially with respect to interaction A and B [Begin], and with respect to each other (i.e. graph three in Figure 4-4).
Figure 4-5. The IS diagram for the illustrative e-mail example with the identified routing relations based on a temporal analysis of interaction start- and end times.

Discovery and analysis of email-driven collaboration processes
127
An artificial interaction is introduced during the primary analysis to act as the parent of any set of parallel sibling interactions. In business process design and modelling, it is common practice to add artificial routing elements to a process model that manage (i.e. split and synchronize) parallel flows. The artificial interaction is necessary in order to manage the parallel execution of a certain number of sibling interactions. The name of such an interaction is formed by the string “[PAR]” and is referred to as interaction class complex parallel. Since a complex parallel interaction is an artificial interaction, its start- and end-times are set based on the logic discussed in Section 4.3.3 for artificial interactions. In Figure 4-5, interaction [PAR] is introduced to act as the parent of the parallel interactions A and B [Begin].
A secondary temporal analysis identifies the routing relations of each set of simple sibling interactions. In the example, the secondary temporal analysis compares the timestamps of interactions B and C on the one hand, and interactions F and G on the other hand. Graph three in Figure 4-4 corresponds to the former whereas graph two corresponds to the latter.
After the temporal analyses, the EIM method introduces an artificial interaction to act as the root of the output model (see Figure 4-5). This interaction is referred to as interaction class complex root. In the illustrative example, the name of this root interaction is Process X. The start- and end times of Process X are listed in Table 4-3. Note that, in the output model all sibling interactions are chronologically ordered from left to right based on their start times.
The routing structure in Figure 4-5 is relatively simple because of the small number of e-mail messages and threads, and the resulting small number of interactions. In real world e-mail, the routing structure is more complex because the set of discovered interactions is larger for the (primary and secondary) temporal analysis. In larger interaction sets, subsets or chains of parallel and sequential interactions can be identified. Moreover, nested parallel structures can occur within a chain of parallel interactions. The top part of Figure 4-6 shows seven interactions that generate a more complex routing structure. This graph shows two main parallel chains that are positioned sequentially to each other: interactions 1 to 5 and interactions 6 to 7. The first parallel chain consists of one nested parallel chain that starts with interaction 3. Assuming that all seven interactions are atomic interactions and thus all input for the primary temporal analysis, this would result in the output model in the bottom part of Figure 4-6. As the figure shows, the EIM

Chapter 4
128
method introduces an additional complex parallel interaction to handle the nested parallel structure of interactions 3 to 5.
Figure 4-6. Example of the identification of routing relations for seven atomic interactions.
4.3.5. Activity 4: Identification of actors and roles
Several participants are involved in an interaction. In general, interaction participants are formed by the senders and recipients of the e-mail messages in the corresponding thread. For each interaction, the EIM method differentiates between active and passive participants. Active participants comprise the senders and

Discovery and analysis of email-driven collaboration processes
129
recipients listed in the “From” and “To” fields of all the messages in the corresponding thread. Similarly, passive participants comprise the recipients listed in the “Cc” fields of all the messages in the corresponding thread. As indicated before in Section 4.3.2, the entities retrieved from these address header fields are of type e-mail address (Loshin, 1999). Based on the work in (Dredze, Lau, & Kushmerick, 2006), the persons (i.e. distinct e-mail addresses) involved in a given thread T are identified in the following way. For an e-mail message M, Pa(M) denotes the set of active participants of M, and Pp(M) denotes the set of passive participants of M. Next, Pa(M) and Pp(M) are generalized from a message to the thread T by defining:
Pa(T) = M T Pa(M) (1)
Pp(T) = M T Pp(M) (2)
The first formula produces the union of the active participants in all the messages in the thread T. Similarly, the second formula produces the union of the passive participants in all the messages in the thread T. In the case that a person appears in both “To” fields and “Cc” fields in the thread T, the design decision is that the person is considered an active participant only. In other words, a participant is only passive when it is not active. A third formula defines this constraint.
Pa(T)Pp(T) = (3)
This formula requires the intersection of Pa(T) and Pp(T) to be empty, which ensures that someone cannot be an active and passive participant at the same time. Using the three above formulas, the interaction participants can be identified for the non-artificial interactions (i.e. atomic, simple, and complex) since these are created directly from simple threads. For instance, based on the address header fields of the e-mail messages in Table 4-1, the active participants in interaction A are Herman, Marco, and Gijs. In interaction B, the active participants are Hans, Nick, Peter, and Frank. Interaction B also has two passive participants (Jeroen and Bert).
In the output model, roles tell us which generic participants are involved in an interaction. After the EIM method identifies the participants for each interaction, it assigns the unique roles of the active participants to the interactions. The roles of the active participants are expected to contribute to the interaction, that is, they comprise resources in the email-driven HCP under study. Therefore, each active participant is represented by its role name, which corresponds to its job title. In

Chapter 4
130
contrast, passive participants are assumed to be only informed, that is, a reply or action is not expected. When two or more active participants in an interaction have the same job title then they are represented by the same role. Section 4.8.3 discusses in more detail the rationale behind the design decisions related to roles and participants.
Role names or job titles cannot be discovered from e-mail header fields. Therefore, they are collected from external sources. In practice, job titles are typically available from company repositories like employee websites or databases, or an enterprise Human Resource Management system. The EIM software tool (see Section 4.4), which implements the EIM method, allows an external database with role information to be imported. The software tool then uses the unique e-mail addresses, which are extracted from the address header fields of the input e-mails, to match persons to their role names. Table 4-4 shows the role names for the interaction participants in the illustrative example.
Table 4-4. The role names or job titles of the interaction participants in the example Process X. Person Role
Herman Role 1
Marco Role 2
Gijs, Hans, Nick Role 3
Peter Role 4
Frank Role 5
Bob Role 6
Simon, Gerard Role 7
Sonja Role 8
Thomas Role 9
Gerben, Jeroen Role 10
Karel Role 11
Bert Role 12
The EIM method cannot identify participants and roles for artificial interactions (i.e. complex begin, complex parallel, and complex root) since these do not correspond to actual threads. However, since completion is a bottom-up process in the IS diagram, all parent interactions collect the unique roles of their child interactions. Figure 4-7 shows the IS diagram for the illustrative example including all the roles.

Discovery and analysis of email-driven collaboration processes
131
Figure 4-7. The IS diagram (read: output model) for the illustrative example in which all roles are connected to the interactions.

Chapter 4
132
An initiator person, who is the sender of the root e-mail, starts each simple thread. The EIM method uses this information to identify an initiator role for each non-artificial interaction (i.e. atomic, simple, and complex). In the IS diagram, initiator roles can be recognized by the role-interaction connectors with a filled arrowhead at their tail (see Figure 4-7). For artificial interactions, the initiator role is set to correspond to the initiator role of the chronologically first direct child interaction. In Figure 4-7, this applies to interactions Process X, [PAR], and B [Begin]. Note that, the (non-artificial) complex interaction E has its own initiator role (i.e. role 7). An initiator role can only be played by a single active participant. Thus, when two or more active participants play the same role in an interaction and one of those participants is the initiator then that role name appears twice. In the illustrative example, Hans and Nick are active participants in interaction B and both play role 3. Hans is the initiator. Therefore, role 3 is connected twice to interaction B: once as an initiator role and once as a normal role.
It is important to note that, in the e-mail interactions discussed in this chapter, not all interaction participants may directly interact with each other. This happens for instance when everybody sends a reply to the initiator person but not to each other. Furthermore, the design decisions above imply that non-respondents also become active participants in an interaction. Non-respondents are recipients that appear in “To” header fields but have not sent a reply in a given thread. Although these recipients may not be actively engaged in a thread as a contributor or author, the EIM method considers that all senders and recipients are in some way involved in the corresponding interaction. Therefore, the roles of such participants are to be connected to the corresponding interaction. For example, inspection of Table 4-1 reveals that Peter and Frank are non-respondents in the root thread B. In addition, they are contributors in the child thread C. In this case, the EIM method connects the roles of Peter and Frank to both interaction B and C. This makes sense since they are involved in both interactions: as contributors in topic C and active recipients in topic B.
4.3.6. Activity 5: Post-processing
The post-processing activity is optional. The set of input e-mail messages, which was collected in the pre-processing activity (see Section 4.3.2), can be incomplete. Reasons can include sloppy archiving, sloppy filtering, limited storage space for inbox folders, accidental deletion of messages, purposeful deletion or withholding of specific messages, etc. E-mail message bodies usually contain references to previous discussions and messages in the form of embedded passages and/or e-

Discovery and analysis of email-driven collaboration processes
133
mails. The post-processing activity is concerned with close reading of e-mail message bodies to22:
1. discover missing root or interim messages in identified threads; 2. discover reference relations between threads (i.e. missing messages can
fracture a chain of reference ID’s); 3. discover new embedded threads.
These discovery tasks can lead to modification of certain interaction attributes. This is discussed in more detail in Section 4.5.3 where the post-processing activity is described for the case study.
The output model aims to create improved insight into the interaction structure of an email-driven HCP. The model should enable organizations to analyse, improve, and/or manage better the email-driven HCP under study. In this regard, the graphical representation of the output model should convey organizational meaning to its users (i.e. business analysts or any other stakeholders) and allow for easy interpretation. In general, the names of the interactions in the output model are derived from the names of the corresponding threads, which in turn are based on the subject lines of their root e-mails. These subject lines were created for the message recipient’s understanding, which may imply that the meaning of this text may not be very clear and/or understandable for a wider (business) audience. Recent work on semantic quality aspects of process models (Mendling, Reijers, & Recker, 2010) stresses the importance of the intuitiveness and understandability of “activity” labels. As part of the post-processing activity, the interaction names can be modified manually. In this way, their meaning, added value and contribution in the output model, and the business domain is clearer. The close reading of e-mail messages can assist the user in the modification of interaction names. Moreover, one or more (key) employees from the organization under consideration may be consulted. Furthermore, as part of the post-processing activity, prefixes (e.g. “Re:” or “Fw:”) can be removed and typos can be corrected in the interaction names.
4.4. Tool Support
The EIM method is implemented in a supporting software tool named Email Interaction Miner (the EIM software tool). The software tool executes the interaction-centric analysis of a (pre-processed) set of e-mail messages and provides automated assistance to create the output model. The implementation of
22 Close reading is beneficial only when preceding messages are included in reply messages. Most e-mail clients are or can be configured to do this.

Chapter 4
134
the EIM method in the software tool demonstrates the feasibility of the method and its design decisions (Hevner, March, Park, & Ram, 2004).
The EIM software tool works with MS Outlook23 and takes as input a set of e-mail messages from a specific mail folder that is selected by the user. MS Outlook has been selected not only because it is the standard e-mail client used within the case study company but also because it is the top e-mail client used by business recipients. The EIM software tool has been written using Visual Basic.NET, which interacts best with the MS Windows (application) API. The software tool connects to the selected MS Outlook folder and stores all e-mail messages in a list. Next, the software tool loops through this list, and groups messages into threads based on their subject lines and reference IDs. Figure 4-8 shows the main user interface screen of the EIM software tool. The information on the screen is based on a set of test e-mails. As the screenshot shows, the user has the option to (de)select either threading by subject or threading by reference. Clearly, this affects strongly the thread and interaction identification, and thus the (structure of the) output model.
After the threads are identified, the EIM software tool creates the different interaction classes including their routing and composition relations, their roles, and their attributes. The software tool normalizes all interaction names. This process is similar to the subject normalization discussed by Yeh and Harnley (2006), which removes common prefixes from e-mail subject lines like “Re:”, “Fw:” etc. The user has the option to specify other less common (i.e. client- or language-specific) prefixes for removal (see the top right part of Figure 4-8). The EIM software tool displays all discovered interactions in a tree view list in the bottom text area (see Figure 4-8). The name of the root interaction (i.e. the name of the email-driven HCP under study) is specified in advance by the user. The user can navigate the tree view list and can inspect interaction attributes by selecting a specific interaction. Moreover, the user has the option to perform the post-processing activity to change, add, and/or delete interactions directly in the EIM software tool. Here, change of interactions means modification of interaction attributes. The user executes the post-processing activity before the EIM software tool identifies the routing relations between the identified interactions since adding, deleting, or changing (e.g. start times, end times, routing types) interactions influences the routing structure in the output model.
23 Email Interaction Miner requires the CDO (Collaboration Data Objects) package to be installed for Outlook. A document with installation instructions is available from the software section on http://www.agentlab.nl/.

Discovery and analysis of email-driven collaboration processes
135
Figure 4-8. The user interface of the E-mail Interaction Miner software tool.
After the EIM software tool identifies the routing relations, the tool displays a list of the unique active interaction participants. The user can then specify a role name for each participant manually, or can load an external file with e-mail addresses or person names and their corresponding role names. Finally, the user can export the entire interaction structure including all roles and attributes to a specific database format that is recognized by the TALL Visual Editor. In general, this editor can be used to build and manipulate TALL diagrams. In this chapter, the TALL Visual Editor is used to visualize the output model produced by the EIM software tool. During the database export, the EIM software tool loops through the interaction structure and fills the database with the correct diagram (IS), diagram symbols (interactions, roles, and their connectors), and symbol attributes. The latter includes basic layout and proper positioning. All software tools are freely available from the software section on http://www.agentlab.nl/.

Chapter 4
136
4.5. Case Study
4.5.1. Case description
Gasunie Transport Services Inc. (GTS) is the operator of the national gas transmission grid in the Netherlands. GTS is a wholly owned subsidiary of N.V. Nederlandse Gasunie, the owner of the pipeline network, but performs its activities independently as required by law. GTS's mission is the provision and implementation of gas transmission services for the benefit of a properly functioning liberalised gas market. GTS not only transports gas for customers but also provides additional services relating to storage, flexibility, grid balancing, quality conversion, and information.
GTS, its customers, and its partners operate in an increasingly dynamic gas market. Developments in electronic communication and service provisioning are in a rapid growth phase. To support process integration and electronic information-exchange with partners and (external and internal) customers, GTS decided to implement a service bus. The service bus is a hardware and software infrastructure that enables disparate business applications to expose their functionalities as web services. Moreover, it enables these applications to communicate via the bus (i.e. message engine) using an (international) standardized message format without changing the applications itself. To realize the service bus, GTS initiated the Service Bus project. At GTS, the entire IT infrastructure is managed and hosted by an external company (from now on: Company X24). If new IT services or products are required, GTS submits a Request for Change (RfC) to Company X. The scope of the Service Bus project is the infrastructural process within GTS, and between GTS and Company X.
In November 2008, when GTS was approached for the current research project, the Service Bus project was already delayed because of coordination issues between GTS and Company X, as indicated by GTS managers. Since the project depended heavily on e-mail communication, GTS was interested to apply the EIM method to expose the collaboration problems within the project and to identify improvement options for future infrastructural projects. This was the identified business need. From a scientific viewpoint, framing (design) research activities to address business needs assures research relevance (Hevner, March, Park, & Ram, 2004).
24 Any company names other than GTS have been disguised for confidentiality reasons.

Discovery and analysis of email-driven collaboration processes
137
4.5.2. Data collection
The Service Bus project started in February 2008 and ended in May 2009. At GTS, a full-time team was formed to execute the project. This team consisted of eight technical employees and four business managers. One of these business managers served as a key informant (Marshall, 1996) throughout the entire research project. In November 2008, the twelve employees were asked to provide all e-mails related to the Service Bus project. Although the project started nine months earlier, all employees stored the e-mails related to this project. In May 2009, when the Service Bus project ended with the release of the service bus infrastructure by Company X, the twelve employees were asked to provide a second set of e-mails.
Most e-mail exchange concerning the Service Bus project involved at least one of the twelve key employees, leaving only a small part of exchanges exclusively between other GTS employees. When this did occur, it did not concern the specific scope mentioned at the end of Section 4.5.1. This was also confirmed by the key informant. No e-mails were collected from the members of Company X. Since most of the e-mails involved at least one of the twelve key employees, only the intra-organizational exchanges that occurred between the employees of Company X were missing. For GTS, the collected e-mails provide a useful trace of the email-driven HCP related to the Service Bus project. In the end, the following data was collected: e-mails concerning the Service Bus project over a period of fifteen months, containing the e-mail inboxes of twelve employees, with a volume of 666 e-mails. All the e-mails were saved in a MS Outlook folder on the researcher’s computer.
4.5.3. Application of the EIM method
The volume of 666 e-mails was manually filtered in the pre-processing activity (see Section 4.3.2). Duplicate e-mails, e-mails not concerning the infrastructural process, and other irrelevant e-mails were deleted. When necessary, the key informant was consulted during this process. A volume of 516 e-mails remained as input for the EIM software tool. From this e-mail archive, the software tool discovers 148 interactions based on 135 identified threads. The discovered interactions consist of 93 atomic interactions, 1 complex interaction, 16 simple interactions, and 38 artificial interactions. The artificial interactions consist of 7 complex begin interactions, 30 complex parallel interactions, and the complex root interaction. Moreover, the EIM software tool discovers 40 unique person names or e-mail addresses from the e-mail archive. The formal role names of these

Chapter 4
138
employees were collected from the GTS intranet and loaded in the software tool. The key informant provided the formal role names of the employees of Company X. To be able to distinguish between the roles of different companies in the output model, the roles were edited in the EIM software tool to include company suffixes.
Based on the application of the EIM method to the GTS e-mails, two newly learned design decisions were made. First, the GTS e-mail archive contains a number of e-mails with empty subject lines. In situations, where the root e-mail of a thread has an empty subject line, the design decision is to fill the name of the corresponding interaction with the string “(no subject)”. The second design decision is concerned with single e-mails. Single e-mails are stand-alone messages with the prefixes “Re:” or “FW:”. These messages are thread-messages but the root e-mail and possibly some interim messages are missing. The design decision is to consider such e-mail messages as (size-one) threads.
In the case study, the post-processing activity (see Section 4.3.6) was performed to identify embedded e-mails and to modify interaction names. Close reading of the e-mail messages in MS Outlook revealed multiple embedded e-mails. In all cases, these messages were interim messages in existing threads. Specific attention was given to those interactions that contained a single message. This applied to 32 interactions. These interactions result from size-one threads. The post-processing activity required modification of several interaction attributes (i.e. Number of messages, Participants, Initiator, Start time). For around half of the interactions, the interaction names were modified based on the message content. Any typos were also corrected as part of the post-processing. In cases where the technical or business-specific content made it difficult to modify the interaction name, the key informant was consulted. Face validation of the output model with the key informant confirmed that the majority of relevant interactions in the Service Bus project were captured. Face validation uses expert opinion to review if a model accurately reflects reality and meets user expectations (Illgen & Gledhill, 2001; Pace, 2004; Sargent, 2007).
4.6. Method Evaluation: Model Impact & Utility
4.6.1. Preliminaries
The purpose of applying the proposed EIM method is to produce an IS diagram. This IS diagram makes the email-driven HCP under study amenable to analysis so that HCP improvement opportunities can be identified. Therefore, this section uses the GTS case study to evaluate the EIM method with regard to its effectiveness in

Discovery and analysis of email-driven collaboration processes
139
realizing business value. More specifically, this section demonstrates the impact and utility of the output model in reality through a discussion of HCP improvement opportunities obtained from a process analysis of the output model.
In general, the management of GTS wants to reduce the throughput time of their projects and processes, and wants to commit its resources effectively. This is especially important for company(-wide) IT infrastructures like the service bus on which other IT applications and business processes depend for their operation. Figure 4-9 depicts the generic high-level procedural infrastructural process as it occurs between GTS and Company X for each new infrastructural project. Company X is responsible for the ordering and implementation of the needed hard- and software. Implementation covers both installation and configuration.
Figure 4-9. From demand to delivery of application hosting services. Source: GTS.

Chapter 4
140
Figure 4-9 provides insufficient insight in the actual interactions taking place. The output model provides insight into the actual (e-mail) interactions, and therefore provides a good base for HCP analysis and improvement. Figure 4-10 shows a fragment of the output model for the email-driven HCP studied at GTS25.
A manipulated version of the complete output model is included in the distribution of the TALL Visual Editor. The process analysis of the output model is a qualitative analysis (i.e. visual inspection) of the interaction structure, and the interaction roles and attributes. To support the analysis, occasional content analysis of e-mail messages and consultations with the key informant were performed. The analysis focuses on several phases in the email-driven HCP under study (i.e. the infrastructural process) with a relatively high number of interactions. The results provide GTS with actionable insights that can initiate improvements in the interaction structure and resource planning of future infrastructural projects. The following sections 4.6.2 to 4.6.6 present the results of the process analysis in terms of a discussion of bottlenecks, problems, and their causes along with suggestions for improvement26.
25 In this specific fragment, the interaction and role names have been translated from Dutch to English. Moreover, any company names other than GTS have been disguised in the interaction and role labels. Finally, for clarity reasons, the roles have not been collected bottom-up by parent interactions. 26 The scope of the work for GTS is an analysis of the current situation and the communication of several improvement opportunities. The initiative to perform an actual redesign of the infrastructural process lies with GTS.

Discovery and analysis of email-driven collaboration processes
141
Figure 4-10. A fragment of the GTS output model.

Chapter 4
142
4.6.2. Architectural design of the Service Bus infrastructure
Analysis of the output model revealed 41 interactions that are concerned with the architectural design of the service bus infrastructure, which covers steps a to d in Figure 4-9. Moreover, inspection of the roles connected to these interactions revealed most of these interactions to be inter-organizational. Note that, the suffixes GTS, X, Y, and Z were added to the role names to be able to distinguish between the roles of different companies in the output model. Companies Y and Z are introduced below. Based on the relatively high number of interactions and involved organizations, specific attention was given to this part of the infrastructural process through detailed analysis of the interaction structure and consultations with the key informant.
In the current interaction structure, GTS develops the initial Technical Design (TD), which contains the preliminary architectural design (step b in Figure 4-9). The initial TD is then sent to Company X for approval. Next, Company X finalizes the TD (step c in Figure 4-9) and creates a Bill of Materials (BOM, step d in Figure 4-9), which specifies the needed hard- and software for the new IT infrastructure. Analysis of the interaction structure for the architectural design phase exposes the following HCP.
The software that is installed and configured by Company X is supplied by Company Y. GTS submitted the initial TD for certification to this software supplier and to Company Z, their IT architecture consultant. Overall, four companies were involved in the architectural design phase. Detailed analysis of the interactions and roles involved in the architectural design phase identified the following problems:
In the current interaction structure, Company X creates the final TD based on the input of GTS, Company Y, and Company Z. Company X made fundamental changes to the certified architectural design of Company Y. This led to discontent at GTS. Additional coordination and interaction was required to come to an agreement and shared solution. This caused a significant delay;
In the current interaction structure, GTS creates the initial TD with the support of Company Y and Z. In the Service Bus project, this made certain (technical) parts of the initial TD hard to understand for the technical employees of Company X, who had to develop the final TD. Additional interaction between the technical employees of GTS and Company Y on the one hand, and between the technical employees of GTS and Company X on the other hand was required.

Discovery and analysis of email-driven collaboration processes
143
In the current interaction structure, GTS is responsible for the creation of the initial TD. Based on the above problems, GTS realized that it is more efficient that Company X creates the initial TD since that company anyway manages most of the IT matters for GTS. The following redesign of the architectural interactions is suggested:
1. GTS initiates and justifies the infrastructural project and the architectural implications internally;
2. GTS formulates the functional requirements for Company X, possibly in cooperation with Company Y and Company Z;
3. GTS sends the requirements to Company X in the form of a RfC; 4. Company X offers GTS a quotation; 5. If GTS accepts, Company X creates an initial TD; 6. The initial TD is reviewed and approved by GTS with the option to initiate
a review or certification process with Company Y and/or Z. The risk that Company X makes changes to a certified TD has been taken away. Moreover, Company X now performs the core technical activities while the initiative for acceptance lies with GTS. This division of work leverages better the expertise of both companies, and allows for more effective and efficient commitment of resources.
4.6.3. Disk capacity management
Company X orders the required hardware based on the BOM (step e in Figure 4-9). When the hardware arrives, Company X sets up the datacentre environment (steps f, g, and h in Figure 4-9). Detailed analysis of the output model, in cooperation with the key informant, revealed 24 interactions that are concerned with (disk) hardware capacity management. These interactions centred on the issue that insufficient hardware was ordered for the service bus software. Based on the analysis, the management of GTS realized that a pro-active capacity management process between GTS and Company X is desirable in all future infrastructural projects so that sufficient disk capacity is available in due time. The following redesign of the hardware acquisition interactions is suggested. A pro-active capacity management process should keep track of all running and future applications and projects, and their required disk capacity. Moreover, such a process should reserve disk space for organic growth of IT applications.

Chapter 4
144
4.6.4. Installation communication manual
The technical employees of GTS write an Installation Communication Manual (ICM) for the development- and test environment (step i in Figure 4-9), and the acceptance- and production environment (step m in Figure 4-9). Both ICM’s are reviewed and approved by Company X. The engineers of Company X use the second ICM to install and configure the required software after the hardware has been set up. Analysis of the output model, in cooperation with the key informant, revealed that on several occasions during the software installation and configuration process, the engineers of Company X deviated from the second ICM since it was not accurate and complete. This required several interactions between Company X and GTS to coordinate the modification and correction of the ICM by the employees of GTS. Based on this finding, the following redesign is suggested. Section 4.6.2 suggests that Company X should perform the core technical activities. In line with this suggestion, it is more efficient that the engineers of Company X write the ICM since they also execute the software installation and configuration. The role of the GTS employees can be limited to providing the configuration parameters for the installation and configuration process.
4.6.5. Communication and escalation
In the output model, 25 interactions are concerned with one of the following subjects: project communication, project delay, project progress, project status, or project escalation. Communication between GTS and Company X in the infrastructural process occurs on both the technical and management level. Detailed analysis of these interactions and consultation with the key informant revealed that formal lines of communication, although defined in company procedures, were not followed at the technical level. This caused many uncoordinated efforts (read: interactions). The cause can be found in the many lines of communication to and from Company X. The management of GTS realized that horizontal lines of communication need to be enforced on the inter-organizational level: from engineer to engineer, from project leader to project leader etc. This keeps communication short and streamlined. Moreover, structural communication between the project leaders ensures that the project status is known at any time at a central location in both companies.
The output model shows that several escalations where initiated at the technical level. When an escalation occurs, a business manager is notified who then contacts its counterpart at Company X to resolve the issue. On the management level, lines

Discovery and analysis of email-driven collaboration processes
145
of communication are well defined. However, adherence to the formal lines of communication at the technical level can decrease the number of escalations and therefore improve the efficiency of the infrastructural process.
Consultation with the key informant disclosed that Company X blames the delays in the Service Bus project on their late involvement. Due to this, it was not possible to reserve and assign sufficient resources to the project in a timely fashion. In the interaction structure suggested in Section 4.6.2, Company X is involved more actively from the start.
4.6.6. Managerial implications
In summary, the following actionable insights are derived from the process analysis of the GTS output model:
1. A larger and more responsible role for Company X in the design of the initial TD leads to a more efficient and effective collaboration process;
2. A pro-active disk capacity management process makes an infrastructural project less dependent on the hardware ordering process, which benefits the throughput time of the process and makes sure that the required disk capacity is reserved in a timely fashion;
3. Early involvement of Company X not only informs the disk capacity management process but also allows for timely resource assignment;
4. Based on the first item, the expertise and formal approval of Company Y and Z should be enlisted to review the architectural design of Company X instead of the other way around;
5. As an extension of the first item, Company X should lead the creation of the ICM since their engineers perform software installation and configuration;
6. Definition and enforcement of horizontal communication lines and formal project formats decreases the number of escalations, and ensures project visibility.
These actionable insights can initiate structural improvements in future infrastructural processes leading to more efficient and streamlined projects. Besides these specific insights, GTS obtained the following valuable information from the application of the EIM method:
A coherent view of all interactions and their relations in the email-driven HCP;
The active and passive participants involved in each interaction;

Chapter 4
146
The roles involved in each interaction;
The initiator person and initiator role for each interaction;
The duration and message size for each interaction.
4.7. Related Work: Towards Managing E-mail
As motivated in Section 4.1, e-mail communication is one of the primary methods for business collaboration, and many organizations are starting to recognize e-mail as an important part of their business activity. Employees spend so much time managing their e-mail that e-mail overload is becoming a problem (Bellotti, Ducheneaut, Howard, Smith, & Grinter, 2005; Duchenaut & Bellotti, 2001; Whittaker & Sidner, 1996). Since organizations want to manage their human resources and business processes for efficiency, it is not surprising that tools and solutions are being developed that help employees manage their e-mail. Several research works are concerned with e-mail task- and activity management for work coordination. These works can be categorized in three groups: (1) task-centric user interfaces, (2) visualization techniques for e-mail structure, and (3) technical approaches for e-mail classification.
The first group, task-centric user interfaces, provides alternative user interfaces to view and organize e-mails and related content (e.g. attachments, links, documents, presentations etc.) as task or activity lists (Bellotti, Ducheneaut, Howard, & Smith, 2003; Dredze, Lau, & Kushmerick, 2006; Gwidzka, 2002; Whittaker, 2005). In this way, all relevant media is at hand when a user is working on an (ongoing or pending) task or activity. The second group, visualization techniques for e-mail structure, is mostly concerned with novel user interfaces for message threads in e-mail clients (Kerr, 2003; Popolov, Callaghan, & Luker, 2000; Rohall, et al., 2004; Venolia & Neustaedter, 2003), and how threading activity is used to structure ongoing collaborative work over time and space (Venolia, Dabbish, Cadiz, & Gupta, 2001; Yates, Orlikowski, & Woerner, 2003). This second group overlaps with the first group since several of the task-centric user interface approaches use a correspondence between threads and tasks as the starting point for better e-mail management. Thread visualizations are similar to the TALL IS diagram because of their tree layout. However, the former are concerned with the visual layout of individual messages and their relations for a single user whereas the latter is concerned with the visual layout of a HCP’s interaction structure for an organization. The third group, technical approaches for e-mail classification, facilitates e-mail management through automated (machine learning)

Discovery and analysis of email-driven collaboration processes
147
algorithms for linking e-mails and tasks/activities (Dredze, Lau, & Kushmerick, 2006; Dredze & Wallach, 2008; Khoussainov & Kushmerick, 2005; Kushmerick & Lau, 2005; Minkov, Balasubramanyan, & Cohen, 2008).
Overall, threads stand central in literature on organizing and visualizing e-mail. Threads are also the fundamental building blocks of the EIM method. Some related works (Dredze, Lau, & Kushmerick, 2006; Khoussainov & Kushmerick, 2005; Kushmerick & Lau, 2005) produce process models, which allow the user to track activity progress as new e-mail messages arrive using an interface. The EIM method does not work with ongoing processes; it is only concerned with already executed processes that are discovered from a historical e-mail archive. Future work may investigate the challenge of making a graphical distinction between completed and in-progress interactions in the IS diagram based on the e-mail messages that are still to be received from certain recipients.
In general, all of the related works discussed above have the goal to help individual users manage their e-mail more effectively. Thus, they are personal e-mail management tools instead of (company-wide) business process management tools. The key innovation of the EIM method is the focus on business process discovery and analysis. Personal e-mail management tools can complement the EIM method by (automatically) classifying, filtering, or sorting the messages for the user in the pre-processing activity.
An exception to the above is the related work mentioned in Section 4.1 on process mining of e-mail logs (van der Aalst & Nikolov, 2008). This work translates e-mail logs into event logs in which each e-mail message corresponds to a single task event in a workflow process. This approach assumes that the task name is included in the message subject line either through an explicit (i.e. a standard format) or implicit (i.e. a partial subject match) tag. Moreover, a generic task model is required as input to the approach. This model provides the keywords to which the e-mail tags can be linked and provides information about the routing structure between the discovered task events.
The EIM method differs from the process mining approach in three important respects. First and most importantly, the EIM method is based on a different design principle. The focus is not on the structure of tasks (i.e. individual e-mails) in a workflow process but on the structure of interactions (i.e. threads) in a HCP. This is based on the rationale that e-mail communication is primarily about interaction work (i.e. collaboration) instead of task sequence. Second, the EIM method does not assume that meaningful labels (i.e. workflow information) are present in the

Chapter 4
148
subject lines of the input e-mail messages. Such labels are not present in conventional e-mails. Thus, the EIM method can discover a business process from an e-mail archive in which the subject lines of the input e-mails are totally unrelated to a particular process or task name. Such e-mails are prominent in real world e-mail traffic. Third, the EIM method does not require an (external) input model that provides information about the routing relations between the process elements. Instead, it discovers this information from the header fields of the input e-mail messages.
4.8. Discussion
4.8.1. Contribution and generalization
The theoretical challenge of this chapter was to develop a novel method to transform a set of related e-mails in a HCP, and to visualize this HCP with the TALL IS diagram. From a theory point of view, this chapter shows that it is possible to mine a specific set of company e-mail messages for interactions and to reverse-engineer a HCP’s interaction structure (i.e. interactions, their relations, their roles, and their attributes). In this regard, the empirical application and evaluation using real world e-mail data demonstrates the effectiveness and utility of the EIM method to discover and represent email-driven HCPs. Based on this, the developed EIM method meets the requirements set out in Section 4.3.1.
The practical contribution of this chapter is the business value realized in the GTS case study in the form of improvement opportunities for the infrastructural process. The main theoretical contribution of this chapter is the EIM method and the supporting software tool. Without the EIM method, it is hard or even impossible to identify HCP improvement opportunities since e-mail communication is distributed over multiple mailboxes (read: process participants), and provides no process context. The main innovation of the EIM method is that it makes explicit, in a formal process model, the HCP that occurs via e-mail. This enables analysis and improvement of the email-driven HCP. The EIM method is formalized as a set of activities and steps that produces the output model. This formalisation is listed in Appendix A and describes the logic of the method in pseudo-code, which is implemented in the EIM software tool.
In this chapter, data from a single case study achieved the research objective. However, the set of collected company e-mails is representative of conventional day-to-day e-mail communication in organizations. Thus, the proposed EIM method can be beneficial to other business environments. In this regard, the GTS

Discovery and analysis of email-driven collaboration processes
149
case represents a typical case. Future work plans to investigate the effectiveness of the EIM method using new sets of input e-mails. This may lead to further (re)design of the method and output model. More specifically, an evaluation of the EIM method using the Enron corpus is planned for the future. The Enron corpus is a large set of e-mail messages that was made public during the legal investigation of the Enron Corporation (Klimt & Yang, 2004). Moreover, an investigation of ways to deal with multiple HCP instances in one e-mail archive is planned for the future.
4.8.2. Assumptions about user behaviour
The specific design decisions made in the development of the EIM method are based on certain assumptions (i.e. expectations) about user behaviour with regard to the use of e-mail. The following lists the most relevant design decisions and the corresponding assumptions:
1. As Section 4.3.3 explains, the EIM method creates certain composition relations between interactions in the output model based on the reference or reply relations that exist between the identified threads. The rationale is that such reference relations indicate related topics (i.e. conversational streams) and these relations should be made visible in the output model. The assumption about user behaviour is that users use the reply function to reply to a message, and not to start a new e-mail (with a new unrelated topic) to save the time and trouble of typing e-mail addresses. In the latter case, reference relations between otherwise unrelated e-mails are created, which results in the composition of otherwise unrelated interactions in the output model;
2. As Section 4.3.5 explains, in the EIM method, the senders and recipients listed in the “From” and “To” fields of the e-mails in a given thread become active participants in the corresponding interaction. The recipients listed in the “Cc” fields become passive participants. The assumption about user behaviour is that users use the “To” and “Cc” fields to separate between different types of recipients. This means that recipients who are expected to respond to a given message are put in the “To” field whereas recipients who are only informed are put in the “Cc” field. This is opposed to putting all recipients in the “To” field to save the trouble of separating between the two types of recipients, which results in only active interaction participants;

Chapter 4
150
The direction taken with the EIM method is to base its design on the assumptions made above. To support the wider applicability of the method, the experience obtained in the GTS case study was used to create a list of recommendations for desired user behaviour (i.e. e-mail etiquette rules). When followed, these recommendations maximize the benefits obtained from the application of the EIM method. More specifically, the recommendations benefit the quality (i.e. structure) of the output model and thus its usefulness for HCP analysis and improvement purposes. The list of recommendations can be found in Appendix B. An e-mail policy may be set-up by an organization to formally establish these recommendations. It is important to note that, organizations that do not have the time or interest to implement the recommendations can still apply the EIM method. In such organizations, the face validation of the output model, as described for GTS in Section 4.5.3, can be given more weight to make sure the model accurately reflects reality. After all, the users in the GTS case study did not follow the recommendations. Still, the EIM method proved feasible and effective with valuable and actionable insights for GTS.
Future work intends to explore improvements to the EIM method so that it can be effectively applied without the recommendations. For instance, with regard to the first assumption, thread assembly based on content analysis using text analytics may be an improvement. As opposed to using threading by subject and reference, content analysis does not depend on how the reply function is used by the user. Text analytics may also be used to automate the discovery of missing e-mail messages from message bodies. On the other hand, a current strength of the EIM method is that it can produce a model without looking into message bodies, that is, the method is unobtrusive. Therefore, organizations with confidentiality or privacy concerns can remove message bodies, and still apply the method and obtain desirable insights. In contrast, the use of text analytics requires the availability and use of message bodies. However, message bodies could be encrypted to ensure privacy.
With regard to the second assumption, a possible future improvement to the EIM method could be that the separation between active and passive participants is based on whether recipients have actually sent a reply in a given thread. This as opposed to the separation based on the listing in recipient header fields (i.e. “To” and “Cc” fields). It is reasonable to assume that recipients who actually should have been put in a “Cc” field have not sent a reply in a given thread. The result that there are no recipients in “Cc” fields may also be caused by the use of the “Reply

Discovery and analysis of email-driven collaboration processes
151
All” function by the user. When this function is used, some e-mail clients only put the sender of the message, to which the current message is a reply, in the “To” field and everybody else in the “Cc” field. Although this might wrongfully lead to all the others becoming passive participants, it is reasonable to assume that such recipients contributed to the thread with another message. This still makes them active participants.
Another avenue for future research is an empirical study of user behaviour. A detailed user study (e.g. a survey) of professional e-mail communication could provide insight into common user behaviour to investigate whether the above assumptions, in general, hold in practice. For example, it could be interesting to compare the results of two studies of user behaviour, one conducted before and one conducted after the list of recommendations is established in an organization.
4.8.3. Limitations
The main limitation of the EIM method is that it is beneficial only for organizations where e-mail is (one of) the most important communication mediums for human collaboration. For example, in organizations that promote open workplaces where collaborators are clustered together and can easily talk face to face, the EIM method is less beneficial when the HCP occurs mostly through such synchronous interaction. At GTS, most collaborators had private offices and tended to use e-mail for most of their interactions. Even if e-mail is the main tool used for business communication and collaboration, in practice, an email-driven HCP is a subset of a wider HCP since other interaction forms (e.g. discussions, conversations, telephone calls etc.) typically occur between the human process participants. In organizations where other interaction forms are prevalent, the e-mail interactions in the output model can be out of context since the model does not provide a full view of the HCP. Knowledge about other interaction forms can be collected by pursuing additional data collection methods, in particular in-depth interviews with the involved process participants and/or study of organizational documentation. The collected knowledge can be used to enhance the output model. Such additional data collection can be incorporated into the manual post-processing activity of the EIM method (see Section 4.3.6).
Besides the main limitation, there are some limitations to the EIM method due to practical and methodological choices. First, the EIM method does not look into message contents. Although this is considered a strength, as mentioned in Section 4.8.2, this does imply that the method does not take into account differences in e-mail length (i.e. the amount of text in e-mail message bodies). In other words, e-
Chapter 4
152
mails with detailed responses and e-mails that for instance just say “Thanks” or “Ok” have the same weight. However, the EIM method considers message threads as the fundamental building blocks in an email-driven business process. Moreover, the method uses threading by subject to group e-mails into threads, and uses threading by reference to discover relations between threads. Both threading algorithms use only e-mail header fields. Therefore, because of the focus on the discovery of threads (from e-mail header fields), the weight (read: length) of individual e-mails is not relevant in the EIM method. Yet, this design may have implications when lengthy e-mails discuss multiple (related) subjects in their message bodies. In this case, a limitation of the EIM method is that these subjects do not appear in the output model since only the subject lines of e-mails are read by the method. To address this limitation, one of the e-mail etiquette rules (see Appendix B), recommends that users start a new message for each subject. In other words, users should limit e-mails to a single subject to ensure that each subject is represented as an interaction in the output model. This recommendation is reasonable since, in general, keeping e-mails succinct and on target is considered good practice.
Second, as Section 4.3.5 explains, the EIM method assigns the role names of the active participants to the interactions in the output model. These formal role names correspond to job titles. In practice, it is possible that employees take on roles, which are not part of the formal (project or process) structure based on job titles. This is usually done informally. An interesting direction for future work is to enable the specification and visualization of informal roles with the EIM method.
Third, the EIM method visualizes the roles (i.e. generic interaction participants) in the output model but not the active participants (i.e. the specific interaction participants). The active participants can be distinguished in the corresponding interaction attribute. As Section 4.2.2 explains, agents can be assigned to play the roles in the IS diagram. As Figure 4-1 shows, this notation can be used to visualize also the specific interaction participants in the IS diagram. The infrastructural process between GTS and Company X is executed for each new infrastructural (IT) project. The goal of the application of the EIM method was not only to analyse the Service Bus project but to primarily use the results to inform the (improvement of) the interaction structure and resource planning of future infrastructural projects. Roles provide more useful resource information since these usually remain the same across projects whereas the agents often change. This was confirmed by the key informant. Therefore, the agents have not been visualized in the GTS output

Discovery and analysis of email-driven collaboration processes
153
model. Future works intends to explore the option to let users select dynamically what is (and is not) visualized in the output model.
Fourth, the EIM method relies on the “References” field to identify compound threads. However, this e-mail header field is optional. In an e-mail message, the only required header fields are the origination date field and the originator address field(s) (IETF, 2001; Loshin, 1999). Thus, not all e-mail clients generate the “References” field (or the “In-Reply-To” field) in an e-mail message. Nevertheless, popular e-mail clients like Mozilla Thunderbird and MS Outlook do add this field. Currently, the EIM method works with MS Outlook. As part of future work, the method may be extended to work with other e-mail clients. As indicated in Section 4.8.2, a possible future improvement to the threading algorithm of the EIM method is the use of text analytics. This has the advantage in applicability even when the necessary e-mail header fields are not available.
4.8.4. Interaction-centric modelling
In today’s business environments, the vast majority of work performed within organizations is executed in a dynamic and unstructured environment of e-mails, meetings, phone calls, and face-to-face meetings (Knudson, 2009). The TALL modelling language is specifically designed to model such interactions as a HCP, making them visible and amenable to process analysis and improvement. It was argued that e-mail communication is a HCP since it is primarily about interaction between the participants. In this regard, the output model demonstrates that TALL successfully and effectively puts e-mail interaction in a process context in terms of a role-based human interaction structure. The output model (i.e. IS diagram) provides an overview of all interactions, their composition and routing relations, their roles, and their attributes. The interactions serve as containers for the messages within it. This provides local process context whereas the routing and composition relations between the interactions provide global process context. Overall, the results show that the IS diagram can be used to expose the role-based interactions in an email-driven HCP, and can provide actionable insights based on a process analysis.
The development of the EIM method also contributed to the development of the TALL modelling language. In (Stuit & Szirbik, 2009), a formal definition of the IS diagram is presented in which interactions are defined with the following attributes: label, routing type, decision rule set. Based on this chapter, the interactions in the IS diagram are extended with the identified attributes: start time, end time, duration, active participants, passive participants, message size.
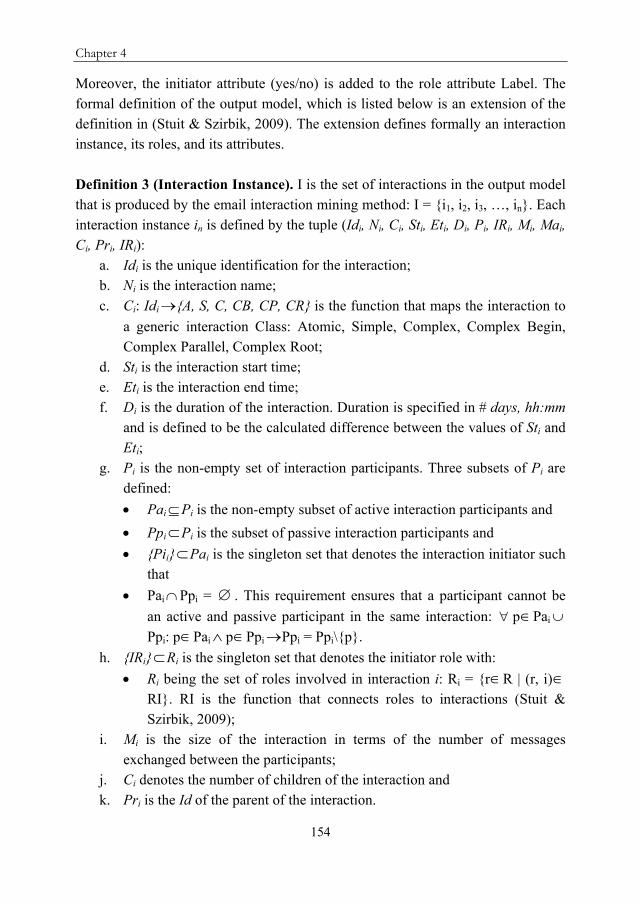
Chapter 4
154
Moreover, the initiator attribute (yes/no) is added to the role attribute Label. The formal definition of the output model, which is listed below is an extension of the definition in (Stuit & Szirbik, 2009). The extension defines formally an interaction instance, its roles, and its attributes. Definition 3 (Interaction Instance). I is the set of interactions in the output model that is produced by the email interaction mining method: I = {i1, i2, i3, …, in}. Each interaction instance in is defined by the tuple (Idi, Ni, Ci, Sti, Eti, Di, Pi, IRi, Mi, Mai, Ci, Pri, IRi):
a. Idi is the unique identification for the interaction; b. Ni is the interaction name;
c. Ci: Idi{A, S, C, CB, CP, CR} is the function that maps the interaction to
a generic interaction Class: Atomic, Simple, Complex, Complex Begin, Complex Parallel, Complex Root;
d. Sti is the interaction start time; e. Eti is the interaction end time; f. Di is the duration of the interaction. Duration is specified in # days, hh:mm
and is defined to be the calculated difference between the values of Sti and Eti;
g. Pi is the non-empty set of interaction participants. Three subsets of Pi are defined:
PaiPi is the non-empty subset of active interaction participants and
PpiPi is the subset of passive interaction participants and
{Pii}Pai is the singleton set that denotes the interaction initiator such that
PaiPpi = . This requirement ensures that a participant cannot be
an active and passive participant in the same interaction: pPaiPpi: pPai pPpiPpi = Ppi\{p}.
h. {IRi}Ri is the singleton set that denotes the initiator role with:
Ri being the set of roles involved in interaction i: Ri = {rR | (r, i)RI}. RI is the function that connects roles to interactions (Stuit & Szirbik, 2009);
i. Mi is the size of the interaction in terms of the number of messages exchanged between the participants;
j. Ci denotes the number of children of the interaction and k. Pri is the Id of the parent of the interaction.

Discovery and analysis of email-driven collaboration processes
155
To return the values of the list items j and k the functions children(i) and parent(i) are used (Stuit & Szirbik, 2009). The function children(i) returns the set of direct child interactions of the parent interaction i. The function parent(i) returns the parent of the interaction i.
It is interesting to investigate if the interaction attributes can be generalized to (instances of) other interaction forms. It is reasonable to assume that most interactions have a name, start time, end time, duration, and participants. Future research intends to empirically validate this claim. Moreover, it is interesting to investigate if the divergence of a single thread into multiple (related) threads occurs for other interaction forms. The complexity of certain interactions is likely to cause decomposition into several interactions. The tree layout of the IS diagram offers explicit support for such decompositions. The routing relations in the GTS output model show many parallel interactions. This is in line with the work in (McDaniel, Olson, & Magee, 1996), which finds that the threading of computer-mediated communication includes more concurrency than that of face-to-face interactions. The authors conclude that the delay between interactions in asynchronous communication provides time for interleaving of different topics.
4.9. Conclusions
This chapter presents an email interaction mining method to discover and represent email-driven business processes, that is, the business process associated with professional human e-mail communication. The discovered business process is a human collaboration process, which consists of a process structure of e-mail interactions between humans who have specific roles to play. The proposed method adopts an interaction-centric business process modelling language named TALL to visualize the discovered email-driven business process.
In the method, message threads (i.e. sets of e-mail messages that are replies to each other) are used as the fundamental building blocks to identify the e-mail interactions. The focus on business process discovery and the use of message threads separates this work from related work. The proposed method extracts process-related information from header fields of e-mail messages in a historical e-mail archive, which relates to a specific project or process, and outputs a TALL Interaction Structure diagram. The method is able to discover interactions, their composition and routing relations, their roles, and their attributes (name, start time, end time, participants). The composition and routing relations between interactions are identified based on the similarity and temporal order of the identified threads.

Chapter 4
156
The method is implemented in a software tool named Email Interaction Miner. This software tool transforms a set of e-mail messages in MS Outlook into a model format that can be loaded in a visual editor for the TALL modelling language.
In a case study, the method is applied to an e-mail archive collected from a Dutch gas transport company. Evaluation of the case application shows (1) the effectiveness of the method to discover and visualize the email-driven business process under study, and (2) the utility of the method to realize business value. The business value takes the form of process improvement opportunities, which are identified based on a process analysis of the output model. The case study is followed by a discussion of the contribution, generalizability, assumptions, and limitations of the proposed method. It is concluded that the method has wide applicability because the input e-mails are not manipulated and are representative of conventional e-mail communication in organizations.

Chapter 5
A business process study of human collaboration This chapter is an edited version of the manuscript: Marco Stuit and Hans Wortmann. A collaboration process study with application of agent interaction and behaviour diagrams. In: W.W. Smari and W.K. McQuay (Eds.), Proceedings of the 2010 International Symposium on Collaborative Technologies and Systems, pp. 302-313. Washington, DC, USA: IEEE Xplore, 2010.

Chapter 5
158
Abstract
he contemporary workplace is characterized by all kinds of (synchronous and asynchronous) human interactions both within and across organizations like meetings, discussions, consultations, conversations etc.
Although such interactions are an essential part of a modern organization’s business activity, current business process research focuses mainly on the sequence of activities or tasks within a process (i.e. workflow processes), and not on human interactions. This chapter presents an application of an interaction-centric business process modelling language named TALL for human collaboration processes (HCPs). For the illustration and evaluation of the language, a case study of a real-life HCP is presented. The case study concerns the collaborative work of a Dutch municipality with regard to young persons who drop out from school. Shortcomings of existing graphical workflow-based process modelling languages in their ability to model HCPs are elicited. In the case study, the TALL modelling language is shown to address these shortcomings. The main strengths of the language are (1) the rich graphical representation of human interactions, their composition and routing relations, and their participants (i.e. agents) in an interaction diagram with a tree layout, and (2) the explicit recognition and specification of the local behaviours of the agents who are assigned to play the roles in a given interaction. Evaluation results are discussed. These results comprise practical insights for the municipality and theoretical insights that stem from the application of the language.
T

A business process study of human collaboration
159
5.1. Introduction
Within organizations, many business processes are defined in workflows, such as order handling. A workflow definition specifies which tasks in a process need to be executed and in what order (van der Aalst, 1998). Such a specification is usually implemented in the form of a model in a software system (i.e. workflow application). In this way, the model can be applied to a multitude of similar cases (e.g. multiple orders follow the same process structure in an order handling process). Alternatively, the model can be implemented in a set of organizational protocols. In both cases, the goal of workflow modelling is to increase process efficiency. Conventional graphical workflow-based process modelling languages include, amongst others, BPMN (White, 2004), WS-BPEL (OASIS, 2007), Petri nets (Desel, 2005), UML activity diagrams (Dumas & ter Hofstede, 2001; Eshuis, 2002), EPCs (Scheer, Thomas, & Adam, 2005), and IDEF0 (Mayer, Painter, & deWitte, 1992). The essence of workflow-based languages is similar; they create structured, well-defined process models in which the collection of tasks or activities in the business process and their ordering constraints are formalized in a task execution sequence (Wang & Wang, 2006).
In the last decade, organizational structures with a more collaborative nature have emerged like the knowledge organization, horizontal organization, networked organization, and virtual organization. A common characteristic of these organizations is that human work is executed across internal (e.g. team, departmental) and external (e.g. organizational) boundaries (Stanford, 2005). In these organizations, humans cooperate through (informal) interactions. Cooperation is required to leverage each other’s expertise, experience and resources, and to reach individual and joint business goals. Typical examples of human interactions are meetings, consultations, discussions, or conversations. These interactions occur either synchronous (e.g. face-to-face) or asynchronous (e.g. via e-mail, telephone), and are seldom isolated since humans are usually engaged in several related and intermittent interactions to reach their goals. Since such interactions consume a lot of time in daily work practice, it is remarkable that business modelling tools, in particular process modelling languages, focus primarily on the specification of workflow processes. This research takes the position that human interactions should be managed as a business process. In literature, such processes are designated as knowledge-intensive processes, case management processes, complex and dynamic processes, ad-hoc and informal

Chapter 5
160
processes etc. In this research, these processes are named human collaboration processes (HCPs). A HCP consists of a process structure of (several forms of) workplace interactions between humans who may each play different roles. In a HCP, there is a need for communication and collaboration between workers (Stohr & Zhao, 2001). Collaboration instead of task sequence determines the nature of the business activity (Harrison-Broninski, 2005).
The workflow-based languages have their main purpose to ‘program’ workflows as task sequences. Therefore, new graphical process modelling tools are required to represent HCPs. This research adopts an interaction-centric business process modelling language named TALL (Stuit & Szirbik, 2007; Stuit & Szirbik, 2009; Stuit & Wortmann, 2010) for the graphical representation of HCPs. The language is process-oriented but based on agent-oriented concepts and notations (i.e. interactions, behaviours, agents, and roles).
This chapter adopts a design science research approach because of its focus on problem solving through the application of novel artefacts, and the evaluation of their effectiveness and practical utility using empirical methods (Hevner, March, Park, & Ram, 2004). The empirical method used in this chapter is a case study of a real-life HCP at a Dutch municipality. The general methodology for design research as described by (Vaishnavi & Kuechler Jr., 2008) is followed.
In the Problem Awareness phase, the problems are identified. Based on an analysis of business process literature, modelling shortcomings of existing graphical workflow-based process modelling languages in their ability to represent HCPs are identified. These shortcomings form the theoretical problem. It is important to mention that these shortcomings do not mean that the workflow-based languages are flawed, only that they have their main utility in the specification of workflows. Section 5.2 presents the shortcomings, supported by related works. Next, Section 5.3 introduces the process diagrams in the TALL modelling language, which consist of interaction and behaviour diagrams, as a potential solution for the problem (Suggestion phase). Section 5.4 first introduces the case study and the organizational problem. Second, it presents an instantiation (read: application), an artefact of design science research (Hevner, March, Park, & Ram, 2004), of the TALL diagrams in the case study (Development phase). The goal is to make human interaction and behaviour in the HCP under study explicit via diagrams so that it becomes amenable to process analysis and improvement. Section 5.5 reports on the practical results (i.e. HCP improvement options) to show that the organizational problem has been addressed whereas Section 5.6 offers a

A business process study of human collaboration
161
discussion to show that the theoretical problem has been addressed (Evaluation phase). Finally, Section 5.7 gives conclusions together with future work (Conclusion phase).
5.2. Modelling Shortcomings
5.2.1. The interaction shortcoming
Existing graphical workflow-based process modelling languages have shortcomings in their ability to model a HCP’s interaction structure. In these languages, the graphical representation of interactions is either weak or not addressed at all. When interactions are modelled, they are modelled as part of the workflow – as mere ‘connected’ individual communicative activities that are mixed with the specification of non-communicative activities. In most cases, the roles or actors are differentiated using explicit boundaries or swimlanes (e.g. UML activity diagrams). In the case of a (peer-to-peer) interaction between two actors, message or flow arrows are used to connect the communicative activities in two adjacent swimlanes. In the case of an interaction between three or more actors, the communicative activity needs to be repeated on each swimlane and all activities need to be connected. This introduces unnecessary redundancy. In (De Backer, Snoeck, Monsieur, Lemahieu, & Dedene, 2009), the authors confirm that, when modelling collaboration, an increasing amount of ‘‘coordination overhead” is introduced as the number of participants increase. In the case of multiple interactions, with relations to each other, between different sets of actors, the model becomes difficult to read. Certain interactions may be part of other interactions, certain interactions may have to be completed before others, certain interactions may run in parallel with other interactions, or certain interactions may have to be repeated. Li, Hosking, and Grundy (2007) write that cobweb and labyrinth problems appear quickly when workflow-based models are used to create very complex diagrams or to model many cross-diagram relations. Workflow-based languages adopt box-and-line style diagrams, also called flowchart or graph-based notations. Hommes (2004) explains that these do not work well for large diagrams where users have to model interactions between a wide range of actors. Workflow-based languages are appropriate for modelling business processes that display complex activity or task flows (i.e. workflow processes) but are less appropriate for modelling business processes that involve the interaction of a multitude of actors (i.e. HCPs) (Barjis, 2007; De Backer, Snoeck, Monsieur, Lemahieu, & Dedene, 2009; Hommes, 2004; Melão & Pidd, 2000; Ryu &
Chapter 5
162
Yücesan, 2007). With an increasing number of participants and interactions, it is
difficult to read in a workflow-based process model where interaction takes place and between whom. Moreover, it is not represented how an interaction is
related to other interactions as part of the HCP. The advent of web service technology puts more emphasis on collaboration and
has given rise to new modelling techniques. In choreography models (Pelz, 2003), interaction between business entities is modelled by describing the sending and receiving of messages in a way similar to interaction protocols (Odell, Van Dyke Parunak, & Bauer, 2001). First, choreography models are most useful when a high level of automation is the primary goal. In this situation, there need to be unambiguous models that specify in detail the nature of the collaboration between business partners (Weske, 2007). Thus, choreography models are implementation-driven instead of human-driven. The realistic capture of actual human work practice is less important. Second, a choreography model or interaction protocol does not reveal how an interaction is related to other interactions as part of a business process. This means that the complexity of a HCP’s interaction structure remains implicit. De Backer, Snoeck, Monsieur, Lemahieu, and Dedene (2009) confirm that, although useful for implementation and enactment, these message-oriented approaches are essentially binary (peer-to-peer) and not capable of modelling complex collaboration relations in a business process.
5.2.2. The local view shortcoming
In graphical workflow-based process modelling languages, the process is defined independently from the actors. The process model reflects the generic perspective of the process designer who aims to increase process standardization and efficiency. Such a model is referred to as a centralistic model since it is created from a central observer view. In a HCP, the knowledge, expertise, and experience of the humans are quite distinct and different. The humans have their own local (i.e. personal, individual) view or perception of the process. The disadvantage of a centralistic model is that local process views are lost at the choice of the process designer since they are squeezed into a single model. In other words, in a centralistic model local views are not explicitly captured and modelled. Liu, Li, and Zhao (2009) mention that such a (centralistic) approach neutralizes the diversity of participants in terms of perception scopes. King and Johnson (2006) add that a standardization approach has the danger to stifle local process variety through a one-size-fits-it-all solution. In this chapter, the terms process variety and diversity are used interchangeably to refer to the multifariousness of a HCP in

A business process study of human collaboration
163
terms of local process views. The monolithic nature of centralistic models strengthens the interaction shortcoming since centralistic models tend to get large and unreadable with increasing numbers of participants and interactions. Another shortcoming arises out of the centralistic nature of existing workflow-based process models. The (communicative) activities of different actors are not allowed to conflict. Current modelling frameworks do not acknowledge the complex, situated, adaptive nature of human behaviour, and provide ’aerial’ representations that ignore the process required to align the different and inconsistent views that human agents frequently have of the organization (Zacarias, Pinto, Magelhães, & Tribolet, 2009). The neutralization of local process views may make humans feel that their views are not adequately modelled. Taking into account the local views of the agents has the potential to minimize the gap between the actual process and the modelled process by capturing real-world nuances, diversity, and intricacies. This provides a richer basis for a process analysis and improvement effort. Moreover, the process can flow in a different way than if it were centrally modelled.
5.3. The TALL Modelling Language
In the TALL modelling language (Stuit & Szirbik, 2007; Stuit & Szirbik, 2009), the organizational context in which a HCP occurs is seen as a multi-agent environment in which different agents behave in interactions to coordinate their work. The language’s main modelling concepts are agents, roles, interactions, and behaviours.
The language separates between two levels of linked process representation. On a high level, the set of interactions that forms the HCP is structured in the Interaction Structure (IS) diagram. Interactions are depicted as flattened hexagons and are related to other interactions through composition (one interaction being part of another) and routing (one interaction must be completed before, in parallel with, or instead of another interaction). The routing relations supported in the IS diagram are sequential routing (SEQ), parallel routing (PAR), and exclusive choice (XOR). Formally, the IS diagram is a tree with a single root interaction. Figure 5-1 shows a simple example of the interactions in a 2-Day Workshop in which the first day consists of Paper Presentations and the second day ends with a Best Paper Ceremony. The Paper Presentations interaction could be decomposed further to represent all individual presentations. Child interactions are linked to their parent interaction by a routing symbol that indicates the process flow of sibling interactions. A parent interaction completes if all its children complete according to

Chapter 5
164
the specified routing relation. Thus, by convention, completion or composition is read bottom-up while routing between sibling interactions is read from left to right. Decision rules can be attached to the three routing types to enable rule-based execution of a set of sibling interactions. Graphically, a (non-empty) decision rule set is depicted by attaching a subscripted letter d to the routing type. In effect, decision rules allow the specification of optional and repetitive interactions.
Figure 5-1. Agent interaction and behaviour modelling in TALL.
For each elementary interaction (i.e. interactions without children), it is indicated which roles are involved. Roles are depicted as ellipses and are attached to the lines outgoing the hexagon (see Figure 5-1). In TALL, an interaction does not exist without at least two roles being bound to it (Stuit & Szirbik, 2007; Stuit, Szirbik, & Wortmann, 2007b; Stuit & Szirbik, 2009). An initiator role either starts or leads an interaction, and can be recognized by the role-interaction connector with a filled arrowhead (see Figure 5-1). A role is directly linked to an interaction and is an independent object separate from the agent(s) that is(are) assigned to play a specific role. Roles serve as placeholders for the agents and can be thought of as generic participant types. The roles in an interaction also represent division of responsibility within the process.
The elementary interactions are completed by the coordinated execution of the local behaviours performed by the agents playing the involved roles. Agents are depicted as rounded rectangles and are assigned to play roles as in Figure 5-1. The circle icon represents human agents. Figure 5-1 shows two human agents that are assigned to play the roles of Presenter and Chairman. No audience members are

A business process study of human collaboration
165
depicted. In the IS diagram, agent behaviours are depicted as chevron symbols (i.e. arrow rectangles) that appear at the tail of the agent-role connector (see Figure 5-1). Each chevron is owned by the adjacent agent and is a compact representation of an Agent Behaviour (AB) diagram that details the (intended) behaviour of the owner agent for that specific interaction. Thus, on a lower level of modelling, a set of AB diagrams specifies the individual local behaviours of the agents assigned to the roles of a given interaction in the IS diagram. Although an agent may have a knowledge base of applicable behaviours, from a modelling perspective, only the behaviour that is selected for usage or analysis is depicted in the IS diagram. An AB diagram is a swimlane that specifies the internal states of the owner agent, and the communicative and non-communicative activities that cause it to change states. AB diagrams are based on the Behaviour net formalism (Meyer & Szirbik, 2007a), an extension of the coloured Petri net formalism with the message place type. The messages sent and received by the agent are modelled explicitly as message places. Message places allow the process flow to alternate between different agent behaviours in an interaction. Section 5.4.4 shows some examples of AB diagrams from the municipality case study.
AB diagrams allow to represent beliefs about the contribution expected (i.e. expected behaviours) from other agents in the same interaction. Such AB diagrams are named interaction beliefs in TALL. They allow an expected interaction to be modelled from the viewpoint of one agent: the left-most swimlane depicts the behaviour of the owner agent and the other agents are regarded as message senders or receivers. Other (non agent-oriented) process modelling techniques do not consider that an actor can have explicit process beliefs. The interaction belief concept is explained in more detail in (Stuit, Szirbik, & de Snoo, 2007). A software tool, named the Visual Editor, supports the TALL modelling language. It allows the user to build and manipulate TALL diagrams and is freely available from the software section on http://www.agentlab.nl/.
5.4. Case Study
5.4.1. Case description
In the Netherlands, national legislation enforces compulsory education for each young person until their 16th birthday. This is extended up to the 18th birthday when the young person did not yet obtain a so-called start qualification, which is a school diploma with a certain educational level that qualifies as a job qualification. The execution of the Law for Compulsory Education (LCE) is organized de-

Chapter 5
166
centrally by municipalities. The LCE requires Dutch municipalities to check and enforce the school attendance of the school age youth (age 5-18) in their residential area. Since 2002, the Dutch government also pursues to help dropouts in the age group 18-23 without a start qualification to obtain such a qualification. However, young persons in this age group cannot be forced since the LCE does only apply to the 5-18 year olds. Municipalities must maintain a database in which school (un)enrolments (age 5-23) and data about school absenteeism (age 5-18) are registered as part of a Student Administration system. Educational institutions (e.g. primary and secondary schools, vocational/professional schools) have a legal obligation to report school absenteeism and school (un)enrolments to the municipality where the young person resides. For the dropouts of age 18-23, municipalities also receive reports about social security benefits from social service institutions and job data from employment offices. In Oldambt, the case study municipality27, the cluster Student Affairs (cluster SA) in the department of Welfare and Neighbourhood Management is responsible for the above work. The primary goal of the cluster SA is the reduction of school absenteeism and the number of dropouts. The (collaborative) work concerned with all facets of the student affairs in the cluster SA forms the scope of the HCP in this case study.
5.4.2. Agents and roles
Eight full-time employees, who play five different roles, work in the cluster SA. There are two school attendance officers. The primary task of the school attendance officer is the enforcement of the LCE. The school attendance officer deals with absolute (no school enrolment), relative (truancy), and luxury (holiday leave without permission) school absenteeism, and is responsible for (re)directing dropouts (5-18) back to the formal education system. Because of the LCE, the school attendance officer has several means of coercion (e.g. official warnings, summons). There is one prevention officer who focuses on the 18-23 year olds. The primary goal of the prevention officer is to have all dropouts in this age group without a start qualification on the radar, and to pro-actively approach them to motivate and help them to obtain a start qualification. The school attendance and prevention officers also have a care task in the case of family issues or socio-emotional problems. To find solutions to problems, they collaborate with several partners: educational institutions, care institutions, the police, the public
27 The municipality of Oldambt is a relatively big Dutch municipality in the eastern part of the northern province Groningen.

A business process study of human collaboration
167
prosecution office, (youth) welfare work, the child abuse office, employment offices, social welfare institutions, the child welfare council, the schools inspectorate, the labour inspectorate etc. The abundance of interactions with these external partners is one of the causes of the organizational problem (see Section 5.4.3). Interaction with young persons and their parents/caretakers usually occurs through telephone, e-mail, house visits, conversations at the town hall etc. There are three administrative employees. Two of them support the school attendance officers and one supports the prevention officer. Their primary tasks include filing activities, entering school (un)enrolments and school absenteeism reports in the Student Administration system, dealing with less serious cases of school absenteeism, and taking care of the correspondence with young persons, parents/caretakers and schools. There is one employee who takes care of applications for student transport coming from parents/caretakers. Student transport is requested in the case of absence of suitable education nearby (e.g. because of religious conviction or a serious disability of a young person). Finally, the senior manager student affairs sets out the policy of the cluster SA and coordinates the collaborative work of all employees.
5.4.3. Organizational problem
The cluster SA is dealing with a large coordination complexity in the execution of the student affairs for several reasons. The first reason is the general problem situation in this part of the Netherlands (higher than average levels of poverty, population exodus, brain drain etc.) and all social issues that stem from it. The second reason is the resulting increase in the number of dropouts and school absenteeism. The third reason is the recent merger (April 2009) of three municipalities into the municipality Oldambt. Consequently, the cluster SA is now responsible for the young persons in a larger residential area. The fourth reason is the government policy towards the extension to the age of 23. Finally, there is the ever-increasing pressure of new national regulation. These factors contribute to a complex mix of numerous interactions and their interrelations:
Local, communal meetings are visited three times by the SA employees due to the recent merger, in particular by the school attendance and prevention officers;
Regional, inter-communal meetings increased in number since the government enforced the creation of regional networks of collaboration in which preventive policy gets priority over curative policy;

Chapter 5
168
Interactions with external partners, young persons, and their parent/caretakers increased in number because of the higher amount of young persons with problems. Each young person is considered a unique case so interaction and information-exchange is of utmost importance;
The senior manager has increased the number of intra-departmental interactions (i.e. work meetings) to improve knowledge-exchange and collaboration between the employees who originate from the three pre-merger municipalities.
Although all employees pursue a common business goal and share a passion for their work, different views on the work processes exist. This is partly caused by the fact that the employees originate from three different municipalities. Traditionally, Dutch municipalities have had much autonomy in the definition and execution of their business processes. Therefore, the operational process views of the employees from different municipalities differ. In addition, the existence of different process views is caused by the fact that most of the employees operate in specific focus areas, each with their own expertise and experience. For example, the school attendance and prevention officers have professional autonomy. This means they have the ability to make their own decisions without having to account to others beforehand (WCPT, 2003). This implies that the administrative employees supporting them also have specific focus areas.
The core of the organizational problem is that nobody knows exactly what everyone is doing, that is, there is no clear view of the overall HCP in which the colleagues are engaged. The municipality attempted to solve this problem about a year ago when they hired a consultancy company to model their operational work processes (including the work of the cluster SA). The consultancy company studied documentation and performed interviews with one representative of each job title/role. The result was a report with process models and descriptions of the current situation. In the initial phase of the current case study, the senior manager communicated that the consultancy report was a poor basis for a process analysis and improvement effort since it did not provide insight into actual human work practice.
5.4.4. Interaction and behaviour modelling
The TALL modelling activity at the municipality consisted of two sequential phases. The first phase started with the creation of a preliminary IS diagram based on an in-depth study of municipality documentation with regard to student affairs.

A business process study of human collaboration
169
However, written documents are not sufficient to provide a complete and accurate picture of actual human interactions. For this, the valuable input of the subject matter experts (i.e. process participants) is required. Therefore, a model-based workshop was hosted and chaired by the researcher to validate the IS diagram with the eight employees. In a model-based workshop, models are built interactively with subject matter experts who talk about the process and a modeller/facilitator who changes models on the fly (Bridgeland & Zahavi, 2009).
The workshop spanned one entire morning and lasted about 4 hours. During the workshop, the researcher started with an explanation of the TALL modelling notations using the preliminary IS diagram. Next, the author facilitated a focused walkthrough discussion of the HCP using the preliminary IS diagram. During the discussion, the employees were asked to improve the preliminary IS diagram. The researcher processed live the feedback of the participants (i.e. extensions, refinements, deletions) in the TALL Visual Editor. This lead to several new interactions, improvements to the role assignment of interactions, changes to the classification and placement (composition) of interactions (composition), and changes to the routing of interactions. In this way, the workshop allowed for immediate face validation of the IS diagram. Face validation is asking the reality owners or subject matter experts whether the models accurately reflect reality (Sargent, 2007). It is a form of qualitative assessment, which involves human judgment or expert opinion, to review if a model meets user expectations (Illgen & Gledhill, 2001; Pace, 2004). Figure 5-2 shows a fragment of the IS diagram output from the model-based workshop. The complete model is not included but can be downloaded with the TALL Visual Editor.
The IS diagram served as input for the behaviour modelling phase. In this phase, data collection was done through semi-structured interviews. The researcher interviewed all employees for 1-2 hours in their offices. During the interviews, the employees were asked, for each interaction in which they are involved, to describe their actual behaviours (i.e. activities and their order), the message exchange points with the other interaction participants, and the expected behaviours’ of the other participants. Moreover, the employees were explicitly asked and stimulated to discuss these behaviours from their own personal view and experience. Audio was recorded with a voice recorder. Since there was limited time during the interviews, the researcher formalized the collected local domain knowledge in AB diagrams in his own time. The behaviour modelling phase resulted in 26 AB diagrams for different interactions in the IS diagram. To validate these AB diagrams, each

Chapter 5
170
employee was then sent their own set of AB diagrams together with a legend explaining the modelling notations. Based on the feedback received, the researcher made corrections to the AB diagrams.
Figure 5-2. Fragment of the IS diagram for the cluster Student Affairs.

A business process study of human collaboration
171
In the bottom left part of Figure 5-2, the two school attendance officers and their local behaviours are assigned to the roles of the School Enrolment Exemption interaction. Figure 5-3 and Figure 5-4 show the two corresponding AB diagrams. For privacy reasons, the names of the employees have been disguised.
Figure 5-3. The local behaviour of the first school attendance officer.
Although the AB diagrams in Figure 5-3 and Figure 5-4 have been simplified to take into account a non-disclosure agreement, the key aspects of the behaviours are still present. Both diagrams are interaction beliefs since they show beliefs about the expected behaviours of the other agents in the interaction. Thus, these AB diagrams are represented as multi-swimlaned Behaviour nets including message exchange points (i.e. both have three swimlanes). In each swimlane, incoming messages are indicated on the left and outgoing messages are indicated on the right. These messages can be matched to the incoming and outgoing messages of the other swimlanes using the message labels that act as type names (Meyer & Szirbik, 2007a). In a workflow-based process modelling language, a single generic

Chapter 5
172
behaviour would be specified for the role of the school attendance officer in this interaction. In other words, the two individual behaviours of the two agents who play the role of school attendance officer would not be modelled separately. This means differences between behaviours are not explicitly modelled. The explicit capture and modelling of the local behaviours with TALL retains process diversity, that is, the two AB diagrams show differences in the behaviours of the two school attendance officers. This allows these differences to be analysed (see Section 5.5).
Figure 5-4. The local behaviour of the second school attendance officer.

A business process study of human collaboration
173
5.5. Practical Results
The IS diagram gives the cluster SA a clear overview of the (number of) interactions, their composition and routing relations, and their (initiator) roles. In particular, the composition (i.e. classification) of interactions in preventive and curative interactions, communal and inter-communal meetings, and internal and external meetings provides insight into the number of interactions of each class. The following list presents examples of some specific actionable insights:
The IS diagram reveals that the school attendance officers are involved in a relatively high number of preventive consultations with external partners. The senior manager decided to merge some of these consultations. This reduces the number of consultations and allows partners to leverage each other’s expertise;
The IS diagram reveals that the school attendance and prevention officers are involved in a relatively high number of external work meetings. Work meetings do not focus on cases (i.e. young persons) but on higher-level issues (e.g. policy, professional-related issues). The senior manager decided to attend these work meetings personally rather than delegating this work to subordinates, allowing the school attendance and prevention officers to focus on the case load;
The school attendance and prevention officers are not consistently involved in the school cooperation networks that are centred in large secondary schools. Since such students from multiple municipalities enrol in these secondary schools, multiple school attendance and prevention officers are involved in these cooperation networks. The senior manager decided that clear agreements about participation and information-exchange between the different municipalities need to be made;
There is a clear division and sequence between the interactions of the school attendance officers and their administrative employees. The preparatory interactions of the administrative employees occur before the interactions of the school attendance officers. Such a division and sequence does not exist between the prevention officer and its administrative employee, which makes the responsibilities unclear. The senior manager decided to clarify the job descriptions for the work concerned with the 18-23 year olds.
The cluster SA confirmed that the IS diagram breaks the previous opacity of the HCP through an effective representation of its human interaction structure. The

Chapter 5
174
insights obtained from the IS diagram helped to prioritize and evaluate interactions, enabling more effective resource assignment and case management.
The AB diagrams of the eight employees were compared and analysed to identify deficiencies and to discover innovations. Differences were found in the behaviours of the employees in certain interactions. Some examples of innovations are:
School (Un)Enrolment interaction: the administrative employee working for one of the school attendance officers tries to retrieve any missing information on a school enrolment with the school through telephone. The administrative employee working for the other school attendance officer does not perform this activity, which increases the workload of the school attendance officer;
School Enrolment Exemption interaction: one of the school attendance officers always has a face-to-face conversation with the young person and his/her parent/caretakers before an exemption is granted. The goal is to warn and inform them about the consequences or impact of an exemption. In many cases, this motivates parents/caretakers to consider (previously unknown) options for alternative schooling. This activity is not executed by the other school attendance officer, which can impede the development of the given young person;
18-23 Dropout interaction: The prevention officer communicates with young persons in the age group 18-23 mainly by e-mail. This increases the response rate, as compared with paper mail. Other officers and employees can do the same.
Some examples of deficiencies are:
Relative School Absenteeism interaction: the school attendance officers do not close the absenteeism reports in the Student Administration system when they finish a case. It is important for case management to close all cases immediately;
Student Transport interaction: the employee student transport receives a call from the transport company when a young person has not been travelling a while. This care signal should be reported to the school attendance officer since it could indicate a social problem;
In all interactions with external partners or young persons, the school attendance and prevention officers make many handwritten notes. These are not entered in the Student Administration system. It is important to

A business process study of human collaboration
175
register all relevant data about young persons to be able to make informed decisions.
Based on the behaviour analysis, the cluster SA gained insight into the diversity of (local) behaviours of its employees in the modelled interactions. The senior manager decided to standardize the innovations and take out the deficiencies to increase the efficiency of the HCP.
5.6. Discussion
The interaction shortcoming
A real-life HCP, like the one studied in the municipality case study, consists of hundreds of tasks performed by numerous actors and has a complex interaction structure. The studied HCP is not an atypical HCP in the sense that one can expect to encounter similar organizational problems in other HCPs. The complexity of HCPs often grows to the extent that no one has a clear overview of the process. This is also the core of the organizational problem at the cluster SA.
A common approach to reduce the complexity of a process and provide structure to a model is to introduce modularity in the process definition. A good overview of modularity in process models is provided by (Reijers & Mendling, 2008). The authors explain that most popular process modelling techniques support modularity through the sub process concept. This concept uses task refinement to achieve modularity, that is, tasks can be detailed through sub processes on a lower level. In this way, task refinement enables the hierarchical structuring of complex business processes. The main advantages attributed to task refinement are enhanced understanding, ease of reuse, and scalability. Although task refinement reduces the complexity of a process through decomposition of tasks, the focus remains on task specification. Therefore, this approach does not address the interaction shortcoming. Another approach, not based on task refinement, is the work on proclets (Mans, Russell, van der Aalst, Bakker, Moleman, & Jaspers, 2010; van der Aalst, Barthelmess, Ellis, & Wainer, 2001), which partitions complex workflows into interacting lightweight workflows. Although this approach promotes interactions to first-class citizens, interaction is specified through message exchange. It has the same disadvantages as choreography models and interaction protocols discussed in Section 5.2.1. The interaction structure remains implicit and the focus is on the modelling of prescribed rather than actual collaboration. Therefore, the interaction shortcoming is not addressed in this approach either.

Chapter 5
176
In the TALL modelling language, the complexity of a HCP is addressed in the IS diagram where interaction is the primary unit of representation and analysis. The IS diagram separates the interaction specification from the task or activity specification. The interactions, the relations between interactions, and the participants for each interaction (i.e. agents and roles) are modelled on a higher level in a tree layout. This addresses the interaction shortcoming. The tree layout is not a diagrammatic convention but part of the formal syntax and semantics of the IS diagram (Stuit & Szirbik, 2009). Li, Hosking, and Grundy (2007) argue that trees are familiar abstractions for business modellers to manage complex relations because they support navigation, elision, and automatic layout in ways difficult to achieve with the workflow-based box-and-line representations. With TALL, the process designer can at first focus on the interactions in the HCP without being concerned with the tasks or activities (read: behaviours) of the agents. This allows a complex HCP to be made simpler. Effectively, the interactions in the IS diagram break the process in smaller related topics. This feature has been successfully applied in the municipality case study, and the IS diagram has shown to overcome the organizational problem with several desirable process insights. Moreover, the behaviour capture through interviews has been shown to benefit from this feature. The interactions in the IS diagram provided a starting point for the local agent behaviour specification. Overall, the two-phase modelling activity results in a clear separation between a HCP’s interaction structure and the behaviours exhibited by the agents to perform the interactions.
The local view shortcoming
Section 5.2.2 argues that existing graphical workflow-based process modelling languages do not capture and model explicitly the local behaviours (i.e. the operational process views) of the agents or actors. Several business process approaches reduce the complexity of a process model by the specification of multiple abstraction levels (e.g. public vs. private, business vs. technical) or views (e.g. data, resources, control flow, security). In literature, the latter are also referred to as process layers, aspects, or dimensions, which may be better designations to separate them clearly from the process views owned by individual actors or agents. Both dimensions and abstraction levels simplify a process definition through a separation of concerns (De Backer, Snoeck, Monsieur, Lemahieu, & Dedene, 2009) but do not capture and model process views as discussed in this chapter. Therefore, they do not address the local view shortcoming.

A business process study of human collaboration
177
In TALL, an AB diagram reflects the individual operational process view of the owner agent in a given interaction. It is at this level that local process variety or diversity occurs. King and Johnson (2006) confirm that traditional process modelling languages do not express process variety well. Through the AB diagrams, TALL allows to explore process diversity in the local behaviours of the agents. The practical results in Section 5.5 show that analysis of the AB diagrams identified several innovations and deficiencies on the behavioural level. The modeller can compare AB diagrams in their local interaction context. In other words, the modeller does not have to cross-analyse all AB diagrams but can focus on those AB diagrams that complete a certain interaction or play a certain role. This reduces the cognitive effort for the process analyst. In this way, the interaction construct serves as a container for the behaviours within it, providing good local context, and a good overview of all roles involved.
Section 5.2.2 also argues that in existing graphical workflow-based process modelling languages the (communicative) activities of different actors are not allowed to conflict. In contrast, the AB diagrams in a given interaction are allowed to conflict at design time. However, based on the local behaviour of an agent, there is no certainty that the behaviour(s) of the other agent(s) in the interaction are matching the behaviour of the agent. Meyer and Szirbik (2007a) discuss in more detail how non-aligned intended agent behaviours are dealt with at execution time. In the approaches that introduce modularity, the different modules are not allowed to conflict. The process designer makes the choice of what to do and when to do it in advance. Overall, through the AB diagrams, the TALL modelling languages overcomes the local view shortcoming.
An interesting finding from the municipality case study is that the employees performed a very thorough validation of the AB diagrams, which resulted in diagrams that are more precise. The reason is the personal, individual nature of these diagrams, which contain the employees’ own names. This created a sense of ownership of the models among the process participants, and fuelled their interest and involvement. This finding corroborates the finding in (Zacarias, Pinto, Magelhães, & Tribolet, 2009): subjects pay more attention, perform more thorough analysis, and engage in more in-depth discussions with diagrams with their name that reflect their actual work practices than when they work with generic and role-based task diagrams.
The identified modelling shortcomings are not exhaustive since they are based on a literature study only. The shortcomings should be seen as a first step in the

Chapter 5
178
identification of requirements for the proper graphical representation of HCPs. Other process modelling languages may exist that address some, all, or other modelling shortcomings. It is practically impossible to make an explicit comparison with all of them. Other research performed comparisons with several mainstream process modelling languages (Stuit & Szirbik, 2007). The main innovation of the TALL modelling language is the interaction-centricity of the language, which results from the agent-orientation. In the language, interaction is recognized as the core activity in collaborative organizational work and the starting point in the modelling effort. Moreover, the operational flow of the process is specified from each agent’s local viewpoint.
5.7. Conclusions
This chapter separates the interaction- and human-driven nature of HCPs from the task- and implementation-driven nature of workflow processes. Based on a study of relevant theory and research, modelling shortcomings of existing graphical workflow-based process modelling languages in their ability to represent human interactions and behaviours in a HCP are discussed. A case study application of a real-life HCP is presented to allow assessment of the effectiveness and utility of an interaction-centric business process modelling language. The application results demonstrate that the language effectively addresses the identified shortcomings and has practical utility. The specific properties of TALL generate desirable and actionable insights in the HCP after analysis of the modelled interaction structure and the modelled local behaviours of the agents that perform the interactions. The main contribution of this chapter is a practice of modelling and understanding a real-world collaboration.
Future work is directed towards the application of the TALL modelling language in other case studies to ensure utility among a wider range of HCPs. These future case studies are planned to include the application of workflow-based process modelling languages to demonstrate that these are less effective for the modelling of HCPs, as compared to TALL. This allows stronger claims of language effectiveness and suitability. Moreover, these studies enable empirical investigation and validation of the identified modelling shortcomings.

Chapter 6
Multi-view interaction modelling of human collaboration processes
This chapter is an edited version of the manuscript: Marco Stuit, Hans Wortmann, Nick Szirbik, and Jan Roodenburg. Multi-view interaction modelling of human collaboration processes: A business process study of head and neck cancer care in a Dutch academic hospital. Journal of Biomedical Informatics, Under Review (2nd round after Moderate Revision).

Chapter 6
180
Abstract
n the healthcare domain, human collaboration processes (HCPs), which consist of interactions between healthcare workers from different disciplines and departments, are of growing importance as healthcare delivery becomes
increasingly integrated. Existing workflow-based process modelling tools for healthcare process management, which are the most commonly applied, are not suited for healthcare HCPs mainly due to their focus on the definition of task sequences instead of the graphical description of human interactions.
This chapter uses a case study of a healthcare HCP at a Dutch academic hospital to evaluate a novel interaction-centric process modelling method. The HCP under study is the care pathway performed by the head and neck oncology team. The evaluation results show that the method brings innovative, effective, and useful features. First, it collects and formalizes the tacit domain knowledge of the interviewed healthcare workers in individual interaction diagrams. Second, the method automatically integrates these local diagrams into a single global interaction diagram that reflects the consolidated domain knowledge. Third, the case study illustrates how the method utilizes a graphical modelling language for effective tree-based description of interactions, their composition and routing relations, and their roles. An analysis of the global interaction diagram is shown to identify HCP improvement opportunities.
The proposed interaction-centric method has wider applicability since interactions are the core of most multidisciplinary patient-care processes. A discussion argues that, although (multidisciplinary) collaboration is in many cases not optimal in the healthcare domain, it is increasingly considered a necessity to increase integration, continuity, and quality of care. The proposed method is helpful to describe, analyse, and improve the functioning of healthcare collaboration.
I

Multi-view interaction modelling of human collaboration processes
181
6.1. Introduction
Nowadays, healthcare services require close collaboration of healthcare workers from different disciplines and departments. Improved support of healthcare collaboration through Information Technology (IT) is only possible if the essence of collaboration can be captured and understood (Andersson, Hallberg, & Timpka, 2003; Hägglund, Scandurra, & Kochab, 2010; Kane & Luz, 2006; Reddy, Bardram, & Gorman, 2009). This chapter contributes to the graphical description of healthcare collaboration to enable deep understanding of its functioning.
Business Process Management (BPM) is a prominent way to gain deep understanding of the functioning of organizations (Dalmaris, Tsui, Hall, & Smith, 2007). The graphical description of business processes in models (i.e. business process modelling) is the core concept in achieving this better understanding (Weske, 2007). In various industries and services, BPM is most commonly applied to workflow processes, which are procedural processes (Cull & Eldabi, 2010). Existing graphical workflow-based process modelling tools focus on the definition of the tasks and their ordering relations within the business process. Their primary purpose is to create a standard workflow model that is defined once and then serves as an executable specification for a workflow management system to enable automated process support (van der Aalst & van Hee, 2002). This chapter argues that such an approach does not suit the modelling of business processes that require intensive collaboration, so-called artistic (Hall & Johnson, 2009) or human-driven processes (Harrison-Broninski, 2010). In this research, such processes are defined as human collaboration processes (HCPs). A HCP is a coordinated collaboration effort where humans perform several related and intermittent workplace interactions, in which they may play different roles. Therefore, a HCP consists of a process structure of interactions. Examples of synchronous or asynchronous interactions are meetings, discussions, consultations, conversations etc.
Human interactions increasingly characterize the contemporary workplace, as the structure of organizations has become increasingly flatter, less hierarchical, more fluid, and even virtual (Gratton, 2004). This is also true for the healthcare domain where a move towards more flexible organizational structures with a focus on teamwork and collaboration can be observed (Brooks, 2006). For healthcare processes, a general distinction can be made between organizational processes (e.g. clinical workflows like medical order entry), and medical diagnosis and treatment processes (Mans, Russell, van der Aalst, Bakker, Moleman, & Jaspers, 2010). Reddy, Bardram, and Gorman (2009) name the latter multidisciplinary patient-care

Chapter 6
182
processes. These processes are good examples of HCPs since they require a wide range of interactions within and across (para)medical disciplines and departments in diagnosis and treatment (Lenz & Reichert, 2005; Mans, Russell, van der Aalst, Bakker, Moleman, & Jaspers, 2010; Wu, Wang, & Yun, 2009). For healthcare HCPs, the primary purpose of business process modelling is to capture and define accurately the essence of healthcare collaboration (i.e. the interaction structure) as a necessary precursor to analyse and improve the HCP. This requires novel modelling tools because of the different nature of the business activity (i.e. collaboration instead of task sequence).
This chapter introduces, applies, and evaluates a novel interaction-centric modelling method for HCPs through a case study (Dul & Hak, 2008; Yin, 2003) of a healthcare HCP at the University Medical Center Groningen (UMCG), the largest Dutch academic hospital. The healthcare HCP under study is the Head and Neck Oncology (HNO) care pathway28. In this HCP, numerous interactions take place between the different involved healthcare workers (a group named “the HNO team”). The HCP runs because of joint experience and collaboration, which brings on the execution of the interactions. However, the awareness about these interactions is based on tacit domain knowledge29. The result is that there is no explicit process definition of the target HCP’s interaction structure. Due to this, it has been very difficult for the HNO steering team to analyse and improve the HNO care pathway.
The proposed modelling method is the Multi-View Interaction Modelling (MVIM) method, which is designed to capture and model a HCP’s interaction structure (i.e. interactions, their composition and routing relations, and their roles). For the successful evaluation of the method in the case study, there are three main requirements. First, an effective interaction description capability is needed. Second, the MVIM method should be able to make explicit, in graphical models, the tacit domain knowledge of the HNO team members30. Third, the method should contribute to an improvement of the HNO care pathway.
28 A care pathway is a multidisciplinary outline of anticipated care, placed in an appropriate timeframe, to help a patient with a specific condition or set of symptoms move progressively through a clinical experience to positive outcomes (Middleton, Barnett, & Reeves, 2001). 29 Tacit domain knowledge is individual knowledge of experience, which is mainly intangible and often resides in the heads of employees (Chaffey & Wood, 2005). 30 The (internal) process of transformation of tacit knowledge into formal explicit knowledge is an important research subject in the field of Knowledge Management (KM). In this chapter, the focus is on the practical use of (interaction-centric) business process models that formalize tacit domain knowledge, not on the KM aspects.

Multi-view interaction modelling of human collaboration processes
183
The main contribution of this chapter is the MVIM method as a novel modelling tool and the evaluation of its effectiveness in practice. The remainder of this chapter is structured as follows. Section 6.2 provides theoretical background including related work. Next, Section 6.3 presents a description of the case study and the target healthcare HCP. Section 6.4 introduces the MVIM method and describes its application to the selected healthcare HCP (i.e. the HNO care pathway). After, Section 6.5 reports on the practical results. Section 6.6 reports on the evaluation of the proposed method. Section 6.7 presents a discussion with generalization and implications of the results in the broader healthcare domain. Finally, Section 6.8 gives conclusions and highlights future research.
6.2. Theoretical Background
6.2.1. The TALL modelling language
An interaction-centric business process modelling language named TALL (Stuit & Szirbik, 2007; Stuit & Szirbik, 2009; Stuit & Wortmann, 2010) supports the MVIM method. The language explicitly recognizes interaction as the core activity in collaborative organizational work. There are four main (agent-oriented) concepts in TALL: interactions, roles, agents, and behaviours. The interactions in a HCP are modelled in the Interaction Structure (IS) diagram (see Figure 6-1). The IS diagram is a hierarchical interaction structure, in which interactions are related by composition (one interaction being part of another) and routing (one interaction must be completed before, in parallel with, or instead of another interaction). The IS diagram has a tree layout, which means interactions appear at a certain level. The root level, which starts at the top, is level zero.
A parent interaction completes when its child interactions complete according to the specified routing relation. The routing relation is specified using a routing type symbol, which graphically appears below parent interactions (see Figure 6-1). Formally, the routing type is an attribute of the parent interaction. The supported routing types are sequential routing (SEQ), parallel routing (PAR), and exclusive (non-deterministic) choice (XOR). Decision rules can be attached to the routing types to enable rule-based execution of a set of sibling interactions. Decision rules can for instance be used to achieve an exclusive deterministic choice (XORd), or to make an inclusive choice for N-out-of-M sibling interactions. In the latter case, when N 2, the children are executed in sequence (SEQd) or in parallel (PARd). In Figure 6-1, interaction C is completed either by interaction D or by interaction E. The decision rule attached to the XORd routing type of interaction C selects only

Chapter 6
184
one of these interactions. The following is the complete list of interaction attributes: Id (unique identification), Label (interaction name), Routing Type (routing relation), Parent (Id of the interaction’s parent), and Children (number of children).
Figure 6-1. Graphical representation of TALL’s main modelling concepts.

Multi-view interaction modelling of human collaboration processes
185
For each elementary interaction (i.e. interactions without children in the tree), it is indicated which roles or generic participant types are involved. Roles are depicted by ellipses and are attached to the lines outgoing the hexagon (see Figure 6-1). In TALL, an interaction does not exist without at least two roles being bound to it (Stuit & Szirbik, 2007; Stuit, Szirbik, & Wortmann, 2007b; Stuit & Szirbik, 2009). The initiator role is the role that either starts or leads the interaction, and is identifiable by the role-interaction connector with a filled arrowhead (see Figure 6-1). Roles have two attributes: Label (role name) and Initiator (yes/no). The elementary interactions are completed by the coordinated execution of the behaviours performed by the agents playing the involved roles. Agents are depicted by rounded rectangles and their behaviours are depicted by arrow rectangles that appear at the tail of the agent-role connector (see Figure 6-1). Each arrow rectangle is a compact representation of an Agent Behaviour (AB) diagram, which describes the local activities that the agent executes as part of the interaction.
Besides the IS an AB diagrams, there are other types of diagrams in the TALL modelling language, which allow to capture other aspects of a HCP and its organizational environment. One of these diagrams, which is applied in this chapter (see Section 6.4.2), is the Agent Structure (AS) diagram to capture the structure of the organizational population under consideration. In this diagram, all involved business entities are modelled as agents whose nature can be individual (i.e. human agents) or collective (i.e. synthetic agents). Human agents represent people in the business domain, and synthetic agents represent organizational units (e.g. departments, teams) or organizations. A synthetic agent is a composite agent that consists of one or more internal (human or synthetic) member agents.
6.2.2. Related work
The MVIM method is a methodical approach to conduct a business process study. This section contrasts the method with several recent empirical business process studies in the healthcare domain through a discussion of traditional (workflow-based) process modelling methods and languages.
Traditionally, a business process study starts with a description phase to capture the AS-IS or current business processes. This phase usually consists of the following activities: (1) the business process modeller visits the target organization, (2) reads the existing documentation, (3) conducts a series of interviews, and (4) studies and represents the gathered information in process models (Barjis, 2009; Weske, 2007). The description phase is usually followed by an analysis phase to identify bottlenecks or improvement options in the AS-IS model. Finally, the

Chapter 6
186
redesign phase creates a TO-BE process model based on the results of the analysis phase and/or predefined objectives (e.g. to conform to a new corporate strategy, to suit a new IT system).
In BPM literature, most empirical business process studies are concerned with workflow processes. These studies are mostly technology-oriented works, which focus on the effectiveness or efficiency of workflow management systems (Houy, Fettke, & Loos, 2010). There are several recent healthcare process studies that take a workflow perspective (Abraham & Reddy, 2010; Brixey, Robinson, Turley, & Zhang, 2010; Hägglund, Scandurra, & Kochab, 2010; Huser, Peissig, Christensen, & Starren, 2010; Malhotra, Jordan, Shortliffe, & Patel, 2007; Mans, Russell, van der Aalst, Bakker, Moleman, & Jaspers, 2010; Reijers, Russell, van der Geer, & Krekels, 2010; Rojo, et al., 2008; Vankipuram, Kahol, Cohen, & Patel, 2010). In general, workflow-based process models are most useful when the business activity is procedural of nature (Kalpic & Bernus, 2002). However, as argued in 6.1, healthcare HCPs have a different nature and modelling purpose.
The main innovation of the MVIM method is the focus on the modelling of collaboration and interaction. In line with this focus, the proposed method differs from traditional task-centric methods, especially with regard to the nature of the activities in the description phase. In a HCP, different participants may have different views on the process. One of the characteristics of the HNO care pathway, described in Section 6.3.2, is the existence of local process views. Healthcare workers are knowledgeable about their interactions and responsibilities but do not have a complete view of the overall HCP. The HCP functions because the healthcare workers playing the roles in the interactions know themselves what to do. Thus, a HCP has an emergent bottom-up nature. Traditional methods do not model explicitly the local views of the process participants (Stuit & Wortmann, 2010). The MVIM method considers that not modelling the local views of the process participants (i.e. the subject matter experts) means losing the essence of what makes the process work. Thus, the MVIM method collects and models local interaction views in local IS diagrams, and then automatically consolidates them in a global IS diagram using an algorithm (see Section 6.4.1). This results in a model that minimizes the gap between the actual HCP and the modelled HCP, and provides a rich base for the analysis phase. The process participants are actively involved in the creation of the local IS diagrams. A local IS diagram is an individual diagram that depicts the local (i.e. incomplete and restricted) interaction view of a single process participant. It can be considered a segment of the HCP

Multi-view interaction modelling of human collaboration processes
187
under study. A global IS diagram does not take the point of view of a particular process participant but shows an integrated interaction view.
A common feature in most process modelling methods is the use of a graphical modelling language to describe business processes. The MVIM method is supported by the TALL modelling language. The language considers the interaction (performed by multiple actors) instead of the task (performed by a single actor) as the core activity in a business process. Previous research (Stuit & Wortmann, 2010) has shown that the graphical representation of interaction structures is weak in existing (task-centric) workflow-based modelling languages. This applies especially to large diagrams with increasing numbers of participants and interactions (Hommes, 2004). Several authors confirm that existing graphical workflow-based modelling languages are appropriate for modelling business processes that display complex task flows (i.e. workflow processes) but are less appropriate for modelling business processes that involve the interaction of a multitude of actors (i.e. HCPs) (Barjis, 2007; De Backer, Snoeck, Monsieur, Lemahieu, & Dedene, 2009; Hommes, 2004; Melão & Pidd, 2000; Ryu & Yücesan, 2007).
6.3. Case Study
6.3.1. Case description
Currently, in the Netherlands, approximately 2700 cases of head and neck cancer are diagnosed yearly and the incidence of this ailment has been rising over the past few decades (Brouha, Tromp, Koole, Hordijk, Winnubst, & de Leeuw, 2007). The main risk factors for the emergence of a tumour in the mouth, pharynx, or larynx are smoking, chewing tobacco, drinking alcohol, or a combination of these. Head and neck cancer is the work domain of both the ENT specialist (ear, nose, throat) and the maxillofacial surgeon. In the Netherlands, the care for head and neck cancer patients is organized into eight specialized treatment centres, one being the HNO team in the UMCG. A tumour in the head and neck area may have physical (e.g. problems with breathing, eating, drinking, speaking, damage to the physical appearance etc.), emotional, psychosocial, and relational effects for the patient and his/her key relatives. Because of the complexity of the care, a relatively large number of over 40 (para)medical disciplines is involved in the HNO care pathway, which together form a multidisciplinary team.

Chapter 6
188
The HNO team works according to national guidelines set up by a cooperation network named the Dutch Co-operative Head and Neck Group (NWHHT31) in which all eight Dutch HNO treatment centres participate. The primary goal of the NWHHT is to advance the quality of the HNO care in the Netherlands. The NWHHT not only develops guidelines but also performs internal evaluations by means of accreditations.
6.3.2. The HNO care pathway
The HNO care pathway deals with the human interactions in the outpatient and inpatient diagnosis, treatment and/or consultation, and follow-up of patients suffering from head or neck cancer once they are referred to the UMCG. Thus, the scope of the healthcare HCP under study is the intramural care within the UMCG for this specific patient group. On a high level, the studied interactions are of three generic types: (1) interactions between healthcare workers and patients (e.g. medical examinations, treatments, consultations), (2) interactions between colleagues within or across (para)medical disciples or departments (e.g. meetings, consultations, casuistry), and (3) interactions between healthcare workers and information systems (e.g. activity registration, activity planning, medical file processing). A maxillofacial surgeon oncologist and a business line manager, who are both members of the HNO steering team, served as key informants (Marshall, 1996) to investigate the HNO care pathway in more detail. The following distinctive characteristics of the HNO care pathway were identified. 1. The HNO care pathway is collaborative Head and neck cancer management requires close and seamless collaboration among the diagnostic and treating disciplines (Harrison, Sessions, & Hong, 2006). Healthcare workers rely on each other’s expertise, experience, and resources when making decisions with regard to patient care. A wide range of interactions within and across (para)medical disciplines and departments is required in terms of information sharing, consultation, and combined diagnosis and treatment (Lenz & Reichert, 2005; Mans, Russell, van der Aalst, Bakker, Moleman, & Jaspers, 2010; Wu, Wang, & Yun, 2009). In the HNO care pathway, even the simplest activities, like an endoscopy, require interaction among different disciplines.
31 http://www.nwhht.nl/

Multi-view interaction modelling of human collaboration processes
189
2. The HNO care pathway is multidisciplinary In multidisciplinary patient care, team members have different professional backgrounds and functional areas of expertise. Moreover, they are often concerned with different aspects of patient care and are involved in different phases of the care process. Distinctive properties of multidisciplinary collaboration are that (i) medical disciplines and their employees maintain their own identity in terms of their methodical approach, theoretical perspectives, responsibilities and focus areas (Pruyn, 2002), (ii) employees work relatively independently (Kane & Luz, 2006), and (iii) employees have differing perceptions of teamwork (Atwal & Caldwell, 2006; Pruyn, 2002). Based on these three properties, the HNO team members have their own local (i.e. restricted and incomplete) views. 3. The HNO care pathway is complex The HNO care pathway consists of a multitude of interactions in intricate arrangement. Interactions are interrelated in terms of both routing and composition. Interactions in and across (para)medical disciplines and/or departments may run in conjunction with each other, certain interactions may have to be completed before others, certain interactions may have to be repeated, and certain interactions may be part of other interactions. 4. The HNO care pathway is dynamic The tasks of the HNO team members are dynamic32. Due to newly discovered symptoms of a specific disease, the need for further diagnosis, or new medical knowledge, treatment plans must be tailored to the individual needs and circumstances of the patient. Moreover, they require frequent adjustment (e.g. to suit national guidelines) and joint decision-making (Lenz & Reichert, 2005; Wu, Wang, & Yun, 2009). 5. The HNO care pathway is large-scale The HNO care pathway involves healthcare workers from over 40 (para)medical disciplines and departments, and consists of over 400 identified interactions performed by over 120 team members.
32 In this context, dynamics refers to the stability or instability of the tasks in a business process. The tasks in a dynamic business process change frequently and unpredictably whereas the tasks in a static business process do not change very often; they either remain the same or change very slowly.

Chapter 6
190
6.4. Application of the Multi-View Interaction Modelling Method
6.4.1. Preliminaries
The MVIM method is a six-step process. Figure 6-2 graphically depicts the flow of the method. The first state of the method is a HCP without a process definition of its human interaction structure. The first step performs an analysis to scope the target business domain and to identify the human process participants (i.e. interviewees).
Figure 6-2. Graphical representation of the steps (represented by rectangles) and states (i.e. results of steps, represented by circles) in the multi-view interaction modelling method. Directed arrows connect the rectangles and circles to represent execution flow.

Multi-view interaction modelling of human collaboration processes
191
In steps 2a and 2b, interviews are performed to model the local interaction views of the process participants. This results in multiple local IS diagrams in which the tacit domain knowledge of the interviewees is formalized. The third step in the MVIM method automatically integrates the created local IS diagrams into a single global IS diagram using an algorithm, named the Global Construction Algorithm (GCA) (Stuit & Meyer, 2009). The fourth step performs face validation of the global IS diagram with (key) people from the business domain under consideration. The result after the fourth step is a global IS diagram that (1) defines the HCP under study in terms of its human interaction structure, and (2) correctly reflects reality and meets user expectations. The fifth step in the MVIM method reaps business value from the global IS diagram. In this research, the business value or practical results take the form of HCP improvement options. The implementation of the suggested improvements in the HNO care pathway (i.e. the execution of the sixth step in the MVIM method) is outside the scope of this research. For this reason, the state after the fifth step is indicated by a double circle to denote the final state (see Figure 6-2).
6.4.2. Business domain analysis
Based on organizational documentation and several key informant consultations, the relevant (para)medical disciplines/departments and role names (i.e. job titles) involved in the HNO care pathway were identified. Due to workload constraints, the HNO steering team required the researchers to make a selection of roles for the interviews in which local interaction views are collected and modelled. For example, the roles of nursing director and specialist were selected but not the roles of nurse and ward doctor. The remaining result was a list of 43 roles played by over 120 team members (i.e. there are multiple maxillofacial surgeon oncologists, multiple medical social workers, multiple dental hygienists etc.). It was considered sufficient by the HNO steering team to interview one representative of each selected role. Therefore, in the end, 43 interviewees were selected. Most of the selected interviewees are from the four main departments involved in the HNO care pathway: Maxillofacial Surgery (MFS), ENT Surgery (ENT), Radiotherapy (RT), and Medical Oncology (MO). For the other departments, a small fraction of the personnel is concerned with head and neck oncology. The selected interviewees are represented as human agents in an AS diagram of the HNO team (see Figure 6-3).

Chapter 6
192
Figure 6-3. The TALL Agent Structure diagram of the HNO team.

Multi-view interaction modelling of human collaboration processes
193
In Figure 6-3, triangle and circle icons, which appear in the top-left corner of the agent symbol, distinguish synthetic and human agents. The highest-level synthetic agent is the HNO team. The UMCG is organized de-centrally in six sectors (A to E). The second level of synthetic agents shows the four sectors. The third level of synthetic agents show the ten departments involved in the HNO care pathway. The MFS, ENT, and MO departments contain a fourth level of synthetic agents, which represent nursing wards, polyclinics, and specialist centres within departments. The other departments are polyclinical departments only (e.g. RT department) or are supportive departments (e.g. Department of Psychiatry). On the lowest level, Figure 6-3 shows the 43 selected human agents as members of the different departments. Normally, human agents are specified using name: role name (e.g. David Ross: Maxillofacial Surgeon Oncologist). Here, for confidentiality reasons, no person names are used. Therefore, all human agents in Figure 6-3 are depicted as anonymous instances (e.g. aMaxillofacial Surgeon Oncologist).
In the UMCG case study, a high-level IS diagram of the HNO care pathway was created based on organizational documentation and input of the key informants. Figure 6-4 and Figure 6-5 show this diagram33. The diagram depicts a general overview of the HNO care pathway in terms of its main default interactions, and served as input to the interviews with the following purposes: (i) it allowed to explain the TALL modelling notations to the interviewees, (ii) it allowed to explain, on a high level, the HNO care pathway to the interviewees (i.e. what is the planned patient journey), and (iii) it provided a starting point for the placement of the ‘local’ interactions of the interviewees, which is useful for large-scale HCPs like the HNO care pathway. The high-level IS diagram consists of the following default interactions:
1. Referral: the patient is referred to either the maxillofacial surgeon oncologist or the ENT specialist oncologist by the general practitioner, the dentist, or a specialist from another (regional) hospital;
2. Diagnostic Day: to limit the amount of hospital visits, the diagnostic examinations regarding a possible ailment are clustered on a diagnostic day at the polyclinic MFS or the polyclinic ENT. In the morning, the patient is seen by the specialist and several diagnostic examinations are performed (interaction Monodisciplinary Patient Intake). In the afternoon, specialists from the MFS, ENT, and RT departments examine the ailment in the
33 The original diagram is in Dutch. All interaction names have been translated from Dutch to English.

Chapter 6
194
interaction Multidisciplinary Patient Intake Polyclinic ENT. Based on this joint examination, the patient receives a treatment proposal at the end of the diagnostic day (interaction Preliminary Treatment Proposal);
3. Additional Diagnostics: additional diagnostics can consist of a radiology examination, a pathology examination, or additional clinical examination (e.g. an echo-guided puncture or biopsy, or an exploratory surgery under narcosis with endoscopy and possible dental extraction);
4. Cancer Staging: the maxillofacial surgeon oncologist or the ENT specialist oncologist performs the clinical staging of the tumour based on the available medical information;
5. Multidisciplinary Team Meeting: the HNO team meets to finalize the individual treatment plan based on the clinical, radiology, and pathology examinations. The treatment plan is verified with the HNO team from the Medical Center Leeuwarden in the interaction Teleconsulting Medical Center Leeuwarden. If needed, also a patient reconstruction plan is made together with the plastic surgeon (reconstructive surgery), implantologist (dental implant surgery), and the dentist from the centre of specialized dentistry (maxillofacial prosthetics) in the interaction Surgical Reconstruction Meeting;
6. Oncological Treatment: the basic treatments for head and neck cancer are (a) Surgical Treatment (maxillofacial or ENT surgery with or without reconstructive surgery), (b) Radiotherapy (primary or adjuvant treatment), (c) Chemotherapy, or (d) a combination of these like Chemoradiotherapy (primary or adjuvant treatment);
7. Follow-Up Care: regular follow-up is important after treatment to make sure the cancer has not returned or a secondary cancer has not developed. In most cases, the follow-up continues for a period of five years. The follow-up includes protocolized surgery hours and medical check-ups. Furthermore, it includes counselling and recovery/rehabilitation therapy by different paramedics.

Multi-view interaction modelling of human collaboration processes
195
Figure 6-4. The high-level IS diagram of the HNO care pathway, part one.

Chapter 6
196
Figure 6-5. The high-level IS diagram of the HNO care pathway, part two.

Multi-view interaction modelling of human collaboration processes
197
6.4.3. Capture and modelling of local interaction views
Two modellers conducted the interviews: the first author and a master student. A few days before the interviews took place, each interviewee received an email explaining the goal and focus of the interview, and the request to think about their (local) interactions in the HNO care pathway. The email also gave some typical examples of human interactions. All interviews were semi-structured interviews in which interview questions were not entirely pre-defined but general guidelines were followed (Patton, 2002).
Each healthcare worker was interviewed for about two hours. During each interview, the modeller started with an explanation of the TALL modelling notations using the high-level IS diagram. The interviewer then used the high-level IS diagram to facilitate a focused walkthrough discussion of the HNO care pathway. During the walkthrough, the interviewee was asked to name and describe his/her own interactions, relevant interactions of colleagues he/she knows of, composition and routing relations between the interactions, and the allocation of roles over the named interactions. In collaboration with the interviewee, the modeller then augmented the default interactions in the high-level IS diagram to make the collected domain knowledge explicit. This resulted in 43 local IS diagrams of the HNO care pathway, one for each interviewee. Each local IS diagram was immediately validated together with the interviewee. Since there was limited time during the interviews, the joint modelling was first done on paper. After, in the interviewer’s own time, each model was inserted into the TALL Visual Editor, a software tool to create and edit TALL diagrams (see Section 6.4.4), and saved as a local IS diagram. At this time, any uncertainties or ambiguities from the interviews were clarified with the key informants and processed in the local IS diagrams.
Figure 6-6 depicts one local IS diagram from the set of 43 diagrams34. This specific diagram depicts the local interaction view of the Radiotherapeutic Physicist. The (local) interactions in this diagram detail the interaction Pre-Treatment Period RT, one of the interactions in the high-level IS diagram of the HNO care pathway (see Figure 6-4 and Figure 6-5).
34 All original 43 local IS diagrams of the HNO care pathway are in Dutch. Thus, all interaction and role names in Figure 6-6 have been translated from Dutch to English.

Chapter 6
198
Figure 6-6. The local IS diagram of the Radiotherapeutic Physicist.
The pre-treatment period at RT is mainly concerned with the creation of a radiation treatment plan. The interaction structure in Figure 6-6 reveals that the Radiotherapeutic Physicist is concerned with the technical assessment of the radiation treatment plan (interaction Technical Assessment RT Treatment Plan),

Multi-view interaction modelling of human collaboration processes
199
which checks if the radiation machine can execute the plan. To complete this interaction, the Radiotherapeutic Physicist initiates several sequential child interactions: IMRT Measurement (transfer to and measurement of the radiation treatment plan on the radiation machine), IMRT Reporting (formal registration of the results of the IMRT measurement), and IMRT Completion. The latter interaction consists of two exclusive conditional interactions: a consultation with the Radiotherapist Oncologist in case any anomalies have been found during the IMRT measurement (interaction Consultation Technical Assessment RT) or a formal approval of the radiation treatment plan when no anomalies have been found (interaction IMRT Accordance).
Besides the above mentioned interactions, Figure 6-6 shows that the Radiotherapeutic Physicist is knowledgeable about three interactions that are performed by colleagues before the technical assessment of the radiation treatment plan:
Diagnostic Day RT: patient intake at RT by the Radiotherapist Oncologist;
RT Treatment Planning: creation of the radiation treatment plan by the Medical Dosimetrist based on the prescription of the Radiotherapist Oncologist;
RT Treatment Plan Assessment: functional assessment of the radiation treatment plan by the Radiotherapist Oncologist.
Finally, Figure 6-6 shows that the Radiotherapeutic Physicist is involved in the interaction Radiation Treatment Plan Meeting. In this meeting, which is led by the Radiotherapist Oncologist (see the initiator role in Figure 6-6), radiation treatment plans are presented and double-checked before radiation treatment actually starts. The roles in Figure 6-6 depict the generic interaction participants the Radiotherapeutic Physicist knows of. The role OIS RT stands for Oncology Information System Radiotherapy. In the TALL modelling language, an information system can be represented as an interaction participant (Stuit & Szirbik, 2009).
Each local IS diagram represents a specific local (incomplete) part of the overall HCP, which complement each other. The other 42 local IS diagrams detail other parts. For example, with regard to the pre-treatment period at RT, the local IS diagram of the Employee Care Administration RT is more specific about the interactions that occur during the diagnostic day at RT. Similarly, the local IS diagram of the Medical Dosimetrist is more specific about the treatment planning at RT. Depending on the interviewee and its (para)medical discipline or

Chapter 6
200
department, the other 42 local IS diagrams detail other treatments and phases in the HNO care pathway. All 43 local IS diagrams can be downloaded together with the TALL Visual Editor, which is discussed in the next section.
6.4.4. Integration of local interaction views
The MVIM method utilizes GCA to automatically integrate multiple local IS diagrams into a single global IS diagram. GCA integrates interactions, their relations, their roles, and their attributes. It can integrate complementary or alternative interaction structures (i.e. differences in local IS diagrams), and merge overlapping interaction structures (i.e. commonalities in local IS diagrams). A detailed technical description of the workings of GCA is provided in (Stuit & Meyer, 2009).
A software toolset supports the MVIM method. The TALL Visual Editor allows the user to build and manipulate TALL diagrams. The editor stores TALL diagrams and its modelling elements in an associated database. A software tool that implements GCA, named Local IS Integrator (LISI), has been developed. LISI operates on the database created by the Visual Editor. With LISI, the user can integrate a selected number of local IS diagrams into a single global IS diagram, which the tool saves as an additional diagram in the database. The user can then load the database in the Visual Editor to visualize the global IS diagram. Figure 6-7 shows the main user interface of LISI.
Figure 6-7. The user interface of the integrator for local IS diagrams.

Multi-view interaction modelling of human collaboration processes
201
The 43 local IS diagrams of the HNO care pathway were integrated using LISI. Figure 6-8 shows a screenshot of the Visual Editor with a fragment of the produced global IS diagram of the HNO care pathway. The complete global IS diagram consists of 410 unique interactions and 157 unique roles, and is included in the download of the Visual Editor. Note that, all original case study diagrams (i.e. the local and the global IS diagrams), which are available online, are in Dutch. All software tools are freely available from the software section on http://www.agentlab.nl/.
Figure 6-8. The global IS diagram of the HNO care pathway in the TALL Visual Editor.
A business process modelling activity is usually followed by a validation activity to check whether the model reflects reality (Weske, 2007). The researchers organized a face validation session with the key informants (i.e. the fourth step of the MVIM method, see Figure 6-2). Face validation uses expert opinion to review if a model accurately reflects reality and meets user expectations (Illgen & Gledhill, 2001; Pace, 2004; Sargent, 2007). During the face validation session, which lasted four hours, a walkthrough of the global IS diagram of the HNO care pathway was performed. The walkthrough encompassed how a patient flows through the various modelled interactions. The researchers were interrupted by the two key informants when they saw mistakes or omissions in the global IS diagram. This led to some new interactions being added. Moreover, minor changes were made to the routing,

Chapter 6
202
composition, and role assignment of existing interactions. All feedback was processed live in the global IS diagram using the TALL Visual Editor. The key informants also indicated redundant interactions, which were the result of ontology conflicts (Shvaiko & Euzenat, 2008). In GCA, interactions and roles are candidates for merging when their labels are identical. However, different interviewees may use different (medical) terms or terminology for the same interactions and roles. A simple example from the UMCG case study is the interaction Morning Nursing Ward Meeting, which was named Morning Patient Discussion by some interviewees. In only a few cases, the key informants found redundant interactions.
6.5. Business Value: Practical Results
The global IS diagram provides an integrated end-to-end overview of the interactions in the HNO care pathway. Now that the interactions in the HNO care pathway are defined in a model, the HNO care pathway becomes amenable to analysis. Business value can be reaped from the global IS diagram, by using it to discover HCP improvement options. This section realizes two model purposes of the global IS diagram, which generate business value.
6.5.1. Compliance analysis
As mentioned in Section 6.3.1, the HNO team participates in the NWHHT, whose primary goal is to improve the quality of the HNO care in the Netherlands. The HNO team strives to comply with the NWHHT guidelines to remain an acknowledged and certified HNO treatment centre. Moreover, the HNO team realizes strongly that the improvement of the HNO care pathway is a continuous process. In the healthcare domain, quality of care is often associated to and determined by the needs of the patient. A recent report from two Dutch HNO patient associations (Offerman & Pruyn, 2009), written in cooperation with the NWHHT, formulates quality criteria from the patients’ viewpoint (from now on: the HNO report). Table 6-1 presents ten quality criteria from the HNO report based on the scope of this chapter’s study.

Multi-view interaction modelling of human collaboration processes
203
Table 6-1. The quality criteria that are input to the compliance analysis. 1. Systematic screening of patient symptoms and complaints, and referral to the appropriate medical
professional or paramedic in an early stadium throughout all phases of the care pathway35;
2. All patients are offered adequate follow‐up care: 3. tailored recovery‐ and rehabilitation therapy is offered; 4. adequate referral and transfer to primary care in the home environment. 5. Every (non‐critical) HNO patient is proposed an individual treatment plan, which has been discussed in a
multidisciplinary meeting before treatment starts; 6. The specialist or doctor informs the patient and his/her key relatives about the results of the oncological
treatment immediately after the treatment; 7. Throughout all phases of the care pathway, it is clear to the patient and his/her key relatives who their
contact person is in case of questions and/or problems; 8. Key relatives are involved as much as possible based on the wishes of the patient. If needed, key relatives
receive professional support; 9. Prior to patient discharge, a concluding consultation with the (oncology) nurse and/or ward doctor takes
place; 10. The possibility of a visit by a fellow sufferer (i.e. ex‐patient) is pro‐actively brought to the attention of the
patient; 11. To minimize patient hospital visits, diagnostic examinations are clustered on one day and location as much
as possible; 12. Good coordination and (digital) information‐exchange takes place between healthcare workers. Clinicians
have 24‐hour direct access to relevant medical data and reports.
Compliance management or regulatory compliance is about the need of organizations to check their compliance with relevant laws, regulations, and procedures (Rozinat, de Jong, Günther, & van der Aalst, 2009). A compliance analysis is used to investigate compliance of the HNO care pathway with the quality criteria in Table 6-1. For each quality criterion, the compliance analysis identifies (lack of) relevant interaction structures in the global IS diagram of the HNO care pathway. Then, it makes a statement about compliance and suggests organization improvement actions when necessary. To verify the statements about compliance with the quality criteria, key informant consultations were used to discuss and illuminate the identified interaction structures, and make sure that useful improvements are suggested. For confidentiality reasons, the full compliance analysis is not included in this chapter. In general, the compliance analysis reveals that the HNO care pathway is a coordinated and integrated whole of interactions. However, for some of the quality criteria, improvement actions are suggested. For these criteria, Table 6-2 presents a summary of the results of the compliance analysis, the key informant consultations, and the suggested improvement actions.
35 Diagnostic phase, hospitalization/treatment phase, and follow-up phase.

Chapter 6
204
Table 6-2. Details of the Practical Results. Quality Criterion From Table 6‐1
Suggested Improvement Actions
1 The following paramedics are present in the HNO team: Dietician (for nutrition and weight problems), Medical Social Worker and Nurse Practitioner Psychiatry (for psychosocial problems), Pastoral Counsellor (for spiritual and religious problems), Discharge Liaison Nurse (for home care management), Speech Therapist (for speech and swallowing problems), Physiotherapist (for problems with the locomotor apparatus), Dental Hygienist (for oral and dental care). The global IS diagram of the HNO care pathway shows that interactions between paramedics and patients are most prominent in the hospitalization/treatment and follow‐up phases. Thus, paramedics are not systematically involved in the diagnostic phase and depend on the judgment of the physicians and nurses for referral. However, these healthcare workers are not educated to make adequate paramedical diagnoses. The suggested improvement action, on the longer term, is to bring forward and/or protocolize the paramedic process, preferably on the first diagnostic day. This allows paramedics to filter out more patients and initiate timely counselling and/or therapy. This applies especially to the following paramedics:
Pastoral Counsellor: the pastoral assessment is protocolized for ENT patients with laryngeal cancer during pre‐operative hospitalization. For other patients, spiritual or religious problems are to be diagnosed by the physicians or nurses;
Medical Social Worker Sector B: there is insufficient insight into the psychosocial needs of non‐surgical ENT patients (e.g. primary RT patients). After referral to RT by the lead clinician, the medical social worker in Sector B often never sees them again. There is no dedicated medical social worker in Sector D (i.e. RT);
Discharge Liaison Nurse Sector B: for MFS and ENT patients, this nurse arranges home care during hospitalization close to patient discharge. In this way, home care needs of patients who are not hospitalized or who require home care before hospitalization are not property assessed;
Dietician Sector B: the ward nurse screens the MFS and ENT patients during the admission conversation using the MUST (Malnutrition Universal Screening Tool). This screening is not performed at the diagnostic day, which means dietary consultations may be scheduled too late;
It is hard to protocolize the paramedic process for all patients because of the large population. Therefore, the suggested organization improvement action, on the short term, is the systematic use of screening lists by physicians and nurses in all phases of the care pathway. Screening lists allow patients to ‘self‐screen’ themselves and communicate their needs to healthcare workers. These lists help to clarify and sharpen referral criteria, especially in the diagnostic phase.
2 The global IS diagram of the HNO care pathway shows that follow‐up care is well organized with regular doctor‐patient (i.e. medical check‐ups) and paramedic‐patient interactions. Patients are mostly treated in‐house to provide adequate follow‐up care. Referral to primary healthcare in the home environment is only done when travel distance or patient conditions inhibit frequent treatment by the HNO team. The global IS diagram shows that several, but not all, paramedic‐patient interactions run in parallel with the doctor‐patient interactions. The suggested improvement action is to improve alignment and coordination during follow‐up care to reduce patient hospital visits. There are currently initiatives to set up a joint polyclinic for the MFS, ENT, and RT departments.
5 During periods at specific departments, the global IS diagram includes several interactions between specialist nurses and patients to provide overall guidance. It is clear to the patient whom to contact during these periods. However, during transfer from one to another department, which is often a home period, it is not clear whom to contact. The suggested improvement action is to appoint a case manager at the first diagnostic day who remains the primary contact person throughout the entire care pathway.
9 The global IS diagram of the HNO care pathway shows that most diagnostic examinations are clustered on the first diagnostic day. This successfully reduces the number of patient hospital visits.

Multi-view interaction modelling of human collaboration processes
205
Some diagnostic examinations, especially medical imaging, are not performed on the first diagnostic day. Delays occur because demand is bigger than supply. This makes it difficult to finalize the treatment plan for the patient in a timely fashion. The suggested improvement action is to arrange fixed time slots for medical imaging. Another suggested improvement action is to ask maxillofacial surgeons and ENT specialists in regional hospitals, from where some patients are referred, to perform and share medical imaging results.
10 Analysis of the roles in the global IS diagram of the HNO care pathway reveals that IT systems are used for digital reporting and appointment scheduling. However, the inserted information is quite limited, especially in the diagnostic phase. Thus, important medical information (e.g. medical history, medication, preliminary treatment, home situation, psychosocial problems etc.) is not available for all disciplines from the start. This is ineffective especially when medical decisions have to be made. For example, in the case of adjuvant radiotherapy after maxillofacial surgery, RT would like to be able to examine all medical information collected in the diagnostic and treatment period at MFS. The suggested improvement action is to improve reporting and information sharing across disciplines. This avoids needless repetition of anamnesis. There are currently initiatives to protocolize the timely availability of medical information.
The global IS diagram reveals that the hospital‐wide appointment scheduling system is not involved in the interactions at RT. The complex radiation planning procedures and schemes require the use of proprietary systems. The result is that other disciplines cannot effectively follow RT patients and/or cluster appointments during combined treatment. This is especially important for MO in the case of chemoradiotherapy and for the dental hygienists from MFS, who have daily interactions with the RT patients for oral and dental care during radiation treatment. The suggested improvement action on the long term is to investigate the suitability of the appointment scheduling system for use at RT. On the short term, the suggested improvement action is to give a selection of personnel access to the proprietary systems of RT.
6.5.2. Communication and training
Currently, the HNO team members have their own local views of the HNO care pathway. The global IS diagram of the HNO care pathway reflects the formalized and consolidated domain knowledge or understanding of the interviewed HNO team members. The business value of the global IS diagram is its ability to communicate that understanding to all healthcare workers (and any other stakeholders). It is important for all involved healthcare workers to have a good understanding of the interaction structure of the HNO care pathway because:
to improve coordination, integration, and continuity of care, it is important that healthcare workers understand the interactions and responsibilities of colleagues both within and across (para)medical disciplines and departments (i.e. who delivers which care and when);
to better assess a patient’s needs and emotional condition, and to improve quality of care, it is important that healthcare workers understand the patient’s complete journey through the care pathway.
The suggested organization improvement action is to make HNO team members knowledgeable of the HNO care pathway via the global IS diagram. Ideally, this is part of a training course for (new) healthcare workers. The business value of such a training course is that employees are better informed in individual patient contact

Chapter 6
206
and in interactions with colleagues. Moreover, employees are in a better position to participate in process improvement projects or even to implement (local) improvements in daily work practice themselves.
6.6. Evaluation
According to Hevner, March, Park, and Ram (2004), a design solution is effective when it satisfies the requirements and constraints of the problem it was meant to solve. The objective of this chapter was to introduce and apply a novel modelling method that fits the HNO care pathway, and addresses the organizational problem. The core of the organizational problem is the implicit interaction structure of the HNO care pathway, and the resulting lack of a proper basis for its analysis and improvement. The evaluation described in this section is a reflection on the effectiveness of the (application of the) MVIM method. The requirements put forward in Section 6.1 and the characteristics of the HNO care pathway listed in Section 6.3.2 are used as measures for the success of the evaluation.
The first requirement is that the MVIM method should be able to describe the interaction structure of the HNO care pathway. The interaction-centricity of the MVIM method, which is the result of the use of the TALL modelling language, proved advantageous in the case application. This because the focus of the modelling effort was to describe the interactions between the healthcare workers rather than the development of a step-by-step task model. Thus, the TALL modelling language proved well suited for the description of the target HCP’s interaction structure. In this regard, the language suits the collaborative nature of the HNO care pathway (characteristic one). In particular, the tree layout of the IS diagram, with the possibility to specify different routings between interactions, proved an effective way to tackle the complexity of the HNO care pathway (characteristic three). This confirms previous research into the effectiveness of tree-based representations (Li, Hosking, & Grundy, 2007; Tsay, Wu, & Jeng, 2009). Moreover, the interaction-centricity enabled the modellers to focus on the essential interactions in the HNO care pathway, which are more stable. In other words, the interaction specification is independent of the dynamic realization of the interactions through the execution of individual tasks. In this way, the IS diagram allows to specify ‘what’ to perform without specifying ‘how’ to perform it. This allowed to address the dynamic nature of the HNO care pathway (characteristic four).

Multi-view interaction modelling of human collaboration processes
207
The second requirement is that the MVIM method should facilitate the externalisation and formalization of the tacit domain knowledge of the HNO team members in graphical process models. The multi-view support provided the ability to capture and model the local interaction views of the interviewed HNO team members in 43 local IS diagrams. Since the TALL modelling effort starts from a local viewpoint, the MVIM method is a decentralized modelling method. This matches the multidisciplinary (i.e. decentralized) nature of the HNO care pathway (characteristic two). Moreover, the multi-view support provided the following benefits in addressing the complexity of the HNO care pathway (characteristic three):
The modeller(s) could focus on segments (i.e. local IS diagrams), which were later automatically integrated to form a whole (i.e. global IS diagram). This divide-and-conquer strategy proved effective in practice;
The interviews took the form of ‘mini-workshops’ in which the modeller created each local IS diagram in active cooperation with the interviewee. This had the advantage of immediate validation. Moreover, the modeller did not have to create the local IS diagrams alone;
The individual nature of the local IS diagrams created a sense of ownership among the interviewees. This fuelled their interest and involvement, which led to diagrams that are more precise.
The automatic integration of the 43 local IS diagrams into a single global IS diagram of the HNO care pathway provided the following benefits:
Two modellers used interviews to create the 43 local IS diagrams as input for GCA. There was no need for the modellers to discuss or agree with each other. In theory, an entire team of process modellers, who work independently and concurrently, can execute the modelling effort. This is especially useful for large-scale HCPs (characteristic five);
The integration of the 43 local IS diagrams was done by GCA, an unbiased algorithm, instead of being done by a human modeller. This ensured that all local interaction views were properly consolidated in the global IS diagram.
The third requirement is that the application of the MVIM method should contribute to an improvement of the HNO care pathway. The practical results in Section 6.5 demonstrate that the global IS diagram brings business value.
The reflection above reveals that the MVIM method suits the characteristics of the HNO care pathway and meets the requirements set out in advance. The MVIM

Chapter 6
208
method successfully brings explicitness to the HNO care pathway in terms of the proper capture and modelling of its interaction structure, which opened up the door for proper analysis and improvement.
6.7. Discussion
The healthcare HCP studied in the UMCG case study is representative of other medical diagnosis and treatment processes, which are concerned with patients with a chronic disease. In such HCPs, healthcare workers are motivated or pressured to collaborate in a multidisciplinary team for effective long-term treatment. There is a trend to organize such processes in care pathways (Panella, Vanhaecht, & Sermeus, 2009; Walshe & Smith, 2006). Although other healthcare HCPs might differ in the degree of complexity and scale, in general, they share the characteristics of the HNO care pathway: collaborative, multidisciplinary, complex, dynamic, and large-scale. Thus, the MVIM method can be beneficial in the broader healthcare domain.
Multidisciplinary collaboration is not self-evident in the healthcare domain (Pruyn, 2002). The details of the practical results in Table 6-2 show that multidisciplinary collaboration is not always effective in the HNO care pathway, especially in the transfer periods between different (para)medical disciplines or departments. However, both medical professionals and patient organizations increasingly consider multidisciplinary collaboration a necessity to increase quality of care. In line with this development, there is a move towards more flexible organizational structures with a focus on teamwork and healthcare collaboration (Brooks, 2006). The interest of the HNO steering team in the current research shows that initiatives to improve healthcare collaboration are considered important.
The collaborative nature of healthcare HCPs is characterized by less certainty, more ambiguity, and more complexity. To facilitate the improvement of healthcare HCPs, modelling tools that suit their nature are needed to make them explicit and amenable to analysis. To make healthcare HCPs explicit, the tacit domain knowledge of the involved healthcare workers needs to be made explicit (in models). The MVIM method can be used for this purpose. The paradigm shift towards interaction-centric process design may have implications for healthcare practice and management, and the possible future (re)design of healthcare systems:
structural implications: blurring of organizational boundaries;
decisional implications: changing planning and management systems;
financial implications: changing funding mechanisms, budget cycles, and resource flows;
Multi-view interaction modelling of human collaboration processes
209
professional implications: changing roles and responsibilities. A perceived limitation in the UMCG case study was the imposed constraint to select one representative from a subset of roles for the interviews. This may have posed the risk that valuable (tacit) domain knowledge was not collected and therefore the global IS diagram is less accurate. In the UMCG case study, this limitation was addressed through face validation of the global IS diagram with the key informants. Still, even the key informants have local (i.e. restricted) views. Therefore, the MVIM method is most advantageous when the business domain under consideration allows all (relevant) healthcare workers to be interviewed.
6.8. Conclusions
In the healthcare domain, HCPs require interaction between healthcare workers from different (para)medical units in both diagnosis and treatment. Typical healthcare HCPs are concerned with effective long-term treatment of patients with a chronic disease. Healthcare HCPs are an essential part of modern healthcare organizations, hospitals in particular. Thus, it is important for managers to have a deep understanding of the functioning of HCPs, as a necessary precursor to improve their effectiveness and/or to develop IT for their support. A common way to increase understanding of processes is to conduct a business process study in which a business process is defined in a model using a graphical modelling language, and the model is analysed to identify improvement opportunities. This chapter argues that the representation of human interaction structures is weak in existing workflow-based process modelling tools, which are most commonly applied in healthcare process management. These tools are most effective when the business activity is procedural of nature (e.g. clinical workflows). As a result, workflow models usually focus on the task (performed by a single actor) instead of the interaction (performed by multiple actors).
This chapter reports on a business process study of a healthcare HCP at a Dutch academic hospital in which a novel Multi-View Interaction Modelling method is introduced, applied, and evaluated. The MVIM method utilizes the interaction-centric TALL process modelling language to describe the target HCP’s human interaction structure (i.e. the interactions, their composition and routing relations, and their roles). The selected healthcare HCP is the head and neck oncology care pathway in which a multidisciplinary team of healthcare workers from over 40 (para)medical disciplines collaborate. The addressed organizational problem is that there is no process definition and managerial awareness of the interactions in the

Chapter 6
210
selected healthcare HCP. As a result, there is no proper basis for process analysis and improvement. Improvement is considered important to increase integration, continuity, and quality of the provided care.
The interaction-centricity of the MVIM method, which is the result of the use of the TALL modelling language, matches the different nature of the business activity in (healthcare) HCPs (i.e. collaboration instead of task sequence). The evaluation results show that the method is a useful and effective tool to capture and model the target HCP’s human interaction structure. In the medical profession, healthcare workers develop specialized (tacit) domain knowledge within their own functional areas. Besides the effective description capability, the MVIM method is proven effective to (1) collect and formalize the tacit domain knowledge of the interviewed healthcare workers in local (i.e. individual) interaction diagrams and (2) generate automatically a single integrated global interaction diagram based on the local interaction diagrams. In this way, the method takes advantage of the distributed knowledge of the subject matter experts, which leads to a more accurate and complete global interaction diagram. Subsequent qualitative interaction analysis of the global interaction diagram demonstrates its business value through the identification of several desirable improvement opportunities. Based on its identified characteristics, this chapter concludes that the studied healthcare HCP is representative of other healthcare HCPs and/or care pathways. Thus, the MVIM method is expected to be useful in the broader healthcare domain. When used more widely, interaction-centric modelling tools like the MVIM method may have implications for the (re)organization and management of (future) healthcare systems.
The next step with the MVIM method is to strengthen the evaluation through crosschecking and replication of the successful results from the hospital case study. Although the HCP studied in this paper is not atypical, other cases from both the healthcare domain and other domains need to be performed. This allows to examine the method’s capabilities, and to improve and/or extend its design. One of the goals is to explore the use of other data collection methods for the interaction capture from the human process participants. When the MVIM method is to be useful to organizations over a longer period, it should be possible to quickly update the global interaction diagram to reflect new (local) work practices. To achieve this, the local IS diagrams can be maintained by the organization and updated when (local) change occurs. A new global IS diagram can then be automatically generated using the MVIM method. Overall, all the TALL diagrams should be easy

Multi-view interaction modelling of human collaboration processes
211
to maintain, inspect, use, change, compare, and integrate. Therefore, future research will focus on the development of an interactive (multi-user) diagram management system, which includes the current diagram editor and integrator for local IS diagrams. As an extension, this system may use the global IS diagram to monitor the execution of the interactions in a given HCP. In this context, a log of an executed HCP can contain various temporal data like interaction start and end times. Such data can be used for quantitative analysis to identify and address bottlenecks and delays. To support such an analysis, future work plans to develop a time-based visualization for the TALL IS diagrams, in which interactions are laid out on a time axis. The TALL modelling language is already extended with temporal interaction attributes.

Chapter 6
212

Chapter 7
Discussion & Conclusions

Chapter 7
214
he research objective of this thesis (as stated in Section 1.3) was to present, apply, and develop the TALL modelling approach for human collaboration processes (HCPs), and to evaluate its effectiveness and practical utility in
real-life business settings. In the previous chapters, the theoretical and practical results to achieve this research objective have been presented. The approach consists of the following developed components and their supporting software tools:
1. The TALL modelling language and the Visual Editor (all chapters); 2. The design-time verification method and TALL2HCPN (Chapter 2); 3. The global construction algorithm and Local IS Integrator (Chapter 3); 4. The e-mail interaction mining method and E-mail Interaction Miner
(Chapter 4); 5. The two-phase modelling method for local agent behaviour specification
and analysis within a HCP’s interactions (Chapter 5); 6. The multi-view interaction modelling method and Local IS Integrator
(Chapter 6); 7. The set of TALL modelling guidelines: a list of modelling activities that
relates the language and methods above in order to support modellers in the usage and application of the approach (this chapter).
The corresponding chapters presented and applied these artefacts. All the method artefacts (i.e. list items 2 to 7) utilize the TALL modelling language for the graphical description of HCPs.
In Section 7.1, this chapter reflects on the three evaluation case studies in Chapter 4, Chapter 5, and Chapter 6 with a cross-case analysis. Based on this analysis, several scientific statements about the TALL modelling approach are made. After, Section 7.2 presents the set of TALL modelling guidelines. Finally, Section 7.3 concludes this thesis with a discussion of the main research contributions and possible directions for future research.
7.1. Cross-Case Analysis
The focus in the three evaluation case studies was primarily at demonstrating the situated utility of the TALL modelling approach in the local business context of the particular cases. This orientation is consistent with the adopted research methodology that integrates case study research and design science research (see Section 1.5), which both have an applied orientation. The knowledge generated in individual cases can be generalized based on reflection and cross-case analyses
T

Discussion & Conclusions
215
(van Aken, 2004). A cross-case analysis is theory-oriented in the sense that (evaluation) results from multiple cases are analysed to contribute to the robustness and generalizability of a theoretical statement or explanation (Dul & Hak, 2008). Based on a cross-case analysis of the three evaluation case studies, this thesis makes the following scientific statements.
Statement 1: The TALL modelling approach allows effective identification and modelling of HCPs in organizations (condition X), which enables valuable analysis (effect Y). This statement expresses a sufficient condition: “if there is X then there is Y”. The three evaluation case studies show that the TALL modelling approach successfully and effectively models the three selected HCPs (i.e. condition X is present in each case). Furthermore, the approach generates actionable managerial insights in the form of HCP improvement opportunities after analysis of the TALL diagrams (i.e. effect Y is present in each case). This proves the practical utility of the approach and provides evidence that the statement is correct. However, since the statement expresses a sufficient (but not a necessary) condition, effect Y can have other causes or conditions (even if the statement is true). Moreover, future empirical evidence may reveal that effect Y does not always occur, which would contradict the statement. Thus, the evaluation results corroborate (but not prove) that condition X is a sufficient cause for effect Y. Nevertheless, the support found for the statement in three separate case studies enhances the degree of confidence that the statement is correct and applies to the entire theoretical domain.
The theoretical domain is the universe of instances of the object of study for which the statement is believed to be true (Dul & Hak, 2008). From this domain, specific cases are selected. In this thesis, the theoretical domain is formed by HCPs in organizations. The main object of study is human interactions in HCPs. For practical reasons (i.e. ease of access, time and resource constraints), the cases were selected from a geographically bounded subdomain, that is, HCPs in Dutch organizations. As mentioned in Section 1.5.1, an exploration of practice was performed in the initial phases of each case study. The goal of this exploration was to confirm the relevance of the case for this research. The main case selection criterion was the existence of (organizational) problems related to human interaction structures. In each of the three evaluation case studies, the human interaction structure in a specific business activity was not properly defined, which

Chapter 7
216
inhibited proper HCP management, analysis, and improvement. The result was the selection of HCPs in three different sectors: Private Sector: evaluation case study at Gasunie Transport Services Inc.
(Chapter 4); Public Sector: evaluation case study at the Municipality of Oldambt (Chapter
5); Healthcare Sector: evaluation case study at the University Medical Center
Groningen (Chapter 6). In selecting these cases, no defined selection criteria in terms of the type (e.g. synchronous/asynchronous, verbal/non-verbal, physical/virtual), form (e.g. discussion, conversation, consultation), or scope (intra-/inter-organizational) of human interactions were used. As a result, the interactions modelled within the three cases are very diverse. The advantage of the diversity in interactions is that the TALL modelling approach has been applied to identify and model a large number of human interactions, which enabled proper testing of its abilities. The TALL Interaction Structure (IS) diagrams in each of the cases contain a mix of interaction types and forms, in many cases with participants from different organizations. An exception, in terms of the diversity of interaction types and forms, is the evaluation case study in Chapter 4 in which all modelled interactions are e-mail interactions. Thus, in this case study, all interactions are asynchronous conversations. In the other evaluation case studies, the diversity in interactions is the result of the relatively broad definition of human interaction. According to the definition provided in Section 1.2, any reciprocal business act between two or more roles that is directed towards a common goal or benefit is an interaction. Future research intends to define more clearly what can and cannot be considered a human interaction (see Section 7.3.2).
Statement 2: The TALL modelling approach can be useful to identify, model, analyse, and improve HCPs in other organizations as well - this research topic deserves further scientific and practical investigation. The positive evaluation results in the three cases from three different sectors prove that organizational problems related to HCPs are not constrained to specific business domains and are likely to exist in other organizations as well. Multiple cases clarify that a finding or phenomenon is not idiosyncratic to a single case (Eisenhardt, 2007). Therefore, it is reasonable to expect that the interaction-centric
Discussion & Conclusions
217
TALL modelling approach can be useful to identify, model, analyse, and improve HCPs in other organizations as well. In general, the positive experiences and findings obtained in the three evaluation case studies confirm that this research topic deserves further scientific and practical investigation. New applications of the approach, including comparative studies with workflow-based process modelling approaches, are planned for the future (see Section 7.3.2).
Statement 3: The core component of the TALL modelling approach (i.e. the TALL modelling language) is well suited for the graphical description of HCPs. The TALL modelling language has the following strengths. 1. The language is effective The language proved well suited to describe the interaction structures of the target HCPs in the three evaluation case studies. In particular, the tree layout of the IS diagram proved a powerful concept to model and understand the many interaction interrelations (i.e. routing and composition relations). The interaction-centricity of the language allowed the modeller to focus on the essential interactions that contribute to the execution of the target HCP without being concerned with the details of the behaviours of individual agents. In a second modelling phase, the IS diagram proved an effective anchor for the individual behaviour specification in Agent Behaviour (AB) diagrams (see Chapter 5). Overall, the language separates between two levels of ‘linked’ process flows. The macroflow of interactions in the IS diagram allows to specify “what” to perform in terms of collaborative multi-agent activities. The microflow of behaviours in the associated AB diagrams allows to specify “how” to perform these in terms of individual single agent activities. Despite the conceptual separation, the process modelling is completely hierarchical. Interactions can be specified in more detail using (child) interactions or using agent behaviours on the elementary level. This divide-and-conquer approach proved effective in real-life to tackle the complexity of HCPs. 2. The language is agent-oriented The agent-oriented concepts, on which the language is based, fit the collaborative nature of HCPs. The graphical syntax and diagrams allowed to model the essential components of the three target HCPs: role-based multi-agent interactions in the IS diagram, and agent behaviours in the AB diagram. Moreover, the language allowed

Chapter 7
218
to model the static aspects of the organizational environment of each target HCPs with the TALL Agent Structure (AS) and Role Structure (RS) diagrams. This makes TALL a business process modelling language instead of a process modelling language (Barjis, 2007). 3. The language is rigorous A well-defined formal semantics supports the graphical syntax. This makes the language more than a diagrammatic convention and enables formal analysis (i.e. implementation in Petri nets and structural model checking as demonstrated in Chapter 2). Moreover, as Chapter 2 indicates, the formal TALL diagrams can be executed by a simulation environment to develop software agents for HCP support. In a next phase of a HCP’s lifecycle, the models can reside in a deployed multi-agent system and be executed for real-life HCP support. 4. The language is robust The positive evaluation results in the three evaluation case studies from three different sectors proves that TALL’s modelling constructs are not specific to a certain business environment. This strengthens language robustness and generalizability. 5. The language produces accurate descriptions of reality and is useful in practice The face validation sessions, organized in the three evaluation case studies with key people from the target organizations, demonstrated that the language correctly models real-life HCPs and meets user expectations. The graphical syntax shields business users from the formal semantics. Therefore, the business people (i.e. process owners) who will actually manage and/or improve a HCP can relate to and understand the TALL diagrams. The evaluation results prove that the language is a valuable asset for HCP identification, modelling, analysis, and improvement. A long-term goal is to achieve more widespread use of the language by for instance business analysts. This is part of future work (see Section 7.3.2).
7.2. TALL Modelling Guidelines
Based on the modelling experience obtained in the four case studies in Chapter 2, Chapter 4, Chapter 5, and Chapter 6, the following list of modelling activities supports modellers in the usage and application of the TALL modelling approach and its components.

Discussion & Conclusions
219
1. Build an Agent Structure Diagram The (lead) modeller creates an AS diagram of the business environment under consideration to scope the organizational population. The case applications in Chapter 2 (see Figure 2-2) and Chapter 6 (see Figure 6-3) included the creation of an AS diagram. The evaluation case study in Chapter 6 used the AS diagram to create a graphical representation of the organizational structure under consideration with involved business units, departments, and department centres. The diagram was then used to identify human agents within these synthetic agents to obtain a representative group of healthcare workers for the interviews. Thus, in Chapter 6, the AS diagram facilitated the selection of the interviewees. In general, the identification and modelling of the agent structure in the business domain under consideration is the primary purpose and value of the AS diagram. Besides synthetic and human agents, the illustrative case study in Chapter 2 showed that the diagram also allows the modelling of software agents (e.g. legacy systems). This enables the capture and understanding of the (structure of the) information technology (IT) landscape.
2. Build a Global Interaction Structure Diagram The modeller(s) create(s) a global IS diagram of the interactions in the target HCP.
Single view situation In this situation, the modeller creates the global IS diagram in a top-down way either in a model-based workshop or based on an interaction log. In a model-based workshop, models are built interactively with subject matter experts who talk about the process and a modeller who changes the models on the fly (Bridgeland & Zahavi, 2009). A model-based workshop reflects a single view situation because the local interaction views of the participants are not explicitly modelled in local IS diagrams as in the multi-view situation (see below). Instead, the human input is directly processed in the global IS diagram by the (lead) modeller during the workshop. In Chapter 5, the global IS diagram was completed and validated in a model-based workshop in which all process participants sat together.
A model-based workshop is recommended for relatively small HCPs, like in the Chapter 5 case study, which are performed in a single organizational unit with a small group of participants. In this case, a model-based workshop is efficient because of the speed of the modelling process (i.e. no interviews are required to

Chapter 7
220
create the global IS diagram). A model-based workshop may also be required when the business domain under consideration cannot or is not willing to commit their employees to the interviews required in the multi-view situation (i.e. because of time or resource constraints).
For large-scale HCPs with many distributed participants, like in the Chapter 6 case study, the model-based workshop approach has disadvantages. First, with a large group of participants it is difficult to obtain everyone’s input. The group setting of a workshop may intimidate some participants, who may be afraid to speak up and voice an own opinion (Buelens, van den Broeck, Vanderheyden, & Kinicki, 2006). On the other hand, if only a few (key) participants attend the workshop, valuable tacit domain knowledge is not collected. Second, the model-based workshop approach does not work in distributed settings where (some of) the participants cannot sit together or are not willing to sit together. In the Chapter 6 case study, because of their local views, healthcare workers did not have a good understanding of the overall healthcare HCP. Therefore, they found it hard to discuss and agree with colleagues from other disciplines and departments on the interactions to be represented in the global IS diagram.
If there is an organization where an e-mail archive or log is available to discover and represent an email-driven HCP, the Email Interaction Mining (EIM) method from Chapter 4 can be selected and applied. The EIM method builds the global IS diagram directly from the interaction log (i.e. in a top-down way). An interesting avenue for future research is to improve the developed interaction mining tool to be able to discover an IS diagram from other interaction logs (see Section 7.3.2). Multi-view situation In this situation, the modeller applies the Multi-View Interaction Modelling (MVIM) method from Chapter 6 to collect and formalize the tacit domain knowledge of the human process participants in local IS diagrams. In other words, the local interactions views of the participants are explicitly modelled. Next, the (lead) modeller can automatically integrate the created local IS diagrams into a global IS diagram using the software implementation of the MVIM method. In this way, the global IS diagram is created in a bottom-up way. The local IS diagrams that serve as input to the method can be created separately and concurrently by multiple modellers. In the Chapter 6 case study, two modellers used interviews to collect and formalize the tacit domain knowledge of the selected healthcare workers.

Discussion & Conclusions
221
The MVIM method is recommended for large-scale distributed HCPs where the process participants are concerned with different aspects of the target HCP and/or are involved in different phases of the target HCP (or when the process participants cannot or are not willing to sit together as mentioned under the single view situation). Usually, this is the case when the diversity of the process participants in terms of their professional backgrounds and functional areas of expertise is great. The advantage of the MVIM method for such HCPs is the use of one-to-one focused interviews, which allows the tacit domain knowledge of the human process participants to be collected and formalized in cooperation with the interviewee. This benefits the completeness and accuracy of the TALL diagrams. In turn, this benefits the usefulness of the diagrams for process analysis and improvement purposes. Another advantage of the MVIM method for large-scale HCPs, as described above, is the inherent support for a multiple modeller situation.
Both the single view situation (i.e. model-based workshop) and multi-view situation (i.e. MVIM method) can benefit from a preliminary high-level IS diagram, created based on organizational documentation. In Chapter 5, a preliminary high-level IS diagram facilitated the execution of the model-based workshop. In Chapter 6, a high-level preliminary IS diagram served as input to the one-to-one interviews to provide a generic starting point for the creation of the local IS diagrams. In business domains where the organization(s) does(do) not want to commit human resources at all, the global IS diagram can be created based on organizational documentation only.
3. Build a Role Structure Diagram The (lead) modeller can create a RS diagram of the unique roles in the global IS diagram. A RS diagram accompanies a global IS diagram and can be created for several purposes. First, it can graphically depict and explain to which organization (or organizational unit) a role in the global IS diagram belongs. In the Chapter 4 case study, company suffixes were added to the roles in the global IS diagram to distinguish between the roles of different companies (see Figure 4-10). Alternatively, an RS diagram could have been created to provide this information. Second, a RS diagram can explain possible role grouping in the global IS diagram. Role grouping provides for clean IS diagrams by avoiding role clutter as parent interactions collect the roles of their children in a bottom-up way. The Chapter 2 case study created an RS diagram for this purpose (see Figure 2-5) to accompany

Chapter 7
222
the global IS diagram (see Figure 2-3). Third, in general, an RS diagram may be used to depict a reporting structure within a single organization (i.e. chain of command). Finally, RS diagrams may be used to define authorization schemes. In this context, role building may be used to design agent groups, which are generic sets of agents with similar skills. For this, roles have to define permissions (i.e. constraints) to make sure only agents, who are members of a certain agent group, are authorized to play that role. This research avenue was also mentioned in the future work of Chapter 2 (see Section 2.9). 4. Perform Interaction Analysis The (lead) modeller performs analysis of the global IS diagram, possibly in cooperation or consultation with (key) people from the business domain under consideration, to identify HCP improvement opportunities. The evaluation case studies in Chapter 4, Chapter 5, and Chapter 6 each present several improvement opportunities with regard to the target HCP’s interaction structure after (qualitative) process analyses of the created global IS diagrams.
5. Build Agent Behaviour Diagrams The global IS diagram provides a good starting point for the specification of the individual local agent behaviours. The elementary interactions in the IS diagram (i.e. the leafs in the interaction tree) are completed by the coordinated execution of the behaviours of the agents playing the roles. For each elementary interaction, the modeller(s) can collect knowledge about the agent behaviours and formalize this knowledge in AB diagrams. In most cases, this knowledge is collected through (another round of) interviews, like in Chapter 5. Alternatively, the modeller may pursue other data collection methods like desk study of organizational documentation (e.g. protocols, procedures, norms), non-intervening observation, or key informant consultations. The goal of this modelling activity is to inform the sixth activity Perform Behaviour Analysis (see below). In the Chapter 2 case study, the modelling of the behaviours of legacy IT systems (i.e. software agents) in terms of generic system activities (read: functionalities) was also illustrated. This allows to investigate interaction touch points with other agents (e.g. how a human interacts with an IT system as part of a HCP).

Discussion & Conclusions
223
6. Perform Behaviour Analysis The modeller(s) analyse(s) and/or compare(s) the AB diagrams to reap business value from them. This thesis demonstrated two types of behaviour analysis:
Qualitative Behaviour Analysis: in Chapter 5, the modeller (cross-) analysed the AB diagrams to identify deficiencies and/or innovations within and across local behaviours. This resulted in several actionable managerial insights for the case organization on the behaviour level;
Verification Analysis: in Chapter 2, the modeller used the design-time verification method to translate the global IS diagram and the associated AB diagrams to a hierarchical coloured Petri net to enable verification analysis. This resulted in several valuable observations on the structural correctness and compatibility of the individual agent behaviours that complete a certain elementary interaction. After correction of the identified errors, this resulted in improved AB diagrams. The verification analysis may be performed after a redesign of agent behaviours based on a qualitative behaviour analysis. In this way, the structural correctness and compatibility of (redesigned) agent behaviours can be analysed before they are used for further design and/or implementation. For instance, such behaviours may be used to directly code the behaviours of software agents in a multi-agent system for real-life HCP support.
7.3. Conclusions
7.3.1. Research contributions
This thesis has undertaken empirical design research to present, apply, develop, and evaluate a novel graphical business process modelling approach named TALL. The approach allows for the identification, modelling, analysis and improvement of Human Collaboration Processes (HCPs). A HCP consists of a process structure of related interactions (e.g. meetings, conversations, consultations, discussions) between agents, who may each play different roles. The following summarizes the motivation behind and innovation of the approach.
In Business Process Management (BPM) research and practice, the study of workflow processes is widespread. These studies are mostly technology-oriented with a focus on the implementation of workflow processes in workflow management systems (Houy, Fettke, & Loos, 2010). Workflow management systems allow organizations to streamline and automate business processes, re-engineer their structure, as well as, increase efficiency and reduce costs (Cardoso,

Chapter 7
224
Sheth, & Miller, 2002). These systems use a workflow model to control the execution of the tasks in the process. In this way, the system provides automated process support. Therefore, a workflow model specifies which tasks in a process need to be executed and in what order (van der Aalst, 1998). Workflow modelling is mostly done using graphical process modelling languages. The essence of these languages is similar; they create flowchart or graph-based models in which the collection of tasks and their ordering relations are formalized in task execution sequence (Wang & Wang, 2006). Overall, the huge focus and investment in the study of workflow processes and their Information Technology (IT) support has produced proven modelling tools.
In HCPs, collaboration instead of task sequence determines the nature of the business activity (Harrison-Broninski, 2005). This thesis argues that pervasive graphical workflow-based process modelling approaches have shortcomings to model those processes that require intensive human interaction for their completion. This is mainly due to their focus on workflow processes, and the definition and automation of workflow processes as task structures. Several authors confirm that existing graphical (workflow-based) process modelling languages are appropriate for modelling business processes that display complex task flows (i.e. workflow processes) but are less appropriate for modelling business processes that involve the interaction of a multitude of actors (i.e. HCPs) (Barjis, 2007; De Backer, Snoeck, Monsieur, Lemahieu, & Dedene, 2009; Hommes, 2004; Melão & Pidd, 2000; Ryu & Yücesan, 2007; Stuit & Wortmann, 2010). With HCPs, the goal of process modelling is not primarily IT support or automation but in the first place to capture and define accurately the essence of collaboration, as a necessary basis for their analysis and improvement.
Although human interactions are adopted in practice as an effective way to collaborate, organizations do not define - let alone manage - them as a business process. This is remarkable since human interactions constitute an essential part of a modern organization’s activities. The net result is that human interaction structures in organizations remain largely implicit; there exists no process definition of human interactions in organizations. Therefore, HCPs are not amenable to proper process design, analysis, and improvement. This is the core of the organizational problem in the case studies performed in this thesis (see below).
The lack of proper modelling tools for human collaboration and interaction was the motivation to develop the interaction-centric TALL modelling approach in order to fill the gap, and provide an effective and useful modelling tool for HCPs in

Discussion & Conclusions
225
organizations. The approach is inspired by the agent paradigm. As indicated above, most pervasive process modelling approaches are inspired by the workflow paradigm (Fischer, 1995). Using the TALL modelling approach, an organization is viewed as a multi-agent environment in which different agents behave in role-based interactions to coordinate their work. This is a paradigm shift in BPM research and practice. In the approach, the main modelling concept is the interaction (performed by multiple actors) instead of the task (performed by a single actor). The interaction-centricity results from the agent-orientation (i.e. agent interactions stand central in multi-agent systems research). The power of the agent-orientation is that it provides rich graphical notations to model a HCP’s human interaction structure (i.e. interactions, their composition and routing relations, their roles, and their participants or agents) and the behaviours of the agents that are used to perform the interactions. Moreover, the agent-orientation provides explicit support for the modelling of local individual process views on both the interaction and behaviour level. In this regard, TALL offers an internal observer view (i.e. an agent-centric perspective). This is opposed to the external observer view of most existing process modelling approaches.
Other modelling approaches have emerged that adhere to different paradigms to capture those business processes that are collaborative of nature. For example, modelling approaches that adhere to a social paradigm conceive business processes as a special kind of social interaction process (Wagner, 2003), as patterns of interaction and action (Dietz, 2006), as social constructs (Melão & Pidd, 2000), or as a holarchy of human activity systems (Clegg & Shaw, 2008). Other examples are the case handling paradigm (van der Aalst & Weske, 2005) and the rule-based paradigm (Goedertier, Haesen, & Vanthienen, 2008), which both aim to make process definition and enactment more flexible. The emergence of these modelling approaches confirms that (1) modern business processes are more complicated than the scope and features of pervasive workflow-based process modelling tools, and (2) there is a need for HCP-like process investigation and support tools.
The research methodology applied in this thesis integrates case study research and design science research. The adopted design science research framework is shown in Figure 7-1 and includes activities for problem identification (i.e. the research motivation), developing the artefact, evaluating the artefact, and demonstrating research contributions. As discussed above, the research process draws from foundations in the existing knowledge base of the BPM field to motivate the development of the TALL modelling approach. Moreover, multi-

Chapter 7
226
agent systems research provides theoretical concepts that led to the main language concepts: interactions, behaviours, agents, and roles. Furthermore, the research process makes use of sound methodologies (i.e. case studies) available in the knowledge base for the development and evaluation of the approach. Case studies allowed the development of the TALL modelling approach in close interaction with reality while at the same time the practical utility of the approach to solve identified organizational problems could be evaluated. A single case study (Chapter 2) and an illustrative process example (Chapter 3) was used to present the initial design of the approach, and a multiple case study consisting of three evaluation case studies (Chapter 4, Chapter 5, and Chapter 6) was used to demonstrate the utility of the approach in real-life HCP (re)design situations.
Figure 7-1. The design science research framework adopted in this thesis. Based on (Hevner, March, Park, & Ram, 2004; Vaishnavi & Kuechler Jr., 2008).
The main theoretical (design) contribution of this thesis is the TALL modelling approach, which proved useful and effective in practice. The close connection with reality produced an approach that has high validity with the people in the field and that can address practical business problems. In each evaluation case study, the application of the approach had a strong observable effect in solving the organizational problem. More specifically, in each case, the approach defined the (previously implicit) target HCP’s interaction structure, which enabled proper process analysis and improvement. Several actionable managerial insights in the

Discussion & Conclusions
227
form of HCP improvement opportunities were identified in each evaluation case study. Based on this, the main practical contribution of this thesis is the business value realized in each evaluation case study. As Figure 7-1 shows, the theoretical contribution is added to the existing knowledge base, and the practical contribution flows back to the business environment in which the (organizational) problem was identified. According to Hevner, March, Park, and Ram (2004), the contributions of design science are assessed as they are applied to the business needs in an appropriate environment (i.e. practical contribution) and as they add to the content of the knowledge base for further research and practice (i.e. theoretical contribution).
Each process modelling approach has certain strengths, fits certain purposes, or adheres to certain theoretical perspectives. There is no general-purpose process modelling tool suitable for all projects in the BPM field (Bider, 2005). The outcomes of this research strongly suggest that the TALL modelling approach has potential within the BPM community. In this regard, the approach may serve as a valuable addition to the assortment of existing process modelling approaches. This thesis showed how the approach can identify HCPs in organizations, provides powerful concepts to model agent interaction and behaviour, and contributes to the understanding and improvement of the target HCP. Overall, the evidence suggests that HCPs in organizations can be effectively identified, modelled, analysed, and improved via the interaction-centric TALL business process modelling approach. Clearly, the approach is not finished. Section 7.3.2 presents possible future research directions.
Besides the main theoretical contribution in the form of the TALL modelling approach, the chapters in this thesis provide the following specific theoretical contributions:
The main innovation of the TALL modelling approach, when compared to existing agent-oriented modelling approaches in multi-agent systems research, is its focus on business process specification instead of system specification (Chapter 2 of this thesis);
The design-time verification method allows to verify the structural correctness and compatibility of the individual agent behaviours that complete a certain elementary interaction. The design-time verification method is different from other verification methods due to its ability to trace back identified design errors to individual agent behaviours. In a broader context, this enhances the reliability and quality of the TALL Agent

Chapter 7
228
Behaviour (AB) diagrams, which may be used as requirements in the development of software agents for intelligent IT support of humans in their workplace interactions. For example, the verified AB diagrams may serve as executable specifications for software agents (Chapter 2 of this thesis);
E-mail is one the primary media for business communication and collaboration. The Email Interaction Mining (EIM) method can discover (i.e. reverse-engineer) an e-mail-driven HCP from a historical e-mail archive. The EIM method is different from other process mining methods in the sense that the interaction (i.e. a collaborative activity by multiple actors) instead of the task (i.e. an individual activity by a single actor) is the basic building block to construct the process. The EIM method is different from other e-mail tools because of its focus on BPM instead of individual user management (Chapter 4 of this thesis);
In existing workflow-based process modelling languages, the graphical representation of interaction structures is weak due to the focus on task specification, which makes the capture of the essence of HCPs difficult. This is named the interaction shortcoming. In the TALL modelling language, interaction specification is done in the Interaction Structure (IS) diagram where interaction is the fundamental process element. The tree layout of the IS diagram breaks the opacity of a HCP and overcomes the interaction shortcoming (Chapter 5 of this thesis);
In existing workflow-based process modelling languages, the process model prescribes generic process behaviour. This standardizes behaviour and makes process execution efficient. However, such a model does not explicitly define local behaviour and therefore prevents the analysis of local differences in behaviours. This is named the local view shortcoming. In the TALL modelling language, the AB diagrams capture explicitly the local operational process views of the owner agents in a given interaction. This retains local process diversity and overcomes the local view shortcoming (Chapter 5 of this thesis);
The Multi-View Interaction Modelling (MVIM) method makes use of personal interviews to capture the tacit domain knowledge of human agents and to formalize this knowledge in local IS diagrams. The MVIM method is different from existing methods in the BPM field because of the interaction-centricity, and the explicit capture and modelling of local interaction views. The interviews take the form of mini-workshops between the interviewer

Discussion & Conclusions
229
and the interviewee. Each interviewee is actively involved in the creation of the local IS diagram. This setup fuels the interviewee’s involvement and interest, which leads to more precise local IS diagrams. Moreover, it allows for immediate validation of the local IS diagrams (Chapter 6 of this thesis);
The MVIM method makes use of the global construction algorithm (see Chapter 3) to automatically integrate the created local IS diagrams in a global IS diagram. The algorithm does not streamline (i.e. standardize) the local interaction views of the process participants but consolidates them. The global IS diagram provides an overview of a HCP’s interaction structure, which reflects the consolidated domain knowledge. The integration feature enables effective division of work since multiple modellers can work independently and concurrently on different local IS diagrams, and then provide them as input to the MVIM method (Chapter 6 of this thesis).
7.3.2. Future research directions
The previous chapters highlighted future work related to the specific content of the particular chapters. This section provides general directions for future research. The main thrust of future work is concerned with research to strengthen the validation of the TALL modelling approach. Both qualitative and quantitative validation studies are planned.
As qualitative research, future applications of the approach to HCPs in (non-Dutch) organizations are intended to further the (re)design of the approach. These empirical studies are planned to include comparative analyses of TALL and conventional workflow-based process modelling approaches. For instance, a traditional (single-view) process modelling method, making use of e.g. BPMN, can be compared to the MVIM method, making use of TALL. To realize this, two groups of students can study two similar HCPs in two different organizations with one group applying the traditional method and the other group applying the MVIM method. When both studies complete, an evaluation of the advantages and disadvantages of both modelling methods can be performed together with (key) people from the organizations under consideration.
As quantitative research, a comparative laboratory experiment concerned with model validation is planned for the future. A common source of difficulty in conventional (task-centric) process modelling languages is an appropriate visual method to reduce the complexity of large diagrams where users have to model interactions between a wide range of actors (Hommes, 2004). Therefore, a laboratory experiment intends to examine the effectiveness of the interaction-

Chapter 7
230
centric TALL modelling language in comparison with a conventional task-centric process modelling language. Separate experiments can be performed of a HCP and a workflow process to thoroughly investigate the strengths and weaknesses of the languages in modelling both types of business processes. At first, a two-group experimental design can be used. Next, the findings of the first experiments may help to isolate the specific effective notations of both modelling languages and inform more sophisticated experimental designs.
The qualitative and quantitative validation studies described above enable a better understanding of the capabilities, limitations, and appropriateness of the TALL modelling approach. An important part of future validation relates to dissemination. In this regard, the planned action is to establish and maintain a committed research team for the management and evolvement of the approach, and to make the approach more known in both industry and academia. In this way, a larger community of researchers and/or practitioners may perform critical analyses of the approach.
Besides the main thrust of future work that is concerned with validation, specific future research directions are associated to different components of the TALL modelling approach. With regard to the TALL modelling language, the IS diagram currently does not provide distinct language elements to express interaction types (e.g. synchronous/asynchronous, verbal/non-verbal, physical/virtual) and forms (e.g. discussion, conversation, consultation). Both the interaction form and type are implicit from the interaction label or name. Moreover, a formal semantics for the AS and RS diagrams is to be included in the language. This thesis mainly focused on the process diagrams of the language, that is, the IS and AB diagrams. In this regard, the practical utility of the AS and RS diagrams needs to be established, and advanced guidelines for the integrated use of the different TALL diagrams need to be developed. With regard to the set of TALL modelling guidelines, the first extension is to specify more advanced procedures that can assist modellers in the identification of agents, roles, interactions, and behaviours. Furthermore, other data collection methods for the interaction and behaviour capture are to be explored. Currently, the data collection process uses interviews, which is quite laborious, especially for large-scale HCPs when also the agent behaviours are to be identified and formalized in models. With regard to the discovery of HCPs through interaction mining, the goal is to improve and generalize the developed mining tool (see Chapter 4) to work with other interaction logs (e.g. digital user agenda’s, multi-agent system execution logs etc.).

Discussion & Conclusions
231
As a next step in the lifecycle of a HCP, future work intends to apply interaction-centric process modelling tools – like the TALL modelling approach – as the first phase in the development of multi-agent systems that support real-life HCPs. This provides many avenues for future research and development.

Chapter 7
232

Appendices

Appendices
234
Appendix A – Pseudo Code E-mail Interaction Mining Method
The email interaction mining method from Chapter 4 to discover an interaction-centric process model from a set of e-mail messages is defined in the following (tool-independent) activities and steps. Activity 1: Pre-Processing
1. Determine the organization’s project or business process under consideration
2. Identify the involved employees 3. Collect the relevant e-mail messages from the employees’ Inbox folders 4. Store all messages in a single archive
Intermediate output: a manually pre-processed e-mail archive with messages that pertain to a single process instance Activity 2: Thread Identification
1. Group all messages by thread a. Build simple threads using threading by subject b. Build compound threads using threading by reference c. Identify the root and child threads within compound threads using
threading by subject 2. For each thread, record thread attributes
a. Set the name to match the subject line of the root e-mail b. Set the initiator to match the author of the root e-mail c. Set the start time to match the origination date of the chronologically
first message in the thread d. Set the end time to match the origination date of the chronologically
last message in the thread e. Set the parent thread to match the name of the parent thread
Intermediate output: a set of e-mail threads and their attributes Activity 3: Interaction Identification
1. For each simple thread a. Create an atomic interaction b. Set the attribute Name to match the thread name c. Set the attribute Class to Atomic
2. For each compound thread If the root thread contains one e-mail message then36 a. Create a complex interaction based on the root thread b. Set the attribute Name to match the name of the root thread
36 In this case, all replies in the compound thread introduce a new subject.

Appendices
235
c. Set the attribute Class to Complex d. For each child thread in the compound thread
Create a simple interaction Set the attribute Name to match the name of the child thread Set the attribute Class to Simple Connect the complex interaction as a parent to the simple
interaction If the root thread contains two or more messages then37 a. For each thread in the compound thread
Create a simple interaction Set the attribute Name to match the name of the (root or child)
thread Set the attribute Class to Simple
b. Create an artificial complex interaction c. Set the attribute Name of the artificial complex interaction to
match the name of the root thread and attach the string “[Begin]” d. Set the attribute Class to Complex Begin e. Connect the artificial complex interaction as parent to the simple
interactions 3. Normalize the labels of all the identified interactions by removing common
prefixes like “Re:” or “Fwd:” Intermediate output: (1) a list of atomic, simple, complex, and complex begin interactions, (2) a set of partial interaction structures that represent the parent-child relations between complex (begin) and simple interactions Activity 4: Control flow discovery
1. Create an artificial complex interaction to act as the overall root of the interaction model
2. Set the attribute Class of the root interaction to Complex Root 3. Set the attribute Routing Type of the root interaction to SEQ 4. Set the attribute Name of the root interaction to match the name of the
project or business process under consideration 5. Sort all Complex, Complex Begin, and Atomic interactions in ascending
chronological order based on their start times 6. Process the interactions from this main list of sorted interactions
If a direct successor in the list (interaction 2) lies before the end time of a previous interaction in the list (interaction 1) then a. Start a parallel chain b. Assign interaction 1 as the first member of the parallel chain c. Assign interaction 2 as a member of the parallel chain
37 In this case, there are replies with the subject line of the root e-mail of the root thread.

Appendices
236
d. Assign interactions from the list as members of the parallel chain as long as the start time of those interactions lay before any of the end times of the interactions already assigned to the parallel chain
7. For each parallel chain a. Execute Activity 7 b. For each Complex Parallel interaction that is created during Activity 7
Set the attribute Start time to match the start time of its chronologically first direct child interaction
Set the attribute End time to match the end time of its chronologically last direct child interaction
c. Connect the overall root interaction Complex Root as parent to the chain’s root interaction
8. Connect the overall root interaction Complex Root as parent to the sequential interactions from the main list of step 638
9. For each Complex and Complex Begin interaction, list its children in ascending chronological order based on their start times39
10. Execute step 7 for each list of Simple sibling interactions a. Case 1: all the siblings in the list are sequential (i.e. there is no parallel
chain) Set the attribute Routing Type of their parent interaction to SEQ
b. Case 2: all the siblings in the list are assigned to a single parallel chain Execute step 2 from Activity 7 Execute step 7b Set the attribute Routing Type of their parent interaction to PAR
c. Case 3: one or more parallel chains are identified with adjacent or interim sequential siblings Set the attribute Routing Type of the siblings’ parent (interaction 1)
to SEQ For each interaction that is a member of a parallel chain, remove
the parent-child relation with interaction 1; Execute steps 7a and 7b Connect interaction 1 as parent to each chain’s root interaction
11. Set the attribute Start time of the Complex Root interaction to match the start time of its chronologically first direct child interaction
12. Set the attribute End time of the Complex Root interaction to match the end time of its chronologically last direct child interaction
Intermediate output: A temporarily ordered interaction structure with composition and routing relations
38 These are the interactions that are not assigned as members of the identified parallel chains. 39 Effectively, this creates multiple lists of sorted Simple sibling interactions.

Appendices
237
Activity 5: Attribute assignment 1. For each interaction
a. Set the attribute Active participants to be the unique persons from the “From” and “To” fields of the messages in the corresponding thread
b. Set the attribute Passive participants to be those persons in the “Cc” fields of the messages in the corresponding thread that are not active participants
c. Set the attribute Initiator to match the sender of the root e-mail in the corresponding thread
d. Set the attribute Duration to be the calculated difference between the start- and end times in number of days, hours, and minutes
e. Set the attribute Message size to be equal to the number of messages in the corresponding thread40
f. Set the attribute Number of children to match the number of children of the interaction
g. Set the attribute Parent to match the ID of the parent of the interaction If the interaction is Atomic or Simple a. Set the attributes Start time and End time to match the start- and end-
times of the corresponding thread If the interaction is Complex a. Set the attribute Start time to match the start time of the corresponding
root thread b. Set the attribute End time to match the latest end time of the direct
child interactions If the interaction is Complex Root, Complex Begin or Complex Parallel a. Set the attribute Start time to match the start time of the
chronologically first direct child interaction b. Set the attribute End time to match the latest end time of the direct
child interactions Activity 6: Role Identification
1. For all active interaction participants, identify the corresponding role name or job title based on organizational documentation
2. For each Atomic, Simple, and Complex interaction a. Connect the identified roles based on the active participants b. Connect the initiator role
3. For each Complex Root, Complex Begin, and Complex Parallel interaction a. Collect and connect the roles of their direct children b. Connect the initiator role of the chronologically first direct child as the
initiator role
40 If there is no e-mail header data, the attributes in a to e are left empty. This is the case with artificial complex interactions (i.e. Complex Root, Complex Begin, and Complex Parallel interactions).

Appendices
238
Output: The output model, an Interaction Structure (IS) diagram including roles Activity 7: Post-Processing (optional)
1. Perform close reading of the e-mail messages in the archive a. Discover missing root or interim messages in existing threads b. Discover new connections between existing threads c. Discover new embedded threads
2. If any new e-mails or threads are discovered a. Modify the interaction structure and the interaction attributes (start
time, participants, number of messages) of the corresponding interactions
3. Modify and correct the interaction names using one or more of the following research methods a. Inspection of organizational documentation b. In-depth interviews with employees c. Close reading of e-mail messages
Output: A manually post-processed output model Activity 8: Determine the control flow structure within the parallel chain
1. For the first interaction in the parallel chain a. Create an artificial complex interaction to act as its parent (this is the
root interaction of the parallel chain) b. Set the attribute Class of the artificial complex interaction to Complex
Parallel c. Set the attribute Name of the Complex Parallel interaction to “[PAR]” d. Set the attribute Routing Type of the Complex Parallel interaction to
PAR 2. For each subsequent interaction in the parallel chain ask the following
questions a. Does the interaction completely lie within the time span of its direct
predecessor? Yes, go to step 1c No, go to step 1b
b. Does the interaction lie sequentially with respect to its direct predecessor? Yes, go to step 1c No, add the interaction as a child on the level of its direct
predecessor in the tree, and continue on the lowest existing level41 c. Does the interaction have successors that start within its time span?
41 Each interaction in the IS diagram appears at a certain level in the tree, starting at level zero, which is the root level and highest level.

Appendices
239
Yes, execute the following steps Create an artificial complex interaction to act as its parent Set the attribute Class of the artificial complex interaction to
Complex Parallel Set the attribute Name of the Complex Parallel interaction to
“[PAR]” Set the attribute Routing Type of the Complex Parallel
interaction to PAR Connect the Complex Parallel interaction as a child to the
Complex Parallel interaction immediately above it (in the tree) No, go to step 1d
d. Does the interaction have predecessors that end within its time span? Yes, add the interaction as a child on the highest predecessor level
that ends within its time span, and continue on the lowest existing level
No, add the interaction as a child on the level of its direct predecessor, and continue on the lowest existing level

Appendices
240
Appendix B – Email Etiquette Rules
Organizations that plan to use the email interaction mining method from Chapter 4 are advised to establish the following e-mail etiquette rules. Adherence to these rules improves the quality (i.e. structure) of the output model and thus its usefulness for analysis and improvement of the email-driven business process under study:
Create meaningful subject lines for the recipient as well as yourself. Avoid generic subject lines like “Request for information”. Instead, use “Request for information about Product X”. This ensures that the interaction names in the output model are more informative and appeal to a larger audience;
Avoid spelling and grammar mistakes in subject lines, and the use of business-specific or technical content/abbreviations. This ensures that the output model can be well understood by a large audience;
Use the “To” field for recipients who should respond to the message and the “Cc” field for recipients who are only informed. This ensures that the active and passive interaction participants are correctly set;
Limit messages to one subject, that is, start a new message for a new subject. For instance, start a reply with a new subject line when a thread is diverging. This ensures that the subject is represented as an interaction in the output model since the proposed method does not look into message bodies;
Click “Reply” instead of “New E-mail” when replying to a message. The latter starts a new thread and incorrectly becomes a separate (unrelated) interaction in the output model;
Do not use the reply function to save the time and trouble of typing e-mail addresses. This means the new e-mail starts a (otherwise unrelated) child thread, which results in the composition of otherwise unrelated interactions in the output model. An address book is commonly available (or can be easily implemented in popular email clients) to employees that allow them to input real names in recipient fields. In this way, email addresses do not have to be typed;
Store or archive all messages relating to the same project or process together.
An e-mail policy may be set-up to formally establish these rules in an organization.

References

References
242
1. Abraham, J., & Reddy, M. (2010). Challenges to inter-departmental coordination of patient transfers: A workflow perspective. International Journal of Medical Informatics, 79(2), 112-122.
2. Adams, M., ter Hofstede, A., Edmond, D., & van der Aalst, W. (2006). Worklets: A service-oriented implementation of dynamic flexibility in workflows. In R. Meersman, & Z. Tari (Eds.), On the Move to Meaningful Internet Systems 2006: CoopIS, DOA, GADA, and ODBASE (Vol. 4275 Lecture Notes in Computer Science, pp. 291-308). Heidelberg, Berlin, Germany: Springer.
3. Aguilar-Savén, R. (2004). Business process modelling: Review and framework. International Journal of Production Economics, 90(2), 129-149.
4. Andersson, A., Hallberg, N., & Timpka, T. (2003). A model for interpreting work and information management in process-oriented healthcare organisations. International Journal of Medical Informatics, 72(1-3), 47-56.
5. Atwal, A., & Caldwell, K. (2006). Nurses´ perceptions of multidisciplinary team work in acute healthcare. International Journal of Nursing Practice, 12(6), 359-365.
6. Bacarin, E., van der Aalst, W., Madeira, E., & Medeiros, C. (2007). Towards modelling and simulating a multi-party negotiation protocol with coloured Petri nets. Proceedings of the 8th Workshop and Tutorial on Practical Use of Coloured Petri Nets and the CPN Tools (pp. 29-48). Aarhus, Denmark: University of Aarhus.
7. Barjis, J. (2007). An innovative method for business process modeling. Proceedings of the Fifth International Workshop on Modeling, Simulation, Verification and Validation of Enterprise Information Systems (pp. 31-42). Setubal, Portugal: INSTICC.
8. Barjis, J. (2009). Collaborative, participative and interactive enterprise modeling. In J. Filipe, & J. Cordeiro (Eds.), Enterprise Information Systems (Vol. 24 Lecture Notes in Business Information Processing, pp. 651-662). Heidelberg, Berlin, Germany: Springer.
9. Barros, A., Dumas, M., & ter Hofstede, A. (2005). Service interaction patterns: Towards a reference framework for service-based business process interconnection. Technical Report, Queensland University of Technology, http://www.workflowpatterns.com/documentation/documents/ServiceInteractionPatterns.pdf.
10. Bauer, B., Müller, J., & Odell, J. (2001). Agent UML: A formalism for specifying multiagent software systems. The International Journal of Software Engineering and Knowledge Engineering, 11(3), 207-230.
11. Bellifemine, F., Caire, G., Poggi, A., & Rimassa, G. (2003). JADE: A white paper. Technical Report, Telecom Italia, http://jade.tilab.com/papers/2003/WhitePaperJADEEXP.pdf.
12. Bellotti, V., Ducheneaut, N., Howard, M., & Smith, I. (2003). Taking email to task: The design and evaluation of a task management centered email tool. Proceedings of the SIGCHI Conference on Human Factors in Computing Systems (pp. 345-352). New York, NY, USA: ACM.
13. Bellotti, V., Ducheneaut, N., Howard, M., Smith, I., & Grinter, R. (2005). Quality versus quantity: E-mail-centric task management and its relation with overload. Human-Computer Interaction, 20(1/2), 89-138.
14. Bider, I. (2005). Choosing approach to business process modelling - Practical perspective. Journal of Conceptual Modelling, http://www.ibissoft.com/publications/HowTo.pdf.

References
243
15. Billington, J., & Gupta, K. (2007). Effectiveness of coloured Petri nets for modelling and analysing the contract net protocol. Proceedings of the 8th Workshop and Tutorial on Practical Use of Coloured Petri Nets and the CPN Tools (pp. 49-65). Aarhus, Denmark: University of Aarhus.
16. Binder, W., Constantinescu, I., Faltings, B., Haller, K., & Türker, C. (2006). A multiagent system for the reliable execution of automatically composed ad-hoc processes. Autonomous Agents and Multi-Agent Systems, 12(2), 219-237.
17. Bresciani, P., Perini, A., Giorgini, P., Giunchiglia, F., & Mylopoulos, L. (2004). Tropos: An agent-oriented software development methodology. Autonomous Agents and Multi-Agent Systems, 8(3), 203-236.
18. Bridgeland, D., & Zahavi, R. (2009). Business modeling: A practical guide to realizing business value. Burlington, MA, USA: Morgan Kaufmann Publishers Elsevier.
19. Brixey, J., Robinson, D., Turley, J., & Zhang, J. (2010). The roles of MDs and RNs as initiators and recipients of interruptions in workflow. International Journal of Medical Informatics, 79(6), 109-115.
20. Brooks, C. (2006). Working with healthcare professionals. In K. Walshe, & J. Smith (Eds.), Healthcare management (pp. 253-268). Maidenhead, Berkshire, England: Open University Press.
21. Brouha, X., Tromp, D., Koole, R., Hordijk, G., Winnubst, J., & de Leeuw, J. (2007). Professional delay in head and neck cancer patients: Analysis of the diagnostic pathway. Oral Oncology, 43(6), 551-556.
22. Buelens, M., van den Broeck, K., Vanderheyden, K., & Kinicki, A. (2006). Organisational Behaviour (3rd ed.). Berkshire, UK: McGraw-Hill.
23. Buhler, P., & Vidal, J. (2005). Towards adaptive workflow enactment using multi-agent systems. Information Technology and Management, 6(1), 61-87.
24. Business Rules Group. (2000). Defining business rules - What are they really? Technical Report, Business Rules Group, http://www.businessrulesgroup.org/first_paper/BRG-whatisBR_3ed.pdf.
25. Bussmann, S., & Schild, K. (2000). Self-organizing manufacturing control: An industrial application of agent technology. Proceedings of the 4th International Conference on Multi-Agent Systems (pp. 87-94). Washington, DC, USA: IEEE Computer Society.
26. Cabac, L., & Moldt, D. (2005). Formal semantics for AUML agent interaction protocol diagrams. In J. Odell, P. Giorgini, & J. Müller (Eds.), Agent-Oriented Software Engineering V (Vol. 3382 Lecture Notes in Computer Science, pp. 47-61). Heidelberg, Berlin, Germany: Springer.
27. Caire, G. (2008). Workflow and Agents Development Environment (WADE). WADE User Guide, Telecom Italia, http://jade.tilab.com/wade/doc/WADE-User-Guide.pdf.
28. Caire, G., Coulier, W., Garijo, F., Gomez, J., Pavon, G., Leal, F., et al. (2002). Agent oriented analysis using Message/UML. In M. Wooldridge, G. Weiss, & P. Ciancarini (Eds.), Agent-Oriented Software Engineering II (Vol. 2222 Lecture Notes in Computer Science, pp. 119-135). Heidelberg, Berlin, Germany: Springer.
29. Caire, G., Leal, F., Chainho, P., Evans, R., Jorge, F., Pavon, G., et al. (2001). MESSAGE: Methodology for agent-oriented software engineering. Technical Report, Eurescom, http://www.eurescom.de/~pub-deliverables/P900-series/P907/TI1/p907ti1.pdf.
30. Calisti, M., & Greenwood, D. (2008). Goal-oriented autonomic process modelling and execution for next generation networks. In S. van der Meer, M. Burgess, & S. Denazis

References
244
(Eds.), Modelling Autonomic Communications Environments (Vol. 5276 Lecture Notes in Computer Science, pp. 38-49). Heidelberg, Berlin, Germany: Springer.
31. Callon, M., Méadel, C., & Rabeharisoa, V. (2002). The economy of qualities. Economy and Society, 31(2), 194-217.
32. Camargo-Santacruz, F., Frausto-Solís, J., & Ramos-Quintana, F. (2005). Modeling multiple interactions using colored Petri nets: A case study. In F. Ramos, V. Lrios Rosillo, & H. Unger (Eds.), Advanced Distributed Systems (Vol. 3563 Lecture Notes in Computer Science, pp. 182-193). Heidelberg, Berlin, Germany: Springer.
33. Camarinha-Matos, L., & Afsarmanesh, H. (2005). Collaborative networks: A new scientific discipline. Journal of Intelligent Manufacturing, 16(4/5), 439-452.
34. Cardoso, J., Sheth, A., & Miller, J. (2002). Workflow quality of service. Proceedings of the International Conference on Enterprise Integration and Modeling Technique: Enterprise Inter- and Intra-Organizational Integration: Building International Consensus (pp. 303-311). Deventer, The Netherlands: Kluwer.
35. Carley, K. (2002). Computational organization science: A new frontier. Proceedings of the National Academy of Sciences, 99(3), 7257-7262.
36. Carr, N. (2003). IT doesn't matter. Harvard Business Review, 81(5), 41-49. 37. Cervenka, R., Trenanský, I., & Calisti, M. (2006). Modeling social aspects of multi-
agent systems: The AML approach. In J. Müller, & F. Zambonelli (Eds.), Agent-Oriented Software Engineering VI (Vol. 3950 Lecture Notes in Computer Science, pp. 28-39). Heidelberg, Berlin, Germany: Springer.
38. Cervenka, R., Trenanský, I., Calisti, M., & Greenwood, D. (2005). AML: Agent modeling language toward industry-grade agent-based modeling. In J. Odell, P. Giorgini, & J. Müller (Eds.), Agent-Oriented Software Engineering V (Vol. 3382 Lecture Notes in Computer Science, pp. 31-46). Heidelberg, Berlin, Germany: Springer.
39. Chaffey, D., & Wood, S. (2005). Knowledge management strategy. In D. Chaffey, & S. Wood, Business information management: Improving performance using information systems (pp. 221-272). Harlow, England: Financial Times Prentice Hall.
40. Chang, J., & Scott, C. (1996). Agent-based workflow: TRP Support Environment (TSE). Computer Networks and ISDN Systems, 28(7), 1501-1511.
41. Chen, X., & Chung, P. (2006). Cross-organisational workflow enactment via progressive linking by run-time agents. In M. Ali, & R. Dapoigny (Eds.), Advances in Applied Artificial Intelligence (Vol. 4031 Lecture Notes in Computer Science, pp. 54-59). Heidelberg, Berlin, Germany: Springer.
42. Cheong, C., & Winikoff, M. (2006). Improving flexibility and robustness in agent interactions: Extending Prometheus with Hermes. In A. Garcia, R. Choren, C. Lucena, P. Giorgini, T. Holvoet, & A. Romanovsky (Eds.), Software Engineering for Multi-Agent Systems IV (Vol. 3914 Lecture Notes in Computer Science, pp. 189-206). Heidelberg, Berlin, Germany: Springer.
43. Clegg, B., & Shaw, D. (2008). Using Process-Oriented Holonic (PrOH) modelling to increase understanding of information systems. Information Systems Journal, 18(5), 447-477.
44. Collins, J., Aruachalam, R., Sadeh, N., Eriksson, J., Finne, N., & Janson, S. (2006). The supply chain management game for the 2007 trading agent competition. Carnegie Mellon University, Pittsburgh, PA, USA (2006). Research Report, http://www.sics.se/tac/tac07scmspec.pdf.

References
245
45. Costa Miranda, M., & Perkusich, A. (1999). Modeling and analysis of a multi-agent system using colored Petri nets. Proceedings of the Workshop on Applications of Petri Nets to Intelligent System Development, (pp. 59-70). Williamsburg, VA, USA.
46. Cull, R., & Eldabi, T. (2010). A hybrid approach to workflow modelling. Journal of Enterprise Information Management, 23(3), 268-281.
47. Dalmaris, P., Tsui, E., Hall, B., & Smith, B. (2007). A framework for the improvement of knowledge-intensive business processes. Business Process Management Journal, 13(2), 279-305.
48. De Backer, M., Snoeck, M., Monsieur, G., Lemahieu, W., & Dedene, G. (2009). A scenario-based verification technique to assess the compatibility of collaborative business processes. Data & Knowledge Engineering, 68(6), 531-551.
49. de Vreede, G., & Briggs, R. (2005). Collaboration engineering: Designing repeatable processes for high-value collaborative tasks. Proceedings of the 38th Annual Hawaii International Conference on System Sciences (p. 17.c). Washington, DC, USA: IEEE Computer Society.
50. de Vreede, G., Kolfschoten, G., & Briggs, R. (2006). ThinkLets: A collaboration engineering pattern language. International Journal of Computer Applications in Technology, 25(2/3), 140-154.
51. Decker, G., & Weske, M. (2007). Local enforceability in interaction Petri nets. In G. Alonso, P. Dadam, & M. Rosemann (Eds.), Business Process Management (Vol. 4714 Lecture Notes in Computer Science, pp. 305-319). Heidelberg, Berlin, Germany: Springer.
52. Decker, G., & Weske, M. (2011). Interaction-centric modeling of process choreographies. Information Systems, 36(2), 292-312.
53. DeLoach, S., Wood, M., & Sparkman, C. (2001). Multiagent systems engineering. The International Journal of Software Engineering and Knowledge Engineering, 11(3), 231-258.
54. Desel, J. (2005). Process modeling using Petri nets. In M. Dumas, W. van der Aalst, & A. ter Hofstede (Eds.), Process-Aware Information Systems: Bridging People and Software through Process Technology (pp. 147-177). Hoboken, NJ, USA: John Wiley & Sons.
55. Dietz, J. (2006). Enterprise ontology: Theory and methodology. Heidelberg, Berlin, Germany: Springer.
56. Dijkman, R., & Dumas, M. (2004). Service-oriented design: A multi-viewpoint approach. International Journal of Cooperative Information Systems, 13(4), 337-378.
57. Dijkman, R., Dumas, M., & Ouyang, C. (2008). Semantics and analysis of business processes in BPMN. Information and Software Technology, 50(12), 1281-1294.
58. Dredze, M., & Wallach, H. (2008). User models for email activity management. Proceedings of the 5th International Workshop on Ubiquitous User Modeling (pp. 438-438). New York, NY, USA: ACM.
59. Dredze, M., Lau, T., & Kushmerick, N. (2006). Automatically classifying emails into activities. Proceedings of the 11th International Conference on Intelligent User Interfaces (pp. 70-77). New York, NY, USA: ACM.
60. Dubé, L., & Paré, G. (2003). Rigor in information systems positivist case research: Current practices, trends, and recommendations. MIS Quarterly, 27(4), 597-636.
61. Duchenaut, N., & Bellotti, V. (2001). Email as habitat: An exploration of embedded personal information management. Interactions, 8(5), 30-38.

References
246
62. Dul, J., & Hak, T. (2008). Case study methodology in business research. Oxford, UK: Butterworth-Heinemann Elsevier.
63. Dumas, M., & ter Hofstede, A. (2001). UML activity diagrams as a workflow specification language. In M. Gogolla, & C. Kobryn (Eds.), UML 2001 - The Unified Modeling Language. Modeling Languages, Concepts, and Tools (Vol. 2185 Lecture Notes in Computer Science, pp. 76-90). Heidelberg, Berlin, Germany: Springer.
64. Dumas, M., van der Aalst, W., & ter Hofstede, A. (2005). Introduction. In M. Dumas, W. van der Aalst, & A. ter Hofstede (Eds.), Process-aware information systems: Bridging people and software through process technology (pp. 3-20). Hoboken, NJ, USA: John Wiley & Sons.
65. Ehrler, L., Fleurke, M., Purvis, M., & Savarimuthu, B. (2006). Agent-based workflow management systems (WfMSs): JBees – a distributed and adaptive WfMS with monitoring and controlling capabilities. Journal of Information Systems and E-Business Management, 4(1), 5-23.
66. Eisenhardt, K. (1989). Building theories from case study research. The Academy of Management Review, 14(4), 532-550.
67. Eisenhardt, K. (2007). Theory building from cases: Opportunities and challenges. Academy of Management Journal, 50(1), 25-32.
68. Erl, T. (2005). Service-oriented architecture: Concepts, technology, and design. Upper Saddle River, NJ, USA: Prentice Hall.
69. Eshuis, R. (2002). Semantics and verification of UML activity diagrams for workflow modeling. PhD Thesis, University of Twente, http://doc.utwente.nl/64834/1/eshuis.pdf.
70. Eshuis, R., & Grefen, P. (2008). Constructing customized process views. Data & Knowledge Engineering, 64(2), 419-438.
71. Ferber, J., & Gutknecht, O. (1998). A meta-model for the analysis and design of organizations in multi-agent systems. Proceedings of the 3rd International Conference on Multi Agent Systems (pp. 128-135). Washington, DC, USA: IEEE Computer Society.
72. Fischer, L. (1995). The workflow paradigm: The impact of information technology on business process reengineering (2nd ed.). Alameda, CA, USA: Future Strategies Inc.
73. Genesereth, M., & Ketchpel, S. (1994). Software agents. Communications of the ACM, 37(7), 48-53.
74. Genilloud, G., & Wegmann, A. (2000). A foundation for the concept of role in object modeling. Proceedings of the 4th International Conference on Enterprise Distributed Object Computing (pp. 76-85). Washington, DC, USA: IEEE Computer Society.
75. Ghattas, J., & Soffer, P. (2009). Evaluation of inter-organizational business process solutions: A conceptual model-based approach. Information Systems Frontiers, 11(3), 273-291.
76. Gibbert, M., Ruigrok, W., & Wicki, B. (2008). What passes as a rigorous case study? Strategic Management Journal, 29(13), 1465-1474.
77. Goedertier, S., Haesen, R., & Vanthienen, J. (2008). Rule-based business process modelling and enactment. International Journal of Business Process Integration and Management, 3(3), 194-207.
78. Gottschalk, F., van der Aalst, W., Jansen-Vullers, M., & Verbeek, H. (2007). Protos2CPN: Using colored Petri nets for configuring and testing business processes. International Journal on Software Tools for Technology Transfer, 10(1), 95-110.
79. Gratton, L. (2004). The democratic enterprise: Liberating your business with freedom, flexibility and commitment. London, UK: Financial Times Prentice Hall.

References
247
80. Gregor, S., & Hevner, A. (2011). Introduction to the special issue on design science. Information Systems and e-Business Management, 9(1), 1-9.
81. Gwidzka, J. (2002). Reinventing the inbox: Supporting the management of pending tasks in email. Extended Abstracts of the Conference on Human Factors in Computing Systems (pp. 550-551). New York, NY, USA: ACM.
82. Hägglund, M., Scandurra, I., & Kochab, S. (2010). Scenarios to capture work processes in shared homecare: From analysis to application. International Journal of Medical Informatics, 79(6), 126-134.
83. Hahn, C., Madrigal-Mora, C., & Fischer, K. (2008). A platform-independent metamodel for multiagent systems. Autonomous Agents and Multi-Agent Systems, 18(2), 239-266.
84. Hall, J., & Johnson, M. (2009). When should a process be art, not science? Harvard Business Review, 87(3), 58-65.
85. Hanachi, C., & Sibertin-Blanc, C. (2004). Protocol moderators as active middle-agents in multi-agent systems. Autonomous Agents and Multi-Agent Systems, 8(2), 131-164.
86. Harrison, L., Sessions, R., & Hong, W. (2006). Head and neck cancer: A multidisciplinary approach (3rd ed.). Philadelphia, PA, USA: Wolters Kluwer/Lippincott Williams & Wilkins.
87. Harrison-Broninski, K. (2005). Human interactions: The heart and soul of business process management. Tampa, FL, USA: Meghan-Kiffer Press.
88. Harrison-Broninski, K. (2010). Human processes: Playing in the orchestra on the titanic. Technical Report, BPTrends, http://www.bptrends.com/publicationfiles/ONE_01-10-COL-HumanProcesses-Harrison-Broninski-20091224.pdf.
89. Hawryszkiewycz, I., & Debenham, J. (1998). A workflow system based on agents. In G. Quirchmayr, E. Schweighofer, & T. Bench-Capon (Eds.), Database and Expert Systems Applications (Vol. 1460 Lecture Notes in Computer Science, pp. 135-144). Heidelberg, Berlin, Germany: Springer.
90. Hevner, A., March, S., Park, J., & Ram, S. (2004). Design science in information systems research. MIS Quarterly, 28(1), 75-105.
91. Holmström, J., & Främling, K. (2006). Product centric integration: Exploring the impact of RFID and agent technology on supply chain management. In L. Camarinha-Matos, H. Afsarmanesh, & M. Ollus (Eds.), Network-Centric Collaboration and Supporting Frameworks (Vol. 224 IFIP International Federation for Information Processing, pp. 565-572). Heidelberg, Berlin, Germany: Springer.
92. Holmström, J., Kajosaari, R., Främling, K., & Langius, E. (2009). Roadmap to tracking based business and intelligent products. Computers in Industry, 60(3), 229-233.
93. Hommes, B. (2004). The evaluation of business process modeling techniques. PhD Thesis, Delf University of Technology, http://www.m3pe.org/reading/Hommes-PhD-EvaluationBPMTechniques.pdf.
94. Houy, C., Fettke, P., & Loos, P. (2010). Empirical research in business process management - Analysis of an emerging field of research. Business Process Management Journal, 16(4), 619-661.
95. Huang, C., Trappey, A., & Yao, Y. (2006). Developing an agent-based workflow management system for collaborative product design. Industrial Management & Data Systems, 106(5), 680-699.

References
248
96. Huser, V., Peissig, P., Christensen, C., & Starren, J. (2010). PS1-21: Evaluation of commercial workflow engine for modeling clinical processes in quality improvement and decision support. Clinical Medicine & Research, 8(1), 46-46.
97. Huvio, E., Grönvall, J., & Främling, K. (2002). Tracking and tracing parcels using a distributed computing approach. Proceedings of 14th Annual Conference for Nordic Researchers in Logistics (pp. 29-43). Trondheim, Norway: Norwegian University of Science and Technology.
98. IBM Corporation. (2008). The new collaboration: Enabling innovation, changing the workplace. Technical Report, IBM Corporation, http://www-935.ibm.com/services/us/cio/pdf/new-collaboration-white-paper.pdf.
99. IETF. (2001). Internet message format. Technical Report, The Internet Engineering Task Force (IETF), http://www.ietf.org/rfc/rfc2822.txt.
100. Illgen, J., & Gledhill, D. (2001). 21st century verification and validation techniques for synthetic training models and simulations. Proceedings of the 2001 Simulation Technology and Training Conference (SIMTecT 2001). Lindfield, NSW, Australia: SIAA.
101. Jagdev, H., & Thoben, K. (2001). Anatomy of enterprise collaboration. Production Planning & Control, 12(5), 437-451.
102. Jennings, N., Faratin, P., Norman, T., O'Brien, P., & Odgers, B. (2000). Autonomous agents for business process management. International Journal of Applied AI, 2, 145-189.
103. Jennings, N., Faratin, P., Norman, T., O'Brien, P., Odgers, B., & Olty, J. (2000). Implementing a business process management system using ADEPT: A real-world case study. International Journal of Applied AI, 14(5), 421-465.
104. Jensen, K. (1994). An introduction to the theoretical aspects of coloured Petri nets. In J. de Bakker, W. de Roever, & G. Rozenberg (Eds.), A Decade of Concurrency Reflections and Perspectives (Vol. 803 Lecture Notes in Computer Science, pp. 230-272). Heidelberg, Berlin, Germany: Springer.
105. Jensen, K. (1997). Hierarchical coloured Petri nets. In K. Jensen, Coloured Petri nets: Basic concepts, analysis methods and practical use volume 1 (2nd ed., pp. 89-119). Heidelberg, Berlin, Germany: Springer.
106. Jensen, K., Kristensen, L., & Wells, L. (2007). Coloured Petri nets and CPN Tools for modelling and validation of concurrent systems. International Journal on Software Tools for Technology Transfer, 9(3), 213-254.
107. Jeston, J., & Nelis, J. (2006). Business process management: Practical guidelines to successful implementations. Oxford, UK: Butterworth-Heinemann Elsevier.
108. Jimenez, G. (2009). Business process engineering. In J. Cardoso, & W. van der Aalst (Eds.), Handbook of research on business process modelling (pp. 366-383). Hershey, NY, USA: Information Science Reference.
109. Joeris, G. (2000). Decentralized and flexible workflow enactment based on task coordination agents. Proceedings of the 2nd International Bi-Conference Workshop on Agent-Oriented Information Systems (pp. 41-62). Berlin, Germany: iCue Publishing.
110. Kalpic, B., & Bernus, P. (2002). Business process modelling in industry - The powerful tool in enterprise management. Computers in Industry, 47(3), 299-318.
111. Kane, B., & Luz, S. (2006). Multidisciplinary medical team meetings: An analysis of collaborative working with special attention to timing and teleconferencing. Computer Supported Cooperative Work, 15(5/6), 501-535.

References
249
112. Kärkkäinen, M., Ala-Risku, T., & Främling, K. (2003). The product centric approach: A solution to supply network information management problems? Computers in Industry, 147-159.
113. Kelemen, J. (2003). The agent paradigm. Computing and Informatics, 22(6), 513-519. 114. Kerr, B. (2003). Thread arcs: An email thread visualization. Proceedings of the 9th
Annual IEEE Symposium on Information Visualization (pp. 211-218). Los Alamitos, CA, USA: IEEE Computer Society.
115. Khoussainov, R., & Kushmerick, N. (2005). Email task management: An iterative relational learning approach. Proceedings of the 2th Conference on Email and Anti-Spam.
116. King, S., & Johnson, O. (2006). VBP: An approach to modeling process variety and best practice. Information and Software Technology, 48(11), 1104-1114.
117. Klimt, B., & Yang, Y. (2004). The enron corpus: A new dataset for email classification research. In J. Boulicaut, F. Esposito, F. Giannotti, & D. Pedreschi (Eds.), Machine Learning: ECML 2004 (Vol. 3201 Lecture Notes in Computer Science, pp. 217-226). Heidelberg, Berlin, Germany: Springer.
118. Knudson, G. (2009). Transforming email 'noise' into business process knowledge. Technical Report, ebizq, http://www.ebizq.net/topics/bpm/features/11142.html.
119. Köhler, M., Moldt, D., & Rölke, H. (2001). Modelling the structure and behaviour of Petri net agents. In J. Colom, & M. Koutny (Eds.), Applications and Theory of Petri Nets 2001 (Vol. 2075 Lecture Notes in Computer Science, pp. 224-241). Heidelberg, Berlin, Germany: Springer.
120. Kolfschoten, G., Briggs, R., Appelman, J., & de Vreede, G. (2004). ThinkLets as building blocks for collaboration processes: A further conceptualization. In G. de Vreede, L. Guerrero, & G. Marín Raventós (Eds.), Groupware: Design, Implementation and Use (Vol. 3198 Lecture Notes in Computer Science, pp. 137-152). Heidelberg, Berlin, Germany: Springer.
121. Kolfschoten, G., Briggs, R., de Vreede, G., Jacobs, P., & Appelman, J. (2006). A conceptual foundation of the thinkLet concept for collaboration engineering. International Journal of Human-Computer Studies, 64(7), 611-621.
122. Kolfschoten, G., de Vreede, G., Briggs, R., & Sol, H. (2010). Collaboration 'engineerability'. Group Decision and Negotiation, 19(3), 301-321.
123. Kushmerick, N., & Lau, T. (2005). Automated email activity management: An unsupervised learning approach. Proceedings of the 10th International Conference on Intelligent User Interfaces (pp. 67-74). New York, NY, USA: ACM.
124. Kushmerick, N., Lau, T., Dredze, M., & Khoussainov, R. (2006). Activity-centric email: A machine learning approach. Proceedings of the 21st National Conference on Artificial Intelligence (pp. 1634-1637). Boston, MA, USA: AAAI Press.
125. Lenz, R., & Reichert, M. (2005). IT support for healthcare processes. In W. van der Aalst, B. Benatallah, F. Casati, & F. Curbera (Eds.), Business Process Management (Vol. 3649 Lecture Notes in Computer Science, pp. 354-363). Heidelberg, Berlin, Germany: Springer.
126. Lewis, D., & Knowles, K. (1997). Threading electronic mail: A preliminary study. Information Processing & Management, 33(2), 209-217.
127. Li, L., Hosking, J., & Grundy, J. (2007). EML: A tree overlay-based visual language for business process modelling. Proceedings of the 9th International Conference on Enterprise Information Systems (pp. 131-137). Setubal, Portugal: INSTICC.

References
250
128. Lian, J., & Schatz, S. (2008). A modeling methodology for conflict control in multi-agent systems. International Journal of Software Engineering and Knowledge Engineering, 18(3), 263-303.
129. Lin, F., & Norrie, D. (2001). Schema-based conversation modeling for agent-oriented manufacturing systems. Computers in Industry, 46(3), 259-274.
130. Lin, F., Yang, M., & Pai, Y. (2002). A generic structure for business process modelling. Business Process Management Journal, 8(1), 19-41.
131. Lindsay, A., Downs, D., & Lunn, K. (2003). Business processes - Attempts to find a definition. Information and Software Technology, 45(15), 1015-1019.
132. Liu, C., Li, Q., & Zhao, X. (2009). Challenges and opportunities in collaborative business process management: Overview of recent advances and introduction to the special issue. Information Systems Frontiers, 11(3), 201-209.
133. Loshin, P. (1999). Essential email standards: RFCs and protocols made practical. New York, NY, USA: John Wiley & Sons.
134. Luck, M., McBurney, P., Shehory, O., & Willmott, S. (2005). Agent technology: Computing as interaction. Technical Report, AgentLink, http://www.agentlink.org/roadmap/al3rm.pdf.
135. Malhotra, S., Jordan, D., Shortliffe, E., & Patel, V. (2007). Workflow modeling in critical care: Piecing together your own puzzle. Journal of Biomedical Informatics, 40(2), 81-92.
136. Mans, R., Russell, N., van der Aalst, W., Bakker, P., Moleman, A., & Jaspers, M. (2010). Proclets in healthcare. Journal of Biomedical Informatics, 43(4), 632-649.
137. March, S., & Smith, G. (1995). Design and natural science research on information technology. Decision Support Systems, 15(4), 251-266.
138. Marshall, M. (1996). The key informant technique. Family Practice, 13(1), 92-97. 139. Mayer, R., Painter, M., & deWitte, P. (1992). IDEF family of methods for concurrent
engineering and business reengineering applications. Technical Report, Knowledge Based Systems, Inc., http://www.idef.com/pdf/IDEFFAMI.pdf.
140. McDaniel, S., Olson, G., & Magee, J. (1996). Identifying and analyzing multiple threads in computer-mediated and face-to-face conversations. Proceedings of the Conference on Computer Supported Cooperative Work (pp. 39-47). New York, NY, USA: ACM.
141. Melão, N., & Pidd, M. (2000). A conceptual framework for understanding business processes and business process modeling. Information Systems Journal, 10(2), 105-129.
142. Mendling, J., Reijers, H., & Recker, J. (2010). Activity labeling in process modeling: Empirical insights and recommendations. Information Systems, 35(4), 467-482.
143. Meyer, G., & Szirbik, N. (2007a). Anticipatory alignment mechanisms for behavioral learning in multi agent systems. In M. Butz, O. Sigaud, G. Pezzulo, & G. Baldassarre (Eds.), Anticipatory Behavior in Adaptive Learning Systems (Vol. 4520 Lecture Notes in Computer Science, pp. 325-344). Heidelberg, Berlin, Germany: Springer.
144. Meyer, G., & Szirbik, N. (2007b). Agent behavior alignment: A mechanism to overcome problems in agent interactions during runtime. In M. Klusch, K. Hindriks, M. Papazoglou, & L. Sterling (Eds.), Cooperative Information Agents XI (Vol. 4676 Lecture Notes in Computer Science, pp. 270-284). Heidelberg, Berlin, Germany: Springer.
145. Meyer, G., Främling, K., & Holmström, J. (2009). Intelligent products: A survey. Computers in Industry, 60(3), 137-148.

References
251
146. Middleton, S., Barnett, J., & Reeves, D. (2001). What is an integrated care pathway? What is?, 3(3), 1-8.
147. Minkov, E., Balasubramanyan, R., & Cohen, W. (2008). Activity-centred search in email. Proceedings of the 5th Conference on Email and Anti-Spam. Mountain View, CA, USA: CEAS.
148. Miyamoto, T., Sakamoto, M., & Kumagai, S. (2007). On reachability analysis of multi agent nets. IEICE Transactions on Fundamentals of Electronics, Communications and Computer Sciences, E90-A(10), 2257-2260.
149. Moitra, D., & Ganesh, J. (2005). Web services and flexible business processes: Towards the adaptive enterprise. Information and Management, 42(7), 921-933.
150. Moldt, D., & Wienberg, F. (1997). Multi-agent systems based on coloured Petri nets. In P. Azema, & G. Balbo (Eds.), Application and Theory of Petri Nets 1997 (Vol. 1248 Lecture Notes in Computer Science, pp. 82-101). Heidelberg, Berlin, Germany: Springer.
151. Moran, T., Cozzi, A., & Farrell, S. (2005). Unified activity management: Supporting people in e-business. Communications of the ACM, 48(12), 67-70.
152. Norta, A., & Eshuis, R. (2010). Specification and verification of harmonized business-process collaborations. Information Systems Frontiers, 12(4), 457-479.
153. Nwana, H. (1996). Software agents: An overview. Knowledge Engineering Review, 11(3), 205-244.
154. Nwana, H., Lee, L., & Jennings, N. (1996). Co-ordination in software agent systems. British Telecom Technology Journal, 14(4), 79-88.
155. OASIS. (2007). Web services business process execution language version 2.0. Technical Report, Organization for the Advancement of Structured Information Standards (OASIS), http://docs.oasis-open.org/wsbpel/2.0/OS/wsbpel-v2.0-OS.pdf.
156. Odell, J., Van Dyke Parunak, H., & Bauer, B. (2000). Extending UML for agents. Proceedings of the Agent-Oriented Information Systems Workshop at the 17th National Conference on Artificial Intelligence (pp. 3-17). Austin, TX, USA: AAAI Press.
157. Odell, J., Van Dyke Parunak, H., & Bauer, B. (2001). Representing agent interaction protocols in UML. In P. Ciancarini, & M. Wooldridge (Eds.), Agent-Oriented Software Engineering (Vol. 1957 Lecture Notes in Computer Science, pp. 201-218). Heidelberg, Berlin, Germany: Springer.
158. Odell, J., Van Dyke Parunak, H., & Fleischer, M. (2003). Modeling agent organizations using roles. Software and Systems Modeling, 2(2), 76-81.
159. Offerman, M., & Pruyn, J. (2009). Goede zorg voor mensen met kanker in het hoofd-halsgebied: Kwaliteitscriteria gezien vanuit de patient. Technical Report, Patiëntenvereniging NSvG en Stichting Klankbord, http://www.stichtingklankbord.nl/klankbord/images/stories/brochure_klankbord.pdf.
160. Oliveira de Almeida, H., da Silva, L., Perkusich, A., & de Barris Costa, E. (2005). A formal approach for the modelling and verification of multiagent plans based on model checking and Petri nets. In R. Choren, A. Garcia, C. Lucena, & A. Romanovsky (Eds.), Software Engineering for Multi-Agent Systems III (Vol. 3390 Lecture Notes in Computer Science, pp. 162-179). Heidelberg, Berlin, Germany: Springer.
161. Oude Luttighuis, P., Lankhorst, M., van de Wetering, R., Balb, R., & van den Berg, H. (2001). Visualising business processes. Computer Languages, 27(1-3), 39-59.
162. Pace, D. (2004). Modeling and simulation verification and validation challenges. John Hopkins APL Technical Digest, 25(2), 163-172.

References
252
163. Padgham, L., & Winikoff, M. (2003). Prometheus: A methodology for developing intelligent agents. In F. Giunchiglia, J. Odell, & G. Weiss (Eds.), Agent-Oriented Software Engineering III (Vol. 2585 Lecture Notes in Computer Science, pp. 174-185). Heidelberg, Berlin, Germany: Springer.
164. Padgham, L., & Winikoff, M. (2004). Developing intelligent agent systems: A practical guide. Chichester, West Sussex, England: John Wiley & Sons.
165. Padilla, R. (2008). Stopping the email bloat: Are your business processes and email the same thing? Technical Report, TechRepublic, http://techrepublic.com.com/5208-12848-0.html?forumID=102&threadID=271141&start=0.
166. Palacz, K., & Marinescu, D. (2000). An agent-based workflow management system. Proceedings of the AAAI Spring Symposium 2000 (pp. 119-126). Menlo Park, CA, USA: AAAI Press.
167. Palme, J. (1998). Message threading in e-mail software. Technical Report, Department of Computer and Systems Sciences, Stockholm University, http://people.dsv.su.se/~jpalme/ietf/message-threading.pdf.
168. Panella, M., Vanhaecht, K., & Sermeus, W. (2009). Care pathways: From clinical pathways to care innovation. International Journal of Care Pathways, 13(2), 49-50.
169. Partsakoulakis, I., & Vouros, G. (2006). Agent-enhanced collaborative activity in organized settings. International Journal of Cooperative Information Systems, 15(1), 119-154.
170. Patton, M. (2002). Qualitative research and evaluation methods (3rd ed.). Thousand Oaks, CA, USA: Sage Publications.
171. Pelz, C. (2003). Web services orchestration and choreography. IEEE Computer, 36(8), 46-52.
172. Pesic, M., & van der Aalst, W. (2006). A declarative approach for flexible business processes management. In J. Eder, & S. Dustdar (Eds.), Business Process Management Workshops (Vol. 4103 Lecture Notes in Computer Science, pp. 169-180). Heidelberg, Berlin, Germany: Springer.
173. Popolov, D., Callaghan, M., & Luker, P. (2000). Conversation space: Visualising multi-threaded conversation. Proceedings of the Working Conference on Advanced Visual Interfaces (pp. 246-249). New York, NY, USA: ACM.
174. Presley, A., & Liles, D. (2001). A holon-based process modeling methodology. International Journal of Operations & Production Management, 21(5/6), 565-581.
175. Pruyn, J. (2002). Op weg naar vanzelfsprekende samenwerking!? Research Report (Oration), Tilburg University, http://www.ikc.nl/uploaded/bibliotheek_upload_document/1550/folder_pruyn.pdf.
176. Ragin, C. (1999). The distinctiveness of case-oriented research. Health Services Research, 34(5), 1137-1151.
177. Rajsiri, V., Bénaben, F., Lorré, J., & Pingaud, H. (2010). Knowledge-based system for collaborative process specification. Computers in Industry, 61(2), 161-175.
178. Reddy, M., Bardram, J., & Gorman, P. (2009). Special issue call for papers: Supporting collaboration in healthcare settings. International Journal of Medical Informatics, 78(11), I.
179. Reijers, H., & Mendling, J. (2008). Modularity in process models: Review and effects. In M. Dumas, M. Reichert, & M. Shan (Eds.), Business Process Management (Vol. 5240 Lecture Notes in Computer Science, pp. 20-35). Heidelberg, Berlin, Germany: Springer.

References
253
180. Reijers, H., Russell, N., van der Geer, S., & Krekels, G. (2010). Worfklow for healthcare: A methodology for realizing flexible medical treatment processes. In S. Rinderle-Ma, S. Sadiq, & F. Leymann (Eds.), Business Process Management Workshops (Vol. 43(7) Lecture Notes in Business Information Processing, pp. 593-604). Heidelberg, Berlin, Germany: Springer.
181. Resnick, P., Hansen, D., Riedl, J., Terveen, L., & Ackerman, M. (2005). Beyond threaded conversation. Extended Abstracts of the Conference on Human Factors in Computing Systems (pp. 2138-2139). New York, NY, USA: ACM.
182. Ricci, A., Omicini, A., & Denti, E. (2002). Virtual enterprises and workflow management as agent coordination issues. International Journal of Cooperative Information Systems, 11(3/4), 355-379.
183. Roest, G., & Szirbik, N. (2009). Escape and intervention in multi-agent systems. AI & Society, 24(1), 25-34.
184. Rohall, S., Gruen, D., Moody, P., Wattenberg, M., Stern, M., Kerr, B., et al. (2004). ReMail: A reinvented email prototype. Extended Abstracts of the Conference on Human Factors in Computing Systems (pp. 791-792). New York, NY, USA: ACM.
185. Rojo, M., Rolón, E., Calahorra, L., García, F., Sánchez, R., Ruiz, F., et al. (2008). Implementation of the Business Process Modelling Notation (BPMN) in the modelling of anatomic pathology processes. Diagnostic Pathology, 3(Suppl 1), S22.
186. Rosen, E. (2007). The culture of collaboration: Maximizing time, talent and tools to create value in the global economy. San Francisco, CA, USA: Red Ape Publishing.
187. Rosenkranz, C., & Holten, R. (2011). The variety engineering method: Analyzing and designing information flows in organizations. Information Systems and e-Business Management, 9(1), 11-49.
188. Rozinat, A., de Jong, I., Günther, C., & van der Aalst, W. (2009). Conformance analysis of ASML´s test process. Proceedings of the Second International Workshop on Governance, Risk and Compliance (pp. 1-15). Aachen, Germany: CEUR-WS.org.
189. Ryu, K., & Yücesan, E. (2007). CPM: A collaborative process modelling for cooperative manufacturers. Advanced Engineering Informatics, 21(2), 231-239.
190. Sargent, R. (2007). Verification and validation of simulation models. Proceedings of the 39th Conference on Winter Simulation (pp. 124-137). Piscataway, NJ, USA: IEEE Press.
191. Savarithmu, B., Purvis, M., & Purvis, M. (2005). Different perspectives on modeling workflows in an agent based workflow management system. In R. Khosla, R. Howlett, & L. Jain (Eds.), Knowledge-Based Intelligent Information and Engineering Systems (Vol. 3684 Lecture Notes in Computer Science, pp. 208-214). Heidelberg, Berlin, Germany: Springer.
192. Scapens, R. (2004). Doing case study research. In C. Humphrey, & B. Lee (Eds.), The real life guide to accounting research: A behind-the-scenes view of using qualitative research methods (pp. 257-279). Oxford, UK: Elsevier.
193. Scheer, W., Thomas, O., & Adam, O. (2005). Process modeling using event-driven process chains. In M. Dumas, W. van der Aalst, & A. ter Hofstede (Eds.), Process-Aware Information Systems: Bridging People and Software through Process Technology (pp. 119-145). Hoboken, NJ, USA: John Wiley & Sons.
194. Seligmann, P., Wijers, G., & Sol, H. (1989). Analysing the structure of IS methodologies. Proceedings of the 1st Dutch Conference on Information Systems, (pp. 1-28). Amersfoort, The Netherlands.

References
254
195. Shaw, S. (2007). New reality: Workplace collaboration is crucial. Technical Report, Eedo Knowledgeware, http://www.eclo.org/pages/uploads/File/Non-ECLO%20Publications/Workplace%20Collaboration%20is%20Crucial.pdf.
196. Shvaiko, P., & Euzenat, J. (2008). Ten challenges for ontology matching. In R. Meersman, & Z. Tari (Eds.), On the Move to Meaningful Internet Systems: OTM 2008 (Vol. 5332 Lecture Notes in Computer Science, pp. 1164-1182). Heidelberg, Berlin, Germany: Springer.
197. Sierhuis, M., Clancey, W., & van Hoof, R. (2007). Brahms: A multiagent modelling environment for simulating work processes and practices. International Journal of Simulation and Process Modelling, 3(3), 134-152.
198. Siggelkow, N. (2007). Persuasion with case studies. Academy of Management Journal, 50(1), 20-24.
199. Singh, M., & Huhns, M. (1999). Multiagent systems for workflow. International Journal of Intelligent Systems in Accounting, Finance & Management, 8(2), 105-117.
200. Stanford, N. (2005). Organization design: The collaborative approach. Oxford, UK: Butterworth-Heinemann Elsevier.
201. Steimann, F. (2000a). A radical revision of UML’s role concept. In A. Evans, S. Kent, & B. Selic (Eds.), «UML» 2000 — The Unified Modeling Language (Vol. 1939 Lecture Notes in Computer Science, pp. 194-209). Heidelberg, Berlin, Germany: Springer.
202. Steimann, F. (2000b). On the representation of roles in object-oriented and conceptual modeling. Data & Knowledge Engineering, 35(1), 83-106.
203. Steimann, F. (2001). Role = interface: A merger of concepts. Journal of Object-Oriented Programming, 14(4), 23-32.
204. Stohr, E., & Zhao, J. (2001). Workflow automation: Overview and research issues. Information Systems Frontiers, 3(3), 281-296.
205. Stuit, M. (2006). Decomposing role-based interactions between agents. Proceedings of the 8th European Agent Systems Summer School, http://www.agentlab.nl/marco/publications/Stuit2006b.pdf.
206. Stuit, M., & Meyer, G. (2008). Improving enterprise interoperability by identifying agent interactions using product-centric data. Proceedings of the International Workshop on Agent-Based Technologies and Applications for Enterprise Interoperability (pp. 82-93). Estoril, Portugal: IFAAMAS.
207. Stuit, M., & Meyer, G. (2009). Agent interaction modeling based on product-centric data: A formal method to improve enterprise interoperability. In K. Fischer, J. Müller, J. Odell, & A. Berre (Eds.), Agent-Based Technologies and Applications for Enterprise Interoperability (Vol. 25 Lecture Notes in Business Information Processing, pp. 197-219). Heidelberg, Berlin, Germany: Springer.
208. Stuit, M., & Szirbik, N. (2006). Embodied interactions: A way to model and execute complex and changing business processes with agents. In G. O'Hare, A. Ricci, M. O'Grady, & O. Dikenelli (Ed.), Proceedings of The Seventh Annual International Workshop Engineering Societies in the Agent World (pp. 169-184). Dublin, Ireland: University College Dublin.
209. Stuit, M., & Szirbik, N. (2007). Modelling and executing complex and dynamic business processes by reification of agent interactions. In G. O'Hare, A. Ricci, M. O'Grady, & O. Dikenelli (Eds.), Engineering Societies in the Agents World VI (Vol. 4457 Lecture Notes in Computer Science, pp. 106-125). Heidelberg, Berlin, Germany: Springer.

References
255
210. Stuit, M., & Szirbik, N. (2009). Towards agent-based modeling and verification of collaborative business processes: An approach centered on interactions and behaviors. International Journal of Cooperative Information Systems, 18(3/4), 423-479.
211. Stuit, M., & Wortmann, J. (2010). A collaboration process study with application of agent interaction and behavior diagrams. Proceedings of the 2010 International Symposium on Collaborative Technologies and Systems (pp. 302-313). Washington, DC, USA: IEEE Computer Society.
212. Stuit, M., Szirbik, N., & de Snoo, C. (2007). Interaction beliefs: A way to understand emergent organizational behaviour. Proceedings of the Ninth International Conference on Enterprise Information Systems. Software Agents and Internet Computing, pp. 241-248. Funchal, Madeira, Portugal: INSTICC.
213. Stuit, M., Szirbik, N., & Wortmann, J. (2007a). Mapping structural and process models in agent-based simulations of organisations. Proceedings of the 4th Workshop on Agents for Complex Systems (pp. 41-48). Timisoara, Romania: Department of Computer Science, West University of Timisoara.
214. Stuit, M., Szirbik, N., & Wortmann, J. (2007b). Building agent-based simulations using structural and process mental models. Post-Proceedings of the Ninth International Symposium on Symbolic and Numeric Algorithms for Scientific Computing (pp. 267-274). Los Alamitos, CA, USA: IEEE Computer Society.
215. Sturm, A., Dori, D., & Shehory, O. (2003). Single-model method for specifying multi-agent systems. Proceedings of the Second International Joint Conference on Autonomous Agents and Multiagent Systems (pp. 121-128). New York, NY, USA: ACM.
216. Szirbik, N., & Stuit, M. (2009). Default interactions for multi-agent simulations of complex organizations. Proceedings of the International Workshop on Enterprises & Organizational Modeling and Simulation, 458, http://doi.acm.org/10.1145/1750405.1750416.
217. Szirbik, N., Stuit, M., & Meyer, G. (2009). Dynamic agent hierarchies for design prototypes. Proceedings of the 18th IEEE International Workshops on Enabling Technologies: Infrastructures for Collaborative Enterprises, 2009. WETICE '09. (pp. 7-12). Washington, DC, USA: IEEE Computer Society.
218. Tarumi, H., Kida, K., Ishiguro, Y., Yoshifu, K., & Asakura, T. (1997). WorkWeb system – Multi-workflow management with a multi-agent system. Proceedings of the International ACM SIGGROUP Conference on Supporting Group Work: The Integration Challenge (pp. 299-308). New York, NY, USA: ACM.
219. Taveter, K., & Wagner, G. (2002). A multi-perspective methodology for modelling inter-enterprise business processes. In H. Arisawa, & Y. Kambayashi (Eds.), Conceptual Modeling for New Information Systems Technologies (Vol. 2465 Lecture Notes in Computer Science, pp. 403-416). Heidelberg, Berlin, Germany: Springer.
220. Thimm, R., & Will, T. (2004). AMIRA – A state of the art analysis of workflow modelling and agent-based information systems. Research Report, http://www.wi2.uni-trier.de/publications/2004_TechnicalReport_thimmWill.pdf.
221. Trenanský, I., & Cervenka, R. (2005). Agent Modeling Language (AML): A comprehensive approach to modeling MAS. Informatica, 29(4), 391-400.
222. Tsay, J., Wu, B., & Jeng, Y. (2009). Hierarchically organized layout for visualization of biochemical pathways. Artificial Intelligence in Medicine, 48(2/3), 107-117.
223. Uden, L., Kumaresan, A., & Salmenjoki, K. (2007). Usable collaborative email requirements using activity theory. Informatica, 31(1), 71-83.

References
256
224. Vaishnavi, V., & Kuechler Jr., W. (2008). Design science research methods and patterns: Innovating information and communication technology. Auerbach Publications: New York, NY, USA.
225. van Aken, J. (2004). Management research based on the paradigm of the design sciences: The quest for field-tested and grounded technological rules. Journal of Management Studies, 41(2), 219-246.
226. van der Aalst, W. (1997). Verification of workflow nets. In P. Azema, & G. Balbo (Eds.), Application and Theory of Petri Nets 1997 (Vol. 1248 Lecture Notes in Computer Science, pp. 407-426). Heidelberg, Berlin, Germany: Springer.
227. van der Aalst, W. (1998). The application of Petri nets to workflow management. The Journal of Circuits, Systems and Computers, 8(1), 21-66.
228. van der Aalst, W. (2000a). Loosely coupled interorganizational workflows: Modeling and analyzing workflows crossing organizational boundaries. Information and Management, 37(2), 67-75.
229. van der Aalst, W. (2000b). Workflow verification: Finding control-flow errors using Petri-net-based techniques. In W. van der Aalst, J. Desel, & A. Oberweis (Eds.), Business Process Management (Vol. 1806 Lecture Notes in Computer Science, pp. 161-183). Heidelberg, Berlin, Germany: Springer.
230. van der Aalst, W. (2004). Business process management: A personal view. Business Process Management Journal, 10(2), 135-139.
231. van der Aalst, W., & Nikolov, A. (2008). Mining e-mail messages: Uncovering interaction patterns and processes using e-mail logs. International Journal of Intelligent Information Technologies, 4(3), 27-45.
232. van der Aalst, W., & van Hee, K. (2002). Workflow management: Models, methods and systems. Cambridge, MA, USA: The MIT Press.
233. van der Aalst, W., & Weske, M. (2005). Case handling: A new paradigm for business process support. Data & Knowledge Engineering, 53(2), 129-162.
234. van der Aalst, W., Barthelmess, P., Ellis, C., & Wainer, J. (2001). Proclets: A framework for lightweight interacting workflow processes. International Journal of Cooperative Information Systems, 10(4), 443-482.
235. van der Aalst, W., Pesic, M., & Schonenberg, H. (2009). Declarative workflows: Balancing between flexibility and support. Computer Science - Research and Development, 23(2), 99-113.
236. van der Aalst, W., ter Hofstede, A., Kiepuszewski, B., & Barros, A. (2003). Workflow patterns. Distributed and Parallel Databases, 14(1), 5-51.
237. van der Aalst, W., van Dongen, B., Herbst, J., Maruster, L., Schimm, G., & Weijters, A. (2003). Workflow mining: A survey of issues and approaches. Data and Knowledge Engineering, 47(2), 237-267.
238. Vankipuram, M., Kahol, K., Cohen, T., & Patel, V. (2010). Toward automated workflow analysis and visualization in clinical environments. Journal of Biomedical Informatics, http://dx.doi.org/10.1016/j.jbi.2010.05.015.
239. Venable, J. (2006). A framework for design science research activities. Proceedings of the Information Resource Management Association Conference (pp. 184-187). Hershey, PA, USA: Idea Group Publishing.
240. Venolia, G., & Neustaedter, C. (2003). Understanding sequence and reply relationships within email conversations: A mixed-model visualization. Proceedings of the SIGCHI Conference on Human Factors in Computing Systems (pp. 361-368). New York, NY, USA: ACM.

References
257
241. Venolia, G., Dabbish, L., Cadiz, J., & Gupta, A. (2001). Supporting email workflow. Technical Report, Microsoft Research, http://research.microsoft.com/pubs/69881/tr-2001-88.pdf.
242. Verginadis, Y., & Mentzas, G. (2008). Agents and workflow engines for inter-organizational workflows in e-government cases. Business Process Management Journal, 14(2), 188-203.
243. Wagner, G. (2003). The agent-object-relationship metamodel: Towards a unified view of state and behavior. Information Systems, 28(5), 475-504.
244. Walshe, K., & Smith, J. (2006). Introduction: The current and future challenges of healthcare management. In K. Walshe, & J. Smith (Eds.), Healthcare management (pp. 1-9). Maidenhead, Berkshire, England: Open University Press.
245. Wang, M., & Wang, H. (2005). Intelligent agent supported business process management. Proceedings of the 38th Annual Hawaii International Conference on System Sciences (pp. 71b-71b). Washington, DC, USA: IEEE Computer Society.
246. Wang, M., & Wang, H. (2006). From process logic to business logic – A cognitive approach to business process management. Information and Management, 43(2), 179-193.
247. WCPT. (2003). European Physiotherapy Benchmark Statement. Technical Report, World Confederation for Physical Therapy (WCPT), http://www.fysiot.ee/dok/01.pdf.
248. Weske, M. (2007). Business process management: Concepts, languages, architectures. Heidelberg, Berlin, Germany: Springer.
249. Weyns, D., & Holvoet, T. (2002). A colored Petri net for a multi-agent application. Proceedings of the Second Workshop on Modelling of Objects, Components and Agents (pp. 121-141). Aarhus, Denmark: University of Aarhus.
250. WfMC. (1999). Workflow management coalition: Terminology & glossary. Technical Report, Workflow Management Coalition (WfMC), http://www.wfmc.org/standards/docs/TC-1011_term_glossary_v3.pdf.
251. White, S. (2004). Introduction to BPMN. Technical Report, IBM Corporation, http://www.bpmn.org/Documents/Introduction_to_BPMN.pdf.
252. Whittaker, S. (2005). Supporting collaborative task management in e-mail. Human-Computer Interaction, 20(1), 49-88.
253. Whittaker, S., & Sidner, C. (1996). Email overload: Exploring personal information management of email. Proceedings of the SIGCHI Conference on Human Factors in Computing Systems (pp. 276-283). New York, NY, USA: ACM.
254. Wooldridge, M. (2009). An introduction to multiagent systems (2nd ed.). Chichester, West Sussex, England: John Wiley & Sons.
255. Wooldridge, M., & Jennings, N. (1995). Intelligent agents: Theory and practice. Knowledge Engineering Review, 10(2), 115-152.
256. Wooldridge, M., Jennings, N., & Kinny, D. (2000). The GAIA methodology for agent-oriented analysis and design. Autonomous Agents and Multi-Agent Systems, 3(3), 285-312.
257. Wu, B., Wang, M., & Yun, M. (2009). An agent-based system for healthcare process management. Proceedings of the 11th International Conference on Enterprise Information Systems (pp. 45-49). Setubal, Portugal: INSTICC.
258. Wynn, M., Verbeek, H., van der Aalst, W., ter Hofstede, A., & Edmond, D. (2009). Business process verification – Finally a reality! Business Process Management Journal, 15(1), 74-92.

References
258
259. Xu, D., Volz, R., Loerger, T., & Yen, J. (2002). Modeling and verifying multi-agent behaviors using predicate/transition nets. Proceedings of the 14th International Conference on Software Engineering and Knowledge Engineering (pp. 193-200). New York, NY, USA: ACM.
260. Yan, Y., Maamar, Z., & Shen, W. (2001). Integration of workflow and agent technology for business process management. Proceedings of The Sixth International Conference on Computer Supported Cooperative Work in Design (pp. 420-426). Los Alamitos, CA, USA: IEEE Computer Society.
261. Yates, J., Orlikowski, W., & Woerner, S. (2003). Virtual organizing: Using threads to coordinate distributed work. Proceedings of the 36th Annual Hawaii International Conference on System Sciences (p. 271.2). Washington, DC, USA: IEEE Computer Society.
262. Yeh, J., & Harnley, A. (2006). Email thread reassembly using similarity matching. Proceedings of the 3th Conference on Email and Anti-Spam. Mountain View, CA, USA: CEAS.
263. Yin, R. (2003). Case study research: Design and methods (3rd ed.). Thousand Oaks, CA, USA: Sage Publications.
264. Zacarias, M., Pinto, H., Magelhães, R., & Tribolet, J. (2009). A ‘context-aware’ and agent-centric perspective for the alignment between individuals and organizations. Information Systems, 35(4), 441-466.
265. Zambonelli, F., & Omicini, A. (2004). Challenges and research directions in agent-oriented software engineering. Autonomous Agents and Multi-Agent Systems, 9(3), 253-283.
266. Zambonelli, F., Jennings, N., & Wooldridge, M. (2001). Organizational abstractions for the analysis and design of multi-agent systems. In P. Ciancarini, & M. Wooldridge (Eds.), Agent-Oriented Software Engineering (Vol. 1957 Lecture Notes in Computer Science, pp. 407-422). Heidelberg, Berlin, Germany: Springer.

Samenvatting (Dutch Summary)

Samenvatting (Dutch Summary)
260
enselijke SamenwerkingsProcessen (MSPs), die bestaan uit een structuur van samenhangende interacties (zoals vergaderingen, gesprekken, overleg, discussies), vormen een essentieel onderdeel van
de activiteiten van een moderne organisatie. Hoewel menselijke interacties in de praktijk als een effectieve manier van samenwerken worden gebruikt, worden zij door organisaties niet gedefinieerd – laat staan beheerd – als een bedrijfsproces. Daarom zijn MSPs niet ontvankelijk voor procesontwerp, analyse en verbetering.
In dit onderzoek wordt beargumenteerd dat bestaande grafische benaderingen voor procesmodellering tekortkomingen hebben in het modelleren van processen die intensieve menselijke samenwerking en interactie vereisen voor hun voltooiing. Dit komt voornamelijk door hun focus op workflow processen, en de definitie en automatisering van workflow processen als taakstructuren.
Dit proefschrift draagt bij aan de grafische beschrijving van MSPs in organisaties, als een noodzakelijke voorwaarde voor hun analyse en verbetering. Een nieuwe interactie-centrische procesmodelleringsaanpak, genaamd TALL, wordt gepresenteerd. Het ontwerp van de aanpak is geïnspireerd door het agent paradigma. De organisatorische context waarin een MSP plaatsvindt, wordt gezien als een multi-agent omgeving waarin verschillende agenten acteren in rol-gebaseerde interacties om hun werk te coördineren.
Casestudy’s van MSPs binnen organisaties, die worden uitgevoerd binnen een ontwerpwetenschappelijke methodologie, worden gebruikt voor de illustratie, toepassing, ontwikkeling en evaluatie van de aanpak. Elke casestudy identificeert procesinzichten en verbeteringen, breidt de aanpak uit op basis van empirische bevindingen en draagt bij aan theorievorming. De resultaten van dit proefschrift suggereren dat de TALL procesmodelleringsaanpak een innovatieve, bruikbare en effectieve aanvulling is op de bestaande praktijk en onderzoek in het bedrijfsprocesmanagement domein.
M

Dankwoord (Acknowledgements)

Dankwoord (Acknowledgements)
262
The PhD research presented here was performed at the Department of Business & ICT of the Faculty of Economics & Business at the University of Groningen, the Netherlands. I express my gratitude to all people who supported me during the research project. There are several people that I would like to thank in particular. First and foremost, I offer my gratitude to my supervisors prof. dr. ir. Hans Wortmann and dr. Nick Szirbik. They motivated and helped me to apply for a PhD position in the first place. Nick, I am grateful for the opportunity to build on your research and the freedom you gave me to develop my own ideas. I also appreciate very much your easy accessibility and availability throughout the research project. Hans, without your guidance and support this research and the casework would not have been possible. You always made time to provide comments and coaching despite your busy schedule. I thank both of you for your advice and insights, and of course for your help in writing and reviewing the papers that make up the core of this thesis. On the same lines, I would like to thank the other members of the reading committee, prof. dr. G. Wagner, prof. dr. ir. A. Verbraeck, and prof. dr. ir. C.T.B. Ahaus for assessing the quality of this dissertation and approving the manuscript. Secondly, I would like to thank all (former) colleagues from the Department of Business & ICT. Several colleagues deserve special mention. These are the fellow (ex-)members of The Agent Lab: Gerben Meyer, Gijs Roest, Wilrik Mook, Bert-Jan Broeksema, and Bas Dijkstra. Gerben, despite our different research topics, we wrote an interesting paper together that constitutes Chapter 3 of this dissertation. Gijs, Wilrik and Bert-Jan, thank you for your essential technical expertise on programming the software tools that are part of this research. The same thank you goes to Bas, who worked with me as a student-assistant, and completed both his bachelor and master thesis under my supervision. Furthermore, I would like to thank Alex Alblas, Nick van Beest, and Javid Koochaki for being my (former) office mates and for several fruitful discussions. Finally, I would like to express my gratitude to the secretaries for their support. They include from the department Durkje van Lingen-Elzinga, Irene Ravenhorst and Iris Huizinga, and from the SOM research school Ellen Nienhuis. Case studies of real-life business processes are an essential part of this research. I am grateful to all involved employees from the three case organizations. I want to

Dankwoord (Acknowledgements)
263
thank all interviewees for their availability and knowledge sharing. From the University Medical Center Groningen, I am grateful in particular to Prof. Jan Roodenburg and Rachel Dopheide. Jan, thank you for your broad (scientific) interest, for building internal commitment for my research, and for your contribution to our paper in Chapter 6. Rachel, thank for your assistance on providing organizational documentation and organizing the data collection process. From the municipality of Oldambt, I am grateful in particular to Irmgard Buissink for her guidance, support, and input during the conception and execution of my casework there. From the N.V. Nederlandse Gasunie, I thank Peter Baard for his support, interest and enthusiasm, and for building internal support for my research. A special thank you goes to my mother and sister. Even though we live quite close to each other, we did not see each other as often as I would have liked to. Thank you for understanding this and for always being there. Mom, I have the deepest respect for the fact that you did such a good job in raising Petra and me alone. I cannot wish for a better mother. I also thank my family in law for their kindness and hospitality. My final words go to my wife Nadine. We joked several times about what I would write about you in the acknowledgements of my dissertation. Clearly, there are not enough words to express my gratitude for your unconditional support and love throughout all the phases of this journey, and for putting up with my grumpy behaviour on many occasions. I love you and look forward to spending the rest of my life with you. I dedicate this dissertation to you! Marco Stuit Groningen, April 2011