University of Groningen Live-Cell Imaging Tool ... fileThe Gram-positive soil bacterium Bacillus...
10
University of Groningen Live-Cell Imaging Tool Optimization To Study Gene Expression Levels and Dynamics in Single Cells of Bacillus cereus Eijlander, Robyn T.; Kuipers, Oscar Published in: Applied and environmental microbiology DOI: 10.1128/AEM.01347-13 IMPORTANT NOTE: You are advised to consult the publisher's version (publisher's PDF) if you wish to cite from it. Please check the document version below. Document Version Publisher's PDF, also known as Version of record Publication date: 2013 Link to publication in University of Groningen/UMCG research database Citation for published version (APA): Eijlander, R. T., & Kuipers, O. P. (2013). Live-Cell Imaging Tool Optimization To Study Gene Expression Levels and Dynamics in Single Cells of Bacillus cereus. Applied and environmental microbiology, 79(18), 5643-5651. https://doi.org/10.1128/AEM.01347-13 Copyright Other than for strictly personal use, it is not permitted to download or to forward/distribute the text or part of it without the consent of the author(s) and/or copyright holder(s), unless the work is under an open content license (like Creative Commons). Take-down policy If you believe that this document breaches copyright please contact us providing details, and we will remove access to the work immediately and investigate your claim. Downloaded from the University of Groningen/UMCG research database (Pure): http://www.rug.nl/research/portal. For technical reasons the number of authors shown on this cover page is limited to 10 maximum. Download date: 17-02-2019
Transcript of University of Groningen Live-Cell Imaging Tool ... fileThe Gram-positive soil bacterium Bacillus...

University of Groningen
Live-Cell Imaging Tool Optimization To Study Gene Expression Levels and Dynamics inSingle Cells of Bacillus cereusEijlander, Robyn T.; Kuipers, Oscar
Published in:Applied and environmental microbiology
DOI:10.1128/AEM.01347-13
IMPORTANT NOTE: You are advised to consult the publisher's version (publisher's PDF) if you wish to cite fromit. Please check the document version below.
Document VersionPublisher's PDF, also known as Version of record
Publication date:2013
Link to publication in University of Groningen/UMCG research database
Citation for published version (APA):Eijlander, R. T., & Kuipers, O. P. (2013). Live-Cell Imaging Tool Optimization To Study Gene ExpressionLevels and Dynamics in Single Cells of Bacillus cereus. Applied and environmental microbiology, 79(18),5643-5651. https://doi.org/10.1128/AEM.01347-13
CopyrightOther than for strictly personal use, it is not permitted to download or to forward/distribute the text or part of it without the consent of theauthor(s) and/or copyright holder(s), unless the work is under an open content license (like Creative Commons).
Take-down policyIf you believe that this document breaches copyright please contact us providing details, and we will remove access to the work immediatelyand investigate your claim.
Downloaded from the University of Groningen/UMCG research database (Pure): http://www.rug.nl/research/portal. For technical reasons thenumber of authors shown on this cover page is limited to 10 maximum.
Download date: 17-02-2019

Live-Cell Imaging Tool Optimization To Study Gene ExpressionLevels and Dynamics in Single Cells of Bacillus cereus
Robyn T. Eijlander, Oscar P. Kuipers
Top Institute Food and Nutrition (TIFN), Wageningen, The Netherlands; Department of Molecular Genetics, Groningen Biomolecular Sciences and Biotechnology Institute,
University of Groningen, Groningen, The Netherlands
Single-cell methods are a powerful application in microbial research to study the molecular mechanism underlying phenotypic
heterogeneity and cell-to-cell variability. Here, we describe the optimization and application of single-cell time-lapse fluores-
cence microscopy for the food spoilage bacterium Bacillus cereus specifically. This technique is useful to study cellular develop-
ment and adaptation, gene expression, protein localization, protein mobility, and cell-to-cell communication over time at the
single-cell level. By adjusting existing protocols, we have enabled the visualization of growth and development of single B. cereus
cells within a microcolony over time. Additionally, several different fluorescent reporter proteins were tested in order to select
the most suitable green fluorescent protein (GFP) and red fluorescent protein (RFP) candidates for visualization of growth stage-
and cell compartment-specific gene expression in B. cereus. With a case study concerning cotD expression during sporulation,
we demonstrate the applicability of time-lapse fluorescence microscopy. It enables the assessment of gene expression levels, dy-
namics, and heterogeneity at the single-cell level. We show that cotD is not heterogeneously expressed among cells of a subpopu-
lation. Furthermore, we discourage using plasmid-based reporter fusions for such studies, due to an introduced heterogeneity
through copy number differences. This stresses the importance of using single-copy integrated reporter fusions for single-cell
studies.
The Gram-positive soil bacterium Bacillus cereus is a knowncause of food spoilage and food-borne illnesses of both diar-
rheal and emetic types. Over the last decades, research concerningthis problematic microorganism has focused on various differentresearch disciplines, including toxin production and virulence (1,2), resistancemechanisms against applied stresses (3, 4), cell struc-ture, metabolism (5, 6), and cellular developments, such as celldivision, biofilm formation (7), sporulation (8), and spore germi-nation (9). In this way, B. cereus is becoming an increasingly stud-iedmodel organism forGram-positive pathogenic bacteria next toits well-known but fairly distant and nonpathogenic relative Ba-cillus subtilis. In contrast to such studies of the latter, in-depthstudies on B. cereus are still hampered by the lack of suitable andeffective molecular biological tools and are often restricted due topoor genetic accessibility of the strains. Importantly, there hasbeen an increasing number of reports that mention phenotypicheterogeneity in the above-described processes (10–13), and phe-notypic heterogeneity can be defined as the emergence of sub-populations within an isogenic culture. Such phenotypic hetero-geneity increases the chances of survival of a given species duringfrequent and random environmental changes (14). In industrialapplication, however, it complicates the predictability of micro-bial behavior and, as a result, the eradication of food spoilageBacillus spp. from foodstuffs by conventional food preservationtechniques (15, 16).
Using the sporulation and spore germination processes as anexample, we previously discussed the molecular basis of such het-erogeneity in B. cereus populations (16). We suggested that appli-cation of single-cell techniqueswould achieve further insights intothis phenotypic variation. Combinations of such techniques withfluorescent reporters can further couple the observed phenotypicheterogeneity to underlying molecular mechanisms.
Here, we describe the applicability of time-lapse fluorescencemicroscopy for B. cereus to investigate levels and dynamics of and
heterogeneity in gene expression and furthermore demonstrateimportant technical constraints of the technique. Studies with B.subtilis have shown that heterogeneity in sporulation and in sporeproperties can be attributed to differences in gene expression andprotein levels between individual cells (17–19). In order to studythese phenomena in B. cereus, we have optimized time-lapse fluo-rescence microscopy specifically for this organism. Even thoughusability of this technique has been described for several species ofbacteria, including B. subtilis, Escherichia coli, and Streptococcuspneumoniae (20, 21), application of the described methods for B.cereus cells was unsuccessful. By adjusting medium composition,cell culture preparation, and slide preparation, we demonstratedgrowth and sporulation of B. cereus cells under the microscope ina single layer from single cell to microcolony. In this way, we havestudied the dynamics of expression of the sporulation gene cotD ofB. cereus ATCC 14579 in single cells. CotD is produced duringlate-stage sporulation in the mother cell under the control of spo-rulation-specific sigma factor s
K (23). It is localized in the innercoat of the spore, which is important for the spores’ resistanceproperties (23, 24).
For decades, fluorescent proteins (FPs) have been successfullyemployed as tools for biological imaging (25–27). Continued de-velopment of a wide range of FP variants has decreased the bio-logical and spectral limitations of the ones initially available (25).
Received 6 May 2013 Accepted 4 July 2013
Published ahead of print 12 July 2013
Address correspondence to Oscar P. Kuipers, [email protected].
Supplemental material for this article may be found at http://dx.doi.org/10.1128
/AEM.01347-13.
Copyright © 2013, American Society for Microbiology. All Rights Reserved.
doi:10.1128/AEM.01347-13
September 2013 Volume 79 Number 18 Applied and Environmental Microbiology p. 5643–5651 aem.asm.org 5643
on S
epte
mber 1
8, 2
013 b
y U
niv
ers
ity o
f Gro
nin
ge
nh
ttp://a
em
.asm
.org
/D
ow
nlo
ad
ed
from

On the other hand, choosing an FP for any experimental questionor organism at study has become more complicated. The selectionof the most suitable candidate for a specific experiment greatlydepends on influencing factors such as the pHof the environment,the presence of ions, multimerization and toxicity, cultivationtemperature, the availability of oxygen, photostability, and spec-tral overlap (28). Species-specific codon-optimized or mutatedvariants of FPs are increasingly utilized to maximize the transcrip-tion, translation, and fluorescent capacities of the proteins foroptimal fluorescence in specific species or experimental setups(29–31). To enable tracking of gene expression during all growthstages of B. cereus and to improve the availablemolecular tool box,we have also tested a few readily available green fluorescent pro-teins (GFPs) and red fluorescent proteins (RFPs) in order to selectthe most suitable candidates for this organism.
MATERIALS AND METHODS
Strains and plasmids. All strains and plasmids used in this study are listedin Table 1. As a reference strain, Bacillus cereus ATCC 14579 was used.Foreign DNA was introduced in this strain either by using multicopyplasmids or by single-crossover DNA integration using the nonreplicativepSG1151 vector, introduced via electroporation (32).
For the construction of the pSG14cotD vector, an 800-bp fragment ofthe region upstream of the B. cereus ATCC 14579 cotD gene (BC1560) wasamplified using primers Bce14_cD800HindIII-F and Bce14_cDpstI-R(see Table S1 in the supplemental material). The fragment was cleavedwith HindIII and PstI and ligated into the corresponding sites of the
pSG1151 vector (33), enabling a transcriptional fusion to the gfpmut1
gene. Electroporation of the resulting pSG14cotD vector into competent
cells of B. cereus ATCC 14579 and selection on LB agar plates (containing
4 mg/ml chloramphenicol) resulted in a single-crossover event of the vec-
tor on the region of homology with the region upstream of cotD. Correct
integration of the fusion into the chromosomewas verified using PCR and
sequencing (Macrogen).
To study optimal fluorescence performance in B. cereus, we se-
lected several readily available GFPs and RFPs. For green fluorescence,
we tested GFPmut3a (34), sfGFP(Bs) (superfolder GFP [35], which
was B. subtilis codon optimized using the dual-codon method (48),
and GFP(Sp) (GFP codon optimized for S. pneumoniae) (36). For red
fluorescence, we selected mCherry (37) and mKate2 (38, 39). The
gfpmut3a gene on pAD123 (34) was replaced by genes encoding these
variants, using the XbaI and HindIII restriction sites. The resulting
vectors (pAD641, pAD642, pAD650, and pAD651) are listed in Table
1. The expression of the FP-encoding genes in B. cereus was driven by
different promoters, as listed in Table 2. For this purpose, promoter-
containing fragments (approximately 250 bp each) were amplified by
PCR from B. cereus ATCC 14579 chromosomal DNA using primers
TIFN73 and TIFN74, TIFN75 and Bce14-upctD-XbaI-R, and TIFN77
and TIFN78 (see Table S1 in the supplemental material). Alternatively,
the 1,400-bp upp fragment was cleaved from pAD43-25 (34) using
KpnI and XbaI restriction enzymes (Fermentas FastDigest). These
fragments were subsequently ligated into the KpnI/XbaI sites of the
obtained pAD vectors. The vectors were introduced into B. cereus
ATCC 14579 via electroporation and selection on LB agar plates with
the addition of chloramphenicol (4 mg/ml).
TABLE 1 Plasmids and strains used in this study
Strain or plasmid Description Source(s)
Strains
B. cereus ATCC 14579 Enterotoxic strain of B. cereus wild-type isolate ATCC, BGSC ID6A5
B. cereus ATCC 14579 PcotD-gfpmut1 PcotD-gfpmut1 This study
Plasmids
pSG1151 Vector for integrative P-gfpmut1 fusions in B. subtilis 33
pSG14cotD pSG1151 with gfpmut1 driven by B. cereus cotD promoter This study
pAD123 E. coli Gram-positive shuttle vector containing gfpmut3a 34
pAD123-A gfpmut3a driven by B. cereus secA promoter This study
pAD123-D gfpmut3a driven by B. cereus cotD promoter This study
pAD123-G gfpmut3a driven by B. cereus sigG promoter This study
pAD43-25 gfpmut3a driven by 1.4-kb insert of B. cereus UW85 DNA 34
pAD641 pAD123 derivative with gfpmut3a replaced by sfgfp(Bs) This study
pAD641-A sfgfp(Bs) driven by B. cereus secA promoter This study
pAD641-D sfgfp(Bs) driven by B. cereus cotD promoter This study
pAD641-G sfgfp(Bs) driven by B. cereus sigG promoter This study
pAD641-25 sfgfp(Bs) driven by 1.4-kb insert of B. cereus UW85 DNA This study
pAD642 pAD123 derivative with gfpmut3a replaced by gfp(Sp) This study
pAD642-A gfp(Sp) driven by B. cereus secA promoter This study
pAD642-D gfp(Sp) driven by B. cereus cotD promoter This study
pAD642-G gfp(Sp) driven by B. cereus sigG promoter This study
pAD642-25 gfp(Sp) driven by 1.4-kb insert of B. cereus UW85 DNA This study
pAD650 pAD123 derivative with gfp replaced by mCherry This study
pAD650-A mCherry driven by B. cereus secA promoter This study
pAD650-D mCherry driven by B. cereus cotD promoter This study
pAD650-G mCherry driven by B. cereus sigG promoter This study
pAD650-25 mCherry driven by 1.4-kb insert of B. cereus UW85 DNA This study
pAD651 pAD123 derivative with gfp replaced by mKate2 This study
pAD651-A mKate2 driven by B. cereus secA promoter This study
pAD651-D mKate2 driven by B. cereus cotD promoter This study
pAD651-G mKate2 driven by B. cereus sigG promoter This study
pAD651-25 mKate2 driven by 1.4-kb insert of B. cereus UW85 DNA This study
Eijlander and Kuipers
5644 aem.asm.org Applied and Environmental Microbiology
on S
epte
mber 1
8, 2
013 b
y U
niv
ers
ity o
f Gro
nin
ge
nh
ttp://a
em
.asm
.org
/D
ow
nlo
ad
ed
from
Culture preparation. All B. cereus cultures were grown at 30°C withshaking at 220 rpm. For the preparation of cells for time-lapse micros-copy, cells were diluted to an optical density at 600 nm (OD600) of 0.1fromovernight cultures in hydrolyzed casein (CH)medium (40), with theaddition of 4 mg/ml chloramphenicol when appropriate. To allow forsporulation, cells were harvested at early exponential phase (OD600, ;0.7)and resuspended in the same volume of chemically defined medium(CDM) (20). Cells were allowed to adapt to this medium for 15 min at30°C with shaking at 220 rpm prior to a 1:4 dilution in CDM. Of thisdilution, 1.5 ml was spread on a strip of time-lapse polyacrylamide (PAA)(see below).
Slide preparation. To support growth and development under themicroscope, we spread cells on specially prepared time-lapse microscopyslides as previously described by de Jong et al. in 2011 (20), with a fewadjustments. Most importantly, instead of low-melting-point agarose,polyacrylamide was used. A detailed description of the slide preparationcan be found in the text in the supplemental material. In short, we per-formed the following steps:
1. Prepare a gene frame glass slide as is described in steps 2.1 to 2.3 inthe protocol description by de Jong et al. (20).
2. Mix 1.5 ml of supplemented time-lapse medium (see the text inthe supplemental material) with 500 ml 40% PAA solution (ac-rylamine-BIS [N,N-methylenebisacrylamide], 37.5:1; Serva).Add 20 ml 10% ammonium persulfate (APS) and 2 ml TEMED(N,N,N=,N=-tetramethylethylenediamine) and pour 500 ml ofthis liquid within the gene frame. Apply pressure with anotherglass slide. Leave at room temperature for 30 min to allow forpolymerization.
3. Cut the PAApatch in six equal-sized strips using a sterilized scalpel.Wash the strips in sterile deionized water and supplemented time-lapse medium.
4. Place up to three strips between a new gene frame, making surethere are gaps on either side of the slice.
5. Add 1.5 ml of prepared cells (see “Culture preparation”) onto aPAA strip as described in steps 2.9 and 2.10 in the protocol descrip-tion in reference 20.
6. Place a clean microscope slide coverslip (24 by 50 mm) on the geneframe fromone side to the other. Immediately search for single cellsby using an inverted microscope with a prewarmed climate cham-ber and time-lapse microscopy software.
Time-lapse microscopy. For the visualization of growth and develop-ment of B. cereus cells, we used an IX71 microscope (Olympus) with aCoolSNAP HQ2 camera (Princeton Instruments) and DeltaVision soft-WoRx 3.6.0 (Applied Precision) software as previously described in point3 of the protocol section of reference 20, with the following adjustments.A 603 phase-contrast objective was used with a GFP filter set (Chroma)(excitation at 470/40 nm and emission at 525/50 nm) for visualization ofgreen fluorescence. Images were taken every 15 or 20 min using 32%APLLC white-light-emitting diode (LED) light and 0.05-s exposure forbright-field pictures and 10% xenon light with 0.5 s exposure for GFPdetection.
Fluorescence microscopy. B. cereus cells containing pAD vectors (Ta-ble 1) were grown in maltose sporulation medium (MSM) with the addi-
tion of chloramphenicol (4 mg/ml) at 30°C and shaking at 220 rpm. Flu-orescence at various time points was analyzed using the Nikon TI-Emicroscope with a CoolSNAP H2Q camera. The fluorescein isothiocya-nate (FITC) filter (excitation at 465 to 495 nm, dichroic mirror [DM] at505 nm, barrier filter [BA] at 515 to 555 nm) was used for visualization ofgreen fluorescence and the tetramethyl rhodamine isothiocyanate(TRITC) filter (excitation at 528 to 553 nm, DM at 565 nm, BA at 590 to650 nm) for red fluorescence. A 3100 magnification lens was used. By useof IS Elements software, all pictures were taken using the following set-tings: pixel size, 1,280 by 1,024 (no binning); phase-contrast exposure at150 ms, gain of 8; and FITC/TRITC exposure at 60 ms, gain of 2.
Image analysis. Pictures were adjusted and analyzed in ImageJ soft-ware (http://rsb.info.nih.gov/ij/). Equal adjustment settings were appliedto images taken for each FP variant but were optimized per promoter.This allowed for signal comparison between GFPs or RFPs but not be-tween promoters.
GFP intensities per cell per frame were determined in arbitrary unitsby measuring the pixel intensity of 16-bit images by using the region ofinterest (ROI) tool. For the time-lapse data analysis, the GFP intensity ofstrains containing PcotD-gfp as an integrated single copy or on the pADvector was determined for 180 cells or 131 cells, respectively. For quanti-fication of the fluorescence signal derived from several FP variants ex-pressed from the pAD vector, a minimum of 300 cells per strain wascounted. Measurements were exported to Excel and normalized by sub-tracting background fluorescence levels of the microscopy slide (agarose)and autofluorescence of the cells or spores (highest fluorescence valuemeasured for promoterless vectors). Normalized fluorescence levels weredetermined and set to absolute values (,0 5 0).Mean fluorescence valuesand the intensity distributions were calculated using Excel, and after this,the data were plotted.
Flow cytometry analysis. To verify fluorescence distributions of cellscontaining GFP variants controlled by different promoters, flow cytom-etry analysis was applied. Overnight cultures were diluted to an OD600 of0.1 in fresh MSM with the addition of chloramphenicol (4 mg/ml) andgrown at 30°C with shaking at 220 rpm. Multiple samples were analyzedusing a BD FACS Canto flow cytometer at specific time points. The bestsignals were observed at T3 for Pupp, T4 for PsecA, and T23 for PcotD andPsigG, where the variable represents the number of hours after initial dilu-tion. The voltage settings were set to forward scatter (FSC) 10, side scatter(SSC) 300, and FL-1 600 (FITC/GFP). FSC and SSC threshold levels wereset to 200,measuring 50,000 events per sample.Once the cells had reachedlate exponential growth phase, they were briefly treated in a bead beater(Mini-Bead-Beater-8; Biospec Products) without glass beads prior to be-ing measured for homogeneity. Data were captured using FACSDiva soft-ware (BD Biosciences) and further analyzed using WinMDI 2.8 software(http://facs.scripps.edu/software.html).
RESULTS
Optimization of culture and slide preparation results in visual-ization of growth and development of B. cereus cells using time-lapse microscopy. Studying cellular development (as well as geneexpression and protein localization) at the single-cell level pro-vides valuable insights that are generally missed by using tech-niques focused on or limited to bacterial populations. Time-lapsemicroscopy is a powerful technique which allows for tracking and
TABLE 2 Selected promoters for transcription of various gfp and rfp genes
Promoter Gene locus tag Properties
PsecA BC5189 Strong promoter for the essential secA gene during vegetative growth (22)
PcotD BC1560 Sporulation-specific promoter activated during late-stage sporulation in the mother cell (23)
PsigG BC3903 Sporulation-specific promoter activated during late-stage sporulation in the forespore (41)
Pupp The =glyA fragment plus the upstream region of the upp gene from B. cereus UW85, which
has been described as a strong constitutive promoter during vegetative growth (34)
Bacillus cereus Time-Lapse Microscopy
September 2013 Volume 79 Number 18 aem.asm.org 5645
on S
epte
mber 1
8, 2
013 b
y U
niv
ers
ity o
f Gro
nin
ge
nh
ttp://a
em
.asm
.org
/D
ow
nlo
ad
ed
from
visualization of growth and development from a single cell into amicrocolony over time. Application of this tool for B. cereus cellsby using previously described techniques and protocols for B. sub-tilis (20, 21) was unsuccessful (data not shown). Cells grew inmultiple layers in the z direction, grew out of the field of vision,showed a deviant morphology from cells grown in liquid culture,showed increased lysis, and failed to sporulate. For this reason, theprotocol was optimized and adjusted specifically for B. cereus. Theadjustments included a two-step cultivation method in rich CHmedium and a poor chemically defined medium (20). Moreover,instead of agarose, polyacrylamide (PAA) was used for the solidmediumon themicroscopy slide.Use of agarose caused the cells togrow in multiple layers (causing focus problems) and in longstrings that grew out of the field of vision. With PAA, the growthwas more controlled and remained in a monolayer. The PAA wasmixed with time-lapse CDM supplemented with a 1:50 dilution ofmaltose sporulation medium (MSM). This defined proportion ofavailable nutrients resulted in the most suitable growth and devel-opment of B. cereus cells on the PAA solid medium, with adequatesporulation events (Fig. 1; see Movie S1 in the supplemental ma-terial). For a detailed description of the optimized protocol, seeMaterials and Methods and also the text in the supplemental ma-terial.
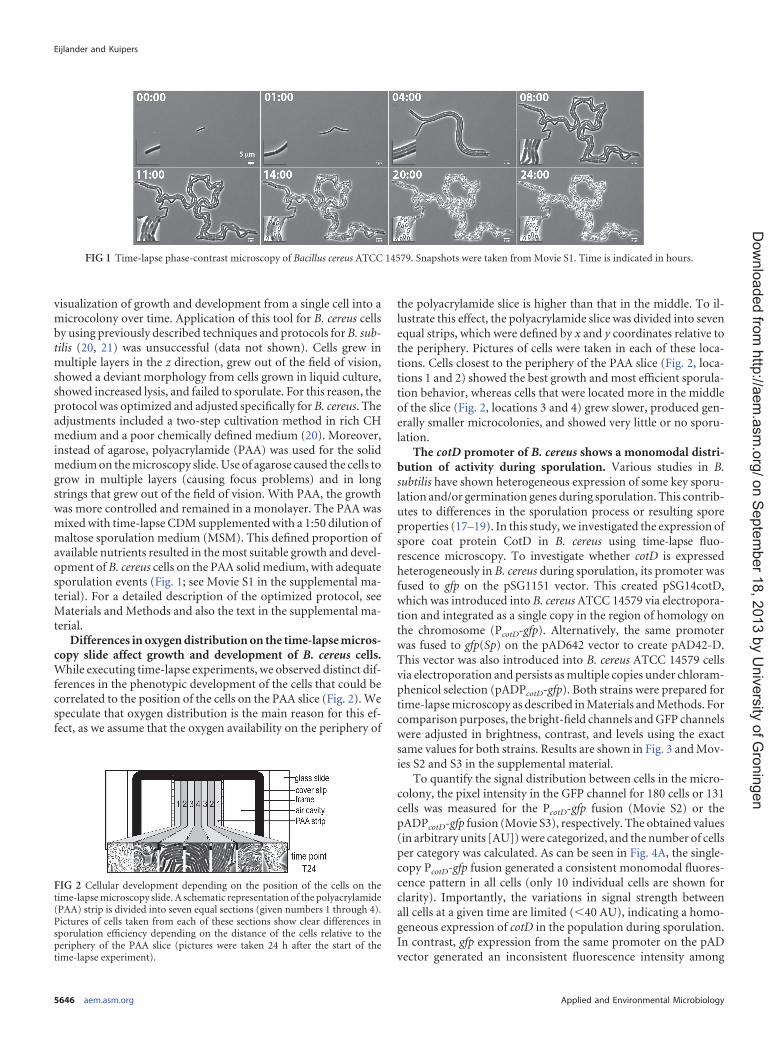
Differences in oxygen distribution on the time-lapse micros-copy slide affect growth and development of B. cereus cells.While executing time-lapse experiments, we observed distinct dif-ferences in the phenotypic development of the cells that could becorrelated to the position of the cells on the PAA slice (Fig. 2). Wespeculate that oxygen distribution is the main reason for this ef-fect, as we assume that the oxygen availability on the periphery of
the polyacrylamide slice is higher than that in the middle. To il-lustrate this effect, the polyacrylamide slice was divided into sevenequal strips, which were defined by x and y coordinates relative tothe periphery. Pictures of cells were taken in each of these loca-tions. Cells closest to the periphery of the PAA slice (Fig. 2, loca-tions 1 and 2) showed the best growth and most efficient sporula-tion behavior, whereas cells that were located more in the middleof the slice (Fig. 2, locations 3 and 4) grew slower, produced gen-erally smaller microcolonies, and showed very little or no sporu-lation.
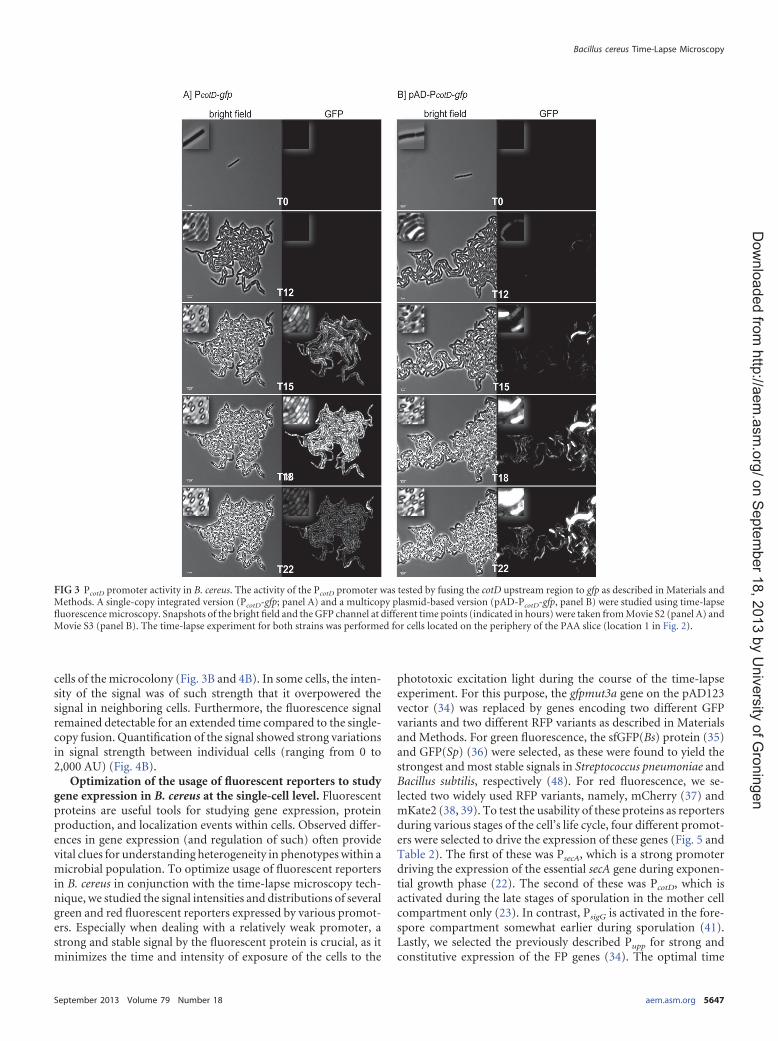
The cotD promoter of B. cereus shows a monomodal distri-bution of activity during sporulation. Various studies in B.subtilis have shown heterogeneous expression of some key sporu-lation and/or germination genes during sporulation. This contrib-utes to differences in the sporulation process or resulting sporeproperties (17–19). In this study, we investigated the expression ofspore coat protein CotD in B. cereus using time-lapse fluo-rescence microscopy. To investigate whether cotD is expressedheterogeneously in B. cereus during sporulation, its promoter wasfused to gfp on the pSG1151 vector. This created pSG14cotD,which was introduced into B. cereus ATCC 14579 via electropora-tion and integrated as a single copy in the region of homology onthe chromosome (PcotD-gfp). Alternatively, the same promoterwas fused to gfp(Sp) on the pAD642 vector to create pAD42-D.This vector was also introduced into B. cereus ATCC 14579 cellsvia electroporation and persists asmultiple copies under chloram-phenicol selection (pADPcotD-gfp). Both strains were prepared fortime-lapsemicroscopy as described inMaterials andMethods. Forcomparison purposes, the bright-field channels andGFP channelswere adjusted in brightness, contrast, and levels using the exactsame values for both strains. Results are shown in Fig. 3 and Mov-ies S2 and S3 in the supplemental material.
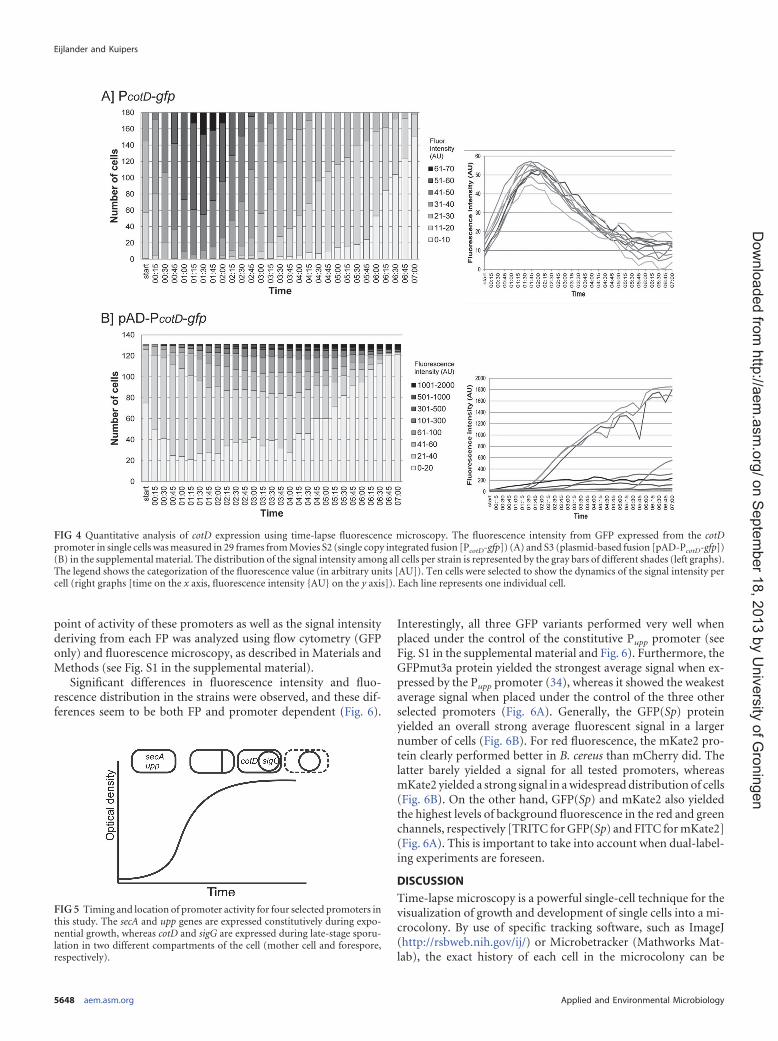
To quantify the signal distribution between cells in the micro-colony, the pixel intensity in the GFP channel for 180 cells or 131cells was measured for the PcotD-gfp fusion (Movie S2) or thepADPcotD-gfp fusion (Movie S3), respectively. The obtained values(in arbitrary units [AU])were categorized, and the number of cellsper category was calculated. As can be seen in Fig. 4A, the single-copy PcotD-gfp fusion generated a consistent monomodal fluores-cence pattern in all cells (only 10 individual cells are shown forclarity). Importantly, the variations in signal strength betweenall cells at a given time are limited (,40 AU), indicating a homo-geneous expression of cotD in the population during sporulation.In contrast, gfp expression from the same promoter on the pADvector generated an inconsistent fluorescence intensity among
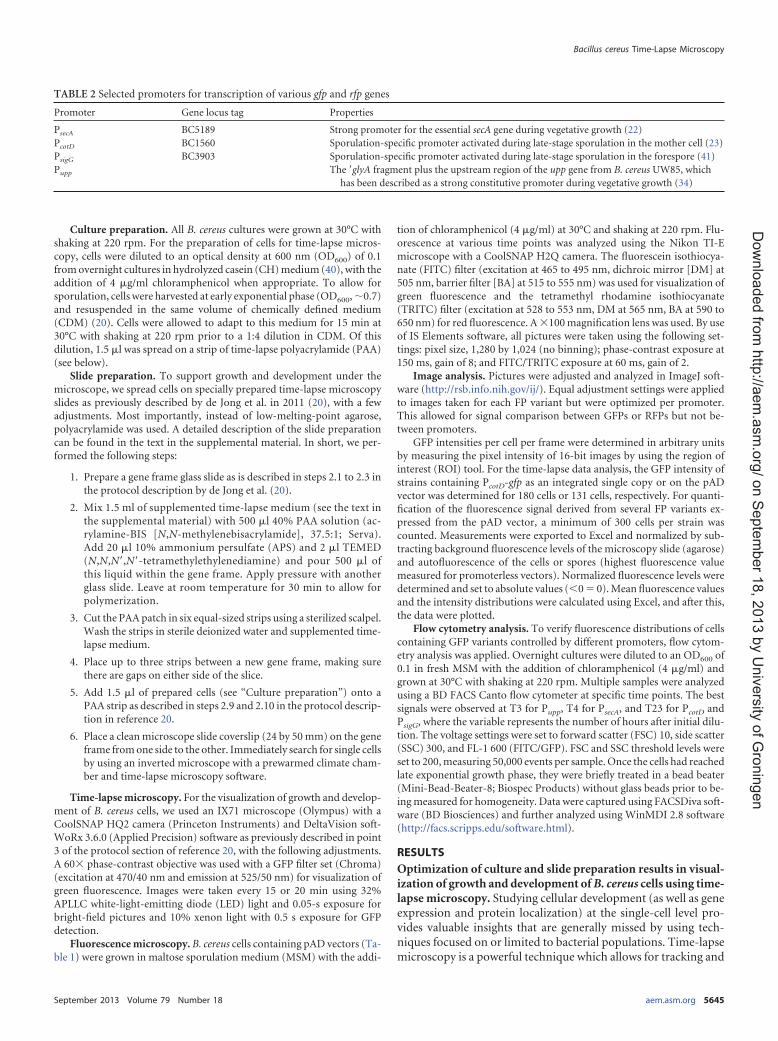
FIG 1 Time-lapse phase-contrast microscopy of Bacillus cereus ATCC 14579. Snapshots were taken from Movie S1. Time is indicated in hours.
FIG 2 Cellular development depending on the position of the cells on thetime-lapsemicroscopy slide. A schematic representation of the polyacrylamide(PAA) strip is divided into seven equal sections (given numbers 1 through 4).Pictures of cells taken from each of these sections show clear differences insporulation efficiency depending on the distance of the cells relative to theperiphery of the PAA slice (pictures were taken 24 h after the start of thetime-lapse experiment).
Eijlander and Kuipers
5646 aem.asm.org Applied and Environmental Microbiology
on S
epte
mber 1
8, 2
013 b
y U
niv
ers
ity o
f Gro
nin
ge
nh
ttp://a
em
.asm
.org
/D
ow
nlo
ad
ed
from
cells of the microcolony (Fig. 3B and 4B). In some cells, the inten-sity of the signal was of such strength that it overpowered thesignal in neighboring cells. Furthermore, the fluorescence signalremained detectable for an extended time compared to the single-copy fusion. Quantification of the signal showed strong variationsin signal strength between individual cells (ranging from 0 to2,000 AU) (Fig. 4B).
Optimization of the usage of fluorescent reporters to studygene expression in B. cereus at the single-cell level. Fluorescentproteins are useful tools for studying gene expression, proteinproduction, and localization events within cells. Observed differ-ences in gene expression (and regulation of such) often providevital clues for understanding heterogeneity in phenotypes within amicrobial population. To optimize usage of fluorescent reportersin B. cereus in conjunction with the time-lapse microscopy tech-nique, we studied the signal intensities and distributions of severalgreen and red fluorescent reporters expressed by various promot-ers. Especially when dealing with a relatively weak promoter, astrong and stable signal by the fluorescent protein is crucial, as itminimizes the time and intensity of exposure of the cells to the
phototoxic excitation light during the course of the time-lapseexperiment. For this purpose, the gfpmut3a gene on the pAD123vector (34) was replaced by genes encoding two different GFPvariants and two different RFP variants as described in Materialsand Methods. For green fluorescence, the sfGFP(Bs) protein (35)and GFP(Sp) (36) were selected, as these were found to yield thestrongest and most stable signals in Streptococcus pneumoniae andBacillus subtilis, respectively (48). For red fluorescence, we se-lected two widely used RFP variants, namely, mCherry (37) andmKate2 (38, 39). To test the usability of these proteins as reportersduring various stages of the cell’s life cycle, four different promot-ers were selected to drive the expression of these genes (Fig. 5 andTable 2). The first of these was PsecA, which is a strong promoterdriving the expression of the essential secA gene during exponen-tial growth phase (22). The second of these was PcotD, which isactivated during the late stages of sporulation in the mother cellcompartment only (23). In contrast, PsigG is activated in the fore-spore compartment somewhat earlier during sporulation (41).Lastly, we selected the previously described Pupp for strong andconstitutive expression of the FP genes (34). The optimal time
FIG 3 PcotD promoter activity in B. cereus. The activity of the PcotD promoter was tested by fusing the cotD upstream region to gfp as described in Materials andMethods. A single-copy integrated version (PcotD-gfp; panel A) and a multicopy plasmid-based version (pAD-PcotD-gfp, panel B) were studied using time-lapsefluorescence microscopy. Snapshots of the bright field and the GFP channel at different time points (indicated in hours) were taken from Movie S2 (panel A) andMovie S3 (panel B). The time-lapse experiment for both strains was performed for cells located on the periphery of the PAA slice (location 1 in Fig. 2).
Bacillus cereus Time-Lapse Microscopy
September 2013 Volume 79 Number 18 aem.asm.org 5647
on S
epte
mber 1
8, 2
013 b
y U
niv
ers
ity o
f Gro
nin
ge
nh
ttp://a
em
.asm
.org
/D
ow
nlo
ad
ed
from
point of activity of these promoters as well as the signal intensityderiving from each FP was analyzed using flow cytometry (GFPonly) and fluorescence microscopy, as described in Materials andMethods (see Fig. S1 in the supplemental material).
Significant differences in fluorescence intensity and fluo-rescence distribution in the strains were observed, and these dif-ferences seem to be both FP and promoter dependent (Fig. 6).
Interestingly, all three GFP variants performed very well whenplaced under the control of the constitutive Pupp promoter (seeFig. S1 in the supplemental material and Fig. 6). Furthermore, theGFPmut3a protein yielded the strongest average signal when ex-pressed by the Pupp promoter (34), whereas it showed the weakestaverage signal when placed under the control of the three otherselected promoters (Fig. 6A). Generally, the GFP(Sp) proteinyielded an overall strong average fluorescent signal in a largernumber of cells (Fig. 6B). For red fluorescence, the mKate2 pro-tein clearly performed better in B. cereus than mCherry did. Thelatter barely yielded a signal for all tested promoters, whereasmKate2 yielded a strong signal in awidespread distribution of cells(Fig. 6B). On the other hand, GFP(Sp) and mKate2 also yieldedthe highest levels of background fluorescence in the red and greenchannels, respectively [TRITC forGFP(Sp) and FITC formKate2](Fig. 6A). This is important to take into account when dual-label-ing experiments are foreseen.
DISCUSSION
Time-lapse microscopy is a powerful single-cell technique for thevisualization of growth and development of single cells into a mi-crocolony. By use of specific tracking software, such as ImageJ(http://rsbweb.nih.gov/ij/) or Microbetracker (Mathworks Mat-lab), the exact history of each cell in the microcolony can be
FIG 4 Quantitative analysis of cotD expression using time-lapse fluorescence microscopy. The fluorescence intensity from GFP expressed from the cotDpromoter in single cells wasmeasured in 29 frames fromMovies S2 (single copy integrated fusion [PcotD-gfp]) (A) and S3 (plasmid-based fusion [pAD-PcotD-gfp])(B) in the supplemental material. The distribution of the signal intensity among all cells per strain is represented by the gray bars of different shades (left graphs).The legend shows the categorization of the fluorescence value (in arbitrary units [AU]). Ten cells were selected to show the dynamics of the signal intensity percell (right graphs [time on the x axis, fluorescence intensity {AU} on the y axis]). Each line represents one individual cell.
FIG5 Timing and location of promoter activity for four selected promoters inthis study. The secA and upp genes are expressed constitutively during expo-nential growth, whereas cotD and sigG are expressed during late-stage sporu-lation in two different compartments of the cell (mother cell and forespore,respectively).
Eijlander and Kuipers
5648 aem.asm.org Applied and Environmental Microbiology
on S
epte
mber 1
8, 2
013 b
y U
niv
ers
ity o
f Gro
nin
ge
nh
ttp://a
em
.asm
.org
/D
ow
nlo
ad
ed
from

tracked and analyzed, enabling detailed studies on cell lineagesand heritable traits of observed phenotypes. Even though thistechnique is already widely used for studying a number of bacte-rial species, no such reports on its application for Bacillus cereuscells have yet emerged. To enable such an application, we haveoptimized both cultivation and slide preparation protocols for B.cereus cells specifically.
With time-lapsemicroscopy, cells are spotted on a slice of solidmedium within a chamber on a glass microscopy slide. The cham-ber is encased by a frame several millimeters thick (20). This al-lows for complete sealing of the chamber to prevent desiccation ofthe solidmedium,while oxygen is still provided to support growthof the cells. Several conditions have to be met before cells can be
successfully studied using the time-lapse microscopy technique.For instance, growth in a monolayer is crucial, especially whenworking with fluorescent reporters for which signal registrationartifactsmay occur when cells overlap in the z direction. Also, cellsmust grow in a patchwise fashion to prevent growth out of thefield of vision, which renders cell division tracking and lineagestudies impossible. Finally, when studying cellular developmentalprocesses such as sporulation, proper timing and development ofsuch processes under the conditions used are crucial.
When the previously described protocol for B. subtilis time-lapse microscopy studies (20) was applied to B. cereus ATCC14579 cells, the conditions described abovewere notmet (data notshown). Cells rather grew in complex multidimensional struc-
FIG 6 Fluorescence intensities and distributions of GFP and RFP variants expressed by different promoters on multicopy plasmids. A minimum of 300 cells perstrain was counted and the fluorescence intensity per cell measured as described in Materials and Methods. In panel A, the average fluorescence intensity per FPvariant is shown in arbitrary units in the FITC channel (GFP; black bars) and the TRITC channel (RFP; gray bars) for each studied promoter (from left to right,PsecA, Pupp, PcotD, and PsigG). Error bars are not included, due to awide distribution of signal intensity for some promoters (the error bars would then exceed 50%).This variation of fluorescence for all cells is visualized in panel B. Signal intensities (in arbitrary units [AU]) were grouped (x axis), and the number of fluorescentcells per group was calculated (y axis). The distribution of fluorescence intensity is shown for GFPmut3a (light gray shading), sfGFP(Bs) (dark gray shading),GFP(Sp) (black shading), mCherry (white shading), and mKate2 (patterned shading).
Bacillus cereus Time-Lapse Microscopy
September 2013 Volume 79 Number 18 aem.asm.org 5649
on S
epte
mber 1
8, 2
013 b
y U
niv
ers
ity o
f Gro
nin
ge
nh
ttp://a
em
.asm
.org
/D
ow
nlo
ad
ed
from

tures and did not sporulate. Both cell preparation and time-lapseconditions were optimized to allow for single-cell studies of grow-ing and developing B. cereus cells. These conditions were opti-mized for B. cereus ATCC 14579 but are also appropriate for otherstrains of B. cereus (E. Frenzel, R. Eijlander, O. Kuipers, and M.Ehling-Schulz, personal communication, unpublished data). Im-portantly, the location of the selected cells on the microscope slideis crucial, as differences in cellular development were observeddepending on the position of the cells relative to the periphery ofthe PAA slice (Fig. 2). This is probably due to differences in oxygenavailability. We speculate that this affects not only cellular devel-opment but also the fluorescence signal, as oxygen availability isrequired for proper activity of GFP (42). Selecting cells as close tothe periphery as possible is therefore required for more reliableanalysis of the results obtained (locations 1 and 2 in Fig. 2). For aslice 4 mm in width, this corresponds to no more than 1 mm awayfrom the edge of the slice. All movies described in this study wereobtained with cells within this parameter.
To minimize exposure of the cells to the toxicity of the excita-tion light during time-lapse microscopy, a strong and relativelystable fluorescence signal is required. For this reason, we testedseveral readily availableGFPs andRFPs in our lab to determine thebest-performing variant in B. cereus ATCC 14579 during variousgrowth stages. Under the conditions tested, the overall best per-formers for green and red fluorescence were GFP(Sp) andmKate2, respectively. Both yielded a well-detectable signal for allfour promoters (Fig. 6; see also Fig. S1 in the supplemental mate-rial). However, there may be specific conditions in which other(nontested) variants work better.
Fluorescent reporter proteins are useful tools for, e.g., studyingpromoter activity, heterogeneity in gene expression, protein local-ization, and cellular dynamics. Nevertheless, visualization of thesereporters more often than not merely provides clues to possiblemechanisms and often does not reflect the true nature of the pro-cess studied. For instance, translational fusions of native proteinsto homo-oligomeric FPs can cause mislocalization and/or aggre-gation of the protein (43). The maturation time of one fluorescentprotein may differ from the maturation time of another, causing adelay in signal between two different fluorophores (K. Beilharz,personal communication, unpublished data). Furthermore, thegrowth stage of the cell can affect the signal captured dependingon the intrinsic properties of the FP used (44). In this study, wehave shown that the choice of the most optimal FP may also bepromoter specific. This calls for optimization and the necessity ofimportant controls when performing new experiments. Fluores-cent proteins are continuously being adapted and optimized forimproved signal strength, limited spectral overlap, decreased pho-totoxicity, and increased protein stability. These adaptations in-clude mutations and species-specific codon optimization for im-proved translation. There is, however, no guarantee that this willyield the best FP variant for that species (48).
Optimization of the time-lapse fluorescence microscopy tech-nique for B. cereus now allows us to investigate the expression leveland dynamics of genes of interest in single cells for this organismspecifically. In this study, we have focused on the cotD sporulationgene. The heterogeneous character of spores in food productscomplicates their eradication (15, 16, 45). To obtain further in-sights into the origin of spore variability, time-lapse (fluores-cence) microscopy is a powerful tool to analyze heterogeneity insingle-spore development (17, 20, 45, 46). When studying the dy-
namics of cotD expression during sporulation in B. cereus ATCC14579, we did not observe a heterogeneous or bimodal signal pat-tern (Fig. 3A and 4A). This indicates that cotD is expressed homo-geneously and consistently among single cells of a subpopulation.Importantly, when studying the same promoter activity expressedfrom a multicopy plasmid, a wide distribution in GFP intensitycould be observed among single cells (Fig. 3B and 4B). The plas-mid copy number can vary per cell, per growth stage, and duringsporulation (47), which can cause a significant level of heteroge-neity that does not reflect true promoter activity over time. Takentogether, these results show that plasmid-based fusions are an un-suitable tool for single-cell and heterogeneity studies.
Unfortunately, the molecular toolbox for genetic manipula-tion via single or double crossover in the B. cereus genome is not aselaborate as those for other model organisms, such as B. subtilis.The development of an integrative systemallowing for single-copytranscriptional and translational fluorescence reporter fusions inB. cereus should be considered for future research efforts, as thiswill be a valuable addition to the entire B. cereus research field.Together with optimized techniques such as time-lapse fluores-cence microscopy, various developmental and molecular pro-cesses (such as heterogeneous gene expression during sporula-tion) can be studied and visualized at the single-cell level. Thesetools will subsequently increase our understanding of such pro-cesses in B. cereus and related species as more specific mechanisticinsights can be obtained.
ACKNOWLEDGMENTS
We thank E. Frenzel for testing the time-lapse microscopy method usingother strains of B. cereus and for useful comments on the manuscript. Wealso thank J. W. Veening for useful discussions and suggestions.
REFERENCES
1. Bottone EJ. 2010. Bacillus cereus, a volatile human pathogen. Clin. Micro-biol. Rev. 23:382–398.
2. Stenfors Arnesen LP, Fagerlund A, Granum PE. 2008. From soil to gut:Bacillus cereus and its food poisoning toxins. FEMS Microbiol. Rev. 32:579–606.
3. Mols M, Abee T. 2011. Bacillus cereus responses to acid stress. Environ.Microbiol. 13:2835–2843.
4. MolsM, Abee T. 2011. Primary and secondary oxidative stress in Bacillus.Environ. Microbiol. 13:1387–1394.
5. Abee T, Wels M, de Been M, den Besten H. 2011. From transcriptionallandscapes to the identification of biomarkers for robustness.Microb. CellFact. 10(Suppl 1):S9. doi:10.1186/1475-2859-10-S1-S9.
6. Lindbäck T, Mols M, Basset C, Granum PE, Kuipers OP, Kovacs AT.2012. CodY, a pleiotropic regulator, influences multicellular behaviourand efficient production of virulence factors in Bacillus cereus. Environ.Microbiol. 14:2233–2246.
7. Wijman JG, de Leeuw PP, Moezelaar R, Zwietering MH, Abee T. 2007.Air-liquid interface biofilms of Bacillus cereus: formation, sporulation,and dispersion. Appl. Environ. Microbiol. 73:1481–1488.
8. van der Voort M, Abee T. 2013. Sporulation environment of emetictoxin-producing Bacillus cereus strains determines spore size, heat resis-tance and germination capacity. J. Appl. Microbiol. 114:1201–1210.
9. Abee T, Groot MN, Tempelaars M, Zwietering M, Moezelaar R, van derVoort M. 2011. Germination and outgrowth of spores of Bacillus cereusgroup members: diversity and role of germinant receptors. Food Micro-biol. 28:199–208.
10. den Besten HM, van Melis CC, Sanders JW, Nierop Groot MN, Abee T.2012. Impact of sorbic acid on germination and outgrowth heterogeneityof Bacillus cereus ATCC 14579 spores. Appl. Environ. Microbiol. 78:8477–8480.
11. Yi X, Setlow P. 2010. Studies of the commitment step in the germinationof spores of Bacillus species. J. Bacteriol. 192:3424–3433.
12. Want A, Hancocks H, Thomas CR, Stocks SM, Nebe-von-Caron G,
Eijlander and Kuipers
5650 aem.asm.org Applied and Environmental Microbiology
on S
epte
mber 1
8, 2
013 b
y U
niv
ers
ity o
f Gro
nin
ge
nh
ttp://a
em
.asm
.org
/D
ow
nlo
ad
ed
from

Hewitt CJ. 2011. Multi-parameter flow cytometry and cell sorting revealextensive physiological heterogeneity in Bacillus cereus batch cultures.Biotechnol. Lett. 33:1395–1405.
13. Cronin UP, Wilkinson MG. 2008. Bacillus cereus endospores exhibit aheterogeneous response to heat treatment and low-temperature storage.Food Microbiol. 25:235–243.
14. Veening JW, Smits WK, Kuipers OP. 2008. Bistability, epigenetics, andbet-hedging in bacteria. Annu. Rev. Microbiol. 62:193–210.
15. Hornstra LM, Ter Beek A, Smelt JP, Kallemeijn WW, Brul S. 2009. Onthe origin of heterogeneity in (preservation) resistance of Bacillus spores:input for a ‘systems’ analysis approach of bacterial spore outgrowth. Int. J.Food Microbiol. 134:9–15.
16. Eijlander RT, Abee T, Kuipers OP. 2011. Bacterial spores in food: howphenotypic variability complicates prediction of spore properties and bac-terial behavior. Curr. Opin. Biotechnol. 22:180–186.
17. de Jong IG, Veening JW, Kuipers OP. 2010. Heterochronic phospho-relay gene expression as a source of heterogeneity in Bacillus subtilis sporeformation. J. Bacteriol. 192:2053–2067.
18. Ghosh S, Scotland M, Setlow P. 2012. Levels of germination proteins indormant and superdormant spores of Bacillus subtilis. J. Bacteriol. 194:2221–2227.
19. Ramirez-Peralta A, Stewart KA, Thomas SK, Setlow B, Chen Z, Li YQ,Setlow P. 2012. Effects of the SpoVT regulatory protein on the germina-tion and germination protein levels of spores of Bacillus subtilis. J. Bacte-riol. 194:3417–3425.
20. de Jong IG, Beilharz K, Kuipers OP, Veening JW. 2011. Live cell imagingof Bacillus subtilis and Streptococcus pneumoniae using automated time-lapse microscopy. J. Vis. Exp. 2011(53):e3145. doi:10.3791/3145.
21. Young JW, Locke JC, Altinok A, Rosenfeld N, Bacarian T, Swain PS,Mjolsness E, Elowitz MB. 2012. Measuring single-cell gene expressiondynamics in bacteria using fluorescence time-lapse microscopy. Nat. Pro-toc. 7:80–88.
22. Herbort M, Klein M, Manting EH, Driessen AJ, Freudl R. 1999. Tem-poral expression of the Bacillus subtilis secA gene, encoding a central com-ponent of the preprotein translocase. J. Bacteriol. 181:493–500.
23. Zheng LB, Losick R. 1990. Cascade regulation of spore coat gene expres-sion in Bacillus subtilis. J. Mol. Biol. 212:645–660.
24. Imamura D, Kuwana R, Takamatsu H, Watabe K. 2010. Localization ofproteins to different layers and regions of Bacillus subtilis spore coats. J.Bacteriol. 192:518–524.
25. Chudakov DM, Matz MV, Lukyanov S, Lukyanov KA. 2010. Fluorescentproteins and their applications in imaging living cells and tissues. Physiol.Rev. 90:1103–1163.
26. Giepmans BN, Adams SR, Ellisman MH, Tsien RY. 2006. The fluores-cent toolbox for assessing protein location and function. Science 312:217–224.
27. Luo W, He K, Xia T, Fang X. 2013. Single-molecule monitoring in livingcells by use of fluorescence microscopy. Anal. Bioanal. Chem. 405:43–49.
28. Shaner NC, Steinbach PA, Tsien RY. 2005. A guide to choosing fluores-cent proteins. Nat. Methods 2:905–909.
29. Leroch M, Mernke D, Koppenhoefer D, Schneider P, Mosbach A,Doehlemann G, Hahn M. 2011. Living colors in the gray mold pathogenBotrytis cinerea: codon-optimized genes encoding green fluorescent pro-tein and mCherry, which exhibit bright fluorescence. Appl. Environ. Mi-crobiol. 77:2887–2897.
30. Henriques MX, Catalao MJ, Figueiredo J, Gomes JP, Filipe SR. 2013.Construction of improved tools for protein localization studies in Strep-tococcus pneumoniae. PLoS One 8:e55049. doi:10.1371/journal.pone.0055049.
31. Sastalla I, Chim K, Cheung GY, Pomerantsev AP, Leppla SH. 2009.
Codon-optimized fluorescent proteins designed for expression in low-GCgram-positive bacteria. Appl. Environ. Microbiol. 75:2099–2110.
32. Masson L, Prefontaine G, Brousseau R. 1989. Transformation of Bacillusthuringiensis vegetative cells by electroporation. FEMS Microbiol. Lett.51:273–277.
33. Lewis PJ, Marston AL. 1999. GFP vectors for controlled expression anddual labelling of protein fusions in Bacillus subtilis. Gene 227:101–110.
34. Dunn AK, Handelsman J. 1999. A vector for promoter trapping in Ba-cillus cereus. Gene 226:297–305.
35. Pédelacq JD, Cabantous S, Tran T, Terwilliger TC, Waldo GS. 2006.Engineering and characterization of a superfolder green fluorescent pro-tein. Nat. Biotechnol. 24:79–88.
36. Martin B, Granadel C, Campo N, Henard V, Prudhomme M, ClaverysJP. 2010. Expression and maintenance of ComD-ComE, the two-component signal-transduction system that controls competence ofStreptococcus pneumoniae. Mol. Microbiol. 75:1513–1528.
37. Shaner NC, Campbell RE, Steinbach PA, Giepmans BN, Palmer AE,Tsien RY. 2004. Improved monomeric red, orange and yellow fluorescentproteins derived from Discosoma sp. red fluorescent protein.Nat. Biotech-nol. 22:1567–1572.
38. Beilharz K, Novakova L, Fadda D, Branny P, Massidda O, Veening JW.2012. Control of cell division in Streptococcus pneumoniae by the con-served Ser/Thr protein kinase StkP. Proc. Natl. Acad. Sci. U. S. A. 109:E905–E913.
39. Shcherbo D, Murphy CS, Ermakova GV, Solovieva EA, ChepurnykhTV, Shcheglov AS, Verkhusha VV, Pletnev VZ, Hazelwood KL, RochePM, Lukyanov S, Zaraisky AG, Davidson MW, Chudakov DM. 2009.Far-red fluorescent tags for protein imaging in living tissues. Biochem. J.418:567–574.
40. Sterlini JM, Mandelstam J. 1969. Commitment to sporulation in Bacillussubtilis and its relationship to development of actinomycin resistance.Biochem. J. 113:29–37.
41. de Vries YP, Hornstra LM, de Vos WM, Abee T. 2004. Growth andsporulation of Bacillus cereus ATCC14579 under defined conditions: tem-poral expression of genes for key sigma factors. Appl. Environ. Microbiol.70:2514–2519.
42. Heim R, Prasher DC, Tsien RY. 1994. Wavelength mutations and post-translational autoxidation of green fluorescent protein. Proc. Natl. Acad.Sci. U. S. A. 91:12501–12504.
43. Landgraf D, Okumus B, Chien P, Baker TA, Paulsson J. 2012. Segrega-tion of molecules at cell division reveals native protein localization. Nat.Methods 9:480–482.
44. Doherty GP, Bailey K, Lewis PJ. 2010. Stage-specific fluorescence inten-sity of GFP and mCherry during sporulation in Bacillus subtilis. BMC Res.Notes 3:303. doi:10.1186/1756-0500-3-303.
45. Pandey R, Ter Beek A, Vischer NO, Smelt JP, Brul S, Manders EM.2013. Live cell imaging of germination and outgrowth of individual Bacil-lus subtilis spores; the effect of heat stress quantitatively analyzed withSporeTracker. PLoS One 8:e58972. doi:10.1371/journal.pone.0058972.
46. Veening JW, Stewart EJ, Berngruber TW, Taddei F, Kuipers OP,Hamoen LW. 2008. Bet-hedging and epigenetic inheritance in bacterialcell development. Proc. Natl. Acad. Sci. U. S. A. 105:4393–4398.
47. Turgeon N, Laflamme C, Ho J, Duchaine C. 2008. Evaluation of theplasmid copy number in B. cereus spores, during germination, bacterialgrowth and sporulation using real-time PCR. Plasmid 60:118–124.
48. Overkamp W, Beilharz K, Weme RDO, Solopova A, Karsens H, KovácsAT, Kok J, Kuipers OP, Veening J-W. Benchmarking various GFPvariants in Bacillus subtilis, Streptococcus pneumoniae and Lactococcus lactisfor live cell imaging. Appl. Environ. Microbiol., in press.
Bacillus cereus Time-Lapse Microscopy
September 2013 Volume 79 Number 18 aem.asm.org 5651
on S
epte
mber 1
8, 2
013 b
y U
niv
ers
ity o
f Gro
nin
ge
nh
ttp://a
em
.asm
.org
/D
ow
nlo
ad
ed
from