University of Groningen Intersection assistance Dotzauer ... · PDF fileNetherlands....
26
University of Groningen Intersection assistance Dotzauer, Mandy; Caljouw, Simone; de Waard, Dick ; Brouwer, Wiebo Published in: Accident Analysis and Prevention DOI: 10.1016/j.aap.2013.07.024 IMPORTANT NOTE: You are advised to consult the publisher's version (publisher's PDF) if you wish to cite from it. Please check the document version below. Document Version Final author's version (accepted by publisher, after peer review) Publication date: 2013 Link to publication in University of Groningen/UMCG research database Citation for published version (APA): Dotzauer, M., Caljouw, S. R., de Waard, D., & Brouwer, W. H. (2013). Intersection assistance: A safe solution for older drivers? Accident Analysis and Prevention, 59, 522-528. DOI: 10.1016/j.aap.2013.07.024 Copyright Other than for strictly personal use, it is not permitted to download or to forward/distribute the text or part of it without the consent of the author(s) and/or copyright holder(s), unless the work is under an open content license (like Creative Commons). Take-down policy If you believe that this document breaches copyright please contact us providing details, and we will remove access to the work immediately and investigate your claim. Downloaded from the University of Groningen/UMCG research database (Pure): http://www.rug.nl/research/portal. For technical reasons the number of authors shown on this cover page is limited to 10 maximum. Download date: 14-05-2018
-
Upload
dinhkhuong -
Category
Documents
-
view
218 -
download
3
Transcript of University of Groningen Intersection assistance Dotzauer ... · PDF fileNetherlands....
University of Groningen
Intersection assistanceDotzauer, Mandy; Caljouw, Simone; de Waard, Dick ; Brouwer, Wiebo
Published in:Accident Analysis and Prevention
DOI:10.1016/j.aap.2013.07.024
IMPORTANT NOTE: You are advised to consult the publisher's version (publisher's PDF) if you wish to cite fromit. Please check the document version below.
Document VersionFinal author's version (accepted by publisher, after peer review)
Publication date:2013
Link to publication in University of Groningen/UMCG research database
Citation for published version (APA):Dotzauer, M., Caljouw, S. R., de Waard, D., & Brouwer, W. H. (2013). Intersection assistance: A safesolution for older drivers? Accident Analysis and Prevention, 59, 522-528. DOI: 10.1016/j.aap.2013.07.024
CopyrightOther than for strictly personal use, it is not permitted to download or to forward/distribute the text or part of it without the consent of theauthor(s) and/or copyright holder(s), unless the work is under an open content license (like Creative Commons).
Take-down policyIf you believe that this document breaches copyright please contact us providing details, and we will remove access to the work immediatelyand investigate your claim.
Downloaded from the University of Groningen/UMCG research database (Pure): http://www.rug.nl/research/portal. For technical reasons thenumber of authors shown on this cover page is limited to 10 maximum.
Download date: 14-05-2018
1
Title:
Intersection assistance: A safe solution for older drivers?
Authors:
Mandy Dotzauera
Simone R. Caljouwb
Dick de Waardc
Wiebo H. Brouwera,c
a UMCG, Department of Neuropsychology, Hanzeplein 1, AB 60, 9700 RB Groningen, the
Netherlands. [email protected], [email protected]
b University of Groningen, Department of Human Movement Sciences, Antonius Deusinglaan
1, room 329 (3215), 9713 AV Groningen, the Netherlands. [email protected]
c University of Groningen, Department of Clinical and Developmental Neuropsychology,
Grote Kruisstraat 2/1, 9712 TS Groningen, the Netherlands. [email protected],
Corresponding author:
Mandy Dotzauer
UMCG, Department of Neuropsychology, Hanzeplein 1, AB 60, 9700 RB Groningen, the
Netherlands. [email protected], 0031-50-363-9731
Abstract:
Within the next few decades, the number of older drivers operating a vehicle will increase
rapidly (Eurostat, 2011). As age increases so does physical vulnerability, age-related
impairments, and the risk of being involved in a fatal crashes. Older drivers experience
problems in driving situations that require divided attention and decision making under time
pressure as reflected by their overrepresentation in at-fault crashes on intersections.
Advanced Driver Assistance Systems (ADAS) especially designed to support older drivers
crossing intersections might counteract these difficulties. In a longer-term driving simulator
study, the effects of an intersection assistant on driving were evaluated. 18 older drivers (M=
71.44 years) returned repeatedly completing a ride either with or without a support system in
a driving simulator. In order to test the intersection assistance, eight intersections were
depicted for further analyses. Results show that ADAS affects driving. Equipped with ADAS,
drivers allocated more attention to the road center rather than the left and right, crossed
intersections in shorter time, engaged in higher speeds, and crossed more often with a critical
*ManuscriptClick here to view linked References
2
time-to-collision (TTC) value. The implications of results are discussed in terms of
behavioral adaptation and safety.
Keywords:
intersection assistance, older drivers, behavioral adaptation, safety, ADAS
Highlights:
More attention is allocated to the road center when driving with the system
Intersection assistance decreases intersection crossing time
Drivers equipped with ADAS cross intersections more often with a critical TTC
3
1. Introduction
Because of demographical changes, the number of persons age 65 and above will increase
rapidly over the next few decades and in particular this concerns the “older old”, those aged
75 and above (Eurostat, 2011). Driving is going to be the more frequently preferred mode of
transportation of the older persons in the future, more than it is presently, due to increasing
numbers of people possessing driver’s licenses and keeping them through advanced age,
especially for women. Therefore, the number of older persons holding a valid driver’s license
and being active drivers will probably rise substantially (OECD, 2001).
With rising age the probability of incidence of diseases and impairments which make the
body more vulnerable increase and thus interfere with the capacity for safe driving practices
(Hewson, 2006). Nonetheless we cannot ignore differences in health and functioning which
vary with each individual. Even in case of significant impairments, older drivers are not
necessarily considered unsafe drivers or unfit to drive, as illustrated by various legislations
which still allow persons with mild dementia or macular degeneration to drive, granted they
have shown in on-road tests that they are able to drive safely. It is actually thought that the
driving task provides a lot of opportunities for assistance on an individual, infrastructural, and
vehicular level. A recent development in terms of offering support to the driver is the
implementation of Advanced Driver Assistance Systems (ADAS) which could be very
helpful in case of age- related impairments. It can be argued that older drivers need more
tailored support apart from what is currently offered on the market because of the specific
crash profile of older drivers, that means at-fault crashes on intersections (Davidse, 2007;
McGwin & Brown, 1999; Evans, 2004), are not targeted by currently popular ADAS such as
Adaptive Cruise Control (ACC) and Lane Departure Warning (LDW). Consistent with the
crash statistics, older drivers themselves report having difficulties identifying traffic signs,
extracting the most relevant traffic sign, and also making decisions under time pressure, a
reason why they, for example, travel at lower speeds (Musselwhite & Haddad, 2010). Several
causes leading to crashes at intersections have been identified. Older drivers often fail to
yield to the right-of-way (Aizenberg & McKenzie, 1997; McGwin & Brown, 1999). They
experience problems estimating safe gaps between oneself and approaching cars (Oxley et al.,
2006) which leads to an over-involvement of crashes when turning left (Griffin, 2004;
Mayhew et al., 2006), but also makes passing straight through an intersection a problematic
undertaking (Preusser et al., 1998). Approaching and crossing an intersection involves several
processes resulting in a complex task. Crossing an intersection requires divided attention
among several pieces of information, perceiving and processing changes in the traffic
situation, perceiving and processing signals and traffic signs, determining and executing a
course of action (Braitman et al., 2007), and decision making under time pressure (Brouwer
& Ponds, 1994). Attentional capacity deficits seem to be the key for their increased
involvement in accidents (Owsley et al., 1998).
Michon’s hierarchical task analysis of driving (1985) as applied by Brouwer (2002) to the
domain of driver impairments, distinguishes three task levels: the strategic level, the tactical
level, and the operational level. The strategic level (navigation) is the highest level. On this
level, decisions with regard to route, navigation, and time of driving are made. Decisions are
4
usually made before the trip has begun, but also, occasionally, during the trip, for example
when deciding to choose an alternative route because of expected traffic jams. On the tactical
level, which takes place while driving, safety margins are set and adjusted for the trip. This
includes deciding on speed, time headway, and lane position, but also involves considering
various maneuvers such as overtaking and passing. Decisions on the tactical level are only
performed occasionally, for example setting smaller time headway than normal if one is in a
hurry or choosing the middle of three parallel lanes in an unfamiliar town. On the operational
level (control), the driver performs second to second lateral and longitudinal control tasks to
avoid acute danger and to stay within the margins set on the tactical level. The difference
between tactical and operational level decisions and actions is that the latter are reactive and
the former are proactive (anticipatory), not a reaction to immediate danger but a setting of
safety margins for the case that actual danger (e.g. vehicle on collision course) manifesting
itself in the near future.
On the strategic and tactical level, drivers can make adjustments and compensate for their
challenges on the operational level. On the strategic level this includes e.g. not driving during
rush hours or avoiding highly complex intersections. On the tactical level, the driver can set a
lower travelling speed or decide on keeping a larger gap between themselves and other cars
which gives them more time to seek the necessary information and to make a decision. This
compensation for challenges is not infinite. When the driving task becomes too complex
and/or impairments are too severe, limitations of attentional capacity can no longer be
compensated for and other means such as Advanced Driver Assistance Systems (ADAS), are
needed to support the older driver. Currently marketed ADAS are not necessarily designed to
fit the needs of the older driver.
Older drivers make adjustments on the tactical level in order to be able to extract more
traffic-relevant information out of their surroundings (Musselwhite & Haddad, 2010). These
results indicate that support on the tactical level might be a promising area of focus for the
development of support systems for older drivers. Currently marketed ADAS such as ACC
and LDW support the primary driving task, particularly speed control, distance to the car
ahead, and lane positioning. Supporting lateral and longitudinal control of the vehicle means
providing support on the operational level, which is not necessarily needed. Assistance on the
tactical level can be given in form of an intersection assistant that provides relevant traffic
information, including traffic signs, speed limits, and gap sizes, for the upcoming intersection
in advance. Receiving information in advance serves two purposes. (1) It takes away
uncertainty because the driver knows what to expect and what to anticipate. Receiving
information in advance can compensate for difficulties in decision making under time
pressure. (2) It also counters problems with divided attention because the important
information, for example, priority regulation information at the upcoming intersection is fed
to the driver before reaching the intersection. In theory, giving the older driver information
about speed limit, priority regulation, and approaching traffic in advanced can compensate for
attentional capacity challenges leaving enough resources to fulfill the primary driving task;
freeing up just enough resources to drive. In the past, designing for in-vehicle signs has
shown some promising results (Staplin & Fisk, 1991; Hanowski et al., 1999; Lee et al., 1999;
5
Luoma and Rämä, 2002; Caird et al., 2008; Ziefle et al., 2008; Davidse et al., 2009), but
research has only been done sporadically. Staplin and Fisk (1991) investigated whether
advanced information about left turns improved decision making performance in younger and
older drivers. They found that younger and older drivers made more accurate go/no go
decisions when the information was available. Lee and colleagues (1999), on the other hand,
found that in-vehicle messaging led to deterioration in older drivers’ performance in terms of
crashes per hour, lane variability, and speed variability. Hanowski and colleagues (1999)
investigated the effects of advanced warnings (related to unexpected events in traffic). They
found that with the advanced information, subjects could anticipate upcoming events. Older
as well as younger drivers benefitted from the advanced information. Caird et al. (2008)
investigated an in-vehicle warning system which informed the driver about the status of the
upcoming traffic light. They found that drivers run fewer red lights when the advanced
information was present. Older drivers took longer than younger drivers to process the given
information, but when they decided to stop, they compensated by faster reacting and
decelerating. Ziefle et al. (2008) showed that presenting traffic information about priority
regulation and traffic density of the upcoming intersection visually as compared to auditory
led to better performance. Davidse and colleagues (2009) investigated an assistant system
that provided information about priority regulation, gap size, obstructed view at the
intersection, and one-way streets. The first three types of messages led to safer driver
performance, but did not reduce workload. The information about the one-way street resulted
in fewer route errors. The studies show changes in performance when driving with ADAS.
However, conclusions drawn result solely from short-term studies in which participants
encountered a system as novice users in a single assessment. Little is known about longer-
term effects of ADAS use on driving performance and driving behavior over time or the
effects of negative behavioral adaptation. Longer-term studies investigating the effects of
ADAS use are a necessity.
1.1 Current study
As a follow-up of Davidse (2007), the present study was designed to investigate the effects of
an intersection assistant on the driving performance and driving behavior of older drivers. A
longer-term driving simulator study was realized in order to acquaint drivers with the support
system and to examine changes in driving performance and behavior due to ADAS use over
time. Participants completed 14 trials in the driving simulator, the first twelve trials within a
four week time period and the last two after a four week retention interval. During each trial,
participants drove through a virtual city and encountered several driving tasks. One of them
was crossing uncontrolled intersections at which subjects had to yield the right-of-way.
Bushes placed near the intersection obstructed the view into the intersection and made the
crossing a safety-critical task forcing the driver to slow down before crossing. These
intersections were used to test the effect of the intersection assistant on driving performance
and behavior and to examine the effect on attention allocation due to information presentation
in a head up display (HUD).
6
The implemented intersection assistant was designed to support the driver crossing an
intersection safely. It gave advice on whether it is safe to cross an intersection. The advice
was based on driver’s time-to-intersection (TTI) as well as the time-to-collision (TTC) with
other cars approaching the intersection. The information was presented in a HUD.
Even though older persons might learn new complex tasks at a slower pace (Lowe & Rabbit,
1997), we expect that over a longer period of exposure and experience with the intersection
assistant, older drivers improve their overall intersection performance. It is expected that as
drivers improve their overall driving performance they become quicker at crossing
intersections and are also safer by choosing more appropriate gap distances when driving
with ADAS. We also expect that drivers equipped with ADAS will use the ADAS and
retrieve intersection information resulting in more attention allocation to the road center that
is where the information is projected onto. Despite the information retrieval, we do not expect
an adverse impact of the ADAS on attention allocation because drivers do not need to take
their eyes-off-the road in order to seek out information about the upcoming intersection.
2. Materials and methods
2.1 Participants
Overall, 31 older drivers were recruited through distribution of flyers at different local senior
clubs such as bridge and billiard and also through the local senior academy. They all reported
feeling subjectively healthy and not having been diagnosed with a serious disease that
interferes with driving. 42 percent of the recruited persons were excluded during the training
session from the study due to simulator sickness. 18 older drivers between the ages of 65
years and 82 years old (M=71.44 + 4.82), 15 males and three females participated in the
study. On average, participants reported a total driving experience of 965.000 km, with an
average of 17.900 km driven the past year. Subjects scored high on the Mini Mental State
Exam (MMSE) (M= 29.28 + .82) indicating intact normal functioning. On average,
participants completed the Trial Making Test Part A in 44.33 seconds (SD + 12.00), which
corresponds to the 62nd
percentile (Schmand et al., 2012), and Part B in 90.94 seconds (SD +
22.28), corresponding with the 73rd
percentile (Schmand et al., 2012). The mean ratio of Trail
Making Test A and B (TMTb/TMTa) resulted in 2.13 (SD + .58) indicating good task
switching abilities, also corresponding to the 73rd
percentile (Schmand et al., 2012).
Participants assessed their overall driving ability as good. Eight participants felt that they
drive better compared to their peer group; nine reported that their driving ability is as good as
the peer group. One person reported driving worse compared to the peer group. Participants
were randomly assigned to the control and treatment group.
2.2 Apparatus
7
A fixed-based driving simulator located at the University Medical Center Groningen was
used for the study. The simulator consisted of an open cabin mock-up containing an
adjustable force-feedback steering wheel, gas pedal, brake pedal, and audio sound simulated
driving sound. Three projection modules resulting in 180 degrees horizontal and 45 degrees
vertical out-window projection screen of 4.5 m diameter stands in front of the mock-up. Front
and side windows as well as a rear view mirror and side mirrors were projected onto the
screen. The computer system consisted of four PCs: two PCs were used for graphical
rendering, one for the traffic simulation and one for system control with a user interface for
the simulator operator. The graphical interface was designed by means of StRoadDesign, a
program provided by StSoftware. The scenario was programmed by means of StScenario, a
scripting language also developed by StSoftware.
2.3 ADAS
The ADAS consisted of four functions: traffic sign recognition, speed warning, collision
warning, and intersection assistance, but in this paper, the intersection assistant will only be
discussed. The intersection assistant was realized by providing information about
approaching traffic at the upcoming intersection. The assistant system indicated whether it is
safe to cross an intersection. The information was presented in form of a bar in front of the
driver by means of a head-up display HUD). It was a three-stage system that dynamically
changed from green to amber to red and vice versa as the traffic situation changed. The
priority regulation at the intersection as well as the travelling direction (as indicated by the
activation/deactivation of the indicator) of the driver were considered by the assistant system.
A gap between cars greater than five seconds indicated safe crossing (green flag). Gap
between 2.5 and five seconds were classified as marginal indicated by an amber flag, and gap
sizes smaller than 2.5 seconds were unsafe as conveyed by the red flag. In order to calculate
gaps and give advice on whether to proceed through the intersection, the driver’s time-to-
intersection as well as the time-to-collision with other cars approaching the intersection was
taken into account. TTI and TTC values are based on speed and distance.
2.4 Design
The driving simulator study is a mixed study design with 13 or 14 repeated measures
depending on the manipulation which had been approved by the Medical Ethical Committee
(METc) of the University Medical Center Groningen. Participants were randomly assigned to
the control and treatment group. The control group completed the experiment without the
intersection assistant; the treatment group drove three times without assistance and eleven
times with. The virtual driving environment was comprised of a 25 km city drive. Route
instructions on when to turn left or right were given visually and auditorily through a
navigation system. In order to avoid learning effects, four different routes comparable in
length and events were used. The order of the routes was counterbalanced. Drivers
encountered various driving tasks such as changes in priority regulation and speed limits,
8
slower moving vehicle in front of them, etc. All participants completed the first trial without
the system. The treatment group completed trial two to six with ADAS, trial seven was
without ADAS, and trials eight to twelve with ADAS again. After a retention interval of four
weeks, the treatment group completing one trial with ADAS and one without; whereas, the
control group completed one trial without ADAS.
For the present study, trial 1, 6, 7, and 8 were depicted for further analysis. The intersections
used to assess the effect of ADAS use are characterized as safety critical because view was
obstructed on these intersections forcing the driver to slow down look to the right and left
before crossing an intersection. The speed limit was 30 km/h and priority was regulated by
yield-to-the-right. For each trial, eight intersections were included for the analysis.
2.5 Procedure
Persons interested in participating in the study received an information package via regular
mail or email including a detailed description of the study, the Motion Sickness
Questionnaire (Golding, 1998), and an informed consent form. After filling in the
questionnaire and signing the informed consent, participants were invited, filled in
questionnaires and completed 4 rides in the driving simulator in order to get acquainted to the
simulator but also to test for simulator sickness. Participants who experienced simulator
sickness during the training were excluded from the study.
Participants returned for the experimental trials. They read a short description of the
experiment, took a seat in the simulator. The seat and steering wheel were adjusted to
accommodate participants’ preferences. Participants were instructed to drive as they would
normally do. After the first trial, the treatment group was introduced to the ADAS. It was
explained to them thoroughly and also presented to them. They also took home a user manual
and asked to read it thoroughly. Participants returned to the driving simulator three times per
week for four weeks and after the retention interval for a final assessment in order to
complete participation in the experiment. Participants were compensated for their
participation.
2.6 Data analysis and dependent measures
For the present study, trial 1, 6, 7 and 8 were depicted for further analysis. For the treatment
group, trial 1 and 7 were without ADAS, trial 6 and 8 were with ADAS. The control group
completed all trials without ADAS. Per trial, eight intersections characterized as safety
critical because of view obstruction were depicted for further analysis. For all dependent
measures, intersections at which participants had another car in front of them were excluded
from analyses.
Driving performance parameters were sampled with a frequency of 10 Hz and stored as
ASCII files. A MATLAB routine was used to extract the information about speed, time, and
critical events. In particular, for each trial we determined the mean intersection time, i.e. the
average sum of waiting time and crossing time of all intersections, the average maximum
9
speed on all intersections, stopping behavior, i.e. the percentage of intersections where the
intersection approach speed was between 0 and 1 km/h, and time-to-collision. Data were
analyzed to investigate the effect of the implemented intersection assistant on intersection
performance
In order to analyze the gaze behavior, video recordings of participants’ faces were coded and
analyzed. The videos were coded using ELAN, a tool used to annotate videos. The gaze of
the participant was coded with center, left, right, or other. Out of the output file, the percent
road center (PRC), which is defined as the percentage of gaze data points that falls within the
area of the road center (Victor et al., 2005), for each subject and each trial was calculated.
The value of PRC is the cumulative time of fixation in the center over the total time. The data
includes the gaze behavior for approaching the intersection (approximately 160 meters) and
crossing the intersection (approximately 23 meters).
The extracted TTC values only include values from participants’ entrance until exit of the
second crossing lane. For this time frame, the mean TTC as well as the mean minimum TTC
were determined. The absolute minimum TTC, i.e. the absolute lowest value while crossing
the intersection, the percentage of critical and safe gap crossings also serve as a dependent
measure. Safety critical gaps are gaps with a TTC equal to or smaller than one second. Safe
crossing gaps have been defined as gaps with a TTC equal to or greater than 1.5 seconds.
3. Results
3.1 Gaze behavior
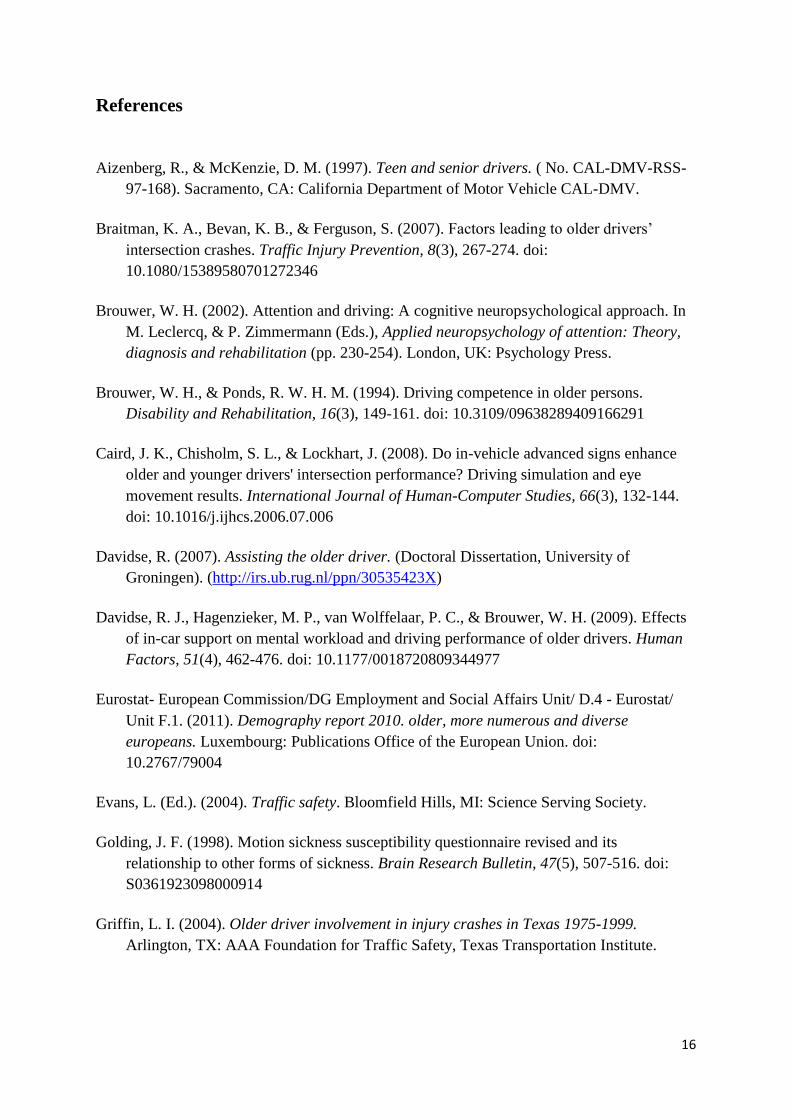
An analysis of Friedman’s ANOVA shows that the gaze behavior (Figure 1) of the CG did
not change significantly over time, χ² (3, N=9)= 3.4, p= .35; whereas, TG’s gaze behavior
changed over time, χ² (3, N=9)= 15.3, p< .001. Wilcoxon tests were used to follow up on the
findings of TG. A Bonferroni correction was applied and all effects are reported at a .008
level of significance. It appeared that the differences in PRC are significant when comparing
trial 1 (no ADAS) with trial 6 (ADAS), z= 2.66, p= .001, r= .89, and trial 1 (no ADAS) with
trial 8 (ADAS), z= 2.55, p= .008, r= .85. Comparing other trials with each other did not lead
to significant differences, but large effects were revealed. TG spend more time looking in the
center on trial 7 (no ADAS) compared to trial 1, z= 1.96, p= .05, r= .65. Results comparing
trial 6 (ADAS) and trial 7 (no ADAS), z= 2.07, p= .04, r= .70 show a decrease in PRC from
one trial to the other, and comparing results of trial 7 (no ADAS) with the results of trial 8
(ADAS), z= 1.71, p= .09, r= .57, suggest an increase in PRC, again.
---INSERT FIGURE 1 ABOUT HERE---
10
Comparing mean ranks between CG and TG using a Mann-Whitney U test (α= .01) revealed
significant differences in trial 6 (no ADAS vs. ADAS), z= 3.05, p= .001, r= .72, trial 7 (both
no ADAS), z= 2.61, p= .008, r= .61, and trial 8 (no ADAS vs. ADAS), z= 3.13, p= .001,
r= .74 indicating a higher PRC for TG compared to CG.
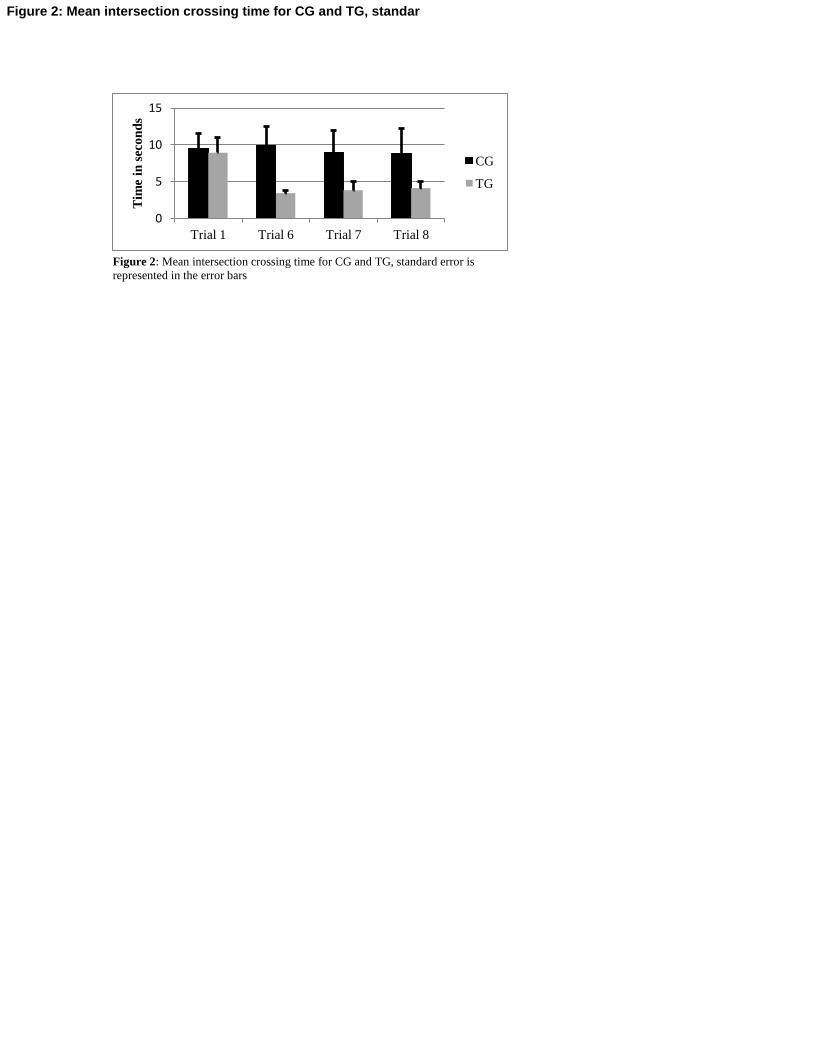
3.2 Intersection time
Figure 2 shows the average intersection time with the standard errors for both groups.
Friedman’s ANOVA was used to analyze differences in intersection time over time. No
significant differences in intersection time were found for the control group (CG), χ² (3,
N=9)= 1.8, p= .65, indicating no changes in intersection time over time. A trend was
observed for the treatment group (TG), χ² (3, N=9)= 6.6, p= .08. As a post hoc analysis, the
Wilcoxon test was applied to examine the difference in intersection time over time for the
treatment group. A Bonferroni correction was applied and results are reported at a .008
significance level. The decrease in intersection time over trials for TG was significantly
different when comparing trial 1 with trial 7 (both trials no ADAS), z= 2.55, p= .008, r= .85.
A comparison of trial 1 (no ADAS) with trial 6 (ADAS) did not reveal a significant decrease
in intersection time, but a large effect was observed, z= 2.19, p= .02, r= .73. The same is true
when comparing trial 1 (no ADAS) with trial 8 (ADAS), z= 2.07, p= .04, r= .70. The effect
sizes show a decrease in intersection time when comparing trial 1 with the remaining three
trials.
---INSERT FIGURE 2 ABOUT HERE---
In order to determine difference in intersection time between groups, per trial mean ranks
were compared using Mann-Whitney U tests. The significance level has been adjusted to
α= .01. No significant differences between groups have been revealed, but a large effect was
found for trial 6 (no ADAS vs. ADAS), z= 2.61, p= .03, r= .51 and a medium effect for trial 7
(both groups no ADAS), z= 2.61, p= .06, r= .45 which tentatively suggests a faster
intersection time for TG compared to CG.
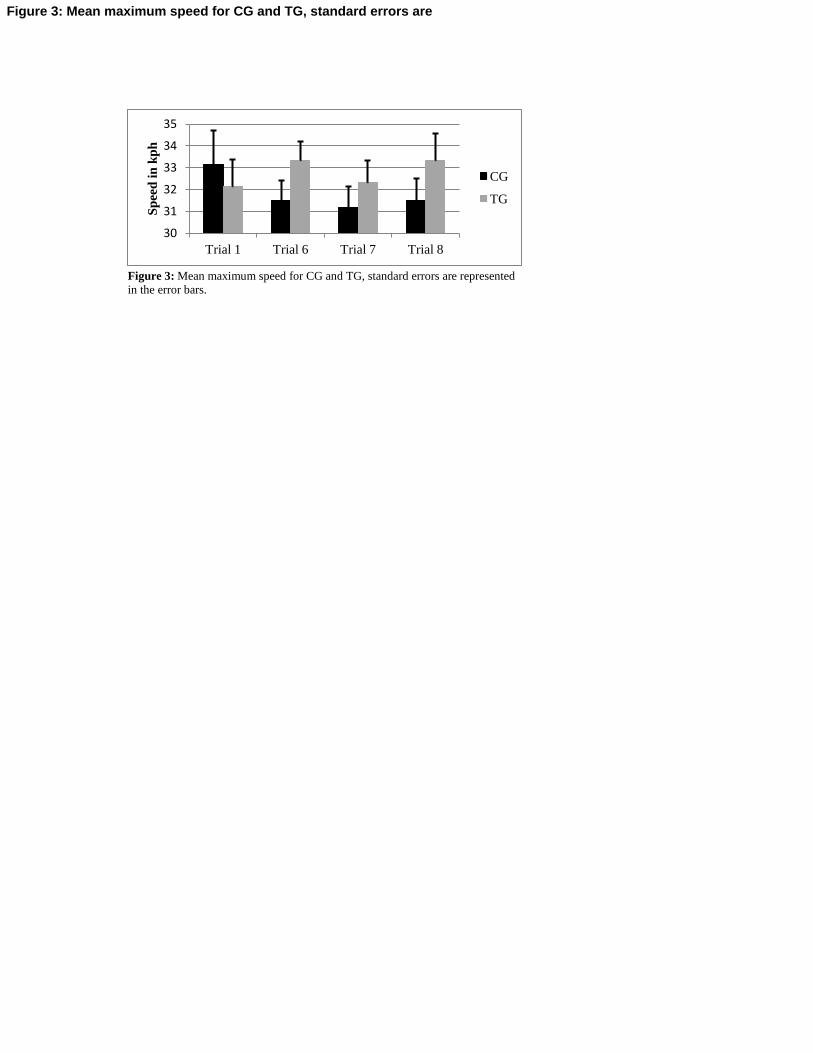
3.3 Speed Information
3.3.1 Average maximum speed
Friedman’s ANOVA did not reveal significant differences in maximum speed for either CG,
χ² (3, N=9)= 1.13, p= .81, nor TG, χ² (3, N=9)= 3, p= .41, over time. Figure 3 shows the
mean values for maximum speed on intersections including the standard errors. In order to
analyze differences in maximum speed between groups, Mann-Whitney U tests were used.
The tests did not reveal significant differences between groups in choice of speed on the
11
intersection, but medium effects for trial 6, z=1.37, p= .19, r=. 32, trial 7, z= 1.37, p= .19,
r= .32, and trial 8, z= 1.81, p= .07, r= .43 have been observed which tentatively suggest that
TG crosses intersection with a higher speed.
---INSERT FIGURE 3 ABOUT HERE---
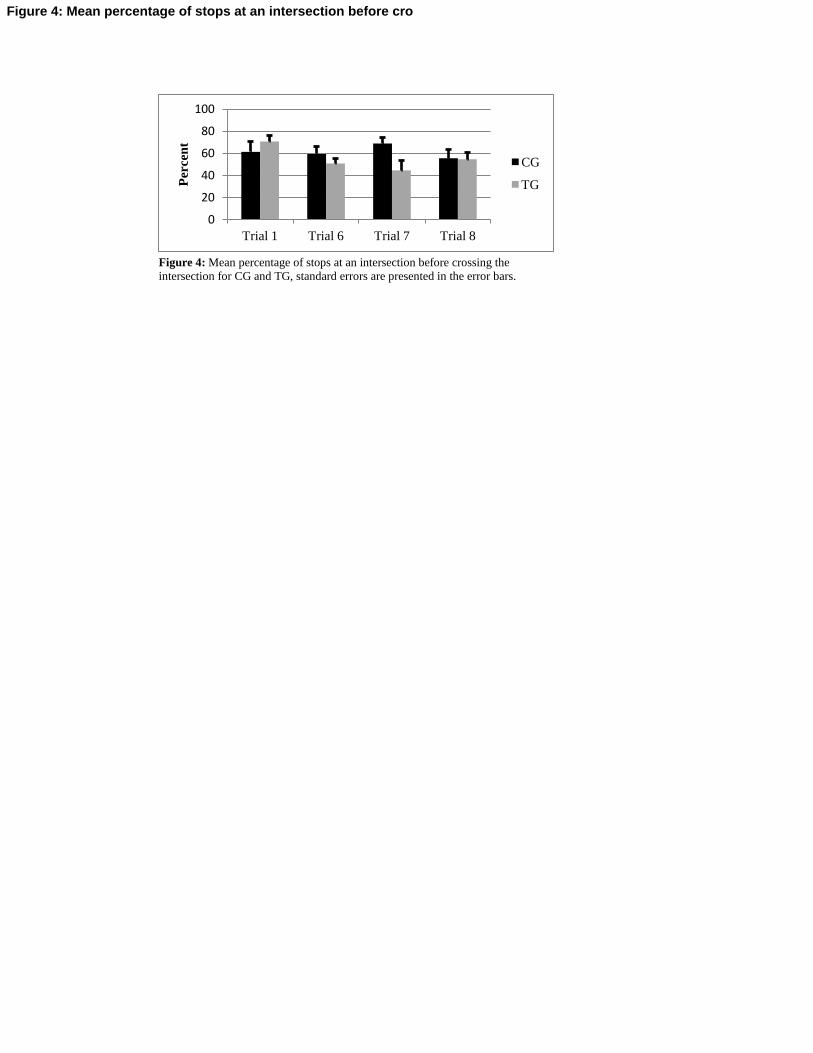
3.3.2 Stopping at intersection
Investigating participants’ stopping behavior (see Figure 4) at intersections using Friedman’s
ANOVA did not reveal differences over time for CG, χ² (3, N=9)= 2.6, p= .46, but significant
difference for TG , χ² (3, N=9)= 8.9, p= .02. For a post hoc analysis, Wilcoxon tests have
been administered with an adjusted level of significance set to .008. Significant differences
were not found, but large effects, showing a decrease in the percentage of stops, were
revealed when comparing trial 1 to trial 6, z= 2.31, p= .02, r= .77, to trial 7, z= 2.39, p= .01,
r= .80, and to trial 8, z= 1.71, p= .09, r= .57. Between-subject comparisons did not yield
significant differences.
---INSERT FIGURE 4 ABOUT HERE---
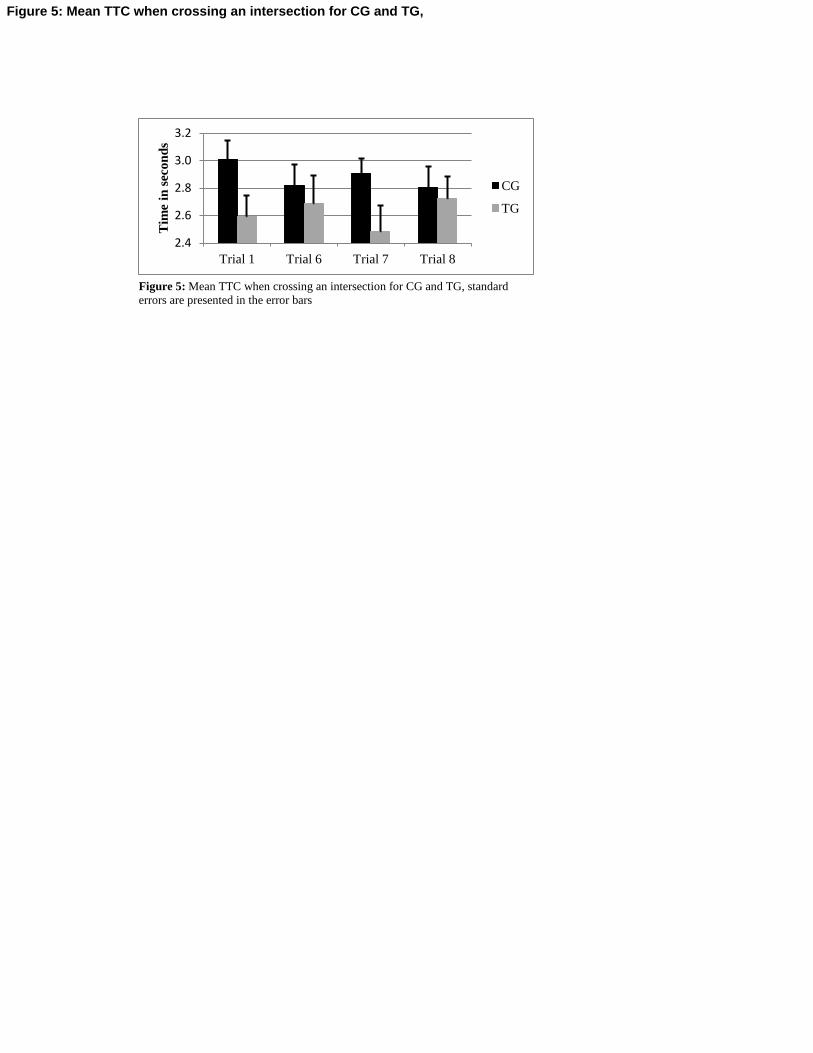
3.4 Time-to-collision (TTC)
3.4.1 Average TTC
On average, TG crossed the intersections with a smaller average TTC (see Figure 5), but
Friedman’s ANOVA did not reveal differences in average TTC over time for neither CG, χ²
(3, N=9)= .10, p= .99 nor TG χ² (3, N=9)= .86, p= .85. Mann Whitney U tests also did not
yield significant differences between groups, but on trial 1 (no ADAS) a large effect, z= 2.08,
p= .40, r= .50, has been observed indicating a smaller TTC for TG. The differences between
groups on trial 7 (no ADAS) were not significant either, but a medium effect, z= 1.63, p= .10,
r= .39, in the same direction was observed.
---INSERT FIGURE 5 ABOUT HERE---
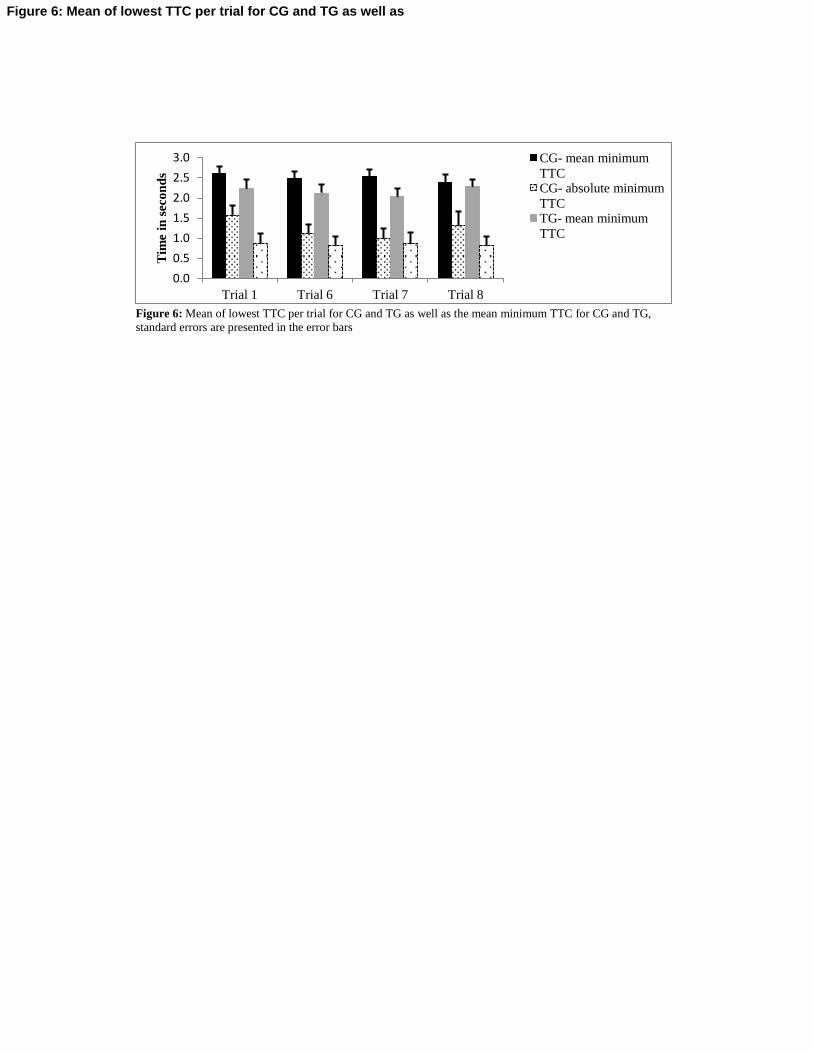
3.4.2 Minimum and absolute minimum TTC
Minimum TTC and absolute minimum TTC were also analyzed. Figure 6 shows the mean
values for the average minimum TTC as well as the absolute minimum TTC including the
standard errors. Friedman’s ANOVA did not result in significant changes over time in
12
average minimum TTC for neither CG χ² (3, N=9)= .33, p= .97 nor TG χ² (3, N=9)= .20,
p= .98. Between-subject comparison also did not reveal significant differences between the
groups at the different measurements in time either.
---INSERT FIGURE 6 ABOUT HERE---
Analyzing the absolute minimum TTC data using Friedman’s ANOVA did not yield
significant results, neither for CG χ² (3, N=9)= 4.70, p= .20 nor for TG χ² (3, N=9)= .07, p=
1.00. Mann-Whitney U tests also did not reveal significant differences between groups.
3.4.3 Critical and safe gaps
Changes in critical gaps (< 1s) over time were analyzed using Friedman’s ANOVA. No
significant differences for CG, χ² (3, N=9)= 1.08, p= .79 or TG χ² (3, N=9)= .67, p= .89, have
been observed, even though, on average, TG crossed the intersection between critical gaps
more often than CG (see Table 1). Looking at between-subject comparisons, Mann-Whitney
U tests did not yield significant differences between CG and TG. Only for trial 1 (no ADAS)
a medium effect, z= 1.86, p= .09, r= .44 was observed.
---INSERT TABLE 1 ABOUT HERE---
It was also analyzed whether choosing a safe gap (> 1.5s) would change over time.
Friedman’s ANOVA did not result in significant differences for either CG, χ² (3, N=9)= 2.40,
p= .51 or TG χ² (3, N=9)= .66, p= .89. Analyzing between subject differences did not reveal
significant differences, but medium effects have been observed for the trials without ADAS.
The differences in trial 1 result in z= 1.87, p= .07, r= .44 and in trial 7 in z= 1.44, p= .16, r=.
34.
4. Discussion
This study was conducted to evaluate the longer-term effects of an intersection assistant on
driving. The support system was tailored to fit the needs of the older driver. It gave advice on
whether it was safe to cross an intersection indicated by a green, amber, or red flag in an
HUD. The experiment was realized as a longer-term study in order to acquaint drivers with
the assistant and examine changes in driving performance and driving behavior over time. Of
special interest were negative behavioral adaptations and whether these changes in behavior
were carried over when ADAS was taken away from the driver. In order to investigate effects
13
of ADAS, intersections characterized as safety critical intersections had been depicted for
further analyses. The view into the intersection was obstructed, which, in general, forced the
driver to slow down and look to the left and right before being able to make a sound decision
on crossing the intersection. A general trend that could be observed was that driving
performance of the treatment group did not go back to the initial performance as displayed
during the baseline trial when the ADAS was deactivated for one trial, after driving with
ADAS over a longer period of time.
An analysis of the gaze behavior revealed no significant differences in attention allocation
over trials for the control group. On the other hand, as expected, the treatment group showed
changes in gaze behavior spending more time looking at the road center when driving with
ADAS. The hypothesis that the treatment group will look more in the center than the control
group, when driving with ADAS, was confirmed. When driving with ADAS, drivers
retrieved relevant information about other cars approaching the intersection and gap
information form the HUD. They spent less time looking to the left and right in order to
comprise a picture of the current traffic situation. Even though the differences on trial 7 were
not significant, calculating the effect size revealed a large effect. This suggests that after
being equipped with the intersection assistant, drivers did not go back to their initial gaze
behavior as displayed during baseline. They still allocated less attention to the left and right
of the intersection and more attention to the road center. This could be an indication for a
negative carry-over effect, not being able to suppress the new learned behavior. But it could
also mean that with the help of ADAS, they learned to look and retrieve information more
effectively considering the finding that the amount of crossings with a critical time-to-
collision did not increase significantly in trial 7.
Intersection time was used to assess drivers’ intersection performance. The results showed
that over time and equipped with ADAS, older drivers crossed intersections faster than
drivers not equipped with ADAS. The hypothesis has been confirmed. Contrary to
expectations, the intersection times for trial 7, the trial where both groups drove without
ADAS, were also different for the groups. Having the ADAS taken away from the driver did
not increase drivers’ intersection times. A difference was observed between the baseline trial
(without ADAS) and the following trials for the treatment group; whereas, the control group
did not improve over time. These differences between groups suggest that ADAS affects the
overall intersection performance. It indicates that with the support system drivers do not wait
as long as unequipped drivers before crossing an intersection. They seem to learn taking
smaller gaps based on the advice on safe gaps given by the ADAS.
Speed has also been analyzed in order to find out whether ADAS has an effect on speed
choice as well as on stopping behavior. No significant differences could be found between
groups. It was expected that the treatment group engages in higher speeds when driving with
ADAS compared to the control group. The hypothesis could not be confirmed. Nevertheless,
medium effects were observed tentatively suggesting that the control group decreased speed
on intersections over time. This might be an indication for a more cautious driving behavior;
whereas, the treatment group showed an increase when driving with ADAS and a decrease in
speed when driving without ADAS. Seeing this trend in the treatment group over trials and
14
conditions suggests that the green flag indicating safe crossing might have served as a trigger
to drivers to clear the intersection as fast as possible. Taking the stopping behavior into
account supports this assumption. The control groups’ and treatment groups’ stopping
behavior on trial 6 and trial 8 did not differ significantly, but at the same time, the maximum
speed on intersections is higher for the treatment group compared to the control group.
Because speed analysis shows different trends for both groups, but the stopping behavior did
not yield the same trend, we assume that the green flag triggers a response, namely, hitting
the gas and crossing the intersection quickly. When driving without ADAS, even though the
choice of speed did not change, the stopping behavior of the treatment group changed. A
visual inspection of the figure on stopping behavior shows that on the trial 7 (no ADAS), the
treatment group stopped fewer times compared to the baseline trial, and fewer times
compared to the trials with ADAS, not what was expected. An explanation for the changes on
trial 7 might lie in the analysis of TTC.
Time-to-collision has been analyzed as a safety indicator. Small TTC below a critical value
can serve as an indication for unsafe behavior and decision making. It was expected that
drivers equipped with ADAS choose for more conservative gaps than drivers not equipped
with ADAS. This hypothesis could not be confirmed. Analyses of the TTC data did not yield
any significant results. Yet, given the observation that drivers of the treatment group became
less cautious over time as indicated by less attention allocation to the left and right, shorter
intersection times, fewer stops before the intersection, we might expect more risky crossings
in general, but also when drivers first equipped with an intersection assistance drive after an
acquainting period without ADAS again. A visual inspection of figures 5 and 6 indicate that
the average TTC as well as the average minimum TTC is lowest on trial 7 for the treatment
group. It tentatively suggests that drivers made less conservative decisions when they drove
without ADAS on trial 7. The figures suggest changes in driving over time for the treatment
group. Inspecting changes over time, we can observe that drivers of the treatment group
stopped fewer times and crossed intersections with an overall lower speed. The changes in
the numbers of stops and speed suggest that crossings are made at the cost of safety margins.
We can observe the smallest TTC (see Figure 6) on trial 7 compared to all other trials.
Looking at the mean values (see Table 1) for the percentage of safe and critical crossings, we
can also observe that the treatment group found more safety critical gaps and less safe gaps
on trial 7.
5. Conclusion
To summarize, we investigated the effects of an intersection assistant on driving performance
and driving behavior. We can conclude that the intersection assistant leads to changes in both
driving performance and driving behavior. Driving with ADAS resulted in faster intersection
crossings. Drivers of the treatment group tended to cross intersections with higher speeds and
smaller TTC. According to the literature, critical TTC on intersections are defined as times
smaller than 1.5 seconds (van der Horst, 1990). On average drivers kept TTC greater than
that, even though the average minimum TTC of the treatment group was smaller than the
15
TTC of the control group and the absolute minimum TTC of the treatment group remained
below 1 second on all trials. Moreover, an analysis of the gaze revealed that when driving
with ADAS, drivers sought out information about the upcoming intersection from the HUD,
spending less time looking to the left and the right. A trend also noticed when the ADAS was
taken away from the driver on trial 7. This effect might also be due to the fact that the study
was done in a driving simulator and participants were aware that a crash would have no
serious consequences. We also saw that when driving without ADAS, after being exposed to
the ADAS for a longer period of time, performance did not go back to the initial performance
as displayed during the baseline trial. At this point, we cannot conclude whether these
changes in performance and behavior are due to a safer and more efficient way of driving or
whether they reflect a continuum of a risky behavior that resulted from driving with the
system. One reason why we cannot draw exclusive conclusions from these findings is the
sample size. The sample size was small, and therefore, we did not reveal too many significant
differences between groups, but effect size calculations indicate that with a bigger sample
size, results should allow for more explicit conclusions.
Moreover, the population investigated in this study were fairly young older drivers without
prominent impairments. These drivers might have not benefitted from the implemented
ADAS because they were still able to drive safely. In order to gain more insight, driving
behavior and performance of the investigated group needs to be compared to young drivers
but also to impaired drivers which will be done in a follow-up study.
Acknowledgements
"The research leading to these results has received funding from the European Community's
Seventh Framework Programme (FP7/2007-2013) under grant agreement n°238833/
ADAPTATION project, www.adaptation-itn.eu". We also like to thank Bauke Dijkstra and
Yvonne Akkerman for their involvement in preparing and administering the study and Alex
Platinetty for his helpful advice on the final manuscript.
16
References
Aizenberg, R., & McKenzie, D. M. (1997). Teen and senior drivers. ( No. CAL-DMV-RSS-
97-168). Sacramento, CA: California Department of Motor Vehicle CAL-DMV.
Braitman, K. A., Bevan, K. B., & Ferguson, S. (2007). Factors leading to older drivers’
intersection crashes. Traffic Injury Prevention, 8(3), 267-274. doi:
10.1080/15389580701272346
Brouwer, W. H. (2002). Attention and driving: A cognitive neuropsychological approach. In
M. Leclercq, & P. Zimmermann (Eds.), Applied neuropsychology of attention: Theory,
diagnosis and rehabilitation (pp. 230-254). London, UK: Psychology Press.
Brouwer, W. H., & Ponds, R. W. H. M. (1994). Driving competence in older persons.
Disability and Rehabilitation, 16(3), 149-161. doi: 10.3109/09638289409166291
Caird, J. K., Chisholm, S. L., & Lockhart, J. (2008). Do in-vehicle advanced signs enhance
older and younger drivers' intersection performance? Driving simulation and eye
movement results. International Journal of Human-Computer Studies, 66(3), 132-144.
doi: 10.1016/j.ijhcs.2006.07.006
Davidse, R. (2007). Assisting the older driver. (Doctoral Dissertation, University of
Groningen). (http://irs.ub.rug.nl/ppn/30535423X)
Davidse, R. J., Hagenzieker, M. P., van Wolffelaar, P. C., & Brouwer, W. H. (2009). Effects
of in-car support on mental workload and driving performance of older drivers. Human
Factors, 51(4), 462-476. doi: 10.1177/0018720809344977
Eurostat- European Commission/DG Employment and Social Affairs Unit/ D.4 - Eurostat/
Unit F.1. (2011). Demography report 2010. older, more numerous and diverse
europeans. Luxembourg: Publications Office of the European Union. doi:
10.2767/79004
Evans, L. (Ed.). (2004). Traffic safety. Bloomfield Hills, MI: Science Serving Society.
Golding, J. F. (1998). Motion sickness susceptibility questionnaire revised and its
relationship to other forms of sickness. Brain Research Bulletin, 47(5), 507-516. doi:
S0361923098000914
Griffin, L. I. (2004). Older driver involvement in injury crashes in Texas 1975-1999.
Arlington, TX: AAA Foundation for Traffic Safety, Texas Transportation Institute.
17
Hanowski, R. J., Dingus, T. A., Gallagher, J. P., Kieliszewski, C. A., & Neale, V. L. (1999).
Driver response to in-vehicle warnings. Transportation Human Factors, 1(1), 91-106.
doi: 10.1207/sthf0101_10
Hewson, P. (2006). Ageing drivers or ageing casualties? Presented at The Older People in
Rural Area (OPeRA) Research Conference, Taunton.
Lee, J. D., Gore, B. F., & Campbell, J. L. (1999). Display alternatives for in-vehicle warning
and sign information: Message style, location and modality. Transportation Human
Factors, 1(4), 347-375. doi: 10.1207/sthf0104_6
Louma, J., & Rämä, P. (2002). Acceptance of traffic sign information provided by an in-
vehicle terminal. Proceedings of the Ninth World Congress on Intelligent Transportation
Systems, Chicago, IL.
Lowe, C., & Rabbitt, P. (1997). Cognitive models of ageing and frontal lobe deficits. In P.
Rabbitt (Ed.), Methodology of frontal and executive function (pp. 39-57). East Sussex,
UK: Psychology Press.
Mayhew, D. R., Simpson, H. M., & Ferguson, S. (2006). Collisions involving senior drivers:
High-risk conditions and locations. Traffic Injury Prevention, 7, 117-124. doi:
10.1080/15389580600636724
McGwin, J., Gerald, & Brown, D. B. (1999). Characteristics of traffic crashes among young,
middle-aged, and older drivers. Accident Analysis & Prevention, 31(3), 181-198. doi:
10.1016/S0001-4575(98)00061-X
Michon, J. A. (1985). A critical view of driver behavior models: What do we know, what
should we do? In L. Evans, & R. C. Schwing (Eds.), Human behavior and traffic safety
(pp. 485-520). New York, NY: Plenum Press.
Musselwhite, C., & Haddad, H. (2010). Exploring older drivers’ perceptions of driving.
European Journal of Ageing, 7(3), 181-188. doi: 10.1007/s10433-010-0147-3
OECD. (2001). Ageing and transport: Mobility needs and safety issues. France: OECD.
Owsley, C., Ball, K., McGwin, G., Sloane, M. E., Roenker, D. L., White, M. F., & Overley,
E. T. (1998). Visual processing impairment and risk of motor vehicle crash among older
adults. Journal of the American Medical Association, 279(14), 1083-1088. doi:
10.1001/jama.279.14.1083
Oxley, J., Fildes, B., Corben, B., & Langford, J. (2006). Intersection design for older drivers.
Transportation Research Part F: Traffic Psychology and Behaviour, 9(5), 335-346. doi:
10.1016/j.trf.2006.06.005
18
Preusser, D. F., Williams, A. F., Ferguson, S. A., Ulmer, R. G., & Weinstein, H. B. (1998).
Fatal crash risk of older drivers at intersections. Accident Analysis and Prevention,
30(2), 151-159. doi: 10.1016/S0001-4575(97)00090-0
Schmand, B., Houx, P. & de Koning, I. (2012). Normen van psychologische tests voor
gebruik in de klinische neuropsychologie. excelbestand met bijbehorende toelichting.
Retrieved 02/13, 2013, from www.psynip.nl
Staplin, L., & Fisk, A. D. (1991). A cognitive engineering approach to improving signalized
left-turn intersections. Human Factors, 33, 559-573. doi: 10.1177/001872089103300507
Van Der Horst, R. (1990). A time-based analysis of road user behavior in normal and critical
encounters. (Doctoral Dissertation, Delft University of Technology).
Victor, T. W., Harbluk, J. L., & Engström, J. (2005).
Sensitivity of eye-movement measures to in-vehicle task difficulty. Transportation
Research Part F: Traffic Psychology and Behaviour, 8(2), 167-190. doi:
10.1016/j.trf.2005.04.014
Ziefle, M., Pappachan, P., Jakobs, E., & Wallentowitz, H. (2008). Visual and auditory
interfaces of advanced driver assistant systems for older drivers. Computers Helping
People with Special Needs, 11th International Conference, ICCHP, Linz, Austria. 62-69.
30
40
50
60
70
80
Trial 1 Trial 6 Trial 7 Trial 8
Tim
e in
per
cen
t
CG
TG
Figure 1: Mean of percent road center for CG and TG, standard error is
represented in the error bars
Figure 1: Mean of percent road center for CG and TG, standard er
0
5
10
15
Trial 1 Trial 6 Trial 7 Trial 8
Tim
e in
sec
on
ds
CG
TG
Figure 2: Mean intersection crossing time for CG and TG, standard error is
represented in the error bars
Figure 2: Mean intersection crossing time for CG and TG, standar
30
31
32
33
34
35
Trial 1 Trial 6 Trial 7 Trial 8
Sp
eed
in
kp
h
CG
TG
Figure 3: Mean maximum speed for CG and TG, standard errors are represented
in the error bars.
Figure 3: Mean maximum speed for CG and TG, standard errors are
0
20
40
60
80
100
Trial 1 Trial 6 Trial 7 Trial 8
Per
cen
t
CG
TG
Figure 4: Mean percentage of stops at an intersection before crossing the
intersection for CG and TG, standard errors are presented in the error bars.
Figure 4: Mean percentage of stops at an intersection before cro
2.4
2.6
2.8
3.0
3.2
Trial 1 Trial 6 Trial 7 Trial 8
Tim
e in
sec
on
ds
CG
TG
Figure 5: Mean TTC when crossing an intersection for CG and TG, standard
errors are presented in the error bars
Figure 5: Mean TTC when crossing an intersection for CG and TG,
0.0
0.5
1.0
1.5
2.0
2.5
3.0
Trial 1 Trial 6 Trial 7 Trial 8
Tim
e in
sec
on
ds
CG- mean minimum
TTC CG- absolute minimum
TTC TG- mean minimum
TTC
Figure 6: Mean of lowest TTC per trial for CG and TG as well as the mean minimum TTC for CG and TG,
standard errors are presented in the error bars
Figure 6: Mean of lowest TTC per trial for CG and TG as well as
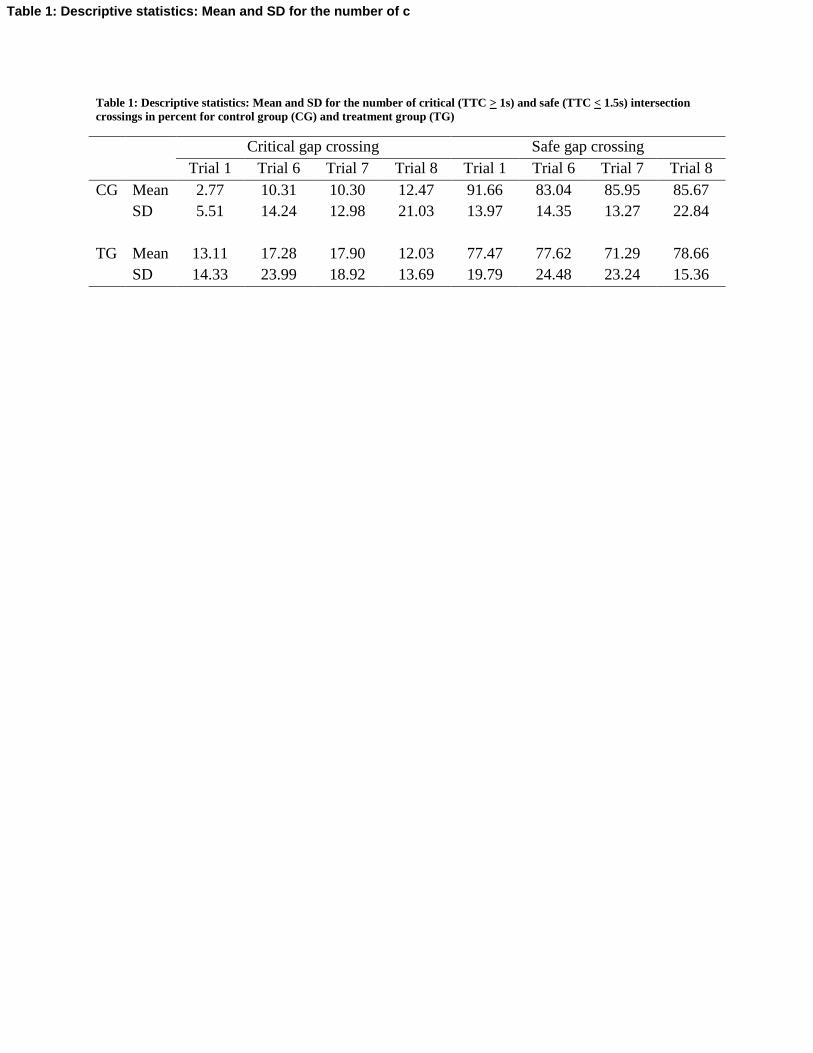
Table 1: Descriptive statistics: Mean and SD for the number of critical (TTC > 1s) and safe (TTC < 1.5s) intersection
crossings in percent for control group (CG) and treatment group (TG)
Critical gap crossing Safe gap crossing
Trial 1 Trial 6 Trial 7 Trial 8 Trial 1 Trial 6 Trial 7 Trial 8
CG Mean 2.77 10.31 10.30 12.47 91.66 83.04 85.95 85.67
SD 5.51 14.24 12.98 21.03 13.97 14.35 13.27 22.84
TG Mean 13.11 17.28 17.90 12.03 77.47 77.62 71.29 78.66
SD 14.33 23.99 18.92 13.69 19.79 24.48 23.24 15.36
Table 1: Descriptive statistics: Mean and SD for the number of c


![Dotzauer 113 Estudios Vol.1 (Exercises 1-34]](https://static.fdocuments.us/doc/165x107/543cdaddb1af9fc82e8b4893/dotzauer-113-estudios-vol1-exercises-1-34.jpg)