University of Groningen Begg orthodontic therapy in ... · 1.1 Development of the Begg orthodontic...
150
University of Groningen Begg orthodontic therapy in retrospect Levin, Raymond Israel IMPORTANT NOTE: You are advised to consult the publisher's version (publisher's PDF) if you wish to cite from it. Please check the document version below. Document Version Publisher's PDF, also known as Version of record Publication date: 1975 Link to publication in University of Groningen/UMCG research database Citation for published version (APA): Levin, R. I. (1975). Begg orthodontic therapy in retrospect. [S.n.]. Copyright Other than for strictly personal use, it is not permitted to download or to forward/distribute the text or part of it without the consent of the author(s) and/or copyright holder(s), unless the work is under an open content license (like Creative Commons). Take-down policy If you believe that this document breaches copyright please contact us providing details, and we will remove access to the work immediately and investigate your claim. Downloaded from the University of Groningen/UMCG research database (Pure): http://www.rug.nl/research/portal. For technical reasons the number of authors shown on this cover page is limited to 10 maximum. Download date: 17-05-2020
Transcript of University of Groningen Begg orthodontic therapy in ... · 1.1 Development of the Begg orthodontic...
University of Groningen
Begg orthodontic therapy in retrospectLevin, Raymond Israel
IMPORTANT NOTE: You are advised to consult the publisher's version (publisher's PDF) if you wish to cite fromit. Please check the document version below.
Document VersionPublisher's PDF, also known as Version of record
Publication date:1975
Link to publication in University of Groningen/UMCG research database
Citation for published version (APA):Levin, R. I. (1975). Begg orthodontic therapy in retrospect. [S.n.].
CopyrightOther than for strictly personal use, it is not permitted to download or to forward/distribute the text or part of it without the consent of theauthor(s) and/or copyright holder(s), unless the work is under an open content license (like Creative Commons).
Take-down policyIf you believe that this document breaches copyright please contact us providing details, and we will remove access to the work immediatelyand investigate your claim.
Downloaded from the University of Groningen/UMCG research database (Pure): http://www.rug.nl/research/portal. For technical reasons thenumber of authors shown on this cover page is limited to 10 maximum.
Download date: 17-05-2020

raymond levin
begg arthadantiE th�rapy in retraspeEt

begg orthodontic therapy
in retrospect
druk: verenigde reproduktie bedrijven kleine der a 4 • groningen • 1975

promotor : prof.dr. h.s. duterloo copromotor : c. booy
theses
It is unrealistic to assume that, in contrast to all other systems of the human organism which change throughout life, the occlusion is static after orthodontic treatment.
II
The final examination after (orthodontic) treatment should be as extensive as the initial examination.
Ill
Prolonged retention after orthodontic treatment is of limited value.
IV
Stability of changes effected in the dentition during treatment can be assessed at an early stage of the postretention period, while, changes in the periodontium due to treatment can only be evaluated at a much later stage.
v There is no scientific basis for equating the principle of the arch as used in architecture to a comparable application in orthodontics, to promote the stability of the dental arches.
VI
Compartmentalisation of dental training produces a fragmentary approach to general dental
care.
VII
There is as yet no justification for mandibular third molar germectomy to prevent mandibular incisor crowding.
VIII
Methods to pervent dental caries and periodontal disease should be introduced to children of preschool age and their parents.
IX
The forces which are used and co-ordinated in reaching the moon are much, much simpler than the forces and co-ordination of forces which are at work in craniofacial morphogenesis.
(A. G. M. van Me/sen: The morphogenesis of the human head. Acta Morpho/. Neeri-Scand 10:3-8, 1972).
X
The current trend to more conservative attire is a precursor of a similar political trend.
R.I. Levin Groningen, January 1975.


rijksuniversiteit te groningen
begg orthodontic therapy
in retrospect
proefschrift ter verkrijging van het doctoraat
in de geneeskunde aan de rijksuniversiteit te groningen
op gezag van de rector rnagnificus dr. a . wattel
in het openbaar te verdedigen op
woensdag 1 5 januari 1 975 des namiddags te 4.00 uur
door raymond israel levin
geboren te johannesburg

f1om the cleplirtment of orthodontk:l, state university of groningen,
netherlendl, (head: prof. dr. h.s. duterloo)

state university groningen
begg orthodontic therapy
in retrospect
a dissertation to fulfil the requirements for
the degree of doctor of medicine at the university of groningen
on authority of the rector magnificos dr. a. wattel
and to be defended in public on
wednesday the 1 5th of january 1 975 at 4.00 p.m.
by raymond israel levin born in johannesburg

I acknowledge with thanks the assistance of:
Prof. K. G. Bijlstra, Professor Emeritus, whose encouragement and interest was greatly appre·
ciated; Mr. L. Th. van der Weele and Drs. D. M . van der Sluis, Computing Centre ( Head : Dr. D. W. Smits) ; Dr. H. Boersma, Department of Orthodontics, University of Nijmegen ( Head: Prof. Dr. F. P. G. M. van der Linden�;
Drs. A. ten Hoeve, Dr. A. Matin and Drs. H. W. Rouwe for critically reviewing chapters of the manuscript; Dr. T. Pilot, Department of Periodontics; Mr. K. J. Poel, Mr. A. L. Dijkstra and Mr. P. Hartevelt, Department of Dental Photography; Miss L. E. Noordhof, Librarian, Department of Dentistry. Members of the Department of Orthodontics who treated the subjects used in this investigation,
and, who assisted directly or indirectly with the investigation. Miss. M. van Dijken and Mrs. E. Siyahaya who assisted with typing of the manuscript and other onerous tasks.

to my parents
preface
I n general , the a im in treating malocclusions and oro-facial dysplasias is to obtain a biological ly optimal functional balance of the oro-facial structures: teeth, bone and soft tissues. I n addition to providing a basis for the longevity of the dentition, the facial skeleton and integumental structures are also more favourably maintained over a longer period and facial aesthetics are improved.
The mechanics of orthodontic treatment are of considerable intricacy. I n addition, patients are usually growing and it i s the individual oro-facial growth pattern which adds to the intricacy of the therapy. Moreover, the treatment period is lengthy and the continued cooperation of the patient is required.
Treatment results can only be effectively evaluated some time after the end of treatment as further changes may occur in the posttreatment period. An evaluation of results, besides indicating the success or failure of treatment also serves as a feedback to facil itate the formulation of treatment objectives and procedures. To th is end an investigation was undertaken of certain treatment and posttreatment changes in patients treated using the Begg orthodontic technique.
contents
Chapter 1 I ntroduction 1 .1 . Development of the Begg orthodontic theory and technique
1 .2. Objectives
Chapter 2, Material and Methods 2.1 . Material 2.1 . 1 .
2.1 .2.
2.1 .3. 2.1 .4.
2.1 .5. 2.2. 2.2.1 . 2.2.2. 2.2.3. 2.2.4. 2.3. 2.3. 1 . 2.3.2. 2.3.3. 2.3.4. 2.3.5 . 2.3.6. 2.3.7. 2.3.8 . 2.4.
Treatment technique
Selection criteria
Sample Records
Presentation of data Measuring on dental casts Determination of reference points Reference points Measuring with the Optocom Error of measurement Measuring on lateral cephalometric radiographs Cephalostat Determination of reference points Reference points . Reference lines and planes Method of measurement Error of measurement Structural method of superimposing mandibles Error of measurement of the structural method of superimposition Statistical procedures
Chapter 3 Overbite 3.1 . Introduction
3.2. Measurement
3.3. Results
3.3.1 . Mean values and distribution of individual values 3.3.2. Correlations
3.4. Discussion
Chapter 4 Vertical position of mandibular and maxillary incisors and occlusal plane inclination 4. 1 . I ntroduction
4.2. 4.3. 4.3.1 .
Measurements Results Mean values and distribution of individual values
4.3.2. Relationship between changes of occlusal plane inclination and vertical changes in position of mandibular molars and incisors
4.3.3. Correlations 4.4. Discussion
2
3 3 3 3 4 4
4 5 5 5 5
6 7 7 8 8
1 0 1 2
1 3
1 3 1 5
1 6
1 7 1 7 1 7
1 8
1 8 20 22
25 25 26 27 27
28 31 33
Chapter 5 Overjet 5.1 . I ntroduction 5.2. 5.3. 5.3. 1 . 5.3.2. 5.3 .3. 5.4.
Measurement Results
Mean values and distribution of individual values Correlations Relationship of overjet to overbite
Discussion
Chapter 6 Sagittal inclination of mandibular and maxillary incisors 6. 1 . I ntroduction 6.2.
6.3. Measurements Results
6.3. 1 . Incisor mandibular plane angle 6.3.1 . 1 . Relationship to overbite and overjet 6.3.2. Maxil lary incisal inclination 6.3.2.1 . Relationship to overbite and overjet 6.3.3. I nterincisal angle
6.3.3. 1. Relationship to overbite and overjet 6.4. Discussion
Chapter 7 lntercanine widtb and anterior dental arch circumference 7.1 . Introduction 7.2. Measurements
7.3. Results
7 .3.1 . I ntercanine width
7.3.2. Anterior dental arch circumference
7.3.3. Correlations 7.3.4. Extraction diastema
7 .4. Discussion
Chapter 8 Direction of condylar growth
37
37 37 37 37
41 42
43
46 46 46 47 47 51
52 53 54
54 55
59 59 60 61 61
64 67 67 68
72 8.1 .
8.2.
8.2. 1 . 8.2.2.
8 .3.
8.3. 1 . 8.3.2.
8.3.3.
Introduction 72
8.3.4.
8.3.5. 8.4.
Methods 73 Measurements 73 Procedure of analysis 75 R�� n Direction of condylar growth 76 Relationship of the direction of condylar growth to overbite 76 Relationship of the direction of condylar growth to changes in vertical position of incisors and occlusal plane incl ination 8 1 Relationship o f the direction o f condylar growth t o intercanine width and anterior dental arch circumference 83 Mandibular plane inclination 84 Discussion 87
Chapter 9 Mandibular rotation 9.1 . Introduction 9.2. Method 9.2. 1 . 9.2.2. 9.3. 9.3. 1 . 9.3.2. 9.3.3. 9.3.4. 9.4.
Measurement Procedure of analysis Results
Mean values and distribution of individual values Relationship of mandibular rotation to the direction of condylar growth Relationship of mandibular rotation, direction of condylar growth and overbite
Correlations Discussion
Chapter 1 0 Facial Profile 1 0.1 . Introduction 1 0.2. Methods and measurements 1 0.2 .1 . Division of sample 1 0.2.2. Measurements 1 0.3 Results 1 0.3.1 . Soft tissue profil e description 1 0.3.2. Cephalometric measurements 1 0.3.3. Relationship between dento-skeletal and soft tissue profile changes 1 0.4. Discussion
Chapter 1 1 Status of dentition and periodontium 1 1 .1 I ntroduction
1 1 .2. Sulcus depth
1 1 .2.1 . Material 1 1 .2.2. Method 1 1 .2.3. Error of the method 1 1 .2.4. Results
1 1 .3. Anterior alveolar crest height
1 1 .3.1 . Measurements
1 1 .3.2. Results
1 1 .4. Root length 1 1 .5 . Mandibular third molars 1 1 .6. Discussion
Chapter 1 2 General discussion
Summary
References
93
93 93 93 94 95 95 95 97 98 98
1 01 1 01 1 01
101
1 02
1 03 1 03 1 03
1 09
1 1 1
1 1 4
1 14 1 14 1 1 4
1 1 5 1 1 5 1 1 5 1 1 9 1 1 9 1 1 9 120 120 1 20
1 23
1 27
1 3 1

chapter 1
introduction
1 .1 Development of the Begg orthodontic theory and technique
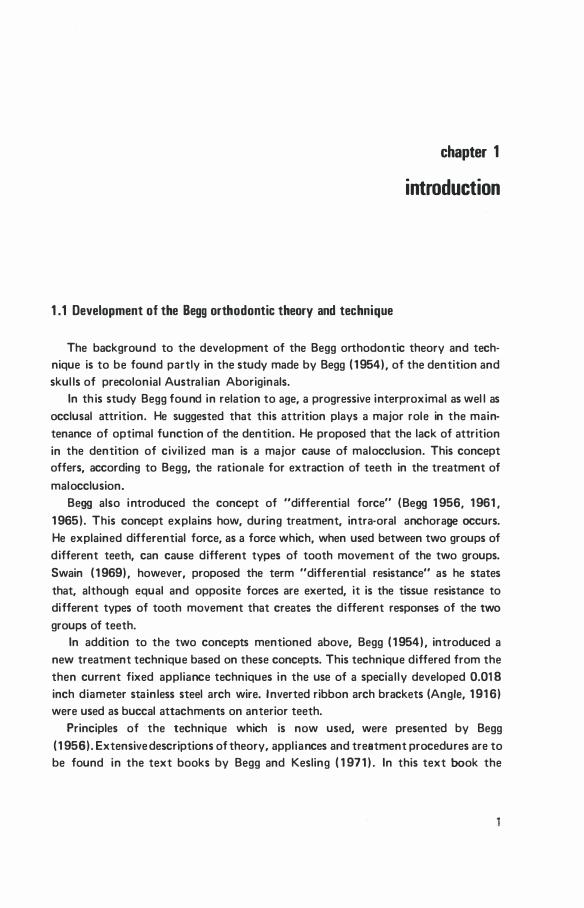
The background to the development of the Begg orthodontic theory and technique is to be found partly in the study made by Begg (1954), of the dentition and skul ls of precolonial Austral ian Aboriginals.
In th is study Begg found in relation to age, a progressive interproximal as wel l as occlusal attrition. He suggested that this attrition plays a major role in the maintenance of optimal function of the dentition. He proposed that the lack of attrition in the dentition of civil ized man is a major cause of malocclusion. This concept offers, according to Begg, the rationale for extraction of teeth in the treatment of
malocclusion. Begg also introduced the concept of "differential force" (Begg 1956, 1961,
1965). This concept explains how, during treatment, intra-oral anchorage occurs. He explained differential force, as a force which, when used between two groups of different teeth, can cause different types of tooth movement of the two groups. Swain (1969), however, proposed the term "differential resistance" as he states that, although equal and opposite forces are exerted, it is the tissue resistance to different types of tooth movement that creates the different responses of the two groups of teeth.
In addition to the two concepts mentioned above, Begg (1954), introduced a new treatment technique based on these concepts. This technique differed from the then current fixed appliance techniques in the use of a special ly developed 0.018 inch diameter stainless steel arch wire. Inverted ribbon arch brackets (Angle, 1916) were used as buccal attachments on anterior teeth.
Principles of the technique which is now used, were presented by Begg ( 1956). Extensive descriptions of theory. appliances and treatment procedures are to be found in the text books by Begg and Kesling (1971 ). In this text book the
records i l l ustrating the treatment of a wide range of malocclusions are shown. A chapter written by Wi l l iams is devoted to the analysis of lateral cephalometric radiographs. He describes in general terms some of the changes which occur during and fol lowing treatment. However, the changes which have occurred during the treatment, and specifical ly thereafter, have not been extensively analysed.
There is general disagreement as to the manner in which certa in changes take place during Begg treatment. Longterm results have not been widely studied and there are few unanimous opinions regarding the causes of the stabil ity of treatment results or of posttreatment changes. A number of studies have recently appeared on different aspects of Begg therapy and other relevant phenomena. These studies wi l l be referred to in subsequent chapters.
1.2 Objectives
The purpose of the investigation described in th is thesis is to study in retrospect a number of changes of the dentition, its occlusion and the facial skeleton which occurred during and fol lowing treatment in a sample of thi rty patients treated with the Begg fixed appliance technique. A further understanding of these changes may contribute to the formulation of treatment objectives, the use of the fixed appl iance and the selection of retention appl iances.
The fol lowing changes during the treatment and posttreatment periods are studied : overbite, overjet, incisor positions, mandibular and maxil lary crowding and intercanine widths. Using the structural method of superimposing mandibles (Bjork 1 963, 1 969) , the direction of condylar growth, mandibu lar rotation, and occl usal plane rotation are investigated. Aspects of anterior facial profi l e changes are
examined . Further, the interrelationship of a number of the variables studied are investigated. Additional ly, an evaluation of the status of the dentition and the periodontal tissues is made.
Due to the nature of the investigation the sequence of chapters is arbitrary. However the changes in variables described in one chapter may be related to both changes in variables described in previous as wel l as subsequent chapters.
2
chapter 2
material and methods
2.1 Material
Orthodontic treatment using the Begg fixed appl iance technique was fi rst undertaken in the Orthodontic department of the State U niversity of Groningen i n 1 960. Since 1 960, the technique has been used for increasingly larger numbers of patients in th is department. For the present investigation, 30 patients were selected.
Al l were treated by staff members of the department under the supervision of C.Booy . The selection was based mainly on the suitability of records and on the criteria mentioned below.
2. 1 . 1 . Treatment techn ique
The technique used in the present investigation, was as described by Begg ( 1 96 1 , 1 965) . The theory, the appliances and treatment procedures were first described by Begg in 1 954 and 1 956. An extensive description of the theory, the appl iances and treatment procedures is to be found in the text book by Begg and Kesl ing ( 1 97 1 ) .
Retention procedures were usual ly a s fol lows: with in a few days of the removal of the fixed appl iances, removabl e retainers were provided for retention of the maxi l lary and mandibular dental arches. For the first three months the patients were advised to wear the retainers day and night. For the next three months retainers were worn at night only and thereafter less frequently. After approxi· mately nine months all retention· procedures were stopped .
2 . 1 .2. Selection Criteria
The fol lowing criteria were used in the selection of patients: a. an age at the start of treatment of 1 0 to 1 5 years; b. malocclusions were excluded from the investigation which were classified as
3
Class I l l , Class I I division 2 or openbite; c. all permanent teeth (erupted or unerupted) had been present at the start of
treatment (third molars excepted) ; d. the four fi rst premolars had been extracted at the start of treatment;
e. the treatment with the fixed appl iance had been satisfactori ly completed. This was evaluated by i nspection of the dental casts, taken at the time of removal of the fixed appliance.
f. the postretention period was from 1 2 to 36 months.
2 . 1 .3. Sample
The group of 30 patients meeting the selection criteria showed the fol lowing general characteristics. At the start of treatment the average age was 1 2.8 years (SD 1 .2 . ) . The youngest patient was 1 0 years 8 months and the oldest was 1 5 years 2 months. There were 1 2 females and 1 8 males.
The average period for which fixed appl iances were worn was 27.8 months (S.D. 6 .9). The shortest period was 16 months and the longest 44 months. The retention period was approximately nine months and the postretention period was at least 1 2 months. The average posttreatment period was 32 months (S.D . 6 ). The shortest posttreatment period was 2 1 months and the longest was 44 months. The malocclu· sions of the patients were classified according to the Angle system by inspection of the dental casts. Seven malocclusions were classified as Class I malocclusions, six as borderl ine cases (Class I and Class II characteristics). and 1 7 as Class II division 1 malocclusions.
2.1 .4. Records
Complete records had to be available. They consisted of dental casts, lateral cephalometric radiographs, intraoral radiographs and colour s l ides, and black and white profi le photographs. The sets recorded the status of the patient at: a. The start of treatment (examination 1 or the initial examination) ; b . The removal o f the fixed appl iance (examination 2 o r the end of treatment) ; c. The treatment results at least one year after the retention procedures had ended
(examination 3 or the final examination) .
2 . 1 .5. Presentation of data
The treatment period refers to the period between examination 1 and 2. The changes which took place were calculated by subtracting the values found at examination 1 from 2 (2- 1 ) . The posttreatment period refers to the interval between examination 2 and 3 . The changes were calculated by subtracting the values found at examination 2 from 3 (3-2) . The total period of the examination refers to the
4
interval between examination 1 and 3. The changes ( net changes) were calculated by subtractiny the values found at examination 1 from 3 (3-1 ) .
2.2 Measuring on dental casts
2.2. 1 . Determination of reference points
The three sets of dental casts from each patient were placed side by side. The points to be registered on the first dental cast were determined by inspection, and marked with a soft graphite penci l . When attrition of the cusps of the canines had occurred the second a nd thi rd casts were compared with the first cast in order to determine the position of the cusps.
2.2.2. Reference points
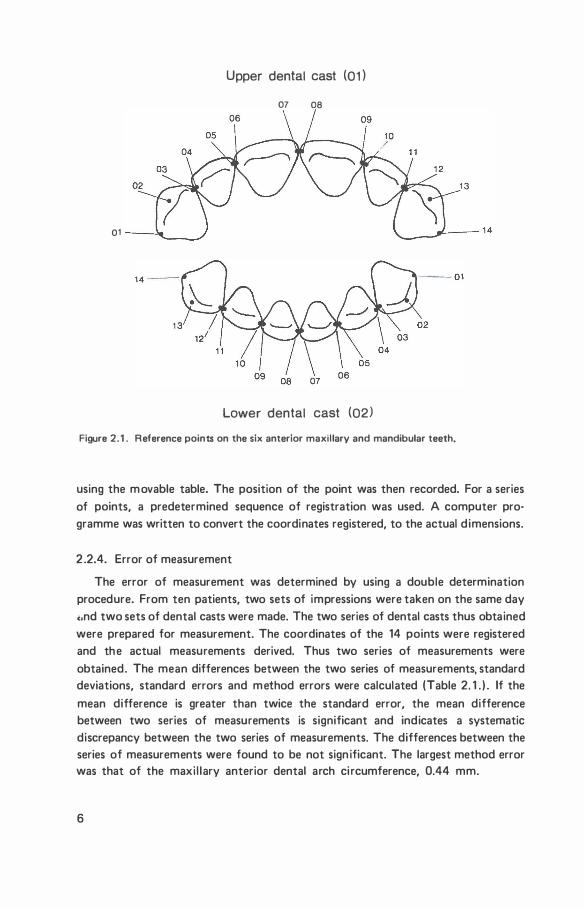
For each set of dental casts 28 reference points were determined ( F igure 2. 1 . ) . A numerical code was used to denote the points of the upper and lower cast. The upper cast was denoted 0 1 , the lower 02. The points were numbered one to fourteen and were defined as fol lows:
points two and thirteen: the cusps of the canines;
points one, three to twelve and fourteen: the points denoting the greatest mesiodistal widths of the can ines and incisors.
2.2.3. Measuring with the Optocom
The Optocom (Van der Linden et al . , 1 972) is described as a monocular microscope with a reticl e in the lens, mounted above a two dimensional ly movable table. The position of the table is electron ical ly recorded on paper tape.
The upper dental cast was mounted on a base which could be incl ined. The base was then adjusted to orientate the dental cast, so that the occlusal plane was horizonta l . The occlusal plane was defined as the plane through the mesiobuccal cusps of the first molars and the midpoint of the incisal edge of the right central i ncisor. The lower dental cast, mounted on a base, was placed in occl usion on the upper dental cast using an i nstrument cal led the orientation tower. The orientation tower has two paral le l platforms with precision pins corresponding to holes in the bases on which the dental casts were mounted. Once the bases had been positioned in the orientation tower and the dental casts were in occlusion they were removed from the tower and the points recorded. The coordinates were registered to 0. 1 mm.
The casts were measured separately. The base was placed on the two-dimentional ly movable table of the Optocom in a fixed position using precision pins and holes. The point to be registered was moved under the reticle of the microscope
5
01
Upper dental cast (01)
07 08
Lower dental cast (02)
Figure 2.1 . Reference poinu on the six anterior maxillary and mandibular teeth.
using the m ovable table. The position of the point was then recorded. For a series of points, a predetermined sequence of registration was used. A computer programme was written to convert the coordinates registered, to the actual d imensions.
2 .2.4. Error of measurement
The error of measurement was determined by using a double determination procedure. From ten patients, two sets of impressions were taken on the same day c.nd two sets of dental casts were made. The two series of dental casts thus obtained were prepared for measurement. The coordinates of the 14 points were registered and the actual measurements derived. Thus two series of measurements were obtained. The mean differences between the two series of measurements, standard deviations, standard errors and method errors were calculated (Table 2. 1 . ) . If the
mean difference is greater than twice the standard error, the mean difference between two series of measurements is significant and indicates a systematic discrepancy between the two series of measurements. The differences between the series of measurements were found to be not sign ificant. The largest method error was that of the maxi l lary anterior dental arch ci rcumference, 0.44 mm.
6
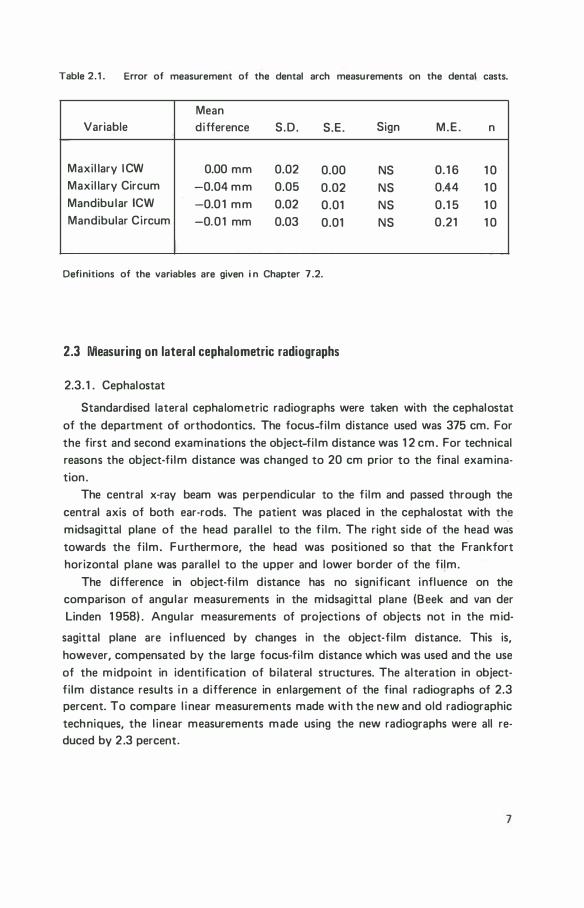
Table 2.1 . Error of measurement of the dental arch measurements on the dental casts.
Mean Variable difference S .D. S.E. Sign M.E. n
Maxil lary ICW 0.00 mm 0.02 0.00 NS 0. 1 6 1 0 Maxil lary Circum -0.04 mm 0.05 0.02 NS 0.44 1 0 Mandibu lar ICW -0.0 1 mm 0.02 0.01 NS 0.1 5 1 0 Mandibular Circum -0.01 mm 0.03 0.01 NS 0.21 1 0
Definitions of the variables are given i n Chapter 7 .2.
2.3 Measuring on lateral cephalometric radiographs
2.3. 1 . Cephalostat
Standardised lateral cephalometric radiographs were taken with the cephalostat of the department of orthodontics. The focus-film distance used was 375 em. For the first and second examinations the object-fi lm distance was 1 2 em. For technical reasons the object-fi lm distance was changed to 20 em prior to the final examination .
The central x-ray beam was perpendicular to the fi lm and passed through the central axis of both ear-rods. The patient was placed in the cephalostat with the midsagittal plane of the head paral lel to the fi lm. The right side of the head was towards the fi lm. Furthermore, the head was positioned so that the Frankfort horizontal plane was paral lel to the upper and lower border of the film.
The difference in object-fi lm distance has no significant influence on the comparison of angular measurements in the midsagittal plane (Seek and van der Linden 1 958) . Angular measurements of projections of objects not in the mid-
sagittal plane are i nfluenced by changes in the object-film distance. This is, however, compensated by the large focus-fi lm distance which was used and the use of the midpoint in identification of bi lateral structures. The alteration in objectfi lm distance results i n a difference in enlargement of the final radiographs of 2.3 percent. To compare l inear measurements made with the new and old radiographic techniques, the l inear measurements made using the new radiographs were all reduced by 2 .3 percent.
7
N
Me
Pr
Is
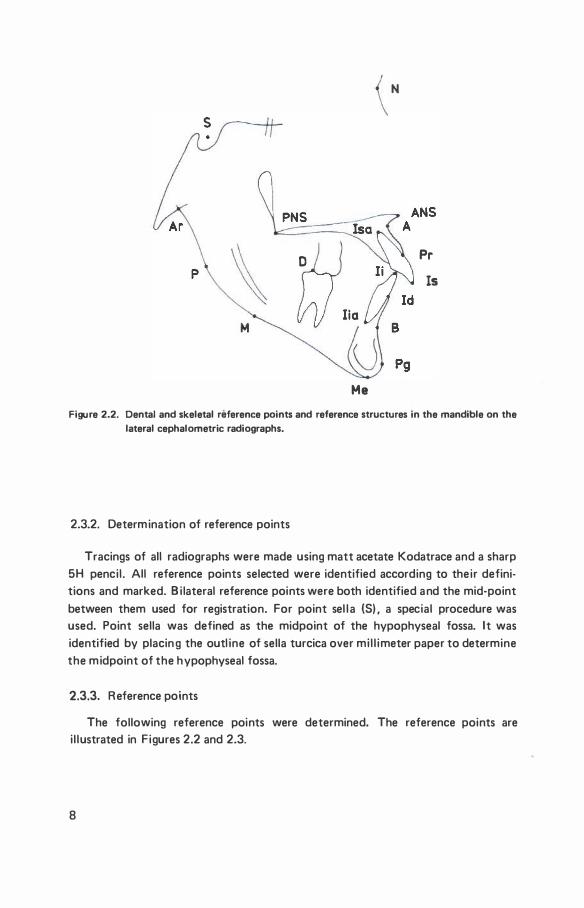
Figure 2.2. Dental and skeletal reference points and reference structures in the mandible on the
lateral cephalometric radiographs.
2.3.2. Determination of reference points
Tracings of all radiographs were made using matt acetate Kodatrace and a sharp 5H pencil . All reference points selected were identified according to their definitions and marked. Bi lateral reference points were both identified and the mid·point between them used for registration. For point sel l a (S) , a special procedure was used. Point sella was defined as the midpoint of the hypophyseal fossa. It was identified by placin g the outl ine of sella turcica over mi l l imeter paper to determine the midpoint of the hypophyseal fossa.
2.3.3. Reference points
The following reference points were determined. The reference points are i l lustrated in Figures 2.2 and 2.3.
8
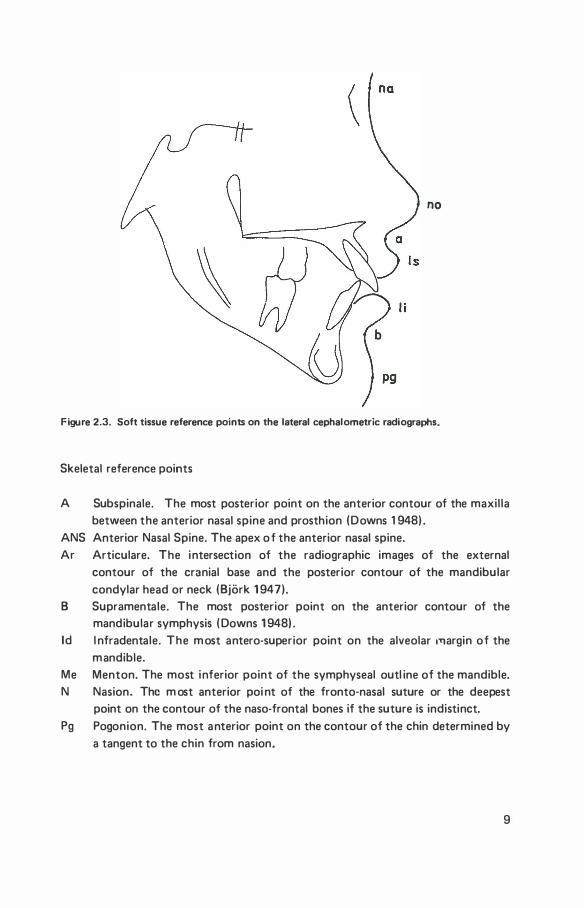
no
Figure 2.3. Soft tissue reference points on the lateral cephalometric radiographs.
Skeletal reference points
A Subspinale. The most posterior point on the anterior contour of the maxil la between the anterior nasal spine and prosthion (Downs 1 948) .
ANS Anterior Nasal Spine. The apex o f the anterior nasal spine. Ar Articulare. The intersection of the radiographic images of the external
contour of the cranial base and the posterior contour of the mandibular condylar head or neck (Bjork 1 947).
B Supramentale. The most posterior point on the anterior contour of the mandibular symphysis ( Downs 1 948) .
ld l nfradentale. The m ost antero-superior point on the alveolar 1T1argin of the mandible.
Me Menton. The most inferior point of the symphyseal outl ine of the mandible. N Nasion. The m ost anterior poi nt of the fronto·nasal suture or the deepest
point on the contour of the naso-frontal bones if the suture is indistinct. Pg Pogonion. The most anterior point on the contour of the chin determined by
a tangent to the chin from nasion.
9

PNS Posterior Nasal Spine. The most posterior point of the hard palate in the sagittal plane.
Pr Prosth ion. The most antero-inferior point on the alveolar margin of the maxil la.
S Sel la . The mid point of the hypophyseal fossa. M* Point on the tangent to the lower border of the mandible. R* Point on the tangent to the posterior border of the ramus.
Dental reference points
D* Distobuccal cusp of the mandibu lar first molar. Li I ncision inferius. The incisal tip of the most anterior mandibular incisor. Is Incision superius. The incisal t ip of the most anterior maxil lary incisor. l ia Apex of the most anterior mandibular incisor. l sa Apex of the m ost anterior maxi l lary incisor.
In addition to the reference points the following mandibular reference structures were identified and traced:
1 the outl ine of the madibular canal ; 2 the anterior contour of the chin ; 3 the outl ine of the inner cortical structure of the mfererior border of the man
dibular symphysis.
Soft tissue profile reference points
a The deepest point on the contour between the nose and upper l ip. b The deepest point on the contour between the lower l ip and chin. l i The most anterior point on the lower l ip. Is The most anterior point on the upper l ip. n The most anterior point on the nose. na The deepest point on the contour between nose and forehead. pg The m ost anterior point on the ch in.
2.3.4. Reference l ines and planes* *
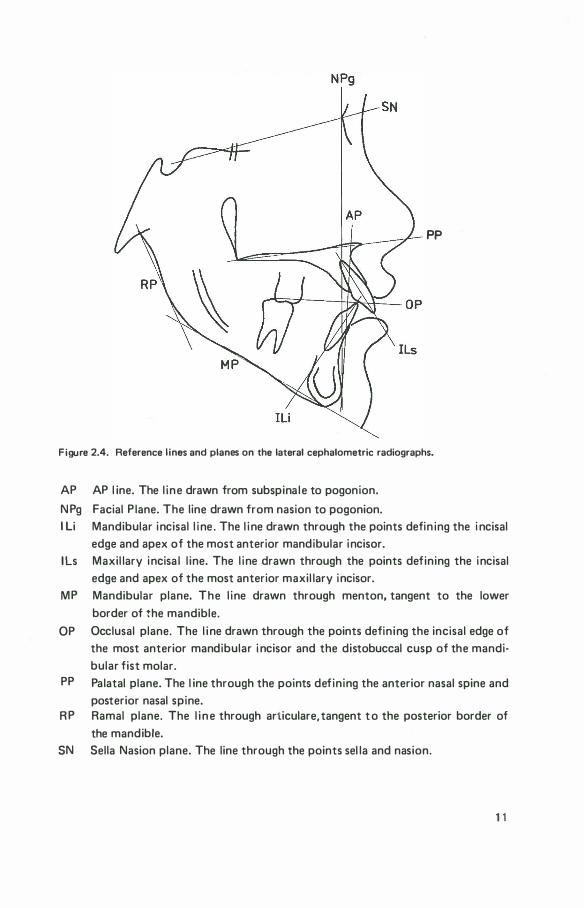
The fol lowing reference l i nes and planes were used ( Figure 2.4) .
* The letters used t o denote these points were chosen for convenience
"* The term plane is commonly used in orthodontic l iterature to describe a line when examining lateral cephalometric radiographs.
10
PP
Figure 2.4. Reference l ines and planes on the lateral cephalometric radiographs.
AP AP l ine. The l ine drawn from subspina le to pogonion.
N Pg Facial P lane. The line drawn from nasion to pogonion. I Li Mandibular incisal l i ne . The l i ne drawn through the points defin ing the i ncisal
edge and apex of the most anterior mandibular incisor. lls Maxil lary incisa l l ine. The l ine drawn through the points defining the incisal
edge and apex of the most anterior maxil lary incisor. MP Mandibular plane. The l ine drawn through menton, tangent to the lower
border ot the mandible.
OP Occlusal plane. The l i ne drawn through the points defin ing the incisal edge of the most anterior mandibular i ncisor and the distobuccal cusp of the mandibular fist molar.
PP Palatal plane. The l ine through the points defining the anterior nasal spine and posterior nasal spine.
R P Ramal plane. The l i n e through articulare, tangent t o the posterior border of the mandible.
SN Sella Nasion plane. The line through the points sel la and nasion.
11
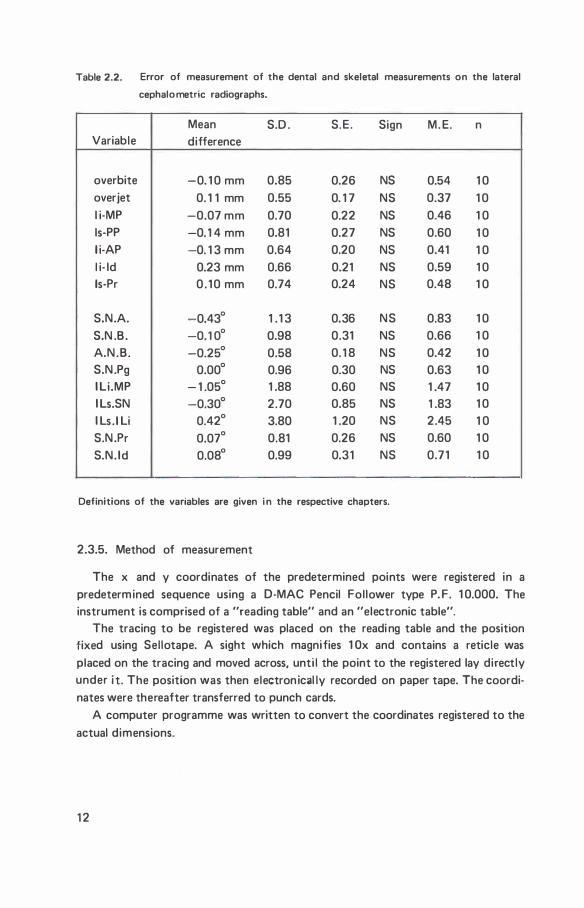
Table 2.2. Error of measurement of the dental and skeletal measurements on the lateral
cephalo metric radiographs.
Mean S.D . S.E. Sign M. E. n Variable difference
overbite -0. 1 0 mm 0.85 0.26 NS 0.54 1 0 overjet 0. 1 1 mm 0.55 0. 1 7 NS 0.37 1 0 l i-MP -0.07 mm 0.70 0.22 NS 0.46 1 0 ls-PP -0. 1 4 mm 0.81 0.27 NS 0.60 1 0 l i-AP -0. 1 3 mm 0.64 0.20 NS 0.41 1 0 l i- ld 0.23 mm 0.66 0.21 NS 0.59 1 0 ls-Pr 0 . 1 0 mm 0.74 0.24 NS 0.48 1 0
S.N.A. -0.43° 1 . 1 3 0.36 NS 0.83 1 0 S.N .B . -0. 1 0° 0.98 0.31 NS 0.66 1 0 A.N.B. -0.25° 0.58 0. 1 8 NS 0.42 1 0 S.N .Pg 0.00° 0.96 0.30 NS 0.63 1 0 I Li.MP - 1 .05° 1 .88 0.60 NS 1 .47 1 0 I Ls.SN -0.30° 2.70 0.85 NS 1 .83 1 0 I Ls .ILi 0.42° 3.80 1 .20 NS 2.45 1 0 S.N .Pr 0.07° 0.81 0.26 NS 0.60 1 0 S.N. Id 0.08° 0.99 0.31 NS 0.71 1 0
Definitions of the variables are given i n the respective chapters.
2.3.5. Method of measurement
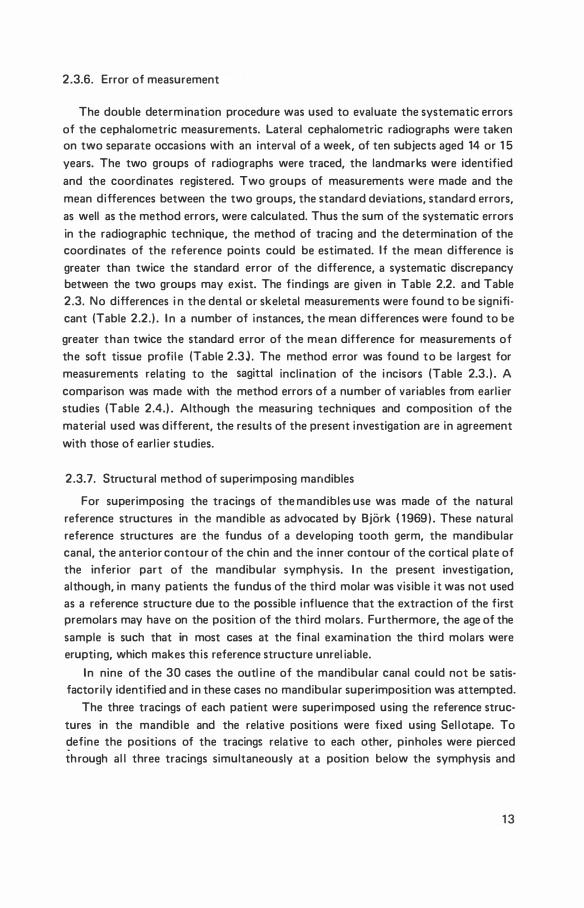
The x and y coordinates of the predetermined points were registered in a predetermined sequence using a 0-MAC Pencil Fol lower type P. F. 1 0.000. The instrument is comprised of a "reading table" and an "electronic table".
The tracing to be registered was placed on the readi ng table and the position fixed using Sel lotape. A sight which magnifies 1 Ox and contains a reticle was placed on the tracing and moved across, until the point to the registered lay directly under it. The position was then electron ical ly recorded on paper tape. The coordinates were thereafter transferred to punch cards.
A computer programme was written to convert the coordinates registered to the actual dimensions.
1 2
2.3.6. Error of measurement
The double determination procedure was used to evaluate the systematic errors of the cephalometric measurements. Lateral cephalometric radiographs were taken on two separate occasions with an interval of a week, of ten subjects aged 14 or 1 5 years. The two groups of radiographs were traced, the landmarks were identified and the coordinates registered. Two groups of measurements were made and the mean differences between the two groups, the standard deviations, standard errors, as well as the method errors, were calculated. Thus the sum of the systematic errors in the radiographic technique, the method of tracing and the determination of the coordinates of the reference points could be estimated. If the mean difference is greater than twice the standard error of the difference, a systematic discrepancy between the two groups may exist. The findings are given in Table 2.2. and Table 2.3. No differences i n the dental or skeletal measurements were found to be significant (Table 2.2.) . In a number of instances, the mean differences were found to be
greater than twice the standard error of the mean difference for measurements of the soft tissue profi l e (Table 2.3l. The method error was found to be largest for measurements relating to the sagittal inclination of the i ncisors (Table 2.3. ) . A comparison was made with the method errors of a number of variables from earl i er studies (Table 2.4.) . Although the measuring techniques and composition of the material used was d ifferent, the results of the present investigation are in agreement with those of earl ier studies.
2.3.7. Structural method of superimposing mandibles
For superimposing the tracings of the mandibles use was made of the natural reference structures in the mandible as advocated by Bjork (1 969) . These natural reference structures are the fundus of a developing tooth germ, the mandibular canal, the anterior contour of the chin and the inner contour of the cortical plate of the inferior part of the mandibular symphysis. In the present investigation, although, in many patients the fundus of the third molar was visible it was not used as a reference structure due to the possible influence that the extraction of the first premolars may have on the position of the third molars. Furthermore, the age of the sample is such that in most cases at the final examination the thi rd molars were erupting, which makes th is reference structure unrel iable.
In nine of the 30 cases the outl ine of the mandibular canal could not be satis· factori ly identified and in these cases no mandibular superimposition was attempted.
The three tracings of each patient were superimposed using the reference structures in the mandible and the relative positions were fixed using Sel lotape. To �efine the positions of the tracings relative to each other, pinholes were pierced through al l three tracings simultaneously at a position below the symphysis and
1 3
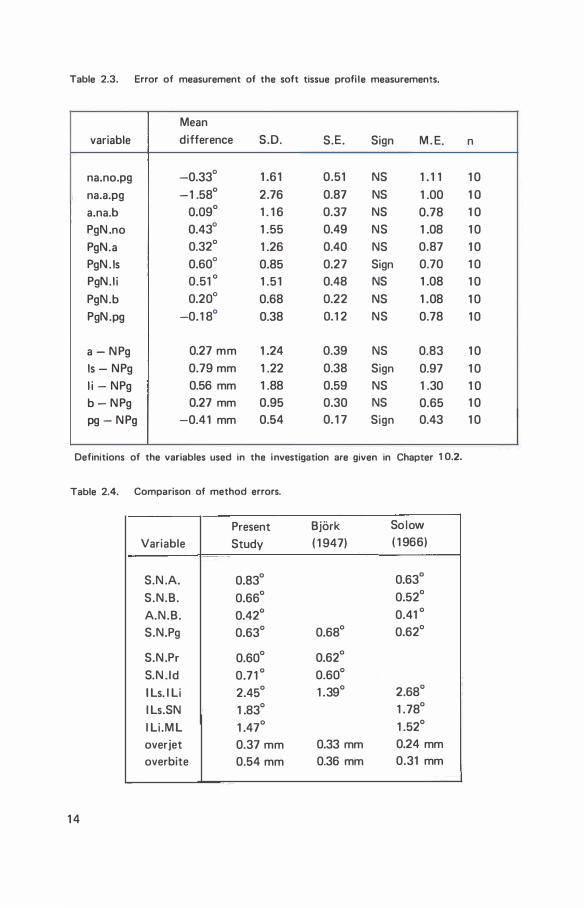
Table 2.3. Error of measurement of the soft tissue profi le measurements.
Mean variable difference S.D. S.E. Sign M . E.
na.no.pg -0.33° 1 .61 0.51 NS 1 . 1 1 na.a.pg -1 .58° 2.76 0.87 NS 1 .00 a.na.b 0.09° 1 . 1 6 0.37 NS 0.78 PgN .no 0.43° 1 .55 0.49 NS 1 .08 PgN.a 0.32° 1 .26 0.40 NS 0.87 PgN . Is 0.60° 0.85 0.27 Sign 0.70 PgN. I i 0.51 ° 1 .51 0.48 NS 1 .08 PgN.b 0.20° 0.68 0.22 NS 1 .08 PgN.pg -0. 1 8° 0.38 0. 1 2 NS 0.78
a - N Pg 0.27 mm 1 .24 0.39 NS 0.83 Is - NPg 0.79 mm 1 .22 0.38 Sign 0.97 l i - NPg 0.56 mm 1 .88 0.59 NS 1 .30 b - N Pg 0.27 mm 0.95 0.30 NS 0.65 pg - N Pg -0.41 mm 0.54 0. 1 7 Sign 0.43
Definitions of the variables used in the investigation are given in Chapter 1 0.2.
Table 2.4. Comparison of method errors.
Present Variable Study
S.N .A. 0.83°
S.N.B. 0.66°
A.N.B. 0.42°
S.N.Pg 0.63°
S.N .Pr 0.60°
S.N. Id 0.71 °
I Ls. I Li 2.45°
I Ls.SN 1 .83°
I Li .M L 1 .47°
overjet 0.37 mm overbite 0.54 mm
1 4
Bjork So low
( 1 947) ( 1 966)
0.63°
0.52°
0.41 °
0.68° 0.62°
0.62°
0.60°
1 .39° 2.68°
1 .78°
1 .52°
0.33 mm 0.24 mm 0.36 mm 0.31 mm
n
1 0 1 0 1 0 1 0 1 0 1 0 1 0 1 0 1 0
1 0 1 0 1 0 1 0 1 0
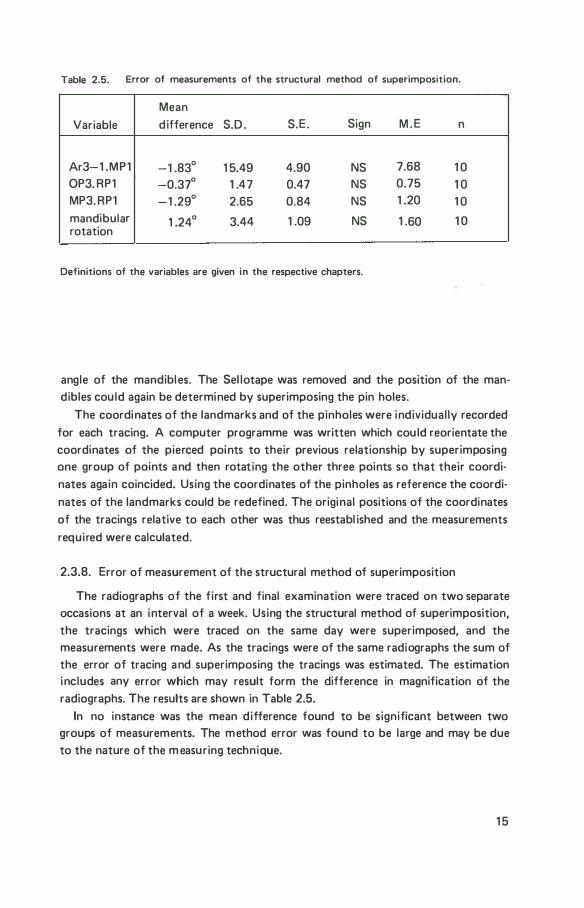
Table 2.5. Error of measurements of the structural method of superimposition.
Mean Variable d ifference S.D . S.E. Sign M . E n
Ar3-1 .MP1 -1 .83° 1 5.49 4.90 NS 7.68 1 0 OP3. RP1 -0.37° 1 .47 0.47 NS 0.75 1 0 MP3. RP1 -1 .29° 2.65 0.84 NS 1 .20 1 0 mandibular 1 .24° 3.44 1 .09 NS 1 .60 1 0 rotation
Definitions of the variables are given in the respective chapters.
angle of the mandibles. The Sel lotape was removed and the position of the mandibles cou ld again be determined by superimposing the pin holes.
The coordinates of the landmarks and of the pinholes were individual ly recorded for each tracing. A computer programme was written which cou ld reorientate the coordinates of the pierced points to their previous relationship by superimposing one group of points and then rotating the other three points so that their coordi· nates again coincided. Using the coordinates of the pinholes as reference the coordinates of the landmarks could be redefined. The original positions of the coordinates of the tracings relative to each other was thus reestabl ished and the measurements required were calculated.
2.3.8. Error of measurement of the structural method of superimposition
The radiographs of the first and final examination were traced on two separate occasions at an interval of a week. Using the structural method of superimposition, the tracings which were traced on the same day were superimposed, and the measurements were made. As the tracings were of the same radiographs the sum of the error of tracing and superimposing the tracings was estimated. The estimation includes any error which may result form the difference in magnification of the radiographs. The results are shown in Table 2.5.
In no instance was the mean difference found to be significant between two groups of measurements. The method error was found to be large and may be due to the nature of the m easuring technique.
1 5
2.4 Statistical procedures
The calculation of the measurements and al l statistical procedures were per· formed on the C.D.C. Computer of the Computing Center, State Univllrsity,Gronin· gen ( Head: Dr. D.W . Smith) .
For each variable the mean ( M) . standard deviation (S.D.) , standard error (S. E. ) and range were calculated. I n add ition, for double determinations, the method error * ( M . E. ) was calculated.
The significance of mean changes during the observation period (matched pairs) and the mean d ifference between two groups ( independent samples) was tested using the appropriate Students t-test. For matched pairs the degrees of freedom used in determining the significance of t was n·1 and for independent samples n-2. The product moment correlation coefficient (r) W\'IS used to investigate the relation· ship between two variables. To determine the significance, n-2 degrees of freedom were used. Further, the significance of t and r were determined using two tai led tests. A value of t or r equal to, or less than a probabil ity value (P) of 0.05 was considered to be significant. This indicates, that the probabil ity of the value of t or r being due to chance would arise once in 20 times or less. Significance levels of PQ>.05 and �0.01 are given for each table.
Advice on statistical procedures was given by L. Th. van der Weele. Statistical procedures were prepared by L . Th. van der Weele et al. (1974) and the computer programmes were written by D.M. van der Sluis.
*
M. E.=
16
dh=xil 1 )_ xi
l2l, n = number of double determinations.
xil1 l is first determination and xi
l2l is second determination
of measurements of individual with index i .
chapter 3
overbite
3.1 . I ntroduction
There are as many methods of treating a deep overbite as there are orthodontic treatment techniques. For each technique there are opposing opinions as to h ow, and when the treatment should take place. I n addition, views differ widely on how the treatment result is attained.
The complexity of the problem of overbite was recognized by Moorrees et al. (1969), who state,""that overbite is a symptom determi ned not only by the position and incl ination of the incisors but by an agglomeration of factors involving disproportionate relationships between the heights of the alveolar processes in the incisor and posterior segments of one or both jaws and even disproportions of vertical facial development". Further, it is frequently observed that the treatment of overbite may be unstable and numerous factors have been investigated to determine the causes of overbite relapse.
I n this chapter the changes in overbite wil l be examined. I n subsequent chapters various factors wil l be examined which may be related to changes in overbite during or fol lowing treatment.
3.2. Measurement
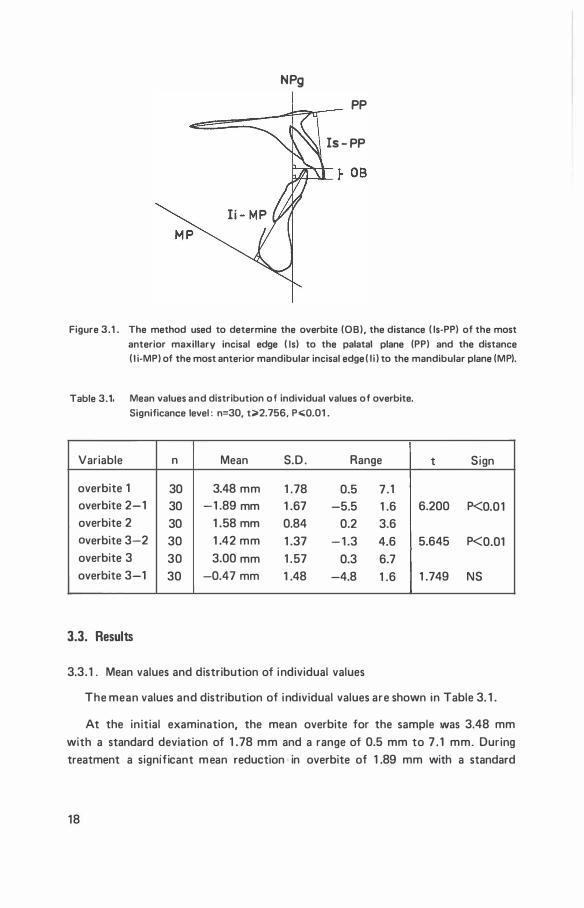
Details of the cephalometric procedures and the landmarks and plane used are described in Chapter 2.3. The method of measurement is i l lustrated in F igure 3. 1 .
08 Overbite, was defined as the distance from the incisal edge of the most anterior mandibular incisor ( I i) to the incisal edge of the most anterior maxil lary incisor ( I s). measured parallel to the facial plane ( NPg) .
17
NPg
PP
Is-PP
Figure 3.1 . The method used to determine the overbite (OB), the distance ( ls-PP) of the most anterior maxillary incisal edge ( Is) to the palatal plane (PP) and the distance ( l i-MP) of the most anterior mandibular incisal edge ( l i ) to the mandibular plane (MP).
Table 3.1 . Mean values and distribution of individual values of overbite.
Significance level : n=30, t>2.756, P.;;Q.01 .
Variable n Mean S.D . Range
overbite 1 30 3.48 mm 1 .78 0.5 7 . 1 overbite 2-1 30 -1 .89 mm 1 .67 -5.5 1 .6 overbite 2 30 1 .58 mm 0.84 0.2 3.6 overbite 3-2 30 1 .42 mm 1 .37 - 1 .3 4.6 overbite 3 30 3.00 mm 1 .57 0.3 6.7 overbite 3-1 30 -0.47 mm 1 .48 -4.8 1 .6
3.3. Results
3.3.1 . Mean values and distribution of individual values
t Sign
6.200 P<0.01
5.645 P<0.01
1 .749 NS
The mean values and distribution of individual values are shown in Table 3. 1 .
At the initial examination, the mean overbite for the sample was 3.48 mm with a standard deviation of 1 .78 mm and a range of 0.5 mm to 7 . 1 mm. During treatment a significant mean reduction in overbite of 1 .89 mm with a standard
18
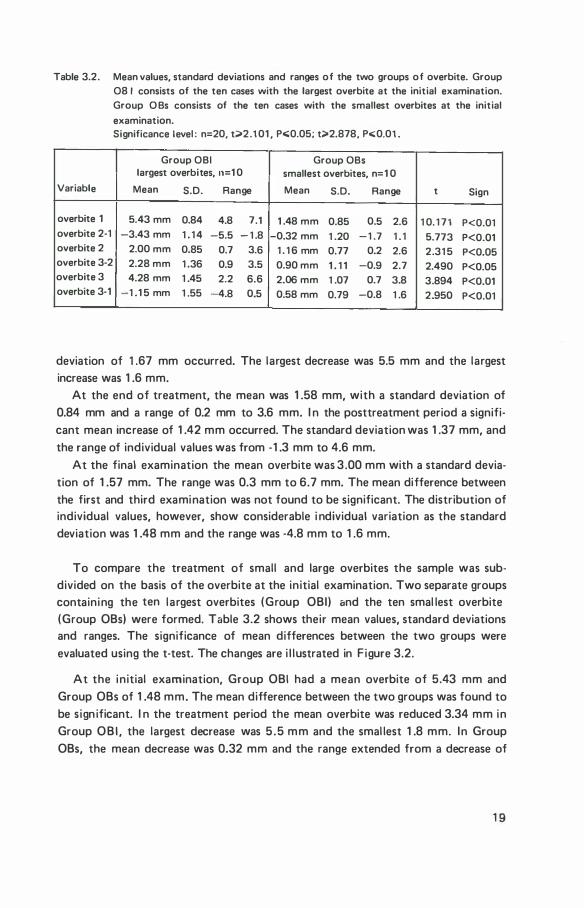
Table 3.2. Mean values, standard deviations and ranges of the two groups of overbite. Group 08 I consists of the ten cases with the largest overbite at the initial examination. Group O Bs consists of the ten cases with the smallest overbites at the initial
examination. Significance level : n=20, t;;;-2 . 101 , P<:0.05 ; t;;;-2.878 , P<:0 .0 1.
Group OBI Group OBs largest overbites, n=1 0 smallest overbites, n=1 0
Variable Mean S.D. Range Mean S.D. Range t Sign
overbite 1 5.4 3 mm 0.84 4.8 7.1 1 .48 mm 0.85 0.5 2.6 1 0. 1 7 1 P<0.01 overbite 2-1 - 3.4 3mm 1 . 1 4 -5.5 - 1 .8 -0 .32 mm 1 .20 - 1 .7 1 .1 5.77 3 P<0.01 overbite 2 2.00 mm 0.85 0.7 3.6 1 . 1 6 mm 0.77 0.2 2.6 2. 31 5 P<0.05 overbite 3-2 2.28 mm 1 . 36 0.9 3.5 0.90 mm 1 . 1 1 -0.9 2.7 2.490 P<0.05 overbite 3 4.28 mm 1 .45 2.2 6.6 2 .06 mm 1 .07 0.7 3.8 3.894 P<0.01 overbite 3-1 -1 .1 5 mm 1 .55 -4.8 0 .5 0.58 mm 0.79 -0.8 1 .6 2 .950 P<0.01
deviation of 1 .67 mm occurred. The largest decrease was 5.5 mm and the largest increase was 1 .6 mm.
At the end of treatment, the mean was 1 .58 mm, with a standard deviation of 0.84 mm and a range of 0.2 mm to 3.6 mm. I n the posttreatment period a significant mean increase of 1 .42 mm occurred. The standard deviation was 1 .37 mm, and the range of individual values was from -1 .3 mm to 4.6 mm.
At the final examination the mean overbite was 3 .00 mm with a standard deviation of 1 .57 mm. The range was 0.3 mm to 6.7 mm. The mean difference between the first and third examination was not found to be significant. The distribution of individual values, however, show considerable i ndividual variation as the standard deviation was 1 .48 mm and the range was -4.8 mm to 1 .6 mm.
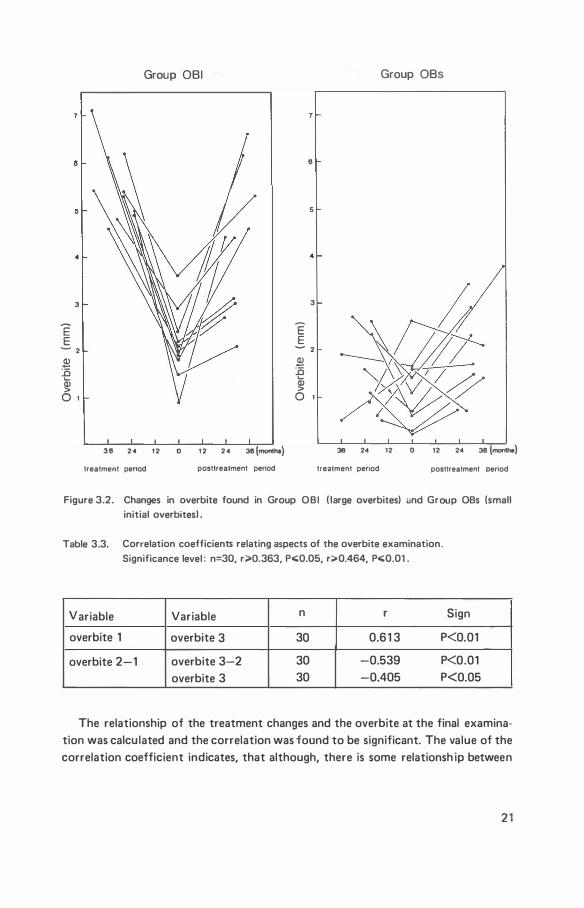
To compare the treatment of small and large overbites the sample was subdivided on the basis of the overbite at the initial examination. Two separate groups containing the ten largest overbites (Group OBI) and the ten smal lest overbite (Group OBs) were formed. Table 3.2 shows their mean values, standard deviations and ranges. The significance of mean differences between the two groups were evaluated using the t-test. The changes are i l lustrated in F igure 3.2.
At the initial examination, Group OBI had a mean overbite of 5.43 mm and Group OBs of 1 .48 mm. The mean difference between the two groups was found to be s ign ificant. I n the treatment period the mean overbite was reduced 3.34 mm in Group OBI , the largest decrease was 5 .5 mm and the smal lest 1 .8 mm. In Group OBs, the mean decrease was 0.32 mm and the range extended from a decrease of
19
1 .7 mm to an increase of 1 . 1 mm. The mean difference between the two groups was significant.
At the end of treatment, although the mean difference between the two groups was small it was still found to be significant. The mean overbite in Group OBI was 2.00 mm, an� the range extended from 0.7 to 3.6 mm while in Group OBs, the mean overbite was 1 . 1 6 mm and the range was from 0.2 mm to 2.6 mm.
In the posttreatment period the mean difference between the two groups remained significant. I n Group OBI a mean increase in overbite of 2.28 mm was found and of 1 . 1 1 mm in Group OBs. The ranges found in the posttreatment period indicate that in Group OB I the overbite increased in all cases. The range was from 0.9 to 3.5 mm. I n Group OBs however, the values ranged from a decrease in overbite of 0.9 mm to an increase of 2.7 mm.
At the third examination the mean difference was again found to be significant. I n Group OBI, the mean was 4.28 mm and the range 2.2 to 6.6 mm. I n Group OBs, the mean was 2 .06 and the range 0.7 to 3.8 mm. The mean difference between the net changes was also found to be significant. In Group OBI , the mean was - 1 . 1 5, and the range from a decrease of 4.8 mm to an increase of 0.5 mm. I n Group OBs, the mean was 0.58 mm, the largest decrease was 0.8 mm and the largest increase was 1 .6 mm.
I t thus appears that the mean overbite remained significantly larger in Group OBI despite the effects of treatment. The l ine diagram ( F igure 3.2) i l l ustrates the individual changes. I n Group OBI, there are several cases in which the overbite has been shown to be considerably smaller at the th i rd examination than at the fi rst, and there is only one case in which the overbite was larger at the final examination. I n group OBs, there were a number of cases i n which overbite had become larger by the final examination.
3.3.2. Correlations
The correlation coefficients are l isted in Table 3.3. To measure the relationship between overbite at the first and third examination the correlation coefficient was calculated. It was found to be significant. When considered with the mean values and their standard deviations it appears that there is a tendency for the individual initial overbite to be similar to the overbite at the final examination.
The correlation coefficient between treatment and posttreatment changes was calculated and found to be significant. The correlation coefficient, in combination with the means and standard deviations, indicates that generally a decrease of overbite during treatment is associated with a posttreatment increase of overbite. Such posttreatment changes are sl ightly less than the treatment changes. I t appears that usual ly some amount of relapse may be expected to occur.
20
E E
3
� 2 $ :0 � 0 1
Group OBI
38 24 12 0 12 24 38 {monilia) treatment penod posttreatment per1od
E E
8
5
4
3
� 2 $ :0 � 0 1
Group OBs
311 24 12 0 12 24 38 (mon1ho) treatment penod posttreatment oenod
Figure 3.2. Changes in overbite found in Group OBI ( large overbites) und Group OBs (small initial overbites) .
Table 3. 3. Correlation coefficients relating aspects of the overbite examination .
Significance level : n= 30, r;;.Q. 36 3, P<:0.05, r>0.464, P<:0.01 .
Variable Variable n r Sign
overbite 1 overbite 3 30 0.61 3 P<0.01
overbite 2-1 overbite 3-2 30 -0.539 P<0.01 overbite 3 30 -0.405 P<0.05
The relationship of the treatment changes and the overbite at the final examination was calcu lated and the correlation was found to be significant. The value of the correlation coefficient indicates, that although, there is some relationsh ip between
2 1
these two measures it is of a low magnitude and apparently other factors besides the extent of treatment change, are relevant to the depth of the overbite fol lowing treatment.
The possible infl uence of the amount of time elapsed between the second and third examination in relation. to the overbite changes was also evaluated. This correlation coefficient between the posttreatment interval and the posttreatment over· bite change was not found to be significant ( r=0.048, P>0.05).
3.4. Discussion
The findings indicate that in general, overbite although successfu l ly reduced during the treatment period usual ly increased in the posttreatment period. There was a significant relationship between the treatment and posttreatment changes which, when evaluated with the mean values and the standard deviations, indicates a tendency for a large or respectively a smal l overbite decrease during treatment to be associated with a large or respectively a smal l overbite increase in the posttreatment period. I n addition, the significant relationship found between the initial and final overbite confirms that these measures are associated and, when considered with the mean values and their standard deviations, indicates that the in itial and final overbites are quite similar.
It must, however, be emphasized that the findings of the individual changes in overbite, also, indicate that there was considerable variation of the changes in the posttreatment period. I n some cases with large initial overbite (Group OBI) , increases of overbite in the posttreatment period were smal l , resulting in a successful treatment of the overbite. However, in several other cases a large posttreatment
increase was found. I n Group OBs, posttreatment increases were general ly smal l , but, the overbite tended to be larger at the final examination than at the initial examination. The comparison of the two groups shows that overbite was relatively more succesful ly treated in Group OBI , as the decrease in overbite between the initial and final examination was sign ificantly larger in this group.
If all findings are considered, it may be concluded that cases with the largest initial overbite maintained the greatest amount of overbite correction. Furthermore, a large overbite may be reduced during treatment but th is correction is not always maintained after treatment.
The finding that the correlation coefficient between treatment changes and the final overbite is significant, although relatively low, i ndicates that, even if a further reduction of overbite were to occur in the treatment period it would be of l ittle influence on the final results. Moreover, it appears that the magnitude of overbite correction is in itself a factor of l imited importance in determin ing the eventual
22
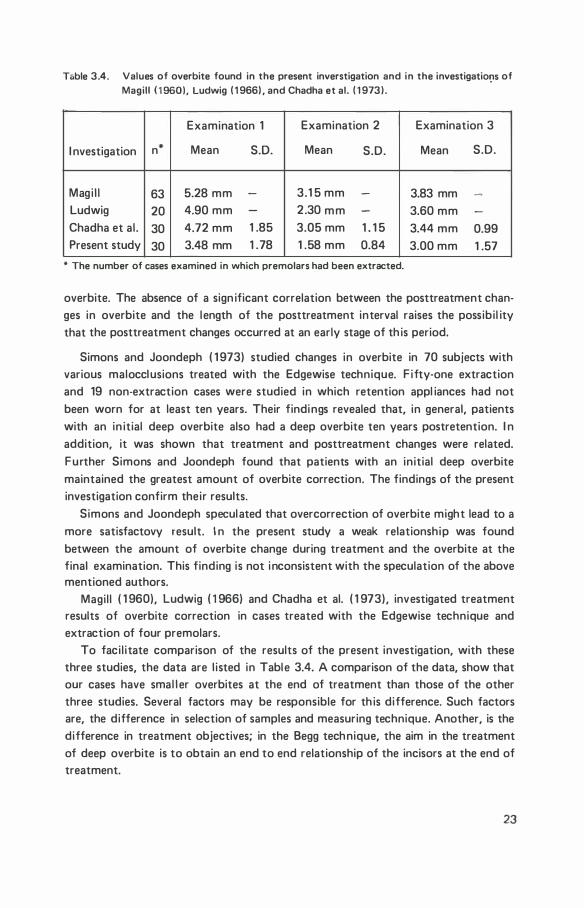
T&ble 3.4. Values of overbite found in the present inverstigation and in the investigatiO!JS of Magill ( 1 960), Ludwig ( 1 966) , and Chadha et al. ( 1 97 3) .
Examination 1 Examination 2 Examination 3
I nvestigation n* Mean S.D. Mean S.D. Mean S.D.
Magi l l 63 5.28 mm - 3.1 5 mm - 3.83 mm -
Ludwig 20 4.90 mm - 2.30 mm - 3.60 mm -
Chadha et al. 30 4.72 mm 1 .85 3.05 mm 1 . 1 5 3.44 mm 0.99 Present study 30 3.48 mm 1 .78 1 .58 mm 0.84 3.00 mm 1 .57
* The number of cases examined in which premolars had been extracted.
overbite. The absence of a sign ificant correlation between the posttreatment changes in overbite and the length of the posttreatment interval raises the possibi l ity that the posttreatment changes occurred at an early stage of th is period.
Simons and Joondeph ( 1 973) studied changes in overbite in 70 subjects with various malocclusions treated with the Edgewise technique. F ifty-one extraction and 19 non-extraction cases were studied in which retention appl iances had not been worn for at least ten years. Their findings revealed that, in general, patients with an in itial deep overbite also had a deep overbite ten years postretention. I n addition, it was shown that treatment and posttreatment changes were related. Further Simons and Joondeph found that patients with an initial deep overbite maintained the greatest amount of overbite correction. The findings of the present investigation confirm their results.
Simons and Joondeph speculated that overcorrection of overbite might lead to a more satisfactovy result. I n the present study a weak relationship was found between the amount of overbite change during treatment and the overbite at the final examination. This finding is not inconsistent with the speculation of the above mentioned authors.
Magil l ( 1 960), Ludwig ( 1 966) and Chadha et al. ( 1 973), investigated treatment results of overbite correction in cases treated with the Edgewise technique and extraction of four premolars.
To faci l itate comparison of the results of the present investigation, with these three studies, the data are l isted in Table 3.4. A comparison of the data, show that our cases have smal l er overbites at the end of treatment than those of the other three studies. Several factors may be responsible for th is difference. Such factors are, the difference in selection of samples and measuring technique. Another, is the difference in treatment objectives; in the Begg technique, the aim in the treatment of deep overbite is to obtain an end to end relationship of the incisors at the end of treatment.
23
The results at the final examination again show differences between the four samples. The value of the mean overbite of the present i nvestigation is the lowest
and the mean overbite in the Magi l l investigation is the highest. It shou ld however be noted, that this order was also found at the first examination and that differences in the results are smal l . This suggests that if the large number of variables in the different investigation are taken into account, there is l ittle difference between the final results of the present investigation and the three studies reviewed. Magi l l ( 1 960) also compared the ten largest and the smal lest overbites in his material . H is results are much l ike those of the present study: small overbites tend to be relatively larger at the final examination and large overbites tend to be large at the final examination, although they decrease by a greater amount.
In conclusion, it may be stated that in the posttreatment period a partial relapse of overbite correction generally occurs. Furthermore, the final results appear to be simi lar, i rrespective of the treatment method used. F inally, the findings of the present investigation, showed that in some cases of deep in itial overbite there was relative stabil ity in the posttreatment period. Whilst, in others the relapse was quite large, although , in all cases except one the final overbite in this group (OBI) was less than the initial overbite.
24
chapter 4
vertical position of mandibular and maxillary incisors
and occlusal plane inclination
4.1 . I ntroduction
There are confl icting reports in the l iterature on changes during treatment in the vertical positions of the mandibular molars and incisors, when a decrease in overbite (bite opening) takes place in the Begg technique. These results can be divided into three main categories: 1 . Begg ( 1 965) , Begg and Kesl ing ( 1 969) and Sims ( 1 97 1 ) found that mandibular
incisor intrusion usual ly occurs and that molar extrusion is minimal. 2. Swain and Ackerman ( 1 969) observed that mandibular incisor eruption is pre
vented during treatment. They contend that overbite correction is due mainly to an increased eruption of mandibular molars. Grano ( 1 97 1 ) , also found that the vertical position of mandibular incisors was stable and that a vertical movement of molars occurred.
3. James ( 1 968), Wil l iams ( 1 968) and Bijlstra ( 1 969) found that overbite correction during treatment was due to mandibular incisor intrusion and mandibular molar extrusion.
The aim of th is part of the study was to investigate the vertical changes in position of mandibular and maxi l lary incisors and incl ination of occlusal plane. Additional ly, to examine these changes in relation to overbite.
The occlusal p lane was evaluated using the Bji:irk structural method of superimposing mandibles. This superimposition technique, contrary to other techniques, enables an evaluation of the changes, with minimal interference from those due to facial growth or treatment.
25
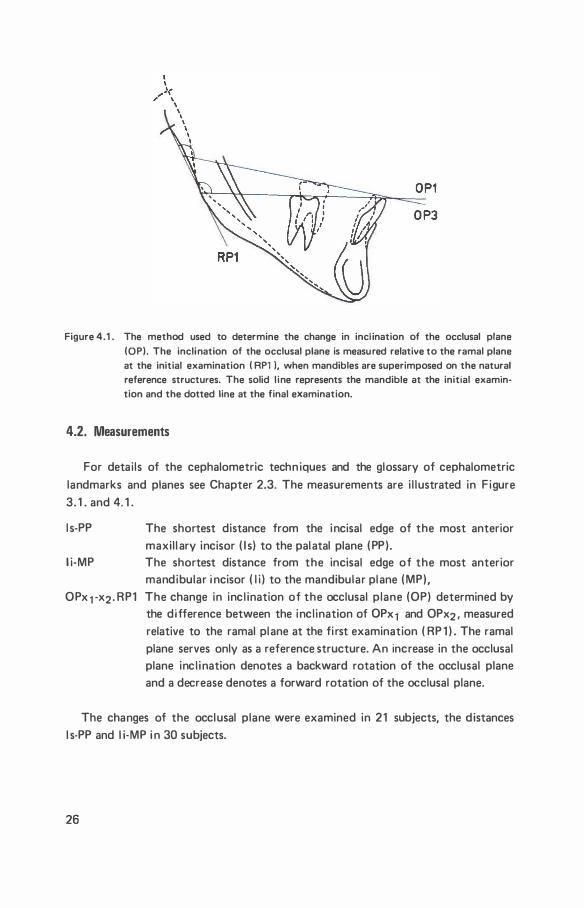
Figure 4.1 . The method used to determine the change in incl ination of the occlusal plane (OP). The inclination of the occlusal plane is measured relative to the ramal plane at the initial examination ( RP1 l, when mandibles are superimposed on the natural reference structures. The solid l ine represents the mandible at the initial examintion and the dotted line at the final examination.
4.2. nneasure�ents
For detai ls of the cephalometric techn iques and the glossary of cephalometric landmarks and planes see Chapter 2.3. The measurements are i l lustrated in F igure 3. 1 . and 4. 1 .
l s-PP
l i-MP
The shortest distance from the incisal edge of the most anterior maxil l ary incisor ( I s) to the palatal plane ( PP) . The shortest distance from the incisal edge of the most anterior mandibular i ncisor ( l i ) to the mandibular plane ( MP),
OPx 1 -x2 . RP1 The change in inc l ination of the occlusal plane (OP) determined by the difference between the incl ination of 0Px1 and OPx2 . measured relative to the ramal plane at the fi rst examination ( RP 1 ) . The ramal plane serves only as a reference structure. An increase in the occlusal plane inc l ination denotes a backward rotation of the occlusal plane and a decrease denotes a forward rotation of the occlusal plane.
The changes of the occlusal plane were examined in 21 subjects, the distances l s-PP and l i-MP i n 30 subjects.
26
Table 4.1 . mean values and distribution of individual values of treatment, posttreatment, and net changes of the vertical positions of the incisors and the occlusal plane. Significance level : n= 30, t;;>2.750, P<0.01 , n=21 , t;;>2.086, P<0.05; t;;>2.845, P<0 .0 1 .
Variable n Mean S.D. Range t Sign
l s-PP 2-1 30 1 .50 mm 1 .62 -1 .3 4.7 5.081 P<0.01
ls-PP 3-2 30 1 .50 mm 1 .05 -0.4 3.5 7.882 P<0.01
l s-PP 3-1 30 3.0 1 mm 1 .53 0.0 6. 1 1 0.735 P<0.01
l i-MP 2-1 30 -1 .02 mm 1 .97 -5.9 2.4 2.836 P<0.01
l i-MP 3-2 30 2.38 mm 1 .3 1 0.3 5.1 9.941 P<0.01
l i-MP 3- 1 30 1 .36 mm 2.34 -2.7 5.9 3. 1 73 P<0.01
OP 2-1 .RPI 21 4.48° 3.98 -4.5 9.8 5.270 P<O.Ol
OP 3-2. RPI 2 1 -1 .80° 3. 1 4 -8.8 5.2 2.686 P<0.05
OP 3-1 . RPI 21 2.68° 3.34 -6.4 9.4 3.774 P<0.01
4.3. Results
4.3. 1 . Mean values and distribution of indiv idual values
The statistical data on the measurements made are shown in Table 4. 1 .
The distance from the maxillary incisal edge to the palatal plane. This di�tance was found to increase significantly in the treatment and posttreatment periods. The mean increase in the treatment period was 1 .50 mm, standard deviation 1 .62 mm, the individual values ranged from a decrease of 1 .3 mm to an increase of 4.7 mm. I n the posttreatment period the mean increase was 1 .50 mm with a standard deviation of 1 .05 mm, the range was from ·0.4 mm to 3.5 mm. A mean net increase between the first and third examination of 3.01 mm, standard deviation 1 .53 mm was found to occur, and the range was from 0.0 to 6. 1 m m.
The distance from the mandibular incisal edge to the mandibular plane. This variable differs from that of the maxil lary incisor in that during treatment a significant mean decrease of 1 .02 mm with a standard deviation of 1 .97 mm occurred. The largest decrease was 5.9 mm and the largest increase was 2.4 m m. I n the posttreatment period a mean increase of 2.38 mm with a standard deviation of 1 .3 1 mm was found t o have taken place. The range was from 0.3 t o 5 . 1 mm. The mean net increase was 1 .36 mm with a standard deviation of 2.34 mm and a range from -2.7 mm to 5.9 mm.
27
Occlusal plane. A significant mean backward rotation of the occlusal plane of 4.48°, standard deviation 3.98° and a range of -4.5° to 9.8° occurred during treatment. A sl ight mean forward rotation in the posttreatment period of 1 .80° with a standard deviation of 3. 1 4° and range from -8.8° to 5.2° was found. It was found that a significant mean backward rotation of the occlusal plane of 2.68° , standard deviation 3.34° and a range of -6.4° to 9.4°, had occurred between the fi rst and th ird examinations.
4.3 .2. R elationship between changes of occlusal plane incl ination and vertical changes in position of mandibular molars and incisors.
The occlusal plane was defined as the l ine drawn through the incisal edge of the most anterior mandibular incisor and the disto-buccal cusp of the mandibular first molar. It fol lows that a change in occlusal plane incl ination as measured by the structural method of superimposition may be due to a change in : a. the position of the fi rst molar; b. the position of the mandibular incisal edge; c. a combination of both .
To investigate the site at which the changes of occlusal plane incl ination take place in the individual subjects the coordinates representing the superimposed mand ibles were plotted and the graphical representation of each subject was examined, to determine the relative vertical changes in incisors and molars. These vertical changes were evaluated with reference to the occlusal plane at the fi rst examination. A table (Table 4.2.) was set out showing the individual vertical changes of the teeth and the findings were ordered according to the corresponding change in occlusal plane. The change in overbite for each individual was also included. An arrow indicates an occlusal positioning (t ) or intrusion ( .j. ) of an incisor or molar. A small arrow ( t ) indicates that the change in the position of incisor or molar is relatively less than the corresponding change in the position of mol ar or incisor.
Changes during the treatment period. I n 18 cases a backward rotation of the
occlusal plane took place and in three cases a forward rotation. Rotation of the occlusal plane depends on the relative changes in position of incisors and molars. Therefore an interpretation of the observed changes requires a further analysis of vertical movements of incisors and molars. Three different responses are possibl e : 1 . intrusion; 2 . no positional change; 3 . occl usal positioning. The second possibi l ity may be interpreted as prevention of eruption. Occlusal positioning may be due to eruption which normal ly occurs or to an extrusion which is due to effects of treatment or a combination of both. Furthermore occlusal positioning as wel l as intrusion may vary in amount.
Al l three types of response were found for the mandibular incisors: five cases showed various amounts of occlusal positioning; eleven cases showed various
28
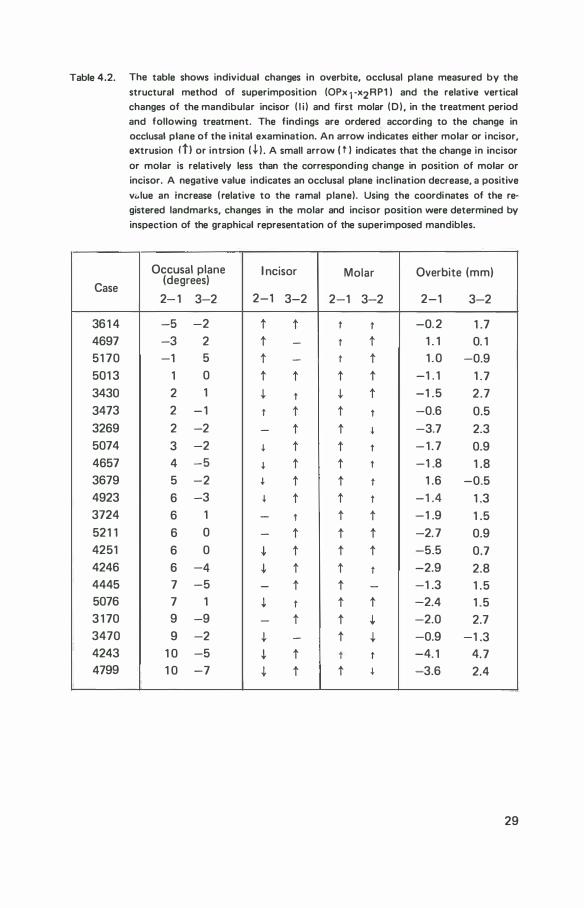
Table 4.2. The table shows individual changes in overbite, occlusal plane measured by the
structural method of superimposition (0Px 1 -x2RP1 ) and the relative vertical changes of the mandibular incisor ( l i ) and first molar (D) , in the treatment period and following treatment. The findings are ordered according to the change in occlusal plane of the inital examination. An arrow indicates either molar or incisor, extrusion ltl or intrsion ( .J, ) . A small arrow ( t ) indicates that the change in incisor
or molar is relatively less than the corresponding change in position of molar or incisor. A negative value indicates an occlusal plane incl ination decrease, a positive
v .. lue an increase ( relative to the ramal plane). Using the coordinates of the registered landmarks, changes in the molar and incisor position were determined by
inspection of the graphical representation of the superimposed mandibles.
Occusal plane I ncisor Molar Overbite (mm) Case
(degrees)
2- 1 3-2 2-1 3-2 2-1 3-2 2-1 3-2
361 4 -5 -2 t t t t -0. 2 1 .7 4697 -3 2 t - t t 1 . 1 0. 1 51 70 -1 5 t - t t 1 . 0 -0.9 501 3 1 0 t t t t -1 . 1 1 .7 3430 2 1 .j. t .j. t -1 .5 2.7 3473 2 - 1 t t t t -0.6 0.5 3269 2 -2 - t t � -3.7 2.3 5074 3 -2 � t t t - 1 . 7 0.9 4657 4 -5 � t t t -1 .8 1 .8 3679 5 -2 � t t t 1 .6 -0.5 4923 6 -3 � t t t -1 .4 1 .3 3724 6 1 - t t t -1 .9 1 .5 521 1 6 0 - t t t -2.7 0.9 4251 6 0 .J, t t t -5.5 0.7 4246 6 -4 .J, t t t -2.9 2.8 4445 7 -5 - t t - -1 .3 1 .5 5076 7 1 .j. t t t -2.4 1 .5 3 1 70 9 -9 - t t .J, -2.0 2.7 3470 9 -2 .J, - t .J, -0.9 -1 .3 4243 1 0 -5 .J, t t t -4. 1 4.7 4799 1 0 -7 .J, t t � -3.6 2.4
29
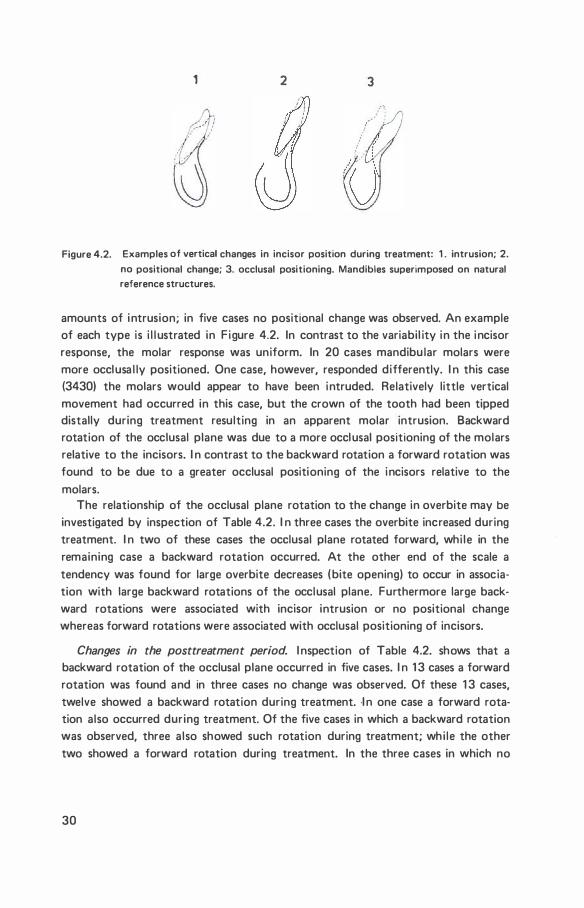
1 2 3
Figure 4.2. Examples of vertical changes in incisor position during treatment: 1 . intrusion; 2.
no positional change; 3. occlusal positioning. Mandibles superimposed on natural reference structures.
amounts of intrusion; in five cases no positional change was observed. An example of each type is i l l ustrated in F igure 4.2. In contrast to the variabil ity in the incisor response, the molar response was uniform. In 20 cases mandibu lar molars were more occlusa l ly positioned. One case, however, responded differently. I n this case (3430) the molars would appear to have been intruded. Relatively little vertical movement had occurred in this case, but the crown of the tooth had been tipped distally during treatment resulting in an apparent molar intrusion. Backward rotation of the occlusal plane was due to a more occlusal positioning of the molars relative to the incisors. I n contrast to the backward rotation a forward rotation was found to be due to a greater occlusal positioning of the incisors relative to the molars.
The relationship of the occlusal plane rotation to the change in overbite may be investigated by inspection of Table 4.2. I n three cases the overbite increased during treatment. I n two of these cases the occlusal plane rotated forward, whi le in the remaining case a backward rotation occurred. At the other end of the scale a tendency was found for large overbite decreases (bite opening) to occur in association with large backward rotations of the occlusal plane. Furthermore large backward rotations were associated with incisor intrusion or no positional change whereas forward rotations were associated with occlusal positioning of incisors.
Changes in the posttreatment period. I nspection of Table 4.2. shows that a backward rotation of the occlusal plane occurred in five cases. I n 1 3 cases a forward rotation was found and in three cases no change was observed. Of these 1 3 cases, twelve showed a backward rotation during treatment. ·I n one case a forward rotation also occurred during treatment. Of the five cases in which a backward rotation was observed, three also showed such rotation during treatment; wh i le the other two showed a forward rotation during treatment. In the three cases in which no
30
change was observed in the posttreatment period a backward rotation was found during treatment.
I rrespective of the treatment response of the mandibular incisors, an eruption took place in the posttreatment period, with the exception of three cases in which no change was noted. Of these three cases, two had shown an occlusal positioning during treatment and in the remaining case an intrusion had occurred. I n four cases a molar intrusion was observed in the posttreatment period, in one case no change was found and in 16 cases eruption was found to take place. I n the cases in which intrusion or no change was found an extrusion would appear to have occurred during treatment. This apparent intrusion of the molars may be termed relapse.
In the five cases in which backward rotation of the occlusal plane was observed, the molars were relatively more occlusal ly positioned than the incisors. I n the 1 3 cases with forward rotation the incisors were more occlusal ly positioned than the molars and in four cases molars were found to have been intruded in the posttreatment period. I t is l ikely that a relapse of the occlusal plane rotation occurred in a l l those cases in which the posttreatment changes were opposite to those which occurred during treatment.
The relationship between changes of overbite to the changes in occlusal plane incl ination in the posttreatment period is not ful ly clarified by an inspection of Table 4.2. A large i ncrease in overbite occurred in cases in which both small and large rotations of the occlusal plane were observed. However, a predominance of large overbite increases were associated with a forward rotation of the occl usal plane. Final ly, no obvious relationship was noticeable between the positional changes in molars, incisors and the overbite.
4.3.3. Correlations
To evaluate the relationship between changes in overbite to changes in the occlusal plane, the distance from the incisal edge of the most anterior mandibular incisor to the mandibular p lane and the distance from the incisal edge of the most anterior maxil lary incisor to the palatal plane, a number of correlation coefficients were calculated (Table 4.3.).
Changes during the treatment period. The correlation coefficient between the changes of overbite and the distance from the mandibular incisal edge to the mandibular plane was found to be significant, as was that between changes of overbite and occlusal plane inclination. The significance of the correlation coefficients confirms the i mpression gained by inspection of Table 4.2. The correlation between the changes in overbite and the distance from the maxil lary incisor edge to the palatal plane was not significant.
3 1
Table 4.3. Correlation coefficients relating overbite changes during and following treatment to occlusal plane and incisor changes and their interrelationships. Significance levels: n=30, r;;;.Q.362, p.;;;Q.05; r;;;-0.463, P.;;;0.01 . n=30, r:>0.433,
P:>0.05; r;o.0.549, p.;;Q.01 .
Variable Variable n r Sign
overbite 2-1 l s-PP 2-1 30 0.268 NS
l i -M P 2-1 30 0.559 P<0.01 OP 2-1 . RP1 21 -0.514 P<0.05
overbite 3-2 l s-PP 3-2 30 0.293 NS l i-MP 3-2 30 0.309 NS Op 3-2. RP1 21 -0.51 7 P<0.05
overbite 3-2 l s-PP 2-1 30 -0.242 NS l i -MP 2-1 30 -0.234 NS OP 2-1 . RP1 21 -0.241 NS
OP 2-1 . R P1 l s-PP 2-1 21 0.294 NS l i-M P 2-1 21 -0.561 P<0.01
OP 3-2.RP1 l s-PP 3-2 21 -0.047 NS l s-MP 3-2 21 -0.325 NS
l s-PP 2- 1 l s-PP 3-2 30 -0.407 P<0.05 l i-MP 2-1 l i-MP 3-2 30 -0.240 NS
OP 2-1 . RP1 OP 3-2. RP1 21 -0.581 P<0.01
Changes in the posttreatment period. Correlation coefficients relating to posttreatment changes in overbite were evaluated. The posttreatment changes in overbite were not found to be associated with posttreatment changes in the distance from the maxi l lary incisal edge to the palatal plane or the mandibular incisal edge to the mandibular plane.
The correlation coefficient between posttreatment changes in overbite and occlusal plane inclination was found to be significant. This correlation coefficient, when evaluated with the mean values and standard deviations, indicates that a large, or respectively a small increase in overbite tended to be associated with a forward rotation or respectively a backward rotation of the cx;:clusal plane. The correlation coefficients between the treatment changes of the occlusal plane incl ination, incisor positions and the posttreatment changes in overbite were calculated. They were not found to be sign ificant.
F inal ly, the correlation coefficient between the treatment and posttreatment
32
changes of occlusal p lane was calculated. The correlation was found to be significant and confirms the impression gained by the inspection of Table 4.2. The corre· lation coefficient between treatment and posttreatment changes of the distance from the maxil lary incisor edge to the palatal plane was significant. When evaluated with the mean values and standard deviations, it indicates that there was a tendency for large or respectively smal l treatment increases to be associated with smal l , or respectively large posttreatment increases. The correlation between treatment and posttreatment changes of mandibu lar incisor postition was not significant.
4.4. Discussion
A distinction between the effects of treatment and normal growth changes is difficult to make when examining occlusal positioning of incisors or molars without the use of a relevant control group. The investigators referred to in the introduction to this chapter were general ly unable to distinguish between the effects of treatment and normal growth. Furthermore, l ittle attention was paid to the individual response. Using meta l l ic implants in the mandible as reference structures to superimpose mandibles of annual lateral radiographs of 21 untreated subjects, Bjork and Skieller ( 1 972) studied mandibular growth and its relation to occlusal development. The longitudinal study covered a six year adolescent period. I n all cases studied, the eruption of incisors and molars was found to occur. In cases with forward mandibular rotation, the molar eruption was greater than that of incisors, resulting in a backward occlusal plane rotation. I n cases with a backward mandibular rotation, incisor eruption was greater than molar eruption.
Mandibular incisors. I n the present study considerable individual variability in incisor response during treatment was found. A significant i ntrusion of i ncisors in the mandibular arch during treatment has been shown to take place, an intrusion which was found to be related to the decrease of overbite. However, it has also been shown that eruption may be prevented and that in a number of cases mandibular incisor eruption during treatment occurred when overbite changes were smal l . Thus it may be stated that intrusion, the prevention of eruption or eruption of mandibular incisors may occur during treatment, the nature of the change being related to the change in overbite.
I n the posttreatment period an occlusal positioning of the mandibular incisors or no positional change was found. The occlusal positioning may be either due to eruption or to an extrusion which is possibly caused by the connective tissue response to treatment. The occlusal positioning showed no apparent relationship to overbite increase (deepening of the overbite). Also no correlation was found between the treatment and posttreatment changes of the distance of the incisal
33
edge of the mandibular incisor to the mandibular plane, and although it indicates that there is no relapse tendency of the intruded mandibu lar incisors, vertical growth in the posttreatment period may obscure an incisor relapse.
Mandibular Molars. The findings on the molar changes are more difficult to interpret since, wh i le it is clear that molars were general ly more occlusal ly positio· ned during treatment, the measurement does not distinguish between extrusion, or the effects of treatment and eruption, or normal growth.
I n the present study molars were general ly more occlusal ly positioned both during and after treatment, an apparent normal occurrence. However, in the posttreatment period molar intrusion was ascertained in four cases. I n these cases in which molar intrusion was found it is l i kely that they were extruded during treat· ment. It may be concluded that relapse had occurred in these cases. I n addition an intrusion may have been ascertained in other cases, had the final examination taken place at an earl ier stage, as growth of the alveolar process subsequent to an intrusion may mask the initial intrusion. In the remaining cases in which no intru· sion was found in the posttreatment period, it is l ikely that eruption occurred during treatment as part of the normal developmental process. There was no obvious relationship between molar changes and changes in overbite during or fol lowing treatment.
Occlusal plane. I n relation to incisors, molars were more occlusal ly positioned in 1 8 cases during treatment. This resulted in a backward rotation of the occlusal plane. Of these 18 cases, twelve cases had a forward rotation in the posttreatment period. This is apparently a relapse of occlusal plane rotation. The relapse was due to a greater occlusal positioning of the incisors relative to the molars. It resulted from an eruption or no positional change of the mandibular incisors in combination with a relatively smal ler eruption of the molars or their intrusion. In the remaining six cases in which a backward rotation occurred during treatment no rotation or a sl ight backward rotation was observed after treatment. It appears that in these cases the amollnt of rotation during treatment was desirable, in that it was maintained in the posttreatment period and it seems that forward rotation would normal ly take place in these cases. Of the three cases in which a forward rotation occurred during treatment, two cases had a forward rotation in the posttreatment period. In one case the di rection of rotation was the same in the posttreatment period.
A relationship was found between the occlusal plane rotation and overbite changes during treatment. A large overbite decrease was associated with a large backward rotation of the occlusal plane. This finding indicates a graduated response of the occlusal plane during treatment, dependent on the size of the overbite. Taking into consideration that occlusal plane rotation is due to a combination of factors, it may be concluded that molar and incisor changes contribute to the
34
changes in overbite during treatment, the extent of their response being associated with the extent of the overbite correction.
In contrast, a forward rotation following treatment was related to an overbite decrease. It appears that it is a combination of molar and incisor changes which were related to an overbite relapse in the posttreatment period. The significance which may be attributed to these factors is not great, as, the correlation coefficient expressing the relationship of posttreatment overbite changes and occlusal plane rotation, although significant, is relatively low. I t therefore appears that other factors besides those which cause changes in the occlusal plane also influence the overbite.
Our findings are not in agreement with the findings of other recent studies.
Swain and Ackerman ( 1 969) reported that relapse of overbite correction in Begg treated cases was caused by additional eruption of mandibular incisors. They also found that mandibu lar molars do not intrude after treatment but continue to erupt and that incisor eruption was greater than that of the molars. Schudy ( 1 973) and Simons and Joondeph ( 1973) , observed incisor intrusion to be related to posttreat· ment incisor eruption and a concomitant overbite relapse. The present findings do not lead to the conclusion that relapse of overbite is due to additonal eruption of mandibular incisors; rather that a greater eruption of mandibu lar incisors relative to an intrusion or eruption of the mandibular molars is a factor in overbite relapse.
flllaxillary incisors. I ntrusion of maxil lary incisors was general ly not found to occur during treatment. I n the present investigation there was no apparent relationship between the changes in overbite and vertical changes in position of the max illary incisors. This lead to the conclusion that treatment changes in overbite are mainly due to changes in the mandibular dental arch. A number of factors may influence the vertical changes in the position of the maxi l lary central incisors. I n subjects with protruding incisors, the action of reducing thi s protrusion wou ld tend to cause an increase in the vertical dimension. I n addition the possibil ity that Class I I intermaxi l lary elastics or aux i l l iary root torquing arch wires may cause extrusion of maxi l l ary incisors should be considered. An indication that th is may have occurred is to be found in the inverse relationship between treatment and posttreatment changes of the distance from the maxil lary incisal edge to palatal plane. These findings may indicate that an extrusion of incisors during treatment is fol lowed by an intrusion of incisors after treatment. That the intrusion is not evident may be due to an increase in height of the alveolar process being greater than the intrusion.
It is apparent that although overbite was frequently found to increase after treatment the factors which contribute to these changes are not a l l evident. Other dental factors, changes in facial dimensions or actual rotations of the mandible may cause a posttreatment increase. It is l ikely that factors which cause the initial
35
overbite are the same factors which contribute to an increase in overbite fol lowing treatment. I n subsequent chapters other factors which may be related to the over· bite wil l be investigated.
In conclusion it may be stated that during treatment with the Begg technique, the vertical changes in the position of the mandibular incisors were modified depending on the extent of the overbite changes. An intrusion of mandibular incisors was related to a large overbite decrease, wh i le eruption of the mandibu lar incisors occurred when overbite changes were smal l . The mandibular first molars were more occlusal ly positioned during treatment and although it is difficult to make a distinction between extrusion and eruption it appears that in some cases the term extrusion is applicable. Thus, our findings indicate that, a variety of different responses occurred in the treatment period. Probably due to individual ity of the malocclusions and the applicati'on of the technique. Mandibular incisor eruption in the posttreatment period was found to be relatively greater than that of the molars and in some cases molar intrusion occurred. This combination appears to be a factor in the cause of overbite relapse.
36
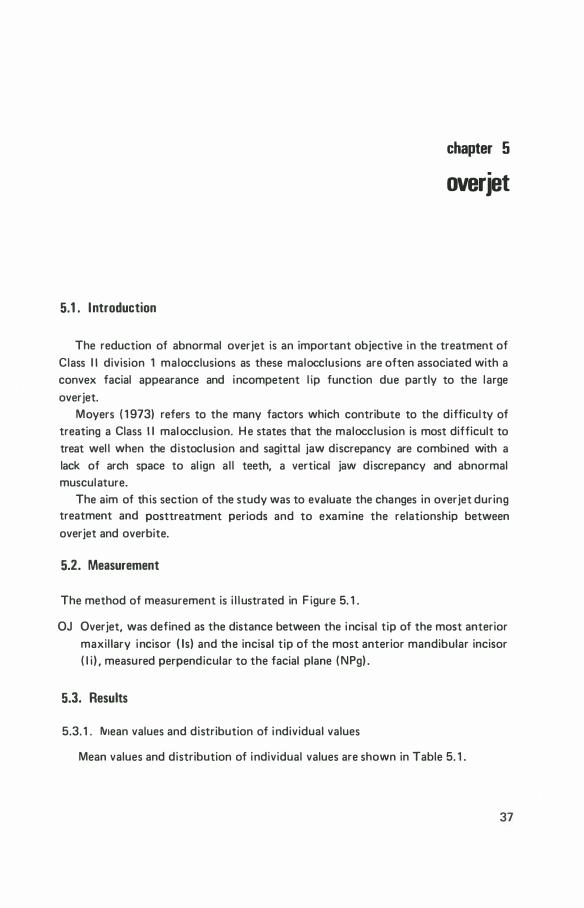
chapter 5
overjet
5.1 . Introduction
The reduction of abnormal overjet is an important objective in the treatment of Class I I division 1 malocclusions as these malocclusions are often associated with a convex facial appearance and incompetent l ip function due partly to the large overjet.
Moyers ( 1 973) refers to the many factors which contribute to the difficulty of treating a Class I I malocclusion. H e states that the malocclusion is most difficult to treat wel l when the distoclusion and sagittal jaw discrepancy are combined with a lack of arch space to al ign al l teeth, a vertical jaw discrepancy and abnormal musculature.
The aim of th is section of the study was to evaluate the changes in overjet during treatment and posttreatment periods and to examine the relationship between overjet and overbite.
5.2. nneasurernent
The method of measurement is i l l ustrated in F igure 5. 1 .
OJ Overjet, was defined as the distance between the incisal tip of the most anterior maxil lary incisor ( Is) and the incisal tip of the most anterior mandibular incisor ( l i ) , measured perpendicular to the facial plane ( NPg) .
5.3. Results
5.3. 1 . rv1ean values and distribution of individual values
Mean values and distribution of individual values are shown in Table 5. 1 .
37
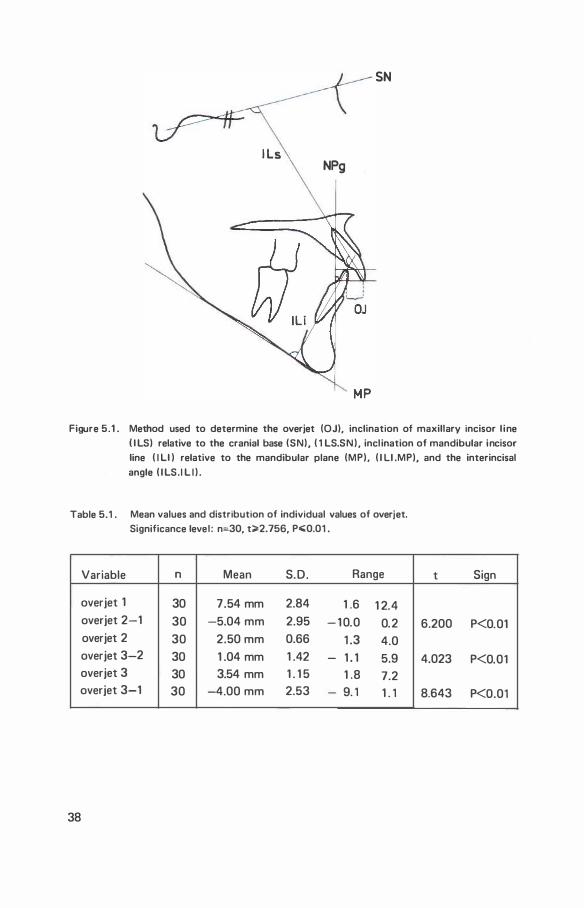
SN
I Ls NPg
Figure 5.1 . Method used to determine the overjet (OJ), inclination of maxillary incisor l ine I l LS) relative to the cranial base (SN), ( 1 LS.SN ) , incl ination of mandibular incisor line ( I ll ) relative to the mandibular plane (MP), ( I LI .MP), and the interincisal angle ( I LS. I L I ) .
Table 5.1 . Mean values and distribution of individual values of overjet. Significance level : n:30, t;;;.2.756, P.;0.01 .
Variable n Mean S.D . Range
overjet 1 30 7.54 mm 2.84 1 .6 1 2.4 overjet 2-1 30 -5.04 mm 2.95 - 1 0.0 0.2 overjet 2 30 2.50 mm 0.66 1 .3 4.0 overjet 3-2 30 1 .04 mm 1 .42 - 1 . 1 5.9 overjet 3 30 3.54 mm 1 . 1 5 1 .8 7.2 overjet 3-1 30 -4.00 mm 2.53 - 9. 1 1 . 1
38
t Sign
6.200 P<0.01
4.023 P<O.Ol
8.643 P<0.01
The initial mean overjet for the sample was 7 .54 mm, with a standard deviation of 2.84 mm. The smal lest indiv idual overjet was 1 .6 mm and the largest was 1 2.4 mm. A significant mean decrease in overjet of 5.04 mm with a standard deviation of 2.95 mm occurred during the treatment period. The largest decrease was 1 0. 1 mm and the largest increase 0.2 mm.
At the end of treatment considerable uniformity for the values of overjet was found (Mean 2.50 mm standard deviation 0.66 mm and a range of 1 .3 to 4.0 mm) . I n the posttreatment period a significant mean increase of 1 .04 mm, standard deviation of 1 .42 mm and a range of · 1 . 1 mm to 5.9 mm was found.
At the final examination, the mean overjet was 3.54 mm, and the standard deviation was 1 . 1 5 mm. The smal lest overjet was 1 .8 mm. and the largest 7.2 mm. A significant mean decrease in overjet between initial and final examinations of 4.00 mm, standard deviation 2.53 took place. The largest decrease was 9.1 mm. and the largest increase was 1 . 1 mm.
To compare the treatment of smal l and large overjets, the sample was subdivided on the basis of the overjet at the initial examination. Two separate groups, Group OJI and G roup OJs were formed. Group OJI contained the ten largest overjets. They were all Class I I div ision 1 malocclusions. G roup OJs contained the ten smal lest overjets. They were Class I or borderl i ne cases. Table 5.2 shows the mean values and distribution of individual values. The individual changes are i l l ustrated in Figure 5.2.
The treatment of overjet would appear to be equal ly effective in both groups as the mean difference between the two groups at the end of treatment was not significant.
Although the mean changes of overjet in the posttreatment period were found to differ significantly, the mean difference was smal l . The individual variabi l ity of posttreatment changes was larger in Group OJ I. In this group the mean value was 1 . 77 mm and standard deviation 2 .04 mm. An increase of 5.9 mm. was observed in one case, wh i le in another a decrease of 1 . 1 mm occurred. I n Group OJs the mean was 0.37 mm and standard deviation 0. 78 mm. The changes ranged from a decrease of 0.8 mm to an increase of 1 .5 mm.
At the final examination the mean difference between the two groups was sign ificant. The mean overjet of Group OJI was 4.29 mm standard deviation 1 .45 mm and the range was from 2 .3 mm to 7.3 mm. I n Group OJs, the mean value was 3.06 mm, standard deviation 0.78 mm and range from 2 . 1 to 4.5 mm. The mean difference of the net changes was significant. In group OJ I, the mean decrease was 6.41 mm and the standard deviation 1 .54 mm. The largest decrease was 9 . 1 mm and the smal lest 4.0 mm. I n group OJs, the mean decrease was 1 .40 mm and standard deviation 1 .65 mm. The largest decrease was 3.4 mm and the largest increase 1 . 1 mm.
39
Group OJ I Group OJs
13 13
12 12
11 11
10 10
9 9
8 8
8 8
5 5
E E E 4 E 4
Qi 3 .. � 3 ·;:::-Q) Q) > > 0 2 0 2
38 24 12 0 12 24 36(months) 38 12 12 0 12 24 38 tmonthsj
treatment penod posttreatment penod treatment penod posttreatment penod
Figure 5.2. Changes in overjet occuring during the treatment and posttreatment periods in
Group OJI (largest initial overjets) and Group OJs (smallest i nitial overjets) .
Table 5.2. Values of overjet for the two groups contai ning the initial ten largest overjets ( Groups OJ I, Class 1 1 , division 1 I and the initial ten smallest overjets (Group OJs,
Class 1 ) . Significance levels: n=20, t>2.1 01 ; P.;;Q.05; t�2.878, P.;;Q.01 .
Group OJI Group OJs Largest overjets, n=1 0 Smallest overjets, n=1 0
Variable Mean S.D. Range Mean S.D. Range t Sign
overjet 1 1 0.70 mm 1 .06 9.1 1 2.4 4.46 mm 1 .50 1 .6 6.1 1 0.8 1 4 P<0.01 overjet 2-1 -8. 1 9 mm 1 .54 - 1 0. 1 -5.4 -1 .78 mm 1 .41 -4.1 0.3 9.653 P<0.01 overjet 2 2.51 mm 0.84 1 .6 4.0 2.68 mm 0.43 1 .9 3.2 0.562 NS overjet 3·2 1 .77 mm 2.04 - 1 . 1 5.9 0.37 mm 0.81 -0.8 1 .5 2.031 NS overjet 3 4.29 mm 1 .45 2.3 7.3 3.06 mm 0.78 2.1 4.5 2.358 P<0.05 overjet 3-1 -6.41 mm 1 .54 - 9.1 -4.0 - 1 .40 mm 1 .65 -3.4 1 .1 6.976 P<0.01
40
Table 5.3. Correlation coefficients calculated between values of overjet. Significance level : n=30, r.;;Q.363, P.;;0.05; r;;.Q.464, P.;;Q.01 .
Variable Variable n r
overjet 1 overjet 3 30 0.453
overjet 2-1 overjet 3-2 30 -0.51 7 overjet 3 30 -0.468
overjet 3-2 posttreatment 30 0. 1 23
interval
Sign
P<0.05
P<0.01 P<0.01
NS
An inspection of F igu re 5.2 shows that in Group OJI (Class I I division 1 ) , a total relapse was in no instance evident. Furthermore, in this group, the considerable variabi l ity of changes during the posttreatment period and the large net decrease in individual cases is notable.
5.3.2. Correlations
To determine the relationships between the values of overjet, a number of correlation coefficients were calculated. They are shown in Table 5.3.
The correlation coefficient between initial and f inal overjet was sign ificant. When evaluated with the m ean values and standard deviations, it appears that a large or respectively a smal l overjet at the initial examination tends to have a large, respectively smal l overjet at the final examination. It is however clear that the final magnitude of the overjet is considerably less than at the initial examination.
The correlation coefficient between changes in overjet during the treatment and posttreatment periods was significant. When considered with the mean values and standard deviations, it appears that there was a tendency for a large or respectively a small decrease during the treatment period to be associated with a large or respectively a smal l increase in the posttreatment period. The posttreatment increases, however, were generally smal l .
Changes in overjet during the treatment period and the final overjet were found to be significantly correlated. When the correlation coefficient is appraised with the means and standard deviations, it seems that a large or respectively a smal l decrease during the treatment period tends to be associated with a large or respectively a small overjet at the final examination.
No significant relationship between the changes during the posttreatment period and its duration was found.
4 1
Table 5.4. Correlation coefficients calculated between overbite and overjet. Significance levels; n=30, r;;a.0.363, p.;;Q.05; r;;a.0.464, p.;;Q.01 .
Variable Variable n r
overjet 1 overbite 1 30 0.378 overjet 2- 1 overbite 2-1 30 0. 508 overjet 3-2 overbite 3-2 30 0.369 overjet 3 overbite 3 30 0.225
5.3.3. Relationship of overjet to overbite
Sign
P<0.05 P<0.01 P<0.05 NS
The correlation coefficients relating overjet to overbite are shown in Table 5.4.
The relationship between initial overbite and overjet was calculated by means of the correlation coefficient. It was found to be significant. When evaluated with the mean values and standard deviations, this indicates that a large or small overjet was associated with a large or smal l overbite, respectively.
The correlation coefficient between changes of overbite and overjet during treatment was significant. The correlation coefficient, when considered with the respective mean changes and standard deviations, indicates that a large decreasE in overjet tends to be associated with a large decrease i n overbite. A simi lar relationship exists for smal l changes.
The correlation coefficient between changes of overbite and overjet in the posttreatment period was significant. When evaluated with the means and standard deviations, th is denotes a tendency for an increase in overbite to occur with an i ncrease in overjet in the posttreatment period.
F inally, the correlation coefficient between the final values of overbite and overjet was evaluated. The correlation coefficient was not found to be significant. The scatter diagram ( Figure 5.3) i l l ustrates the relationship of the overbite to overjet for ind ividual patients at the final examination. The points are widely spread and no particu lar relationship is evident. However, if the points denoting the large overjets are inspected it can be seen that large overjets may occur with smal l or large overbites. Likewise a large overbite may occur in combination with a smal l overjet or a large overjet. Therefore, there are three combinations of the incisal relationship at the final examination in which large relapse takes place: 1 . a large overjet and a small overbite: 2. a large overjet and a large overbite: 3. a smal l overjet and a large overbite.
42
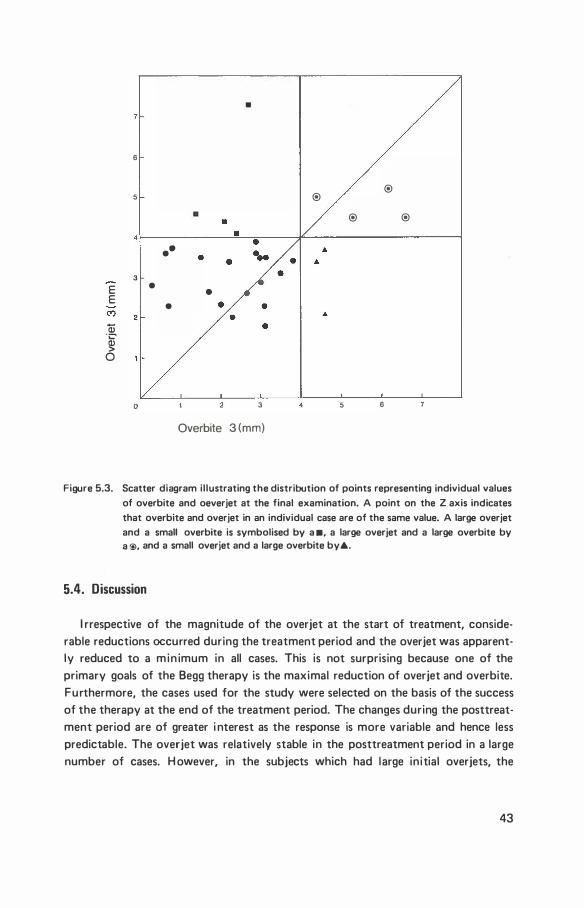
•
6
® 5 ®
® ®
••
3
E •
E •
C') 2 Qj 'C' QJ > 0
0 3 4 5 6
Overbite 3 (mm)
Figure 5.3. Scatter diagram illustrating the distribution of points representing individual values of overbite and oeverjet at the final examination. A point on the Z axis indicates
that overbite and overjet in an individual case are of the same value. A large overjet and a small overbite is symbolised by a •. a large overjet and a large overbite by a @, and a small overjet and a large overbite by&.
5.4. Discussion
I rrespective of the magnitude of the overjet at the start of treatment, considerable reductions occurred during the treatment period and the overjet was apparently reduced to a min imum in all cases. This is not surprising because one of the primary goals of the Begg therapy is the maximal reduction of overjet and overbite. Furthermore, the cases used for the study were selected on the basis of the success of the therapy at the end of the treatment period. The changes during the posttreatment period are of greater i nterest as the response is more variable and hence less predictable. The overjet was relatively stable in the posttreatment period in a large number of cases. H owever, in the subjects which had large initial overjets, the
43
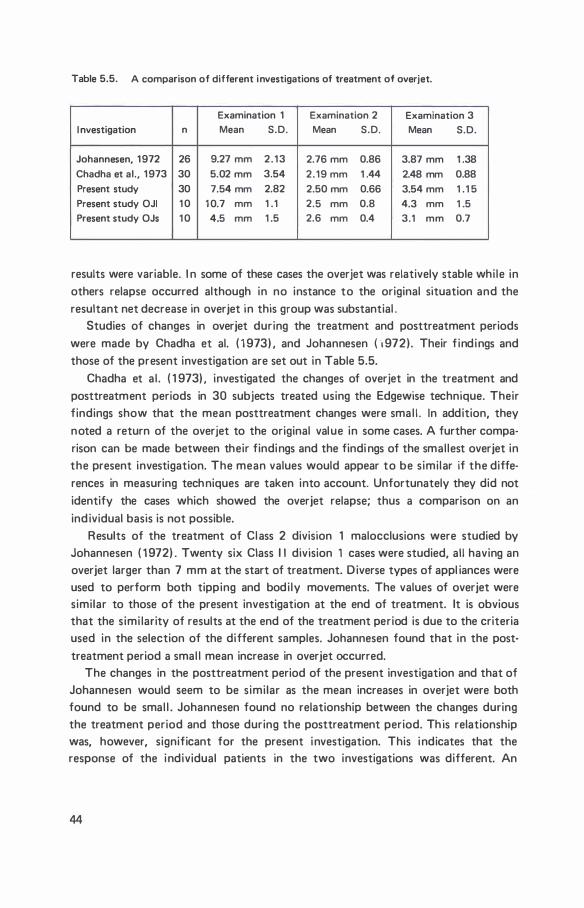
Table 5.5. A comparison of different investigations of treatment of overjet.
Examination 1 Examination 2 Examination 3 I nvestigation n Mean S.D. Mean S.D . Mean S.D.
Johannesen, 1 972 26 9.27 mm 2 . 1 3 2.76 mm 0.86 3.87 mm 1 .38 Chadha et al., 1 973 30 5.02 mm 3.54 2.19 mm 1 .44 2.48 mm 0.88 Present study 30 7.54 mm 2.82 2.50 mm 0.66 3.54 mm 1 .1 5 Present study OJI 1 0 1 0.7 mm 1 .1 2.5 mm 0.8 4.3 mm 1 .5 Present study OJs 1 0 4.5 mm 1 .5 2.6 mm 0.4 3.1 mm 0.7
results were variable. I n some of these cases the overjet was relatively stable whi le in others relapse occurred although in no instance to the original situation and the resultant net decrease in overjet in this group was substantial .
Studies of changes in overjet during the treatment and posttreatment periods were made by Chadha et al. ( 1 973) . and Johannesen { "t 972) . Their f indings and those of the present investigation are set out in Table 5.5.
Chadha et a l . ( 1 973) . investigated the changes of overjet in the treatment and posttreatment periods in 30 subjects treated using the Edgewise technique. Their findings show that the mean posttreatment changes were smal l . In addition, they noted a return of the overjet to the original value in some cases. A further comparison can be made between their findings and the findi ngs of the smal lest overjet in the present investigation. The mean values would appear to be similar if the differences in measuring techniques are taken into account. Unfortunately they did not identify the cases which showed the overjet relapse; thus a comparison on an ind ividual basis is not possible.
Results of the treatment of Class 2 division 1 malocclusions were studied by Johannesen ( 1 972) . Twenty six Class I I division 1 cases were studied, all having an overjet larger than 7 mm at the start of treatment. D iverse types of appl iances were used to perform both tipping and bodi ly movements. The values of overjet were similar to those of the present investigation at the end of treatment. It is obvious that the simi larity of results at the end of the treatment period is due to the criteria used in the selection of the different samples. Johannesen found that in the posttreatment period a smal l mean increase in overjet occurred.
The changes in the posttreatment period of the present investigation and that of Johannesen would seem to be similar as the mean increases in overjet were both found to be smal l . Johannesen found no relationship between the changes during the treatment period and those during the posttreatment period. Th is relationship was, however, significant for the present investigation. This indicates that the response of the individual patients in the two investigations was different. An
44
explanation for these contradictary findings may l ie in our observation that changes in the posttreatment period were more variable and less predictable. I n addition, the different treatment techniques employed in the two studies may have influenced the result.
The relationship between the overbite and overjet changes during treatment and posttreatment periods were not unexpected as the objectives of treatment were to reduce the overjet and overbite to a mi nimum. It was expected that some form of relapse should occur in the posttreatment period. The lack of an association between the final values of the overbite and overjet is due to the diversity of the individual posttreatment changes. The scatter diagram ( F igure 5.3) showed three combinations of relapsed incisal relationship. Relapse of overbite wou ld seem to be fairly predictable. Relapse of overjet is less predictable; s ince it frequently remains stable and when relapse occurred in cases with large initial overjet it did not relapse to the original situation.
The relationship of overjet to other variables wi l l be di scussed in subsequent chapters.
45
6.1 . Introduction
chapter 6
sagittal inclination of mandibular
and maxillary incisors
The axial incl ination of the incisors in the sagittal plane is frequently altered during treatment. I n add ition to aesthetic effects which may result, the inclination of the incisors at the end of treatment is considered to be one of the factors associated with the stabil ity of the treatment.
R iedel ( 1 969), reviewed the l iterature on the problem of relapse. He concluded that: 1 . tipping the incisors into a position too upright relative to each other may result in a relapse of overbite; 2. lower incisors should be placed upright over "basal bone" (90° ± 5° to the mandibular plane) to enhance the stabil ity of the treatment. In addition, he expressed a preference for positioning mandibular incisors too far labially. Schudy ( 1 973) maintained that a close relationship exists between overbite and the interincisal angle.
In this chapter, the changes in the sagittal inclination of the maxil lary and mandibular incisors will be investigated. Furthermore, the relationship of these changes to the changes in overbite and overjet wil l be analysed.
6.2. Measurements
The method of measurement is i l lustrated in F igure 5.1 . The definitions of
the points and l i nes are given in Chapter 2.3 .
l li .MP The angle formed by the incl ination of the mandibular incisor l ine ( l li) relative to the mandibular plane ( MP) .
I Ls.Sf-.1 The angle formed by the inc l ination of the maxil lary incisal l ine ( I Ls) relative to the sella nasion plane (SN) .
I Ls. l Li The interincisal angle. The angle formed between the max il lary ( I Ls) and mand ibular ( I Li) incisal l i nes.
46
Table 6.1 . Mean values and distribution of the individual values of the axial inclinations of
the incisors. Significance levels: n=30, t�2.045, P.;;Q.05; t�2.756, P.;;0.01 .
Variable n Mean S.D. Range t Sign
l li .MP 1 30 95.72° 8.61 74 1 1 2 l li .MP 2-1 30 0.1 1 ° 8.27 - 1 0 2 1 0.072 NS l li .MP 2 30 95.82° 8.90 79 1 1 7 l li .MP 3-2 30 - 1 .74° 5.07 - 1 8 4 1 .891 NS l li .MP 3 30 94.08° 8.61 80 1 1 3 I Li .MP 3-1 30 - 1 .63° 6.42 - 1 3 1 3 1 .393 NS l ls.SN 1 30 1 06.54" 7.74 82 1 1 8 l ls.SN 2-1 30 -1 0.67° 9. 1 6 -31 6 6.389 P<0.01 l ls.SN 2 30 95.86° 7.56 74 1 09 l ls.SN 3-2 30 3.57° 4.53 -3 20 4.301 P<0.01 l ls.SN 3 30 99.44° 8.61 80 1 13 l ls.SN 3-1 30 -7. 1 0° 7.09 -23 7 5.503 P<0.01 I Ls. l Li 1 30 1 2 1 .76° 1 0.88 1 04 1 55
I Ls. I Li 2-1 30 1 0.93° 1 2.21 -20 34 4.901 P<0.01 I Ls. I Li 2 30 132.69° 9.92 1 1 4 1 51 I Ls. I Li 3-2 30 0. 1 7° 6.49 - 1 8 1 4 0. 1 42 NS I Ls . I L i 3 30 1 32.86° 9 . 14 1 1 6 1 49 I Ls. I Li 3-1 30 1 1 . 1 0° 9.64 - 1 0 23 6.300 P<0.01
In the text, incl ination of maxi l lary or mandibular incisor l ines wi l l be referred to as the maxil l ary or mandibular incisor i ncl ination.
Mandibular i ncisor i nclination relative to the mandibular plane was measured by the classical method rather than the Bjork method for the following reasons: 1 .
seven of the nine cases in which the Bjork method of superimposition was not used were 1 . Class I I division 1 cases and constituted seven of the ten cases of the group with the ten largest overjets. This made a comparison of Class II division 1 and Class I malocclusions difficult using th is method: 2. the changes of mandibular incl ination were small (Chapter 8) and therefore not of great i nfluence on the measurement of the incisor mandibular plane angle.
6.3. Results
6.3 . 1 . I ncisor mand ibular plane angle
The mean values and distribution of individual values are shown in Table 6. 1 .
47
Table 6.2. Group OJI consists of the ten cases with the largest overjets at the initial examina
tion and G roup OJs of the ten cases with the smallest overjets at the initial
examination. Significance levels: n=20, t;;.2.1 0 1 , P�0.05; t;;-2.878, P�0.01 .
Group OJI Group OJs largest overjets, n = 1 0 smallest overjets, n = 1 0
Variable Mean S.D. Range Mean S.D. Range t Sign
I LI .MP 1 96.05° 1 1 .06 74 1 1 2 93.02° 8.48 85 1 06 0.686 NS l li.MP 2-1 6.29° 1 0.34 - 1 2 1 -3.34° 4.47 -8 3 2.702 P<0.05 1 Li .MP 2 1 02 .34° 8.08 93 1 1 4 89.68° 6.67 80 99 3.8 1 8 P<0.01 I Li.M P 3-2 -4.23° 7.07 - 1 8 3 -1 .01 ° 2.98 -5 4 1 .323 NS l li .Mp 3 98.1 1° 8.34 87 1 05 88.67° 5.88 8 1 98 2.924 P<0.01 l li .MP 3- 1 2.06° 6.36 -1 1 3 -4.35° 5. 1 7 - 1 2 4 2.474 P<0.05
I Ls.SN 1 1 09.43° 3.46 1 04 1 1 4 1 01 .22° 1 0.75 84 1 1 4 2.296 P<0.05 I Ls.SN 2-1 -1 6.03° 8.73 -31 -2 -3.34° 8.93 -23 6 3.2 1 2 P<0.01 I Ls.SN 2 93.40° 9.44 74 1 06 97.88° 7.49 98 1 07 1 .1 77 NS I Ls.SN 3-2 4.96° 5.80 0 20 1 .33° 4.28 -3 1 1 1 .595 NS I Ls.SN 3 98.36° 5.95 87 1 09 99.21 ° 7. 1 9 86 1 09 0.288 NS I Ls.SN 3-1 - 1 1 .07° 5.85 -19 2 -2.01 ° 6.76 - 1 2 7 3.200 P<0.01
I Ls.l li 1 1 1 9.52° 9.08 1 04 1 34 1 29.1 2° 1 2.77 1 08 1 56 1 .951 NS I Ls.I Li 2-1 9.69° 1 4.62 -5 22 7.83° 1 3.58 - 1 0 35 0.295 NS I Ls.l li 2 1 29.2 1 ° 1 0.61 1 1 7 1 51 1 37.02° 1 0. 1 1 1 1 7 1 48 1 .685 NS I Ls. l li 3-2 1 .48° 9.22 -1 8 1 4 1 .84° 4.58 -7 1 1 0. 1 22 NS 1 Ls. 3 1 30.69° 4.65 1 24 1 39 1 38.86° 9.7 1 1 2 1 1 50 2.400 P<0.05 I Ls. l Li 3-1 1 1 .67° 9.96 - 1 0 23 9.67° 1 1 .08 -8 28 0.3 1 7 NS
The mean inclination of the mandibular incisors relative to the mandibular plane was 95.72° at the start of treatment. The standard deviation was 8.61 ° and range
from 74 ° to 1 1 2° . Seventy-four degrees indicates a retrocl ined incisor wh ile 1 1 2°
indicates a proclined incisor. Neither treatment nor posttreatment changes were significant. Of importance is the observation of a considerable individual variation in these changes.
At the final examination the mean incisor mandibular plane angle was 94.08° , standard deviation 8.61 ° and the individual values ranged from 80° to 1 1 3° . The mean change between initial and final examination was found to be not significant. However, the standard deviation of 6.42° indicates large individual variation. The largest increase ( 1 3° ) which occurred was in a patient with a Class I I division 1 , in which the mandibular incisors were retroclined at the start of treatment. The largest decrease ( 1 3°) which occurred was in a Class I I division 1 case in which the lower incisors became progressively more upright during and following treatment.
The correlation coefficient was calculated between treatment and posttreatment changes ( r=-0.630, P<0.0 1 ) and found to be significant. It denotes a strong general
48
..... .!!! 90 ::J
.0 'g es «l E oo ..... 0 ·l3 75 .f:
Group OJ I
38 24 12 0 12 24 38 (monlhoj
treatment penod posttreatment penod
en � 115 01 � 110
Q) C, 105 c: «l Q) 100 c: ro Ci. 95
..... ro 90 "3 .0 '6 85 c: «l E eo ..... 0 ·l3 75 c:
Group OJs
38 24 12 0 12 24 38 (months)
treatment period posttreatment penod
Figure 6.1 . Change during the treatment and post treatment periods of the incisor mandibular plane angle in Group OJI (large initial overjets) and Group OJs (small initial overjets) .
tendency for the changes which occur during the treatment period to b e reversed i n the posttreatment period.
To compare the i ncisor mandibular plane angle in Class I I division 1 and Class I malocclusions, the sample was subdivided as described in Chapter 5.3. I n group OJI were cases with Class I I division 1 malocclusions and in Group OJs were cases with a Class 1 or borderl ine malocclusion. The mean values and distribution of the individual values are shown in Table 6.2. The individual changes are i l l ustrated in F igure 6.1 .
At the start of treatment, there was no significant mean difference between the incisor mand ibular plane angles of the two groups. Changes in the treatment period were found to be sign ificantly larger in Groups OJI . In Group OJI , the incisors became more proclined relative to the mandibular plane. I n Group OJs the incisors became more upright relative to the mandibular plane.
At the end of treatment, the mean difference between the two groups was
significant. I n group OJI, it was 1 02.34° whereas in Group OJs it was 89.68° . The standard deviation in Group OJI was 8.08° and the range was from 93° to 1 14° . I n Group OJs the standard deviation was 6.67° and the range from 80° to 99° . The
mean difference of the changes in the post treatment period was not significant. At the final examination the mean of Group OJI was 98. 1 1 o , and 88.67° of
49
Table 6.3. Correlation coefficients calculated between the incisal axial inclinations and over
bite and overjet. Significance levels: n=30, r;;;-0.368, P.;;0.05; r;;;.0.464, Po;;0.01 .
Variable Variable n r Sign
I Li .MP 2-1 overjet 2- 1 30 -0.559 P<0.01 overbite 2- 1 30 -0.308 NS
I Li .MP 3-2 overjet 3-2 30 -0.695 P<0.01 overbite 3-2 30 -0.424 P<0.05
1 Li .MP 3 overjet 3 30 0.21 2 NS overbite 3 30 -0.022 NS
I Ls.SN 2- 1 overjet 2-1 30 0.629 P<0.01 overbite 2-1 30 0.307 NS
I Ls.SN 3-2 overjet 3-2 30 -0. 1 40 NS overbite 3-2 30 0. 1 1 2 NS
I Ls.SN 3 overjet 3 30 -0.007 NS overbite 3 30 -0. 1 85 NS
I Ls. I Li 2- 1 overjet 2-1 30 0.035 NS overbite 2-1 30 0.002 NS
I Ls. I Li 3-2 overjet 3-2 30 0.444 P<0.05 overbite 3-2 30 0.493 P<0.01
I Ls. I Li 3 overjet 3 30 -0.344 NS overbite 3 30 0.099 NS
I Ls. I Li 2 overbite 3-2 30 0. 1 1 8 NS overbite 3 30 0. 1 1 3 NS overjet 3-2 30 0.526 P<O.Ol overjet 3 30 0.520 P<0.01
Group OJs. The mean difference between the two groups was significant. I t is thus apparent, that in the group of Class I I division 1 cases, the incisors were procl ined relative to the mandibular plane at the final examination. This in comparison to the group of Class I cases where the incisors were on average almost perpendicular to the mandibular plane. The net changes were significantly different. In Group OJ I , the mean incisor mandibular plane angle apparently increased while in Group OJs it decreased between initial and final examination.
In F igure 6. 1 . the individual values at each examination for the two groups are i l lustrated. It can be seen that in Group OJI several cases showed considerable i ncreases in incisor mandibular plane angle during treatment fol lowed by post treatment decreases. I n G roup OJs, the changes were small during the treatment and
50
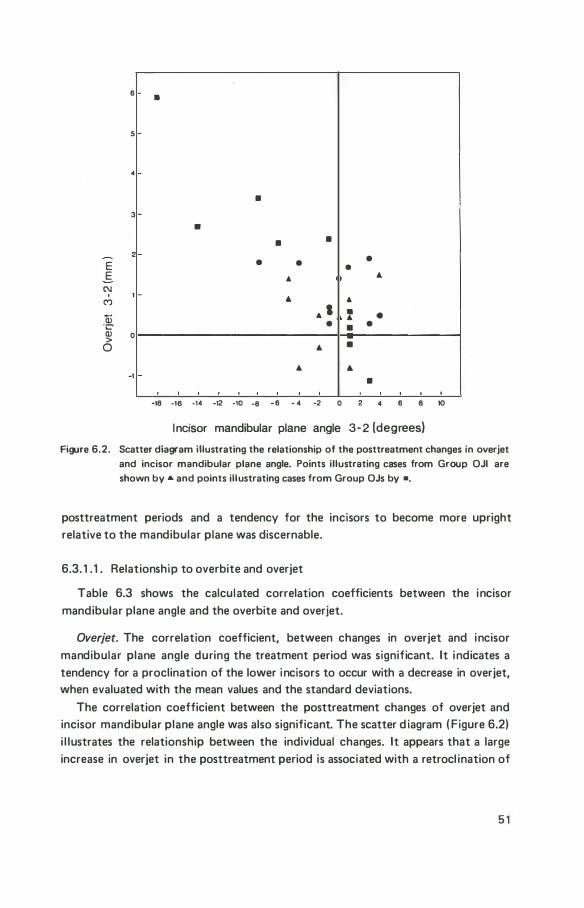
E E
C\1 '
(")
Q) "C'
6
5
3
1
� 0
0
-1
•
•
•
• •
• •
"
...
... . •
...
...
-18 ·18 -14 -12 -10 -8 -6 - 4 -2 0
•
" • ... •
•
...
•
•
•
...
•
4 6 8 10
I ncisor mandibular plane angle 3-2 (degrees)
Figure 6.2. Scatter diagram illustrating the relationship of the posttreatment changes in overjet and incisor mandibular plane angle. Points illustrating cases from Group OJI are shown by ... and points illustrating cases from Group OJs by •.
posttreatment periods and a tendency for the incisors to become more upright relative to the mandibular plane was discernable.
6.3. 1 . 1 . Relationship to overbite and overjet
Table 6.3 shows the calculated correlation coefficients between the incisor mandibular plane angle and the overbite and overjet.
Overjet. The correlation coefficient, between changes in overjet and incisor mandibular plane angle during the treatment period was significant. It indicates a tendency for a proclination of the lower incisors to occur with a decrease in overjet, when evaluated with the mean values and the standard deviations.
The correlation coefficient between the posttreatment changes of overjet and incisor mandibular plane angle was also significant. The scatter d iagram ( Figure 6.2) i l lustrates the relationship between the individual changes. It appears that a large increase in overjet in the posttreatment period is associated with a retrocl ination of
5 1
the lower i ncisors. I n i ndividuals where the changes in overjet are smal l , no specific trend is apparent. From the examination of the groups of large and smal l overjets, it appears that the large posttreatment changes were found within Group OJI, the group of the ten largest overjets.
F inally, no relation could be shown between the final overjet and incisor mandibular plane angle.
Overbite. The correlation coefficient between the changes during treatment of overbite and incisor mandibular plane angle was not significant.
The correlation coefficient between changes in the posttreatment period of overbite and incisor mandibular plane angle was significant. When evaluated with the mean values and standard deviations, it indicates a tendency for an increase in overbite to be associated with a retrocl ination of mandibular incisors.
No relationship was evident between overbite and incisor mandibular plane angle at the final examination.
6.3.2. Maxillary incisal inclination
The mean values and distribution of individual values are shown in Table 6. 1 .
At the start of treatment, the mean angulation of the maxi l lary incisor relative to the SN plane was 1 06.54° , with a standard deviation of 7. 74 ° . The range was from 82° to 1 1 8° . The most procl ined incisor was in a Class I I division 1 malocclusion whereas the most retrocl ined i ncisor was in a Class I malocclusion. During the treatment period, a significant mean decrease of 1 0.67° occurred, with a standard deviation of 9 . 1 6° and a range of -31 ° to 6° .
At the end of treatment, the mean was 95.86° with a standard deviation of 7.56° and a range of 74° to 1 09° . I n the posttreatment period the maxi l lary incisors became on average more procl ined. A significant mean increase of 3.57°
with a standard deviation of 4.53° was found. The range was from -3° to 20° . The mean change between initial and final examinations was significant. A mean decrease of 7 . 1 0° w ith a standard deviation of 7.09° and a range of -23° to 7° was found.
To determine the relationship of treatment to posttreatment changes the correlation coefficient (r=·0.633, P<0.01 ) was calculated and found to be significant. Although the strong inverse relationship between the changes indicates a relapse tendency, the posttreatment changes are obviously considerably smaller than the treatment changes.
To investigate the differences between Class I and Class I I division 1 cases the sample was subdivided into two groups as prev iously indicated. The values of the measurements are shown in Table 6.2. and i l lustrated in figure 6.3.
52
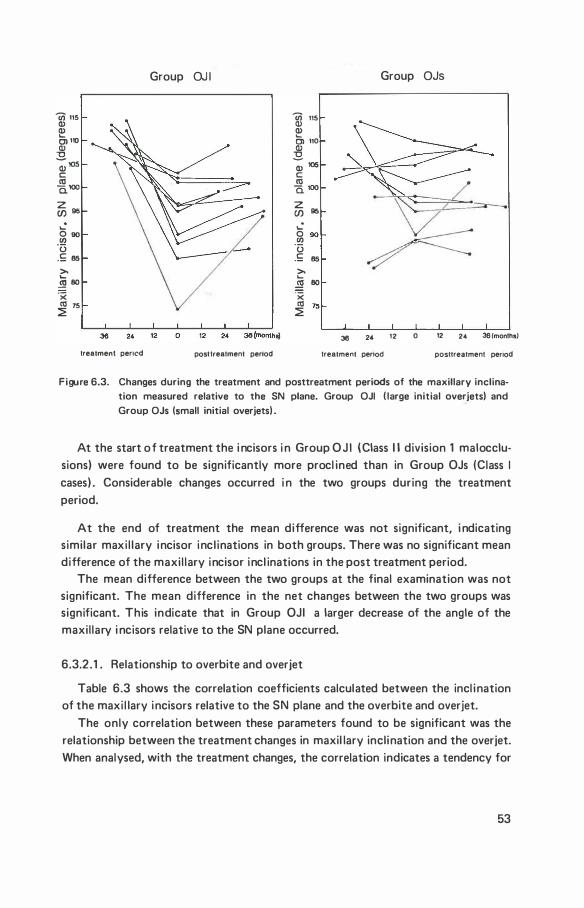
Iii 115 Q) Q) .._ C) 110 Q)
"'C
-;105 c: �100 z (/) 96
.._ O so Ul ·u .£ 85
>. .._ _!!l 80 ·x co 75 �
Group OJ I
treatment pericd posttreatment pereod
Iii 115 Q) � Cl 110 � Q) 105 c: co 0. 100 z CJ) 95 ..: 0 Ul 90 ·u .£ 85 >. .._
..!!! 80 ·x co 75 �
Group OJs
36 24 12 0 12 24 36 (months!
treatment period posttreatment penod
Figure 6.3. Changes during the treatment and posttreatment periods of the maxillary inclination measured relative to the SN plane. Group OJI ( large initial overjets) and Group OJs (small initial overjets) .
At the start o f treatment the i ncisors i n Group O J I (Class I I division 1 malocclusions) were found to be significantly more procl ined than in Group OJs (Class I cases) . Considerable changes occurred i n the two groups during the treatment period.
At the end of treatment the mean difference was not significant, i ndicating similar maxi l lary incisor incl inations in both groups. There was no significant mean difference of the maxi l lary incisor incl inations in the post treatment period.
The mean difference between the two groups at the final examination was not significant. The mean difference in the net changes between the two groups was significant. This indicate that in Group OJI a larger decrease of the angle of the maxil lary i ncisors relative to the SN plane occurred.
6.3.2.1 . Relationship to overbite and overjet
Table 6.3 shows the correlation coefficients calculated between the incl ination of the maxi l lary incisors relative to the SN plane and the overbite and overjet.
The only correlation between these parameters found to be significant was the relationship between the treatment changes in maxil lary inclination and the overjet. When analysed, with the treatment changes, the correlation indicates a tendency for
53
the angle of the maxil lary incisors relative to the SN plane, to decrease as overjet decreases. The incisors tend to become more upright relative to the SN plane in those cases in which a large reduction of overjet occurred. No relationship was evident between the change in inclination of maxi l lary incisors following treatment and the changes in overbite and overjet. Similarly, no relationship was found at the posttreatment examination.
6.3.3. l nterincisal angle
The mean values and distribution of individual values are given in Table 6. 1 .
At the start of treatment the mean interincisal angle was 1 2 1 .76° with a standard deviation of 1 0.88° . The range was from a smal l interincisal angle of 1 04°
to a large interincisal angle of 1 55° where the incisors are almost upright relative to each other. During treatment the mean intetincisal angle increased significantly by 1 0.93° standard deviation 1 2.21 ° . At the end of treatment the mean interincisal angle was 1 32 .69° and the standard deviation was 9.92° . There was no significant mean change in the post treatment period although it is evident from the standard deviation (6.49° ) and the range ( - 1 8° to 1 4° ) that individual changes were considerable. At the final examination the mean interincisal angle was 1 32.86° , the standard deviation was 9 . 1 4° and the range was from 1 1 6° to 1 49° .
The correlation coefficient between changes in the treatment and posttreatment
periods was found to be significant ( r==-0.621 , P<0.01 ) . It denotes a tendency for treatment changes to become reversed in the posttreatment period. However, it should be noted that posttreatment changes are considerably less than the treatment changes.
To investigate the difference between the Class I and Class II division 1 maloc
clusions the sample was subdivided into two groups as previously indicated (Table 6.2) .
No significant mean difference was found between the two groups except at the final examination. The group which was originally Class I I division 1 , Group OJ I , showed an interincisal angle which was less obtuse than the Class I group. The mean differences in the treatment and posttreatment changes were not found to be significant, indicating that the response to treatment is general ly similar. However, it appears from the distribution of the individual values that varied responses occurred in both groups.
6.3.3. 1 . Relationship to overbite and overjet
To determine the relationship of the interincisal angle to overbite and overjet, the correlation coefficients shown in Table 6.3 were calculated.
54
An analysis of the correlation coefficients revealed no significant relationship between the changes dur ing treatment of the interincisal angle and overjet and overbite.
I n the posttreatment period, changes in interincisal angle were correlated with overjet. When evaluated with the mean values and standard deviations this indicates that an increase in the interincisal angle tends to be associated with an increase in overjet. A decrease i n interincisal angle tends to be associated width a smal ler overjet increase. Similarly, the relationship with overbite was significant. An increase in the interincisal angle is associated with an increase in overbite.
At the final examination, there was no significant correlation coefficient between the interincisal angle and overbite and overjet.
F inally, to examine the relationship of the interincisal angle at the end of treatment to the posttreatment changes in overbite and overjet, as well as to the values of overbite and overjet at the final examination, the correlation coefficients were calculated.
No significant correlation coefficient was found between the interincisal angle at the end of treatment and the posttreatment changes in overbite, or between the interincisal angle and the posttreatment overbite.
A significant correlation was found between the end of treatment interincisal angle and the posttreatment change in overjet. Further, the correlation between the interincisal angle and the final overjet was found to be significant.
6.4. Discussion
Mandibular incisor inclination. I n reporting the results of changes of the i ncisor mandibular plane angle, it has been assumed that the changes were due to the change in i nc l ination of the mandibular incisors. The changes in the inc l ination of the mandibular incisors are relative and may, to a lesser extent, be due to changes occurring in the mandibu lar plane. Moreover, it is assumed that the movements which occur are largely of a tipping nature and that it is mainly the position of the incisal edge which is altered relative to the mandibular plane.
From an analysis of the results, it would appear that general ly the incisor mandibular plane angle at the posttreatment examination is s imilar to the i ncl ination at the start of treatment. It therefore appears inadvisable to alter this inc l ination by treatment due to the possibi l ity of relapse following treatment.
The evaluation of the differences between Class I and Class I I cases revealed that the incisal i nc l ination was subject to greater changes in the Class I I d ivision 1 cases during the treatment period. Excessive changes occurred in Class I I division 1 cases in which procl ination of incisors was observed during treatment and a relapse fol lowed treatment. Furthermore, at the final examination, the mand ibular incisors
55
of the initial Class I I division 1 cases were generally more procl ined than the initial Class I cases.
It fol lows that if overjet is corrected only by changes in position of maxi l lary and mandibular incisors, the inherent l imitations imposed by the lower incisors require that the upper incisors be retruded to reduce the overjet. The inclination of the lower incisors relative to the mandibular plane should be maintained in a stable position.
There are, however, situations in which the inclination of the mandibular incisors may be changed without significant relapse in the posttreatment period: in Class I I division 1 malocclusions, retrocl ined mandibular incisors were procl ined during the treatment period and their position remained relatively stable in the posttreatment period. In Class I malocclusions, general ly, the mandibular incisors can be retrocl ined during treatment and the positions remain stable in the posttreatment period. These findings are further substantiated by the mean difference between the Class I and Class I I division 1 malocclusions at the final examination. At this examination it was found that the mandibular incisors in Class I I divison 1 malocclusions were more procl ined than in Class 1 malocclusions. The differing results for mandibular incisor inclination at the final examination were probably due to differences in facial morphology. Since Bjork ( 1 947, 1 972) has show that mandibular i ncisal i ncl ination varies according to individual facial morphology.
M il ls ( 1 966) studied 56 patients in which mandibular incisors had been del iberately procl ined during the treatment of various types of malocclusion. A general tendency for relapse was found in the posttreatment period. Exceptions were Class I I division 1 cases in which incisors were retroclined at the start of treatment. These findings would appear to be similar to those of the present investigation.
In a similar study of cases, in which incisors had been del iberately retrocl ined following extraction of first premolars, Mi l ls ( 1 967) found that in the posttreatment period a relapse general ly occurred. The most stable results occured when, mandibular growth was more forward relative to maxi l lary growth. Th is group of patients was probably similar to the group of Class I patients examined in the investigation, as they also showed a stable mandibular incisor position.
The relationship in the posttreatment period between changes of incisor position and changes of overbite and overjet were significant. A relapse of procl ined mandibu lar incisors was associated with a relapse of overjet and it is l i kely that relapse of procl ined mandibular incisors results in an overjet relapse. The relationship between incisor changes and overbite changes was also significant in the posttreatment period. However, a causal relationship is not directly apparent. It is l ikely that relapse of procl ined incisors is merely one of many factors that ultimately lead to a deepening of the overbite.
56
Simons and Joondeph ( 1 973) found that a procl ination of mandibular incisors during treatment was significantly correlated with overbite relapse. They recommended that th is treatment procedure be avoided in order to enhance stabil ity of deep overbite correction. The present investigation confirms their findings.
Maxillary incisor inclination. The results show that general ly in the treatment period the maxil lary incisors became more upright ( retrocl ined) relative to the SN plane. Furthermore, the upright positioning appears more marked for Class I I d ivision 1 , than Class I cases.
I n the posttreatment period the mean inc l ination i ncreased significantly, indicating a procl ination. Furthermore, the mean difference between the Class I and Class I I division 1 cases was not significant. In the Class I cases both individual increases or decreases were found while in the Class I I division 1 cases no decreases in maxil lary incisal i nclination were found and i ncl ination remained the same or increased.
Kesl ing et a l . ( 1 97 1 ) advocated a maxi l lary incisor inclination relative to the SN plane of 1 06° or more, at the end of treatment. They found a retrocl ination in the posttreatment period and a final inclination of 1 03° which they consider to be the correct incl i nation. I n contrast, Wi l l iams ( 1 965) and ourselves found a sl ight proclination in the same period. As al l patients were treated using the Begg technique, these differences may possibly be due to the different retention appl iances used.
F inally, the posttreatment changes in maxi l lary i ncisor inc l ination relative to the SN plane were not found to be related to changes in overbite or overjet in the posttreatment period. Therefore the posttreatment increases in maxil lary incisor procl ination do not appear related to a relapse of overbite or overjet.
lnterincisa/ angle. At the final examination a significant difference was observed between the interincisal angles of Class I and Class I I division 1 cases. The interin· cisal angle is influenced by positional changes of both mandibular and maxil lary incisors. The mean difference at the final examination between Class I and Class I I division 1 cases was significant for the mandibular incisal incl ination but not significant for maxi l lary incisal inclination. Therefore, it is l ikely that the differen· ces in the interincisal angle in the present investigation were due to the position of the mandibular incisors. The relationship of the interincisal angle to overjet and overbite was found to be significant in the posttreatment period, but, no significant relationships were evident at the final examination.
There are conflicting reports in the l iterature on the relationship between changes of interincisal angle and overbite in the posttreatment period:
R iedel ( 1 969) and Schudy ( 1 973) consider the interincisal angle an important
57
factor in the stabil ity of overbite. R iedel ( 1 969) states that if maxil lary and mandibular incisors are tipped into a too upright relationship to one another a deep overbite may result. Schudy ( 1 973) maintains that maxi l lary and mandibular incisors correctly incl inated ( interincisal angle approximately 1 35° ) prevent extru· sion of each other. Simons and Joondeph ( 1 9731. however, found no relationship between posttreatment changes of the interincisal angle and overbite. Our findings confirm a relationship of interincisal angle and overbite changes in the posttreatment period, but, no relationsh ip was found at the final examination.
To conclude : changes during the treatment period of the incisor mandibular plane angle tend to relapse in the posttreatment period. Exceptions were found in Class I I division 1 cases in which retrocl ined incisors at the initial examination were procl ined in the treatment period, and in Class I cases i n which proclined incisors at the in itial examination were retrocl ined in the treatment period. In such cases the position of the incisors remained stable in the posttreatment period. The treatment
objectives should therefore be individual ised, taking into account that the incisor mandibular plane angle following treatment differs according to the nature of the original malocclusion. F inally, procl ined incisors which relapsed were associated
with a relapse of overbite and overjet. Maxil lary incisors tend to became less procl ined in the treatment period and
sl ightly more procl i ned in the posttreatment period. The mean difference in maxil lary incisor incl ination between Class I and Class I I division 1 cases was not sign ificant at the end of treatment or in the posttreatment period although the net change was. Changes of maxil lary incisor inclination in the posttreatment period were not shown to be related to changes in overbite or overjet.
Changes of interincisal angle in the posttreatment period were found to be related to relapse of overbite and overjet. It is noteworthy that the changes of the mandibular component of the interincisal angle were associated with relapse of overbite and overjet, wh i le changes of maxil lary incisal inclination were not. It thus appears that it is the mandibu lar incisor component that is of importance and not the i nterincisal angle as such.
58
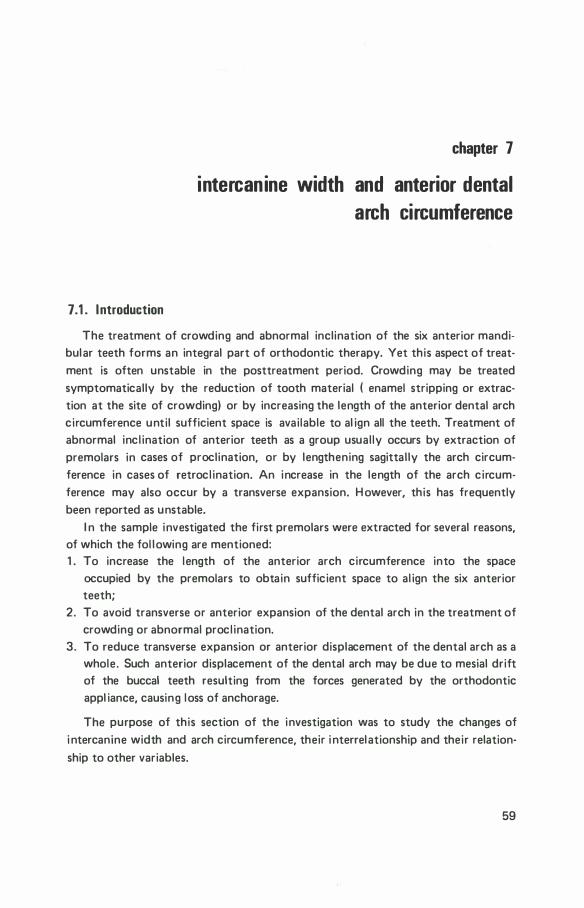
7.1 . Introduction
chapter 7
intercanine width and anterior dental
arch circumference
The treatment of crowding and abnormal inclination of the six anterior mandibular teeth forms an integral part of orthodontic therapy. Yet this aspect of treatment is often unstable in the posttreatment period. Crowding may be treated symptomatically by the reduction of tooth material ( enamel stripping or extraction at the site of crowding) or by increasing the length of the anterior dental arch circumference until sufficient space is avai lable to al ign all the teeth. Treatment of abnormal inc l ination of anterior teeth as a group usual ly occurs by extraction of premolars in cases of proclination, or by lengthening sagittal ly the arch circumference in cases of retrocl ination. An increase in the length of the arch circumference may also occur by a transverse expansion. H owever, this has frequently been reported as unstable.
I n the sample investigated the first premolars were extracted for several reasons, of which the fol lowing are mentioned: 1 . To increase the length of the anterior arch circumference into the space
occupied by the premolars to obtain sufficient space to al ign the six anterior teeth;
2. To avoid transverse or anterior expansion of the dental arch in the treatment of crowding or abnormal procl ination.
3. To reduce transverse expansion or anterior displacement of the dental arch as a whole. Such anterior displacement of the dental arch may be due to mesial drift of the buccal teeth resulting from the forces generated by the orthodontic appl iance, causing loss of anchorage.
The purpose of this section of the investigation was to study the changes of i ntercanine width and arch circumference, their i nterrelationship and their relationship to other variables.
59
Figure 7 .1 Computer plot of a parabolic curve constructed to approach the mesial and distal contact points of the six anterior teeth as closely as possible. Dots * indicate the
mesial or distal contact points. The diagram illustrates the average circumference of the anterior mandibular dental arch at the initial examination.
7.2. nneasurernents
The measurements were made on dental casts. The procedures are described in Chapter 2 .2. Figure 2.1 i l l ustrates the landmarks used. F igure 7 . 1 i l l ustrates the method of measuring the anterior dental arch ci rcumference.
ICW l ntercanine width was defined as the distance between the cusps (points 02 and 1 3) of the canines.
Circum Anterior dental arch circumference was defined as the length of a parabolic curve (y=ax2 +bx+c) constructed to approach as closely as possible (a l east square fit) the mesial and distal contact points of the canines and incisors (points 0 1 , 03 to 1 2 and 1 4) . The length of the curve ( Figure 7. 1 ) was measured from the distal points of the canines (points 01 , 14) projected along the x-axis to intersect the parabo l ic curve using the formula:
S1 = J V 1 + (��)2' dx
The measurements were made in the maxi l lary dental arch (U ) and in the mandibular dental arch ( L) . Measurements were made of 30 cases. In the subsequent text, anterior dental arch circumference may be referred to as circumference.
The circumference changes, are synonymous with crowding changes, as crowding may be calculated by subtracting the l ength of the circumference from the sum of the mesiodistal widths of the six anterior teeth . The tooth dimensions were taken to be constant and therefore changes in crowding and circumference were considered as synonymous in the present investigation. This means that a decrease in circumference is equal to an i ncrease in crowding.
60
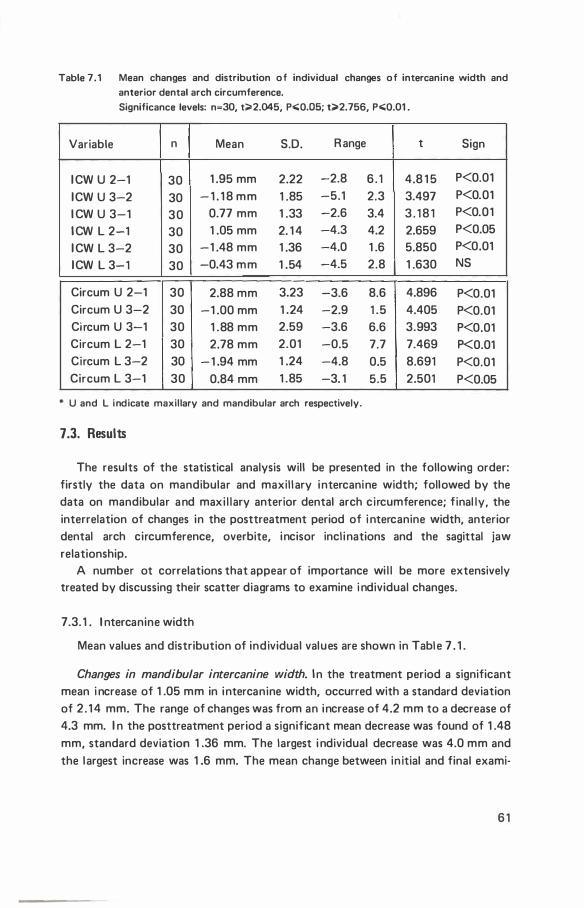
Table 7.1 Mean changes and distribution of individual changes of intercanine width and anterior dental arch circumference.
Significance levels: n=30, t;;;.2.045, p.;;Q,OS; t;;;.2.756, p.;;Q.01 .
Variable n Mean S.D. R ange t Sign
I CW U 2-1 30 1 .95 mm 2.22 -2.8 6 . 1 4.8 1 5 P<0.01
ICW U 3-2 30 - 1 . 1 8 mm 1 .85 -5.1 2.3 3.497 P<0.01
I CW U 3-1 30 0.77 mm 1 .33 -2.6 3.4 3 . 1 8 1 P<0.01
I CW L 2-1 30 1 .05 mm 2. 1 4 -4.3 4.2 2.659 P<0.05
I CW L 3-2 30 -1 .48 mm 1 .36 -4.0 1 .6 5.850 P<0.01
ICW L 3-1 30 -0.43 mm 1 .54 -4.5 2.8 1 .630 NS
Circum U 2-1 30 2.88 mm 3.23 -3.6 8.6 4.896 P<0.01 Circum U 3-2 30 -1 .00 mm 1 .24 -2.9 1 .5 4.405 P<0.01 Ci rcum U 3-1 30 1 .88 mm 2.59 -3.6 6.6 3.993 P<0.01 Circum L 2-1 30 2.78 mm 2.01 -0.5 7.7 7.469 P<0.01 Circum L 3-2 30 - 1 .94 mm 1 .24 -4.8 0.5 8.691 P<0.01 Circum L 3-1 30 0.84 mm 1 .85 -3. 1 5.5 2.501 P<0.05
* U and L indicate maxillary and mandibular arch respectively.
7.3. Results
The results of the statistical analysis will be presented in the following order: firstly the data on mandibular and maxill ary intercanine width; followed by the data on mandibular and maxi l lary anterior dental arch circumference; final ly, the interrelation of changes in the posttreatment period of i ntercanine width, anterior dental arch circumference, overbite, incisor incl inations and the sagittal jaw relationship.
A number ot correlations that appear of importance wi l l be more extensively treated by discussing their scatter diagrams to examine i ndividual changes.
7.3. 1 . l ntercanine width
Mean values and distribution of individual values are shown in Table 7 . 1 .
Changes in mandibular intercanine width. I n the treatment period a significant mean i ncrease of 1 .05 mm in intercanine width, occurred with a standard deviation of 2 . 1 4 mm. The range of changes was from an increase of 4.2 mm to a decrease of 4.3 mm. I n the posttreatment period a significant mean decrease was found of 1 .48 mm, standard deviation 1 .36 mm. The largest i ndividual decrease was 4.0 mm and the largest increase was 1 .6 mm. The mean change between in itial and final exami-
6 1
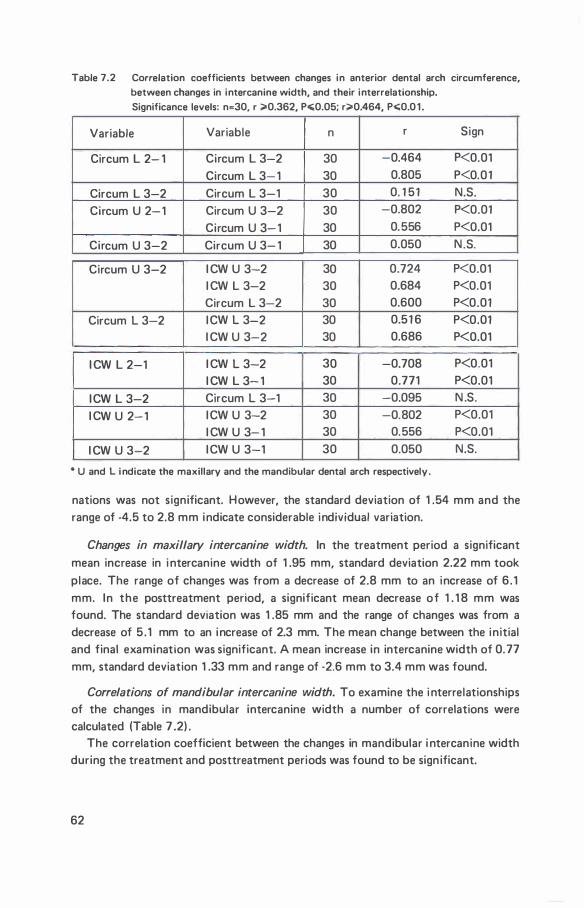
Table 7.2 Correlation coefficients between changes in anterior dental arch circumference, between changes in intercanine width, and their interrelationship. Significance levels: n�30, r �0.362, P"0.05; r�0.464, P"0.0 1 .
Variable Variable n r Sign
Circum L 2- 1 Circum L 3-2 30 -0.464 P<0.01
Circum L 3- 1 30 0.805 P<0.01
Circum L 3-2 Circum L 3-1 30 0. 1 51 N.S.
Circum U 2-1 Circum U 3-2 30 -0.802 P<0.01
Circum U 3-1 30 0.556 P<0.01
Circum U 3-2 Circum U 3- 1 30 0.050 N.S.
Circum U 3-2 I CW U 3-2 30 0.724 P<0.01 I CW L 3-2 30 0.684 P<0.01 Circum L 3-2 30 0.600 P<0.01
Circum L 3-2 I CW L 3-2 30 0.51 6 P<0.01 I CW U 3-2 30 0.686 P<0.01
I CW L 2-1 I CW L 3-2 30 -0.708 P<0.01 I CW L 3- 1 30 0.771 P<0.01
I CW L 3-2 Circum L 3-1 30 -0.095 N .S.
I CW U 2-1 I CW U 3-2 30 -0.802 P<0.01 I CW U 3- 1 30 0.556 P<0.01
I CW U 3-2 I CW U 3-1 30 0.050 N.S.
• U and L i ndicate the maxillary and the mandibular dental arch respectively.
nations was not significant. However, the standard deviation of 1 .54 mm and the range of -4.5 to 2.8 mm indicate considerable individual variation.
Changes in maxillary intercanine width. In the treatment period a significant mean increase in i ntercanine width of 1 .95 mm, standard deviation 2.22 mm took place. The range of changes was from a decrease of 2.8 mm to an increase of 6 . 1 mm. In the posttreatment period, a significant mean decrease of 1 . 1 8 mm was found. The standard deviation was 1 .85 mm and the range of changes was from a decrease of 5 . 1 mm to an increase of 2.3 mm. The mean change between the initial and final examination was significant. A mean increase in intercanine width of 0. 77 mm, standard deviation 1 .33 mm and range of -2.6 mm to 3.4 mm was found.
Correlations of mandibular intercanine width. To examine the i nterrelationships of the changes in mandibular intercanine width a number of correlations were calculated (Table 7 .2) .
The correlation coefficient between the changes in mandibular i ntercanine width during the treatment and posttreatment periods was found to be sign ificant.
62
2
•
E E
N I • (")
.s:: =o ·2 "§
• • • • •
• • • • • •
Ql c ·3 ·c: Ill
• • • ..
• u 0...
� ·4 E •
•
·5 3
-4 -3 ·2 _,
lntercanine width 2-1 ( mm)
Figure 7 .2. The scatter diagram illustrates the distribution of points denoting treatment and posttreatment changes in i ntercanine width in the mandibular dental arch.
The correlation when evaluated with the mean values and their standard deviations indicates a tendency for an i ncrease, or respectively a decrease in intercanine
width during treatment to be associated with a decrease, or respectively an increase in intercanine width following treatment. A tendency to return to the original width is obvious. The scatter diagram ( F igure 7 .2) i l lustrates the distribution of the individual values. For descriptive purposes the scatter diagram was divided into four quadrants.
Quadrant 1 . N o points were distributed in quadrant 1 . This means that in no instance was an increase in intercanine width found both during and following treatment.
Quadrant 2. One point was found in quadrant 2. A decrease in the intercanine width occur
red during treatment followed by an increase in the posttreatment period. I n
this case the mandibular canines were buccally positioned. Quadrant 3. Five points. A decrease occurred in the intercanine width during treatment
followed by a further posttreatment decrease. Quadrant 4. Twenty-two points. I n these cases an increase during the treatment period was
followed by a decrease i n the posttreatment period. Eleven cases represented by the points which lie above the z-axis had treatment changes which were greater than posttreatment changes i.e. there was an in·
63
crease in the intercanine width between initial and final examinations. The eleven points which lie below the z·axis represent cases with posttreatment changes which were greater than treatment changes i.e. There was a decrease in the intercanine width between initial and final examination.
Two points were distributed on the y-axis. No change occurred during treatment
but a decrease was found in the posttreatment period.
The correlation coefficient relating changes in the mandibular intercanine width during the treatment period to the changes between the initial and final examination was found to be significant. It indicates when evaluated with the respective means and standard deviations that an increase, or respectively a decrease in intercanine width during treatment tends to result in a net increase, or respectively a net decrease.
No relationship between the changes which occur following treatment and the changes between the initial and final examination could be shown.
Correlations of maxillary intercanine width. The correlation coefficients between changes in maxil lary intercanine width, are given in Table 7.2.
The correlation coefficient between changes of maxi l lary intercanine width in the treatment and the posttreatment periods was significant. I t indicates when analysed with the means and standard deviations, that an increase in intercanine width in the treatment period is associated with a decrease in the posttreatment period. Similarly, a decrease in the treatment period is associated with an increase in the posttreatment period. A tendency to return to the original width is obvious.
The correlation coefficient between the changes in maxil lary intercanine width during the treatment period and the changes between the initial and final examination was significant. The correlation coefficient when evaluated with the means and standard deviations, indicates that a large, respectively smal l increase during treatment is associated with a large, respectively small increase between initial and final examinations.
The correlation coeffic ient between changes in the posttreatment period and the changes between in itial and final examinations was not significant.
7.3.2. Anterior dental arch circumference
Table 7.1 shows the mean values and distribution of individual values.
Changes in mandibular anterior dental arch circumference. During the treatment period, the mean length of the circumference increased significantly by 2.78 mm, standard deviation 2.01 mm. The largest individual increase of circumference was 7 .7 mm and the smallest decrease 0.5 mm. I n the posttreatment period a significant mean decrease was found of 1 .94 mm, standard deviation 1 .24. The largest decrease
64
2 6
3
2
E E 0
• • C\1 -1 I •
C') .. - 2 • • • • Q)
0 c: - 3 • ... Q) '- • Q) - 4 'E ::J · 5 !: G - 6
-7 3
-7 -6 -5 -4 -3 -2 _, 0 3 5 6
Circumference 2 - 1 (mm)
Figure 7 .3. The scatter diagram illustrates the distribution o f points denoting individual treat
ment and posttreatment changes of the mandibular anterior dental arch circum
ference.
was 4.8 mm and the largest increase was 0.5 mm. F inally it was found that a significant mean increase in the length of the circumference occurred between initial and final examinations. The mean increase was 0.84 mm, standard deviation 1 .85 mm and the range was from -3. 1 mm to 5.5 mm.
Changes in maxillary anterior dental arch circumference. I n the treatment period, the mean circumference of the maxil lary dental arch increased significantly. The mean value was 2.88 mm, standard deviation 3.23. The range was from a decrease of -3.6 mm to an increase of 8.6 mm. In the posttreatment period, a significant mean decrease was found. The mean decrease was 1 .00 mm, standard deviation 1 .24 mm and range was from a decrease of 2.9 mm, to an increase of 1 .5 mm. F inally, a significant mean increase in circumference between initial and final examinations was observed. A mean increase of 1 .88 mm was found, standard deviation 2 .59, and a range from -3.6 mm to 6.6 mm.
Correlations of mandibular anterior dental arch circumference. The correlation coefficients are shown in Table 7 .2. The correlation coefficient between changes of
65
circumference in the treatment period and posstreatment periods was found to be significant. I t indicates when evaluated with the mean changes and their standard deviations that there was a tendency for an increase in the circumference during treatment to be associated with a decrease in the circumference after treatment. A tendency to return to the original circumference is obvious. The scatter diagram ( F igure 7.3) i l lustrates the distribution of the individual points.
Quadrant 1 . I n no instance was an increase in the lenght of the circumference during treatment followed by an increase after treatment.
Quadrant 2 . One point. I n one case a n increase in arch circumference during treatment was followed by a slight increase after treatment.
Quadrant 3 . One point. A decrease occurred during treatment followed by a further decrease.
Quadrant 4. 27 points. In 27 cases an increase in the circumference occurred during treat
ment and a subsequent decrease after treatment. The ten points below the z-axis
represent cases in which the posttreatment decrease was greater than the treat
ment increase, i .e. in these cases the circumference decreased in length between
the initial and final examinations. I n the remaining 1 7 cases the circumference increased between the initial and final examination.
The correlation coefficient, between changes of circumference in the treatment period and the changes between the initial and final examination was significant. I t indicates when evaluated with the respective mean and standard deviations that a large increase during treatment of the circumference is associated with a net increase between in itial and final examinations. Again, the tendency to return to the original dimension is obvious.
The correlation coefficient, between changes in the posttreatment period and the changes between the initial and final examinations was not significant.
Correlations of maxillary anterior dental arch circumference. The correlation coefficient between treatment and posttreatment changes of the ci rcumference was significant. It indicates when considered with the mean values and standard deviations that an increase, respectively a decrease during treatment in the circumference, is associated with an increase, respectively a decrease in the posttreatment period.
The correlation coefficient between treatment changes and the changes occurring between in itial and final examinations was significant. It indicates when evaluated with the mean values and standard deviations that an increase, respectively a decrease in the treatment period, is related to an increase, respectively a decrease between the in itial and final examination.
F ina l ly, the correlation coefficient between the changes in the .posttreatment
period and the changes between the initial and final examination was not found sign ificant.
66
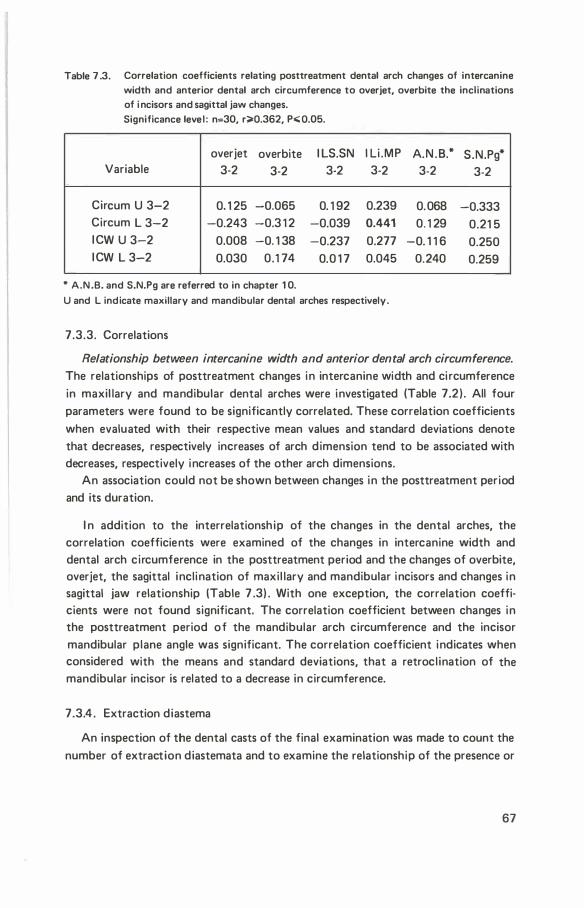
Table 7 .3. Correlation coefficients relating posttreatment dental arch changes of intercanine width and anterior dental arch circumference to overjet, overbite the inclinations of i ncisors and sagittal jaw changes. Significance level : n=30, r;;.Q.362, P.;; Q.05.
overjet overbite I LS.SN l li .MP A.N .B.* S.N.Pg* Variable 3-2 3-2 3-2 3-2 3-2 3-2
Circum U 3-2 0. 1 25 -0.065 0. 1 92 0.239 0.068 -0.333 Circum L 3-2 -0.243 -0.3 1 2 -0.039 0.441 0. 1 29 0.21 5 I CW U 3-2 0.008 -0. 1 38 -0.237 0.277 -0. 1 1 6 0.250 I CW L 3-2 0.030 0.1 74 0.0 1 7 0.045 0.240 0.259
* A.N .B. and S.N.Pg are referred to in chapter 1 0.
U and L indicate maxillary and mandibular dental arches respectively.
7.3.3. Correlations
Relationship between intercanine width and anterior dental arch circumference.
The relationships of posttreatment changes in intercanine width and ci rcumference in maxil lary and mandibular dental arches were investigated (Table 7.2) . All four parameters were found to be significantly correlated. These correlation coefficients when evaluated with their respective mean values and standard deviations denote that decreases, respectively increases of arch dimension tend to be associated with decreases, respectively increases of the other arch dimensions.
An association could not be shown between changes in the posttreatment period and its duration.
I n addition to the interrelationsh ip of the changes in the dental arches, the correlation coefficients were examined of the changes in intercanine width and dental arch circumference in the posttreatment period and the changes of overbite, overjet, the sagittal inclination of maxil lary and mandibular incisors and changes in sagittal jaw relationship (Table 7 .3) . With one exception, the correlation coefficients were not found significant. The correlation coefficient between changes in the posttreatment period of the mandibular arch circumference and the incisor mandibular plane angle was significant. The correlation coefficient indicates when considered with the means and standard deviations, that a retrocl ination of the mandibular incisor is related to a decrease in circumference.
7 .3.4 . Extraction diastema
An inspection of the dental casts of the final examination was made to count the number of extraction diastemata and to examine the relationship of the presence or
67

Table 7 .4 The table i l lustrates the number of dental casts with or without extraction diastemata and the relationship to crowding.
Mandible Maxilla
Variable crowding no crowding crowding no crowding
Extraction diastema present 6 2 4 9 Extraction d iastema absent 1 6 6 1 0 7
absence of extraction diastemata to crowding in the anterior dental arch. The findings are shown in Table 7.4.
Mandibular dental arch. In the mandibular arch, extraction diastemata were found in eight cases. In two cases the diastemata were bilateral and in six uni latera l . In 22 cases crowding was present: in s ix of these cases in association with a dia· stem a and in 1 6 cases there was no diastema present. I n eight cases there was no crowding: in two of these cases extraction diastemata were present and in six cases there was no diastema. There appears to be no association between the presence or absence of a d iastema and crowding.
Maxillary dental arch. In the maxi l laty arch, extraction diastemata were found i n 1 3 cases. I n nine cases the diastemata were bilateral and in four cases uni lateral. Crowding was present in 14 cases: in four of these cases extraction diastemata were present and in ten cases they were absent. I n 1 6 cases there was no crowding: in seven cases there was no extraction diastema and in nine cases they were present. There is no obvious relationship between the presence or absence of a diastema and crowding.
7.4. Discussion
The intercanine width. The mandibular intercanine width decreased in the post· treatment period irrespective of whether an increase or decrease occurred in the treatment period. I n only one instance was a posttreatment increase in intercanine width observed. I n this case a decrease in intercanine width occurred during treat· ment. Further, the relationship between changes in the treatment and post· treatment period was significant, indicating a relapse tendency. The mean change in mandibular intercan ine width between the initial and final examination was not found to be significant. However, it is of note that in individual cases, an increase or decrease in mandibular intercanine width occurred. No directly obvious explanation could be found for such different responses.
The mean maxi l lary intercanine width tended to decrease in the posttreatment
68
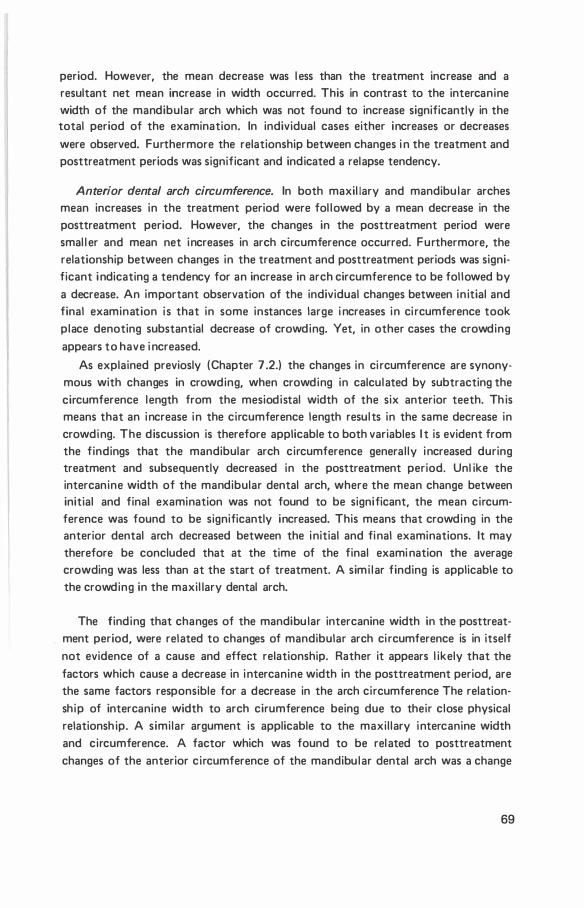
period. However, the mean decrease was l ess than the treatment increase and a resultant net mean increase in width occurred. This in contrast to the intercanine width of the mandibular arch which was not found to increase significantly in the total period of the examination. In individual cases either increases or decreases
were observed. Furthermore the relationship between changes i n the treatment and posttreatment periods was significant and indicated a relapse tendency.
Anterior dental arch circumference. In both maxil lary and mandibu lar arches mean increases in the treatment period were fol lowed by a mean decrease in the posttreatment period. However, the changes in the posttreatment period were smal l er and mean net increases in arch circumference occurred. Furthermore, the relationship between changes in the treatment and posttreatment periods was significant i ndicating a tendency for an increase in arch circumference to be fol lowed by a decrease. An important observation of the individual changes between in itial and final examination i s that in some instances large i ncreases in ci rcumference took place denoting substantial decrease of crowding. Yet, in other cases the crowding appears to have i ncreased.
As explained previosly (Chapter 7 .2.) the changes in ci rcumference are synonymous with changes in crowding, when crowding in calculated by subtracting the circumference length from the mesiodistal width of the six anterior teeth. Th is means that an increase in the circumference length results in the same decrease in crowding. The discussion is therefore applicable to both variables I t is evident from the findings that the mandibular arch circumference general ly increased during treatment and subsequently decreased in the posttreatment period. Unl ike the intercanine width of the mandibular dental arch, where the mean change between initial and final examination was not found to be significant, the mean circumference was found to be significantly increased. This means that crowding in the anterior dental arch decreased between the initial and final examinations. It may therefore be concluded that at the time of the final exami nation the average crowding was less than at the start of treatment. A simi lar finding is applicable to the crowding in the maxil lary dental arch.
The finding that changes of the mandibu lar intercanine width in the posttreatment period, were related to changes of mandibular arch ci rcumference is in itself not evidence of a cause and effect relationship. Rather it appears l ikely that the factors which cause a decrease in intercanine width in the posttreatment period, are the same factors responsible for a decrease in the arch circumference The relationship of intercanine width to arch cirumference being due to their close physical relationsh ip. A similar argument is applicable to the maxil lary intercanine width and circumference. A factor which was found to be related to posttreatment changes of the anterior circumference of the mandibu lar dental arch was a change
69
in incl ination of the mandibu lar incisors: a retrocl ination of incisors procl ined during treatment resulted i n a decrease in circumference. No other factors could be found which were l ikely to cause a decrease in circumference.
There were few extraction diastemata present in the mandibular arch at the final examination and there is no indication that crowding is less when extraction diastemata are present. There were a larger number in the maxi l l ary arch but there was also no indication that crowding was less when these diastemata were present .
• Earl ier studies on arch width by Walter ( 1 953, 1 962) and Arnold ( 1 963), indicate
that in treatment with the Edgewise technique, arch width, increased during treatment, tends to decrease after the end of treatment. Riedel ( 1 969) , reviewed the l iterature on studies of relapse in orthodontical ly treated malocclusions. R iedel states: " I n almost every instance mandibular intercanine width tended to return to or maintain the orgina l dimensions after a l l retaining appl iances had been removed
for several years". The findings of the present investigation general ly confirm this statement.
D iverse factors have been suggested by various investigators to explain the relapse of crowding.
Nance ( 1 947) studied extensively the results of extraction and non-extraction treatment. He found that when expansion in sagittal or transverse direction occurred during treatment the result was unstable. Nance concluded that it was necessary to extract teeth to obtain a correct inclination of the incisors. He felt that th is would produce a stable result. Begg ( 1 965) and Graber ( 1 966), however, hold contradictory views.
Begg ( 1 965) also advocates tooth extraction to correct crowding and rotations but recognises that notwithstanding the extraction of first premolars and the distal movement of the canines some form of relapse occurs. Begg found that relapse is caused by a lack of interproximal attrition and the tendency of teeth to migrate mesial ly .
Graber ( 1 966) makes the point that irrespective of whether or not teeth are extracted, crowding tends to occur after treatment. Graber proposes two explana
tions for the relapse tendency: 1 . the predominance of the morphogenetic pattern overriding the treatment results; 2. an imbalance in muscular pressures in Class I cases treated by dental arch expan
sion. In addition to the above, it is of note that Bjork ( 1 969,1 972) found that crow
ding in the mandibular dental arch is associated with extreme forms of mandibular rotation in non treated subjects. Moreover, longitudinal studies (Sil l man 1 964, and Knott 1 972) and cross sectional studies ( Lovell and Foster 1 969) of non treated subjects indicate that l ittle or no significant change can be expected in intercanine width after the eruption of the permanent canines or 1 2 years of age.
70

With current methods of treatment, premolars are frequently extracted to treat crowding and rotations of incisors and canines. In the present study, it has beeen found that, in both mandible and max i l la in the posttreatment period the mean anterior dental arch circumference tends to decrease and hence crowding increases despite the extraction of four fi rst premolars. However, a slight mean increase in circumference, and hence a sl ight decrease in crowding occurred between initial and final examinations. Moreover in some cases a net increase in circumference was observed whi le in others a net decrease occurred. It is clear that not every case fol lows the mean pattern and hence the decision to extract teeth cannot be based on general ised findings. A multifactorial complex appears to be related to the
problem of crowding. It is suggested that the indication for the extraction of teeth for the treatment of crowding should be reappraised on the basis of further investigation.
71
chapter 8
direction of condylar growth
8.1 . Introduction
Bjork ( 1 955, 1 963, 1 969) recognised that the study of dento-facial changes using lateral cephalometric radiographs,without the use of fixed reference points, was an unrel iable method. He, therefore, introduced metal l ic implants into the jaws of children to serve as such. To study the growth of the mandible, lateral cephalo· metric radiographs were compared by orientating the radiographs so that implants in the mandible were superimposed. He found that the direction of growth of mandibular condyles was variable. I n some instances it took place in a vertical direction and in others, in a sagittal direction. Furthermore, it was found that with vertical condylar growth, resorption at the angle of the mandible occurred, whereas, in sagittal growth, resorption was found to be less or an apposition was observed. Apposition also occurred below the symphysis of the mandible, and was greatest in cases of vertical condylar growth.
Using the implant method Bjork and Skieller ( 1 972) investigated the possible relation between d irection of condylar growth and changes of the mandibular plane incl ination. They found a significant correlation between the di rection of condylar growth and overbite, and di rection of condylar growth and changes of mandibular plane incl ination. No relation could be demonstrated between overbite and mandibul ar plane incl ination.
While using metal l ic implants to superimpose mandibles, Bjork observed that a number of structures in the mandible (Chapter 2.3.7.) were relatively stable during the growth period and that these structures could be used as reference structures. This method is named the structural method of superimposition.
I n the present investigation the direction of condylar growth and the change in incl ination of the mandibular plane were investigated by means of the structural method. The measurements were made to determine the relationship between
72
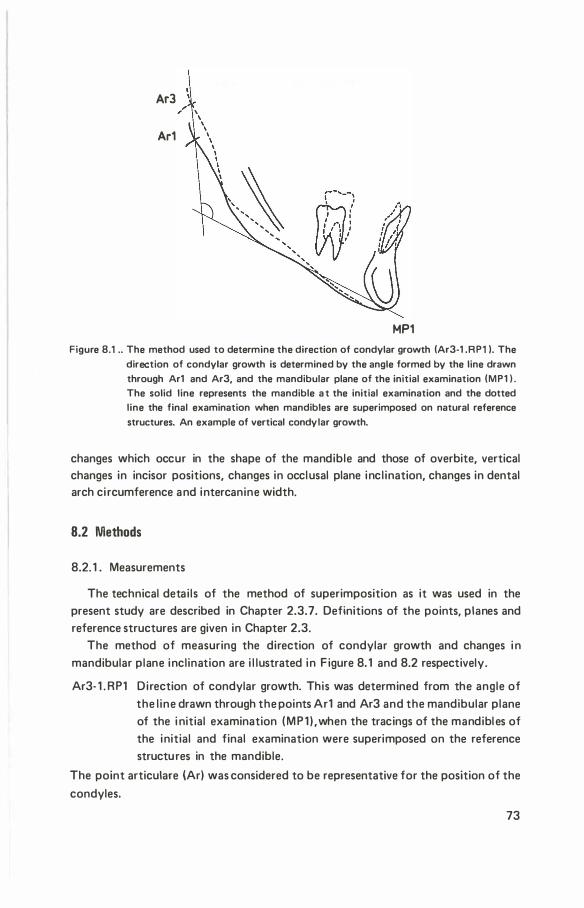
Ar3
Ar1
MP1 Figure 8.1 .. The method used to determine the direction of condylar growth (Ar3-1 .RP1 ). The
direction of condylar growth is determined by the angle formed by the line drawn through Ar1 and Ar3, and the mandibular plane of the initial examination (MP1 I . The solid line represents the mandible a t the initial examination and the dotted line the final examination when mandibles are superimposed on natural reference structures. An example of vertical condylar growth.
changes which occur in the shape of the mandible and those of overbite, vertical changes in incisor positions, changes in occlusal plane incl ination, changes in dental arch ci rcumference and intercanine width.
8.2 Methods
8.2. 1 . Measurements
The technical detai ls of the method of superimposition as it was used in the present study are described in Chapter 2.3.7. Definitions of the points, planes and reference structures are given in Chapter 2.3.
The method of measuring the direction of condylar growth and changes i n mandibular plane inclination are i l lustrated in F igure 8. 1 and 8.2 respectively.
Ar3- 1 . RP1 Direction of condylar growth. This was determined from the angle of the l ine drawn through the points Ar1 and Ar3 and the mandibular plane of the i nitial examination (MP1 ) ,when the tracings of the mandibl es of the initial and final examination were superimposed on the reference structures in the mandible.
The point articulare (Ar) was considered to be representative for the position of the
condyles.
73
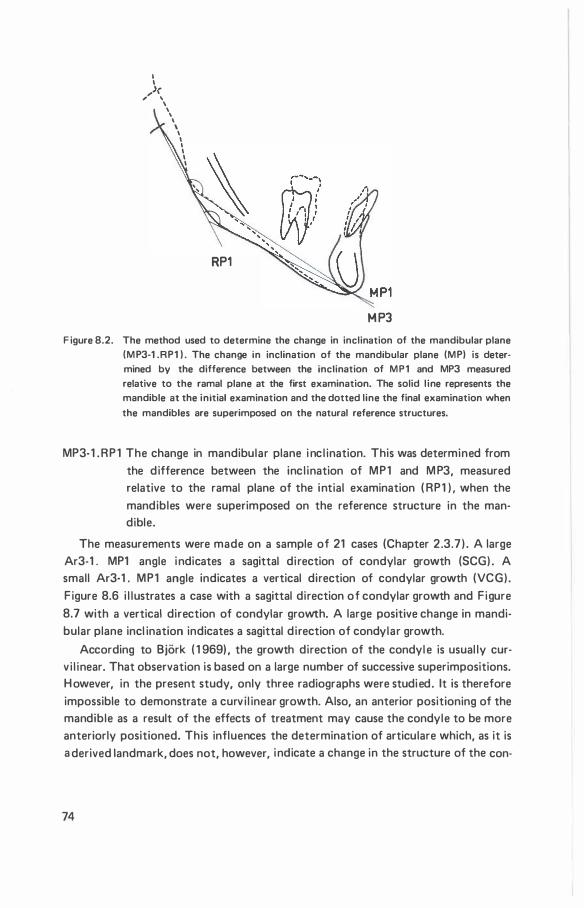
I I
,,_..>(, \
\ ' ' \ I I I I I I
RP1
M P3 F igure 8.2. The method used to determine the change in inclination of the mandibular plane
(MP3-1 .RP1 ) . The change in inclination of the mandibular plane (MP) is determined by the difference between the inclination of MP1 and MP3 measured relative to the ramal plane at the first examination. The solid l ine represents the mandible at the initial examination and the dotted line the final examination when
the mandibles are superimposed on the natural reference structures.
MP3-1 .RP1 The change in mandibular plane i nc l ination. This was determined from the difference between the inc l ination of MP1 and M P3, measured relative to the ramal plane of the intial examination ( RP1 ) . when the mandibles were superimposed on the reference structure in the mandible.
The measurements were made on a sample of 21 cases (Chapter 2.3.7 ) . A large Ar3-1 . MP1 angle indicates a sagittal di rection of condylar growth (SCG) . A small Ar3-1 . MP1 angle indicates a vertical direction of condylar growth (VCG) . F igure 8.6 i l lustrates a case with a sagittal direction of condylar growth and Figure 8.7 with a vertical direction of condylar growth. A large positive change in mandibular plane incl ination indicates a sagittal d irection of condylar growth.
According to Bjork ( 1 969) , the growth direction of the condyl e is usual ly curv i l inear. That observation is based on a large number of successive superimpositions. H owever, in the present study, only three radiographs were studied. It is therefore impossible to demonstrate a curv i l inear growth. Also, an anterior positioning of the mandible as a result of the effects of treatment may cause the condyle to be more anteriorly positioned. This influences the determination of articulare which, as it is a derived landmark, does not, however, indicate a change in the structure of the con-
74
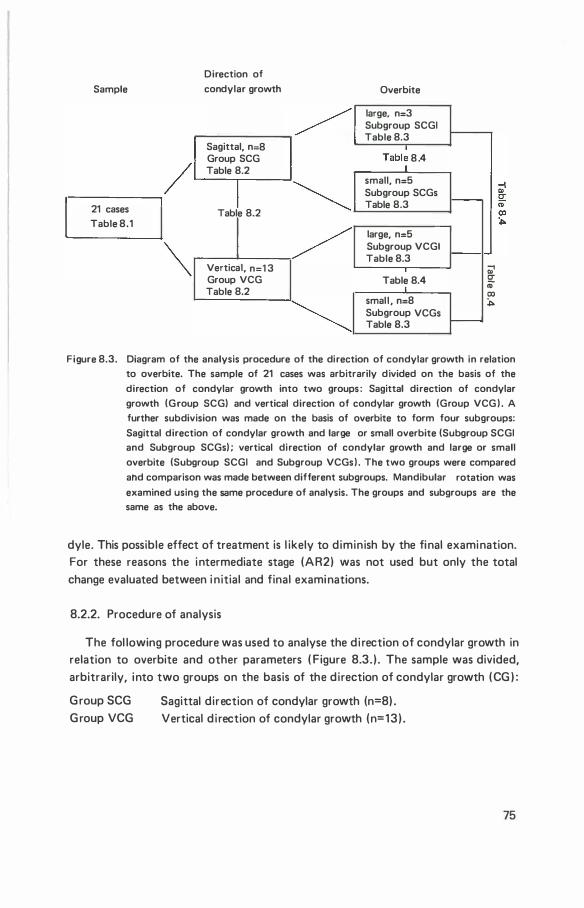
Direction of
Sample condylar growth Overbite
/ large, n=3 Subgroup SCGI Table 8.3
Sagittal, n=8
/ Group SCG Table 8.2
I � 21 cases Table 8.2
Tabl� 8 .4
small, n=5 Subgroup SCGs 1----Table 8.3
Table 8.1
/ � Vertical, n=1 3
Group VCG Table 8.2
�
large, n=5 Subgroup VCGI Table 8.3
Q;1 Table 8.4 !;!:
"' 00
smal l , n=8 :,. Subgroup VCGs
f---Table 8.3
Figure 8.3. Diagram of the analysis procedure of the direction of condylar growth in relation to overbite. The sample of 21 cases was arbitrarily divided on the basis of the
direction of condylar growth into two groups : Sagittal direction of condylar
growth (Group SCG) and vertical direction of condylar growth (Group VCG ) . A further subdivision was made on the basis of overbite to form four subgroups:
Sagittal direction of condylar growth and large or small overbite (Subgroup SCGI and Subgroup SCGs) ; vertical direction of condylar growth and large or small
overbite (Subgroup SCGI and Subgroup VCGs ) . The two groups were compared
alld comparison was made between different subgroups. Mandibular rotation was
examined using the same procedure of analysis. The groups and subgroups are the same as the above.
dyle. This possible effect of treatment is l ikely to diminish by the final examination. For these reasons the intermediate stage (AR2) was not used but only the total change evaluated between i nitial and final examinations.
8.2.2. Procedure of analysis
The fol lowing procedure was used to analyse the di rection of condylar growth in relation to overbite and other parameters ( Figure 8.3. ) . The sample was divided, arbitrarily, into two groups on the basis of the direction of condylar growth (CG ) :
G roup SCG G roup VCG
Sagittal direction of condylar growth (n=8) . Vertical d i rection of condylar growth (n=13) .
75
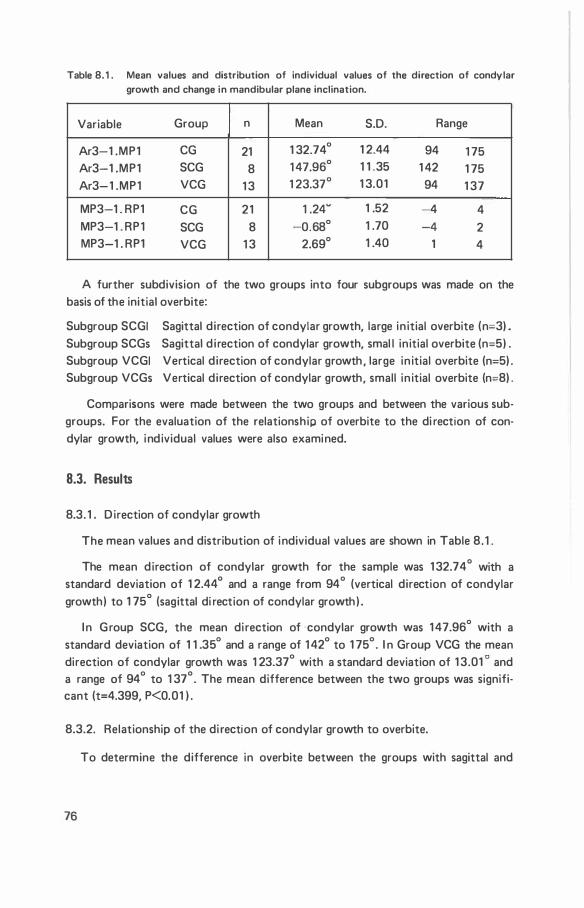
Table 8. 1 . Mean values and distribution of individual values of the direction of condylar growth and change in mandibular plane inclination.
Variable Group n Mean S.D. Range
Ar3-1 .MP1 CG 21 1 32.74° 1 2.44 94 1 75 Ar3-1 .MP1 SCG 8 1 47.96° 1 1 .35 1 42 1 75 Ar3-1 .MP1 VCG 1 3 1 23.37° 1 3.01 94 1 37
MP3-1 . RP1 CG 21 1 .24� 1 .52 -4 4 MP3-1 . RP1 SCG 8 -0.68° 1 .70 -4 2 MP3-1 . RP1 VCG 1 3 2.69° 1 .40 1 4
A further subdivision of the two groups into four subgroups was made on the basis of the initial overbite:
Subgroup SCGI Sagittal direction of condylar growth, large in itial overbite (n=3) . Subgroup SCGs Sagittal d i rection of condylar growth, smal l initial overbite (n=5) . Subgroup VCGI Vertical direction of condylar growth, large in itial overbite (n=5) . Subgroup VCGs Vertical direction of condylar growth, small in itial overbite (n;:;:8) .
Comparisons were made between the two groups and between the various sub· groups. For the evaluation of the relationship of overbite to the di rection of con· dylar growth, individual values were also examined.
8.3. Results
8.3. 1 . D irection of condylar growth
The mean values and distribution of individual values are shown in Table 8 . 1 .
The mean direction of condylar growth for the sample was 1 32.74° with a standard deviation of 1 2.44° and a range from 94° (vertical direction of condylar growth) to 1 75° (sagittal di rection of condylar growth) .
I n G roup SCG, the mean di rection of ·condylar growth was 1 47.96° with a standard deviation of 1 1 .35° and a range of 1 42° to 1 75°. I n Group VCG the mean direction of condylar growth was 1 23.37° with a standard deviation of 1 3.01 ° and a range of 94° to 1 37°. The mean difference between the two groups was signifi· cant (t=4.399, P<0.01 ) .
8.3.2. Relationship of the di rection of condylar growth to overbite.
To determine the difference in overbite between the groups with sagittal and
76
Table 8.2. Mean values and distribution of individual values of overbite for the two groups
with a sagittal direction of condylar growth (Group SCG) and a vertical direction of condylar growth (Group VCG ) . The significance of the mean differences between the two groups was evaluated using the t-test.
Significance level; n=21 ,t>2.080,P..:0.05.
Group SCG Group VCG Variable Mean S.D. Mean S.D. t Sign
Overbite 1 3.6 mm 1 .6 3.2. mm 1 .8 0.531 NS Overbite 2-1 -2.3 mm 1 .8 -1 .3 mm 1 .6 1 .245 NS Overbite 2 1 .3 mm 0.6 1 .8 mm 0.8 1 .558 NS Overbite 3-2 1 .9 mm 0.8 1 .2 mm 1 .8 1 . 146 NS Overbite 3 3.2 mm 0.6 3.0 mm 1 .7 0.234 NS Overbite 3-1 -0.4 mm 2.0 -0.2 mm 1 .0 0.405 NS
vertical di rections of condylar growth (Group SCG and Group VCG) , the mean values of overbite for the successive stages of the investigation were calculated for each group (Table 8.2. ) . The t-test was applied to evaluate the significance of the mean difference between the two groups. The results show that at no stage of the examination was the mean difference between the two groups significant.
A further analysis of the relationship of the d irection of condylar growth to overbite was carried out by a comparison of the subgroups. The data of ind ividual values in each subgroup are l i sted in Table 8.3 and the comparison of the various subgroups in Table 8.4.
Large initial overbite. The mean values of overbite of the two subgroups (Subgroup SCGI and VCGI ) with a sagittal or vertical d i rection of condylar growth and a large overbite were compared.
At the in itial examination, the mean difference in overbite between the two subgroups was not significant. 8t the end of treatment the mean overbite was significantly smaller in the subgroup with sagittal direction of condylar growth than in the subgroup with a vertical di rection of condylar growth. The mean overbite in the subgroup with sagittal direction of condylar growth was 0.8 mm, with a standard deviation of 0.6 mm, whi le in the subgroup with vertical condylar growth the mean overbite was 2 .4 mm and the standard deviation 0.7 mm.
At the final examination, the mean overbite was again significantly smal ler in the subgroup with sagittal direction of condylar growth. This mean value was 2.6 mm with a standard deviation of 0.3 mm whi le the mean value of the overbite in the subgroup with vertical d irection of condylar growth was 4.8 mm with a standard deviation of 1 .2 mm.
77
Table 8.3 Mean values and the individual values of the sample of 21 cases divided into four subgroups according to the direction of condylar growth and the initial overbite.
( Direction of condylar growth in degrees, overbite in mml .
Case
4251 4799 3269
Mean S.D.
Case
3 1 70 4445 3473 3430 361 4
Mean S.D.
Case
4657 3724 4246 4243 521 1
Mean S.D.
Case
3470 4697 4923 5076 5074 5 1 70 3679 501 3
Mean S.D.
78
Subgroup SCGI Sagittal direction of condylar growth and large initial overbite.
Subgroup SCGs Sagittal direction of condylar growth and small initial overbite.
Subgroup VCGI Sagittal direction of condylar growth and large initial overbite. Subgroup VCGs Sagittal direction of condylar growth and small initial overbite.
Subgroup SCGI
Ar3-1 .MPI 06 1 06 2- 1 06 2 06 3-2 06 3 06 3-1
1 5 1 7 .1 -5.5 1 .5 0.7 2.2 -4.8 1 43 3.9 -3.6 0.3 2.4 2.7 - 1 .2 1 45 4.4 -3.7 0.7 2.3 3.0 - 1 .5
1 45.6 5. 1 -4.2 0.8 1 .7 2.6 -2.5 1 .6 1 .0 0.6 0.9 0.3 2.0
Subgroup SCGs
Ar3-1 .MPI 06 1 06 2-1 06 2 06 3-2 06 3 06 3-1
1 42 3.4 -2.0 1 .4 2.7 4.1 0.7 1 42 2.7 - 1 .3 1 .4 1 .5 2.9 0.2 1 41 3.1 -0.6 2.6 0.5 3.1 0.0 1 45 2.6 -1 .5 1 . 1 2.7 3.8 1 .2 1 75 1 .9 -0.2 1 .7 1 .7 3.5 1 .6
1 49.0 2.7 -1 .0 1 .6 1 .8 3.4 0.7 0.5 0.7 0.5 0.9 0.5 0.6
Subgroup VCGI
Ar3- 1 .MPI 06 1 06 2-1 06 2 06 3-2 06 3 06 3-1
1 37 5.4 -1 .8 3.6 1 .8 5.3 -0.1 1 1 4 4.8 -1 .9 2.9 1 .5 4.4 -0.4 1 26 4.6 -2.9 1 .8 2.8 4.6 0.0 1 1 6 6.1 -4.1 1 .9 2.8 6.6 0.5 1 1 3 4.9 -2.7 2.2 0.9 3.1 -1 .8
1 21 .2 5.1 -2.6 2.4 2.3 4.8 -0.3 0.5 0.9 0.7 1 .4 1 .2 0.8
Subgroup VCGs
Ar3-1 .M PI 06 1 06 2- 1 06 2 06 3-2 06 3 06 3-1
94 3.0 -0.9 2.1 -1 .3 0.8 -2.2 1 38 0.5 1 .1 1 .6 0.1 1 .7 1 .2 1 20 3.1 - 1 .4 1 .7 1 .3 3.1 0.0
1 34 3.7 -2.4 1 .3 1 .3 1 .5 -0.8 1 1 9 2.3 - 1 .7 0.6 0.9 1 .5 -0.8 1 20 0.6 1 .0 1 .6 -0.9 1 .5 0.1 1 37 0.9 1 .6 2.6 -0.5 2.1 1 . 1 1 36 1 .6 - 1 .1 0.6 1 .7 2.3 0.6
1 24.8 1 .9 -0.4 1 .5 -0.3 1 .8 -0. 1
1 .2 1 .4 0.6 1 .1 0.8 1 . 1
Table 8.4. Comparison of overbite between the four different subgroups. Significance levels: n=8. t;>2.447, P<;0.05; t;>3.707, P<;0.01 . n=1 3, t;>2.201 , P<;0.05; t;>3.01 2, P<;0.01 .
Subgroup SCGI Subgroup VCGI (n=3l (n=5l
Variable Mean S.D. Mean S.D. t Sign
Overbite 1 5.1 mm 1 .6 5.1 0.5 0.020 NS Overbite 2-1 -4.2 mm 1 .0 -2.6 0.9 2.260 NS Overbite 2 0.8 mm 0.6 2.4 0.7 3.126 P<0.05 Overbite 3-2 1 .7 mm 0.9 2.3 1 .4 0.548 NS Overbite 3 2.6 mm 0.3 4.8 1 .2 2.749 P<0.05 Overbite 3-1 -2.6 mm 2.0 -0.3 0.8 2.1 55 NS
Subgroup SCGI Subgroup SCGs (n=3l (n=5l
Variable Mean S.D. Mean S.D. t Sign
Overbite 1 5.1 mm 1 .6 2.7 0.5 3.049 P<0.05 Overbite 2-1 -4.2 mm 1 .0 - 1 .0 0.7 5.1 77 P<0.01 Overbite 2 0.8 mm 0.6 1 .6 0.5 1 .858 NS Overbite 3-2 1 .7 mm 0.9 1 .8 0.9 0.064 NS Overbite 3 2.6 mm 0.3 3.4 0.5 2 .449 P<0.05 Overbite 3-1 -2.6 mm 2.0 0.7 0.6 3.461 P<0.05
Subgroup VCGI Subgroup VCGs (n=5l (n=8l
Variable Mean S.D. Mean S.D. t Sign
Overbite 1 5.1 mm 0.5 1 .9 1 .2 5.324 P<0.01 Overbite 2-1 -2.6 mm 0.9 -0.4 1 .4 2.937 P<0.05 Overbite 2 2.4 mm 0.7 1 .5 0.6 2.343 P<0.05 Overbite 3-2 2.3 mm 1 .4 0.3 1 .1 2.657 P<0.01 Overbite 3 4.8 mm 1 .2 1 .8 0.8 4.886 P<0.01 Overbite 3-1 -0.3 mm 0.8 -0.1 1 .1 0.402 NS
Subgroup SCGs Subgroup VCGs (n=5l ( n=8l
Variable Mean S.D. Mean S.D. t Sign
Overbite 1 2.7 mm 0.5 1 .9 1 .2 1 .247 NS Overbite 2-1 - 1 .0 mm 0.7 -0.4 1 .4 0.862 NS Overbite 2 1 .6 mm 0.5 1 .5 0.6 0.31 6 NS Overbite 3-2 1 .8 mm 0.9 0.3 1 .1 2.383 P<0.05 Overbite 3 3.4 mm 0.5 1 .8 0.8 3.654 P<0.01 Overbite 3-1 0.7 mm 0.6 -0.1 1 .1 1 .476 NS
79
The mean changes between the successive examinations were not found to differ significantly for the two groups.
The individual values of overbite are also of interest as, at the end of treatment the smal lest value of overbite in the subgroup with a sagittal d i rection of condylar growth was 0.3 mm and the largest 1 .5 mm. In contrast, in the subgroup with vertical direction of condylar growth the smal lest overbite was 1 .8 mm and the largest 3.6 mm. At the final examination in the subgroup with sagittal condylar growth the smal lest overbite was 2.2 mm and the largest 3.0 mm. In the group with the vertical d irection of condylar growth the individual overbites were all larger. The smal lest overbite was 3 . 1 mm and the largest 6.6 mm. An example of the treatment of a case with sagittal di rection of condylar growth and deep overbite is shown in Figure 8.6. Figure 8.7 shows a case with vertical di rection of condy lar growth and deep overbite.
Small intial overbite. The mean values of overbite of the two subgroups (Subgroup SCGs and Subgroup VCGs) with sagittal or vertical condylar growth and a small in itial overbite were compared (Table 8.4. ) . At the initial examination the mean difference in overbite between the two subgroups was not significant. Similarly, atthe end of treatment the mean difference was not significant. However, at the final examination the mean overbite in the subgroup with sagittal d i rection of condylar growth was larger than that of the subgroup with vertical di rection of condylar growth .
The mean values of the changes during the treatment period were not significantly different for the two subgroups, nor were the net changes. The increase in the post treatment period was found to be significantly larger in the subgroup with sagittal d irection of condylar growth.
The tables of individual values (Table 8.3.) show that in the subgroup with sagittal d irection of condylar growth, the overbite decreased in al l cases during the treatment period and i ncreased in a l l cases in the posttreatment period. I n al l cases, a net increase in overbite was observed. In the subgroup with vertical condylar growth, the overbite was found to increase in the treatment period in three cases; in two of these it decreased subsequently in the posttreatment period. I n another case the overbite decreased both during the treatment and posttreatment periods. I n the remaining cases, the overbite decreased and subsequently increased. I n this group net increases or decreases were found.
Small and large initial overbite. The mean values of overbite of subgroups with sagittal d irection of condylar growth were compared (Subgroup SCGs and Subgroup SCGI ) . At the end of treatment there was no significant mean difference between the two subgroups. However, at the final examination, the subgroup with small initial overbite was found to have a larger final overbite than the subgroup
80

Table 8.5. Mean values and standard deviations of the distance of the anterior maxillary incisor edge to palatal plane l ls-PP), the distance of anterior mandibular incisor edge to the mandibular plane (I i-MP), and the changes in occlusal plane inclination (0Px1 -x2.RP1 ), for the two subgroups with sagittal or vertical direction of condylar growth and a large initial overbite (Subgroups SCGI and VCGI ) .
Significance level; n=8,t;;>2.447 ,Po;;;Q.05.
Subgroup SCGI Subgroup VCGI n=3 n=5
Variable Mean S.D. Mean S.D. t Sign
ls-PP 2-1 0.8 mm 3.3 1 .0 mm 0.7 0.1 48 NS
ls-PP 3-2 1 . 1 mm 1 .3 1 .4 mm 0.8 0.392 NS
ls-PP 3-1 1 .8 mm 2.2 2.3 mm 1 .1 0.449 NS
l i-MP 2-1 -2.6 mm 2.4 -1 .7 mm 1 .0 0.770 NS
l i-MP 3-2 1 .8 mm 0.8 2.8 mm 1 .3 1 . 1 51 NS
l i -MP 3-1 -0.8 mm 1 .7 1 . 1 mm 1 .8 1 .440 NS
OP2-1 . R P1 5.7° 4.1 6.1 ° 2.0 0.778 NS
OP3-2.RP1 -2.6° 3.6 -2.6° 2.8 0.1 67 NS
OP3-1 . RP1 3 . 1 ° 3.2 3.5° 3.2 1 .2 1 8 NS
with a large initial overbite. This in contrast to the situation found in subgroups with vertical direction of condylar growth (Subgroup VCGI and Subgroup VCGs). Of these two subgroups the mean overbite in the subgroup with large initial overbite was larger at the three examinations.
An inspection of the tables of the individual values show no exceptions (Table 8.3 ) .
8.3.3. Relationship of the d irection of condylar growth to changes in the vertical positions of incisors and occlusal plane inc l ination
To evaluate if in the treatment of a l arge overbite the direction of condylar growth is of relevance to the changes in the occlusal plane and vertical position of incisors, the fol lowing analysis was undertaken. The changes in occlusal plane, the distance of the most anterior maxil lary incisor edge to the palatal plane and the distance of the most anterior mandibular incisor edge to the mandibular plane were compared in the two subgroups with vertical or sagittal di rection of condylar growth and a large initial overbite (Subgroup SCGI and Subgroup VCGI ) . The results are shown in Table 8.5. Table 8.6. shows the individual values in each subgroup.
8 1

Table 8.6. I ndividual changes in the distance of the most anterior maxillary incisor edge to
the palatal plane ( l s-PP). the most anterior mandibular incisor edge to the mandibular plane ( l i-MP) and the occlusal plane (OP) in Groups SCGI VCGI . (Distances in mm, occlusal plane inclination in degrees.)
Subgroup SCGI Subgroup VCGI
ls-PP l s-PP ls-PP Case
2-1 3-2 3-1 ls-PP l s-PP ls-PP
Case 2-1 3-2 3-1
4251 -1 .2 1 . 1 0.1 4657 1 .6 2.1 3.8 4799 4.7 -0.4 4.3 3724 0.9 -0.1 0.8 3269 -1 .2 2.4 1 .2 4246 0.3 1 .9 2.1
4243 1 .9 1 .3 3.2 Mean 0.8 1 . 1 1 .8 521 1 0.3 1 .6 1 .9 S.D. 3.3 1 .3 2.2
Mean 1 .0 1 .4 2.3
S.D. 0.7 0.8 1 . 1
Subgroup SCGI Subgroup VCGI
l i -MP l i-MP l i-MP Case
2-1 3-2 3-1 l i -MP l i-MP l i-MP
Case 2-1 3-2 3-1
4251 -5. 1 2.3 -2.7 4657 -0.2 4.4 4.2 4799 -2.7 2.3 -0.4 3724 -0.9 1 .2 0.2 3269 -0. 1 0.9 0.8 4246 -2.8 2.1 -0.7
4243 -2.6 3.9 1 .3 Mean -2.6 1 .8 -0.8 521 1 -1 .8 2.5 0.7 S.D. 2.4 0.8 1 .7
Mean -1 .7 2.8 1 . 1 S.D. 1 .0 1 .3 1 .8
Occlusal plane. The two subgroups with sagittal and vertical d irection of condylar growth and deep overbite were compared. There was no significant difference between the two subgroups with respect to the mean changes in occlusal plane inclination in the treatment, posttreatment and total periods of the examination. I ndividual values (Table 8.6.) show no exceptional cases.
Distance of the most anterior maxillary incisor edge to the palatal plane. The mean differences in the distance between the two subgroups at various stages of examination were not significant. The tables of ind ividual values show that in the
82
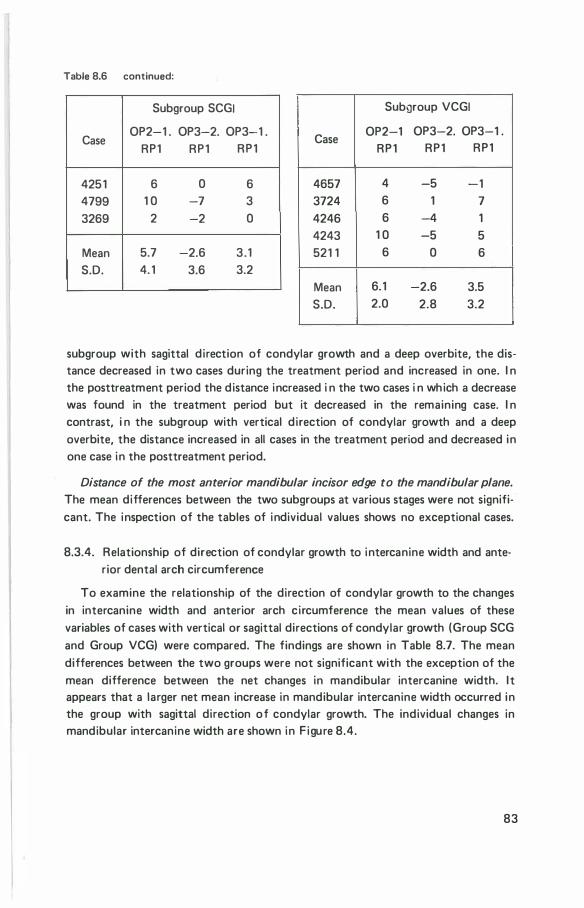
Table 8.6 continued:
Subgroup SCGJ
Case OP2-1 . OP3-2. OP3-1 .
RP1 RP1 RP1
4251 6 0 6 4799 1 0 -7 3 3269 2 -2 0
Mean 5.7 -2.6 3 . 1 S.D. 4. 1 3.6 3.2
Subgroup VCGI
Case OP2-1 OP3-2. OP3-1 .
RP1 RP1 RP1
4657 4 -5 -1 3724 6 1 7 4246 6 -4 1 4243 1 0 -5 5 521 1 6 0 6
Mean 6. 1 -2.6 3.5 S.D. 2.0 2.8 3.2
subgroup with sagittal d irection of condylar growth and a deep overbite, the distance decreased in two cases during the treatment period and increased in one. I n the posttreatment period the distance increased i n the two cases i n wh ich a decrease was found in the treatment period but it decreased in the remaining case. I n contrast, i n the subgroup with vertical d irection of condylar growth and a deep overbite, the distance increased in all cases in the treatment period and decreased in one case in the posttreatment period.
Distance of the most anterior mandibular incisor edge to the mandibular plane.
The mean differences between the two subgroups at various stages were not significant. The inspection of the tables of individual values shows no exceptional cases.
8.3.4. Relationship of direction of condylar growth to intercanine width and anterior dental arch circumference
To examine the relationship of the direction of condylar growth to the changes in intercanine width and anterior arch circumference the mean values of these variables of cases with vertical or sagittal directions of condylar growth (Group SCG and Group VCG) were compared. The findings are shown in Table 8.7. The mean differences between the two groups were not significant with the exception of the mean difference between the net changes in mandibular intercanine width. I t appears that a larger net mean increase in mandibular intercanine width occurred in the group with sagittal direction of condylar growth. The individual changes in mandibular intercanine width are shown in F igure 8.4.
83
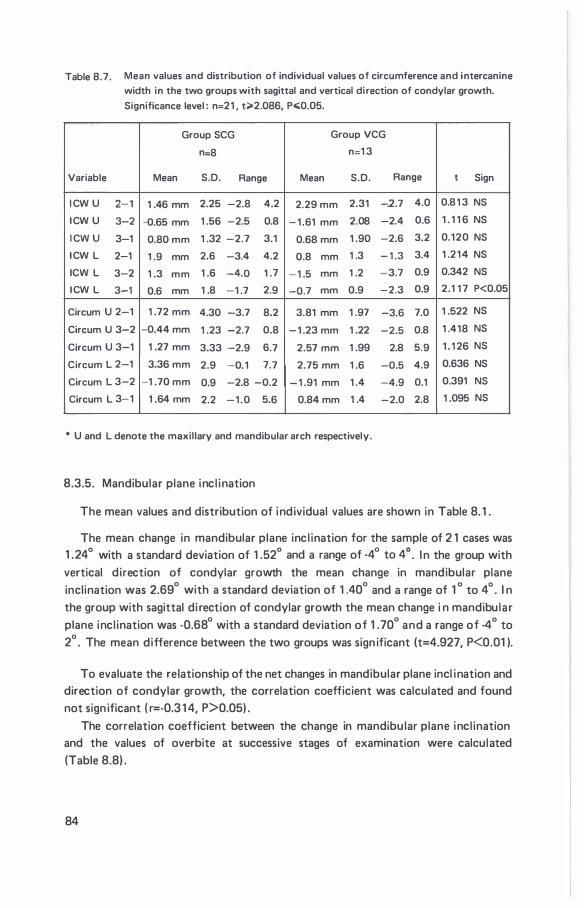
Table 8.7. Mean values and distribution of individual values of circumference and intercanine
width in the two groups with sagittal and vertical direction of condylar growth.
Significance level : n=2 1 , t;;.2.086, P<0.05.
Group SCG Group VCG
n=8 n:1 3
Variable Mean S.D. Range Mean S.D. Range t Sign
I CW U 2- 1 1 .46 mm 2.25 -2.8 4.2 2.29 mm 2.31 -2.7 4.0 0.8 1 3 NS
I CW U 3-2 -0.65 mm 1 .56 -2.5 0.8 - 1 .61 mm 2.08 -2.4 0.6 1 . 1 1 6 NS
I CW U 3-1 0.80 mm 1 .32 -2.7 3.1 0.68 mm 1 .90 -2.6 3.2 0.120 NS
I CW L 2-1 1 .9 mm 2.6 -3.4 4.2 0.8 mm 1 .3 - 1 .3 3.4 1 .2 1 4 NS
ICW L 3-2 1 .3 mm 1 .6 -4.0 1 .7 -1 .5 mm 1 .2 -3.7 0.9 0.342 NS
I CW L 3-1 0.6 mm 1 .8 -1 .7 2.9 -0.7 mm 0.9 -2.3 0.9 2.1 1 7 P<0.05
Circum U 2-1 1 .72 mm 4.30 -3.7 8.2 3.81 mm 1 .97 -3.6 7.0 1 .522 NS
Circum U 3-2 -0.44 mm 1 .23 -2.7 0.8 - 1 .23 mm 1 .22 -2.5 0.8 1 .418 NS
Circum U 3-1 1 .27 mm 3.33 -2.9 6.7 2.57 mm 1 .99 2.8 5.9 1 . 1 26 NS
Circum L 2-1 3.36 mm 2.9 -0. 1 7.7 2.75 mm 1 .6 -0.5 4.9 0.636 NS
Circum L 3-2 -1 .70 mm 0.9 -2.8 -0.2 - 1 .91 mm 1 .4 -4.9 0.1 0.391 NS
Circum L 3-1 1 .64 mm 2.2 - 1 . 0 5.6 0.84 mm 1 .4 -2.0 2.8 1 .095 NS
* U and L denote the maxillary and mandibular arch respectively.
8.3.5. Mandibular plane inc l ination
The mean values and distribution of individual values are shown in Table 8. 1 .
The mean change in mandibular plane incl ination for the sample of 2 1 cases was 1 .24° with a standard deviation of 1 .52° and a range of ·4° to 4° . I n the group with vertical direction of condylar growth the mean change in mandibular plane inclination was 2.69° with a standard deviation of 1 .40° and a range of 1 ° to 4° . I n the group with sagittal di rection of condylar growth the mean change i n mandibular plane incl ination was -0.68° with a standard deviation of 1 . 70° and a range of -4° to 2° . The mean difference between the two groups was sign ificant (t=4.927, P<0.01 ).
To evaluate the relationship of the net changes in mandibular plane incl ination and direction of condylar growth, the correlation coefficient was calculated and found not sign ificant ( r=-0.3 1 4, P>0.05) .
The correlation coefficient between the change in mandibu lar plane incl ination and the values of overbite at successive stages of examination were calculated (Table 8.8) .
84
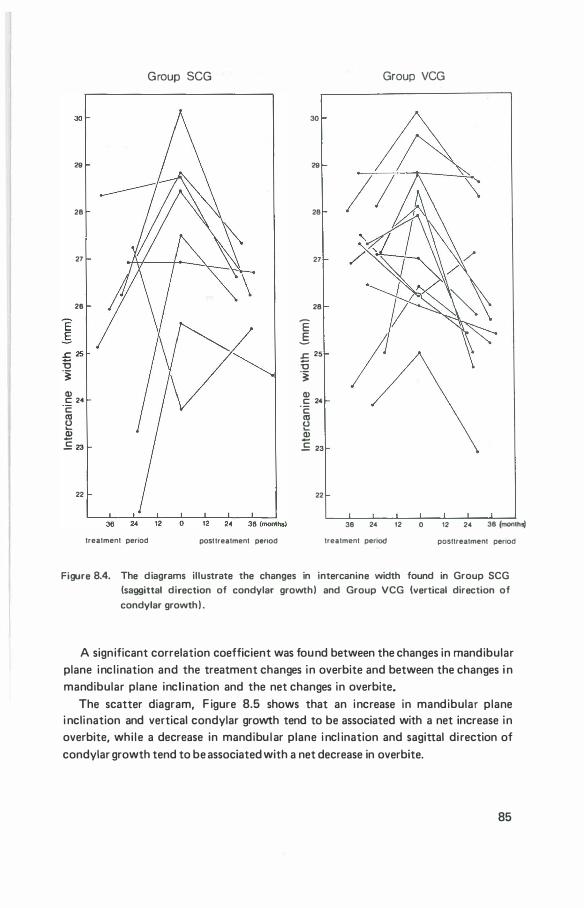
30
28
28
27
26
£ 25 i5 -� Q) c 24 c aJ � Q)
£ 23
22
Group SCG
treatment penod posttreatment penod
30
28
28
27
28
E .5 £ 25
i5 -� Q) c 24
·c: aJ (J .... Q)
£ 23
22
Group VCG
/
36 24 12 0
treatment penod
12 24 36 (mon1hsj
posttreatment penod
Figure 8.4. The diagrams illustrate the changes in intercanine width found in Group SCG (saggittal direction of condylar growth) and Group VCG (vertical direction of
condylar growth) .
A significant correlation coefficient was found between the changes in mandibular plane incl ination and the treatment changes in overbite and between the changes i n mandibular plane incl ination and the net changes in overbite.
The scatter diagram, F igure 8.5 shows that an increase in mandibular plane i nclination and vertical condylar growth tend to be associated with a net increase in overbite, whi le a decrease in mandibu lar plane i ncl ination and sagittal di rection of condylar growth tend to be associated with a net decrease in overbite.
85
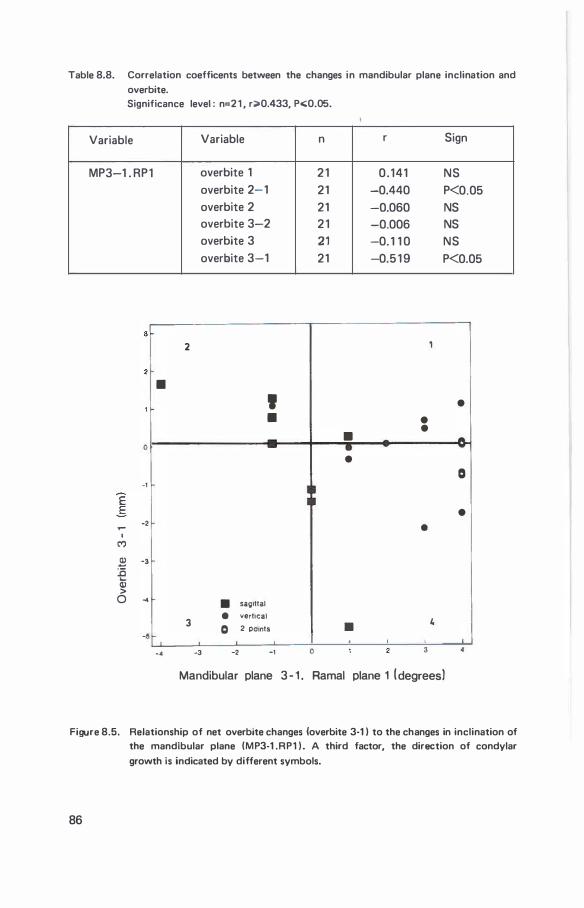
Table 8.8. Correlation coefficents between the changes in mandibular plane inclination and
overbite. Significance level : n=2 1 , r;>0.433, P<:0.05.
Variable
MP3-1 . RP1
.,.... I
C')
0
-1
-2
� -3 :a .... Cll > 0 ...
5
2
•
3
-·
Variable n
overbite 1 2 1 overbite 2-1 21 overbite 2 21 overbite 3-2 2 1 overbite 3 21 overbite 3-1 21
' •
::
• sag11tal • vert1ca1
0 2 POintS
-3 -2 -1 0
r Sign
0 . 141 NS -0.440 P<0.05 -0.060 NS -0.006 NS -0. 1 1 0 NS -0.5 1 9 P<0.05
,
• • • • -•
• 0
• •
• 4
Mandibular plane 3 - 1 . Ramal plane 1 (degrees)
Figure 8.5. Relationship of net overbite changes (overbite 3-1 ) to the changes in inclination of the mandibular plane (MP3-1 .RP1 ) . A third factor, the direction of condylar
growth is indicated by different symbols.
86
8.4. Discussion
Bjork ( 1 960) classified deep overbite as dento-alveolar or basal deep overbite. A dento-alveolar deep overbite results from overeruption of upper and l ower incisors and a vertical overdevelopment of the anterior regions of the maxi l lary and mandibular alveolar arches. A basal deep overbite may arise, by forward rotation of the mandible in relation to the maxil la. He distinguishes three types of forward rota· tion, ( 1 , I I and I l l ) according to the site where the centre of rotation is located. I n Type I , the centre i s at the temporomandibular joints, in Type I I at the incisal edges of the lower incisors and in Type I l l , at the premolars. Bjork ( 1 969) states that a Type I forward rotation resulting in deep overbite may be caused by occlusal imbalance due to l oss of teeth, malocclusion or a powerful musculature. The remaining part of the dentition is then vertical ly unstable and the two dental arches may be pressed into each other. I n Type I I , the incisal occlusion is normal and the centre of rotation is at the incisal edges of the lower i ncisors. No overbite develops in this type. I n the case of an abnormal incisal occlusion, rotation may occur with the centre at the premolars, resulting in the development of a deep overbite (Type I l l ) . I n Type I I and I l l , a more pronounced development of the posterior facial height results in a forward rotation of the mandible. The main cause of the development of the posterior facial height is the vertical ly di rected growth at the mandi· bular condyles (Bjork, 1 969) .
While it is not possible, in retrospect, to determine with certainty the aetiology of the deep overbites in the present investigation, it seems l ikely that cases with a more sagittal di rection of condylar growth were of dento-alveolar type or were deep overbites, with a Type I forward rotation of the mandible. The cases with a vertical direction of condylar growth and a deep overbite probably had a Type I forward rotation or a combination of Types I and I l l .
I n the present study the direction of condylar growth was determined between the initial and final examination. The end of treatment examination was not used for the reasons al ready given. Therefore it is not possible, from th is study, to obtain direct evidence that the di rection of condylar growth was altered as a result of treatment. Several studies with experimental animals (Moffett, 1 97 1 ) have demon· strated that changes in the growth of the condylar cartilages may result from the use of Class I I intermaxi l l ary elastic traction. H owever, we are of the opinion that the duration and intensity of treatment are unl ikely to produce a permanent change in the di rection of condylar growth and thus influence our resul ts.
From the results shown in Tables 8.3 and 8.4, it appears that the response of the deep overbite to treatment differs significantly between the different subgroups (Subgroup SCGI and Subgroup VCGI ) . The overbite in those cases in which a sagittal di rection of growth occurred was significantly smal ler at the end of treat· ment and at the final examination. It therefore appears that the di rection of candy-
87
88

Figure 8.6. The results of treatment in a case with a sagittal direction of condylar growth and a deep overbite (case 425 1 ) . From left to right, are the profile and dental casts of the initial examination, the casts at the removal of the fixed appliance, and
the profile and casts at the final examination. The figure of the superimposition on the SN plane registered at S shows the overall changes. The mandibles, superimposed
on mandibular natural reference structures i l lustrate the vertical direction of condylar growth.
89
90
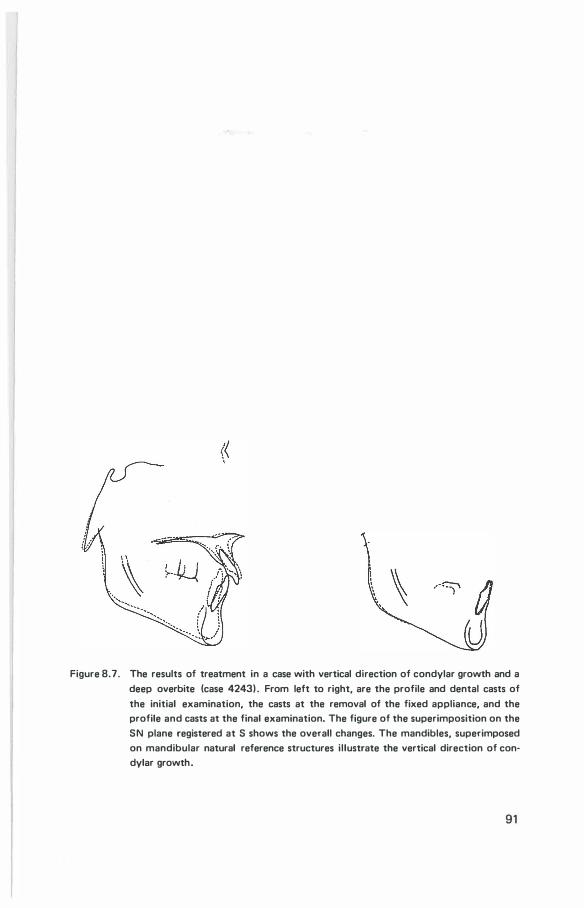
Figure 8.7. The results of treatment in a case with vertical direction of condylar growth and a
deep overbite (case 4243) . From left to right, are the profile and dental casts of
the initial examination, the casts at the removal of the fixed appliance, and the profile and casts at the final examination. The figure of the superimposition on the
SN plane registered at S shows the overall changes. The mandibles, superimposed
on mandibular natural reference structures il lustrate the vertical direction of condylar growth.
91
lar growth may be related to the correction of a deep overbite. Furthermore, the results suggest that the di rection of condylar growth may be of importance in predicting the prognosis of the treatment of deep overbite. The findings on the two subgroups with smal l initial overbites are not consistent with those on subgroups with large overbites. As, the final mean overbites in the subgroup with a vertical di rection of condy lar growth was found to be significantly smal ler than the mean overbite in the subgroup with a sagittal di rection of condylar growth. However, it is noteworthy that only in this subgroup (Subgroup VCGs) were cases found in which overbite increased in the treatment period and decreased in the posttreatment period.
Evidence presented in the l iterature and the results of the present study, ind icate a di rect cause and effect relationship between the di rection of condylar growth and overbite. A relationship between mandibular plane incl ination and overbite was also found. However, it seems unl ikely that there is a di rect causal relation.
The investigation of the vertical changes in occlusal pl ane and the positions in the two subgroups (Subgroup SCGI and Subgroup VCGI) with deep overbites provides further insight into the changes which occur when a deep overbite is treated. However, as the changes were similar in both subgroups, no further information was gained concerning the cause of overbite stabil ity or relapse. Thus, the di rection of growth is the determining factor involved.
An increase in mandibular intercanine width during treatment may be more adequately maintained in patients with a sagittal di rection of condylar growth. Similar findings were not, however, apparent for changes in maxil lary intercanine width or dental arch circumference. No obvious explanation is avai l abl e for these findings.
F inal ly, it may be concluded that there is a relationship between the long term results of treatment of deep overbite and the di rection of condylar growth, a more successful reduction of a deep overbite occurred when the growth of the condyles was in a sagittal direction.
92
chapter 9
mandibular rotatation
9.1 . Introduction
Rotation of the mandible has been found by Bjork ( 1 969) to be masked, when it is examined using conventional superimposition with the lower border of the mandible as reference. This masking of the rotation of the mandible is caused by the remodel l ing taking place at the lower border of the mandible (Bjork 1 963) . Bjork ( 1 969) proposed that for clinical purposes the growth rotation of the mandible be evaluated using the structural method of superimposition. Growth rotation of the mandible in relation to the sel la nasion l ine, can be read from the angle between the sel la nasion l ines for two different ages. In the present investigation the rotation of the mandible is considered to be due to a combination of mandibular growth and the effects of treatment.
Mandibular rotation wil l be examined and its relationship evaluated to the direction of condylar growth, overbite, overjet, intercan ine width, anterior dental arch cirumference, occlusal plane incl i nation, and the posttreatment interval.
9.2. Method
9.2. 1 . Measurement
I n this part of the investigation the same 21 cases were used as for the evaluation of d irection of condylar growth (Chapter 8) . The technical detai ls of the method used in the present study are described in Chapter 2.3.7. Definitions of the points and planes are given in Chapter 2 .3. The method of measurement is i l lustrated i n F igure 9. 1 .
93
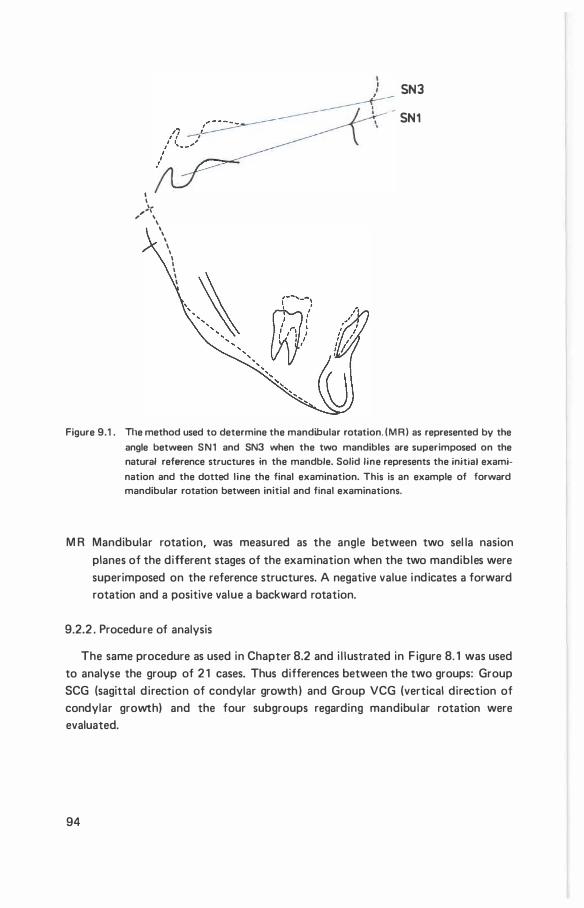
I I '·
,.., , \
' \ \
\ I \ I I I I I
SN3
SN1
Figure 9.1 . The method used to determine the mandibular rotation. (MR) as represented by the
angle between SN1 and SN3 when the two mandibles are superimposed on the natural reference structures in the mandble. Solid line represents the initial exami
nation and the dotted l ine the final examination. This is an example of forward mandibular rotation between initial and final examinations.
M R Mandibular rotation, was measured as the angle between two sel la nasion planes of the different stages of the examination when the two mandibles were superimposed on the reference structures. A negative value indicates a forward rotation and a positive value a backward rotation.
9.2.2 . Procedure of analysis
The same procedure as used in Chapter 8.2 and i l lustrated in F igure 8. 1 was used to analyse the group of 2 1 cases. Thus differences between the two groups: Group SCG (sagittal d irection of condylar growth) and Group VCG (vertical direction of condylar growth) and the four subgroups regarding mandibu lar rotation were evaluated.
94
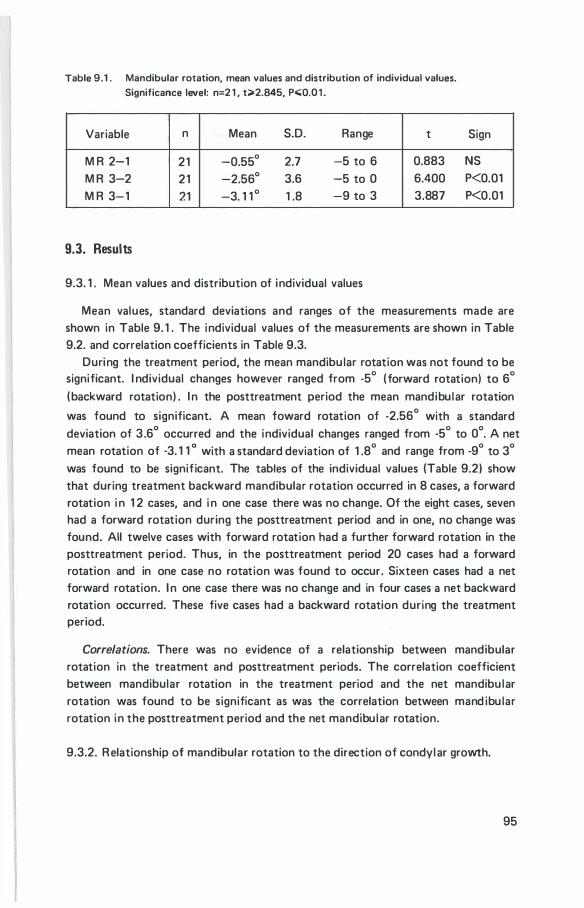
Table 9.1 . Mandibular rotation, mean values and distribution of individual values. Significance level: n=2 1 , t>2.845, Po;;;Q.0 1 .
Variable n Mean S.D. Range t
M R 2-1 21 -0.55° 2.7 -5 to 6 0.883 M R 3-2 21 -2.56° 3.6 -5 to 0 6.400 M R 3-1 21 -3. 1 1 ° 1 .8 -9 to 3 3.887
9.3. Results
9.3. 1 . Mean values and distribution of individual values
Sign
NS P<0.01 P<0.01
Mean values, standard deviations and ranges of the measurements made are shown in Table 9. 1 . The individual values of the measurements are shown in Table 9.2. and correlation coefficients in Table 9.3.
During the treatment period, the mean mandibu lar rotation was not found to be significant. I ndividual changes however ranged from -5° (forward rotation) to 6°
(backward rotation) . I n the posttreatment period the mean mandibu lar rotation
was found to significant. A mean toward rotation of -2.56° with a standard deviation of 3 .6° occurred and the individual changes ranged from -5° to 0°. A net mean rotation of -3. 1 1 o with a standard deviation of 1 .8° and range from -9° to 3°
was found to be significant. The tables of the individual values (Table 9.2) show that during treatment backward mandibular rotation occurred in 8 cases, a forward rotation i n 1 2 cases, and i n one case there was no change. Of the eight cases, seven had a forward rotation during the posttreatment period and in one, no change was found. All twelve cases with forward rotation had a further forward rotation in the posttreatment period. Thus, in the posttreatment period 20 cases had a forward rotation and in one case no rotation was found to occur. Sixteen cases had a net forward rotation. I n one case there was no change and in four cases a net backward rotation occurred. These five cases had a backward rotation during the treatment period.
Correlations. There was no evidence of a relationship between mandibular rotation in the treatment and posttreatment periods. The correlation coefficient between mandibular rotation in the treatment period and the net mandibu lar rotation was found to be significant as was the correlation between mand ibu lar rotation in the posttreatment period and the net mandibu lar rotation.
9.3.2. R elationship of mandibular rotation to the direction of condyl ar growth.
95
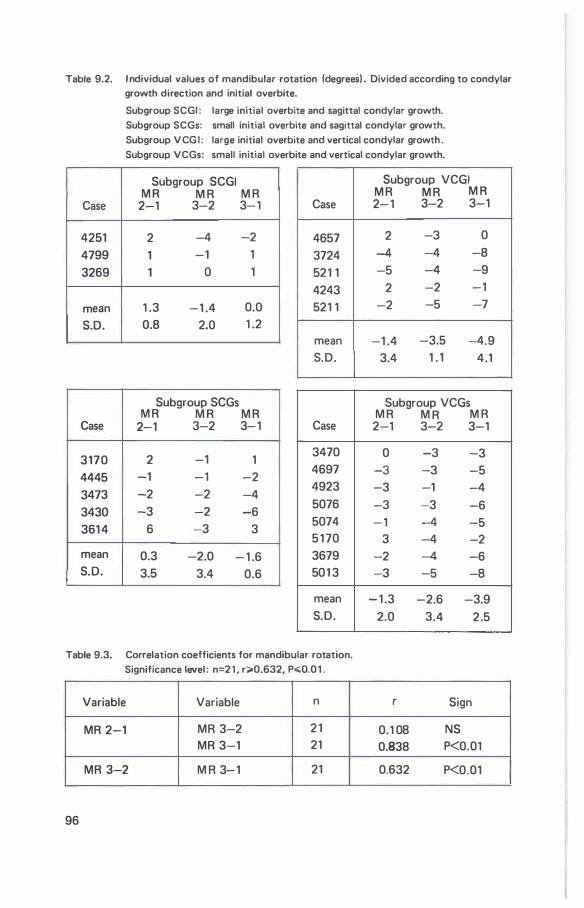
Table 9.2. I ndividual values of mandibular rotation (degrees) . Divided according to condylar growth direction and initial overbite.
Case
4251 4799 3269
mean S.D.
Case
3170 4445 3473 3430 361 4
mean S.D.
Subgroup SCGI : large initial overbite and sagittal condylar growth. Subgroup SCGs: small initial overbite and sagittal condylar growth.
Subgroup V CG I : large initial overbite and vertical condylar growth .
Subgroup VCGs: small initial overbite and vertical condylar growth.
Subgroup SCGI M R M R M R
2-1 3-2 3-1
2 -4 -2
1 -1 1
1 0 1
1 .3 -1 .4 0.0 0.8 2.0 1 .2
Subgroup SCGs M R M R M R
2-1 3-2 3-1
2 -1 1 -1 -1 -2 -2 -2 -4 -3 -2 -6
6 -3 3
0.3 -2.0 - 1 .6 3.5 3.4 0.6
Case
4657 3724 521 1 4243 521 1
mean S.D.
Case
3470 4697 4923 5076 5074 5 1 70 3679 501 3
mean S.D.
Subgroup VCGI M R M R M R 2- 1 3-2 3-1
2 -3 0
-4 -4 -8 -5 -4 -9
2 -2 -1
-2 -5 -7
-1 .4 -3.5 -4.9 3.4 1 . , . 4.1
Subgroup VCGs M R M R M R
2-1 3-2 3-1
0 -3 -3 -3 -3 -5 -3 -1 -4 -3 -3 -6 -1 -4 -5
3 -4 -2 -2 -4 -6 -3 -5 -8
- 1 .3 -2.6 -3.9 2.0 3.4 2 .5
Table 9.3. Correlation coefficients for mandibular rotation. Significance level : n=2 1 , r;;.0.632, P..;;0.0 1 .
Variable Variable n r Sign
MR 2-1 MR 3-2 2 1 0.1 08 NS MR 3-1 21 0.838 P<O.Ol
MR 3-2 M R 3-1 21 0.632 P<0.01
96
Table 9.4. Mean values of mandibular rotation, and the distribution of i ndividual values of the two groups in which sagittal and vertical condylar growth occured. Significance level : n=2 1 , t;;.2.093, Po;;;0.05.
Group SCG Group VCG
Variable Mean S.D Range Mean S.D. Range t Sign
MR 2-1 0.75° 2.7 -3 6 -1 .35° 2.5 -5 3 1 .796 NS
MR 3-2 -1 .84° 1 .2 -4 0 -3.01° 2.1 -5 - 1 1 .414 NS
MR 3-1 -1 .08° 2.8 -6 3 -4.36° 3.6 -9 0 2 . 1 77 P<0.05
The sample was divided into two groups: Group SCG (eight cases with a sagittal di rection of condy lar growth) and Group VCGI ( 1 3 cases with a vertical di rection of condylar growth) . The determination of the di rection of condylar growth is described in chapter 2.3 and 8.2. The mean differences of mandibulat rotation in these two groups were then evaluated, using the t-test (Table 9.4 ) . The changes in mandibular rotation in the two groups are i l l ustrated in F igure 9.2.
Mandibular rotation in the two groups in the treatment and posttreatment periods was not found to be significantly different. However, the mean difference between the net mandibular rotation of the two groups was significant. This indicates that forward rotation of the mandible was on average greater in the group with a vertical direction of condylar growth. I n this group the net mean forward rolation was -4.36 degrees with a standard deviation of 3.6° and range from -9° to 0° . I n the group with a sagittal d irection of condylar growth the mean value was -1 .08° , with a standard deviation of 2.8° and range from -6° to 3°.
9.3.3. R elationship of mandibular rotation, di rection of condylar growth and overbite
As described in Chapter 8, and i l lustrated in F igure 8.3 the sample was subdivided into four subgroups according to vertical or sagittal d irection of condylar growth and small or large overbite: the four subgroups were compared to evaluate differences in d irection and amount of mandibular rotation. None of these differences were found to be significant.
The i ndividual values were examined (Table 9.2. ) . I n group SCGI all three cases had a backward rotation of the mandible during treatment and a forward rotation was found in two cases following treatment. In one case no change was found to occur fol lowing treatment. In Subgroups SCGs, VCGI and VCGs instances of backward rotation were found to occur during treatment. General ly a forward rotation occurred both during and following treatment in these three groups.
97
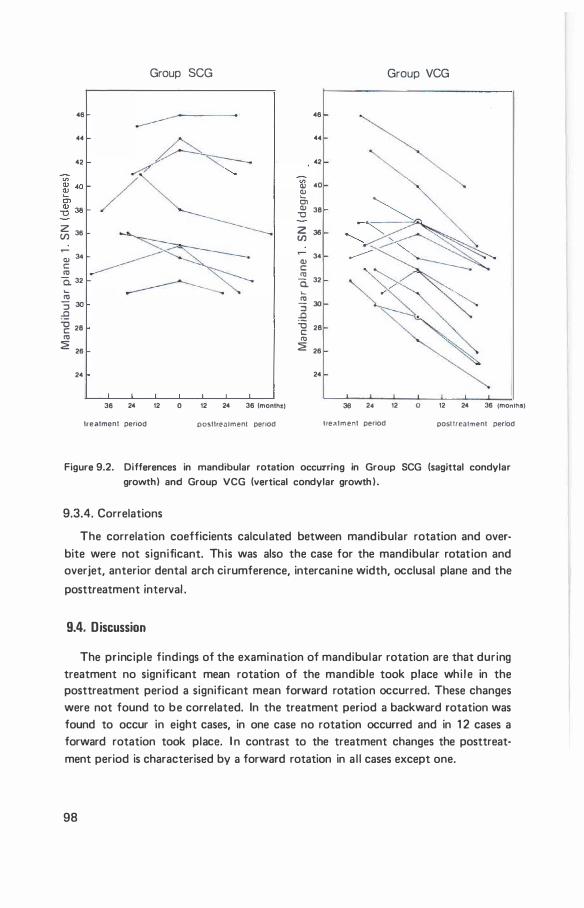
Group SCG
46
..
42
� 36
� 34 c: 11:1
a. 32
.... 11:1 :; ao
:9 -g 28 11:1
2 26
24
36 24 12 0 12 24 36 lmonlh!)
treatment penOd posttreatment penod
46
..
42
V> CIJ 40
� 01 � 38
2 36 V)
34 CIJ c: 11:1 a. 32
.... 11:1 :; 30 ..0 '0 28 c: 11:1
2 26
24
Group VCG
36 2• 12 0 12 24 36 (months)
tret\tment penod posl freat.,ent period
Figure 9.2. Differences in mandibular rotation occurring in Group SCG (sagittal condylar growth) and Group VCG (vertical condylar growth ) .
9.3.4. Correlations
The correlation coefficients calculated between mandibular rotation and overbite were not significant. Th is was also the case for the mandibular rotation and overjet, anterior dental arch ci rumference, intercani ne width, occlusal plane and the
posttreatment interval .
9.4. Discussion
The principle findings of the examination of mandibular rotation are that during treatment no significant mean rotation of the mandible took place whi le in the posttreatment period a significant mean forward rotation occurred. These changes were not found to be correlated. In the treatment period a backward rotation was found to occur in eight cases, in one case no rotation occurred and in 1 2 cases a forward rotation took place. I n contrast to the treatment changes the posttreat· ment period is characterised by a forward rotation in a l l cases except one.
98
Bjork and Skie l ler ( 1 972) , found in 2 1 untreated subjects with various malocclusions, who were examined over a six year period around puberty, that forward rotation occurred in 1 9 cases and backward rotation in 2 cases. I n a previous report Bjork ( 1 969) found that backward rotation was less freqent then forward rotation. Further that backward rotation may be due to a raising of the bite by orthodontic means or it may occur when condylar growth is in a sagittal direction. I n the present investigation, the cases in which backward rotation occurred during treatment are distributed within both groups (SCG and VCG) and it appears that backward rotation may be due to the effects of treatment or in some i nstances to treatment combined with a sagittal condylar growth.
Odegaard ( 1 970) investigated the influence of treatment on the degree of mandibular rotation in 26 subjects in which i mplants had been placed in the mandible. Nine subjects were not treated, 1 7 subjects received treatment with either fixed or removable appl iances. Odegaard concluded that the degree of rotation was influenced by treatment. Our findings show that during the treatment period forward as wel l as backward rotation occurred. While in the posttreatment period all cases except one showed forward rotation. This differences is circumstantial evidence of the influence of treatment on mandi bular rotation.
Bjork and Skiel ler ( 1 972), found a relationship between the di rection of condylar growth and mandibular rotation. I n our study, the correlations between these variables were found to be not significant. However, a significant mean difference in the net mandibular rotation was found between the groups with a sagittal or vertical direction of condylar growth. The forward rotation was less in the group which has subjects with sagittal condylar growth, indicating a relationship of the degree of mandibular rotation to the direction of condylar growth. It seems l ikely that the effect of treatment reduces the significance of their relationship by an alteration in the degree of mandibular rotation. The mean differences between the two subgroups with large overbite were not observed to be significant. However, the individual values indicate some differences. These differences suggest that a relationship between the rotation of the mandible and overbite sti l l may have existed. This expected relationship was however not directly evident. The reason may be the influence of a second predominant factor, that of the direction of condylar growth. The direction of condylar growth was found to be statistical ly different between the two subgroups (SCGI and VCGI ) .
Bjork and Skiel ler ( 1 972). found a significant relationship between mandibular rotation and overbite. The present findings on the mand ibular rotation in the posttreatment period do not confirm a relationship to the overbite changes and it seems l ikely that the di rection of condylar growth was possibly a more important factor.
99

The findings on the relationship of mandibular rotation to changes of overbite, overjet, intercanine width, anterior dental arch circumference and occlusal plane incl ination were all found to be not significant. It may therefore be concluded that mandibular rotation does not appear to be related to these individual variables but rather to a complex of factors that cause mandibular rotation. One of these factors is probably condylar growth, other factors could not be individual ly identified.
1 00
chapter 10
facial profile
1 0.1 Introduction
One of the aims of orthodontic treatment may be the improvement of the aesthetic appearance. Treament of a malocclusion is benefical to the general facial appearance although adverse effects on the soft tissue profile have been reported.
This part of the study was to evaluate the changes in the facial profi l e in subjects treated with the Begg technique. Changes in the facial profil e were examined in two stages: firstly the soft tissue profi les at the initial examination were evaluated by a method of subjective inspection, to divide the sample into groups with similar profiles; then by a subjective inspection of the profiles and objectively by measurement.
1 0.2 Method and measurements
The profiles were investigated at the in itial and final examinations. The intermediate stage was not investigated as it was felt that the maturation of the profi le over the total period of observation was of primary interest.
1 0.2 . 1 D ivision of sample
In dividing a sample into groups of simi lar profiles two methods may be used : an objective or a subjective method. With the subjective method a certai n profile measure is selected as basis for the classification. I f this procedure is used the influence of other contributing profi le components is neglected. In the subjective method the profiles are classified by inspection (Cox and van der Linden 1 97 1 , de Laat 1 974) . This method has obvious disadvantages. However, all the various components which contribute to the anterior facial profi le are considered and not just a s ingle factor. For this reason the subjective method was chosen for th is study.
1 01
Table 1 0. 1 . Definitions of the dento-skeletal and soft tissue anterior profile measurements.
Variable Definition
S. N.A. Point A, relative to the SN plane
S.N.B Point 8, relative to the SN plane
A.N.B Sagittal jaw dyscrepancy
S.N.Pg Point Pg, relative to the SN plane
N.A.Pg Angle of convexity of the skeletal profile
ls-NPg Shortest distance from the most anterior maxillary incisor edge ( Is ) to the facial
plane ( NPg).
l i-NPg
overbite
MR
Ar3-1 . RPI
na.no.pg
na.a.pg
a.na.b
Pg.N.no
Pg. N .a
Pg. N.Is
Pg.N.Ii
Pg.N.b
Pg.N.pg
Shortest distance from the most anterior mandibular incisor edge ( Is ) to the facial
plane ( N Pg)
Defined in Chapter 3.2
Mandibular rotation is defined in Chapter 9.2
Direction of condylar growth is defined in Chapter 8.2
Soft tissue profile convexity including the nose (no)
Soft tissue profi le convexity
Sagittal soft tissue profile discrepancy
Nose (no) relative to the facial plane ( N Pg)
Upper lip (a) relative to the facial plane
Upper lip (Is) relative to the facial plane
Lower lip (lj) relative to the facial plane
Lower lip (b) relative to the facial plane
Chin (pg) relative to the facial plane
An inspection of the initial profi le photographs of al l subjects was made by five orthodontists and two laymen. The seven examiners were invited to inspect the profiles and to group the profiles which were most similar. Each examiner made his inspection independently of the other examiners. I n this way, three groups cou ld be identified. I n some cases there was disagreement regarding the classification. After reexamination these cases were assigned to one of the groups. Two profiles differed from al l other profiles and were excluded from further examination.
1 0.2 .2 Measurements
The cephalometric measurements of the soft tissue and dento-skeletal profi le of each group were compared. The reference points and planes used for the cephalometric measurements are defined in Chapter 2.3. and i l lustrated in Figures 2.2., 2.3. and 2.4. The measurements and thei r definitions are l isted in Table 1 0. 1 .
1 02
1 0.3. Results
The soft tissue profiles are i l lustrated in Figure 1 0. 1 . The three groups are coded as fol lows, according to characteristics at the initial examination: Group PC profiles are convex (aesthetical ly poor) ; Group PM profiles are convex and the mandible appears prominent (aesthetical ly acceptable) ; Group PS profi les are straight (aesthetical ly acceptable) .
I n Group PC there were 1 4 cases; a l l malocclusions were Class I I division 1 . I n Group P M there were five cases; a l l malocclusions were classified a s borderl i ne. I n Group PS there were nine cases; seven were Class I and two were Class I I division 1 malocclusions.
1 0.3. 1 . Soft tissue profile description
The characteristics of each group wil l be described; they may also be studied from F igure 1 0. 1 where the in itial and final profiles are shown of each subject superimposed on the facial plane and orientated to the mid-point between the l ips.
Initial examination.
Group PC. The profiles appear convex, the mandible appears retrognathic, the l ips protrude and are parted at rest. I n some cases the nose appears promi nent.
Group PM. The profiles appear convex, the chin is more prominent in relation to the face than Group PC and is wel l defined. The nose appears smal l . Lips are prominent and in contact at rest.
Group PS. The profiles tend to be straighter than in the other two groups. The l ips are general ly in contact at rest and the chin is wel l defined.
Final examination
The inspection of the profiles at the final examination reveals that the groups establ ished at the initial examination are readi ly recognizable.
Group PC. The profiles are general ly convex and the mandibles appear retrogna· thic. The l ips appear protruded and are in contact at rest.
G roup PM. The profiles appear less convex than at the initial examination. The l ips are also less prominent than at the initial examination and the chin is wel l defi ned.
Group PS. The l ips appear less prominent in relation to the face than at the initial examination and the chin is wel l defined.
1 0 .3.2. Cephalometric measurements
Initial examination
The mean values and distribution of individual values are shown in Table 1 0.2.
1 03
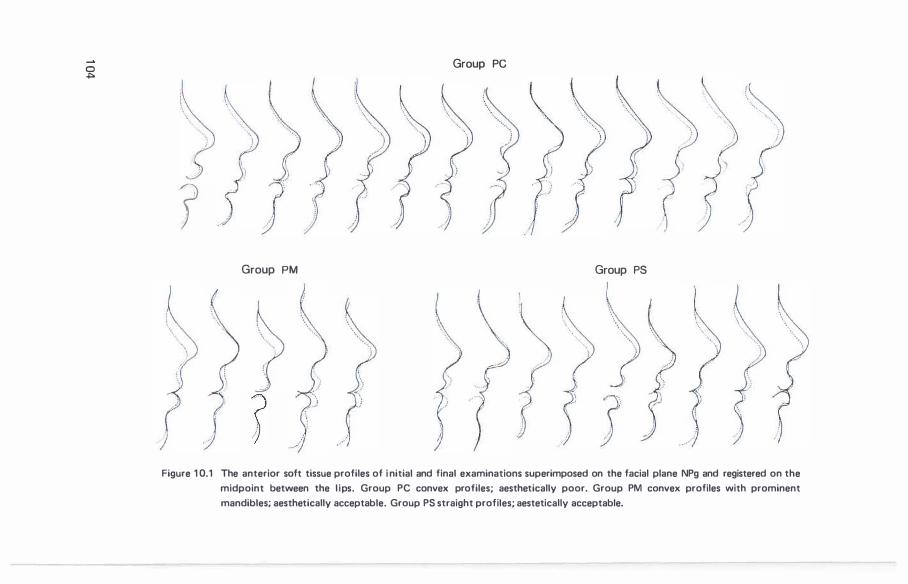
0 .j:>o
r
r
\.. ..•...
Group PM
? -)
Group PC
Group PS
Figure 1 0.1 The anterior soft tissue profiles of i nitial and final examinations superimposed on the facial plane NPg and registered on the
midpoint between the l ips. Group PC convex profiles; aesthetically poor. Group PM convex profiles with prominent
mandibles; aesthetically acceptable. Group PS straight profiles; aestetically acceptable.
and 1 0.3. The mean differences between the groups were evalauted using the t-test.
Demo-skeletal profile. At the in itial exami nation the mean S.N.A angle in Group PS was found to be significantly smal ler than the mean S .N .A angl e in G roups PC and PM. The mean difference between Groups PC and PM was not significant. The findings indicate that point A is less prominent relative to the sel la nasion plane in G roup PS. The mean angles S .N.8 and S.N .Pg were significantly larger in G roup PM than in G roups PC and PS. Further, no significant differences were found between Group PC and PS. These findings indicate that point 8 and point Pg are more prominent relative to the sel la nasion plane in Group PM and that they are simi lar in Groups PC and PS. The differences in the sagittal positions of points A, 8 and Pg results in Group PC having the largest mean sagittal jaw discrepancy (A.N.8) and the greatest convexity of the skeletal profi le (N .A.Pg) .
I f Groups PC and PS are compared then it appears that the greater convexity, ( N .A.Pg) and sagittal jaw discrepancy (A.N .8) found in Group PC are due to a more anterior positioning of point A relative to the sel la nasion plane. Group PM differs from both Groups PC with respect to a more anterior position of the points 8 and Pg relative to the sel la nasion plane.
The mean positions of the incisal edges of the max i l lary and mandibular incisors relative to the facial plane ( ls-NPg, I i -NPg) were significantly different in Groups PC and PS. I n Group PC the incisal edges were more anteriorly positioned. I n the comparison of Group PC with Group PM the max i l l ary incisors were more prominent in G roup PC and no significant difference was found in the position of the mand ibular incisal edges. No significant differences were observed between Groups PM and PS. No difference in overbite was found between the three groups.
Soft tissue profile. The characteristics of the soft tissue profi le general ly reflect the contour of the underlying hard structures. The soft tissue profi le convexity
(na.a.pg) was found to be greatest in G roup PC, and no significant difference was found between Group PM and PC. Similar findings apply to the sagittal profile discrepancy (a.n.b ) . The measurements relating the most anterior point of the nose to the face (na.no.pg, Pg.N.no) indicate that the nose is more prominent in Group PC than in the other two groups. The upper lip (Pg.N.a, Pg.N . I s) was found to be most prominent relative to the facial plane in Group PC and least prominent in Group PS. The position of the lower l ip relative to the facial plane (Pg.N . I i , Pg.N .bi was not found to differ significantly in the three groups. A difference in the position of the chin (Pg.N .pg) was found between Group PC and PM.
If the skeletal, dental and soft tissue characteristics are col lectively considered it appears that the differences between Groups PC and PS are due to a more anterior position of the middle facial structures in Group PC. The anterior border of the mandible appears more anteriorly positioned relative to the sel la nasion plane in
1 05

Table 1 0.2. Soft tissue profile, Examination 1 (angular measurements, in degrees) Level of significance: n = 1 4, t� 2.1 79, P .;; 0.05; t� 3.055, P .;; 0.0 1 .
n = 1 9, t� 2.1 1 0, p .;; 0.05; t� 2.898, P .;; 0.01 .
n = 23, t� 2.069, P .;; 0.05; t� 2.807, P .;; 0.01 .
Group PC n=1 4 Group PM n=5 Group PS n=9 t t t
Variable Mean S.D. Range Mean S.D. Range Mean S.D. Range PC· PM PC·PS PM·P!'
na.no.pg 1 27.2 3.6 1 20 1 32 1 33.1 2.4 1 3 1 1 36 1 30.5 3.7 1 24 1 32 3.379 2. 1 44 1 .366 na.a.pg 1 56.2 4.1 1 49 1 63 1 60.8 2.6 1 58 1 65 1 63.5 4.0 1 59 1 70 1 .945 3.710 1 .354 a.na.b 1 1 .5 1 .8 9 1 5 1 0.0 0.7 9 1 1 8.6 1 .5 5 1 0 1 .818 3.978 1 .878 Pg.N.no 40.6 1 .8 39 45 36.2 2.2 33 39 37.3 2.2 35 42 4.470 3.924 0.894 Pg.N.a 19.4 1 .9 1 7 22 1 7.2 1 .8 1 5 20 1 5.1 1 .6 1 3 1 6 2.176 5.538 2.263 Pg.N. Is 20.3 2.0 1 7 24 1 7.4 1 .9 1 5 20 1 6.2 1 .8 1 4 1 9 2.701 4.858 1 . 193 Pg.N. I i 1 2.7 2.3 1 0 1 5 1 2 .8 1 .6 1 1 1 5 1 1 . 1 1 .8 7 1 3 0.069 1 .734 1 .695 Pg.N.b 5.8 1 .4 3 8 5.2 1 .3 4 7 4.9 0.9 4 5 0.770 1 . 756 0.631 Pg.N.pg 6.5 0.9 5 8 5.1 1 . 1 3 6 5.8 1 . 1 4 8 2.656 1 .510 1 .2 1 1
Table 1 0.3. Anterior dento·skeletal measurements at the start of treatment. (angular measurements in degrees, l inear measurements in mm)
level of significance the same as for table 1 0.2.
Group PC n-14 Group PM n=5 Group PS n=9 t t t
Variable Mean S.D. Range Mean S.D. Range Mean S.D. Range PC-PM PC-PS PM·PS
S.N.A. 8 1 .0 1 .8 73 86 8 1 .7 4.6 78 89 77. 1 1 .8 74 80 2.963 0.432 2.794 S.N.B. 74.8 2.0 68 78 80.0 3.4 76 85 73.9 2.0 71 77 0.830 3.294 4.263 A.N.B. 6.2 1 .7 4 9 1 .8 1 .4 0 4 3.2 1 .7 0 7 4.163 5.185 1 .508 S.N.Pg 75.6 2.1 67 69 8 1 .2 3.6 77 86 75.3 2.1 73 80 0.455 3.351 3.876 N.A.Pg 1 68.8 3.8 1 63 1 76 1 77.6 1 .9 1 75 1 79 1 75.1 3.8 1 67 1 79 3.371 4.005 1 .352 l i-NPg 5.6 3.5 -0.3 1 2.6 4.5 2.0 2.7 7.3 1 .9 3.0 -3.2 4.4 2.462 0.608 1 .660 ls-NPg 14.2 3.2 7.2 1 7.8 9.8 2.6 7.6 14.3 8.5 3.9 0.7 1 05 3.731 2.722 0.609 Overbite 4.1 1 .6 0.9 7.1 3.7 2.1 0.5 5.4 2.8 1 .7 0.5 4.9 1 .691 0.403 0.785
Table 1 0.4. Soft tissue profile changes between initial and final examination ( in degrees). Level of significance the same as for table 1 0.2.
Group PC n=1 4 Group PM n=5 Group PS n=9 t t t Variable Mean S.D. Range Mean S.D. Range Mean S.D. Range PC·PM PC-PS PM-PS
na.no.pg - 1 .1 2.9 -6 4 -1 .7 6. 1 -9 6 0. 1 2.7 -4 1 0.26 1 0.959 0.730 na.a.pg 6.6 3.0 -1 1 0 4.5 4.4 -1 9 5.9 3.9 1 1 3 1 . 180 0. 502 0.594 a.na.b -2.7 1 .4 ·5 0 ·1 .6 1 .3 -4 1 -1 .7 2.0 -4 1 1 .231 1 .640 0.039 Pg.N.no 0.3 1 .5 -3 3 0.8 4.3 -5 5 -0.4 2.3 -3 3 0.407 0. 798 0.666 Pg.N.a -3.0 1 .4 -5 0 -3.3 2.4 -5 0 -2.5 1 .7 -6 -1 0.268 0. 779 0.697 Pg.N. I s -3.3 1 .3 -6 -1 -2.9 2.1 -5 0 -2.8 1 .6 -5 -1 0.576 0.881 0.084 Pg.N. I i -0.5 1 .9 -6 1 -2.2 1 .5 -4 -1 -1 .6 1 .4 -3 1 1 .752 1 .467 0.695 Pg.N.b -0.2 0.9 -2 1 -1 .5 0.6 -2 -1 -0.8 0.8 -2 0 2.789 1 .508 1 .597 Pg.N.p9 0.2 0.7 -1 1 -0.1 0.5 -1 1 -0.1 0.5 -1 1 0.7 1 1 0.269 0.552
1 06
Table 1 0.5. Anterior den to-skeletal changes between initial and final examinations (angular measurements in degrees, linear measurements in mm).
Level of significance the same as for table 1 0.2.
Group PC n=1 4 Group P M n=5 Group PS n=9 t t t Variable Mean S.D. Range Mean S.D. Range Mean S.D. Range PC-PM PC-PS PM-PS
S.N.A. -1 .8 1 .9 -6 0 -0.4 2.3 -3 2 -0.9 1 .0 -2 1 1 .249 1 .328 0.591 S.N.B. 0.8 1 .3 -1 3 0.7 1 .9 -2 2 1 . 1 1 .8 -2 4 0. 1 82 0.449 0.428 A.N.B. -2.6 1 .3 -5 0 -1 . 1 1 . 1 -2 0 -2.1 1 .4 -4 0 2.244 0.941 1 .269 S.N.Pg 1 .3 1 .6 -1 4 2.0 1 .8 -1 4 2.4 2.0 -1 5 0.808 1 .378 0.307 N.A.Pg 5.9 3.7 0 1 1 -1 .3 2.6 -3 3 0.3 5.6 -5 1 0 3.881 2.836 0.588 l i-NPg -2.6 2.4 -6.1 1 . 1 -4.2 1 .3 -6.1 -2.8 -4.0 2.5 -7 -0.8 1 .346 1 .281 0. 1 60 ls-NPg -7.4 2.7 -1 2.0 -3.6 -6.3 2.1 -9.5 -4.1 -7.5 3.4-12.2 -1 .2 0.808 0.062 0.68 1 overbite 0.7 1 .7 -4.8 1 .2 0.8 1 .5 -2.6 1 .2 0.7 1 .7 -1 .8 1 .2 0. 1 07 0.699 0.8 1 2 M R 1 .9 3.5 -1 6 4.4 2.9 0 7 4. 1 3.2 -1 9 1 .209 1 . 1 7 1 0.161 Ar3-1 .MPI 1 29.2 18.9 94 1 5 1 1 29.9 1 1 .5 1 1 3 1 37 1 29.9 1 2.2 1 1 7 145 0.067 0.078 0.006
Table 1 �.6. Soft tissue profile, final examination (angular measurements in degrees). Level of significance; the same as for table 1 0.2.
Group PC n= 1 4 Group PM n=5 Group PS n=9 t t t Variable Mean S.D. Range Mean S.D. Range Mean S.D. Range PC-PM PC-PS PM-PC
na.no.pg 1 26.0 2.6 1 20 1 30 1 31 .5 4.4 1 27 1 38 130.6 3.8 1 23 1 37 3.301 3.371 0.389 na.a.pg 1 62.8 3.7 1 59 1 74 1 65.3 3.7 1 59 1 69 1 69.4 4.7 1 63 1 74 1 .250 3.654 1 .658 a.na.b 8.9 1 .2 7 1 1 8.4 1 .9 5 1 1 6.9 1 .6 5 1 0 0.668 3.195 1 .450 Pg.N.no 40.9 1 .8 38 45 37.0 3.6 35 40 36.9 3.0 35 41 3.101 3.934 0.061 Pg.N.a 1 6.4 2.0 1 5 2 1 1 3.6 1 .4 1 2 1 5 1 2.6 1 .8 1 1 1 6 2.450 4.588 1 .471 Pg.N.Is 1 7.0 2.3 14 22 1 4.6 1 .3 1 3 1 6 1 3.4 1 .5 1 1 1 6 2.161 4.053 1 .425 Pg.N.Ii 1 2.2 1 .6 1 0 1 6 1 0.6 0.7 1 0 1 1 9.5 1 .2 8 1 0 2.093 4.222 1 .801 Pg.N.b 5.6 1 .2 3 8 3.7 0.9 3 5 4.5 0.6 3 5 2.966 3.352 0. 756 Pg.N.pg 6.7 0.8 5 8 5.0 0.9 3 6 5.9 1 . 1 4 7 3.737 1 .816 1 .543
Table 1 0.7. Dental and Skeletal measurements final examination (Angular measurements in degrees, lioear measurements in mm) . Level of significance; the same as for table 1 0.2.
Group PC n=1 4 Group PM n=5 Group PS n=9 t t t Variable Mean S.D. Range Mean S.D. Range Mean S.D. Range PC-PM PC-PS PM-PC
S.N.A. 79.2 3.2 74 85 81 .5 2.8 80 86 76.1 2.0 72 80 1 .37 1 2.468 4.024 S.N.B. 75.6 2.8 7 1 8 1 80.7 2 .1 79 84 75.0 2.6 70 78 3.599 0.523 4.051 A.N.B. 3.6 1 .4 0 6 0.8 0.7 0 2 1 . 1 1 .4 -1 3 3.988 3.783 0.566 S.N.Pg 77.0 2.6 72 81 83.3 2.5 81 87 77.6 2.6 73 8 1 4.591 0.505 3.908 N.A.Pg 1 74.6 3.1 1 67 1 78 1 76.3 0.8 1 76 1 78 1 75.5 3.6 1 7 1 180 1 . 1 72 0.580 0.578 li-NPg 2.7 2.6 -2.0 7 .3 0.3 1 .5 ·1 .9 2.2 -2.1 2.4 -5.4 1 .7 1 .839 4.245 1 .922 ls-NPg 6.8 2 .1 3.5 1 1 .0 3.4 1 .7 0.4 4.8 1 .0 2.6 -2.5 4.0 3.128 5.739 1 .795 overbite 3.3 1 .8 0.7 4.6 2.8 1 .5 1 .7 5.3 2.5 1 .3 0.3 6.2 0.507 1 .059 0.363
1 07
Group PM than in the other two groups. I n addition, maxi l lary structures appear more anteriorly positioned in Group PM than in Group PS.
Changes between initial and final examination.
The mean changes and distribution of individual values are shown in Table 1 0.4 and 1 0.5.
Dento-skeletal changes. The mean changes in the angles S.N.A, S.N.B and S.N.Pg were not found to differ significantly in the three groups although when the changes of the points A, B and Pg are expressed col lectively as the changes in sagittal jaw d iscrepancy and skeletal convexity it was found that the mean sagittal jaw discrepancy decreased more in Group PC than Group PM. The skeletal convexity decreased by the greatest amount in Group PC.
The findings shown in Table 1 0.5 indicate that the changes in sagittal jaw discrepancy and skeletal convexity result from a combination of changes. In Group PC they were general ly due to a decrease in S.N.A and an increase in S .N.B and S.N.Pg. I n Groups PM and PS, increases in S.N.A also occurred, and in these two groups decreases in A.N.B were due to relatively greater increases in S.N.B. than SNA or due to a decrease in S.N.A and an increase in S. N.B . The mean changes in distance of the incisor edges relative to the facial plane ( l s-NPg, l i-NPg) were not found to be statistical ly different for the three groups. The incisors tended to become less prominent relative to the facial plane in al l three groups. No significant differences in the changes in overbite, mandibular rotation or d irection of condylar growth were observed.
Soft tissue profile. The mean changes in the soft tissue profi le were not found to differ significantly in the three groups, with the exception of the angle Pg.N.b where the difference between Group PC and PA was significant. (Table 1 0.4) The examination of the measurements indicating the position of the nose relative to the face shows that in all three groups the range of values are simi lar, sl ight increases or decreases in the prominence of the nose relative to the face were found to occur (na.no.pg, Pg.N .no) . Upper l ip (Pg.N .a, Pg.N. Is) and lower l ip (Pg.N . I i , Pg.N .b) were found to become less prominent in a l l three groups relative to the facial plane. The changes in the position of the chin (Pg.N .pg) appear minimal . Thus, it appears that in a l l three groups the l ips become !ess prominent relative to the chin and nose.
Final Examination.
The mean and individual values are shown in Table 1 0.6 and 1 0.7. Dento-skeletal/ profile. At the final examination the mean S.N.A angle was
smal lest in Group PS, and the difference between Groups PC and PM was not found to be significant. The mean of the angles S.N.B and S .N.Pg were not found to be
1 08
significantly different between Groups PC and PS. These mean values were largest in Group PM. The mean A.N .8 angle was largest in Group PC and no significant difference was found between Groups PM and PS. The mean N .A.Pg angle was not
found to be significantly different for any specific group. Maxi l l ary incisors were most prominent relative to the facial plane in Group PC and least in Group PS. The difference in overbite, was not found to differ significantly between the three groups.
Soft tissue profile. In the comparison of the soft tissue profiles it was found that for a l l aspects examined the mean differences between Groups PM and PS were not significant. With the exception of the position of the chin (Pg.N .pg) it was found that all measurements denoting the positions of the nose and l ips differed significantly between Groups PC and PM and between Groups PC and PS. These findings indicate that relative to the facial plane the nose and l ips were more protruded in Group PC than in the other groups. The mean sagittal soft tissue profi le discrepancy was significantly d ifferent in Groups PC and PS although no significant difference was found between Groups PC and PM. The convexity of the soft tissue profi le was significantly different between Groups PC and PS. No difference was found between Groups PC and PM. Group PC was shown to have the most convex profile.
I f the soft tissue, skeletal and dental measurements are col l ectively evaluated it appears that when Groups PC and PS are compared the structures of the middle third of the face, including the l ips are more anteriorly positioned in Group PC than Group PS. In comparing Group PC and Group PM it appears that relative to the facial plane the soft tissue structures are all more promi nent in Group PC. However, relative to the sella nasion plane the skeletal points Pg and 8 are more prominent in Group PM. Point A is similar in the two groups. This means that the mandibular structures in Group PC are retrognathic when compared with Group PM. Groups PM and PS differ in respect to the skeletal structures. R elative to the sel la nasion plane the points A, 8 and Pg are less prominent in Group PS. The measurements of the soft tissue profi l e were not shown to be significantly different.
10 .3 .3 Relationship between dento-skeletal and soft tissue profi l e changes
The correlation coeficients between the changes in dento-skeletal and the soft tissue profile were calculated (Table 1 0.8) . The correlations between the changes in S .N .A, S.N.8, N .A.Pg, and S.N .Pg and the soft tissue profi le measurements were with one exception not found to be significant. The correlations between A.N.8 changes and changes in Pg.N.a, na.a.pg and a.n.b were found to be significant. The correlations indicate that a decrease in sagittal jaw discrepancy is associated with a decrease in sagittal soft tissue profi le discrepancy, a decrease in soft tissue profile convexity and a decrease in the prominence of point a relative to the facial plane.
The correlations between the changes in l i-NPg and the measurements relating
1 09
Table 1 0.8. Correlations between the changes found in dento·skeletal and soft tissue profile
measurements between the initial and final examination.
Significance level; n=28, r;;;.0.375, P<;;0.05, r;;>0.478, P<;;0.01 .
Variable na.no.pg na.a.pg a.n.b. Pg.N.no Pg.N.a Pg.N.Is Pg.N.Ii Pg.N.b Pg.N.pg
S.N.A 0.051 -0.288 -0.1 32 0.055 0.271 0.200 0.204 0.168 0.244 S.N.B 0.145 0 . 1 53 0.230 -0.2 1 3 -0.080 -0.1 1 5 0.1 92 0.1 97 0.41 0 A.N.B 0.097 ·0.527 0.418 0.302 0.425 0.374 0.042 -0.009 -0.1 5 1 S.N.Pg -0. 1 5 1 0.147 0.1 57 -0.282 ·0.167 -0.224 0.049 -0.030 0.364 N.A.Pg -0.091 0.099 0.1 25 -0.1 1 7 -0.1 02 -0.203 -0.095 0.186 0.155 l i·NPg -0.357 ·0.381 -0.269 0.501 0.477 0.478 0.452 0.389 -0.020 ls-NPg -0.1 51 -0.570 0.403 0.324 0.633 0.672 0.446 0.357 ·0.083 overbite -0.242 ·0.226 ·0. 140 0. 1 54 0.278 0. 1 62 0.576 0.291 0.501 M R 3·1 -0. 1 7 1 -0.031 -0.004 0.328 0.06,6 0.1 28 0.141 0.1 3 1 -0.367 Ar3-1 .MPI 0.226 ·0.004 ·0.025 -0.048 0.095 0.092 -0.058 -0.072 ·0. 1 01
Table 1 0.9. Correlations between mandibular rotation (MR 3·1 ), direction of condylar growth (Ar 3·1 . RPI ) and dento-skeletal changes between initial and final examinations.
Significance level : n=20, r;;>0.444, P..:0.05; r;;>0.56 1 , P<;;0.01 .
Variable n SNA SNB ANB SNPg NAPg l i-NPg ls·NPg
MR3·1 20 0.628 0.785 0.205 0.886 0.079 -0.526 -0.322 Ar3-1 . MPI 20 0. 1 1 1 ·0.091 -0.234 0. 1 29 -0. 1 49 0.1 1 4 0. 1 09
the soft tissue profile to the facial plane were found to be significant (except the correlation between l i-NPg and Pg.N .Pg) . The correlations between l s-Npg and Pg. N .a, Pg.N. Is, Pg. N . I i , na.a.pg and a.n.b. were found to be significant. These correlations indicate that a decrease in the distance of the incisal edges to the facial plane is associated with a decrease in the prominence of the l ips relative to the facial plane. Further a decrease in the distance of the incisal edges to the facial plane is associated with a decrease in the convexity of the soft tissue profile and the sagittal soft tissue profi le discrepancy.
Changes in overbite were correlated with Pg.N. I i and Pg.N.pg. The correlations indicate that a decrease in overbite is associated with a decrease in the prominence of the lower l ip.
The relationship of condylar growth direction (Ar3- 1 .MP) and mandibular rotation ( M R ) . to the changes in profile were examined and were found to be not significant. (Table 1 0.9).
Correlations between mandibular rotation and the changes in S .N.A, S.N.B, S.N .Pg and l i-PgN were found to be significant. (Table 1 0.9) . The correlations
1 1 0
Table 1 0. 1 0. Correlations between dental and skeletal measurements and soft tissue measure·
ments at examination 3.
Significance level; n=28, r;;.0.375, Po;;0.05, r;;.0.478, Po;;0.01 .
Variable na.no.pg naa.pg a.n.b. Pg.N,no Pg.N.a Pg.N.Is Pg.N. I i Pg.N.b Pg.N.pg
S.N.A. ·0.081 0.470 0.359 0.1 7 1 0.464 0.420 0.493 0.360 0.078
S.N.B 0.1 88 ·0.132 0.049 -0.1 1 3 0.066 0.066 0.1 78 0.1 54 ·0.147
A.N.B ·0.480 ·0.608 0.558 0.509 0.7 1 5 0.635 0.567 0.551 0.402
S.N.Pg 0.291 0.065 0.085 ·0.243 ·0. 1 68 -0. 1 70 -0.081 ·0.194 ·0.286
N.A.Pg ·0.077 0.1 39 0.042 -0.051 -0.21 0 ·0.268 -0.308 ·0.306 -0.1 68
li·NPg ·0.456 ·0.788 ·0.567 0.529 0.873 0.877 0.876 0.806 0.338
ls-NPg ·0.467 ·0.709 ·0.584 0.61 6 0.870 0.847 0.869 0.759 0.451
overbite ·0.1 64 ·0.238 0.334 0.072 0.1 8 1 0.1 57 0.254 -0.045 0.050
i ndicate that a forward rotation is associated with a decrease in the angles S.N .Pg, A.N.B; and S.N.A and a decrease in the distance l i·Npg.
The correlation coefficients calculated between the measurements at the final examination (Table 1 0. 1 0) indicate a significant relationsh ip between the angle A.N.B and the soft tissue measurements. A large A.N.B angle tends to be associated with more prominent soft tissue structures relative to the facial plane and a more convex soft tissue profi l e. A similar relationsh ip was found between l i-NPg and ls-NPg and the soft tissue meassurements. S.N.B, S.N.Pg and N.N .Pg were not found to be related to the soft tissue meassurements and S.N .A. was found to be associated with the position of the upper and lower l ips.
1 0.4 Discussion
Patients with aesthetical ly poor soft tissue profiles at the start of treatment (Group PC) were general ly characterised by a convex skeletal profi le ( N .A.Pg) , a concomitant large sagittal jaw discrepancy (A.N.B) and the incisal edges were more anteriorly positioned relative to the facial plane. The soft tissue profi le reflects the underlying skeletal profile and position of the teeth by the facial convexity (na.a.pg) and the prominence of the l ips. The nose was found to be more prominent in relation to the face (na.no.pg, Pg.N .no) in this group, and when viewing the profi le the prominence of the nose is exaggerated by the retrognathic appearance of the chin. Cox and van der Linden ( 1 97 1 ) studied the facial profiles of 72 subjects aged 1 8 years, which had been divided into four equal groups comprising the best and poorest profiles of both sexes. They found that i n subjects with poorest profi les a larger convexity of both soft tissue and skeletal profiles was due to a more anterior positioning of dental , skeletal and soft tissue structures of the middle facia l region. The comparisions in the present study lead to similar findings.
1 1 1

During the examination period the greatest decrease in skeletal convexity and sagittal jaw discrepancy was found in Group PC (the group with the poorest initial profi le) . The proportional relationship of the nose to the face remained the same during the examination period however the prominence of the nose in Group PC is accentuated relative to the upper l ip, as the upper l ip tends to become less prominent (a finding applicable to a l l groups) . The changes in the soft tissue profile were not found to be significantly different for any group.
It was found that the change in the position of the incisal edges were related to the largest number of changes in the soft tissue profile. A decrease in the prominence of the incisors resulting in a decrease in the prominence of the soft tissue profi le relative to the facial plane. I n addition, a decrease in overbite was found to result a decrease in the prominence of the lower l ip ( l i ) and chin (pg) . The changes in S.N.A, S.N.B, S.N.Pg, A.N.B and N.A.Pg were general ly not found to be associated with changes in the soft tissue profile. Therefore, it may by concluded that the change observed in the soft tissue profi le are primarily associated with the changes in the position of the incisors.
The l ips and denture became less prominent in relationship to the face in the course of its maturation (Subtelny 1 959, Enlow 1 968) . The findings of the present investigation i l lustrate a similar process and it is of interest that although the effects of treatment are superimposed on the developmental processes, the changes of the soft tissue profile in all thre� groups with different profile characteristics at the in itial examination were not found to be different during the examination period.
The inspection of the profiles at the final examination shows that characteristics
decribed at the start of treatment are readily discernable, with the exception of the vertical l ip relation which was general ly found to be a closed vertical l ip relation at rest. Furthermore, profi les in each group were characteristic of that group only. The differences in profiles between the three groups were similar to those found at the in itial examination.
The measures of the soft tissue profi le at the final examination were found to be related almost exclusively to the angle A.N.B and the position of the mandibular and maxi l lary incisors relative to the facial plane ( l s-NPg, l i-NPg) . The other values expressing the relationship of points A, B and Pg to the sella nasion plane and the skeletal convexity ( N.A.Pg) have in only a few instance a relation to the soft tissue profi le. These findi ngs indicate that the sagittal jaw discrepancy is an important factor in determining the position of the incisors in the face and that these factors influence the soft tissue profi le.
In conclusion: changes in the soft tissue profi le were due primarily to changes in the position of the incisors. Furthermore, the mean changes in the soft tissue profi le were similar in the three groups. These changes result in a decrease in the prominence of the l ips which in some situations may cause an apparent increase in
1 1 2

the prominence of the nose. Final ly, there is no evidence of a characteristic soft tissue profile resulting after treatment, rather, profiles maintain the characteristics which were in itial ly found.
1 1 3
chapter 11
status of dentition and periodontium
1 1 .1 Introduction
Unfavorable side effects of orthodontic treatment have been reported in many publications. They include damage to the periodontium (Sjol ien and Zachrisson 1 973 and Zachrisson and Alneas 1 973, 1 974) and root resorption ( Reitan 1 969) . These studies indicated the necessity to evaluate our own material to determine the incidence of root resorption and periodontal pocketing. Moreover, it was felt that: a posttreatment study of the results of orthondontic treatment would be inadequate without an evaluation of the status of dentition and periodontium; th is evaluation would i ndicate if it is necessary to persue further investigations on a broader basis.
This aspect of the investigation was to evaluate the incidence of periodontal pocketing, changes in the height of the anterior alveolar crest, root resorption and positions of the th i rd molars at the final examination. The depth of the gingival sulcus was measured using a graduated periodontal probe and the height of the anterior alveolar crest was measured on lateral cephalometric radiographs. For technical reasons root resorptions were not quantitatively exami ned and this evaluation was performed by i nspection of the radiographs. The position of the third molars was examined in a similar way.
1 1 .2 Sulcus depth determination
1 1 .2 . 1 Material
The sample comprised 24 subjects. This sample differs in composition from the sample used for the cephalometric and dental cast analysis. F ifteen cases were of the original sample and nine were additional cases. The sample differs as it was not
1 1 4
possible for a l l subjects of the original sample to return for this i nvestigation. The determination of the sulcus depth was performed an average of 57.8 months (standard deviation 24.3 months) after the removal of the fixed appl iance. Bite wings, an orthopantomograph and intraoral slides were made at the time of the investigation.
I t was not possible to obtain a control group due to the difficulty in finding a sample similar in al l respects except that of treatment. A longitudina l study was also not possible as no usable data was available of the periodontal condition as, this aspect was not extensively investigated at the start of treatment. Despite these disadvantages of our material th is evaluation was undertaken for the reasons previously mentioned.
1 1 .2.2 Method
To measure the depth of the gingival sulcus a periodontal probe graduated in mm was used. The measurements were made from the bottom of the gingival sulcus to the gingival margin . The distance was measured to the nearest mm and recorded on a standardized score sheet by an assistant. I nterproximal, buccal and l i ngual measurements were taken of the sulci of al l teeth except the distal interproximal sulcus of the second molars and the sulci of the erupted third molars. The interproximal measurements were all taken from the buccal or labial aspects of the teeth, as close to the contact points as possible and an attempt was made to measure paral le l to the roots of the teeth. A periodontal pocket was diagnosed when the sulcus depth was greater than three mm.
1 1 .2.2 Error of the method
To assess the reproducibil ity of the sulcus depth measurements 1 0 subjects were examined on two separate occasions, at least one hour apart. The results of the double determinations are shown in F igure 1 1 . 1 . Fourhundred and forty double determinations were made of interproximal sulci. The greater majority of the double determinations were the same, a number differed by 1 mm and two differed by 2 mm.
Coppes ( 1 972) studied the reliabil ity of sulcus depth determinations and found the cl inical measurement of pocket depth to be reasonably accurate. The results of the double determinations of the present study would appear to lead to similar conclusions.
1 1 .2 .4 Results
An inspection of the score sheets showed that in a few cases labial or l i ngual pockets were present in the lower incisor segment. I n the buccal segments of the dental arches few buccal or l ingual pockets were observed. In view of the smal l
1 1 5
2 E .§ 3 .t:
g. 4 1J rg 5 9. cil 6
7 Tota I
- 2 -1 0 + 1 +2 4 4
6 98 27 13.
44 212 12 1 269 9 12 3 24
2 8 1 Q
1 1 1 1 1 62 343 42 1 440
Figure 1 1 .1 . Difference between first and second determinations of sulcus depth to determine error of the method.
numbers involved a statistical analysis of the measurements of these surfaces was not made.
The results of the sulcus depth determi nations of the interproximal measurements are shown in Table 1 1 . 1 and the mean differences between different surfaces are given in Table 1 1 .2. The results of the measurements are i l l ustrated in F igure 1 1 .2 . I t is evident from the examination of tables and figure that the mean sulcus depth progessively increases the further d istal ly the measurements were taken. The range of individual values also ind icates that the largest pocket depths are found in the maxi l lary arch. I n the buccal segments of the mandibular arch the largest individual values are sl ightly less than in the maxil lary arch. The mean sulcus depth is less in the mandibular molar region than in the maxi l lary molar region. I n the buccal regions the mean of the sulcus depth of the distal surface are significantly greater than that of the mesial surface in a number of situations. Also the sulcus depths of the distal surfaces of the buccal teeth were often found signifi
cantly deeper than the distal surfaces of the more mesial teeth . The largest mean sulcus depth was 4.38 mm with a standard deviation of 1 .28 mm and range from 3 to
7 mm. Th is was the depth distal to the maxi l lary left first molar. On the right side the largest mean depth was 3.4 mm, with a standard deviation of 0.93 mm and a range from 2 to 5 mm. This was found on the mesial surface of the first molar. The smal lest mean values were found on the interproximal surfaces of the mandibular incisors.
F igure 1 1 .3 shows the distribution of pockets in individual patients. Sixteen cases were found to have from 0 to 6 pockets. Six had from 8 to 1 2 pockets and two cases had a total of 1 8 and 20 pockets respectively.
1 1 6
7 6
� 5 .f. 4 rn c 3 0 -� 2 c .E Qj a; 0 "C J::. ii 2 Q)
"C 3 rn ::::J 4 .2 � 5
6
5
4
� Q) .c E 2 ::l
z
Number of penodontal pockets
Figure 1 1 .3. Frequency of Periodontal Pockets in individual Subjects.
Surfaces of individual teeth 17 16 15 13 12 11 21 22 23 25
47 46 45 43 42 41 31 32 33 35
26 27
36 37
Figure 1 1 .2. Measurements of sulcus depth for individual surfaces. Mean --- ± 2 S.D. - - - - - -
1 1 7
Table 1 1 . 1 . Mean values and distribution of the individual values of the sulcus depth measure
ments. M easurements in mm.
Maxi l lary dental arch Mandibular dental arch
Variable Mean S.D. range Variable Mean S.D. range
1 7m 3.29 0.91 1 5 37m 3.00 0.51 2 4 1 6d 3.42 0.93 2 5 36d 3. 1 7 0.48 2 4 1 6m 3. 1 3 0.80 2 5 36m 3.00 0.51 2 5 1 5d 3.08 0.65 2 5 35d 2.83 0.48 2 4 1 5m 2.88 0.61 2 4 35m 2.88 0.34 2 3 1 3d 2.67 0.48 2 3 33d 2.88 0.34 2 3 1 3m 2.7 1 0.46 2 3 33m 2.75 0.53 2 4 1 2d 2.46 0.72 1 4 32d 2.67 0.48 2 3 1 2m 2.38 0.58 2 4 32m 2.54 0.59 2 4 1 1 d 2.42 0.58 2 4 3 1 d 2.42 0.65 1 4 1 1 m 2.42 0.72 1 4 31 m 2.38 0.49 2 3
21 m 2.29 0.62 1 3 4 1 m 2.33 0.56 1 3 21d 2.29 0.55 1 3 41 d 2.63 0.58 2 4 22m 2.29 0.75 1 4 42m 2.50 0.51 2 3 22d 2.42 0.65 1 4 42d 2.83 0.38 2 3 23m 2.58 0.88 1 4 43m 2.79 0.72 2 5 23d 2.67 0.56 2 5 43d 2.79 0.51 2 4 25m 3.21 0.93 2 5 45in 2.75 0.61 2 4 25d 3.21 0.72 2 5 45d 2.75 0.53 2 4 26m 3.54 0.98 2 5 46m 3.21 0.41 3 4 26d 4.08 0.88 3 5 46d 3.21 0.59 2 4 27 m 4.38 1 .28 3 7 47m 3.25 0.53 2 4
m and d refer to the mesial or distal surface on the tooth.
Oral hygiene. An objective determination of plague and oral debris in a select sample such as the present one is not possible. However, a subjective estimation of the general oral hygiene was made using the intraoral colour sl ides. Attention was paid to redness and swel l i ng of the gingiva, the presence of debris, plaque and calculus. The oral hygiene was estimated as good, average or poor. It was observed in the two subjects with the largest number of pockets that they also had poor oral hygiene. In subjects with good oral hygiene the number of pockets was smal l .
1 1 8
Table 1 1 .2. Mean differences and their standard deviations of the different interproximal su rfaces compared. Significance level; n=24, t;>2.069, P<0.05, t;>2.807, P<0.01 .
Variables Mean S.D. t-test Sign
1 6m-1 6d 0.29 0.45 3.222 P<0.01 1 5m-1 5d 0.21 0.41 2.625 P<0.05 1 3m-1 3d 0.04 0.20 1 .000 NS 23m-23d 0.08 0.50 0.800 NS 25m-25d 0.00 0.42 0.000 NS 26m-26d 0.54 0.51 5.400 P<0.01
36m-36d 0 . 1 7 0.48 1 .700 NS
35m-35d 0.04 0.36 0.57 1 NS 33m-33d 0.1 3 0.68 0.928 NS
43m-43d 0.00 0.42 0.000 NS 45m-45d 0.00 0.29 0.000 NS 46m-46d 0.00 0.83 0.000 NS
1 5d-1 6d 0.33 0.48 3.300 P<0.01 25d-26d -0.88 0.61 6.769 P<0,01 35d-36d 0.33 0.48 3.300 P<0.01 45d-46d -0.46 0.51 4.600 P<0.01
1 6d-46d -0.21 0.51 2 .1 00 P<0.05 26d-36d 0.92 0.72 6. 1 33 P<0.01
1 1 .3 Anterior alveolar crest height
The sample consisted of the 30 subjects used for the general cephalometric and dental cast investigation. The measurements were made at the three stages of the investigation.
1 1 .3 . 1 Measurements
l s-Pr The distance from the incisal edge of the most anterior maxi l lary incisor ( I s) to the most anterior superior point of the alveolar process of the maxi l la ( Pr) .
l i- ld The distance from the incisal edge of the most anterior mandibular incisors ( I i ) to the most anterior superior point of the alveolar process of the mandible ( I d) .
1 1 .3.2 Results
The differences were calculated between the successive examinations (2- 1 , 3-2
1 1 9
and 3-1 ) . The mean changes for both maxi l lary and mandibular arches were not found to be significant.
To evaluate the relationsh ip of individual changes to changes in overjet and overbite and several other parameters during and fol lowing treatment a number of correlations were calculated which were not found to be significant.
1 1 .4 Root resorption
As no standardized radiographs were �vailable which were suitable for examining decreases in root l ength, only a rough estimate of root resorption is possible. By inspection of the orthopantomographs and intraoral radiographs of the final examination and by a comparison with the radiographs of the initial examination an evaluation of the incidence of root resorption was made of the sample used for the sulcus depth determinations.
In a number of cases sl ight resorptions were seen of different roots. No extensive root resorption was evident in these cases. In only one case were marked root resorptions identified. In this case shortening of the mesial and distal roots of the lower first molars was observed. The distal roots were also somewhat shorter than the mesial roots. The root apices of the mandibu lar incisors appeared blunted and apparently shortened. A similar finding was evident for the maxil lary incisors. The roots of the maxi l lary molars also appear shortened.
1 1 .5 Mandibular third molars
Position of the mandibular third molars was evaluated by inspection of the final radiographs. In 1 7 out of 24 cases examined the molars appear to be erupting normal ly or were vertical ly positioned, level with the second molars. In one case the mandibular molars were impacted horizontal ly and in another case this was found on one side only. In one case a uni lateral mesic-horizontal impaction was observed on the other side the molars was absent. I n two cases mesic-horizontal impactions were bi lateral . In the remaining two cases molars were bil atera l ly absent in one instance and uni lateral ly in another.
1 1 .6 Discussion
The statistical analysis of the sulcus depth determinations showed that the mean sulcus depth increased significantly the further dista l ly the �easurements were taken and the mean sulcus depth appears greater in the maxi l lary dental arch than the mandibular dental arch. The largest periodontal pockets which were found were
1 20
also in the maxil lary arch in the region of molars and premolars. Furthermore the largest number of pockets were present in individuals with poor oral hygiene.
Coppes ( 1 972) investigated differences in sulcus depth in non treated subjects. He found a tendency for the sulcus depth to increase the further d istal ly the measurements were taken. Our results appear similar.
Sjo l ien and Zachrisson ( 1 973) estimated the amount of periodontal bone support in orthodontica l ly treated subjects two years after treatment. They studied 59 subjects treated with an Edgewise type appliance and the extraction of four first premolars. These subjects were compared with a control group. They found that periodontal bone support was less dista l ly than mesial ly, and that there was l ess bone support in orthodontical ly treated cases, particularly in the maxil lary anterior region and in the extraction spaces. They suggested that the loss of bone support was partial ly due to loss of marginal alveolar bone.
Zachrisson and Alneas ( 1 973) found in subjects, two years after treatment, a l oss of gingival attachment in the buccal aspects of maxi l lary teeth greater than that of the control group. Although, no difference in pocket depth or c l in ical crown height was found between the two groups examined. Further, these authors found no relationship between loss of gingival attachment and changes in overjet and other factors examined. Our findings were also similar when changes in alveolar crest height were i nvestigated i n relation to changes i n the dental arches. Zachrisson and Alneas ( 1 974) examined in a similar group of subjects the distance from the cementa-enamel junction to the alveolar crest. They found a significant mean difference between the treated and control group. The loss of alveolar bone was greater in orthodontical ly treated subjects. I n addition the pressure side of the extraction spaces showed the greatest difference. They concluded that although, orthodontical ly treated subjects had a greater bone loss than the control group, the
differences were smal l . However, they stressed that this difference may be of cl in ical significance, because the retentive apparatus of the tooth is largely restricted to the coronal two th irds of the root.
The studies referred to above indicate that orthodontic treatment appears to be accociated with an adverse effect on the periodontium, however, the cl in ical significance will probably only be evaluated after a longer period. Duterloo ( 1 974) has observed that on lateral cephalometric radiographs in specific cases treated with the Begg technique a change in the cortical plate l ingual to the maxil lary and mandibular incisors occurs. It diminishes during treatment and is not observable in the period subsequent to treatment. The clinical impl ications are not clear. I t was thought that tooth movements are concomitant with intensive bone remodel l ing and the formation of bone with a low density.
The relationship of poor oral hygiene to the incidence of periodontal pocketing is evident in our material . This relationsh ip has been found by Sheiham ( 1 969a,
1 21

1 969b,) in non treated subjects. He found a strong relationship between poor oral hygiene, advancing age and the incidence of periodontal pockets.
Root resorption was found to be extensive in one case only. In several other cases s l ight resorptions were found. Our evaluation was l imited by the lack of standardised radiographs. These are necessary for a quantative analysis.
The data from our own study permit only l imited conclusions. However, the findings indicate that a systematic longitudinal investigation of the relationsh ip of orthodontic treatment and the status of the periodontal tissues is necessary.
1 22
chapter 12
general discussion
This general discussion is intended to coordinate the findings and to expand on a number of general observations perta ining to this study.
Simons and Joondeph ( 1 973) and Shapiro ( 1 974), studied cases ten years after retention in the belief that th is is an adequate period after which posttreatment results can be evaluated. Although in the present study and that of Dermaut ( 1 974). the posttreatment periods were shorter, the results are similar to those of the above mentioned authors, Furthermore, Huggins and Birch ( 1 964) . found that relapse of retracted maxil lary incisors was most rapid with in the first six months after retraction. Simi larly, the experimental findings of Reitan ( 1 967) indicate that relapse of orthodontic tooth movement is rapid immediately after removal of the appl iance in tipping, rotating and bodi ly movements. It thus appears that an evalution of general trends of changes in the posttreatment period can be made at a relatively early stage of this period, although this does not diminish the value of a long term study.
Correlation coefficients were calculated between posttreatment changes of a number of variables and the posttreatment duration. These were al l found to be not significant. The general inabil ity to show a relationship between posttreatment changes and posttreatment duration is a further indication that the most substantial changes in the posttreatment period occur at an early stage.
A l imitation of our study as wel l as those of Simons and Joondeph ( 1 973), Shapiro ( 1 974) and others reviewed is the lack of an intensive systematic lon
gitudinal posttreatment study. It is suggested that posttreatment changes be studied at bimonthly intervals during the early postretention period. Th is type of study would provide further insight into the duration and intensity of posttreatment changes.
1 23
A factor which can be most adequately evaluated over a long period is that of the influence of orthodontic treatment on the periodontium. As suggested by Zachrisson and Alneas ( 1 974) . a smal l decrease in the height of the alveolar crest may be of great cl in ical significance. The relationsh ip of orthodontic treatment to maturation changes in the periodontium is not clear. Our findings in this respect also indicate the need for further investigation.
The finding that in the present investigation subjects with different malocclusions may have similar skeletal and soft tissue profiles is evidence of the inadequacy of a classification based on dental characteristics for the purpose of comparing changes in different groups during and following orthodontic treatment. It is apparent from our profile study that a classification system should be used which evaluates both dental and skeletal characteristics to reduce individual variabil ity with in the groups to be compared. Our method of selecting different groups by the similarity of the profi le possibly resulted in finding significant differences of skeletal changes between the three groups compared. Th is is in contrast to the findings of de Laat ( 1 974) . who reported no skeletal differences in 50 Begg cases classified as Class I or Class I I malocclusions and compared on this basis. The difference in results of the two studies is probably due to the difference in the method of analysis.
An aspect of the changes in the posttreatment period, are those changes which occur in the retention period. These were not examined, as the primary interest was an evaluation of treatment results over a longer period and because it is clear that the situation at the end of treatment can be largely maintained as long as retention procedures are continued. Nevertheless, some remarks on the retention period in relation to posttreatment changes can be made. Despite similar treatment and retention procedures, different types and amounts of posttreatment change were observed due presumably to biological factors which influence the effects of treatment, or the incompatabil ity of treatment changes with the oral environment. It seems that long term retention is unl ikely to offer additional stabil ity but rather postpones the posttreatment changes. I t is suggested that short term retention procedures are general ly preferable.
Although relapse was found in a number of situations it is obvious that it is usually l im ited and that substantial improvements of the occlusion, oral health
and general aesthetic appearance of dentition and face were attained. An "ideal" occlusion was strived for but there are numerous influencing factors which supervene on the changes due to treatment and cause various posttreatment changes. We were not able to compare our results with a relevant group of cases treated with other techniques; nevertheless results of studies reported in the l iterature suggest that the final average results are similar irrespective of the technique employed.
1 24
Overbite (vertical ) tended to increase in the posttreatment period and it was observed that a large initial overbite tended to be large at the final examination. However, it is important to note that there were also individual cases with a large in itial overbite in which a large decrease of overbite during treatment was relatively stable in the posttreatment period. A number of factors in the posttreatment period were identified which were related to an overbite increase in the posttreatment period: a forward rotation of the occlusal plane sometimes accompanied by a molar intrusion; an increase in overjet; a retrocl ination of mandibular i ncisors; and an increase in interincisal angulation. These factors enumerated are al l dental in nature and closely related by their physical proximity. It seems unl ikely that their contri
bution to overbite instabil ity is substantia l . Probably the most important factor identified is that of the direction of condylar growth. A vertical di rection of condylar growth was shown to be related to overbite relapse whi le a sagittal direction of condylar growth was associated with overbite stabi l ity. Although overbite relapse was greatest when a vertical direction of condylar growth was observed, this factor should not necessari ly be a contraindication for the treatment of a deep overbite. Rather, a different timing of treatment may be indicated as advocated by Bjork ( 1 969) . He suggests that a stabi l ising appl iance, such as a bite plane, introduced before puberty wi l l prevent the type of deep overbite developing which is found with vertical condylar growth and a forward rotation of the mandible.
Overjet in the posttreatment period was largely stable although in a few cases some relapse was found to occur. The fol lowing factors were found to be associated with an overjet relapse: an increase in overbite; an increase in the interincisal angle and a retrocl ination of proclined mandibular incisors. The most important factor
would seem to be the retrocl ination of a proclined incisor, as it appears to bear a d irect causal relationship to the relapse of overjet. This factor was also found to be related to a decrease in mandibu lar arch cirumference and hence an increase in crowding. De Laat ( 1 974) studied the changes occurring when different techniques are used. He found that lower incisor retraction in the treatment period was greater in subjects treated with the Tweed technique than with the R iedel or Begg technique. One factor responsible for this phenomenon may be the amount and direction of forces used during treatment. However, it may also be due to a difference in severity of malocclusions: severe malocclusions are l ikely to have a greater procl ination of lower incisors. A change in inc l ination of the max i l lary incisors in the posttreatment period was not observed to be associated with overjet relapse. An interesti ng finding is the absence of an observabl e relationship between posttreatment changes in mandibular rotation and overjet. I n fact no statistical relationship was found between mandibular rotation in the posttreatment period and changes within the dental arches.
1 25
I ncreases in the anterior dental arch ci rcumference in the treatment period tended to be unstable in the posttreatment period and decreases occur which result in reappearance of crowding. These changes were closely associated with those of intercanine width. However, it is noteworthy that despite a net mean increase in mandibular intercanine width in cases with a sagittal d irection of condylar growth, a similar relationsh ip was not observed between the anterior dental arch circumference and condylar growth. It is important to note that in some cases substantial net decreases in crowding occurred wh i le in other cases crowding remained u nchanged or increased. From the findings of the present investigation and the opinions expressed in the literature, it is clear that the reasons for the reappearance of crowding or the stabi lity of arch circumference is a complex problem. Several factors have been identified although their relative importance in individual cases is u nclear.
1 26
summary
The purpose of the investigation described in this thesis was to study in retrospect a number of changes of the dentition, its occlusion and the facial skeleton which occurred in the treatment and posttreatment periods in a sample of 30 cases treated with the Begg fixed appl iance techniques. Seventeen of these cases had malocclusions which were classified as Class I I division 1 , six as borderl ine and seven as Class 1 .
The second chapter deals with the material and the methods of investigation. Dental casts and lateral cephalometric radiographs were used which recorded the status of the subjects at the start of treatment ( initial examination ) , at the removal of the fixed appliance and the result at least one year after retention procedures had ended (final examination) . A detai led account was given of the methods and errors of the methods of measuring on dental casts and lateral cephalometric radiographs. This includes an account of the Bjork structural method of superimposing mandibles.
I n Chapter 3 changes in overbite are described. It was found that overbite tended to be the same at the initial and final examinations. However, subjects with a large initial overbite tended to have a greater net decrease in overbite than those subjects with a smal l in itial overbite. Moreover, in some subjects with a large initial overbite a considerable net decrease occurred and in others the net change was minimal.
The vertical changes in the positions of the incisors and the change in incl ination of the occlusal plane are examined in chapter 4. The changes in incl i nation of the occlusal plane were examined using the Bjork structural method of superimposition, Furthermore these changes were examined in relation to overbite. During the period of treatment mandibular incisors were either i ntruded, remained vertical ly stable or erupted. I ntrusion was related to a large decrease in overbite in
1 27
this period. I n the posttreatment period incisors general ly erupted. These posttreat· ment changes were not found to be related to posttreatemnt changes in overbite. Mandibular molars appeared to erupt or were extruded during treatemnt and were intruded or erupted further in the posttreatment period. The extent of the overbite decrease during treatment was related to the extent of incisor intrusion, molar extrusion and a consequent backward rotation of the occlusal plane. The occlusal plane was observed to rotate backward in 1 8 cases during treatment and forward in 12 of these cases in the posttreatment period. A number of cases were also found in which the rotation was either backward or forward throughout the period of investigation. A forward rotation of the occlusal plane in the posttreatment period was related to an increase in overbite. Backward rotation during the treatment period was due to a greater occlusal positioning of mandibu lar molars than mandibular incisors whi le in the posttreatment period a forward rotation was due to a greater occlusal positioning of incisors relative to the mandibular molars. Maxil lary incisors general ly erupted during and fol lowing treatment. These changes were not shown to be associated with changes in overbite.
The changes in overjet are described in Chapter 5. I rrespective of the size of the initial overjet a large amount of stabil ity was found in the posttreatment period. I n a few cases with a large initial overjet some relapse occurred although never t o the extent of the reduction during treatment. Changes in overjet were found to be related to those of overbite.
I n Chapter 6 the sagittal inclination of maxi l lary and mandibu lar incisors are discussed. The interrelationship of these changes were examined as wel l as their relationship to changes in overbite and overjet. Changes in inc l ination of mandibular incisors during treatment were general ly not found to be stable in the posttreat· ment period. This, in contrast to changes in incl ination of the maxi l lary incisors which were quite stable and tended to procline only slightly in the posttreatment period. Mandibular incisors which were retrocl ined at the initial examination in Class I I division I cases and which were proclined duri ng treatment were found to be stable. Similarly, proclined mandibular incisors in Class I cases which were retroclined in the treatment period were also stable. Retrocl ination of mandibular incisors in the posttreatment period were related to increases in overjet and overbite in th is period. Posttreatment increases in the interincisal angle were also related to increases in overbite and overjet although posttreatment changes in inclination of the maxi l lary incisors were not.
Chapter 7 deals with intercanine width and anterior dental arch circumference of
maxil lary and mandibular dental arches. An increase in dental arch circumference is analogous to a decrease in crowding of incisors and canines. The dimensions of all
four variables examined were generally found to increase in the treatment period and to decrease in the posttreatment period. These changes were related.
1 28

No net change i n mand ibular i nterca nine width was found. However, sig
nificant mean net i ncrease of the max i l lary i ntercanine width, the mand ibular
anterior dental arch circumference and the maxi l l ary anterior dental arch circum
ference were found. The net mean increases in arch circumference ind icate net
mean decreases in crowdi ng. Furthermore, changes in i ndividual cases were highly
variable. In some cases a substantial net increase occured and in others a net
decrease. A factor found to be related to a decrease in mandibular arch circum
ference in the posttreatment period was a retrocl ination of mandibular i ncisors i n
th is period.
Using the Bjork structural method of superimposing mandibles the direction of
condylar growth, the change in i ncli nation of the mandibular plane as wel l as
mandibular rotation were examined.
In Chapter 8 the direction of condylar growth and change in i ncl i nation of the
mandibular plane are examined. Thereafter, the di rection of condylar growth was
examined in relation to vertical changes in the dental arches, the overbite and the
dental arch dimensions. The sample was divided into two groups on the basis of the
direction of condylar growth (vertical or sagitta l ) and further subdivided i nto four
subgroups on the basis of a large or small overbite. This aspect of the study revealed
that the treatment of a large initial overbite was successful when the direction of
condylar growth was sagittal . A relapse of a large initial overbite occurred when the
direction of condylar growth was vertical . No differences in the changes in occlusal
plane i nc l ination or the vertical positions of the i ncisors were found when a deep
overbite with a vertical or sagittal d irection of condylar growth was treated. A
greater increase in mandibular intercanine width was observed when the di rection
of condylar growth was sagittal , but, this was not observed for the mandibular
dental arch circumference. Changes in mandibular plane incl ination were found to
be related to those of overbite.
The analysis of mandibular rotation in Chapter 9 showed that a backward
rotation frequently took place in the treatment period. However, no i ndividual
factor was shown to be of influence. I n the posttreatment period a forward rotation
occured in a l l cases except one. This, was not found to be related to changes in
overbite, overjet or a ny other variables examined. The total mandibular rotation
was found to differ between subjects with a sagittal or vertical d irection of condylar
growth : the forward rotation of the mandible was significantly greater in subjects
with a vertical direction of condylar growth.
The facial profile is discussed in Chapter 1 0. The sample was divided i nto three
groups by an inspection of profile photographs. The profi les of the three groups
were compared subjectively and using cephalometric measurements. At the start of
treatment the group with the poorest facial appearance had the most prominent
middle facial structures in relation to the facial plane. Between the i nitial and final
1 29
examination the sagittal jaw discrepancy decreased by the greatest amount in this
group. Additionally, this group had the greatest decrease in skeletal convexity.
Sagittal changes in i ncisor position were similar for a l l three groups and no signifi·
cant differences were shown in the changes of the soft tissue profi le. In a l l three
groups the l ips became l ess prominent in relation to the face. At the final examina
tion the differences found between the three groups at the start of treatment were
sti l l present.
I n Chapter 1 1 an evaluation of the status of the dentition and periodontal tissue
at the final examination is given. A smal l number of periodontal pockets were
found in the majority of subjects. However, in two subjects with poor oral hygiene
a large number of pockets were found. R oot resorptions were found to a sma l l
degree in a number of patients. I n only one case were the resorptions marked and
widespread. In two cases horizontal ly impacted,mand ibu l ar molars were found and
in two other cases mandibular molars were mesio-horizontal ly impacted. In the
remaining cases they were erupting or positioned normal ly.
In the general discussion, Chapter 1 2, a number of observations pertinent to the
investigation are made and the findi ngs of the previous chapters coordi nated. A
number of suggestions for subsequent l ongitudinal studies are made. The resu lts of
treatment are discussed and a number of factors enumerated which were found to
be associated with stabil ity or relapse of the results attai ned at the end of treat
ment.
1 30
References
ANGLE, E.H. : Some new forms of orthodontic mechanism, and the reasons for their introduc·
tion. Dental Cosmos 58: 969-994, 1 9 1 6.
ARNOLD, M.L. : A study of the changes of the mandibular intercanine and intermolar widths
during orthodontic treatment and following a post-retention period of five or more years.
Diss. Seattle, 1 963. BEEK, J.M. and L I N D EN , F.P.G.M. van der: De projecties van hoeken en l ijnstu kken bij
schedel-rontgenfoto's met behulp van de Groninger cephalostat en opnametechniek. Ned.Tijdschr.Tandheelkd. 65:565-577, 1 958.
BEGG, P.R.: Stone age man's dentition with reference to anatomically correct occlusion, The aetiology of malocclusion, and a technique for its treatment. Am.J.Orthod. 40:298-3 1 2, 373-383, 462-475, 51 7-53 1 , 1 954.
B EGG, P.R. : Differential force in orthodontic treatment. Am.J.Orthod. 42: 481 -5 1 0, 1 956.
B EGG, P.R. : light arch wire technique employing the priciple of differential force. Am.J.Orthod. 47: 30-48, 1 96 1 .
B EGG, P.R. Begg orthodontic theory and technigue Philadelphia, Saunders, 1 965.
BEGG, P.R. and KESLING, P.C.: Begg orthodontic theory and technique. 2nd ed. Philadelphia, Saunders, 1 97 1 .
BIJLSTRA, R.J.: Vertical changes during Begg treatment. I n : Transactions of the European Orthodontic Society, 1 969, 385-393. London, European Orthodontic Society, 1 970.
BISHARA, S.E., CHADHA, J.M. and POTTER, R.B. : Stabi l ity of intercanine width, overbite
and overjet correction. Am.J.Orthod. 63: 588-595, 1 973.
BJORK, A.: The face in profile. Lund, Berlingska baktryckeriet, 1 947.
BJORK, A.: Facial growth in man, studied with the aid of metallic implants. Acta Odontoi.Scand. 1 3: 9-34, 1 955.
BJORK, A.: The relationship of the jaws to the cranium. I n : I ntroduction to orthodontics,
1 04-140. Ed. by A. Lundstrom, New York, MCGraw-Hi l l , 1 960.
BJOR K, A. : Variations in the growth pattern of the human mandible: longitudinal radiographic
study by the implant method.
J.Dent.Res. 42: 400-4 1 1 , 1 963. BJORK, A.: Prediction of mandibular growth rotation.
Am.J.Orthod. 59 : 585-599, 1 969. BJOR K, A. and SKI E L LER, V.: Facial development and tooth eruption. An implant study at
the age of puberty. Am.J.Orthod. 62: 339-383, 1 972.
BRANDT, S. : The Kesling and Rocke orthodontic group. J.Ciin.Orthod. 5: 2 1 3-223, 1 9 7 1 .
CHADHA, et a l : see Bishara, S.E.
1 31
COPPES, L.: Routine-sulcus dieptemetingen in de parodontologie; het belang - de betrouwbaarheid - de toepassi ng, Oiss. Amsterdam GU, 1 972.
COX, N.H. and LINDEN, F.P.G.M. van der: Facial harmony. Am.J.Orthod. 60: 1 75-1 83, 1 97 1 .
DERMOUT, L.A . : Aspecten van recidief e n stabiliteit na orthodontische therapie. Diss. Groningen, 1 974.
DOWNS, W.B.: Variations in facial relationships: their significance in treatment and prognosis.
Am.J.Orthod. 34: 8 1 2-840, 1 948. DUTER LOO, H .S. : Personal communication, 1 974.
EN LOW, D.H. : The human face. New York, Harper and Row, 1 968.
GRABER, T.M. : Postmortems in posttreatment adjustment. Am.J.Orthod. 52 : 331 -352, 1 966.
GRANO, D.J. : A radiographic cephalometric study of certain tooth movements observed in the postretention period of deep overbite cases treated with the Begg technique. Am.J.Orthod. 60: 202-203, 1 97 1 .
HUGGINS, D.G. and BI RCH, R . H . : A cephalometric investigation of stabil ity of upper incisors following their retraction. Am.J.Orthod. 50: 852-856, 1 964.
JAM ES. A.T. : Changes in vertical relationship of teeth during and following use of Begg l ight wire differential . Am.J.Orthod. 55: 90-9 1 , 1 969.
JOHANNESEN, B . : Overjet and labia-lingual position of incisor teeth in treatment Class I I ,
division 1 malocclusions.
Diss. Oslo, 1 972.
JONG, H . de: l nleiding tot de medische statistiek. 2e dr. Groningen, Wolters-Noordhoff, 1 963.
K ESLI NG, et al : see Brandt, S. KNOTT, V.B. : Longitudinal study of dental arch widths at four stages of dentition.
Angle Orthod. 42 : 387-394, 1 972.
LAAT, R .C. de: Orthodontics and the facial profile.
Diss. Amsterdam VU, 1 974. LAV E LLE, C.L. and FOSTER, T.D. : A cross-sectional study into age changes of the human
dental arch.
Arch.Orai .Biol. 1 4: 7 1 -86, 1 969. LI NDEN, F.P.G.M. van der, BOERSMA, H. and ZELDERS, T. et al : Three-dimensional analysis
of dental casts by means of the Optocom.
J.Dent.Res.5 1 : 1 1 00, 1 972.
LUDW I G, M.K. : An analysis of anterior overbite relationship changes during and following
orthodontic treatment. Angle Orthod. 6 : 204-21 0, 1 966.
MAG I LL, J.M.: Changes in the anterior overbite relationship following orthodontic treatment in extraction cases. Am.J.Orthod. 46: 755-788, 1 960.
Ml LLS, J .R . : The long-term results of the proclination of the lower i ncisors. Br .Dent.J. 1 20: 355-363, 1 966.
1 32
M l LLS, J.R.: A long-term assessment of the mechanical retroclination of lower incisors. Angle Orthod. 37: 1 65-174, 1 967.
MOF F ETT, B.C.: Remodel ling of the craniofacial articulations by various orthodontic appliances in Rhesus monkeys. I n : Transactions of the European Orthodontic Society, 1 97 1 ,
207-216.
London,European Orthodontic society, 1 972. MOO R R E ES, C.F., GR0N, A.M., L E B R ET, L.M. et al : Growth studies of the dentition: a
review.
Am.J.Orthod. 55: 600-61 6, 1 969.
MOYERS, R.E. : Handbook of orthodontics, 3rd ed. Chicago, Year Book Medical Publ ishers, 1 973.
NANCE, H .N . : The limitations of orthodontic treatment. I. Mixed dentition diagnosis and
treatment. Am.J.Orthod. 33: 1 77-233, 1 947.
NANCE, H.N. : The l imitations of orthodontic treatment. I I . Diagnosis and treatment in the
permanent dentition.
Am.J.Orthod. 33: 253-301 , 1 947. ODEGAARD, J.: G rowth of the mandible studied with the aid of metal implant.
Am.J.Orthod. 57: 1 45-1 57, 1 970. R EITAN, K,: Cl inical and histological observations on tooth movement during and after ortho
dontic treatment. Am.J.Orthod. 53: 721 -745, 1 967.
R EITAN, K.: Biomechanical principles and reactions. In: Current orthodontic concepts and
techniques, vol l . 56-1 59. Ed. by T.M. Graber, Philadelphia, Saunders, 1 969.
AI EDEL, A .A.: A review of the retention problem. Angle Orthod. 30: 1 79-1 94, 1 960.
AI EDEL, A.A.: Retention. I n : Current orthodontic concepts and techniques, vol I I . 875-918. Ed. by T.M. Graber, Philadelphia, Saunders, 1 969.
SCHUDY, F . F . : Sound biologic concepts in orthodontics.
Am.J.Orthod. 63: 376-397, 1 973.
SHAPI RO. P.A.: Mandibular dental arch form and dimension: treatment and postretention changes.
Am.J.Orthod. 66: 58-70, 1 974.
S H E I H AM , A.: The prevalence and severity of periodontal disease in British populations. Dental surveys of employed copulations in Great Britain Br.Dent.J. 1 26: 1 1 5-1 22, 1 969.
S H E I HAM, A. : The prevalence and severity of periodontal disease in Surrey school children.
Dent.Pract. 1 9 : 232-238, 1 969. Sl LLMAN, J.H., Dimensional changes of the dental arches: longitudinal study from birth to 25
years. Am.J.Orthod. 50: 824-842, 1 964.
S I MONS, M.E. and JOON D EPH, D.R. : Change in overbite: a ten-year postretention study. Am.J.Orthod. 64: 349-367, 1 973.
S I MS, M.A. : Anchorage variation with the lightwire technique. Am.J.Orthod. 59: 456-469, 1 97 1 .
1 33
SJO L I EN, T. B.U.: Periodontal bone support and tooth length in orthodonticall y treated and untreated persons. Am.J.Orthod. 64: 28-37, 1 973.
SOLOW, 8.: The pattern of craniofacial associations; a morphological and methodological
correlation and factor analysis on young male adults. Diss. Copenhagen, 1 966.
SUBTELNY, J. D. : Longitudinal study of soft tissue facial structures and their profile characteristics, defined in relation to underlying skeletal structures.
Am. J. Orthod. 45: 48 1 -507, 1 959.
SWA I N , B.F. : Begg differential light forces technique. I n : Current orthodontic concepts and
techniques, 585-814. Ed.by T.M. Graber, Philadelphia, Saunders, 1 969.
SWA I N , B.F. and ACKERMAN, J.L. : an evaluation of the Begg technique. Am.J.Orthod. 55: 668-687, 1 969.
WAL TEA, D.C.: Changes in the form and dimensions of dental arches resulting from orthodontic treatment. Angle Orthod. 23: 3-1 7, 1 953.
WALTER, D.C.: Comparative changes in mandibular canine and first molar widths.
Angle Orthod. 32: 232·241 , 1 962. WEELE, L.Th. van der, S LU I S, D.M. van der, en M EER, T. van der: Handleiding WESP.
Groningen, Rekencentrum, Rijksuniversiteit, 1 974. WI LLIAMS, R . : The cant of occlusal and mandibular planes with and without pure Begg
technique. J.Pract.Orthodont. 1 1 : 496·505, 1 968.
WI LLIAMS, R . : Cephalometric appraisal of the light wire technique. I n : Begg orthodontic theory and technique, 61 3·628.
By P.R. Begg and H .D . Kesling, Philadelphia, Saunders, 1 97 1 .
ZACH R I SSON , B . U . and A LNAES, L . : Periodontal condition in orthodontically treated and
untreated individuals. I . Loss of attachment, gingival pocket depth and clinical crown height.
Angle Orthod. 43: 402-41 1 , 1 973.
ZAC H R I SSO N, B.U. and ALN A ES, L. : Periodontal condition in orthodontical ly treated and untreated individuals. I I . Alveolar bone loss. Angle Orthod. 44: 48-55, 1 974.
ZACHR ISSON, B.U. and ZAC H R I SSON,S.: Caries incidence and orthodontic treatment with fixed appliances. Scand. J.Dent.Res. 79: 1 83-192, 1 971 .
ZACHRISSO N , B.U. and ZAC H R I SSON, S. : Caries incidence and oral hygiene during ortho· dontic treatment. Scand.J.Dent.Res. 79 : 394-401 , 1 97 1 .
ZACHR ISSON, S . and ZACHRISSON, B.U.: Gingival condition associated with orthodontic treatment. Angle Orthod . 42 : 26·34, 1 972.
1 34