University level Initiative 2.3 The Great Place Initiative
29
1
Transcript of University level Initiative 2.3 The Great Place Initiative

1

2
University level Initiative 2.3
The Great Place Initiative
Team 2: Mark Polatajko, Alfreda Brown, Jack WittChairs: Mandy Munro-Stasiuk & Dana Lawless-Andric
3

4
The Goal of GPI
Make Kent State University a great place tolearn, work, and live.
Connected Core Values:• A living-learning environment that creates a genuine sense of place• Engagement that inspires positive change• Diversity of culture, beliefs, identity and thought• Freedom of expression and the free exchange of ideas• A collaborative community• Respect, kindness and purpose in all we do
4/30/2018

5
Data-driven and iterative process
4/30/2018
• Climate Survey• COACHE• NSSE• Great Colleges to
Work For
6
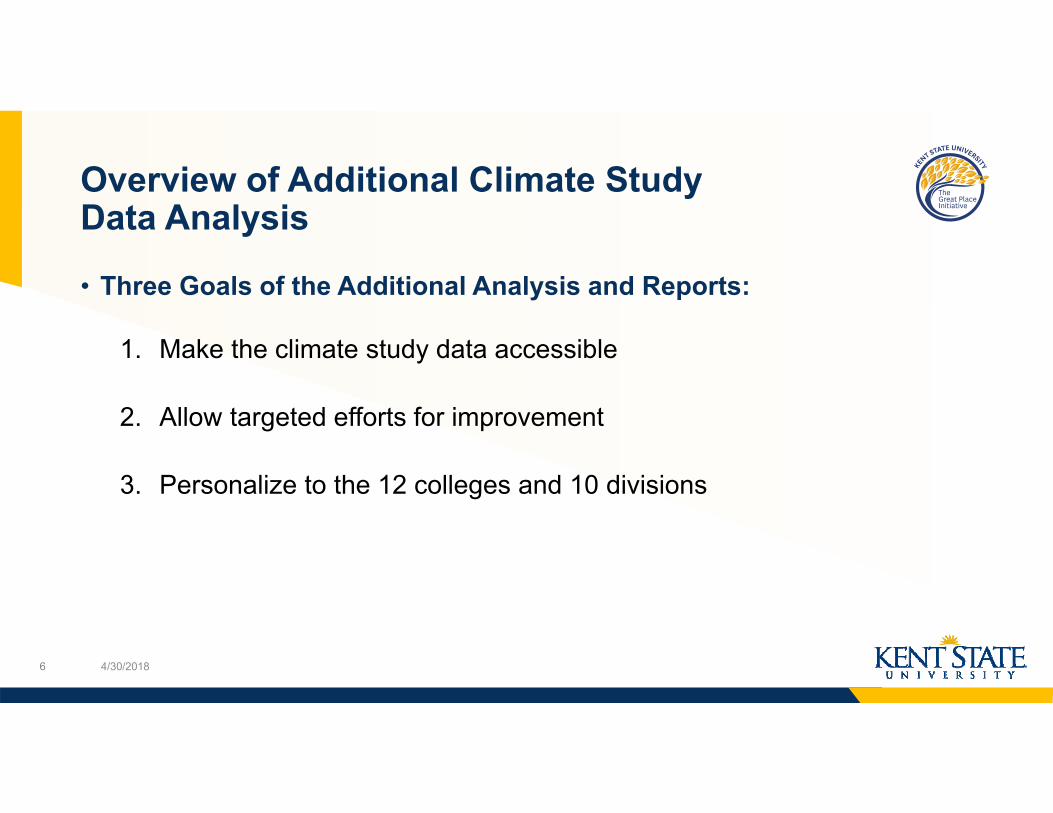
Overview of Additional Climate Study Data Analysis
• Three Goals of the Additional Analysis and Reports:
1. Make the climate study data accessible
2. Allow targeted efforts for improvement
3. Personalize to the 12 colleges and 10 divisions
4/30/2018

7
Methodology for Creating Individual Reports
4/30/2018
Yi = a + ΔXi + β*COLLEGEi + εiDemographic Variables Included in Regression (X)
Students Staff Faculty• Gender• Race• Citizenship• Disability• Sexual Orient.• Transfer• Ph.D./Master’s• Living Situation• Low‐Income• First Gen.
• Gender• Race• Citizenship• Disability• Sexual Orient.• Type of Position• In Union CBA• Age• Full‐time• Education
• Gender• Race• Citizenship• Disability• Sexual Orient.• Faculty Type• Rank• Age
Green –significantlybetter scores
Red –significantly worse scores

8 4/30/2018
Level of Comfort with Overall Climate
Comfort with Climate in Classroom
Seriously Considered Leaving KSU
Experienced Exclusionary Behavior
Experienced Unwanted
Sexual Contact
Missing or Unknown 5 * * * * *Woman (Reference Category) 3182 4.02 4.02 29.3% 12.8% 7.0%Man 1486 4.03 4.11 28.9% 11.6% 1.7%Transspectrum (including Other) 72 3.83 3.81 37.5% 37.5% 11.1%Missing/Unknown/Other 46 3.59 3.74 48.9% 30.4% 6.5%White (Reference Category) 3500 4.07 4.07 28.8% 11.6% 5.7%Alaskan Native/Am Ind 5 * * * * *Asian/Asian American/Southeast Asian 382 3.99 4.14 20.4% 12.0% 1.0%Black/Afr American 361 3.72 3.76 36.0% 18.1% 4.7%Hispanic/Latin@/Chican@ 83 3.86 3.90 34.9% 13.3% *Middle Eastern 81 3.90 4.06 30.9% 23.5% *Pacific Island/Native Hawaiian 9 4.22 4.00 * * *Two or More 278 3.95 3.99 34.8% 16.8% 9.0%Missing, Other or Unknown 17 3.76 3.88 * * *No Disability (Reference Category) 4203 4.03 4.06 28.0% 11.0% 4.5%Disability 394 3.94 3.89 41.0% 24.6% 11.4%Multiple Disability 131 3.75 3.88 36.2% 35.1% 16.0%Missing/Unknown/Other 110 3.92 4.07 28.8% 20.7% 8.1%Heterosexual (Reference Category) 3794 4.02 4.05 28.7% 11.2% 4.8%LGBQ including Pansexual 557 4.03 4.00 33.4% 20.3% 9.0%Asexual 284 3.96 4.04 29.1% 16.1% 5.3%
Table 1A:Student Overall
Climate QuestionsDemographic Results
Gen
der
Race
Disability
Sexu
al
Orie
ntation
Climate Questions (number is average on 5 point scale; higher number is better)
Yes/No Questions (Number is % saying "Yes")
Number of Obser‐vations Green –
significantlybetter scoresRed –significantly worse scores

9 4/30/2018
Num
ber o
f Observatio
ns
"I fe
el value
d by fa
culty
in th
e classroo
m."
"I fe
el value
d by other stud
ents in
the classroo
m."
"I th
ink that Ken
t State fa
culty
are
genu
inely co
ncerne
d with
my
welfare."
"I th
ink that Ken
t State staff a
re
genu
inely co
ncerne
d with
my
welfare (e
.g., resid
ence hall staff)."
"I th
ink that fa
culty
pre‐ju
dge my
abilitie
s based
on their p
erception
of m
y iden
tity/ba
ckgrou
nd (e
.g. a
ge,
race, d
isability, gen
der)." ‐‐
REVE
RSED
"I believe th
at th
e campu
s clim
ate
enco
urag
es free
and
ope
n discussio
ns of d
ifficult top
ics."
"I have faculty
who
m I pe
rceive as
role m
odels."
"I have staff w
hom I pe
rceive as
role m
odels."
"I have ad
visers who
provide
me
with
advice on
core class s
electio
n."
"I have ad
visers who
provide
me
with
caree
r advice."
"My vo
ice is valued
in cam
pus
dialog
ues."
Missing or Unknown 5 * * * * * * * * * * *Woman (Reference Category) 3175 3.93 3.73 3.73 3.68 3.11 3.82 3.97 3.67 3.80 3.94 3.54Man 1486 3.97 3.77 3.78 3.70 2.95 3.77 3.90 3.59 3.70 3.83 5.51Transspectrum (including Other) 72 3.82 3.40 3.66 3.69 2.76 3.57 4.22 3.96 3.57 3.69 3.32Missing/Unknown/Other 45 3.78 3.49 3.53 3.48 2.76 3.16 3.67 3.40 3.80 3.76 3.11White (Reference Category) 3494 3.93 3.74 3.75 3.69 3.20 3.82 3.99 3.64 3.75 3.89 3.52Alaskan Native/Am Ind 5 * * * * * * * * * * 3.600Asian/Asian American/Southeast Asian 383 4.28 4.12 4.05 4.01 2.45 4.07 3.97 3.85 3.94 4.01 3.83Black/Afr American 358 3.78 3.46 3.54 3.45 2.66 3.58 3.73 3.62 3.73 3.92 3.42Hispanic/Latin@/Chican@ 83 4.00 3.63 3.84 3.76 2.89 3.80 3.92 3.70 3.77 3.72 3.63Middle Eastern 79 3.92 3.91 3.70 3.62 2.51 3.69 3.75 3.58 3.73 3.80 3.48Pacific Island/Native Hawaiian 9 3.89 3.44 3.67 3.67 3.22 3.44 3.56 3.67 3.33 3.22 3.33Two or More 279 3.84 3.61 3.58 3.50 2.83 3.65 3.92 3.58 3.76 3.97 3.40Missing, Other or Unknown 17 3.88 3.71 3.71 3.87 2.88 3.94 3.94 3.63 3.76 3.94 3.47No Disability (Reference Category) 4193 3.95 3.76 3.76 3.70 3.06 3.82 3.96 3.66 3.79 3.92 3.55Disability 394 3.85 3.57 3.66 3.56 3.03 3.65 3.92 3.58 3.55 3.75 3.32Multiple Disability 131 3.70 3.36 3.49 3.54 2.98 3.57 3.93 3.56 3.57 3.66 3.28Missing/Unknown/Other 110 4.09 3.96 3.84 3.84 2.55 3.95 4.06 3.90 3.86 3.93 3.60Heterosexual (Reference Category) 3784 3.93 3.74 3.75 3.68 3.11 3.80 3.94 3.64 3.77 3.91 3.52LGBQ including Pansexual 557 3.90 3.61 3.74 3.68 2.94 3.74 4.05 3.62 3.69 3.82 3.50Asexual 284 4.01 3.82 3.73 3.74 2.70 3.95 3.91 3.80 3.83 3.85 3.65
Table 2A: Student Feelings of Value and Interactions with Faculty/Staff
(number is mean on 5 point scale with higher number better; color reflects
statistical significance in regerssion analysis)
Gen
der
Race
Disability
Sexu
al
Orie
ntation
Green –significantlybetterscores
Red –significantly worsescores

10
College/Division-Specific Results
4/30/2018
Green –significantlybetter scores
Red –significantly worse scores
Student Success Question WordingCampus Average
Median College
Best College
College A Average
Col. A Rank (out of 12)
"I feel valued by faculty in the classroom." 3.94 3.89 4.21 4.08 2"I feel valued by other students in the classroom." 3.74 3.77 4.06 3.80 4"I think that Kent State faculty are genuinely concerned with my welfare."
3.75 3.76 3.94 3.89 2
"I think that Kent State staff are genuinely concerned with my welfare (e.g., residence hall staff)."
3.69 3.67 3.93 3.76 3
"I think that faculty pre‐judge my abilities based on their perception of my identity/background (e.g. age, race, disability, gender)." (REVERSED)
3.05 3.03 3.41 3.15 4
"I believe that the campus encourages free and open discussion of difficult topics."
3.80 3.77 3.97 3.97 1
"I have faculty whom I perceive as role models." 3.96 3.93 4.10 4.10 1"I have staff whom I perceive as role models." 3.65 3.63 3.84 3.74 4"I have advisers who provide me with career advice." 3.76 3.82 3.96 3.84 5"I have advisers who provide me with advice on core class selection."
3.90 3.93 4.15 4.03 2
"My voice is valued in campus dialogues." 3.53 3.54 3.81 3.70 2
Number of Observations 4735
Table 2B: Student Feelings of Value and Interactions with Faculty/Staff (Question 91) By College(higher number is better)
548

11
Question WordingCampus Average
College A
College B
College C
College D
College E
College F
College G
College H
College I
College J
College K
College L
"I feel valued by faculty in the classroom." 3.94 4.08 4.01 3.85 3.88 3.86 4.21 3.70 3.89 3.97 3.87 3.36 4.04"I feel valued by other students in the classroom." 3.74 3.80 3.80 3.85 3.60 3.71 4.06 3.42 3.74 3.79 3.74 3.76 3.81"I think that Kent State faculty are genuinely concerned with my welfare." 3.75 3.89 3.76 3.75 3.74 3.64 3.94 3.52 3.76 3.81 3.63 3.35 3.81
"I think that Kent State staff are genuinely concerned with my welfare (e.g., residence hall staff)." 3.69 3.76 3.70 3.71 3.62 3.63 3.93 3.57 3.63 3.78 3.71 3.53 3.64"I think that faculty pre‐judge my abilities based on their perception of my identity/background (e.g. age, race, disability, gender)." (REVERSED) 3.05 3.15 3.16 3.24 3.06 2.99 2.53 3.00 2.82 2.95 2.92 3.41 3.08"I believe that the campus encourages free and open discussion of difficult topics." 3.80 3.97 3.88 3.92 3.69 3.82 3.96 3.68 3.75 3.72 3.77 3.41 3.77"I have faculty whom I perceive as role models." 3.96 4.10 4.02 4.00 3.97 3.81 3.90 3.69 3.96 3.91 3.94 3.58 3.89"I have staff whom I perceive as role models." 3.65 3.74 3.74 3.82 3.58 3.53 3.84 3.51 3.60 3.71 3.56 3.35 3.65"I have advisers who provide me with career advice." 3.76 3.84 3.84 3.96 3.74 3.72 3.84 3.95 3.81 3.70 3.58 3.08 3.83"I have advisers who provide me with advice on core class selection." 3.90 4.03 3.97 4.15 3.84 3.89 3.99 4.00 3.84 3.84 3.71 2.95 4.01"My voice is valued in campus dialogues." 3.90 3.70 3.58 3.62 3.42 3.49 3.81 3.33 3.63 3.48 3.45 3.14 3.61
Table 2B: Student Feelings of Value and Interactions with Faculty/Staff By College
Differences Across Colleges: Table 2 Students
4/30/2018

12
Summary of Main Results from Climate Study Additional Analysis - Students• Area of Strength: Overall high level of comfort with climate at KSU and in
classrooms• Area for Improvement: Students feel pre-judged by their faculty • Systematic differences with worse outcomes for
• Black/African-American• Students with Disabilities• Males• Low-Income students
• There are not many differences across colleges in overall perception of climate or experiencing exclusionary behavior or unwanted sexual contact
• There are large and systematic differences across colleges in students’ perception of value and interactions with faculty/staff
4/30/2018

13
Summary of Main Results from Climate Study Additional Analysis - Staff
• Staff are more comfortable with overall climate at KSU than the climate in their department
• Area of Strength: Staff feel valued by the co-workers in their unit • Area for Improvement: Process for determining salaries/merit raises &
relationship with senior administration• Systematic differences with worse outcomes for
• Staff with Disabilities• Black/African-American• LGBQ
• There are not many differences across colleges/divisions for staff; biggest differences are for feel skills and contributions are valued, access to administrative support, and resources to manage work-life balance
4/30/2018

14
Summary of Main Results from Climate Study Additional Analysis - Faculty• Faculty have a lower assessment of overall climate than staff and administrators• Area of Strength: Faculty feel valued by students• Area for Improvement: Process for determining salaries/merit raises & RPT
process applied equally• Systematic differences with worse outcomes for
• Faculty with Disabilities• Black/African-American• LGBQ & Transpectrum• Asian/Asian American
• Tenure-track faculty are have lower scores than NTT or part-time faculty, particularly Associate Professors who are tenure-track
• Variation across colleges for faculty are dramatic
4/30/2018

15
Timeline and process
GPI committee formed and charged
All data sources shared
Subcommittees formed
Project management implemented
Short and long‐term goals established
Early Wins
4/30/2018
Data analyzed: COACHE, Climate, NSSE, Great Colleges to Work For
Supplemental Climate Study data analysis
Climate engagement sessions and efforts
College and Division Reports created
Colleges and Divisions asked to create action plans
College and Division action plans shared
Climate Change Webinars (Kathy Obear)
AACU High Impact Practices Institute
Retreat: Institutionalizing
Change
Understanding “Full Participation” – Timothy Eatman
Retreat: Project & Change
Management
January 2017 Present
Process
Data
Vertical Engagement
Informing our Work

16
Structure
Great Place Initiative
StudentsEboni Pringle & Lamar Hylton
FacultyTina Bhargava & Kathy Wilson
StaffKimberly Edge & Ken Ditlevson
Regional CampusesTim Pagliari & Larry Froehlich
4/30/2018
PLUS ad‐hoc committees on:• Disability • Black/African American experiences

17
Website
https://www.kent.edu/gpi4/30/2018

18
GPI Work Group Deliverables To Date
• Individualized Climate Study quantitative reports for each Kent campus college and division
• Climate Study Qualitative Reports • Targeted climate sessions with regional campuses; faculty; departments;
student groups; Academic Affairs leadership• Marketing and Branding
4/30/2018

19
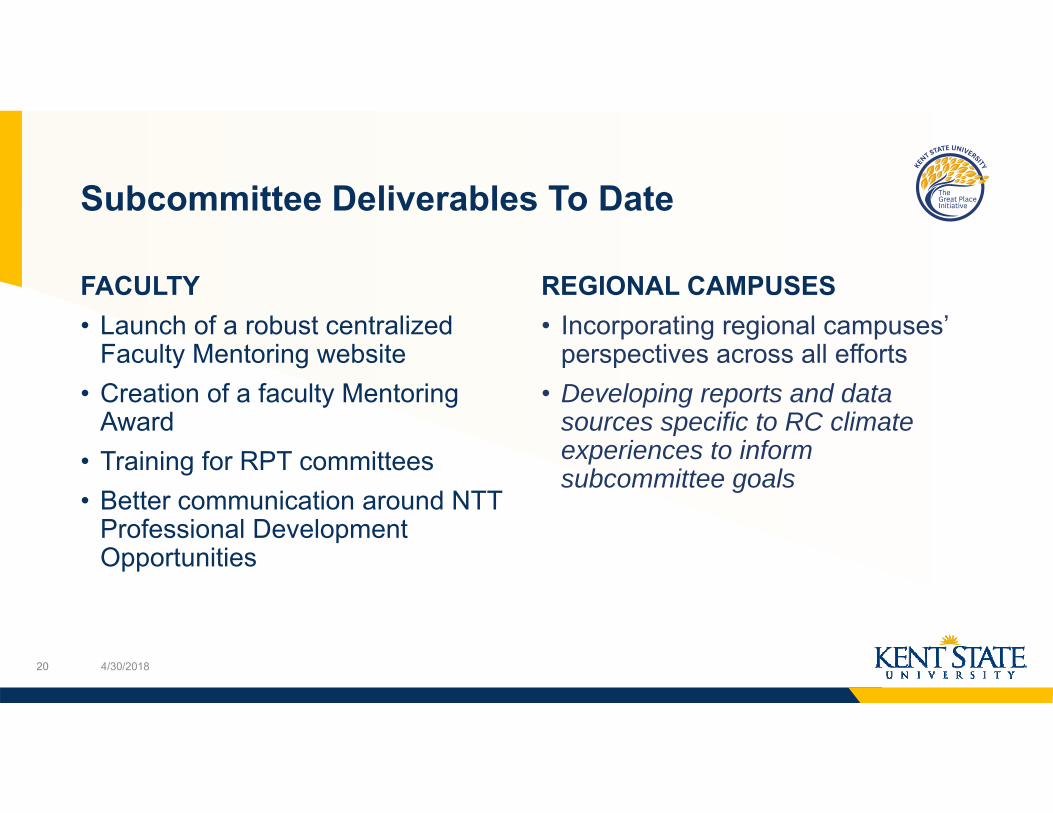
Subcommittee Deliverables To Date
STUDENTS• Creation of Climate Advisory
Network and Climate Response Team
• Develop an interactive portal for climate-related feedback
• Intentional efforts• Experiences of marginalized students• Unwanted Sexual Contact
STAFF• Draft proposal for Staff Council• Draft policy for Flexible Work
(combined efforts with Healthy Campus Initiative)
• Anti-bullying initiatives• Draft policy on bullying • Draft statement on bullying
4/30/2018
20
Subcommittee Deliverables To Date
FACULTY• Launch of a robust centralized
Faculty Mentoring website • Creation of a faculty Mentoring
Award• Training for RPT committees • Better communication around NTT
Professional Development Opportunities
REGIONAL CAMPUSES• Incorporating regional campuses’
perspectives across all efforts• Developing reports and data
sources specific to RC climate experiences to inform subcommittee goals
4/30/2018

21 4/30/2018

22
Accountability
• Assessment of all implemented efforts• Follow-up climate assessments• Colleges and Divisions charged with action plans
• Individualized regional campus reports
• Continuous feedback from community • Evolving long and short-term deliverables
4/30/2018
23
Questions?
24
Community Feedback

25
What ideas do you have to increase staff, student and/or faculty morale?
4/30/2018

26
What should Great Place focus on next year?
What is urgent?
27
Regarding the Great Place Initiative, what kinds of things do you want to hear about?And, what kind of things do you not care to
hear about?

28
How can we best communicate the work of The Great Place Initiative?

29
Thank You.www.kent.edu
4/30/2018