UNIVERSITY HOSPITALS AUTHORITY AND UNIVERSITY HOSPITALS TRUST
37
UNIVERSITY HOSPITALS AUTHORITY AND UNIVERSITY HOSPITALS TRUST Basic Financial Statements June 30, 2012 and 2011 (With Independent Auditors’ Report Thereon)
Transcript of UNIVERSITY HOSPITALS AUTHORITY AND UNIVERSITY HOSPITALS TRUST

UNIVERSITY HOSPITALS AUTHORITY AND UNIVERSITY HOSPITALS TRUST
Basic Financial Statements
June 30, 2012 and 2011
(With Independent Auditors’ Report Thereon)

UNIVERSITY HOSPITALS AUTHORITY AND UNIVERSITY HOSPITALS TRUST
Management’s Discussion and Analysis
June 30, 2012 and 2011
1 (Continued)
This section of the University Hospitals Authority (Authority) and University Hospitals Trust (Trust) Annual Financial Statements presents our discussion and analysis of performance during the fiscal years ended June 30, 2012 and 2011. For comparative purposes, fiscal year 2010 information is also provided. Please read the discussion and analysis in conjunction with the combined financial statements, which follow this section.
Financial Statements Overview
The Authority and Trust report financial results on a combined basis. Both the Authority and the Trust are statutorily mandated with the same mission and the financial resources of both entities are expended to accomplish our mission of Indigent Care, Medical Education and Research. The Authority and the Trust are a component unit of the State of Oklahoma.
The financial statements of the University Hospitals Authority and University Hospitals Trust are prepared on a proprietary basis as a business-like entity. The accrual basis of accounting is utilized and the measurement focus is on economic resources. All short-term and long-term assets and liabilities of the Authority and Trust, both financial and capital are provided. All revenues and expenses earned during the year are recorded regardless of when cash is received or paid.
The financial statements and information presented include:
Statement of Net Assets is the financial report that displays the Authority and Trust assets and liabilities and the difference between them (Net Assets). Changes in net assets, increases or decreases, is one way to measure the financial health of the entity and whether its financial position is improving or deteriorating. The responsibility of capitalizing the hospital operations shifted from the Authority to the Trust at the inception of the Joint Operating Agreement (JOA).
Statement of Revenues, Expenses and Changes in Net assets is the financial report that displays the operating results of the Authority and Trust.
The Authority and Trust utilize the accrual method of accounting which recognizes revenues at the time the earning process is complete and expenses when the liability is incurred regardless of the timing of related cash flows.
Statement of Cash Flows is the financial report that provides relevant information of the Authority’s and Trust’s sources of cash receipts and purposes for its cash disbursements. It demonstrates our ability to generate cash flows and our ability to pay our debts and obligations.

UNIVERSITY HOSPITALS AUTHORITY AND UNIVERSITY HOSPITALS TRUST
Management’s Discussion and Analysis
June 30, 2012 and 2011
2 (Continued)
The cash flow statements presented utilize the direct method of cash reporting, that is, cash receipts and disbursements reported are not netted or combined with other categories presented in the cash flow statements.
Net Assets
(Dollars in thousands)
2012-2011Percentage
2012 2011 2010 change
Current assets $ 76,617 64,317 66,588 19.1%Restricted assets 1,665 1,170 3,163 42.3Capital assets, net 244,726 233,648 202,602 4.7Other assets 20,102 20,108 20,114 (0.1)
Total assets $ 343,110 319,243 292,467 7.5%
Current liabilities $ 17,590 28,596 31,423 (38.5)%Long-term liabilities 49,170 50,150 51,250 (2.0)
Total liabilities $ 66,760 78,746 82,673 (15.2)%
Invested in capital assets,net of related debt $ 194,804 182,694 150,677 6.6%
Restricted for donated purposes 1,665 1,170 3,163 42.3Unrestricted 79,881 56,633 55,954 41.1
Total net assets $ 276,350 240,497 209,794 14.9%
Current assets increased $12.3 million in 2012 and is attributed primarily to net increases of Trust supplemental Medicaid cost reimbursement programs and joint operating income. Current assets decreased $2.3 million in 2011 and is attributed primarily to uses of Authority cash to maximize state match payments related to Medicaid cost reimbursement programs.
Restricted assets increased in 2012 due to receipts of restricted funds of $500 thousand. Restricted assets decreased in 2011 due to collection of restricted pledges of $2.0 million.
Net capital assets increased $11.1 million in 2012 and $31 million in 2011 due to the Trust’s investment in the construction of a new education building and atrium, increased investment in Trust property and equipment related to the hospital capital projects and equipment, and offset by annual depreciation.
Current liabilities decreased $11.0 million in 2012 as payables related to the construction of the education center and grant commitments to the O.U. Cancer Institute were paid in 2012.

UNIVERSITY HOSPITALS AUTHORITY AND UNIVERSITY HOSPITALS TRUST
Management’s Discussion and Analysis
June 30, 2012 and 2011
3 (Continued)
Composition of Net Assets (%) as of June 30
Invested in Capital Assets, net of
related debt and long-term debt
70%
Restricted for Donated Purposes
1%
Unrestricted 29%
2012
Invested in Capital Assets, net of related debt
76%
Restricted for Donated Purposes
1%
Unrestricted 23%
2011
Invested in Capital Assets, net of
related debtand long-term debt
72% Restricted for
Donated Purposes 1%
Unrestricted 27%
2010

UNIVERSITY HOSPITALS AUTHORITY AND UNIVERSITY HOSPITALS TRUST
Management’s Discussion and Analysis
June 30, 2012 and 2011
4 (Continued)
Changes in Net Assets
The Authority and Trust total revenues (operating revenues and net nonoperating revenues) decreased $14 million in 2012 from 2011 and increased $92.7 million in 2011 from 2010. Total revenues for 2012 and 2011 were $240.6 million and $253.9 million with 16% and 5.8% of the total revenues from appropriations for indigent care subsidies (appropriations or subsidies), respectively. Appropriations in 2012 of $38.4 million was an increase from fiscal year 2011’s $14.8 million in appropriations. Appropriations in 2011 was a decrease from fiscal year 2010’s $31.0 million in appropriations.
Another 55% and 69% of total revenues were from Teaching Hospital Reimbursement and Level I trauma programs in 2012 and 2011, respectively. These receipts decreased in 2012 from 2011, and increased in 2011 from 2010. For 2012, 2011 and 2010 the full pre-tax earnings preferential payments (joint venture revenue) of $9 million were earned and received. The University Hospitals Authority and Trust by virtue of a Joint Operating Agreement, receives the first $9 million of pre-tax earnings of the venture if earned. The Trust receives 30% share of total pre-tax earnings in excess of $39 million as specified in the Joint Operating Agreement. As hospital earnings increased in 2012 from 2011 and decreased in 2011 from 2010, excess earnings also increased in 2012 to $27.0 million and decreased in 2011 to $20.9 million.
Sources of Revenue
All Other 4%
Joint Venture Revenue 15%
Medicaid Teaching Hospital Revenue
55%
Investment Income less than 1%
Grant and Program Revenue
4%
GME Income 6%
Subsidies 16%
2012

UNIVERSITY HOSPITALS AUTHORITY AND UNIVERSITY HOSPITALS TRUST
Management’s Discussion and Analysis
June 30, 2012 and 2011
5 (Continued)
The University Hospitals Authority and Trust combined sources of revenues are from the following sources:
• Subsidies are appropriated for Indigent Care and state-matching amounts for Graduate Medical Education (GME) programs and Indigent Care programs.
• Medicaid Teaching Hospital receipts from the Oklahoma Health Care Authority reimburse the costs of providing care to Medicaid and charity patients. This also includes Level I trauma receipts from the Oklahoma State Department of Health that were authorized by the State Legislature to reimburse hospitals for the cost of Level I trauma centers.
• Grant and program revenues relate to Indirect Medical Education (IME), which is a state and federal matching program paid to major teaching hospitals with approved resident and intern programs to offset costs associated with such teaching programs and resultant increased Medicaid and Indigent volumes. The Trust provided the state matching share and received a net IME revenue available of $9.6 million in 2012 and $11.0 million in 2011.
• Joint Venture Revenue relates to the Joint Operating Agreement (JOA) between the Authority and Trust and HCA Health Services of Oklahoma, Inc. The JOA stipulates that the first $9 million of hospital pre-tax earnings is to be paid to the state. Additionally, the Trust receives 30% of total pre-tax earnings in excess of $39 million.
All Other 3%
Joint Venture Revenue
12%
Medicaid Teaching Hospital Revenue
69%
Investment Income less than 1%
Grant and Program Revenue
4%
GME Income 5% Subsidies
6%
2011

UNIVERSITY HOSPITALS AUTHORITY AND UNIVERSITY HOSPITALS TRUST
Management’s Discussion and Analysis
June 30, 2012 and 2011
6 (Continued)
• Graduate Medical Education (GME) income is from the University of Oklahoma (O.U.) and Oklahoma State University (O.S.U.) medical colleges. These two major teaching universities provide $13.8 million and $13.9 million of the state match share paid to the Oklahoma Health Care Authority along with an additional $7.6 million and $0.7 million provided by the Authority from appropriations. This University GME program is for qualifying universities with approved resident and intern programs to offset increased education costs associated with these teaching programs and to provide incentive for participation in the state’s Medicaid Managed Care programs
• Investment Income accounted for less than 1% of total revenues in both 2012 and 2011.
• All Other Revenues is primarily from donations and income associated with rental and lease incomes of Authority and Trust buildings.
Operating Expenses before depreciation and amortization
Grants and Contributions
6% Professional
Services 1%
Compensation, Supplies, Services &
Other Exp. 5%
Indigent Care 66%
GME Expense 22%
2012

UNIVERSITY HOSPITALS AUTHORITY AND UNIVERSITY HOSPITALS TRUST
Management’s Discussion and Analysis
June 30, 2012 and 2011
7 (Continued)
• Total Expenses including depreciation decreased $19.0 million in 2012 from 2011 and increased $73.3 million in 2011 from 2010. The decrease is primarily related to decreases in Indigent Care Expense.
• Indigent Care Expense represents certain amounts of state subsidies and Medicaid program receipts from the Oklahoma Health Care Authority paid to HCA Health Services of Oklahoma, Inc. for Indigent Care services to patients based on the terms of the Indigent Care Agreement.
• Graduate Medical Education (GME) expenses are amounts paid to the Oklahoma Health Care Authority for Hospital GME programs ($19.7 million in 2012 and $15.5 million in 2011) and University GME programs ($21.4 million in 2012 and $14.7 million in 2011).
• Grants and Contributions were for medical education and research and patient care improvement purposes.
• Professional Services were payments for professional auditing, public relations, legal services and pathology services.
Grants and Contributions
5%
Professional Services
- less than1%
Compensation, Supplies, Services &
Other Exp. 3%
Indigent Care 76%
GME Expense 15%
2011

UNIVERSITY HOSPITALS AUTHORITY AND UNIVERSITY HOSPITALS TRUST
Management’s Discussion and Analysis
June 30, 2012 and 2011
8 (Continued)
• Compensation, Supplies, Services and All Other Costs includes costs associated with building operations support for space leased to others.
Changes in Net Assets
(Dollars in thousands)
2012-2011Percentage
2012 2011 2010 change
Operating revenues:Grant and program revenues $ 9,636 11,054 20,122 (12.8)%Services provided to others 8,068 7,884 7,180 2.3Medicaid Teaching Hospital/
Level I trauma/DSH income 133,051 175,232 58,002 (24.1)GME income 13,814 13,900 12,675 (0.6)Joint Venture income 35,995 29,925 31,586 20.3Other revenues 1,411 1,387 554 1.7
Total operatingrevenues 201,975 239,382 130,119 (15.6)
Operating expenses:Compensation and benefits 1,251 857 742 45.9Professional services 1,271 1,583 1,353 (19.7)Grants and contributions 11,705 9,706 22,671 20.6Supplies, services and other 7,201 6,640 6,303 8.4Indigent care expense 120,831 155,566 62,685 (22.3)GME expense 41,115 30,287 38,163 35.8
Total operatingexpenses beforedepreciationand amortization 183,374 204,639 131,917 (10.4)
Depreciation and amortization 18,465 18,514 17,911 0.3
Operating income (loss) 136 16,229 (19,709) (100.3)
Nonoperating revenues (expenses):Investment income 150 337 595 (55.5)Debt related expenses (518) (708) (593) (26.8)Indigent care subsidies 38,446 14,838 31,020 159.1Other (2,361) 7 4 (33,828.6)
Total nonoperatingrevenues (expenses) 35,717 14,474 31,026 146.8
Change in net assets $ 35,853 30,703 11,317 16.2%

UNIVERSITY HOSPITALS AUTHORITY AND UNIVERSITY HOSPITALS TRUST
Management’s Discussion and Analysis
June 30, 2012 and 2011
9 (Continued)
The Authority and Trust operating revenues decreased $37.4 million in 2012 from 2011, and increased $109.3 million in 2011 from 2010.
• Grant and program revenue decreased $1.4 million in 2012 from 2011 and $9.1 million in 2011 from 2010. IME grants paid to the Trust by the Oklahoma Health Care Authority are based on federal matching amounts that vary from year to year.
• Services provided increased $184 thousand in 2012 from 2011 and $704 thousand in 2011 from 2010 due to increases in rental and lease incomes as the Trust increased the amount of square footage under lease in both 2012 and 2011.
• GME revenue represents state share matching payments from universities. The $86 thousand decrease in 2012 represents a minimal FMAP adjustment. The $1.2 million increase in 2011 represents an increase for four fiscal quarters of participation in 2011 from 2010
• Medicaid program income decreased $42.2 million in 2012 from 2011 and increased $117.2 million in 2011 from 2010. These changes were primarily caused by the 2011 Medicaid income representing five federal fiscal quarter reimbursements under the new Teaching Hospital Reimbursement program. Indigent care expenses to OUMC hospitals decreased $34.7 in 2012 from 2011 and increased $92.9 million in 2011 from 2010, as they also fluctuate consistent with changes in federal Medicaid income.
• JOA income increased $6.1 million in 2012 as the OUMC hospital pretax earnings increased substantially in 2012 from 2011.
• Compensation and benefits increased $394 thousand in 2012 from 2011 which was due to the addition of two employees and increases in workers compensation liability reserves. Compensation and benefits increased $115 thousand in 2011 from 2010 which was due to the addition of one employee.
• Professional services cost decreased $312 thousand in 2012 from 2011 and increased $230 thousand in 2011 from 2010. These changes were due to fluctuations in consulting fees year over year.
• The Trust and Authority committed or expended $2 million more in grants in 2012 over 2011. In 2012 additional support related to social work models and primary care was provided. The Trust and Authority committed or expended $13 million less in grants in 2011 over 2010. In 2010 additional support related to the O.U. Cancer Institute and Dean A. McGee construction was provided.
• GME expenses increased $10.8 million in 2012 over 2011 and decreased $7.9 million in 2011 over 2010, as the Oklahoma Health Care Authority provided substantial matching support from federal stimulus funds in 2011.
• Investment income decreased $187 thousand in 2012 from 2011 and $258 thousand in 2011 from 2010 as interest rates dropped.
• Indigent Care subsidies increased $23.6 million in 2012 from 2011 as the legislature increased appropriations as stimulus funds were expended in 2010 and 2011. Indigent Care subsidies decreased $16.2 million in 2011 from 2010 as state revenue shortfalls reduced appropriations.

UNIVERSITY HOSPITALS AUTHORITY AND UNIVERSITY HOSPITALS TRUST
Management’s Discussion and Analysis
June 30, 2012 and 2011
10 (Continued)
Financial Analysis of Fiscal Year 2012 Operations
Total net assets increased $35.9 million in 2012 and net income (change in net assets) increased $5.0 million.
Legislative appropriations increased in 2012 over 2011. The increase in funds were due to the legislature replacing required state match amounts to the Authority as federal stimulus funds were expended in 2010 and 2011.
Capital Assets
Capital assets net of depreciation increased 4.7% in 2012 from 2011. The University Hospitals Trust increased capital assets $29.6 million in 2012 primarily related to design and construction of the Samis Family Education Center. These additions were offset by annual depreciation of $18.5 million in 2012. Capital assets net of depreciation increased 15.3% in 2011 from 2010 due to capital additional of $49.5 million primarily related to design and construction of the CHO Ambulatory Care Center, education center and atrium project. These additions were offset by $18.5 million annual depreciation in 2011.
Capital Assets
(Net of depreciation, dollars in thousands)
2012 to 2011Change
2012 2011 2010 Amount Percentage
Land $ 4,009 4,009 4,009 — —%Building and improvements 162,261 143,127 119,207 19,134 13.4Equipment 37,993 33,781 29,700 4,212 12.5Infrastructure 3,759 3,567 1,946 192 5.4Joint Venture equipment 24,489 24,779 25,302 (290) (1.2)Construction-in-progress 12,215 24,385 22,438 (12,170) 49.9
Total $ 244,726 233,648 202,602 11,078 4.7%

UNIVERSITY HOSPITALS AUTHORITY AND UNIVERSITY HOSPITALS TRUST
Management’s Discussion and Analysis
June 30, 2012 and 2011
11 (Continued)
Long Term Debt
In October, 2005 the University Hospitals Trust issued Series 2005-A and 2005-B variable rate bonds to partially finance the construction of new pediatric care facilities and the phase II basic research center. The $36,715,000 tax exempt Series 2005-A bonds was used for design and construction of the O.U. Children’s Pediatric Ambulatory Care building. The attached 1,000 car parking garage was funded with Trust cash and a central connecting atrium and education center was paid for with a combination of contributions and Trust cash. The 2005-B taxable bonds use is for the phase II basic research building constructed by the University of Oklahoma. Both variable rate bond issues are credit enhanced with irrevocable letters of credit that are in effect for three year terms. The Trust makes interest payments monthly based on weekly rate re-sets with principal payments made annually each August. The bonds are secured with Trust revenues and the indenture and letter of credit agreements place liquidity, debt service and capitalization covenants on the Trust.
Bonds Payable Balance
(Dollars in millions)
2012-20112012 2011 2010 Change
Variable rate bonds $ 50 51 52 —%
Economic Factors, Conditions and Facts Effecting Financial Position or Operations
The University Hospitals Authority and Trust is dependent on subsidies, grants and entitlements from other governments in sustaining its primary mission of Indigent Care, Medical Education and Research. All of these sources of income combine to account for 81% of total income. In 2012 the Oklahoma legislature increased subsidies. Sustaining these programs at current levels or expanding them is dependent on the ability of the State of Oklahoma to increase revenue levels, which is primarily through tax revenues. The University Hospitals Authority’s allocation of appropriations for 2012 was increased from 2011 and some operating reserves are utilized in 2012 to maintain Indigent Care and GME programs at current levels.
GME programs (Hospitals’ and University’s) and Medicaid hospital supplemental payment programs utilize matching state and federal funds to disburse these entitlements to eligible recipients. The match rate was substantially reduced for all of 2010 and the first two quarters of 2011 as part of the ARRA Act of 2009. For 2012, the legislature appropriated sufficient amounts to sustain the GME programs.
The Authority and Trust is required by the JOA to pay for all workers compensation liabilities (accrued legal liabilities) for hospital employees injured prior to February 5, 1998. While these claims and payments have been relatively stable each year since 1998. It is believed that we have adequately stated our potential liability on the 2012 Statement of Net Assets. Any catastrophic loss resulting from any of the pre-JOA injuries would require payment from cash reserves and would result in a decrease in changes in net assets in the payment period.

UNIVERSITY HOSPITALS AUTHORITY AND UNIVERSITY HOSPITALS TRUST
Management’s Discussion and Analysis
June 30, 2012 and 2011
12
Contacting the University Hospitals Authority Financial Management
This financial report is designed to provide interested parties with a general overview of the University Hospitals Authority and University Hospitals Trust finances and demonstrate accountability for the money it receives and expends. If you have questions about this report or need additional financial information, contact the University Hospitals Authority, P.O. Box 26307, Oklahoma City, OK 73126.
KPMG LLP 210 Park Avenue, Suite 2850 Oklahoma City, OK 73102-5683
KPMG LLP is a Delaware limited liability partnership, the U.S. member firm of KPMG International Cooperative (“KPMG International”), a Swiss entity.
Independent Auditors’ Report
Members of the University Hospitals Authority and Trustees of the University Hospitals Trust:
We have audited the accompanying statements of net assets, revenues, expenses and changes in net assets, and cash flows of the University Hospitals Authority and University Hospitals Trust (together referred to as TUH), a component unit of the State of Oklahoma, as of and for the years ended June 30, 2012 and 2011, which collectively comprise TUH’s basic financial statements. These financial statements are the responsibility of TUH’s management. Our responsibility is to express an opinion on these financial statements based on our audits.
We conducted our audits in accordance with auditing standards generally accepted in the United States of America and the standards applicable to financial audits contained in Government Auditing Standards, issued by the Comptroller General of the United States. Those standards require that we plan and perform the audit to obtain reasonable assurance about whether the financial statements are free of material misstatement. An audit includes consideration of internal control over financial reporting as a basis for designing audit procedures that are appropriate in the circumstances, but not for the purpose of expressing an opinion on the effectiveness of TUH’s internal control over financial reporting. Accordingly, we express no such opinion. An audit includes examining, on a test basis, evidence supporting the amounts and disclosures in the financial statements, assessing the accounting principles used and significant estimates made by management, as well as evaluating the overall financial statement presentation. We believe that our audits provide a reasonable basis for our opinion.
In our opinion, the financial statements referred to above present fairly, in all material respects, the financial position of TUH as of June 30, 2012 and 2011, and the respective changes in financial position and, where applicable cash flows thereof for the years then ended in conformity with U.S. generally accepted accounting principles.
In accordance with Government Auditing Standards, we have also issued our report dated October 30, 2012, on our consideration of TUH’s internal control over financial reporting and our tests of its compliance with certain provisions of laws, regulations, contracts, and grant agreements and other matters. The purpose of that report is to describe the scope of our testing of internal control over financial reporting and compliance and the results of that testing, and not to provide an opinion on the internal control over financial reporting or on compliance. That report is an integral part of an audit performed in accordance with Government Auditing Standards and should be considered in assessing the results of our audit.
U.S. generally accepted accounting principles require that the management’s discussion and analysis on pages 1 – 12 be presented to supplement the basic financial statements. Such information, although not a part of the basic financial statements, is required by the Governmental Accounting Standards Board who considers it to be an essential part of financial reporting for placing the basic financial statements in an appropriate operational, economic, or historical context. We have applied certain limited procedures to the required supplementary information in accordance with auditing standards generally accepted in the United States of America, which consisted of inquiries of management about the methods of preparing the
14
information and comparing the information for consistency with management's responses to our inquiries, the basic financial statements, and other knowledge we obtained during our audit of the basic financial statements. We do not express an opinion or provide any assurance on the information because the limited procedures do not provide us with sufficient evidence to express an opinion or provide any assurance.
Our audit was conducted for the purpose of fanning opinions on the financial statements that collectively comprise the TUH’s basic financial statements. The supplementary combining statements on pages 31 through 36 are presented for purposes of additional analysis and are not a required part of the basic financial statements. Such information is the responsibility of management and was derived from and relates directly to the underlying accounting and other records used to prepare the basic financial statements. The supplementary combining statements have been subjected to the auditing procedures applied in the audit of the basic financial statements and certain additional procedures, including comparing and reconciling such information directly to the underlying accounting and other records used to prepare the basic financial statements or to the financial statements themselves, and other additional procedures in accordance with auditing standards generally accepted in the United States of America. In our opinion, the supplementary combining statements are fairly stated in all material respects in relation to the basic financial statements as a whole.
October 30, 2012
15
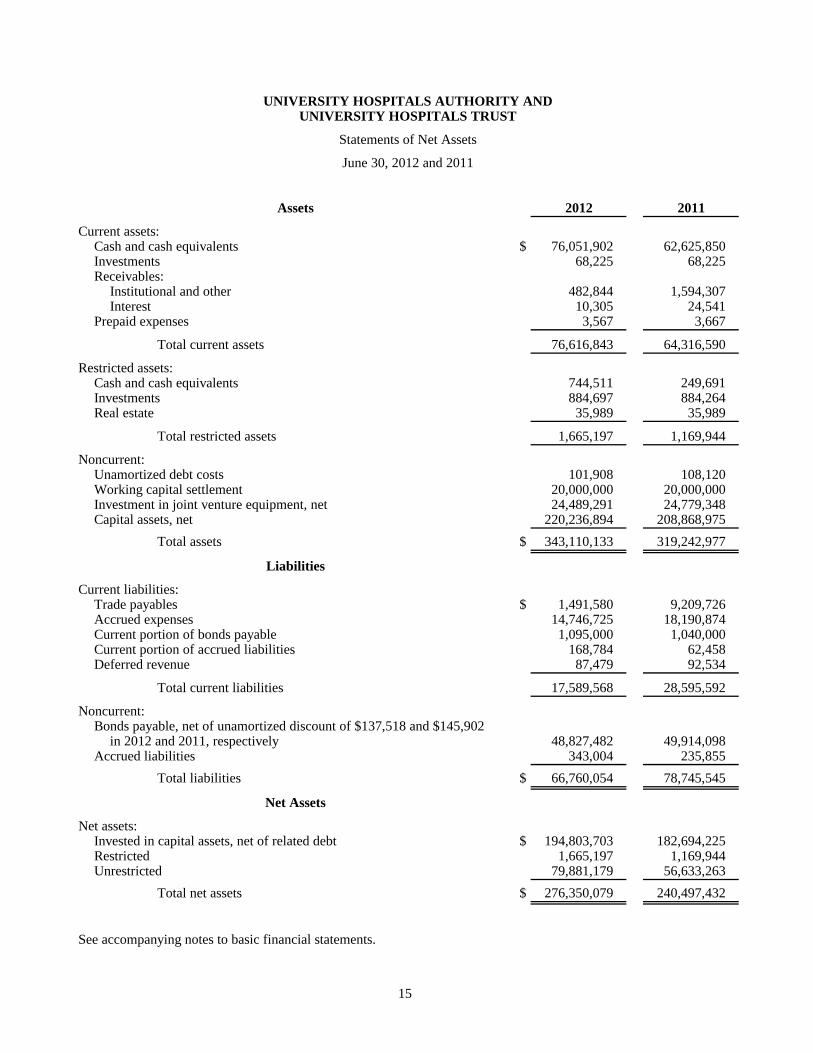
UNIVERSITY HOSPITALS AUTHORITY ANDUNIVERSITY HOSPITALS TRUST
Statements of Net Assets
June 30, 2012 and 2011
Assets 2012 2011
Current assets:Cash and cash equivalents $ 76,051,902 62,625,850 Investments 68,225 68,225 Receivables:
Institutional and other 482,844 1,594,307 Interest 10,305 24,541
Prepaid expenses 3,567 3,667
Total current assets 76,616,843 64,316,590
Restricted assets:Cash and cash equivalents 744,511 249,691 Investments 884,697 884,264 Real estate 35,989 35,989
Total restricted assets 1,665,197 1,169,944
Noncurrent:Unamortized debt costs 101,908 108,120 Working capital settlement 20,000,000 20,000,000 Investment in joint venture equipment, net 24,489,291 24,779,348 Capital assets, net 220,236,894 208,868,975
Total assets $ 343,110,133 319,242,977
Liabilities
Current liabilities:Trade payables $ 1,491,580 9,209,726 Accrued expenses 14,746,725 18,190,874 Current portion of bonds payable 1,095,000 1,040,000 Current portion of accrued liabilities 168,784 62,458 Deferred revenue 87,479 92,534
Total current liabilities 17,589,568 28,595,592
Noncurrent:Bonds payable, net of unamortized discount of $137,518 and $145,902
in 2012 and 2011, respectively 48,827,482 49,914,098 Accrued liabilities 343,004 235,855
Total liabilities $ 66,760,054 78,745,545
Net Assets
Net assets:Invested in capital assets, net of related debt $ 194,803,703 182,694,225 Restricted 1,665,197 1,169,944 Unrestricted 79,881,179 56,633,263
Total net assets $ 276,350,079 240,497,432
See accompanying notes to basic financial statements.

16
UNIVERSITY HOSPITALS AUTHORITY ANDUNIVERSITY HOSPITALS TRUST
Statements of Revenues, Expenses and Changes in Net Assets
Years ended June 30, 2012 and 2011
2012 2011
Operating revenues:Teaching Hospital Reimbursement/DSH revenue $ 123,216,696 166,156,558 GME revenue 13,813,700 13,899,965 Grant and program revenue 9,636,333 11,054,204 Joint venture revenue 35,994,750 29,925,000 Services provided to others 8,067,672 7,883,910 Level I trauma revenue 9,834,176 9,074,956 Other revenue 1,411,559 1,386,916
Total operating revenues 201,974,886 239,381,509
Operating expenses:GME expense 41,114,984 30,286,538 Indigent care expense 120,830,815 155,565,559 Grants and contributions 11,705,210 9,706,132 Professional services 1,270,964 1,583,230 Compensation and benefits 1,250,387 856,876 Supplies, services and other 7,201,333 6,640,626
Total operating expenses before depreciationand amortization 183,373,693 204,638,961
Operating loss before depreciation and amortization 18,601,193 34,742,548
Depreciation and amortization (18,464,644) (18,513,695)
Operating loss 136,549 16,228,853
Nonoperating revenues (expenses):Indigent care subsidies 38,446,391 14,838,184 Investment income 149,708 336,964 Debt related expenses (518,468) (707,887) Miscellaneous revenue (expense) (2,361,533) 7,225
Total nonoperating revenues 35,716,098 14,474,486
Change in net assets 35,852,647 30,703,339
Net assets, beginning of year 240,497,432 209,794,093 Net assets, end of year $ 276,350,079 240,497,432
See accompanying notes to basic financial statements.

17
UNIVERSITY HOSPITALS AUTHORITY ANDUNIVERSITY HOSPITALS TRUST
Statements of Cash Flows
Years ended June 30, 2012 and 2011
2012 2011
Cash flows from operating activities:Receipts from customers $ 7,969,077 8,380,643 Joint operating agreement receipts 35,994,750 29,925,000 Grant receipts (IME, GME, MTH, DSH) 163,001,897 266,277,380 Indigent care payments (120,830,815) (215,901,375) Grant payments (17,042,222) (13,601,065) GME match payments (46,720,697) (35,639,931) Goods and service payments (8,482,373) (8,543,181) Payments to employees (1,044,162) (814,204) Other operating receipts 1,389,310 3,296,255
Net cash provided by operating activities 14,234,765 33,379,522
Cash flows from noncapital financing activities:Subsidies 38,446,391 14,838,184
Cash flows from capital and related financing activities:Principal payment (1,040,000) (980,000) Purchase of capital assets (35,185,825) (46,258,653) Interest paid on bonds (105,394) (154,644) Other bond related costs (391,164) (560,696) Nonoperating revenue (2,197,852) 74,659
Net cash used in capital and related financing activities (38,920,235) (47,879,334)
Cash flows from investing activities:Investment income 159,951 357,908
Net cash flow provided by investing activities 159,951 357,908
Net increase in cash and cash equivalents 13,920,872 696,280
Cash and cash equivalents, beginning of year 62,875,541 62,179,261 Cash and cash equivalents, end of year $ 76,796,413 62,875,541
Reconciliation of operating income to net cash provided by operating activities:Operating income $ 136,549 16,228,853
Adjustments to reconcile operating income to net cash used inoperating activities:
Depreciation and amortization 18,464,644 18,513,695 Decrease in receivables, net 1,111,463 4,955,460 Decrease in payables and accrued expenses (5,472,936) (6,315,896) Decrease in deferred revenue (5,055) (2,690) Decrease in prepaid expenses 100 100
Total adjustments 14,098,216 17,150,669 Net cash provided by operating activities $ 14,234,765 33,379,522
Noncash capital financing and investing activities:Unrealized gains $ — 6,664 Capital assets purchased remaining in accrued expenses 1,072,097 6,560,922
See accompanying notes to basic financial statements.

UNIVERSITY HOSPITALS AUTHORITY AND UNIVERSITY HOSPITALS TRUST
Notes to Basic Financial Statements
June 30, 2012 and 2011
18 (Continued)
(1) Nature of the Entity and Summary of Significant Accounting Policies
(a) Nature of the Entity
The University Hospitals Authority (the Authority) was created in July 1993 by Oklahoma State Senate Bill 423. The bill transferred substantially all assets, liabilities, fund balance, and operations of Oklahoma Medical Center from the Oklahoma Department of Human Services to the Authority at historical cost. The Authority is a nonmajor component unit of the State of Oklahoma (the State). The Authority consists of the University Hospital, Children’s Hospital of Oklahoma, and their related clinics and other services, collectively called the University Hospitals. For management and reporting purposes, these facilities collectively comprise the Authority. The Authority is governed by a six member board. Three of the six members are appointed as follows: one by the President Pro Tempore of the Senate, one by the Speaker of the House of Representatives, and one by the Governor. The other three members serve based on their position as agency head for the Medicaid program, the Provost of the University of Oklahoma Health Sciences Center (OUHSC), and the Chief Executive Officer of the Authority (ex officio). All the Authority’s facilities are located in Oklahoma City, Oklahoma.
During 1995, Oklahoma State House Bill 1751 was passed which, among other actions, allowed for the creation of the University Hospitals Trust (the Trust). The Trust can accept a leasehold interest in the University Hospitals from the Authority and negotiate with private entities for the operation of the University Hospitals. The Trust cannot accept title to real property or pledge any indebtedness against the real property. The Trust was created September 18, 1997. The members of the Authority are the trustees of the Trust. The Trust is included in the financial statements of the Authority as a blended component unit. The operations and activities of the Authority and the Trust are hereinafter referred to as “TUH.”
On February 4, 1998, the Authority through an agreement with the Trust, entered into an agreement to lease and jointly operate substantially all of the operations and facilities of TUH (including O’Donoghue Rehabilitation Institute (ORI), which has remained closed since March 1995 as a cost cutting measure) with a subsidiary of Columbia/HCA (HCA).
The agreement with the Trust provides that the Authority will lease certain buildings, structures, improvements, and personal property utilized in connection with the operation of the University Hospitals (including ORI) to the Trust. The Trust then entered into an agreement with HCA to jointly operate the University Hospitals and Presbyterian Hospital, which is adjacent to the University Hospitals.
TUH is affiliated with the OUHSC, whose medical school residents and staff provide patient care, in-service education, and certain administrative functions for the benefit of TUH.
The jointly operated hospitals and other health care facilities are collectively known as OU Medical Center (OUMC). TUH operated the University Hospitals until February 4, 1998, when the Joint Operating Agreement (JOA) went into effect.

UNIVERSITY HOSPITALS AUTHORITY AND UNIVERSITY HOSPITALS TRUST
Notes to Basic Financial Statements
June 30, 2012 and 2011
19 (Continued)
After February 4, 1998, TUH, (through the Trust) is eligible to share in the net profits of the joint operations of OUMC as described more fully in note 9. The estimated net profits of the joint venture accruing to TUH and the Trust for the years ended June 30, 2012 and 2011 are presented in the accompanying statements of revenues, expenses and changes in net assets as “joint venture revenue.”
(b) Basis of Accounting and Presentation
Under the terms of the JOA described in note 9, the Authority has retained title to substantially all of the property, plant and equipment formerly used in the hospital operations of the University Hospitals and now used in the joint operations of OUMC. This property, plant and equipment was leased from the Authority to the Trust and then subleased from the Trust to the joint operations of the OUMC. The JOA provides for the Trust to share in the net profits of the joint operations of University Hospitals.
As discussed previously, the Trust is considered to be a blended component unit of the Authority and the financial position and results of operations of the Trust and Authority are presented together as “TUH”. For ease of presentation certain agreements between either the Authority or Trust and HCA and others are described herein as between TUH and other parties.
TUH’s basic financial statements are prepared in accordance with U.S. generally accepted accounting principles as they apply to governmental units. The Governmental Accounting Standards Board (GASB) is the accepted standard setting body for establishing governmental accounting and financial reporting principles. TUH applies Financial Accounting Standards Board pronouncements and Accounting Principles Board opinions issued on or before November 30, 1989, unless those pronouncements conflict with GASB pronouncements, in which case, GASB prevails, and all of the GASB pronouncements issued subsequently.
The operations of TUH are accounted for as an enterprise fund on an accrual basis in order to recognize the flow of economic resources. Under this basis, revenues are recognized in the period in which they are earned, expenses are recognized in the period in which they are incurred, depreciation and amortization of assets is recognized, and all assets and liabilities associated with the operations of TUH are included in the statement of net assets. TUH recognizes revenue related to the JOA, teaching hospitals and grant and program as operating revenues. Operating expenses for TUH include the costs of administering the funds, grants and contributions expense, indigent care costs, amounts paid for Graduate Medical Education (GME) programs and depreciation and amortization on capital assets. All other revenues and expenses not meeting this definition are reported as nonoperating revenues and expenses. Net assets are restricted when constraints placed on them are either externally imposed or are imposed by constitutional provisions or enabling legislations.
(c) Cash, Cash Equivalents and Investments
For purposes of the statement of cash flows, TUH considers all highly liquid investments with an original maturity of three months or less when purchased to be cash equivalents. The carrying amount of the cash equivalents and investments is fair value. The net change in fair value of investments and interest income are recorded as investment income in the statement of revenues,

UNIVERSITY HOSPITALS AUTHORITY AND UNIVERSITY HOSPITALS TRUST
Notes to Basic Financial Statements
June 30, 2012 and 2011
20 (Continued)
expenses and changes in net assets and includes the unrealized and realized gains and losses on investments.
(d) Restricted Assets
Certain assets of TUH are classified as restricted assets because their use is restricted by grant agreements or by bond trust agreements. Management has adopted the policy to spend restricted funds before the use of unrestricted resources when donor imposed stipulations and funding agreement requirements have been met.
The Authority has certain assets that are restricted by donor imposed stipulations. The majority of these funds have been restricted for construction or specific purposes at Children’s Hospital.
(e) Capital Assets
All capital assets are stated at cost at the date of acquisition or fair value at the date of donation, net of accumulated depreciation and amortization. Capital assets are defined as long lived assets with initial costs equal to or greater than $2,500. Depreciation is computed by the straight-line method over the following estimated useful lives of the assets:
Building and improvements 25 – 40 yearsEquipment 5 – 25 yearsInfrastructure 40 years
Expenses that increase values, change capacities, or extend useful lives are capitalized. Routine maintenance, repairs, and renewals are charged to operations. Upon disposition, the cost and related accumulated depreciation and amortization are removed from the accounts and the resulting gain or loss is reflected in the period in which the asset is disposed. Substantial capital assets, except construction-in-progress and certain capital additions since 2003, as of June 30, 2012 and 2011 have been leased to the joint operations of the OUMC or the OU Board of Regents for uses related to the mission of TUH. Certain capital additions since 2003 are owned and operated by TUH and are not leased to the joint operations of OUMC.
(f) Compensated Absences
Unused annual leave may be accumulated to a maximum of 480 hours. All accrued leave is payable upon termination, resignation, retirement, or death. Vested or accumulated vacation leave is recorded as an expense and a liability as the benefits accrue to employees. Sick leave does not vest to the employee and therefore is not recorded as a liability.
(g) Income Taxes
As an integral part of the State, the income of the Authority and of the Trust is exempt from federal and state income taxes.

UNIVERSITY HOSPITALS AUTHORITY AND UNIVERSITY HOSPITALS TRUST
Notes to Basic Financial Statements
June 30, 2012 and 2011
21 (Continued)
(h) Use of Estimates
Management of TUH has made a number of estimates and assumptions relating to the reporting of assets and liabilities and the disclosure of contingent assets and liabilities to prepare these financial statements in conformity with U.S. generally accepted accounting principles. Actual results could differ from those estimates.
(i) Subsidy Income
TUH receives an annual appropriation or subsidy from the State Legislature. The indigent care subsidy is recorded as revenue in the fiscal year for which the appropriation is made. Indigent care expense is recorded when funds are paid out to cover indigent care. Future state subsidies will be used to offset the cost of indigent care provided by the joint operations of the OUMC.
(2) Deposits and Investments
(a) Deposits
At June 30, 2012 and 2011, TUH held deposits and cash equivalents with the State Treasurer and other financial institutions. The State Treasurer requires all state funds be either insured by federal deposit insurance, collateralized by securities held by the cognizant Federal Reserve Bank, or invested in United States government obligations. TUH’s deposits with the State Treasurer are pooled with the funds of other state agencies and then, in accordance with statutory limitations, placed in financial institutions or invested as the State Treasurer may determine, in the State’s name.
The Authority’s unrestricted deposits with the State Treasurer at June 30, 2012 and 2011 are approximately $5,036,000 and $7,214,000, respectively. The Authority’s reserved deposits with the State Treasurer at June 30, 2012 and 2011 are approximately $245,000 and $250,000, respectively.
At June 30, 2012 and 2011, the bank balance of the Trust’s cash equivalents were approximately $71,516,000 and $55,162,000, respectively, which equals carrying amount. The bank balance is collateralized with securities held by an agent in the Trust’s name.
(b) Investments
At June 30, TUH’s investments at fair value consisted of the following:
2012 2011
Mutual funds $ 881,874 881,786 Equities 71,048 70,703
Total $ 952,922 952,489
TUH is not subject to credit risk, custodial credit risk, interest rate risk or foreign currency risk.

UNIVERSITY HOSPITALS AUTHORITY AND UNIVERSITY HOSPITALS TRUST
Notes to Basic Financial Statements
June 30, 2012 and 2011
22 (Continued)
(c) Concentration of Credit Risk
TUH places no limit on the amount it can invest in any one issuer. Investment at Morgan Stanley Smith Barney represented 92.8% and 92.8% of total investments at June 30, 2012 and 2011, respectively.
(3) Receivables
At June 30 the accounts receivable are as follows:
2012 2011
Institutional and other $ 482,884 1,594,307 Working capital settlement 20,000,000 20,000,000 Pledges — —
In the event the JOA has not been terminated prior to September 11, 2023, HCA Health Services of Oklahoma, Inc., a subsidiary of HCA, (the Company) agreed to reimburse the Trust $20,000,000 on September 11, 2023. The Company agreed to transfer and assign to the Trust the aggregate amount of $20,000,000 of accounts receivable and notes receivable of the Hospitals, net of the Company’s good faith estimate of an allowance for uncollectibles at the date of the transfer, September 11, 2023. On March 11, 2024, the Company shall determine the Actual Value of Receivables, which is the actual aggregate amount of collections from such accounts and notes receivables. If the Actual Value of Receivables is in excess of $20,000,000, the Trust shall repay the excess to the Company within five business days after determination thereof. If the Actual Value of Receivables is less than $20,000,000, the Company shall pay to the Trust in cash an amount equal to such deficiency within five business days of determination thereof. Management has no knowledge of the Company’s intent to terminate the JOA prior to September 11, 2023.
(4) Capital Assets
A substantial amount of all capital assets are leased to the joint operations of OUMC or to OU Health Sciences Center. At June 30 capital assets consisted of the following:
2012 2011
Land $ 4,009,252 4,009,252 Buildings and improvements 313,651,718 287,780,547 Equipment 129,104,186 123,314,664 Construction-in-progress 12,215,326 24,385,321 Infrastructure 7,579,428 7,210,157
466,559,910 446,699,941
Less accumulated depreciation (246,323,016) (237,830,966) $ 220,236,894 208,868,975
UNIVERSITY HOSPITALS AUTHORITY AND UNIVERSITY HOSPITALS TRUST
Notes to Basic Financial Statements
June 30, 2012 and 2011
23 (Continued)
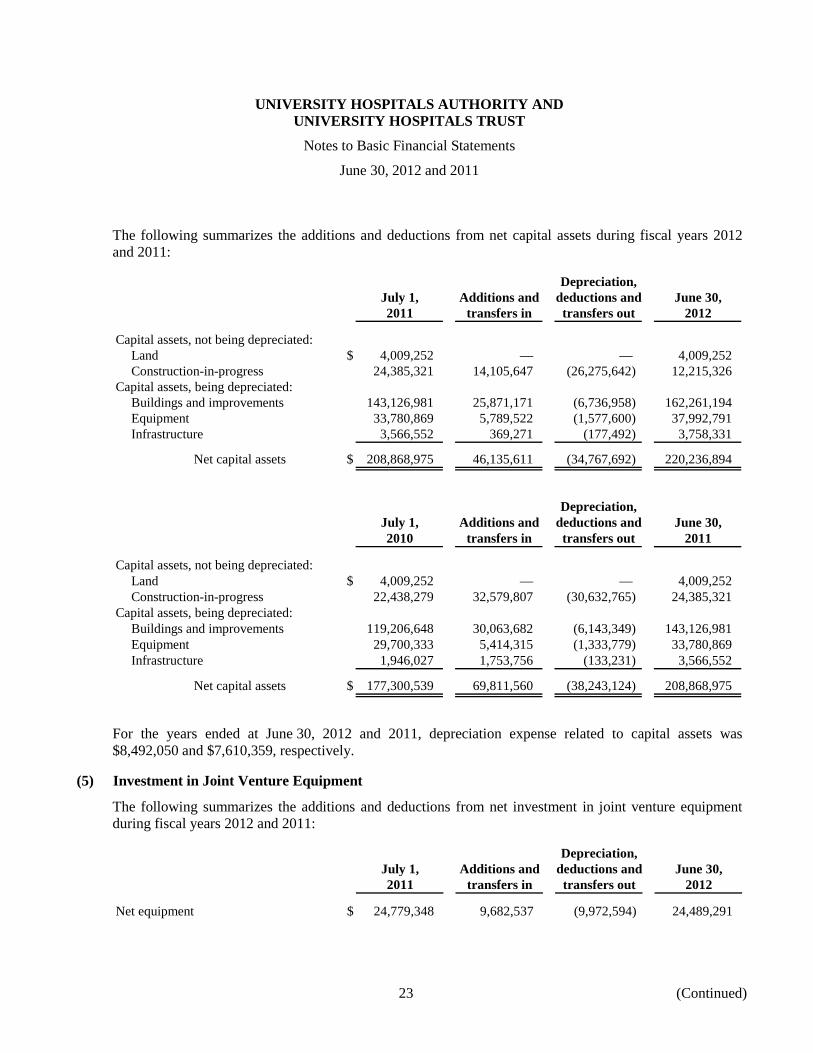
The following summarizes the additions and deductions from net capital assets during fiscal years 2012 and 2011:
Depreciation,July 1, Additions and deductions and June 30,2011 transfers in transfers out 2012
Capital assets, not being depreciated:Land $ 4,009,252 — — 4,009,252 Construction-in-progress 24,385,321 14,105,647 (26,275,642) 12,215,326
Capital assets, being depreciated:Buildings and improvements 143,126,981 25,871,171 (6,736,958) 162,261,194 Equipment 33,780,869 5,789,522 (1,577,600) 37,992,791 Infrastructure 3,566,552 369,271 (177,492) 3,758,331
Net capital assets $ 208,868,975 46,135,611 (34,767,692) 220,236,894
Depreciation,July 1, Additions and deductions and June 30,2010 transfers in transfers out 2011
Capital assets, not being depreciated:Land $ 4,009,252 — — 4,009,252 Construction-in-progress 22,438,279 32,579,807 (30,632,765) 24,385,321
Capital assets, being depreciated:Buildings and improvements 119,206,648 30,063,682 (6,143,349) 143,126,981 Equipment 29,700,333 5,414,315 (1,333,779) 33,780,869 Infrastructure 1,946,027 1,753,756 (133,231) 3,566,552
Net capital assets $ 177,300,539 69,811,560 (38,243,124) 208,868,975
For the years ended at June 30, 2012 and 2011, depreciation expense related to capital assets was $8,492,050 and $7,610,359, respectively.
(5) Investment in Joint Venture Equipment
The following summarizes the additions and deductions from net investment in joint venture equipment during fiscal years 2012 and 2011:
Depreciation,July 1, Additions and deductions and June 30,2011 transfers in transfers out 2012
Net equipment $ 24,779,348 9,682,537 (9,972,594) 24,489,291

UNIVERSITY HOSPITALS AUTHORITY AND UNIVERSITY HOSPITALS TRUST
Notes to Basic Financial Statements
June 30, 2012 and 2011
24 (Continued)
Depreciation,July 1, Additions and deductions and June 30,2010 transfers in transfers out 2011
Net equipment $ 25,301,710 10,380,974 (10,903,336) 24,779,348
For the years ended at June 30, 2012 and 2011, depreciation expense related to investment in joint venture equipment was $9,972,594 and $10,903,336, respectively. Depreciation is computed by the straight-line method over the estimated useful life of five years.
(6) Operating Lease
TUH entered into multiple leases, whereby for the majority of leases TUH will receive rental income for leased office and clinical space for a term of one year.
The following schedule shows future minimum lease rent receipts.
2013 $ 1,065,365 2014 675,876 2015 675,876 2016 675,876 2017 675,876 2018 – 2022 3,367,630 2023 – 2027 3,367,630 2028 – 2032 3,367,630 2033 – 2037 3,367,630 2038 – 2042 3,367,630 2043 – 2047 3,367,630 2048 – 2049 1,078,183
(7) Bonds Payable
In October 2005, the Trust issued Tax Exempt Variable Rate Revenue Bonds, Series 2005A (Series 2005A) and Taxable Variable Rate Revenue Bonds, Series 2005B (Series 2005B) to partially finance the construction of new pediatric care facilities and the phase II basic research center. The $36,715,000 Series 2005A bonds were used for design and construction of the O.U. Children’s Pediatric Ambulatory Care building. The attached 1,000 car parking garage was funded with Trust cash and a central connecting atrium and education center was paid for with a combination of contributions and Trust cash. The $18,745,000 Series 2005B bonds use is for the phase II basic research building constructed by the University of Oklahoma. Both variable rate bond issues are credit enhanced with irrevocable letters of credit that will mature September 30, 2014. The Trust makes interest payments monthly based on weekly rate re-sets with principal payments made annually each August. The bonds are secured with Trust revenues and the indenture and letter of credit agreements place liquidity, debt service and capitalization covenants on the Trust. As of June 30, 2012 and 2011, the balances outstanding are approximately $36,715,000 and $36,715,000 for Series 2005A and $13,345,000 and $14,385,000 for Series 2005B,

UNIVERSITY HOSPITALS AUTHORITY AND UNIVERSITY HOSPITALS TRUST
Notes to Basic Financial Statements
June 30, 2012 and 2011
25 (Continued)
respectively. As of June 30, 2012 and 2011, the interest rates were 0.28% and 0.09% for Series 2005A and 0.35% and 0.12% for Series 2005B, respectively.
The underlying trust agreement contains certain bond covenants that TUH is aware of and monitors for compliance throughout the year. TUH has complied with all bond covenants throughout fiscal year 2012.
The debt service requirements as of June 30, 2012 are as follows:
` Series 2005A Series 2005BPrincipal Interest Total Principal Interest Total
Year ending June 30:2013 $ — 569,475 569,475 1,095,000 334,902 1,429,902 2014 — 568,690 568,690 1,170,000 307,161 1,477,161 2015 — 569,083 569,083 1,235,000 278,184 1,513,184 2016 — 572,201 572,201 1,310,000 248,550 1,558,550 2017 – 2021 — 2,845,800 2,845,800 7,820,000 704,987 8,524,987 2022 – 2026 9,405,000 2,590,760 11,995,760 715,000 18,451 733,451 2027 – 2031 12,320,000 1,756,909 14,076,909 — — — 2032 – 2036 14,990,000 724,111 15,714,111 — — —
$ 36,715,000 10,197,029 46,912,029 13,345,000 1,892,235 15,237,235
As of June 30, 2012, the unamortized bond discount was $99,588 and $37,930 for Series 2005A and Series 2005B, respectively. Amortization expense related to debt service costs for 2012 and 2011 was $6,213 and $6,213, respectively.
(8) Changes in Long-Term Liabilities
Long-term liability activity for the years ended June 30, 2012 and 2011 was as follows:
July 1, June 30, Current2012 2011 Additions Deletions 2012 portion
Accrued liabilities $ 298,313 213,475 — 511,788 168,704 Lease payable — — — — — Bonds payable, net 50,954,098 8,384 (1,040,000) 49,922,482 1,095,000
$ 51,252,411 221,859 (1,040,000) 50,434,270 1,263,704
July 1, June 30, Current2011 2010 Additions Deletions 2011 portion
Accrued liabilities $ 362,893 — (64,580) 298,313 62,458 Lease payable — — — — — Bonds payable, net 51,925,714 8,384 (980,000) 50,954,098 1,040,000
$ 52,288,607 8,384 (1,044,580) 51,252,411 1,102,458

UNIVERSITY HOSPITALS AUTHORITY AND UNIVERSITY HOSPITALS TRUST
Notes to Basic Financial Statements
June 30, 2012 and 2011
26 (Continued)
(9) Joint Operating Agreement
Effective February 4, 1998, the Authority, the Trust, and OUHSC entered into certain agreements with the Company, pursuant to which, among other things, the land, buildings and other improvements and equipment utilized in connection with and comprising the University Hospitals are being leased to the Company on a long-term basis; certain other assets of the University Hospitals were transferred to and are operated by the Company; the academic program of the OUHSC is to continue to be affiliated with the University Hospitals as the OUHSC’s primary teaching hospitals; the Company will provide certain medical care and services to the indigent; and the Trust and the Company have entered into agreements setting forth the terms and conditions of the joint operation by the Trust and the Company of the Presbyterian Hospitals and the University Hospitals. These joint operations are referred to as OUMC.
On December 21, 1997, the Trust and the Company entered into a joint operating agreement (the JOA) that set forth the terms and conditions of the joint operation of the Presbyterian Hospitals and the University Hospitals by the Trust and the Company and the financial compensation to the Trust in consideration for the right of the Company to lease and operate the University Hospitals from and after February 4, 1998 (Closing). As consideration for the right to operate the University Hospitals, the Company shall pay to the Trust a Trust Preference Amount and a Trust Excess Payment each agreement year. The Trust Preference Amount is the first $9,000,000 of pre-tax earnings of the hospitals, to the extent earned in any agreement year. Pre-tax earnings are defined as net income before deductions for income taxes, depreciation, amortization, interest expense and aggregate defined changes in net working capital. The Trust Excess Payment is equal to 30% of pre-tax earnings over $39,000,000 plus any accumulated trust deficit from previous agreement years. On April 1, 2010 the JOA was amended to add the Edmond Hospital and certain related facilities to the agreement.
In the event the JOA is terminated prior to the 25th anniversary of the Closing, the Company is not obligated to pay the working capital settlement. The party initiating termination of the agreement shall pay the other party an amount as determined by the JOA. Both the Trust and the Company have the right to initiate termination of the JOA and the right to exercise reverse termination. Therefore, it cannot be determined if the Company would pay the Trust or the Trust would pay the Company upon termination prior to the 25th anniversary of the Closing.
(10) Employee Retirement Plan
TUH contributes to the Oklahoma Public Employees Retirement Plan (the Plan), a cost-sharing multiple-employer public employee retirement system administered by the Oklahoma Public Employees Retirement System (the System). The Plan provides retirement, disability, and death benefits to plan members and beneficiaries. The benefit provisions are established and may be amended by the legislature of the State of Oklahoma. Title 74 of the Oklahoma Statutes, Sections 901-943, as amended, assigns the authority for management and operation of the Plan to the Board of Trustees of the System. The System issues a publicly available annual financial report that includes financial statements and required supplementary information for the Plan. That annual report may be obtained by writing to the System, 6601 N. Broadway Extension, Suite 129, Oklahoma City, Oklahoma 73116 or by calling 1-800-733-9008.

UNIVERSITY HOSPITALS AUTHORITY AND UNIVERSITY HOSPITALS TRUST
Notes to Basic Financial Statements
June 30, 2012 and 2011
27 (Continued)
Plan members and TUH are required to contribute at a rate set by statute. The contribution requirements of plan members and TUH are established and may be amended by the legislature of the State of Oklahoma. The contribution rate for TUH and plan members is as follows:
Fiscal year 2012TUH employees TUH
All salary All salary
3.5% 16.5%
Fiscal year 2011TUH employees TUH
All salary All salary
3.5% 15.5%
TUH’s contributions to the Plan for the years ended June 30, 2012, 2011, and 2010, were approximately $116,000, $106,000, and $83,000, respectively, and was equal to its required contribution for each year.
(11) Deferred Compensation Plan
The State offers to its own employees, state agency employees and other duly constituted authority or instrumentality employees a deferred compensation plan created in accordance with Internal Revenue Code (IRC) Section 457 and Chapter 45 of Title 74, Oklahoma Statutes. The Oklahoma State Employees Deferred Compensation Plan (the 457 Plan), also known as SoonerSave, is a voluntary plan that allows participants to defer a portion of their salary into the 457 Plan. Participation allows a person to shelter the portion of their salary that they defer from current federal and state income tax. Taxes on the interest or investment gains on this money, while in the 457 Plan, are also deferred. The deferred compensation is not available to employees until termination, retirement, death or approved unforeseeable emergency.
Under SoonerSave, the untaxed deferred amounts are invested as directed by the participant among various 457 Plan investment options. Effective January 1, 1998, a Trust and Trust Fund covering the 457 Plan assets was established pursuant to federal legislation enacted in 1996, requiring public employers to establish such trusts for plans meeting the requirements of Section 457 of the IRC. Under terms of the Trust, the corpus or income of the Trust Fund may be used only for the exclusive benefit of the 457 Plan participants and their beneficiaries. Further information may be obtained from the Oklahoma State Employees Deferred Compensation Plan audited financial statements for the years ended June 30, 2012 and 2011. TUH believes that it has no liabilities in respect to the State’s plan.

UNIVERSITY HOSPITALS AUTHORITY AND UNIVERSITY HOSPITALS TRUST
Notes to Basic Financial Statements
June 30, 2012 and 2011
28
(12) Risk Management
TUH participates in the Oklahoma Risk Management Division’s (a division of the Department of Central Services) insurance pool which covers all governmental tort claims against TUH. TUH pays a monthly premium to the Department to participate in the insurance pool. Premiums paid are not subject to retroactive adjustment.
TUH is self-insured for nongovernmental tort claims. It is the opinion of management, however, after consulting with its legal counsel that estimated costs to be incurred for nongovernmental tort claims included in other liabilities are adequate.
Workers’ compensation claims arising from incidents occurring during the year are paid with current operating funds. TUH accrues estimated annual amounts to cover claims arising from each year’s operations. Payments for claims in excess of a certain retention amount are made by the State Insurance Fund.
(13) Commitments and Contingencies
TUH is required by the JOA to pay for all workers compensation liabilities for hospital employees injured prior to February 5, 1998. The related liability is accrued as accrued liabilities on the statement of net assets.
In the normal course of operations, TUH is a defendant in several lawsuits; however, TUH officials are of the opinion, based on the advice of the attorney general, that the ultimate outcome of this litigation will not have a material adverse effect on the future operations or financial position of TUH.
The U.S. Department of Justice and other federal and state agencies are increasing resources dedicated to regulatory investigations and compliance audits of health care providers. TUH is subject to these regulatory efforts. Costs questioned as a result of investigations or audits, if any, may result in refunds to these governmental agencies.

KPMG LLP 210 Park Avenue, Suite 2850 Oklahoma City, OK 73102-5683
KPMG LLP is a Delaware limited liability partnership, the U.S. member firm of KPMG International Cooperative (“KPMG International”), a Swiss entity.
Independent Auditors’ Report on Internal Control over Financial Reporting and on Compliance and Other Matters Based on an Audit of Basic Financial Statements
Performed in Accordance with Government Auditing Standards
Members of the University Hospitals Authority and Trustees of the University Hospitals Trust:
We have audited the basic financial statements of the University Hospitals Authority and University Hospitals Trust (together referred to as TUH), as of and for the year ended June 30, 2012, and have issued our report thereon dated October 30, 2012. We conducted our audit in accordance with auditing standards generally accepted in the United States of America and the standards applicable to financial audits contained in Government Auditing Standards, issued by the Comptroller General of the United States.
Internal Control over Financial Reporting
Management of TUH is responsible for establishing and maintaining effective internal control over financial reporting. In planning and performing our audit, we considered TUH’s internal control over financial reporting as a basis for designing our auditing procedures for the purpose of expressing our opinion on the financial statements, but not for the purpose of expressing an opinion on the effectiveness of TUH’s internal control over financial reporting. Accordingly, we do not express an opinion on the effectiveness of TUH’s internal control over financial reporting.
A deficiency in internal control over financial reporting exists when the design or operation of a control does not allow management or employees, in the normal course of performing their assigned functions, to prevent, or detect and correct misstatements on a timely basis. A material weakness is a deficiency, or combination of deficiencies, in internal control over financial reporting, such that there is a reasonable possibility that a material misstatement of the entity’s financial statements will not be prevented, or detected and corrected on a timely basis.
Our consideration of internal control over financial reporting was for the limited purpose described in the first paragraph of this section and was not designed to identify all deficiencies in internal control over financial reporting that might be deficiencies, significant deficiencies, or material weaknesses. We did not identify any deficiencies in internal control over financial reporting that we consider to be material weaknesses, as defined above.
Compliance and Other Matters
As part of obtaining reasonable assurance about whether TUH’s financial statements are free of material misstatement, we performed tests of its compliance with certain provisions of laws, regulations, contracts, and grant agreements, noncompliance with which could have a direct and material effect on the determination of financial statement amounts. However, providing an opinion on compliance with those provisions was not an objective of our audit and, accordingly, we do not express such an opinion. The results of our tests disclosed no instances of noncompliance or other matters that are required to be reported under Government Auditing Standards.

30
This report is intended solely for the information and use of the University Hospitals Authority Members, the Trustees of the University Hospitals Trust, the Oklahoma State Auditor and Inspector, and TUH’s management and is not intended to be and should not be used by anyone other than these specified parties.
October 30, 2012

31
UNIVERSITY HOSPITALS AUTHORITY ANDUNIVERSITY HOSPITALS TRUST
Combining Statement of Net Assets
June 30, 2012
Authority TrustFund Fund Total
Current assets:Cash and cash equivalents $ 5,036,237 71,015,665 76,051,902 Investments 38,225 30,000 68,225 Receivables:
Institutional and other 87,362 395,482 482,844 Interest receivable 10,305 — 10,305
Prepaid expenses — 3,567 3,567
Total current assets 5,172,129 71,444,714 76,616,843
Restricted assets:Cash and cash equivalents 244,511 500,000 744,511 Investments 884,697 — 884,697 Real estate 35,989 — 35,989 Pledges receivable — — —
Total restricted assets 1,165,197 500,000 1,665,197
Noncurrent:Unamortized debt costs — 101,908 101,908 Working capital settlement — 20,000,000 20,000,000 Investment in joint venture equipment, net — 24,489,291 24,489,291 Capital assets, net 23,880,848 196,356,046 220,236,894
Total assets $ 30,218,174 312,891,959 343,110,133
Current liabilities:Trade payables $ 15,397 1,476,183 1,491,580 Accrued expenses 2,255,071 12,491,654 14,746,725 Current portion of bonds payable — 1,095,000 1,095,000 Current portion of accrued liabilities 168,784 — 168,784 Deferred revenue 3,567 83,912 87,479
Total current liabilities 2,442,819 15,146,749 17,589,568
Noncurrent:Bonds payable, net — 48,827,482 48,827,482 Accrued liabilities 343,004 — 343,004
Total liabilities $ 2,785,823 63,974,231 66,760,054
Net assets:Invested in capital assets, net of related debt $ 23,880,848 170,922,855 194,803,703 Restricted 1,165,197 500,000 1,665,197 Unrestricted 2,386,306 77,494,873 79,881,179
Total net assets $ 27,432,351 248,917,728 276,350,079
See accompanying independent auditors’ report.
32
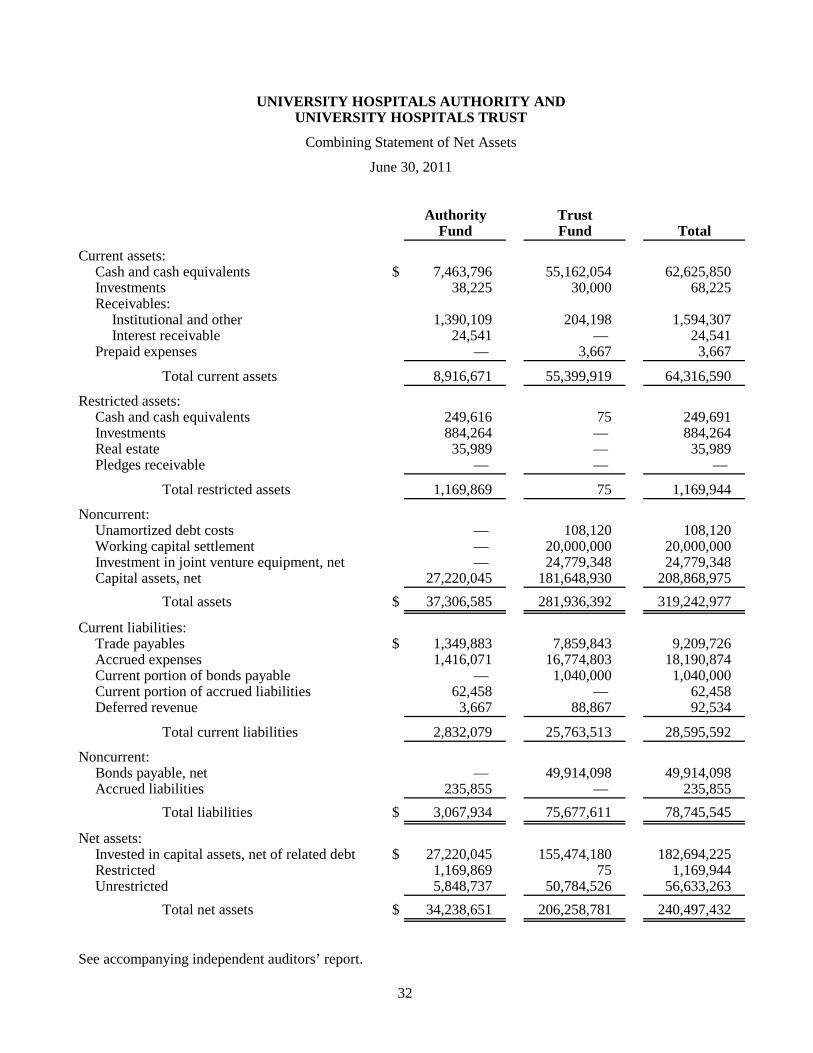
UNIVERSITY HOSPITALS AUTHORITY ANDUNIVERSITY HOSPITALS TRUST
Combining Statement of Net Assets
June 30, 2011
Authority TrustFund Fund Total
Current assets:Cash and cash equivalents $ 7,463,796 55,162,054 62,625,850 Investments 38,225 30,000 68,225 Receivables:
Institutional and other 1,390,109 204,198 1,594,307 Interest receivable 24,541 — 24,541
Prepaid expenses — 3,667 3,667
Total current assets 8,916,671 55,399,919 64,316,590
Restricted assets:Cash and cash equivalents 249,616 75 249,691 Investments 884,264 — 884,264 Real estate 35,989 — 35,989 Pledges receivable — — —
Total restricted assets 1,169,869 75 1,169,944
Noncurrent:Unamortized debt costs — 108,120 108,120 Working capital settlement — 20,000,000 20,000,000 Investment in joint venture equipment, net — 24,779,348 24,779,348 Capital assets, net 27,220,045 181,648,930 208,868,975
Total assets $ 37,306,585 281,936,392 319,242,977
Current liabilities:Trade payables $ 1,349,883 7,859,843 9,209,726 Accrued expenses 1,416,071 16,774,803 18,190,874 Current portion of bonds payable — 1,040,000 1,040,000 Current portion of accrued liabilities 62,458 — 62,458 Deferred revenue 3,667 88,867 92,534
Total current liabilities 2,832,079 25,763,513 28,595,592
Noncurrent:Bonds payable, net — 49,914,098 49,914,098 Accrued liabilities 235,855 — 235,855
Total liabilities $ 3,067,934 75,677,611 78,745,545
Net assets:Invested in capital assets, net of related debt $ 27,220,045 155,474,180 182,694,225 Restricted 1,169,869 75 1,169,944 Unrestricted 5,848,737 50,784,526 56,633,263
Total net assets $ 34,238,651 206,258,781 240,497,432
See accompanying independent auditors’ report.

33
UNIVERSITY HOSPITALS AUTHORITY ANDUNIVERSITY HOSPITALS TRUST
Combining Statement of Revenues, Expenses and Changes in Net Assets
Year ended June 30, 2012
Authority TrustFund Fund Total
Operating revenues:Teaching Hospital Reimbursement revenue $ 54,331,444 68,885,252 123,216,696 GME revenue 13,813,700 — 13,813,700 Grant and program revenue — 9,636,333 9,636,333 Joint venture revenue — 35,994,750 35,994,750 Services provided to others 266,917 7,800,755 8,067,672 Level I trauma revenue 9,834,176 — 9,834,176 Other revenue 72,581 1,338,978 1,411,559
Total operating revenues 78,318,818 123,656,068 201,974,886
Operating expenses:GME expense 41,114,984 — 41,114,984 Indigent care expense 75,111,167 45,719,648 120,830,815 Grants and contributions 773,357 10,931,853 11,705,210 Professional services 444,816 826,148 1,270,964 Compensation and benefits 520,421 729,966 1,250,387 Supplies, services and other 50,339 7,150,994 7,201,333
Total operating expenses beforedepreciation and amortization 118,015,084 65,358,609 183,373,693
Operating (loss) income beforedepreciation and amortization (39,696,266) 58,297,459 18,601,193
Depreciation and amortization (3,341,688) (15,122,956) (18,464,644)
Operating (loss) income (43,037,954) 43,174,503 136,549
Nonoperating revenues (expenses):Indigent care subsidies 38,446,391 — 38,446,391 Interest income 146,795 2,913 149,708 Debt related expenses — (518,468) (518,468) Miscellaneous revenue (expense) (2,361,533) — (2,361,533)
Total nonoperating revenues(expenses) 36,231,653 (515,555) 35,716,098
Change in net assets (6,806,301) 42,658,948 35,852,647
Net assets, beginning of year 34,238,652 206,258,780 240,497,432 Net assets, end of year $ 27,432,351 248,917,728 276,350,079
See accompanying independent auditors’ report.

34
UNIVERSITY HOSPITALS AUTHORITY ANDUNIVERSITY HOSPITALS TRUST
Combining Statement of Revenues, Expenses and Changes in Net Assets
Year ended June 30, 2011
Authority TrustFund Fund Total
Operating revenues:Teaching Hospital Reimbursement revenue $ 59,809,773 106,346,785 166,156,558 GME revenue 13,899,965 — 13,899,965 Grant and program revenue — 11,054,204 11,054,204 Joint venture revenue — 29,925,000 29,925,000 Services provided to others 318,867 7,565,043 7,883,910 Level I trauma revenue 9,074,956 — 9,074,956 Other revenue 69,235 1,317,681 1,386,916
Total operating revenues 83,172,796 156,208,713 239,381,509
Operating expenses:GME expense 30,286,538 — 30,286,538 Indigent care expense 75,917,497 79,648,062 155,565,559 Grants and contributions 773,357 8,932,775 9,706,132 Professional services 318,867 1,264,363 1,583,230 Compensation and benefits 324,719 532,157 856,876 Supplies, services and other 38,092 6,602,534 6,640,626
Total operating expenses beforedepreciation and amortization 107,659,070 96,979,891 204,638,961
Operating (loss) income beforedepreciation and amortization (24,486,274) 59,228,822 34,742,548
Depreciation and amortization (3,538,008) (14,975,687) (18,513,695)
Operating (loss) income (28,024,282) 44,253,135 16,228,853
Nonoperating revenues (expenses):Indigent care subsidies 14,838,184 — 14,838,184 Interest income 334,409 2,555 336,964 Debt related expenses — (707,887) (707,887) Miscellaneous revenue (expense) 6,949 276 7,225
Total nonoperating revenues(expenses) 15,179,542 (705,056) 14,474,486
Change in net assets (12,844,740) 43,548,079 30,703,339
Net assets, beginning of year 47,083,391 162,710,702 209,794,093 Net assets, end of year $ 34,238,651 206,258,781 240,497,432
See accompanying independent auditors’ report.

35
UNIVERSITY HOSPITALS AUTHORITY ANDUNIVERSITY HOSPITALS TRUST
Combining Statement of Cash Flows
Year ended June 30, 2012
Authority TrustFund Fund Total
Cash flows from operating activities:Receipts from customers $ 272,339 7,696,738 7,969,077 Joint operating agreement receipts — 35,994,750 35,994,750 Grant receipts (IME, GME, MTH) 79,277,820 83,724,077 163,001,897 Indigent care payments (75,111,167) (45,719,648) (120,830,815) Grant payments (936,520) (16,105,702) (17,042,222) IME match payments (41,518,205) (5,202,492) (46,720,697) Goods and service payments (416,478) (8,065,895) (8,482,373) Payments to employees (315,996) (728,166) (1,044,162) Other operating receipts 72,581 1,316,729 1,389,310
Net cash (used in) provided by operating activities (38,675,626) 52,910,391 14,234,765
Cash flows from noncapital financing activities:Subsidies 38,446,391 — 38,446,391
Cash flows from capital and related financing activities:Principal payment — (1,040,000) (1,040,000) Purchase of capital assets (2,492) (35,183,333) (35,185,825) Interest paid on bonds — (105,394) (105,394) Other bond related costs — (391,164) (391,164) Nonoperating revenue (2,361,965) 164,113 (2,197,852)
Net cash used in capital and related financing activities (2,364,457) (36,555,778) (38,920,235)
Cash flows from investing activities:Investment income 161,028 (1,077) 159,951
Net (decrease) increase in cash and cash equivalents (2,432,664) 16,353,536 13,920,872
Cash and cash equivalents, beginning of year 7,713,412 55,162,129 62,875,541 Cash and cash equivalents, end of year $ 5,280,748 71,515,665 76,796,413
Reconciliation of operating loss to net cash provided byoperating activities:
Operating (loss) income $ (43,037,954) 43,174,503 136,549
Adjustments to reconcile operating loss to net cash (used in)provided by operating activities:
Depreciation and amortization 3,341,688 15,122,956 18,464,644 (Increase) decrease in receivables, net 1,302,747 (191,284) 1,111,463 (Decrease) increase in payables and accrued expenses (282,007) (5,190,929) (5,472,936) Decrease in deferred revenues (100) (4,955) (5,055) Decrease in prepaid expenses — 100 100
Total adjustments 4,362,328 9,735,888 14,098,216 Net cash (used in) provided by operating activities $ (38,675,626) 52,910,391 14,234,765
Noncash capital financing and investing activities:Capital assets purchased remaining in accrued expenses $ — 1,072,097 1,072,097
See accompanying independent auditors’ report.

36
UNIVERSITY HOSPITALS AUTHORITY ANDUNIVERSITY HOSPITALS TRUST
Combining Statement of Cash Flows
Year ended June 30, 2011
Authority TrustFund Fund Total
Cash flows from operating activities:Receipts from customers $ 291,087 8,089,556 8,380,643 Joint operating agreement receipts — 29,925,000 29,925,000 Grant receipts (IME, GME, MTH) 81,486,194 184,791,186 266,277,380 Indigent care payments (75,917,497) (139,983,878) (215,901,375) Grant payments (5,773,357) (7,827,708) (13,601,065) IME match payments (32,287,509) (3,352,422) (35,639,931) Goods and service payments (442,477) (8,100,704) (8,543,181) Payments to employees (282,047) (532,157) (814,204) Other operating receipts 69,236 3,227,019 3,296,255
Net cash (used in) provided by operating activities (32,856,370) 66,235,892 33,379,522
Cash flows from noncapital financing activities:Subsidies 14,838,184 — 14,838,184
Cash flows from capital and related financing activities:Principal payment — (980,000) (980,000) Purchase of capital assets (476) (46,258,177) (46,258,653) Interest paid on bonds — (154,644) (154,644) Other bond related costs — (560,696) (560,696) Nonoperating revenue 183 74,476 74,659
Net cash used in capital and related financing activities (293) (47,879,041) (47,879,334)
Cash flows from investing activities:Investment income 360,462 (2,554) 357,908
Net (decrease) increase in cash and cash equivalents (17,658,017) 18,354,297 696,280
Cash and cash equivalents, beginning of year 25,371,504 36,807,757 62,179,261 Cash and cash equivalents, end of year $ 7,713,487 55,162,054 62,875,541
Reconciliation of operating loss to net cash provided byoperating activities:
Operating (loss) income $ (28,024,282) 44,253,135 16,228,853
Adjustments to reconcile operating loss to net cash (used in)provided by operating activities:
Depreciation and amortization 3,538,008 14,975,687 18,513,695 (Increase) decrease in receivables, net (1,257,940) 6,213,400 4,955,460 (Decrease) increase in payables and accrued expenses (7,112,607) 796,711 (6,315,896) Decrease in deferred revenues (100) (2,590) (2,690) Decrease in prepaid expenses — 100 100
Total adjustments (4,832,639) 21,983,308 17,150,669 Net cash (used in) provided by operating activities $ (32,856,921) 66,236,443 33,379,522
Noncash capital financing and investing activities:Unrealized gain $ 6,664 — 6,664 Capital assets purchased remaining in accrued expenses — 6,560,922 6,560,922
See accompanying independent auditors’ report.