Universities of Leeds, Sheffield and York ...eprints.whiterose.ac.uk/77451/7/HYP-10-0480 pre peer...
25
promoting access to White Rose research papers White Rose Research Online [email protected] Universities of Leeds, Sheffield and York http://eprints.whiterose.ac.uk/ This is an author produced version of a paper published in Hydrological Processes White Rose Research Online URL for this paper: http://eprints.whiterose.ac.uk/id/eprint/77451 Paper: Grayson, R and Holden, J (2011) Continuous measurement of spectrophotometric absorbance in peatland streamwater in northern England: implications for understanding fluvial carbon fluxes. Hydrological Processes, 26 (1). 27 - 39 (13). ISSN 0885-6087 http://dx.doi.org/10.1002/hyp.8106
Transcript of Universities of Leeds, Sheffield and York ...eprints.whiterose.ac.uk/77451/7/HYP-10-0480 pre peer...

promoting access to White Rose research papers
White Rose Research [email protected]
Universities of Leeds, Sheffield and Yorkhttp://eprints.whiterose.ac.uk/
This is an author produced version of a paper published in HydrologicalProcesses
White Rose Research Online URL for this paper:
http://eprints.whiterose.ac.uk/id/eprint/77451
Paper:Grayson, R and Holden, J (2011) Continuous measurement ofspectrophotometric absorbance in peatland streamwater in northern England:implications for understanding fluvial carbon fluxes. Hydrological Processes, 26(1). 27 - 39 (13). ISSN 0885-6087
http://dx.doi.org/10.1002/hyp.8106
1
Continuous measurement of spectrophotometric absorbance in peatland
streamwater: implications for understanding fluvial carbon fluxes
Richard Grayson* and Joseph Holden
School of Geography, University of Leeds, Leeds, LS2 9JT, UK
[email protected]: +44(0)113 3433373Fax: +44(0)113 3433308
[email protected]: +44(0)113 3433317Fax: +44(0)113 3433308
* corresponding author
Abstract
Bog systems tend to have a flashy hydrological regime with low baseflows and rapid andhigh storm peaks. Water derived from peatlands often contains significant amounts oforganic humic and fulvic materials which largely form the dissolved organic carbonfraction of the fluvial carbon flux. However, most estimates of dissolved organic fluxfrom peatlands are based on sampling that is infrequent and which may miss the periodsof high flux during storm events. In order to better characterise the behaviour and fluxesof fluvial carbon it is necessary to operate more frequent sampling. This paper presentsdata from a continuously operating field based spectrophotometer simultaneouslymeasuring absorbance across 200 to 730 nm at 2.5 nm intervals in runoff from an uplandpeatland stream. It is shown that absorbance at different wavelengths that have previouslybeen used to characterise dissolved organic carbon varies rapidly during storm events.The probe is shown to even detect changes in absorbance characteristics in response torainfall events before the stream discharge starts to rise. The high resolution behaviour ofabsorbance characteristics during storm events is different depending on the wavelengthstudied. Thus the choice of wavelength used as a proxy for dissolved organic carbonneeds careful attention and it may be that automated spectrophotometric methods whichprovide rich time series data from across the spectrum can tell us more about fluxes,processes and sources of aquatic carbon in peatland systems in the future than traditionalpractices have hitherto allowed.
Keywords
DOC; water colour; UV-Vis spectrometry; peat

2
1. IntroductionPeatlands are important carbon stores, but as well as sequestering carbon they also releaseit either directly to the atmosphere or via aquatic pathways. While there have been fewstudies from the same site that compare the role of water borne losses of carbon togaseous losses of carbon from peatlands, the studies that have been undertaken suggestthat aquatic losses are important, perhaps accounting for a loss of 40 to 50 % of thecarbon that is taken up via net ecosystem exchange each year (Dinsmore et al., 2010;Nilsson et al., 2008; Roulet et al., 2007). Of the aquatic components, dissolved organiccarbon (DOC) is usually the largest component, at least in catchments that are notseverely degraded. Significant increases in DOC concentrations in runoff from uplandpeat catchments have been observed over the past few decades (Evans et al., 2006; Evanset al., 2005; Worrall and Burt, 2007; Worrall et al., 2004; Worrall et al., 2003). Numerousmechanisms have been suggested to account for these increases (Evans et al., 2005;Worrall et al., 2007b) including land management change, decreases in sulphatedeposition and temperature change. The presence of DOC also results in water becomingcoloured, posing a significant problem where it is used in the supply of drinking water ascustomers are opposed to such aesthetic problems. Furthermore, trihalomethanes areproduced as a chlorination by-product when there are high concentrations of DOC andthese are strictly regulated and are a costly problem (Chow et al., 2003).
Estimates of DOC fluxes tend to be based on grab samples collected from streams atroutine, but often widely-spaced, intervals (e.g. weekly or twice monthly). The problemis that it is highly likely that much of the DOC flux occurs during short-duration highflow events which are rarely captured by routine monitoring studies (Clark et al., 2007).Blanket peat streams have a very flashy nature with fast responding discharge eventscharacterised by a narrow hydrograph with high peak flow and low baseflow (Holden andBurt, 2003; Price, 1992). Most of the flux of water occurs in a short period of time duringhigh flow. It is, therefore, likely that most of the fluvial carbon flux also occurs duringstorm events which are not captured by most routine DOC monitoring studies. Thus thereis a bias in most peatland DOC flux sampling towards baseflow which may lead tosignificant errors in calculating the total flux of DOC. Clark et al. (2007), for example,sampled DOC in Cottage Hill Sike, Moor House, UK, using a four-hour samplinginterval for a selection of storm events over a 45 day period with an automatic pumpsampler. They found that 50 % of the DOC flux occurred within 10 % of the time duringhigh flows. This was similar to Hinton et al (1997) who found that 41-57 % of DOC wasproduced during the top 10 % of flows in Canadian wetlands. It is, therefore, important toimprove the frequency of sampling of fluvial carbon loss from peatlands.
Aquatic DOC is comprised of various fractions which demonstrate strong absorbanceacross the UV-Vis range (Chen et al., 2002). Humic and fulvic acids make the largestcontribution to DOC in stream waters (c. 75 - 80 %) (Thurman, 1985). While absoluteDOC concentrations can be measured directly in the laboratory, such an approach doesnot lend itself to high resolution monitoring due to the time and costs involved. InsteadUV-Vis spectrometry has been used as a proxy for aqueous DOC concentrations by bothscientists and the water industry (Chow et al., 2008; Spencer et al., 2007; Watts et al.,2001; Worrall et al., 2007a; Worrall et al., 2003). Absorbance at both 400 and 465 nm
3
have been routinely used by the water industry as proxies for DOC and water colour(Hautala et al., 2000; Spencer et al., 2007). Although the water industry has also usedabsorbance at 254 nm as a surrogate for DOC for over 30 years (Chow et al., 2008;Spencer et al., 2007) absorbance at 465 nm is thought to be more powerful atdiscriminating different humic matter solutions than wavelengths around 250 nm(Hautala et al., 2000). Most scientific studies involve absolute measurements of DOC(using TOC analysers) to establish the relationship between absorbance and DOC.Several studies reporting increased DOC losses from UK upland peat catchments haveused absorbance at 400 nm as a proxy for DOC (Watts et al., 2001; Worrall et al., 2007b;Worrall et al., 2003). The UK Environmental Change Network (ECN) use absorbance at436 nm as a proxy for DOC, with absorbance at both 436 and 400 nm exhibiting a stronglinear relationship with DOC (Worrall et al., 2003). Other wavelengths used to estimatehumic substances include 272, 285 340, 360, 365, 410, 465 and 470 nm (Hautala et al.,2000; Kalbitz et al., 1999; Spencer et al., 2007; Tipping et al., 1988; Tipping et al., 1999).The SUVA254 (specific absorbance in UV light) approach normalises absorbance at 254nm against absolute DOC concentration to give absorbance per mass unit DOC (α m-
1/DOC mg l-1) (Weishaar et al., 2003). At the lower end of the UV-Vis range any non-organic matter and inorganic substances present can result in interference (Tipping et al.,1988).
Ratios between absorbance at different wavelengths provide valuable informationregarding the aqueous DOC/DOM composition and/or the sources of this DOC/DOM.The two dominant components of DOC, humic and fulvic acids, absorb light by differentamounts at different wavelengths as their characteristics differ; humic acids are moremature than fulvic acids. As a result the ratio of absorbance at 465 nm and 665 nm(465/665 or E4/E6 ratio) can be used to measure the proportion of humic and fulvic acidsand hence the degree of humification or aromaticity (Hautala et al., 2000; Spencer et al.,2007; Thurman, 1985). Mature humic acids from soil typically have an E4/E6 ratio of 2 to5 indicating increased humification, whereas less mature fulvic acids have a ratio of 8 to10 (Thurman, 1985). In streams and rivers, fulvic acids have been found to have an E4/E6
ratio of 5.5 to 17 (Thurman, 1985). Wallage et al. (2006) observed high ratios in upperlayers of peat indicating a high level of microbial activity and immature fulvic acids, andlower values in the deeper layers where humic acids dominated. Other humificationindices include ratios of absorbance at: 400/360 nm (Kalbitz et al., 1999); 470/360 nm(Kalbitz et al., 1999); 265/465 nm (Chen et al., 2002); 254/365 nm (Baker et al., 2008);and 254/410 nm (Baker et al., 2008; Spencer et al., 2007).
Within the water industry ‘online’ UV-Vis spectrometry is a common practice formeasuring water colour, although typically only one wavelength is measured. Several‘off the shelf’ UV-Vis spectrometers are now available to continually monitor or measurepart of, or the entire spectra of samples in situ: e.g. s::can spectro::lyser, carbo::lyser,nitro::lyser, color::lyser and multi::lyser™ and, WTW CarboVis and NiCaVis®. Suchdevices offer a range of benefits over traditional approaches to measuring discolourationin natural systems. First, they have the ability to make measurements with short samplingintervals if required (e.g. seconds). Second, several offer the ability to measure

4
absorbance across an entire spectrum (e.g. at 2.5 nm intervals), thus enabling valuableinformation on the different fractions of DOC present to be gathered.
The aim of this paper is to use field-based spectrophotometers to continually measureabsorbance across a wide range of wavelengths in runoff from an upland peat catchmentto examine the high-resolution behaviour of DOC and its components through time. Weseek to test whether absorbance at different wavelengths that have previously been usedto characterise DOC varies rapidly during storm events and whether absorbance ratioscan be used to characterise how the composition of DOC also varies during storm events.
2. Study SiteCottage Hill Sike (54°41'N, 2°23'W), located within the Moor House National NatureReserve in Cumbria, northern England, has a catchment area of c. 13.5 ha and analtitudinal range of 545 m to 580 m. Cottage Hill Sike is a tributary of Trout Beck whichlater flows into the River Tees, 750 m downstream of the Cottage Hill Sike confluence.Lower Carboniferous sequences of interbedded limestone, sandstone and shale provide abase for glacial boulder clay at the site (Johnson and Dunham, 1963). This clay impedesdrainage allowing blanket peat to develop, 98 % of the catchment is covered in blanketpeat (Adamson et al., 1998; Miller et al., 2001) which is typically 3 to 4 m thick, althoughin places it is around 8 m thick. Slope angles within the catchment vary between 0 and15o, with the majority of the catchment (>80%) being between 0 and 5o. Catchmentaspect is dominated by east to southeast facing slopes.
The catchment contains an Environmental Change Network (ECN) target monitoring sitewhere vegetation, water table, soil water chemistry, meteorology and other parametershave been monitored under strict protocols since 1992 (Sykes and Lane, 1996).Vegetation cover is most commonly Calluna vulgaris, Eriophorum vaginatum with someEmpertrum nigrum and Sphagnum capillifolium. The climate is classified as sub-arcticoceanic (Manley, 1936; Manley, 1942). Holden and Rose (2010) have produced acorrected and homogenised temperature record for the site dating back to 1931. The meanannual temperature at the site between 1931 and 2006 was 5.3oC compared to 5.8oC since1991 (5.1oC from 1961-1990). Mean annual precipitation is 2012 mm (records from1951-1980 and 1991-2006). Precipitation is only slightly seasonal with 57 % occurring inthe winter-half year from October to March.
The mean annual DOC flux for the catchment has been estimated at 218 kg ha-1 yr-1
(1993-2002) (Clark et al., 2005). The site is being used as the key field site in a UKNatural Environment Research Council funded project exploring the role of natural pipesin carbon export from peatlands (Holden et al., 2009). The site is also one of the national"Carbon Catchments" where measurements of all the major carbon flux terms are beingused to calculate the annual peatland C balance. Cottage Hill Sike flows into Trout Beckfor which there is a weekly DOC sample since 1992.
3. MethodsDue to the nature of UK upland peat catchments not all UV-Vis spectrometers aresuitable for measuring absorbance in situ within streams. Although a number of robust

5
spectrometers have been designed for operation within controlled environments, such aswithin water treatment works, they have rarely been deployed in natural streams. Thedeployment of such devices in upland streams poses a number of problems. For example,power supply options are often limited to batteries and/or solar panels, sites are oftenremote making routine visits and maintenance difficult, flows can vary widely, organicdebris can hamper sensors and the build up of organic deposits on the optical componentsover time can interfere with measurements. High rainfall totals and varying temperatureranges also dictate that any equipment must be weatherproof and be capable of operatingat low temperatures. Basic requirements for an in situ field spectrometer for use in atypical UK upland site are, therefore, that it must be robust enough to handle varyingflow conditions, be weatherproof and be able to run off a low voltage power supply.
Scan Messtechnik GmbH (Austria) have developed a range of UV-Vis spectrometers formonitoring water. The s::can spectro::lyser™ was the first of these and is a submersiblemultiparameter probe which uses a xenon flash lamp to measure absorbance across thetotal UV-Vis range (200-730 nm). In surface waters the maximum upper range of theinstrument is 300 Abs m-1 at 254 nm. In June 2009 a s::can spectro::lyser™ with a linkeds::can con::nect controller was installed in the main channel of Cottage Hill Sike justabove the gauging station. The spectrometer was installed perpendicular to flow acrossthe channel with the measuring window in line with flow. Nylon netting was placeddirectly upstream of the spectrometer to prevent material collecting on the spectrometer.To ensure the optics remain clean, the s::can system uses an optional compressed airsupply to clean the lens windows at set time intervals. Due to the remote location ofCottage Hill Sike a nitrogen cylinder was used (BOC, UK). The whole system waspowered using an external 40 Ah 12v lead acid battery. Initially measurements weremade every 15 minutes, during each measurement the mean of 3 individualmeasurements is stored; this interval was later extended to 20 minutes. Data wasdownloaded, batteries were changed and lens windows were manually cleaned everyfortnight. Although the spectrometer is capable of measuring DOC in mg l-1 based on aglobal calibration, the relationship between absorbance at specific wavelengths and DOChave been found to vary between sites and many different wavelengths have beenanalysed (Wallage and Holden, In Review). Therefore, the full spectrum ‘fingerprint’data were collected and we have not attempted to calculate DOC flux using the globalcalibration as we believe it be erroneous.Wavelengths analysed in this paper were chosenbased on the available literature (Table 1). This allowed for comparisons of absorbance atthese different wavelengths to examine their response to discharge, particularly duringstorm events. In addition the E4/E6 ratio was included as this has been extensively used tocharacterize the composition of DOC. Discharge was measured at 10 minute intervals onCottage Hill Sike as part of a separate research project. Rainfall was recorded in atipping-bucket rain gauge which recorded the timing of each 0.2 mm of rain.
4. ResultsA complete discharge and rainfall record from Cottage Hill Sike is available (e.g. Fig 1).The largest discharge recorded was 0.1689 m3 s-1 on 31/8/2009. High rainfall totals wereobserved in a number of months, noticeably July and November, with the highestrecorded hourly rainfall intensity of 15.6 mm hr-1 being measured on 1/11/2009.

6
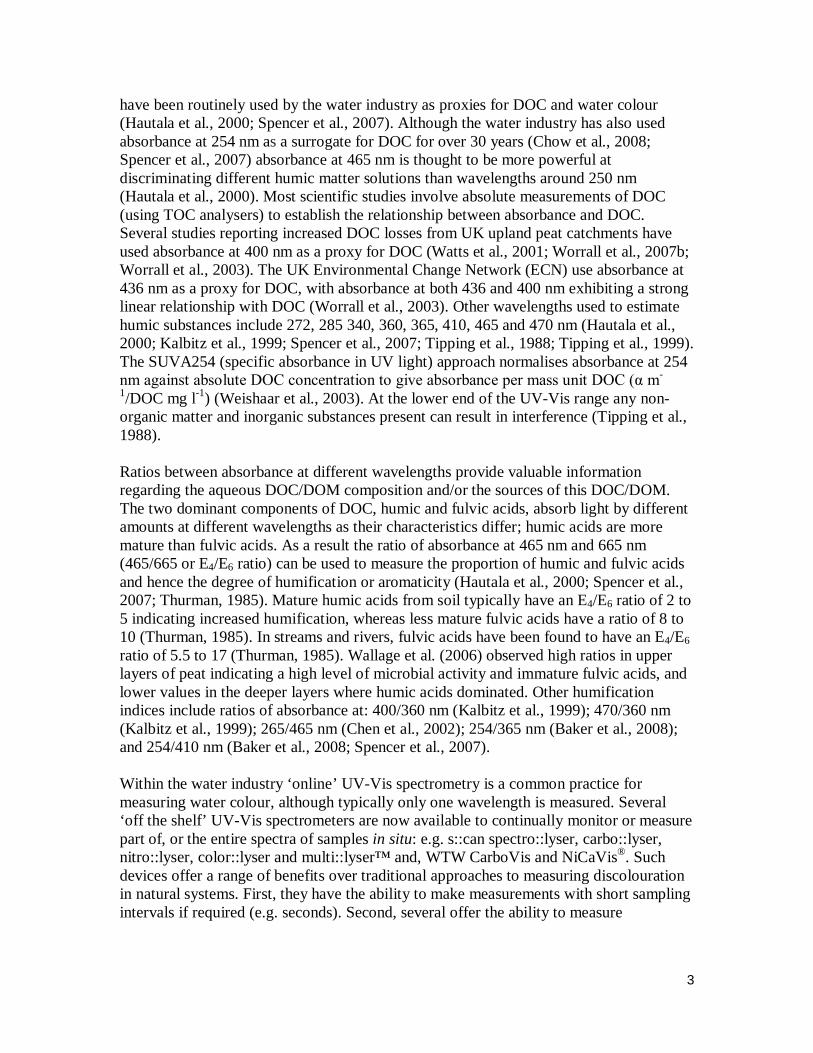
Between July and December 2009 a near continual record of the complete UV-Vis range(200 – 730 nm) was collected at Cottage Hill Sike using the scan spectro::lyser. Only onesignificant break in the record occurred between 4-17th November 2009 due to a landslidewhich blocked the access road to Moor House and therefore prevented batteryreplacement. Sampling was discontinued in December 2009 due to severe snow and icecover which continued through into late March 2010. Tabulated absorbance data at 2.5nm intervals between 220 and 730 nm was available for each measurement.
Of those wavelengths previously used to characterise DOC concentrations, those below300 nm exhibit high background values and noisy signals (Fig 2), with littledifferentiation between wavelengths and rapid fluctuations in absorbance over shortperiods of time thus limiting their ability to discriminate variations in DOCconcentrations. However, at wavelengths above 300 nm (Fig 2) the signal is noticeablyclearer suggesting that they have greater ability to discriminate changes in DOC. Thelong-term stability of the probe was demonstrated by the fact that after 10 months ofnear-continuous deployment and measurement the background absorbance at 400 nmremained below 0.7 Abs m-1.
Correlation analysis between wavelengths demonstrates that those found close to eachother are highly correlated whereas where wavelengths are widely spaced along thespectra relationships are generally weaker (Table 2). This indicates that whilewavelengths across the spectra have been used as proxies for DOC they do not all exhibitsimilar characteristics over time, exhibiting differing responses. No strong statisticalrelationships were observed between temporal changes in discharge and any of thewavelengths or ratios when comparing the full data sets (all r values <0.38).
As DOC export is typically temporally restricted, with the bulk occurring during stormevents (Clark et al., 2007) 24 storm events were selected from the record (July -November 2009) to establish the impacts of storm discharge on absorbance (Table 2).Absorbance at 340 and 400 nm during each of these storm events is shown in Fig 3.These two wavelengths were chosen as they have been extensively used as proxies forDOC (Table 1) and although wavelengths below 300 nm have also been widely used theywere not included for reasons given above. Although the temporal response ofabsorbance differs between storms, many exhibit similar characteristics with absorbancedecreasing on the rising limb of the hydrograph and then increasing again as dischargefalls to almost baseflow.
Clear decreases in absorbance at 340 and 400 nm coincide with increases in dischargeduring a large number of the storm events, with decreases in absorbance being witnessedon the rising limb of the hydrograph during storms 1, 2, 5, 7-14, 17-20, and 22-24. Instorms with double peaks (5, 10, 12, 18, 19, 22 and 24) further decreases in absorbancewere also observed which coincided with the second peak in discharge (Fig 3). Duringother storms (15 + 16) absorbance increased close to peak discharge while during othersno clear pattern was observable. This indicates that during the majority of events DOCconcentrations decrease noticeably during the rising limb of the hydrograph and continue

7
to remain low throughout much of the storm hydrograph before increasing again as flowreturns to baseflow. Therefore, during storm events DOC concentrations per unitdischarge are likely to be lower than those observed during regular baseflow. Theobserved decreases in absorbance during the rising limb of a number of stormhydrographs agrees with the response of absorbance at 400 nm in Trout Beck to the twomost significant storm events captured by Worrall et al. (2003).
One of the main advantages of using a system that measures absorbance across the entireUV-Vis spectra is the ability to monitor the behaviour across several wavelengths andalso to analyse the ratios of absorbance behaviour between wavelengths to provide aninsight into the composition of DOC. The response of the E4/E6 ratio to storm events iscomplex (Fig 4). However, a clear seasonal trend was observed in the E4/E6 ratio withstorms during the summer months of July and August having low ratios (<5)demonstrating the dominance of more mature humic acids (Table 3). In contrast, of thosestorms observed after 8th September 2009 only one had an E4/E6 ratio less than 5indicating that during the majority of storms less mature fulvic acids dominated. Thissuggests that summer storm events may have the ability to wash out more mature humicacids that have built up during drier months as a result of microbial breakdown. However,later in the year the store of these humic acids may become depleted with less maturefulvic acids instead dominating the DOC load. During some storms (storms 3, 6, 9, 10and 12) the initial response was a sharp increase in the E4/E6 ratio, suggesting an initialflux of less mature fulvic acids or surface runoff with low absorbance. In general both the400/360 and 470/360 ratios exhibited contrasting responses to the E4/E6 ratio indicatingthat they can also be used as humification indices.
To try and understand the general response of absorbance at various wavelengths duringstorm events mean absorbance was calculated for the first 30 hours of the 24 previouslyidentified storm events (Fig 5); this demonstrates that the mean response of the differentwavelengths vary over time. In general absorbance of the majority of wavelengths ofinterest remain relatively steady during the first 3 hours of storm events after whichabsorbance decreases rapidly, reaching their minimum around 11 to 12 hours in to thestorm, after this absorbance again increases. The response of the E4/E6 ratio shows someinteresting characteristics (Fig 5), initially this ratio decreases during the first 6 hoursbefore increasing to reach a maximum around 11 to 12 hours into the storm event whichcoincides with lowest absorbance. In both instances a further increase in averagedischarge at 12 hours results in a decrease in the E4/E6 ratio and an increase in absorbanceat most wavelengths. Again both the 400/360 and 470/360 ratios exhibit a contrastingresponse to the E4/E6 ratio. Although both mean absorbance at 340 and 400 nm showsimilar responses over time it is clear that the magnitude of these changes differs betweenthe two wavelengths (Fig 5) demonstrating that even for two wavelengths widely used tocharacterise DOC the temporal response varies.
5. DiscussionThe observed rapid changes in absorbance demonstrate that DOC concentrations andcomposition are highly dynamic changing rapidly even over short timescales. Thisindicates that many sampling strategies using weekly or even daily sampling are likely to

8
miss significant and important changes in DOC export. In many cases the response tostorm events was rapid and would more than likely be missed if weekly sampling wasemployed or indeed if 4 hourly sampling was employed during a few storm events. Sinceblanket peatlands have a flashy regime with rapid increases and decreases in dischargetypically over a period of hours (Evans et al., 1999) it is therefore clear that the currentDOC records from Trout Beck and Cottage Hill Sike are unlikely to properly characterisethis highly dynamic and complex flux.
Despite the rapid fluctuations observed in absorbance at all wavelengths it is possible todetermine some general trends in the response of absorbance during storm events. Clearlinks can be observed between changes in absorbance and both the rainfall and dischargerecords. All major peaks within the discharge record impacted absorbance across therange of wavelengths. Importantly it is evident that not all rainfall events result insignificant increases in discharge within Cottage Hill Sike; however the majority ofrainfall events do have an impact on absorbance. The average storm response calculatedfrom all 24 selected storm events demonstrates that in general a decrease in absorbance isobserved on the rising limb of the hydrograph (Fig 5), with further increases in dischargeassociated with second and third peaks in the hydrograph resulting in further decreases inabsorbance. The average response of the E4/E6 ratio demonstrates a similar response,decreasing on the rising limb, and smaller decreases being associated with further peaksin discharge. Therefore while the response of absorbance differs per storm event andoverall discharge and absorbance are poorly correlated there is a clear link betweenaverage absorbance and average discharge calculated from the 24 selected storm events.This lack of correlation between discharge and absorbance results from the fact that theresponse of absorbance varies over a storm event, typically increasing at the start of theevent after which it either plateaus or increases.
The differences in the temporal response of absorbance at both 340 and 400 nm suggeststhat despite both having been widely used as proxies to characterise DOC it is perhapstoo simplistic to use a single wavelength to characterise DOC. Further work is required todetermine which wavelengths provide the best characterisation of DOC during continualmeasurements made in situ in peatland streams and this work is ongoing at the study site.
The global calibration used by the spectro::lyser can be used to calculate turbidity usingabsorbance at a range of wavelengths. However, the lack of any significant increases inabsorbance during the selected storm events suggests that turbidity corrections ofabsorbance in upland peat catchments are not straightforward. This is particularly true forthe Cottage Hill Sike catchment as the contribution from mineral soils to the suspendedsediment load is very small or negligible due to the near complete dominance of blanketpeat within the catchment. Local calibration is possible for this instrument and this issomething that requires further investigation.
The general seasonal trend is for absorbance to decrease noticeably in late autumn andearly winter. Indeed, absorbance across all wavelengths was highest between July andAugust and lowest in November (Fig 3), this reflects the increased availability of humicand fulvic acids during warmer summer months and the increased occurrence of storm

9
events from September onwards. Equally the response of many of the wavelengths andratios to storm events varied over the period of monitoring indicating some seasonalvariability. During the earlier storms observed prior to late August 2009 the impact ofincreased discharge is less evident; however, after this date the impacts are clearer withabsorbance often decreasing during the rising limb of the hydrograph and then increasingagain as discharge falls. This suggests that earlier in the year storms have a lesser impacton DOC concentrations, while towards the end of summer when microbial decompositionhas taken place baseflow DOC concentrations are noticeably higher than those observedduring storm events.
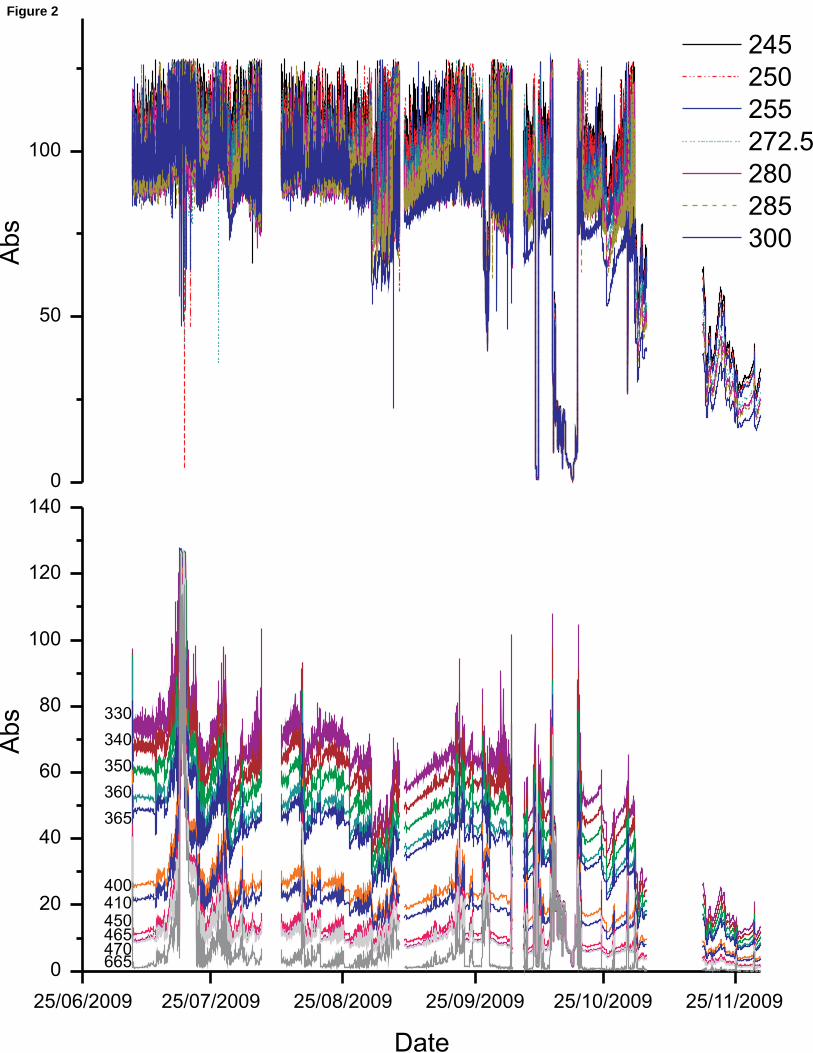
Within UK upland peats, humic and fulvic acids typically build up within near surfacepeat during drier and warmer summer months as the water table lowers allowingmicrobial break down of peat to occur. These humic and fulvic acids are then washed outof the peat during the first significant rainfall events after summer, a phenomenacommonly referred to as the ‘autumn flush’ (Mitchell and McDonald, 1992). As autumnand winter rainfall continues the source of humic and fulvic acids becomes depleted.Therefore towards the later end of autumn and winter the fulvic and humic content ofstreams may be minimal. Extreme rainfall in mid July resulted in the occurrence of anearly ‘flush’, with rapid increases in absorbance across a range of wavelengths resultingfrom high rainfall and subsequently high discharge being observed in July (Storm 3).High absorbance was also observed in mid October which may be indicative of a more‘normal’ autumn flush. Indeed during Storm 17 (19/10/2009) high absorbance wasobserved on the rising limb of the hydrograph, with peak absorbance being almost doublethat seen in other storms observed in September and October. Although a link withdischarge is not immediately clear, with absorbance increasing prior to any significantincrease in discharge (Fig 6), this increase in absorbance does coincide with rainfall overthe same time period and indicates that as rainfall increased, DOC was washed out of thepeat. Initially rainfall was minimal and hence any increase in absorbance was minimal,however as rainfall became more intense so absorbance increased as DOC lossesincreased significantly (Fig 6). Absorbance remained high after the event indicating thateven when discharge decreased DOC concentrations remained high as water with a highDOC content continued to drain from the peat.
During a number of storm events occurring after September 2009 (Storms 15, 16, 19, 20,22 and 24) the E4/E6 ratio was observed to initially be above 5 indicating the dominanceof fulvic acids. However, once discharge increased significantly the E4/E6 ratio fell below5 suggesting that humic acids were being washed out. As discharge began to decrease onthe falling limb the E4/E6 ratio was then observed to increase above 5 suggesting thatagain fulvic acids began to dominate. While an increase in the E4/E6 ratio later on in theyear after the autumn flush might indicate an increase in the contribution of immaturefulvic acids it is perhaps more realistic that this increase in the ratio resulted from anincrease in surface and shallow subsurface flow with low DOC content as a result of highrainfall and saturated peat. Indeed, the concurrent decrease in absorbance for a range ofwavelengths indicates that DOC concentrations decreased during this period as the sourceof humic and fulvic acids within the peat became depleted. Interestingly, examination ofa series of three storms towards the end of August 2009 (Storms 7, 8 and 9) showed that

10
the E4/E6 ratio remained below 5 during the majority of the first event but was then oftengreater than 5 during the second two events. This suggests that the first event eitherwashed out the majority of the available humic acids or the second two events arecharacteristic of storm events dominated by surface runoff where the peat was previouslysaturated by an earlier event. Sharp increases in the E4/E6 ratio were observed at the startof five storms occurring prior to the autumn flush. This suggests that where there is aready supply of more mature humic acids after summer decomposition has taken placestorms can result in an initial decrease in the concentration of humic acids, but that thisincreases as the storm continues. An alternative explanation for the observed increases inthe E4/E6 ratio observed close to the start of several storm events is that the low DOCcontent of surface runoff results in a reduction in absorbance across all the spectra butparticularly at the upper end where absorbance is generally lower, as a result the E4/E6
ratio increases significantly.
6. Conclusions and Future ResearchContinual measurements of absorbance across the UV-Vis spectra made using the s::canspectro::lyser™ exhibited rapid temporal fluctuations indicating that DOC concentrationsand composition are highly dynamic over time. During the majority of storm events theinitial response of absorbance was a significant decrease in colour, as the length of thestorm continues absorbance gradually returned to levels observed prior to the stormevent. Absorbance generally declined through autumn and winter and both an early flushand a more typical ‘autumn flush’ were observed during 2009; with the earlier flushoccurring as a result of intense summer rainfall. Humic acids dominated the DOC loadprior to the ‘autumn flush’ whereas later in the year less mature fulvic acids dominated.Despite absorbance at 340 and 400 nm both being used to characterise DOC they exhibitdiffering responses to storm events
Although the spectrophotometer used in this study is capable of measuring DOC in mg l-1
based on a global calibration, the relationship between absorbance at specificwavelengths and DOC have been found to vary between sites and many differentwavelengths have been used as a proxy for DOC. Therefore, we have not attempted tocalculate DOC flux using the global calibration as we believe it to be problematic inpeatland systems. Instead it is our long-term goal to establish information that willimprove the ability of the probe to estimate DOC fluxes in peatland systems. Forexample, this requires work to use spectrophotometers to sample peat DOC sources andstreamflows at the same time, DOC sampling to establish how well differentwavelengths/ratios sampled by the spectrophotometer actually characterise the DOCproduced by peat and examination of seasonal characteristics of DOC – absorbancerelationships. In the long term it is hoped that this additional information combined withthe high resolution data rich approach of the spectrophotometer will enable us to producemuch more reliable estimates of DOC fluxes from peatland systems than those that arecurrently possible. At very least the high resolution data from across the spectrum shouldat least help us understand more about the sources of DOC within peatland systems andthe dynamic response of the aquatic carbon system to changes in hydrological conditions.

11
AcknowledgementsThis research was funded through a Philip Leverhulme Prize awarded to JH

12
ReferencesAdamson JK, Scott WA, Rowland AP. 1998 The dynamics of dissolved nitrogen in a
blanket peat dominated catchment. Environmental Pollution 99: 69-77.Baker A, Bolton L, Newson M, Spencer RGM. 2008 Spectrophotometric properties of
surface water dissolved organic matter in an afforested upland peat catchment.Hydrological Processes 22: 2325-2336.
Chen J, Gu BH, LeBoeuf EJ, Pan HJ, Dai S. 2002 Spectroscopic characterization of thestructural and functional properties of natural organic matter fractions.Chemosphere 48: 59-68.
Chin, Y.P., Aiken, G. and Oloughlin, E., 1994. Molecular-weight, polydispersity, andspectroscopic properties of aquatic humic substances. Environmental Science &Technology 28: 1853-1858.
Chow AT, Dahlgren RA, Zhang Q, Wong PK. 2008 Relationships between specificultraviolet absorbance and trihalomethane precursors of different carbon sources.Journal of Water Supply Research and Technology-Aqua 57: 471-480.
Chow AT, Tanji KK, Gao S. 2003 Production of dissolved organic carbon (DOC) andtrihalomethane (THM) precursor from peat soils. Water Research 37: 4475-4485.
Clark JM, Lane SN, Chapman PJ, Adamson JK. 2007 Export of dissolved organic carbonfrom an upland peatland during storm events: Implications for flux estimates.Journal of Hydrology 347: 438-447.
Dinsmore KJ, Billett MF, Skiba UM, Rees RM, Drewer J, Helfter C. 2010 Role of theaquatic pathway in the carbon and greenhouse gas budgets of a peatlandcatchment. Global Change Biology 16: 2750-2762.
Evans CD, Chapman PJ, Clark JM, Monteith DT, Cresser MS. 2006 Alternativeexplanations for rising dissolved organic carbon export from organic soils. GlobalChange Biology 12: 2044-2053.
Evans CD, Monteith DT, Cooper DM. 2005 Long-term increases in surface waterdissolved organic carbon: Observations, possible causes and environmentalimpacts. Environmental Pollution 137: 55-71.
Evans, M.G., Burt, T.P., Holden, J. and Adamson, J.K. 1999 Runoff generation and watertable fluctuations in blanket peat: evidence from UK data spanning the drysummer of 1995. Journal of Hydrology 221: 141-160.
Hautala K, Peuravuori J, Pihlaja K. 2000 Measurement of aquatic humus content byspectroscopic analyses. Water Research 34: 246-258.
Her, N., Amy, G., Sohn, J. and Gunten, U. 2008 UV absorbance ratio index with sizeexclusion chromatography (URI-SEC) as an NOM property indicator. Journal ofWater Supply Research and Technology-Aqua 57: 35-44.
Hinton MJ, Schiff SL, English MC. 1997 The significance of storms for the concentrationand export of dissolved organic carbon from two Precambrian Shield catchments.Biogeochemistry 36: 67-88.
Holden J, Burt TP. 2003 Runoff production in blanket peat covered catchments. WaterResources Research 39.
Holden J, Rose R. 2010 Temperature and surface lapse rate change: a study of the UK'slongest upland instrumental record. International Journal of Climatology 30 doi:10.1002/joc.2136.

13
Hongve, D. and Akesson, G. 1996 Spectrophotometric determination of water colour inHazen units. Water Research, 1996; 30: 2771-2775.
Johnson GAL, Dunham KC. 1963 The Geology of Moor House: A National NatureReserve in north-east Westmorland. London: H.M.S.O.
Kalbitz, K., Geyer, S. and Geyer, W. 2000 A comparative characterization of dissolvedorganic matter by means of original aqueous samples and isolated humicsubstances. Chemosphere 40: 1305-1312.
Kalbitz K, Geyer W, Geyer S. 1999 Spectroscopic properties of dissolved humicsubstances - a reflection of land use history in a fen area. Biogeochemistry 47:219-238.
Korshin, G., Chow, C.W.X., Fabris, R. and Drikas, M. 2009 Absorbance spectroscopy-based examination of effects of coagulation on the reactivity of fractions ofnatural organic matter with varying apparent molecular weights. Water Research43: 1541-1548.
Leenheer, J.A. and Croue, J.-P. 2003 Characterizing Aquatic Dissolved Organic Matter.Environmental Science & Technology 37: 18A-26A.
Manley G. 1936 The climate of the northern Pennines: the coldest part of England.Quarterly Journal of the Royal Meteorological Society 62: 103-115.
Manley G. 1942 Meteorological observations on Dun Fell, a mountain station in northernEngland. Quarterly Journal of the Royal Meteorological Society 68: 151-165.
McKnight, D.M., Harnish, R., Wershaw, R.L., Baron, J.S. and Schiff, S. 1997 Chemicalcharacteristics of particulate, colloidal, and dissolved organic material in LochVale Watershed, Rocky Mountain National Park. Biogeochemistry36: 99-124.
Miller JD, Adamson JK, Hirst D. 2001 Trends in stream water quality in EnvironmentalChange Network upland catchments: the first 5 years. The Science of the TotalEnvironment 265: 27-38.
Mitchell G, McDonald AT. 1992 Discoloration of Water by Peat Following InducedDrought and Rainfall Simulation. Water Research 26: 321-326.
Nilsson M, Sagerfors J, Buffam I, Laudon H, Eriksson T, Grelle A, et al. 2008Contemporary carbon accumulation in a boreal oligotrophic minerogenic mire - asignificant sink after accounting for all C-fluxes. Global Change Biology 14:2317-2332.
Price JS. 1992 Blanket Bog in Newfoundland .2. Hydrological Processes. Journal ofHydrology 135: 103-119.
Roulet NT, Lafleur PM, Richard PJH, Moore TR, Humphreys ER, Bubier J. 2007Contemporary carbon balance and late Holocene carbon accumulation in anorthern peatland. Global Change Biology 13: 397-411.
Spencer RGM, Bolton L, Baker A. 2007 Freeze/thaw and pH effects on freshwaterdissolved organic matter fluorescence and absorbance properties from a numberof UK locations. Water Research 41: 2941-2950.
Sykes JM, Lane AMJ. 1996 The United Kingdom Environmental Change Network:protocols for standard measurements of terrestrial sites. London: NaturalEnvironment Research Council.
Thurman EM. 1985 Organic geochemistry of natural water. Kluwer AcademicPublishers, Dordrecht.

14
Tipping E, Hilton J, James B. 1988 Dissolved organic matter in Cumbrian lakes andstreams. Freshwater Biology 19: 371-378.
Tipping E, Woof C, Rigg E, Harrison AF, Ineson P, Taylor K, et al. 1999 Climaticinfluences on the leaching of dissolved organic matter from upland UK Moorlandsoils, investigated by a field manipulation experiment. Environment International25: 83-95.
Wallage ZE, Holden J. Spatial and temporal variability in the relationship between watercolour and dissolved organic carbon in blanket peat pore waters. Science of theTotal Environment In Review.
Wallage, Z.E., Holden, J. and McDonald, A.T. 2006 Drain blocking: An effectivetreatment for reducing dissolved organic carbon loss and water discolouration in adrained peatland. Science of the Total Environment 367: 811-821.
Watts CD, Naden PS, Machell J, Banks J. 2001 Long term variation in water colour fromYorkshire catchments. The Science of The Total Environment 278: 57-72.
Weishaar JL, Aiken GR, Bergamaschi BA, Fram MS, Fujii R, Mopper K. 2003Evaluation of specific ultraviolet absorbance as an indicator of the chemicalcomposition and reactivity of dissolved organic carbon. Environmental Science &Technology 37: 4702-4708.
Worrall F, Armstrong A, Adamson JK. 2007a The effects of burning and sheep-grazingon water table depth and soil water quality in an upland peat. Journal ofHydrology 339: 1-14.
Worrall F, Burt TP. 2007 Trends in DOC concentration in Great Britain. Journal ofHydrology 346: 81-92.
Worrall F, Guilbert T, Besien T. 2007b The flux of carbon from rivers: the case for fluxfrom England and Wales. Biogeochemistry 86: 63-75.
Worrall F, Harriman R, Evans CD, Watts CD, Adamson J, Neal C, et al. 2004 Trends indissolved organic carbon in UK rivers and lakes. Biogeochemistry 70: 369-402.
Worrall F, Reed MS, Warburton J, Burt T. 2003 Carbon budget for a British upland peatcatchment. Science of the Total Environment 312: 133-146.

15
Table 1. Wavelengths used in the analysis of DOC/DOM in natural waters. The majority1of wavelengths are used as proxies whereas both 660 nm and 665 nm have been used2along with 460nm and 465 nm to characterise the composition of DOC.3
4Wavelength,
nmReference
203 Her et al., 2008210 Her et al., 2008; Korshin et al., 2009245 Thurman, 1985250 Hautala et al., 2000253 Her et al., 2008
254Korshin et al., 1997; Spencer et al., 2007; Chow et al., 2008; Baker et al., 2008; Her etal., 2008; Leenheer and Croue, 2003; Korshin et al., 2009
260 Chen et al., 2002272 Spencer et al., 2007; Baker et al., 2008
280Chin et al., 1994; Kalbitz et al., 1999 Kalbitz et al., 2000; Weishaar et al., 2003;Korshin et al., 2009
285 Kalbitz et al., 1999; Kalbitz et al., 2000300 Mcknight et al., 1997330 Hautala et al., 2000340 Tipping et al., 1988; Tipping et al., 1999; Spencer et al., 2007; Baker et al., 2008350 Korshin et al., 2009360 Kalbitz et al., 1999; Kalbitz et al., 2000365 Spencer et al., 2007; Baker et al., 2008
400Thurman, 1985; Hongve and Akesson, 1996; Kalbitz et al., 1999; Kalbitz et al., 2000;Hautala et al., 2000; Watts et al., 2001; Worrall et al., 2003; Worrall et al., 2007
410 Hongve and Akesson, 1996; Spencer et al., 2007; Baker et al., 2008420 Hongve and Akesson, 1996432 Hongve and Akesson, 1996436 Hongve and Akesson, 1996450 Hongve and Akesson, 1996456 Hautala et al., 2000460 Her et al 2008
465Hongve and Akesson, 1996; Hautala et al., 2000; Wallage et al., 2006; Spencer et al.,2007; Baker et al., 2008
470 Kalbitz et al., 1999; Kalbitz et al., 2000490 Hautala et al., 2000660 Her et al., 2008665 Wallage et al., 2006; Spencer et al., 2007a; Baker et al., 2008

16
Table 2. Correlation matrix demonstrating the relationships (Pearson correlation r values) between the temporal response of5absorbance at those wavelengths previously used as proxies for or to characterise DOC. P values for all r values in the table were6<0.0057
8Nm Q 245 250 260 272 280 285 300 330 340 350 360 365 400 410 420 435 450 455 460 465 470 490 660 665
245 -0.012
250 -0.009 0.971
260 -0.007 0.955 0.956
272.5 -0.006 0.966 0.948 0.955
280 -0.014 0.967 0.959 0.935 0.959
285 -0.027 0.965 0.962 0.952 0.956 0.966
300 -0.036 0.931 0.929 0.949 0.956 0.943 0.954
330 0.006 0.897 0.901 0.908 0.918 0.926 0.940 0.971
340 0.053 0.878 0.878 0.888 0.907 0.910 0.920 0.962 0.988
350 0.079 0.855 0.853 0.859 0.883 0.890 0.902 0.938 0.977 0.987
360 0.123 0.821 0.822 0.824 0.846 0.856 0.869 0.907 0.960 0.973 0.986
365 0.138 0.807 0.807 0.807 0.828 0.838 0.85 0.892 0.951 0.966 0.981 0.993
400 0.271 0.606 0.606 0.599 0.627 0.640 0.655 0.694 0.788 0.821 0.866 0.913 0.931
410 0.312 0.534 0.535 0.536 0.555 0.570 0.585 0.625 0.727 0.768 0.818 0.868 0.889 0.985
420 0.322 0.478 0.476 0.481 0.501 0.511 0.528 0.566 0.676 0.721 0.774 0.828 0.850 0.971 0.989
435 0.325 0.400 0.404 0.411 0.426 0.444 0.457 0.491 0.607 0.652 0.714 0.778 0.804 0.958 0.979 0.987
450 0.359 0.336 0.347 0.354 0.372 0.385 0.397 0.436 0.558 0.609 0.667 0.739 0.764 0.935 0.966 0.983 0.988
455 0.358 0.321 0.33 0.338 0.357 0.370 0.384 0.423 0.544 0.591 0.662 0.731 0.755 0.927 0.959 0.982 0.984 0.994
460 0.372 0.306 0.316 0.323 0.342 0.358 0.370 0.406 0.531 0.581 0.647 0.721 0.745 0.927 0.958 0.977 0.988 0.992 0.993
465 0.358 0.297 0.306 0.312 0.334 0.351 0.362 0.395 0.523 0.571 0.637 0.710 0.741 0.925 0.956 0.973 0.990 0.990 0.990 0.993
470 0.347 0.283 0.295 0.302 0.319 0.338 0.349 0.382 0.511 0.560 0.630 0.704 0.732 0.919 0.952 0.968 0.985 0.987 0.985 0.988 0.993
490 0.352 0.235 0.249 0.254 0.275 0.292 0.302 0.339 0.465 0.518 0.586 0.664 0.693 0.899 0.936 0.959 0.977 0.988 0.989 0.993 0.991 0.985
660 0.369 0.086 0.107 0.123 0.141 0.159 0.166 0.200 0.338 0.399 0.47 0.561 0.594 0.829 0.876 0.908 0.936 0.955 0.959 0.963 0.963 0.963 0.973
665 0.375 0.072 0.094 0.11 0.129 0.143 0.154 0.189 0.332 0.392 0.465 0.553 0.592 0.833 0.881 0.907 0.940 0.954 0.957 0.963 0.966 0.966 0.975 0.983
E4/E6 -0.101 -0.212 -0.215 -0.219 -0.226 -0.228 -0.229 -0.233 -0.243 -0.245 -0.245 -0.245 -0.245 -0.221 -0.210 -0.200 -0.187 -0.177 -0.174 -0.17 -0.167 -0.167 -0.157 -0.133 -0.131
9

17
Table 3. Storm event details including the start and end time of the hydrograph, the mean10E4/E6 ratio, total rainfall and total storm discharge.11
12Storm Start Date End Date Mean E4/E6 Total Rain, mm Q (m3)
1 11/07/2009 23:41 13/07/2009 06:56 3.49 18.1 668
2 13/07/2009 23:26 14/07/2009 22:58 3.15 8.2 627
3 16/07/2009 20:58 19/07/2009 00:28 1.35 112.2 8429
4 21/07/2009 13:13 22/07/2009 12:43 3.45 25.2 864
5 28/07/2009 05:45 30/07/2009 03:05 2.48 34.3 1738
6 15/08/2009 04:17 16/08/2009 05:17 2.72 19.6 1851
7 23/08/2009 11:04 24/08/2009 21:19 3.73 14.7 828
8 26/08/2009 06:51 27/08/2009 06:36 7.16 16.2 1072
9 28/08/2009 06:21 29/08/2009 13:06 4.85 13.6 750
10 31/08/2009 06:51 01/09/2009 12:36 2.92 36.9 3325
11 01/09/2009 15:36 02/09/2009 1:36 2.35 17.3 1301
12 02/09/2009 19:21 04/09/2009 08:06 1.94 25.2 2269
13 04/09/2009 10:06 05/09/2009 04:06 1.84 10.5 845
14 08/09/2009 16:39 09/09/2009 17:09 7.67 10.2 598
15 03/10/2009 03:19 03/10/2009 20:49 6.98 24.1 1406
16 06/10/2009 09:49 07/10/2009 02:19 6.22 17.0 1204
17 19/10/2009 03:34 20/10/2009 12:02 5.48 17.0 1249
18 20/10/2009 14:02 22/10/2009 11:42 10.25 10.5 629
19 24/10/2009 09:22 25/10/2009 16:42 9.13 26.1 1324
20 25/10/2009 17:02 26/10/2009 13:42 10.32 14.5 1110
21 30/10/2009 20:02 31/10/2009 13:42 6.69 16.2 728
22 01/11/2009 05:02 02/11/2009 19:22 4.54 75.4 5117
23 03/11/2009 02:42 04/11/2009 07:42 7.43 30.0 1487
24 17/11/2009 11:28 18/11/2009 10:28 7.62 42.8 2870
13
14

18
List of Figures15Figure 1. The rainfall and discharge record for Cottage Hill Sike from July to December16200917Figure 2. Absorbance (Abs m-1) in Cottage Hill Sike from July to December 200918Figure 3. Discharge (dashed black line) and changes in absorbance at 340 (black line),19400 (grey line) nm for 24 storm events at Cottage Hill Sike20Figure 4. Changes in the E4/E6 ratio (solid grey line) and discharge (dashed black line)21over 24 storm events in Cottage Hill Sike22Figure 5. Mean discharge, mean absorbance at 340 and 400nm, mean E4/E6 ratio and23mean 400/360 and 470/360 ratio over time for the first 30 hours of the 24 storm events24analysed25Figure 6. Response of absorbance characteristics for 340, 400 and 365 nm for an October262009 storm event27

0
7
14
20/11/200919/09/200919/07/2009
Ho
urly
Ra
in(m
m)
Rain
0.25
0.20
0.15
0.10
0.05
0.00
QQ(m
3s
-1)
Figure 1
0
50
100
25/06/2009 25/07/2009 25/08/2009 25/09/2009 25/10/2009 25/11/2009
0
20
40
60
80
100
120
140
Abs
245
250
255
272.5
280
285
300
470
450
410
400
465
665
Abs
Date
330
340
350
360
365
Figure 2

04/09/2009 04/09/2009 05/09/2009 05/09/2009
0.01
08/09/2009 08/09/2009 09/09/2009 09/09/2009
1E-3
0.01
02/10/2009 03/10/2009 03/10/2009 03/10/2009
0.01
06/10/2009 06/10/2009 06/10/2009 07/10/2009
0.01
19/10/2009 19/10/2009 20/10/2009 20/10/2009
1E-3
0.01
20/10/2009 21/10/2009 22/10/2009 23/10/2009
1E-3
0.01
24/10/2009 24/10/2009 25/10/2009 25/10/2009
1E-3
0.01
25/10/2009 25/10/2009 26/10/2009
0.01
30/10/2009 30/10/2009 31/10/2009 31/10/2009
1E-3
0.01
01/11/2009 01/11/2009 02/11/2009 02/11/2009 03/11/2009
0.01
0.1
03/11/2009 03/11/2009 04/11/2009 04/11/2009
0.02
0.04
0.06
17/11/2009 17/11/2009 18/11/2009
0.01
0.1
Qm
3s
-1
Storm 13 Storm 14
Qm
3s
-1
Storm 15
Qm
3s
-1
Storm 16
Qm
3s
-1
Storm 17
Qm
3s
-1
Storm 18
Qm
3s
-1
Storm 19
Qm
3s
-1
Storm 20
Qm
3s
-1
Storm 21
Qm
3s
-1
Storm 22
Qm
3s
-1
Storm 23
Qm
3s
-1
Storm 24
Qm
3s
-1
Ab
s
Ab
s
Ab
s
Ab
s
Ab
s
Ab
s
Ab
s
Ab
s
Ab
s
Ab
s
Ab
s
Ab
s
11/07/2009 12/07/2009 12/07/2009 13/07/2009
1E-4
1E-3
0.01
13/07/2009 14/07/2009 14/07/2009 15/07/2009
1E-3
0.01
16/07/2009 17/07/2009 18/07/2009 19/07/2009
1E-3
0.01
0.1
21/07/2009 21/07/2009 22/07/2009 22/07/2009
1E-3
0.01
28/07/2009 29/07/2009 30/07/2009
1E-3
0.01
14/08/2009 15/08/2009 15/08/2009 16/08/2009
0.01
0.1
23/08/2009 23/08/2009 24/08/2009 24/08/2009 25/08/2009
1E-3
0.01
25/08/2009 26/08/2009 26/08/2009 27/08/2009
1E-3
0.01
28/08/2009 28/08/2009 29/08/2009 29/08/2009
1E-3
0.01
31/08/2009 31/08/2009 01/09/2009 01/09/2009
0.01
0.1
01/09/2009 01/09/2009 02/09/2009
0.01
02/09/2009 03/09/2009 03/09/2009 04/09/2009 04/09/2009
0.01
Qm
3s
-1
Qm
3s
-1
Qm
3s
-1
Qm
3s
-1
Qm
3s
-1
Qm
3s
-1
Qm
3s
-1
Qm
3s
-1
Qm
3s
-1
Qm
3s
-1
Qm
3s
-1
Qm
3s
-1
Ab
s
Ab
s
Ab
s
Ab
s
Ab
s
Storm 1 Storm 2 Storm 3
Storm 9Storm 8Storm 7
Storm 4 Storm 5 Storm 6
Storm 10 Storm 11 Storm 12
Ab
s
Ab
s
Ab
s
Ab
sA
bs
Ab
s
Ab
s
Figure 3

11/07/2009 12/07/2009 12/07/2009 13/07/2009
1E-4
1E-3
0.01
13/07/2009 14/07/2009 14/07/2009 15/07/2009
1E-3
0.01
16/07/2009 17/07/2009 18/07/2009 19/07/2009
1E-3
0.01
0.1
21/07/2009 21/07/2009 22/07/2009 22/07/2009
1E-3
0.01
28/07/2009 29/07/2009 30/07/2009
1E-3
0.01
14/08/2009 15/08/2009 15/08/2009 16/08/2009
0.01
0.1
23/08/2009 23/08/2009 24/08/2009 24/08/2009 25/08/2009
1E-3
0.01
25/08/2009 26/08/2009 26/08/2009 27/08/2009
1E-3
0.01
28/08/2009 28/08/2009 29/08/2009 29/08/2009
1E-3
0.01
31/08/2009 31/08/2009 01/09/2009 01/09/2009
0.01
0.1
01/09/2009 01/09/2009 02/09/2009
0.01
02/09/2009 03/09/2009 03/09/2009 04/09/2009 04/09/2009
0.01
Qm
3s
-1
Storm 1 Storm 2 Storm 3
Storm 4 Storm 5 Storm 6
Storm 9Storm 8Storm 7
Storm 10 Storm 11 Storm 12
Qm
3s
-1
Qm
3s
-1
Qm
3s
-1
Qm
3s
-1
Qm
3s
-1
Qm
3s
-1
Qm
3s
-1
Qm
3s
-1
Qm
3s
-1
Qm
3s
-1
Qm
3s
-1
2
4
6
8
E4/E
6
2
4
6
E4/E
6
0.8
1.6
2.4
E4/E
6
0
3
6
9
E4/E
6
1
2
3
4
5
E4/E
6
0
3
6
9
E4/E
6
3
6
9
E4/E
6
3
6
9
E4/E
6
3
6
9
E4/E
6
2
4
6
E4/E
6
1
2
3
4
E4/E
6
1.8
2.4
3.0
E4/E
6
04/09/2009 04/09/2009 05/09/2009 05/09/2009
0.01
08/09/2009 08/09/2009 09/09/2009 09/09/2009
1E-3
0.01
02/10/2009 03/10/2009 03/10/2009 03/10/2009
0.01
06/10/2009 06/10/2009 06/10/2009 07/10/2009
0.01
19/10/2009 19/10/2009 20/10/2009 20/10/2009
1E-3
0.01
20/10/2009 21/10/2009 22/10/2009 23/10/2009
1E-3
0.01
24/10/2009 24/10/2009 25/10/2009 25/10/2009
1E-3
0.01
25/10/2009 25/10/2009 26/10/2009
0.01
30/10/2009 30/10/2009 31/10/2009 31/10/2009
1E-3
0.01
01/11/2009 01/11/2009 02/11/2009 02/11/2009 03/11/2009
0.01
0.1
03/11/2009 03/11/2009 04/11/2009 04/11/2009
0.02
0.04
0.06
17/11/2009 17/11/2009 18/11/2009
0.01
0.1
Qm
3s
-1
Storm 13 Storm 14 Storm 15
Storm 16 Storm 17 Storm 18
Storm 19 Storm 20 Storm 21
Storm 22 Storm 23 Storm 24
Qm
3s
-1
Qm
3s
-1
Qm
3s
-1
Qm
3s
-1
Qm
3s
-1
Qm
3s
-1
Qm
3s
-1
Qm
3s
-1
Qm
3s
-1
Qm
3s
-1
Qm
3s
-1
1.6
2.0
2.4
E4/E
6
6
8
10
E4/E
6
0
10
20
E4/E
6
0
5
10
15
E4/E
6
0
10
20
30
E4/E
6
6
9
12
15
E4/E
6
0
5
10
15
E4/E
6
0
6
12
E4/E
6
0
5
10
15
E4/E
6
0
6
12
E4/E
6
0
7
14
E4/E
6
0
7
14
E4/E
6
Figure 4

0.00
0.01
0.02
0.03
3
4
5
6
Qm
3s
-1
350
Abs
400
E4/E
6R
atio
2 4 6 8 10 12 14 16 18 20 22 24 26 28 30
400/360
Time
470/360
400/3
60
and
470/3
60
Figure 5
0.00
0.02
0.04
17/10/2009 22:00 18/10/2009 22:00 19/10/2009 22:00
0
10
20
30
40
50
60
70
80
90
100
Q(m
3s
-1)
0
2
4
Ho
url
yR
ain
fall
(mm
)
Ab
s
340
400
465
Figure 6