Carbon and hydrogen isotopic ratios of atmospheric methane ...
Upload
truongkhanhCategory
view
216download
0
promoting access to White Rose research papers
White Rose Research Online
Universities of Leeds, Sheffield and York http://eprints.whiterose.ac.uk/
This is an author produced version of a paper published in Combustion and Flame,
White Rose Research Online URL for this paper: http://eprints.whiterose.ac.uk/9191/
Published paper Fairweather, M., Ormsby, M.P., Sheppard, C.G.W. and Woolley, R. Turbulent burning rates of methane and methane-hydrogen mixtures. Combustion and Flame, 2009, 156(4), 780-790. http://dx.doi.org/10.1016/j.combustflame.2009.02.001

Turbulent Burning Rates of Methane and Methane-Hydrogen Mixtures
M. Fairweather†, M.P. Ormsby‡, C.G.W. Sheppard‡ and R. Woolley¶
†School of Process, Environmental and Materials Engineering, and ‡School of
Mechanical Engineering, University of Leeds, Leeds LS2 9JT, UK
¶Department of Mechanical Engineering, University of Sheffield, Sheffield S1 3JD, UK
Corresponding Author for Review Process: Prof. M. Fairweather School of Process, Environmental and Materials Engineering University of Leeds Leeds LS2 9JT UK Tel: +44 (0) 113 343 2419 Fax: +44(0) 113 343 2405 Email: [email protected]
1
Abstract
Methane and methane-hydrogen (10%, 20% and 50% hydrogen by volume) mixtures
have been ignited in a fan stirred bomb in turbulence and filmed using high speed cine
schlieren imaging. Measurements were performed at 0.1 MPa (absolute) and 360 K. A
turbulent burning velocity was determined for a range of turbulence velocities and
equivalence ratios. Experimental laminar burning velocities and Markstein numbers
were also derived. For all fuels the turbulent burning velocity increased with turbulence
velocity. The addition of hydrogen generally resulted in increased turbulent and laminar
burning velocity and decreased the Markstein number. Those flames that were less
sensitive to stretch (lower Markstein number) burned faster under turbulent conditions,
especially as the turbulence levels were increased, compared to stretch-sensitive (high
Markstein number) flames.
Keywords: turbulent premixed, laminar premixed, burning rates, measurement,
methane, methane-hydrogen
2
Nomenclature A, b / dimensionless Constants
Da Damkholer number
fs / r.p.m. fan speed
K / dimensionless Karlovitz stretch factor
L / m integral length scale
Lb, Ls, Lc, Lsr, Lcr / m Markstein lengths
Le / dimensionless Lewis number
Ma, Masr / dimensionless Markstein number
rsch / m schlieren flame radius
t / s time from ignition
Sn / m s-1 stretched flame speed
Ss / m s-1 unstretched flame speed
u' / m s-1 r.m.s. turbulent velocity
u'k / m s-1 effective r.m.s. turbulent velocity
ul / m s-1 unstretched laminar burning velocity
un, unr / m s-1 stretched laminar burning velocities
ut / m s-1 turbulent burning velocity
ute / m s-1 turbulent burning velocity (entrainment)
utr / m s-1 turbulent burning velocity (conversion rate to products)
Greek Symbols
sc s-1 laminar stretch rates
/ m laminar flame thickness
/ dimensionless equivalence ratio
m Taylor turbulent length scale
b / kg m-3 burned gas density
u / kg m-3 unburned gas density
/ m2 s-1 kinematic viscosity
3

1. Introduction
Hydrogen is a potential future energy carrier offering CO2 free emissions at the point of
combustion [1]. However, transition to the hydrogen economy is not straightforward and
will require significant investment and technological development in the manufacture,
transport and use of hydrogen. As a first step towards a hydrogen economy the
NATURALHY project (see acknowledgements and http://www.naturalhy.net) is
considering the potential for using the existing natural gas infrastructure as a means to
transport hydrogen (mixed with natural gas) from manufacturing sites to end users. The
mixture could then be used directly, or the hydrogen could be extracted and used in fuel
cells or combusted. This strategy may assist hydrogen production and hydrogen fuelled
application to become established more quickly than might otherwise be the case.
However, existing gas customers would receive a natural gas-hydrogen mixture and this
may have safety implications. Additionally, the gas infrastructure has been designed and
operated on the basis that natural gas is the medium being conveyed. The addition of
hydrogen to the network may also impact on safety.
Hydrogen is significantly more reactive than natural gas (which predominantly
comprises methane) and when premixed with air its laminar burning velocity is
approximately 5.8 times that of methane under stoichiometric conditions [2], with much
wider flammability limits. It has been shown by a number of researchers that the laminar
burning velocities of methane-hydrogen mixtures are greater than those of pure methane,
e.g. [2, 3] and references therein. It is therefore necessary to identify and quantify the
consequences and level of risk resulting from accidental releases (and subsequent ignition
and fire or explosion) of natural gas-hydrogen mixtures during their transmission,
storage, distribution and use. Such events are likely to be turbulent rather than laminar in
nature. One means of assessing hazards is the use of mathematical models capable of
predicting the consequences of accidental fires and explosions. For use in the
formulation and validation of ignition and explosion models in particular, necessary
inputs are measurements of laminar and turbulent burning velocities of natural gas (or
methane)-hydrogen mixtures.
4

The turbulent burning velocity depends on the flow field (typically represented by
the root mean square (r.m.s.) turbulent velocity and an eddy length scale) and the flame
chemistry (the laminar burning velocity, laminar flame thickness and, sometimes, a
Lewis/Markstein number). The temperature and pressure also influence both the flow
field and flame chemistry. Expressions for these effects on ut are often generalised in
compact form, based on correlations using non-dimensional groups. These are
sometimes given in terms of ut/u’ plotted against the Karlovitz stretch factor, K (or the
Damkohler number), with K given by [4]:
l
l
u
uK
' , (1)
where is the Taylor microscale of turbulence and l the laminar flame thickness,
defined here as /ul. Both the Karlovitz and Damkohler numbers relate the chemical and
turbulent eddy lifetimes.
The correlation which contains the largest amount of turbulent burning velocity data
to date is that of Bradley et al. [4], comprising data from over 1600 measurements. The
majority of these data relate to the stoichiometric fuel-air ratio, for a number of fuels, and
atmospheric pressure. However, some of the data drawn from the available literature
were poorly defined, resulting in significant scatter in the experimental data. Since
generating this correlation, the importance of using a consistent definition of the turbulent
burning velocity has become clear. A widely used definition of the turbulent burning
velocity is that derived from the entrainment of fresh unburned gas into the flame, ute [5].
However, Abdel-Gayed et al. [6] identified an alternative burning rate based on the
conversion rate to burned products, utr; this burning velocity parameter relates more
directly to pressure generation. After ignition a flame can only be wrinkled by those
turbulent eddies smaller than itself. Eddies larger than the flame will convect it. As the
flame grows it encompasses eddies of increasing size resulting in a thicker flame brush
(the distance between completely burned products and unburned mixture). The
5
entrainment of fresh mixture occurs at the front of the flame, whilst the production of
burned gas occurs in the middle of the brush, and as utr and ute are associated with two
different surfaces, and flame brush thickness changes with flame propagation, they often
have different values.
The turbulent burning velocities reported here have been derived for expanding
flames ignited in a turbulent field in which the mean velocity of the flow was zero in all
directions, although the instantaneous velocity at any point and in any direction was
continuously changing. The flames were imaged using high speed schlieren
photography. Simultaneous laser sheet and schlieren measurements have been performed
in the same vessel [7] for propane flames where it was demonstrated that the flame brush
thickness continually increased (for all the flames monitored) from ignition till they
passed beyond the windows. These earlier studies suggested that it was possible to
determine the mass rate of burning, related to the turbulent burning velocity, utr, on the
basis of high speed schlieren photography:
dt
dru sch
u
btr
11.1
1, (2)
where b and u are the burned and unburned gas densities, respectively, with the burned
gas density calculated using a chemical equilibrium program [8]. The schlieren derived
mean flame radius in Eq. (2) is rsch, and this equation is an empirically based expression
obtained using a number of propane-air flames at different equivalence ratios, u’ and
pressures. Measurements were performed up to u’/ul = 10.7. More recently,
simultaneous measurements of schlieren imaging and the pressure rise in the vessel have
been performed on a variety of fuels [9] and the turbulent burning velocity, utr, measured
with the two techniques was shown to be similar up to u’/ul = 36. In the present work,
data used for u’/ul in the final correlations do not exceed the latter value.
Schlieren photography was selected as the measurement method as it is a non-
intrusive optical technique and is relatively easily applied. High speed laser sheet Mie
6
scattering imaging provides better definition of the flame surface, but requires the added
complication of the addition of a seed at the appropriate concentration. In addition, at
higher turbulent velocities it can become difficult to obtain a representative slice through
the flame as the flame kernel can convect out of the plane of the sheet. In comparison,
schlieren imaging is an integrated technique making it easier to track the flame progress.
Measurements of the pressure rise are also non-intrusive and provide a direct
measurement of the rate of production of burned gas [5]. However, the pressure rise is
proportional to the enflamed volume and a pressure rise can only be detected with
sufficient accuracy at relatively large flame radii. In the rig used here, the fans were
situated within the vessel and so there was only a short time from a detectable pressure
rise to the flame being disturbed by the fans.
A limited dataset of laminar and turbulent methane-hydrogen flames had previously
been obtained at 0.5 MPa [10]. In this study, flames were ignited at u’ = 2 m s-1 and the
equivalence ratio varied between the fuel-lean to rich ignition limits. The addition of
hydrogen increased the laminar burning velocity, particular at fuel-lean equivalence
ratios. This trend continued to turbulent burning velocities, where it was shown that the
addition of hydrogen had significant impact only for fuel-lean mixtures. This behaviour
was contrasted with that of methanol (no effect of on utr) and iso-octane (turbulent fuel-
rich faster than fuel-lean).
The experimental work reported here generated a database for the burning velocity
of methane-hydrogen mixtures, with pure methane used in place of natural gas in the
experiments due to the variability in the latter’s composition. Work was undertaken at
atmospheric pressure and with an initial temperature of 360 K, using both laminar
mixtures and a range of turbulence velocities. Mixtures with air of pure methane, 90%
CH4-10% H2, 80% CH4-20% H2 and 50% CH4-50% H2, by volume, were considered over
the fuel-lean to rich ignition limits. The various fuels are referred to as CH4, 10% H2,
20% H2 and 50% H2 in the following text. The turbulent burning velocity data gathered
are also presented in compact form, based on generalised correlations using non-
dimensional groups, for subsequent use in explosion models.
7
2. Experimental Work
A 30 litre spherical stainless steel vessel was employed in the experiments. Three pairs
of orthogonal quartz windows of diameter 150 mm provided optical access. Turbulence
was generated in the bomb by four identical eight bladed fans in a symmetrical
tetrahedral configuration. The fans were directly coupled to electric motors with separate
speed controllers. Each fan was separately adjustable between 3.3 and 167 Hz (200 to
10,000 r.p.m.) and controlled by solid state variable frequency converter units. The
individual fan speeds were set and maintained within ±5% of each other to attain the
required turbulence intensity. The mean and r.m.s. velocities, and integral length scale,
have been determined using laser Doppler velocimetry. Previous workers [11] found a
central region of reasonably uniform isotropic turbulence in this vessel corresponding to
the region of optical access (150 mm). Here the r.m.s. turbulence velocity, u’, was found
to be represented by
u’ = 0.00119 fs, (3)
where fs is the fan speed. This correlation was found valid for all operating pressures,
temperatures and mixture viscosities. The integral length scale L was found by two-point
correlation to be 20 mm and was independent of all operating variables [11].
Mixture temperature was measured using a K-type thermocouple, situated inside the
chamber. The entire vessel was preheated by an internal 2 kW heater. A piezoresistive
pressure transducer was employed to measure the pressure during mixture preparation.
This transducer was situated outside the vessel and was isolated just prior to ignition.
Mixtures were prepared in the vessel, with gas concentrations set on the basis of
partial pressures. After an experiment, the vessel was flushed with compressed air and
then evacuated. Dry cylinder air was used in preparation of the combustible mixture.
Fuel was supplied from high pressure cylinders containing set premixed methane-
8
hydrogen mixtures (supplied by BOC). The fans were run, at low speed, during charge
preparation to ensure full mixing and to maintain uniform heating of the vessel from the
heater. In turbulent flame experiments the fan speed was then adjusted to give the
desired turbulence level, whilst in laminar flame experiments, following mixture
preparation, the fans were switched off for at least 60 seconds before ignition; this
allowed the mixture to become quiescent. An initial charge temperature of 360 K was
adopted in all experiments; otherwise because of kinetic heating at high fan speeds, the
vessel would have required cooling for burning mixtures at room temperature. The
estimated precision in the equivalence ratio setting was ±0.04 in the value of , this being
a function of temperature variation during vessel filling and the accuracy of the pressure
transducers.
Ignition was initiated using a purpose built stainless steel/ceramic sparkplug, with a
gap of 1 mm, mounted in the centre of the vessel. A Lucas 12 V transistorised
automotive ignition coil system was connected to the spark electrode assembly. The
average spark energy was measured to be 23 mJ [12]. For the extremes of fuel-rich
conditions close to mixture flammability limits ( > 1.2 in the case of CH4), a higher
powered capacitance discharge ignition system (~300mJ) was used, as described in [13].
However, all burning velocities were measured at sufficiently large radii that spark
effects could be neglected [14].
The flames were imaged using schlieren photography, employing a 20 W tungsten
element lamp, 1 m focal length lenses and a pinhole. The schlieren images were captured
using a Photosonics Phantom 9 camera framing at 2000 f.p.s. and 512×512 pixels for
laminar flames, and up to 9000 fps and 386×386 pixels for turbulent flames. For u’ = 8
and 10 m s-1 a resolution of 192×192 and framing rate of 20,000 fps was adopted. Shown
in Fig. 1 are typical successive images of a developing turbulent flame observed in the
study. Flames moved outwards from the spark consuming unburned gases. The resulting
images were either hand traced or processed using Adobe PhotoShop 6.0. By subtracting
the background (pre-explosion) image from the subsequent images and applying a
threshold, a binary image was produced for each frame where the burned area was white
9

and the remainder black. The image of the spark plug was manually removed. Flame
areas were then measured by counting the number of pixels behind the flame front.
Flame radii were computed as those of a circle of area equal to that of the imaged flame.
The processing steps are illustrated in Fig. 2. Shown in Fig. 2 (c) is a typical image
histogram after background subtraction for the flame given in Figs. 2 (a) and (b). The
captured images were 8 bit, so grey levels from 0 (black, background) to 255 (white,
flame) were processed. The threshold value was selected on the basis of visual
inspection. If too low a value was selected, noise was clearly visible (a splatter of white
pixels ahead of the flame), and as the value was increased, flame features were lost on the
thresholded image. A typical range of possible threshold values is indicated on Fig. 2(c),
the actual value chosen was around 14. Flame radius plotted against time from ignition is
given in Fig. 2(d) for different threshold values. The flame radius continually increased
with time from ignition for all the flames studied (unless the flame quenched, although
this was only observed at small radii). The range of threshold values used here had little
impact on the flame radius derived. The turbulent burning velocity, utr, is shown against
time from ignition for different threshold values in Fig. 2(e). The turbulent burning
velocity continually increased with time from ignition, with no levelling off in the
burning velocity with time (or flame radius) observed in the flames studied. The
selection of threshold value is shown not to have a strong impact on the burning velocity
derived, except at the initial stages where the flames were small and the velocity sensitive
to small changes in the processing method. This is demonstrated by the standard
deviation in the burning velocity for the range of threshold values chosen, with the
standard deviation high at small times but reducing as the time from ignition (and hence
the flame radius) increased.
Turbulent flames were studied at stoichiometric conditions for all fuel mixtures at
values of u’ of 0.5, 1, 2, 4, 6, 8 and 10 m s-1. The effect of equivalence ratio was studied
between values set by the experimental ignition limits at both u’ = 2 and 6 m s-1. For
each laminar condition, two repeat tests were performed; for turbulent cases five tests
10
were normally completed at each condition, although ten experiments were required for
u’ > 6 m s-1.
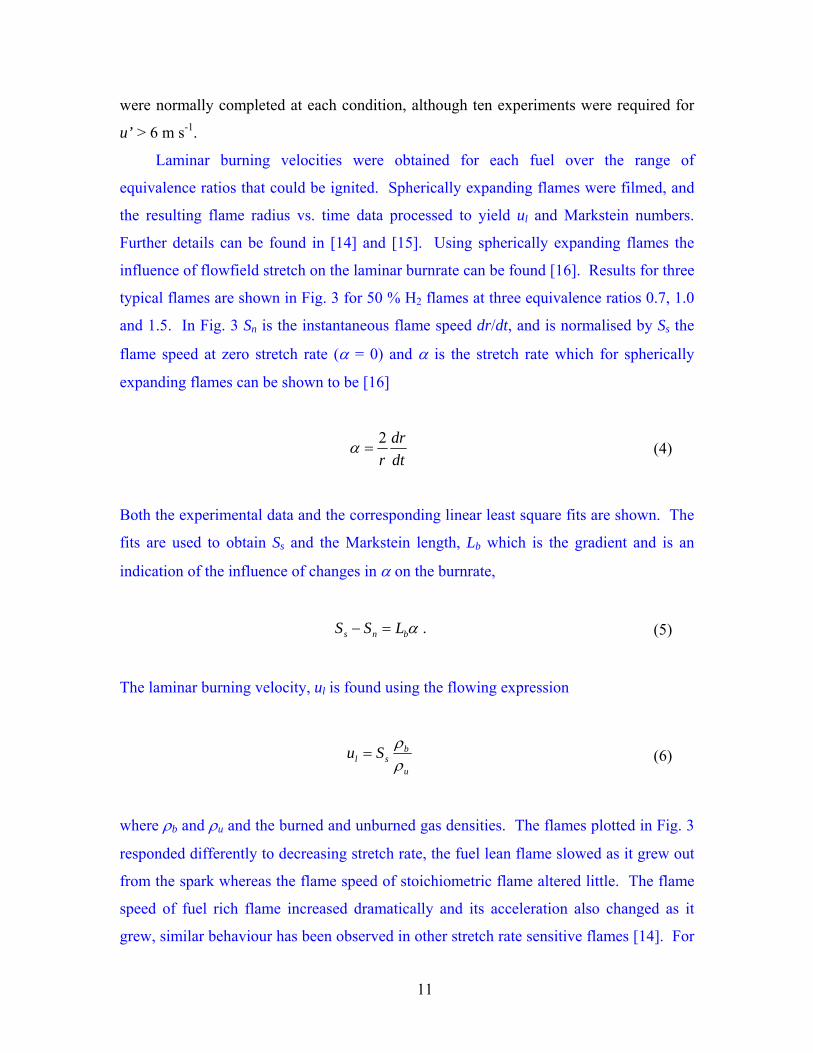
Laminar burning velocities were obtained for each fuel over the range of
equivalence ratios that could be ignited. Spherically expanding flames were filmed, and
the resulting flame radius vs. time data processed to yield ul and Markstein numbers.
Further details can be found in [14] and [15]. Using spherically expanding flames the
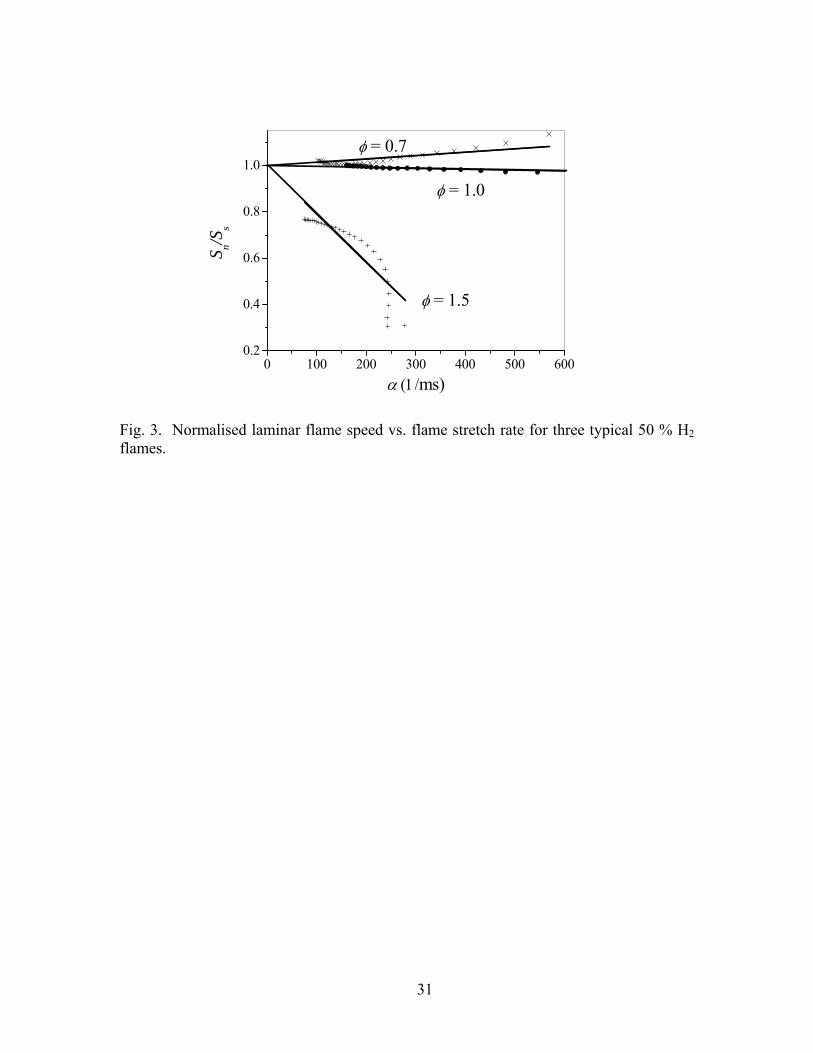
influence of flowfield stretch on the laminar burnrate can be found [16]. Results for three
typical flames are shown in Fig. 3 for 50 % H2 flames at three equivalence ratios 0.7, 1.0
and 1.5. In Fig. 3 Sn is the instantaneous flame speed dr/dt, and is normalised by Ss the
flame speed at zero stretch rate ( = 0) and is the stretch rate which for spherically
expanding flames can be shown to be [16]
dt
dr
r
2 (4)
Both the experimental data and the corresponding linear least square fits are shown. The
fits are used to obtain Ss and the Markstein length, Lb which is the gradient and is an
indication of the influence of changes in on the burnrate,
bns LSS . (5)
The laminar burning velocity, ul is found using the flowing expression
u
bsl Su
(6)
where b and u and the burned and unburned gas densities. The flames plotted in Fig. 3
responded differently to decreasing stretch rate, the fuel lean flame slowed as it grew out
from the spark whereas the flame speed of stoichiometric flame altered little. The flame
speed of fuel rich flame increased dramatically and its acceleration also changed as it
grew, similar behaviour has been observed in other stretch rate sensitive flames [14]. For
11
the rich equivalence ratio the assumed linear relationship between flame speed and
changes in the stretch rate, from Eq. 5, is not good, but to date no better expression exists,
as the changes in flame speed at = 1.5 might be due to spark effects [15]. From these
results it can be seen that the Markstein numbers given here are at best an indication of
the behaviour of flame speed with stretch rate and their absolute values should be treated
with circumspect.
3. Results and Discussion
At large radii the schlieren image generated a sharp outside edge to the flames that could
be relatively easily detected, as shown in Figs. 1 and 2. In the early stages of flame
growth and at higher u’ the edge could be diffuse in appearance. In such cases it is
thought that high local stretch rate resulted in a thickened reaction zone; reducing the
schlieren signal, which was proportional to the local temperature gradient. At high u’,
portions of the flame apparently disappeared (quenched), although they could then
reappear at a later time.
Previous measurements in this vessel have shown that the turbulent burning
velocity of the flame continuously increased with time (and radius) throughout the
measurement period [9]. This was associated with turbulent flame development. A
flame can only be wrinkled by those turbulent eddies smaller than itself, with those
eddies much larger than the flame bodily convecting it. On average, the proportion of
turbulent eddies wrinkling the flame can be determined from the power spectral density
of the turbulence field [6]. As flames grow, they are wrinkled by an increasing
proportion of the turbulence spectrum and hence the “effective” u’ (u’k) increases. The
relatively large integral length scale of the vessel, compared with the dimension (≈140
mm on average) available for monitoring turbulent flames through the windows, resulted
in increasingly large eddies wrinkling the flames throughout their observed growth
period.
12
In order to compare data from different turbulent expanding flames, utr has
previously been found at a reference point where flames attain a mean radius of 30 mm
[9, 10], i.e. 1.5 times the integral length scale. Choice of a smaller reference radius might
result in flames still significantly influenced by the spark and subject to a small
proportion of the turbulent velocity field. At high u’, flames were sometimes convected
away from the spark plug, thus only relatively modest flame radii could be measured
before part of the kernel perimeter ceased to be visible with the result that only a limited
number of measurements were obtained at high fan speeds. Selection of a mean flame
radius of 30 mm was considered a reasonable compromise between these two
experimental factors.
Shown in Fig. 4 are turbulent burning velocities of stoichiometric flames at a
diameter of 60 mm plotted against u’. Only two of the fuels tested, CH4 and 50% H2, are
shown for clarity. The 50 % H2 flames propagated faster than the CH4 flames, as
expected, since the former contains faster burning hydrogen. For both fuels utr increased
with increasing u’ initially, but at high u’ increasing turbulence did not necessarily result
in a commensurate increase in burning velocity; with the consequent “bend over” in the
curve fits given in the figure [6]. In the case of CH4, no increase in utr occurred for u’ > 8
m s-1, whilst the utr for 50% H2 continued to increase above u’ = 8 m s-1, but at a reduced
rate.
There was considerable shot-to-shot variation in the measurements. This is the
result of the random nature of turbulence. At ignition and as each flame grew it would
have encountered turbulent eddies of varying size at different times and positions; this
being particularly the case as it has already been noted that these flames were still
“developing” and hence experienced only part of the total spectrum of turbulent scales at
any given time. As a result, each flame was convected, and its local burn rate modified
by local changes in strain rate differently, in each shot. Theoretically, when a flame
becomes sufficiently large it can experience all eddies of all sizes and the burn rate will
achieve a characteristic fully developed value [6]. At the reference radius employed in
the present study, the flames would only have encountered a portion of the available
13

turbulent spectrum and so the shot-to-shot scatter observed was implicit in the
measurements.
The effect of increasing the hydrogen concentration in the mixture at each u’ tested
is shown in Fig. 5 for = 1. At all values of u’ the burning velocity increased with
hydrogen content. With the addition of 10 and 20% H2 the rises were modest and within
the shot-to-shot scatter due to the turbulence-flame interaction. By 50% H2 significant
increases in utr were observed. This was particularly evident at u’ = 8 m s-1 where
turbulence effects might be expected to dominate over chemical (fuel) effects.
The influence of equivalence ratio at u’ = 2 and 6 m s-1 is shown in Figs.6 and 7.
The symbols represent average values of the 5 or 10 shots performed at each condition
(presented in this way for clarity). The average standard deviation in the results (from
shot-to-shot variation) is shown by the error bars, which apply over the whole range of .
The curves shown are second-order least squares fits to all measured utr data for a
particular fuel. For methane, 10% H2 and 20% H2 the influence of hydrogen addition
proved small at u’ = 2 m s-1. The burning velocity for all three fuels peaked at
equivalence ratios slightly lean of stoichiometric. The lean ignition limit was also
extended from 0.6 to 0.5 for 20% H2, although there was no extension of the rich limit.
The values of utr for 50% H2 mixtures were higher than those for the three other fuels for
all values of equivalence ratio, and the peak burning velocity moved slightly fuel-rich of
= 1. At u’ = 6 m s-1, shown in Fig. 7, the differences between the various fuels were
more apparent. Again, methane and 10% H2 had similar burning velocities, but the 20%
H2 was clearly faster at fuel-lean , with peak utr occurring at about = 0.8. The 50% H2
case again yielded faster burning at all values. The peak burning velocities occurred
slightly lean of = 1 in all cases.
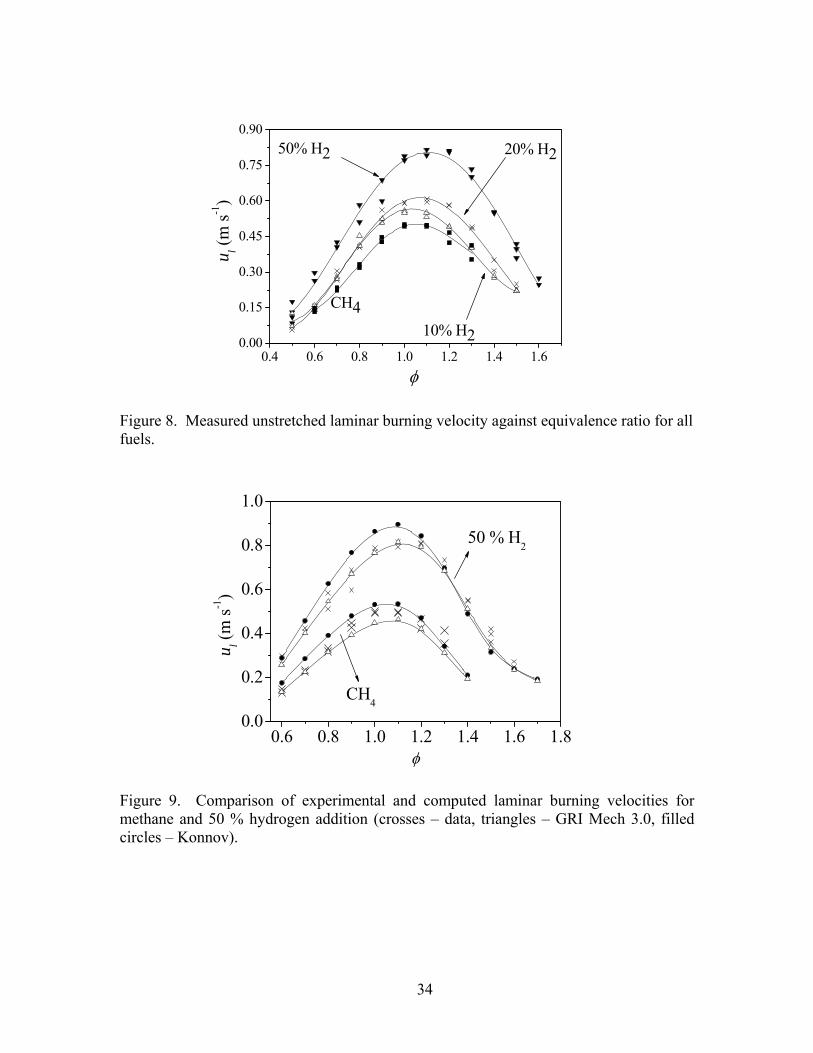
Corresponding experimentally determined laminar burning velocities for all the
fuels tested are shown in Fig. 8. The addition of hydrogen generally increased ul. Pure
methane flames could not be ignited beyond = 1.2, however, the ignition limit was
extended to = 1.4 with the addition of only 10% H2, and to = 1.6 for 50 % H2. The
14
addition of hydrogen did not have such a dramatic effect on the lean ignition limit;
although the limit decreased from = 0.6 to = 0.5 in moving from pure methane to 10%
H2, it did not change further as more hydrogen was added. There was a noticeable shift
in the peak burning velocity to richer with increasing hydrogen content. However, with
50% H2 addition the peak (at about = 1.15) still occurred significantly leaner than that
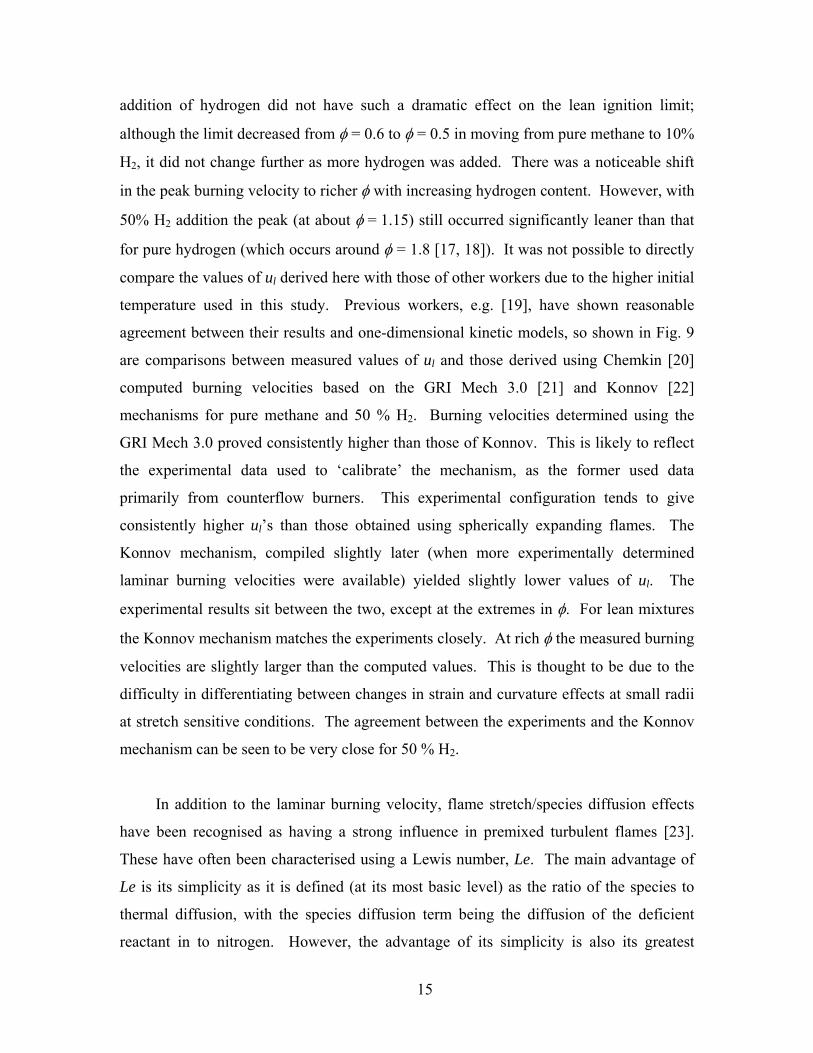
for pure hydrogen (which occurs around = 1.8 [17, 18]). It was not possible to directly
compare the values of ul derived here with those of other workers due to the higher initial
temperature used in this study. Previous workers, e.g. [19], have shown reasonable
agreement between their results and one-dimensional kinetic models, so shown in Fig. 9
are comparisons between measured values of ul and those derived using Chemkin [20]
computed burning velocities based on the GRI Mech 3.0 [21] and Konnov [22]
mechanisms for pure methane and 50 % H2. Burning velocities determined using the
GRI Mech 3.0 proved consistently higher than those of Konnov. This is likely to reflect
the experimental data used to ‘calibrate’ the mechanism, as the former used data
primarily from counterflow burners. This experimental configuration tends to give
consistently higher ul’s than those obtained using spherically expanding flames. The
Konnov mechanism, compiled slightly later (when more experimentally determined
laminar burning velocities were available) yielded slightly lower values of ul. The
experimental results sit between the two, except at the extremes in . For lean mixtures
the Konnov mechanism matches the experiments closely. At rich the measured burning
velocities are slightly larger than the computed values. This is thought to be due to the
difficulty in differentiating between changes in strain and curvature effects at small radii
at stretch sensitive conditions. The agreement between the experiments and the Konnov
mechanism can be seen to be very close for 50 % H2.
In addition to the laminar burning velocity, flame stretch/species diffusion effects
have been recognised as having a strong influence in premixed turbulent flames [23].
These have often been characterised using a Lewis number, Le. The main advantage of
Le is its simplicity as it is defined (at its most basic level) as the ratio of the species to
thermal diffusion, with the species diffusion term being the diffusion of the deficient
reactant in to nitrogen. However, the advantage of its simplicity is also its greatest
15

problem. There is a discontinuity at = 1 where the deficient reactant changes from the
fuel to oxygen, and there are difficulties in its definition when dealing with multi-
component fuels. Although a combined hydrogen/methane Lewis number has been
calculated Jackson et al. [24] it has not been widely adopted, principally because such
global Lewis numbers neglect the diffusion of radicals through the flame (e.g. H, OH and
O) which are important in initiating combustion by chain branching reactions [25].
The influence of changes in the stretch rate can also be expressed as a Markstein
number which can be measured in counterflow or spherically expanding flames [16].
The value of the Markstein number has been shown to depend very strongly on its
definition and measurement. In common with the burning velocity, it varies if measured
with reference to the consumption of unburned or burned gas [26]. In addition, it has
been shown that the effects of flame curvature and the rate of strain in the unburned
mixture should be treated separately [14]. Combining these concepts leads to two
equations involving four Markstein lengths that are required to characterize the effect of
changes of stretch rate on the laminar burning rate:
ssccnl
ssrccrnrl
LLuu
LLuu
(7)
(8)
Here, unr is the burning velocity defined using the rate of production of burned gases, and
un is defined using the rate of consumption of unburned mixture, and these quantities are
different as a result of the finite flame thickness. Due to the different definitions of the
burning velocity the values of the various Markstein lengths can be very different in
magnitude and sign. As a result, it is at present difficult to compare values from different
measurement techniques. In spherically expanding flames the magnitude of the rate of
change of aerodynamic strain has been found to be significantly larger (typically 5 times)
than that due to curvature, and aerodynamic strain is also thought to dominate in a
turbulent flame [5]. Therefore the Markstein number (Masr) which quantifies the
influence of changes in the aerodynamic strain rate on the burning velocity, defined based
on the production of burned gas, is used here as an indicator of the likely effect of
16

changes in the stretch rate that would be encountered in a turbulent flow [5]. This
definition also complements the definition of turbulent burning velocity employed. It
should be noted that to date there is not an accepted definition of Markstein number, Ma,
for use in premixed turbulent modelling, other definitions of Ma may be quantitatively
different but the trends with equivalence ratio and fuel type will be similar.
Experimentally determined Markstein numbers (Masr) plotted against are shown in
Fig. 10. When measuring the Markstein number it was assumed that the influence of
stretch changed the burn rate linearly, and over the range of stretch rates (flame radii) for
which measurements were performed there were no other influences on the burn rate
[14]. In order to meet these requirements the influence of stretch was determined over
relatively large flame radii (typically 15-55 mm) to avoid spark and flame thickness
effects. Even so, unaccountable oscillations and changes in flame speed have often been
noted in spherically expanding flames [5, 14]. Problems with the determination of
Markstein numbers became particularly severe for > 1.1 where flame curvature (flame
thickness) may also be significant [14]. As a result the uncertainty in measurements of
Masr can be large and dependent on the equivalence ratio. For these fuels, at = 0.7 and
1.0 the estimated uncertainty was ± 0.5, however at = 1.3 the uncertainty increased to ±
4.5. Despite this, from Fig. 10, it can be seen that for all the fuels Masr increased with
equivalence ratio. At each value of , methane had the highest Masr, with a progressive
decrease as hydrogen was added to the fuel.
In Fig. 11 values of utr are shown normalised by the corresponding value of ul for
increasing hydrogen concentration at = 1. The best fit straight lines are effectively
horizontal for all fuels; as a result, it may be concluded that for = 1 (at any particular
u’) the increase in utr appears to be primarily a result of the increase in the laminar
burning velocity due to hydrogen addition. To examine the influence of equivalence
ratio, utr/ul is plotted for both u’ = 2 and 6 m s-1 in Fig. 12. The data for both u’ have
similar trends, constant utr/ul for fuel-rich , with utr/ul increasing as the mixtures became
more fuel-lean. No differences could be distinguished between the four fuels. Similar
fits have been given previously for a number of mixtures at 0.5 MPa [9,10] where it was
concluded that the variation of utr/ul with was related to that of the Markstein number.
17
In experiments on light hydrocarbon-air mixtures (e.g. methane) Masr increased as the
mixture moved from fuel-lean to rich, whereas utr/ul decreased, but for iso-octane-air
mixtures Masr decreased lean to rich, whilst utr/ul increased. The results here at 0.1 MPa
are the similar as those at 0.5 MPa for methane and methane/hydrogen mixtures [10]. It
follows that differences would be expected between the fuels in this study as the 50% H2
mixtures have consistently lower measured values of Masr compared to the other fuels,
this was not observed. This could be the due the uncertainty in the determination of the
Markstein number, both in inaccuracies in its measurement and its definition (Masr might
not be fully representative). A direct numerical simulation of hydrogen addition to
methane at = 0.52 has been performed [27]. Three influences of equal significance
were found to account for the increase in turbulent burning velocity with hydrogen
addition: (i) increased laminar burning velocity, (ii) larger flame surface area, and (iii)
turbulent stretch effects on the local flame structure. Influences (ii) and (iii) were
associated with thermal diffusive effects of enhanced H2 levels in parts of the flame
convex with respect to the reactants. A number of studies have concluded that hydrogen
addition not only increases the burning velocity but also reduces the sensitivity of a flame
to aerodynamic stretch [23, 28, 29]. The conclusions of these authors are confirmed here.
A number of researchers, e.g. [30, 31] have attempted to correlate turbulent burning
velocities with turbulence parameters, typically using an expression of the form
dtr KBuu ' , (9)
where B and d are constants. In this way experimental data can be presented in a
generalised form. Despite the apparent simplicity of Eq. 9 there are a number of
problems when attempting to compare data from different sources. These issues stem
from the fact that both u’ and utr are open to interpretation. As the flames are developing
they are not subject to the entire turbulent spectrum and this should be accounted for
when comparing results from different experiments. Abdel-Gayed et al. [6] derived a
non-dimensional turbulence power spectrum density function in terms of dimensionless
frequency on the basis of laser Doppler measurements of isotropic turbulence in a fan
stirred bomb. They assumed that the frequency band affecting flame development
18
extended from the highest frequency to a threshold frequency given by the reciprocal of
the time elapsed from ignition. As a result, these authors developed an expression that
allows the full effects of the turbulence spectrum to be accounted for in the determination
of turbulent burning velocities, thereby effectively producing steady state burning
velocity values. Furthermore, it has been shown that the magnitude of utr is sensitive to
its derivation, with Bradley et al. [7] demonstrating a large variation in the turbulent
burning velocity by varying the reference radius and its definition.
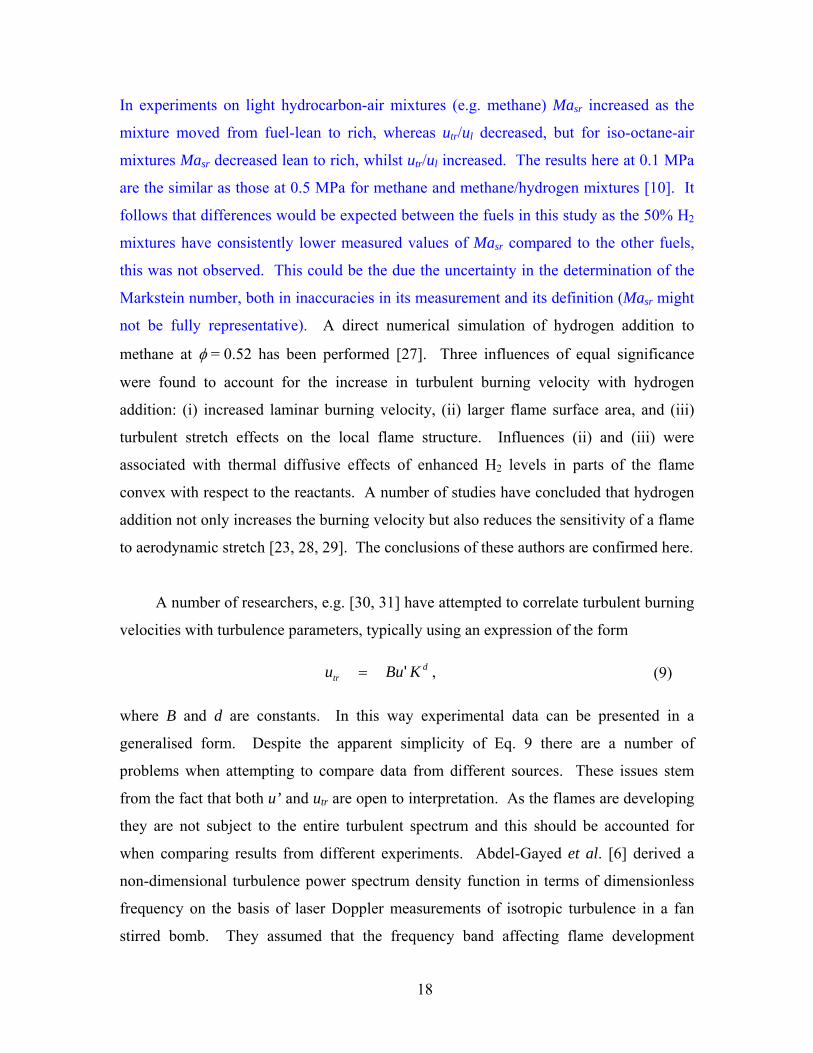
The data for the stoichiometric mixtures of the current study are shown in Fig. 13
for each fuel. Empirical expressions for the turbulent burning velocity at = 1.0 were
then found; this equivalence ratio is often used in explosion modelling as it is assumed it
roughly corresponds to the maximum burning velocity mixture which poses the greatest
risk. Despite some shift in the peak turbulent burning velocity, those at = 1 are close to
the maximum for the range of u’ and fuels tested here. Despite some scatter, the data
appear to be well represented by an expression of the form of Eq. 9; as shown by the
linear (log) fits. The residuals associated with the fits are given in the figure. At low
values of K, utr can be seen to increase as hydrogen is added. However, as the r.m.s.
turbulent velocity and value of K increases the fits for pure methane, 10% H2 and 20% H2
all yield similar values of utr/u’. The 50% H2 fuel can be seen to exhibit higher utr/u’
values over the whole range of K. This is likely to be associated with the lower
sensitivity to variations in stretch rate (lower Lewis/Markstein number) of 50% H2.
Linear trend lines fitted to the modified data demonstrated little difference between the
pure methane, 10% H2 and 20% H2 mixtures, although the 50% H2 fuel had consistently
greater values of utr. The correlation derived for the first three fuels is:
490460 .'. Kuu ktr , (10)
and for the 50% H2 mixture:
470670 .'. Kuu ktr . (11)
In developing these expressions, the Karlovitz stretch factors were determined using Eq.
1. The laminar flame thickness, l, was found using v/ul, an under-estimation of the real
19
laminar flame thickness, but easily calculable and a good qualitative representation. The
Taylor length scale, , was found using
'u
A
L
2
(12)
where A≈15 [32]. The effective r.m.s. turbulent velocity u’k was found from the
integrated power spectral density given in Abdel-Gayed et al. [6]. The ratio u’k/u’
increased from around 0.25 at u’ = 0.5 m s-1 to 0.5 for u’ = 10 m s-1, therefore, the flames
were not fully developed. Equations 10 and 11 are only valid over the experimental
range, 0.005 < K < 1. At low turbulence levels the burning velocity of the flame must
approach the laminar burning velocity, although this form of turbulent burning velocity
correlation does not predict this.
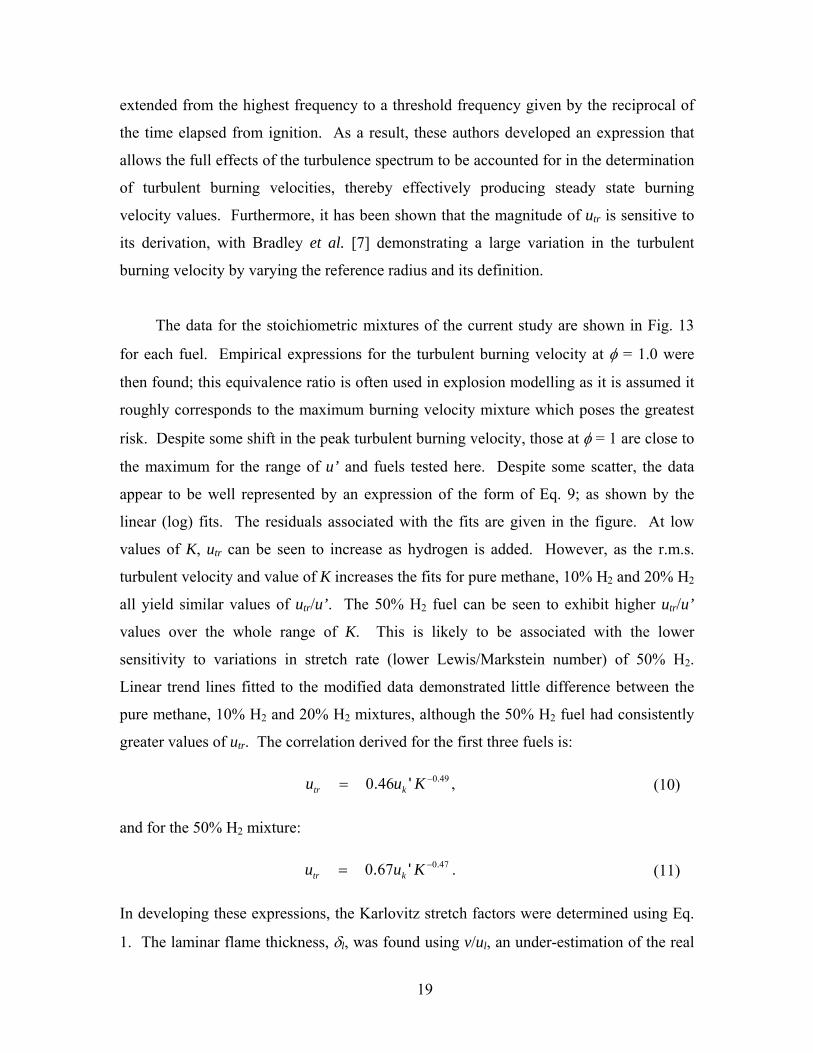
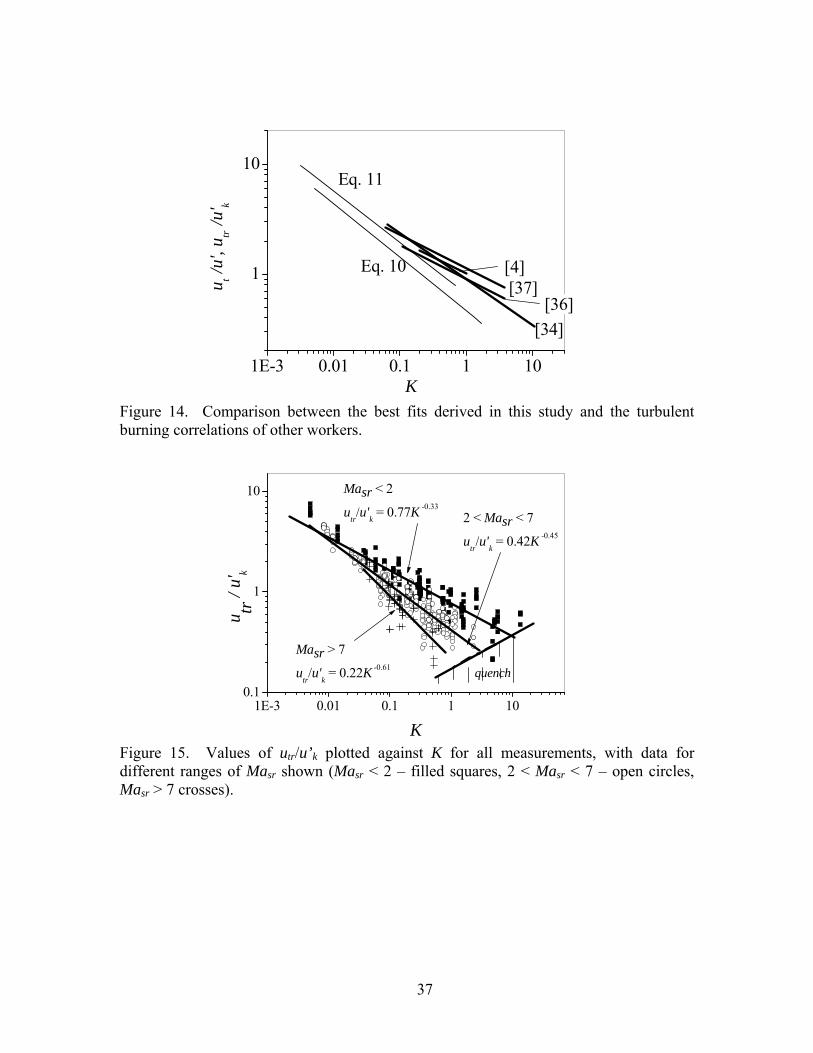
Comparison of turbulent burning velocities established in differing experiments is
non-trivial, especially if quantitative agreement is required. As already noted, there are
differences in the definition of the burning velocity adopted by different workers and
difficulties arise in determining the extent of flame development in any given experiment.
Turbulent burning velocity datasets are usually correlated in some manner. However, the
correlation expressions can take a number of different forms which are not always
directly comparable. A typical example is that the Damkholer number (Da = ulL/u’l) is
often substituted for the Karlovitz stretch factor in Eq. 9 [33, 34]. Whilst these numbers
are very similar, the differing dependence of L and on u’ results in an expression
relating K and Da that depends on the experimental parameters u’ and ul. In order to
compare results of a number of studies in a consistent manner, Lipatnikov and Chomiak
[35] collected and reprocessed a number of databases; presenting the data using both the
Damkohler and Karlovitz numbers. Karlovitz stretch factor versus ut/ul plots are
presented for a number of existing turbulent burning velocity datasets in [35], and these
are compared with Eqs. 10 and 11 in Fig. 14. Comparison is made with:
(a) The Moscow database [36], with measurements performed in a fan stirred bomb. The
line represents a reduced dataset selected by Lipatnikov and Chomiak [35], limited to
moderate turbulence and Le ≈ 1. Here u’ was used.
20

(b) The Leeds database [4], which consists of data obtained using numerous different
measurement techniques and a wide range of conditions. The following expression has
been presented as a reasonably representation of the dataset:
30880 .'. KLeuu kt . (13)
for the range 0.01 < KLe < 0.63. The line plotted in Fig. 14 is for Le =1, with values of K
found using the expressions given in [4] which differ to those derived using Eqs. 1 and 13
due to the use of a differing constant.
(c) The Kido et al. database [37], with measurements performed in a fan stirred bomb.
Again, Lipatnikov and Chomiak [35] provided a fit for a reduced database consisting of
Le ≈ 1 flames and using u’.
(d) The Shy et al. [34] data, with measurements performed in a cruciform burner, with
the fit again from [35] again using u’.
The correlations from previous workers are generally grouped together, indicating
broad agreement between experimental databases. The absolute values of ut/u’ will
depend on the definition of ut, and so variations in ut/u’ are to be expected. Generally the
gradients of the lines are similar, typically values being of the order of ut ~ K-0.3, although
there is one exception, with the fit through the measurements of Shy et al. [34] having a
steeper gradient. The values of utr/uk’ in Eqs. 10 and 11 are lower than those of the other
studies, and the gradients are steeper than most of those of other workers. This is likely
to be associated with the definition of both utr and uk’ used herein, as the magnitude of
the turbulent burning velocity is particularly sensitive to its definition. It has been shown
that the value of the turbulent burning can vary by a factor of as much as 5-6 with the
definition of the flame radius employed, and the nature (engulfment or mass turbulent
burning) of the burning velocity assumed [7].
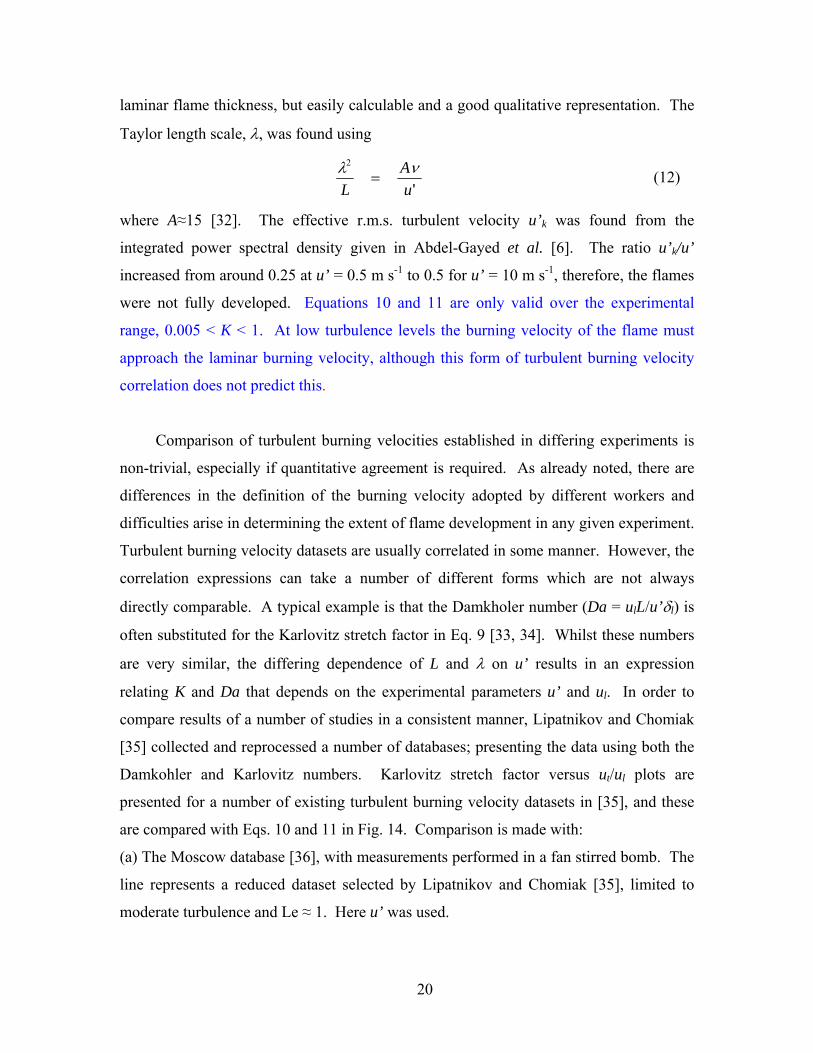
The greater influence of K (resulting in steeper gradients in Fig. 14), and the
relatively modest values of K achieved in these measurements should be examined. To
obtain high values of K it is necessary to reduce the laminar burning velocity, and this is
typically achieved by experimenting with fuel-lean flames. Therefore, results at higher K
21

can be obtained by using non-stoichiometric data. However, these flames have very
different thermo-diffusive properties thus lean flames with lower Markstein numbers had
higher values of the ratio utr/uk’. It was therefore not felt appropriate to correlate the
dataset as a whole but for ranges of Markstein number. Shown in Fig. 15 are all the data
obtained in this study, separated into the three ranges of Masr indicated in Table 1.
Ranges of Masr were used due to the aforementioned uncertainties in its measurement.
Differences in behaviour for the various Markstein number ranges and utr/uk’ can be seen,
with those flames more sensitive to stretch (high Masr) burning slower under turbulent
conditions, especially at higher values of K. Also shown in Fig. 15 is the experimentally
determined point of flame quench which is also dependent on Masr and K [38]:
4344 81 .. srMaK (14)
This relationship was empirically derived in the same vessel and indicates a 20%
probability of a flame kernel continuing to develop. Although unlikely, it is possible for
flames to burn in the indicated quench region, and indeed (for the current study) a limited
number of data points can be seen in this region. From Fig. 15, it appears the quench
limit was approached for all Markstein number ranges relevant to the current data.
The usefulness of the generalised form of the data presented in Fig. 15 can be tested
by checking that it can predict the earlier experimental observations. It is well
established that the form of Eq. 9 predicts the turndown in utr with u’ [6]. Also, flames
exhibiting higher laminar burning velocities will have lower values of K (for constant u’),
hence the turbulent burning velocity will be higher. In the turbulent burning velocity
versus equivalence ratio data (presented in Figs. 6 and 7), 20% H2 was only significantly
faster than methane and 10% H2 at u’ = 6 m s-1. This is a consequence of the divergence
of the Masr < 2 and 2 < Masr < 7 data as K increases, shown in Fig. 15. At low values of
K (low u’), there are few observable differences between CH4, 10% H2 and 20% H2.
Differences do, however, appear at higher u’, corresponding to where the fits diverge. In
Fig. 11, the ratio utr/ul was found to be approximately uniform for each fuel as u’ was
increased at = 1. As the concentration of hydrogen was increased, values of both Masr
and K therefore decreased. At small K, Masr has little or no influence on utr. This may be
22

why no increase in utr/ul was observed as the hydrogen content was increased. Lastly, in
Fig. 12, it was shown that the ratio utr/ul increased rapidly at fuel-lean equivalence ratios,
this being where Masr is lowest and K is highest. Therefore the influence of Masr on K is
at its highest for such equivalence ratios. No such dramatic effect was observed at fuel-
rich equivalence ratios where high values of Masr and K occur, and from Fig. 15 reduced
turbulent burning velocities might be expected. However, flames quench at much lower
K (there is an order of magnitude difference between the ranges Masr < 2 and Masr > 7),
and slow burning flames may not survive to a 30 mm radius. As utr/u’ decreases the
dependence of utr on u’ is decreasing, hence the propagation rate of Masr > 7 flames will
(counter intuitively) be little influenced by increasingly turbulence levels (this is point at
which bend over occurs [33]) although in practice these flames were observed to be
heavily impacted by the turbulence with the flames suffering from localised quenching
and often convected around the vessel in their early stages. This could lead to significant
problems in practical combustion devices.
The findings resulting from this work remain contradictory. The addition of
hydrogen to methane results in a more reactive faster burning fuel, this has been
demonstrated by a number of previous studies ([2],[3], [19]. [24] to reference a few) and
is confirmed here in both laminar and turbulent conditions. However, it is not clear how
significant flowfield stretch effects are on turbulent premixed flames, there is evidence
here that they can be neglected but also some plots show that they may be significant.
Part of the problem stems from the difficulties of defining and measuring the influence of
changes in the stretch rate in laminar flames (given as a Markstein number), this data
should be treated with circumspection and remains a qualitative measure. It can be said
that for the mixtures used here lean flames were less sensitive to changes in the stretch
rate than rich ones, and this can be demonstrated to have an influence in turbulent flames,
as shown in Fig. 12. The addition of hydrogen reduced the Markstein number but this did
not seem to have much influence in turbulent flames for = 1.0 (see Fig. 11) where the
increase in ul with hydrogen appeared to be primary reason of increases in utr. Turbulent
burning velocity correlations (of K vs. utr/u’k) were used in an attempt to summarise the
whole dataset and compare these measurements with those of other workers. However
differences in the definitions of the turbulent burning velocity and the treatment of
23
turbulent flame development mean that it is difficult to draw concrete conclusions
between studies. The measurements obtained here were qualitatively similar to those of
other workers. For stoichiometric flames the 50 % H2 could not be fitted with the other
fuels and this is attributed to differences in the response of the flame to changes in the
stretch rate. However a much more dramatic influence of Markstein number was again
shown when measurements over the whole range of were included. The fuel lean
flames were much less sensitive to increasing stretch rate, given by K, than the fuel rich
flames, with the differences between the flames being most apparent at high values of K.
4. Conclusions
Methane and methane-hydrogen (10%, 20% and 50% hydrogen by volume) mixtures
have been ignited in a fan stirred bomb in turbulence and the resultant turbulent burning
velocity, utr, measured at a flame radius of 1.5 integral length scales of turbulence for a
range of r.m.s. turbulent velocities. Corresponding laminar burning velocities have also
been measured for the same mixtures. The main conclusions of this work are:
The addition of 10% hydrogen did not result in a significant increase in utr. For 20%
hydrogen there was a clear increase in utr for lean equivalence ratios, but not for rich.
In the case of the addition of 50% hydrogen there was an increase in utr for all .
Both the fuel-lean and rich ignition limits were extended with the addition of
hydrogen.
The addition of hydrogen resulted in an increase in the measured laminar burning
velocity, ul, and a decrease in the Markstein number, Masr.
For stoichiometric mixtures the ratio utr/ul did not change with the addition of
hydrogen for a constant u’.
The ratio utr/ul increased as the mixtures became leaner for constant u’. For the
leanest mixtures utr/ul could be 3-4 times that observed for the stoichiometric case.
This was the result of lean flames being less sensitive to stretch rate, as exhibited in
lower values of Masr.
Non-dimensional plots (utr/ul against K, the Karlovitz stretch factor) showed that the
addition of 50% hydrogen results in faster burning than for the other fuels for all
24
The influence of flame thermo-diffusive effects on the turbulent burning velocity
increased as K is increased.
Non-dimensional correlations of turbulent burning velocity data, corrected to fully
developed turbulent flow conditions, have been produced for use in mathematical
models for the prediction of explosion overpressures.
Acknowledgements
The authors gratefully acknowledge financial support for the work described from the
EC’s 6th Framework Programme (Integrated Project NATURALHY – SES6/CT/2004/
50266).
25
References
1. A. Züttel, A. Borgschulte, L. Schlapbach (Eds.), Hydrogen as a Future Energy
Carrier, Wiley-VCH, Weinheim. 2008.
2. Z. Huang, Y. Zhang, K. Zeng, B. Liu, Q. Wang, D. Jiang, Combust. Flame 146
(2006) 302-311.
3. V. Di Sarli, A. Di Benedetto, Int. J. Hydrogen Energy 32 (2007) 637-646.
4. D. Bradley, A.K.C. Lau, M. Lawes, Phil. Trans. R. Soc. London 338 (1992) 359-
387.
5. L. Gillespie, M. Lawes, C.G.W. Sheppard, R. Woolley, Aspects of Laminar and
Turbulent Burning Velocity Relevant to SI Engines, SAE Paper 010192 (2000).
6. R.G. Abdel-Gayed, D. Bradley, M. Lawes, Proc. R. Soc. Lond. A 414 (1987) 389-
413.
7. D. Bradley, M.Z. Haq, R.A. Hicks, T. Kitagawa, M. Lawes, C.G.W. Sheppard, R.
Woolley, Combust. Flame 133 (2003) 415-430.
8. C. Morley, GASEQ: A Chemical Equilibrium Program for Windows Program, see
www.gaseq.co.uk (2001).
9. M. Lawes, M.P. Ormsby, C.G.W. Sheppard, R. Woolley, Combust. Sci. Technol.
177 (2005) 1273-1289.
10. C. Mandilas, M.P. Ormsby, C.G.W. Sheppard, R. Woolley, Proc. Combust. Inst. 31
(2007) 1443-1450.
12. D. Bradley, R.A. Hicks, Lawes, M., and Sheppard, C. G.W., Engine and Fuel
Interaction In Real Engines, Final Report CEC Contract JOU-2-CT92-0162,
Commission of the European Communities and Daimler-Benz AG, Brussels, 1996.
11. K. Nwagwe, H.G. Weller, G.R. Tabor, A.D. Gosman, M. Lawes, C.G.W. Sheppard,
R. Woolley, Proc. Combust. Inst. 28 (2000) 59-65.
13. F. Atzler, Fundamental Studies of Aerosol Combustion, Ph.D. Thesis, University of
Leeds, UK (1999).
14. D. Bradley, R.A. Hicks, M. Lawes, C.G.W. Sheppard, R. Woolley, Combust. Flame
115 (1998) 126-144.
26

15. A.A. Burluka, M. Fairweather, M.P. Ormsby, C.G.W. Sheppard and R. Woolley, The
Laminar Burning Properties of Premixed Methane-Hydrogen Flames Determined
Using a Novel Analysis Method, ECM 2007.
16. P. Clavin, Prog. Energy Combust. Sci. 11 (1985) 1-59.
17. C.K. Wu, C.K. Law, Proc Combust. Inst. 20 (1984) 1941-1949.
18. X. Qin, H. Kobayashi, T. Niioka, Exp. Therm. Fluid. Sci. 21 (2000) 58-63.
19. F. Halter, C. Chauveau, N. Djebaïli-Chaumeix, I. Gökalp, Proc. Combust. Inst. 30
(2005) 201-208.
20. R.J. Kee, J.F. Grgar, M.D. Smooke, J.A. Miller, A Fortran Program for Modeling
Steady Laminar One-Dimensional Premixed Flames, Report No. SAND85-8240,
Sandia National Laboratories, 1985.
21. P.G. Smith, D.M. Golden, M. Frenklach, N.W. Moriarty, M. Goldenberg, C.T.
Bowman, R.K. Hanson, S. Song, W.C. Gardiner Jr., V.V. Lissianski, Z. Oin, from
http://www.me.berkeley. edu /gri_mech/.
22. A. Konnov, Release 0.4, from http://homepages.vub.ac.be/~akonnov/, 1998.
23. A.N. Lipatnikov, J. Chomiak, Prog. Energy Combust. Sci. 31 (2005) 1-73.
24. G.S. Jackson, R. Sai, J.M. Plaia, C.M. Boggs, K.T. Kiger, Combust. Flame 132
(2003) 503-511.
25. J.F. Griffiths, J.A. Barnard, Flame and Combustion, 3 Ed. Blackie A & P, 1995.
26. J. H. Tien, M. Matalon, Combust. Flame 84 (1991) 238-248.
27. E. R. Hawkes , J. H. Chen, Combust. Flame 138 (2004) 242-258.
28. G. Yu, C.K. Law, C.K. Wu, Combust. Flame 63 (1986) 339-347.
29. J.-Y. Ren, W. Qin, F.N. Egolfopoulos, T.T. Tsotsis, Combust. Flame 124 (2001)
717-720.
30. K.N.C. Bray, Proc. R. Soc. Lond. A 431 (1990) 315-335.
31. O.L. Gülder, Proc Combust. Inst. 23 (1991) 743-750.
32. V. Sick, M.R. Hartman, V.S. Arpaci, R.W. Anderson, Combust. Flame 127 (2001)
2119-2123.
33. N. Peters, Turbulent Combustion, Cambridge University Press, 2000.
34. S.S. Shy, W.J. Lin, J.C. Wei, Proc. R. Soc. Lond. A 456 (2000) 1997-2019.
35. A.N. Lipatnikov, J. Chomiak, Prog. Energy Combust. Sci. 28 (2002) 1-74.
27
36. V.P. Karpov, E.S. Severin, Combust. Explos. Shock Waves 16 (1980) 41-46.
37. H. Kido, T. Kitagawa, K. Nakashima, K. Kato, Mem. Faculty Engng., Kyushu Univ
49 (1989) 229-247.
38. D. Bradley, M. Lawes, K. Liu, R. Woolley, Proc. Combust. Inst. 31 (2007) 1393-
1400.
28

Fuel Masr < 2 2 < Masr < 7 Masr > 7
CH4 - 0.6 1.1 1.2
10% H2 0.7 0.8 1.1 1.2
20% H2 0.8 0.9 1.2 1.3
50% H2 1.1 1.2 1.3 1.4
Table 1. Data contained in the Masr ranges shown in Figure 15.
Figure 1. Turbulent flame propagation of a typical, turbulent = 1, 50% H2 flame at u’ = 6 m s-1 (images at 2 ms intervals).
29

0 50 100 150 200 2500.0
0.2
0.4
0.6
0.8
1.0N
umbe
r of
pix
els
(arb
. uni
ts)
Gray scale level
Possible range of threshold values (c)
0 2 4 6 8 10 12
(b) (a)
0 2 4 6 8 100.0
0.2
0.4
0.6
0.8
1.0
1.2
1.4
0.00
0.02
0.04
0.06
0.08
0.10
u tr (
m s
-1)
Time from ignition (ms)
10 14 18 22 26 28 32
Sta
ndar
d de
viat
ion
(m s
-1)
(e)
0
10
20
30
40
50
60
Mea
n Fl
ame
Rad
ius
(mm
)
Time from ignition (ms)
10 14 18 22 26 30 34
(d)
Figure 2. Flame processing procedure for a typical flame (CH4/air, = 0.9, u’ = 2 m s-1): (a) original schlieren image, (b) image after background subtraction, (c) image histogram after background subtraction, (d) flame radius against time from ignition for different grey scale threshold values, and (e) turbulent burning velocity against time from ignition, with the standard deviation in the velocities found at the various threshold values also shown.
30
0 100 200 300 400 500 6000.2
0.4
0.6
0.8
1.0
= 1.0
= 1.5
S n/Ss
ms)
= 0.7
Fig. 3. Normalised laminar flame speed vs. flame stretch rate for three typical 50 % H2 flames.
31

0 2 4 6 8 100
1
2
3
4
5
CH4
50% H2
u tr (
m s
-1)
u' (m s-1)
Figure 4. Turbulent burning velocities, utr, against u’ for CH4 and 50% H2 at = 1.
0 10 20 30 40 50 60 70
0.5
1.0
1.5
2.0
2.5
3.0
3.5
4.0
u tr (m
s-1
)
% Hydrogen
u' = 0.5 m s-1
u' = 1 m s-1
u' = 2 m s-1
u' = 4 m s-1
u' = 8 m s-1
Figure 5. Turbulent burning velocity against percentage hydrogen in the fuel with u’ for = 1.
32

0.4 0.6 0.8 1.0 1.2 1.40.4
0.8
1.2
1.6
CH4
20%H2
10%H2
u tr (
m s
-1)
50%H2
Figure 6. Average turbulent burning velocities against equivalence ratio for all fuels at u’ = 2 m s-1, including second-order least square fits to data.
0.4 0.6 0.8 1.0 1.2 1.40
1
2
3
4
10% H2
CH4
20% H2
50% H2
u tr (
m s
-1)
Figure 7. Average turbulent burning velocities against equivalence ratio for all fuels at u’ = 6 m s-1, including second-order least square fits to data.
33
0.4 0.6 0.8 1.0 1.2 1.4 1.60.00
0.15
0.30
0.45
0.60
0.75
0.90
10% H2
20% H250% H2
u l (m
s-1
)
CH4
Figure 8. Measured unstretched laminar burning velocity against equivalence ratio for all fuels.
0.6 0.8 1.0 1.2 1.4 1.6 1.80.0
0.2
0.4
0.6
0.8
1.0
u l (m
s-1
)
50 % H2
CH4
Figure 9. Comparison of experimental and computed laminar burning velocities for methane and 50 % hydrogen addition (crosses – data, triangles – GRI Mech 3.0, filled circles – Konnov).
34

0.4 0.6 0.8 1.0 1.2 1.4 1.6
0
4
8
12
16
20
Ma sr
50% H2
20% H2
10% H2
CH4
Figure 10. Markstein lengths against equivalence ratio for all fuels.
0 20 40 60
1
2
3
4
5
u' = 4 m s-1
u' = 2 m s-1
u' = 1 m s-1
u' = 0.5 m s-1
u tr/u
l
% hydrogen
u' = 8 m s-1
Figure 11. The ratio utr/ul against percentage hydrogen in the fuel with u’ for = 1.
35
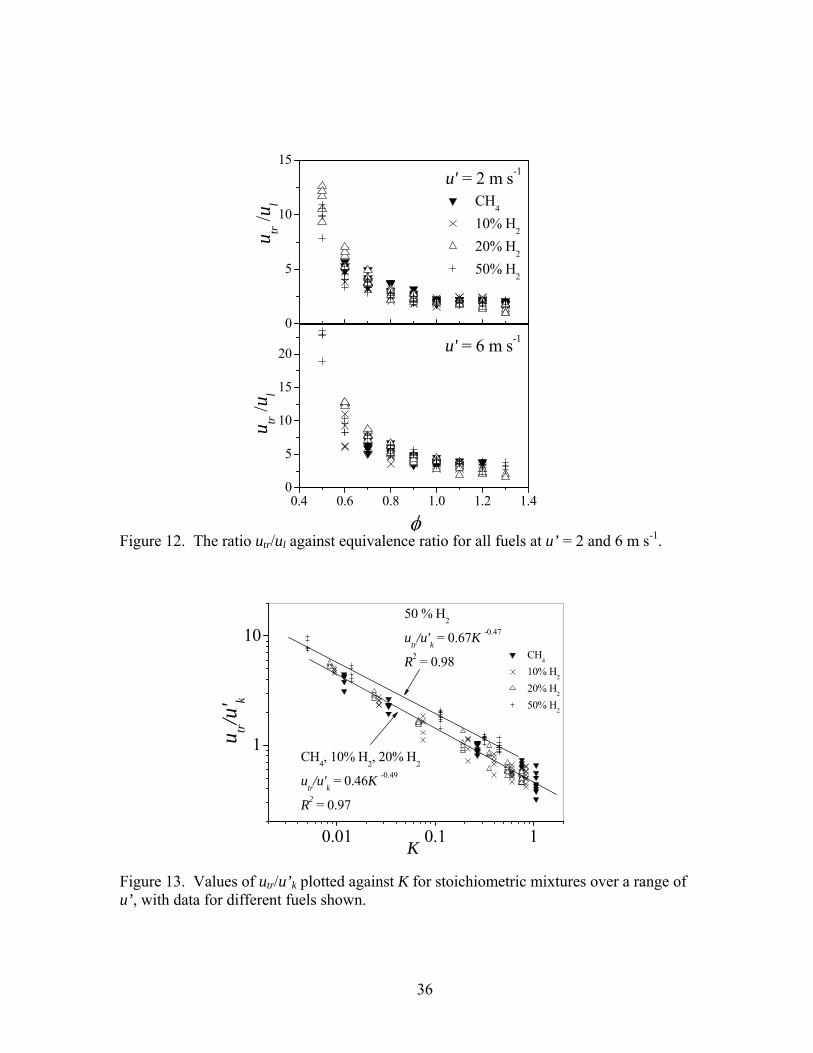
0
5
10
15
0.4 0.6 0.8 1.0 1.2 1.40
5
10
15
20
u' = 2 m s-1
u tr /u
l
u tr /u
l CH4
10% H2
20% H2
50% H2
u' = 6 m s-1
Figure 12. The ratio utr/ul against equivalence ratio for all fuels at u’ = 2 and 6 m s-1.
0.01 0.1 1
1
10 CH
4
10% H2
20% H2
50% H2
K
u tr/u
' k
CH4, 10% H
2, 20% H
2
utr/u'
k = 0.46K -0.49
R2 = 0.97
50 % H2
utr/u'
k = 0.67K -0.47
R2 = 0.98
Figure 13. Values of utr/u’k plotted against K for stoichiometric mixtures over a range of u’, with data for different fuels shown.
36
1E-3 0.01 0.1 1 10
1
10
[4]
[34]
u t /u
', u tr
/u' k
K
Eq. 10
Eq. 11
[36][37]
Figure 14. Comparison between the best fits derived in this study and the turbulent burning correlations of other workers.
1E-3 0.01 0.1 1 100.1
1
10
2 < Masr < 7
utr/u'
k = 0.42K -0.45
Masr > 7
utr/u'
k = 0.22K -0.61
u tr /
u'k
K
Masr < 2
utr/u'
k = 0.77K -0.33
quench
Figure 15. Values of utr/u’k plotted against K for all measurements, with data for different ranges of Masr shown (Masr < 2 – filled squares, 2 < Masr < 7 – open circles, Masr > 7 crosses).
37