UNIVERSITI PUTRA MALAYSIA - psasir.upm.edu.mypsasir.upm.edu.my/4768/1/FPAS_2007_9A.pdf ·...
25
. UNIVERSITI PUTRA MALAYSIA MODEL DEVELOPMENT AND INTEGRATED ANALYSIS OF THE IMPACT OF TRAFFIC EMISSIONS ON AIR QUALITY IN URBAN AREAS IN JAKARTA, INDONESIA DOLLARIS RIAUATY SUHADI T FPAS 2007 9
Transcript of UNIVERSITI PUTRA MALAYSIA - psasir.upm.edu.mypsasir.upm.edu.my/4768/1/FPAS_2007_9A.pdf ·...

.
UNIVERSITI PUTRA MALAYSIA
MODEL DEVELOPMENT AND INTEGRATED ANALYSIS OF THE IMPACT OF TRAFFIC EMISSIONS ON AIR QUALITY IN URBAN
AREAS IN JAKARTA, INDONESIA
DOLLARIS RIAUATY SUHADI
T FPAS 2007 9
MODEL DEVELOPMENT AND INTEGRATED ANALYSIS OF THE IMPACT OF TRAFFIC EMISSIONS ON AIR QUALITY IN URBAN
AREAS IN JAKARTA, INDONESIA
DOLLARIS RIAUATY SUHADI
DOCTOR OF PHILOSOPHY UNIVERSITI PUTRA MALAYSIA
2007
ii

MODEL DEVELOPMENT AND INTEGRATED ANALYSIS OF THE IMPACT OF TRAFFIC EMISSIONS ON AIR QUALITY IN URBAN AREAS
IN JAKARTA, INDONESIA
By
DOLLARIS RIAUATY SUHADI
Thesis Submitted to the School of Graduate Studies, Universiti Putra Malaysia, in Fulfilment of the Requirement for the Degree of Doctor Philosophy
June 2007

DEDICATION
TO MY BELOVED HUSBAND AND MY SONS
BSTRACT

Abstract of thesis presented to the Senate of Universiti Putra Malaysia in fulfilment of the requirement for the degree of Doctor of Philosophy
MODEL DEVELOPMENT AND INTEGRATED ANALYSIS OF THE IMPACT OF TRAFFIC EMISSIONS ON AIR QUALITY IN URBAN
AREAS IN JAKARTA, INDONESIA
By
DOLLARIS RIAUATY SUHADI
June 2007
Chairman: Professor Muhamad Awang, PhD
Faculty: Environmental Studies
This research aims to assess air quality status in the urban area of Jakarta and
evaluate the effect of traffic emissions control of selected air pollutants by
employing a Gaussian-plume dispersion model developed in Delphi. Sources of
air pollutants were divided into point, line, and area sources representing three
contributing sectors, i.e. industry, transport, and household. Input data for the
model was obtained from the government statistics and industrial and traffic
surveys conducted in other previous studies. Improvement of the model run-time
was done by developing a parallel implementation coded in a data-parallel
approach. The dispersion model performed reasonably in estimating the
concentrations of SO2 and NOx. Testing of the model resulted in the relative
standard errors of estimates of below 50% indicating the model could be
reproducible. However, the simulation of PM10 concentration resulted in
underestimation. The cause for this was the exclusion of other significant
sources of PM10 beside three contributing source categories under study.
iii
Prediction of future emissions using the 2002 emission data and socio-economic
factors which affect air quality revealed that the emissions of SO2, NOx, and
PM10 would increase by a factor of 1.64, 1.48, and 1.64, respectively in 2010 if
control of the pollutants emissions was not taken. Similarly, simulation of future
air quality under business-as-usual scenario resulted in increased pollutant
concentrations. The number of grids exceeding the annual NOx ambient standard
in 2010 was twice the number of grids exceeding the standard in 2002. Under
the scenario with control measures, the concentrations of pollutants, particularly
the transport-contributed PM10 were reduced by 44%. The reduction of PM10
concentration was a result of simulated implementation of vehicle inspection and
maintenance. Updating the emissions inventory to include other pollutant
contributing sources, and continued improvement of the dispersion model to fit
the best conditions of the urban area are suggested.
K
iv

Abstrak tesis yang dikemukakan kepada Senat Universiti Putra Malaysia sebagai memenuhi keperluan untuk ijazah Doktor Falsafah
PEMBANGUNAN MODEL DAN ANALISIS INTEGRASI TERHADAP KESAN SISA PELEPASAN KENDARAAN KEATAS KUALITI UDARA
DI KAWASAN BANDAR JAKARTA DI INDONESIA
Oleh
DOLLARIS RIAUATY SUHADI
Juni 2007 Pengerusi: Profesor Muhamad Awang, PhD Fakulti: Pengajian Alam Sekitar
Kajian ini bertujuan untuk menilai tahap kualiti udara di sekitar bandaraya
Jakarta serta penilaian implikasi kawalan pelepasan pencemar udara trafik
dengan penggunaan model dispersi Gaussian yang dibangunkan oleh Delphi.
Sumber bahan pencemar udara telah di bahagikan kepada sumber titik, garisan
dan kawasan mewakili tiga sektor penyumbang iaitu, industri, pengangkutan dan
rumah kediaman. Data yang digunakan untuk model ini diperolehi dari statistic
kerajaan dan kajiselidik industri dan trafik beberapa kajian sebelum ini.
Peningkatan waktu simulasi model telah dilakukan dengan pembinaan kod
implementasi sejajar dalam pendekatan data sejajar. Pencapaian model dispersi
untuk menganggar kepekatan SO2 dan NOx adalah memuaskan. Hasil ujian ke
atas model ini pula menghasilkan sisihan lazim di bawah 50% dan ini
menunjukkan model ini boleh diterima. Walau bagaimanapun, simulasi
kepekatan PM10 menghasilkan keputusan kurang dari jangkaan. Ia adalah
v

vi
berpunca dari terkeluarnya sumber penyumbang PM10 yang lain selain dari tiga
kategori sumber pencemar yang dikaji.
Ramalan pelepasan pencemar masa hadapan dengan menggunakan data
pelepasan dan faktor sosio-ekonomi yang mendatangkan kesan pada kualiti
udara mendapati bahawa pelepasan SO2, NOx dan PM10 meningkat masing-
masing pada faktor 1.64, 1.48, dan 1.64 pada tahun 2010 sekiranya tidak ada
kawalan pada pelepasan pencemar ini. Pada keadaan yang sama, simulasi kualiti
udara masa hadapan pada senario ’perniagaan seperti biasa’ masih menunjukkan
peningkatan kepekatan pencemar. Bilangan grid melampaui standard ambien
NOx tahunan pada tahun 2010 iaitu dua kali ganda bilangan grid melampaui
standard tahun 2002. Di bawah senario dimana adanya langkah-langkah
kawalan, kepekatan pencemar, terutamanya pelepasan PM10 berpunca dari
pengangkutan, menurun sebanyak 44 %. Penurunan kepekatan PM10 adalah
hasil dari implementasi pemeriksaan dan penjagaan kenderaan. Adalah
dicadangkan untuk masa-masa hadapan, inventori pelepasan pencemar perlulah
merangkumi sumber-sumber penyumbang pencemar yang lain disamping
pembaikan beterusan pada model dispersi bersesuaian dengan keadaan yang
terbaik di kawasan bandaraya.

ACKNOWLEDGEMENTS
I would like to thank the Almighty God for the opportunity and grace to have
accomplished this research.
My sincere appreciation is extended to Professor Dr. Muhamad Awang, the
Chairman of my Supervisory Committee, for his continued support and tireless
supervision throughout the course of this program. I also wish to extend my
gratitude to Associate Professor Dr. Mohd Nasir Hassan, Associate Professor Dr.
Ramdzani Abdullah, and Associate Professor Dr. Azizi Hj. Muda for their
guidance and invaluable suggestion provided during the planning and
preparation of this thesis.
I also wish to acknowledge the help from my friends, Trisakti, Ady, Tengku
Sabrina, Penny Iskak, and Susilawati.
My deepest gratitude, however, goes to my husband for his endless support,
understanding and sacrifices, without which I would not have been able to carry
out this research. To my two wonderful sons, Dito and Hazim, thank you for
your love.
vii

I certify that an Examination Committee has met on 25 June 2007 to conduct the final examination of Dollaris Riauaty Suhadi on her Doctor of Philosophy thesis entitled “Model Development and Integrated Analysis on The Impact of Traffic Emission on Air Quality in Urban Areas in Jakarta, Indonesia ” in accordance with Universiti Pertanian Malaysia (Higher Degree) Act 1980 and Universiti Pertanian Malaysia (Higher Degree) Regulations 1981. The Committee recommends that candidate be awarded Doctor of Philosophy. Members of the Examination Committee are as follows: Wan Nor Azmin Sulaiman, PhD Professor Faculty Environmental Studies Universiti Putra Malaysia (Chairman) Azni B.Idris, PhD Professor Faculty Environmental Studies Universiti Putra Malaysia (Internal Examiner) Puziah Abdul Latif, PhD Faculty Environmental Studies Universiti Putra Malaysia (Internal Examiner) Peter Brimblecombe, PhD Professor School of Environmental Sciences University of East Anglica Norwick UK (External Examiner)
________________________________ HASANAH MOHD. GHAZALI, PhD Professor/Deputy Dean School of Graduate Studies Universiti Putra Malaysia Date:
viii

This thesis submitted to the Senate of Universiti Putra Malaysia and has been accepted as fulfillment of the requirement for the degree of Doctor of Philosophy. The members of the Supervisory Committee were as follows:
Muhamad Awang, PhD Professor Faculty Environmental Studies Universiti Putra Malaysia (Chairman)
Ramzani Abdullah, PhD Associate Professor Faculty Environmental Studies Universiti Putra Malaysia (Member)
Mohd Nasir Hassan, PhD Associate Professor Faculty Environmental Studies Universiti Putra Malaysia (Member) Azizi Hj. Muda, PhD. Associate Professor Faculty Environmental Studies Universiti Putra Malaysia (Member)
________________________ AINI IDERIS, PhD Professor/Dean School of Graduate Studies Universiti Putra Malaysia Date: 13 September 2007
ix

x
DECLARATION
I declare that the thesis is my original work except for quotations and citations which have been duly acknowledged. I also declare that it has not been previously, and is not concurrently, submitted for any other degree at Universiti Putra Malaysia or at any other institution. .
DOLLARIS RIAUATY SUHADI
Date: 13 September 2007

TABLE OF CONTENTS
Page DEDICATION ii ABSTRACT iii ABSTRAK v ACKNOWLEDGEMENTS vii APPROVAL viii DECLARATION x LIST OF TABLES xiv LIST OF FIGURES xvi LIST ABBREVIATIONS xviii CHAPTER
1 INTRODUCTION 1.1 1.1 Framing the Problem 1.1 1.2 Research Objective 1.5 1.3 Significance of Research 1.5 1.4 Scope of Research 1.6 1.4.1 Calculation of Emissions Loads 1.7 1.4.2 Development of Dispersion Modeling System 1.8 1.4.3 Simulation of Present Air Quality and Testing of Model
Reproducibility 1.9
1.4.4 Assessment of Cost-effectiveness of Pollution Control Measures
1.10
1.4.5 Prediction of Future Emissions Loads 1.10 1.4.6 Simulation of Future Air Quality 1.11 2 LITERATURE REVIEW 2.1 2.1 Pollutant Emission Load 2.1 2.1.1 Emissions Estimation from Point Sources 2.1 2.1.2 Emissions Estimation from Area Sources 2.9 2.1.3 Emissions Estimation from Mobile Sources 2.10 2.2 Air Quality Modeling 2.17 2.2.1 Gaussian Dispersion Models 2.17 2.2.2 Meteorology of Air Pollution 2.39 2.3 Traffic Emissions 2.42 2.3.1 Overview 2.42 2.3.2 Factors Affecting Emissions 2.45 2.4 Policy Options for Transport Emission Control Measures 2.51 2.4.1 Policy Context 2.51 2.4.2 Policy Options 2.53 2.5 Cost-effectiveness Analysis 2.60 2.5.1 CEA Ratios 2.60 2.5.2 CEA with Scale Differences 2.61

2.5.3 Analysis 2.62 3.13 METHODOLOGY 3.1 3.1 Calculation of Emissions Loads 3.1 3.1.1 Industrial Sector 3.3 3.1.2 Household Sector 3.15 3.1.3 Transport Sector 3.18 3.2 Development of Air Quality Dispersion Model 3.29 3.2.1 Meteorological Pre-processing Model: PCRammet 3.30 3.2.2 Properties Representatives of the Meteorological Station
and Study Area 3.32
3.2.3 Hourly Values of Mixing Height 3.35 3.2.4 Pasquill-Gifford Stability Classes 3.36 3.2.5 Winds 3.38 3.3 Simulation of Present Air Quality and Testing of Model
Reproducibility 3.39
3.3.1 Point Sources 3.44 3.3.2 Line Sources 3.45 3.3.3 Area Sources 3.46 3.3.4 Testing of Model Reproducibility 3.47 3.3.5 Graphical Presentation 3.47 3.4 Assessment of Cost-effectiveness of Traffic Emissions Control
Measures 3.48
3.5 Prediction of Future Emissions Loads 3.50 3.5.1 Prediction of Future Emissions Loads under Business-as-
usual Scenario 3.51
3.5.2 Prediction of Future Emissions Loads with Traffic Emissions Control Measures
3.52
3.5.3 Simulation of Future Air Quality 3.53 4 RESULTS AND DISCUSSION 4.1 4.1 Pollutant Emissions in Study Area 4.1 4.1.1. Industrial Sector 4.1 4.1.2 Household Sector 4.10 4.1.3 Transport Sector 4.12 4.1.4 Total Emissions of Pollutants in Study Area 4.20 4.1.5 Spatial Distribution of Pollutant Emissions 4.21 4.1.6 Conclusion 4.27 4.2 Modeling Results 4.28 4.2.1 Profile of Meteorology in Study Area 4.29 4.2.2 Model Verification 4.31 4.2.3 Spatial Distribution of Pollutant Concentrations 4.40 4.2.4 Conclusion 4.45
xii

4.3 Predicted Future Emissions 4.46 4.3.1 Business-as-usual Scenario 4.46 4.3.2 Scenario with Control Measures 4.47 4.3.3 Conclusion 4.52 4.4 Simulation of Future Air Quality 4.53 4.4.1 Business-as-usual Scenario 4.54 4.4.2 Scenario with Control Measures 4.56 4.4.3 Conclusion 4.60 5 CONCLUSION AND RECOMMENDATIONS 5.1 5.1 Conclusion 5.1 5.2 Theoretical Implications 5.3 5.3 Policy Implications 5.4 5.4 Recommendations 5.5
REFERENCES APENDICES BIODATA OF STUDENT
R.1A.1B.1
xiii
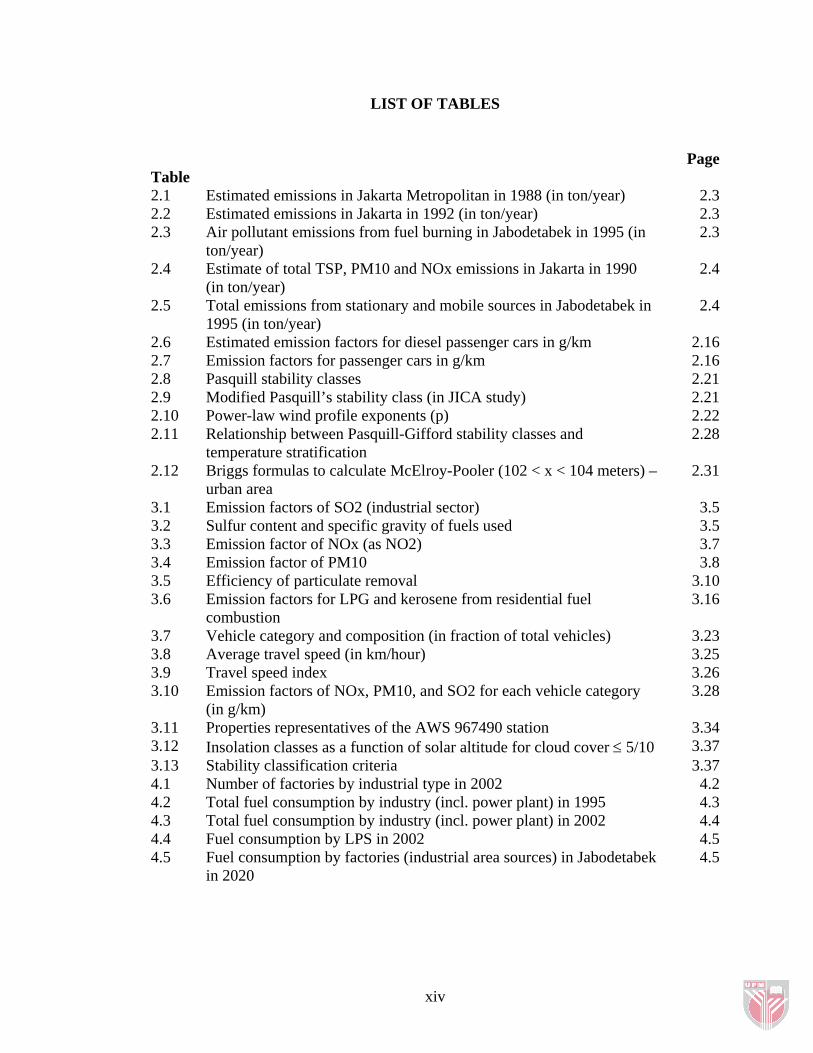
LIST OF TABLES
Page Table 2.1 Estimated emissions in Jakarta Metropolitan in 1988 (in ton/year) 2.32.2 Estimated emissions in Jakarta in 1992 (in ton/year) 2.32.3 Air pollutant emissions from fuel burning in Jabodetabek in 1995 (in
ton/year) 2.3
2.4 Estimate of total TSP, PM10 and NOx emissions in Jakarta in 1990 (in ton/year)
2.4
2.5 Total emissions from stationary and mobile sources in Jabodetabek in 1995 (in ton/year)
2.4
2.6 Estimated emission factors for diesel passenger cars in g/km 2.162.7 Emission factors for passenger cars in g/km 2.162.8 Pasquill stability classes 2.212.9 Modified Pasquill’s stability class (in JICA study) 2.212.10 Power-law wind profile exponents (p) 2.222.11 Relationship between Pasquill-Gifford stability classes and
temperature stratification 2.28
2.12 Briggs formulas to calculate McElroy-Pooler (102 < x < 104 meters) – urban area
2.31
3.1 Emission factors of SO2 (industrial sector) 3.53.2 Sulfur content and specific gravity of fuels used 3.53.3 Emission factor of NOx (as NO2) 3.73.4 Emission factor of PM10 3.83.5 Efficiency of particulate removal 3.103.6 Emission factors for LPG and kerosene from residential fuel
combustion 3.16
3.7 Vehicle category and composition (in fraction of total vehicles) 3.233.8 Average travel speed (in km/hour) 3.253.9 Travel speed index 3.263.10 Emission factors of NOx, PM10, and SO2 for each vehicle category
(in g/km) 3.28
3.11 Properties representatives of the AWS 967490 station 3.343.12 Insolation classes as a function of solar altitude for cloud cover ≤ 5/10 3.373.13 Stability classification criteria 3.374.1 Number of factories by industrial type in 2002 4.24.2 Total fuel consumption by industry (incl. power plant) in 1995 4.34.3 Total fuel consumption by industry (incl. power plant) in 2002 4.44.4 Fuel consumption by LPS in 2002 4.54.5 Fuel consumption by factories (industrial area sources) in Jabodetabek
in 2020 4.5
xiv

4.6 Estimated emissions of SO2, NOx, and PM10 by facility type in 2002 (unit in kg/year)
4.6
4.7 Estimated emissions of SO2, NOx and PM10 from industrial area sources (excl. power plants and cement kilns) in 2002 (ton/year)
4.8
4.8 Total air pollutant emissions from industrial sector in Jabodetabek (2002)
4.8
4.9 Spatial distribution of emissions from industries in Jabodetabek, in ton/year (2020)
4.10
4.10 Total emissions loads from household sector in 2002 (ton/year) 4.114.11 Spatial distribution of emissions from household sector in 2002
(ton/year) 4.11
4.12 Vehicle kilometer traveled (106km/year) 4.124.13 Test of significant difference between emissions with different α
values 4.16
4.14 Total emissions from line mobile sources in 2002 (ton/year) 4.184.15 Total emissions from area mobile sources in 2002 (ton/year) 4.194.16 Total emission from transport sector in 2002 (ton/year) 4.204.17 Results of model testing 4.394.18 Projected fuel consumption in industrial sector in 2010 4.464.19 Projected fuel consumption in household and transport sectors in 2010 4.474.20 Total air pollutant emissions in 2010 (business-as-usual scenario) 4.474.21 Cumulative effectiveness of traffic emission control measures 4.484.22 Emissions reduction in 2010 (with control measures) 4.50
xv

LIST OF FIGURES
Page Figure 1.1 Map of Indonesia 1.121.2 Map of the study area of Jabodetabek region 1.132.1 Illustration of the modification of the standard dispersion parameter
curve 2.38
2.2 Temperature profile in the atmosphere 2.422.3 Factors affecting emissions 2.452.4 Policy options for reducing transport emissions 2.573.1 Flow diagram of the research sequence 3.23.2 Locations of large point sources under study in Jabodetabek 2002 3.43.3 Procedure for estimating emission of pollutants from industrial sector 3.143.4 Gridded study area with resolution of 1-km 3.153.5 Procedure for estimating pollutant emissions from households 3.173.6 Road segments made part of line mobile sources under study 3.203.7 Procedure for estimating emissions from transport sector 3.293.8 Structure of dispersion model 3.313.9 Parallelization of dispersion model 3.323.10 Downwind distance x and y from source to receptor 3.403.11 Approximate representation of a line source by multiple volume
sources 3.45
4.1 Air pollutant emissions from industrial sector 4.94.2 Sensitivity analysis of α in emissions (in developed areas) 4.164.3 Sensitivity analysis of α in emissions (in less-developed areas) 4.174.4 Total pollutant emissions in Jabodetabek in 2002 in comparison with
emissions in 1995 (unit in ton/year) 4.21
4.5 Land use map of Jabodetabek, 2002 4.224.6 Distribution of SO2 emission from LPS, 2002 4.234.7 Distribution of SO2 emission from industrial area sources, 2002 4.244.8 Distribution of PM10 emission from household area sources, 2002 4.244.9 Distribution of NOx emissions from line mobile sources, 2002 4.254.10 Distribution of SO2 emission from area mobile sources, 2002 4.254.11 Distribution of NOx emissions from area mobile sources, 2002 4.264.12 Distribution of PM10 emissions from area mobile sources, 2002 4.264.13 Windrose diagram of Jabodetabek, 2002 4.294.14 Frequency of wind speed in Jabodetabek, 2002 4.304.15 Frequency of stability class in Jabodetabek, 2002 4.314.16 Locations of automatic air quality monitoring stations, 2002 4.324.17 Comparison of monitoring data and simulated results for SO2 at JAF1
site, 2002 4.32
4.18 Comparison of monitoring data and simulated results for SO2 at JAF3 site, 2002
4.33
xvi

4.19 Comparison of monitoring data and simulated results for NOx at JAF4
site, 2002 4.33
4.20 Comparison of monitoring data and simulated results for NOx at JAF5 site, 2002
4.34
4.21 Comparison of monitoring data and simulated results for PM10 at JAF1 site, 2002
4.35
4.22 Comparison of monitoring data and simulated results for SO2 at JAF1 site, 2002
4.37
4.23 Comparison of monitoring data and simulated results for SO2 at JAF3 site, 2002
4.37
4.24 Comparison of monitoring data and simulated results for NOx at JAF4 site, 2002
4.38
4.25 Comparison of monitoring data and simulated results for NOx at JAF5 site, 2002
4.38
4.26 Distribution of annual simulated concentration of SO2 in the urban area of Jakarta, 2002
4.41
4.27 Distribution of annual simulated concentration of NOx in the urban area of Jakarta, 2002
4.42
4.28 Transport contribution of annual NOx simulated concentration in the urban area of Jakarta, 2002
4.43
4.29 Transport contribution of annual PM10 simulated concentration in the urban area of Jakarta, 2002
4.44
4.30 Distribution of annual simulated concentration of SO2 in the urban area of in 2010 under business-as-usual scenario
4.54
4.31 Distribution of annual simulated concentration of SO2 in the urban area of Jakarta, 2002 (same as Figure 4-26, showed for comparison with Figure 4.30 above)
4.55
4.32 Distribution of annual simulated concentration of NOx in the urban area of Jakarta in 2010 under business-as-usual scenario
4.57
4.33 Distribution of annual simulated concentration of NOx in the urban area of Jakarta, 2002 (same as Figure 4-27, showed for comparison with Figure 4.32 above)
4.57
4.34 Transport contribution of the annual PM10 concentration in the urban area of Jakarta in 2010 under scenario with control measures
4.58
4.35 Transport contribution of the annual PM10 concentration in the urban area of Jakarta in 2010 under business-as-usual scenario
4.58
4.36 Transport contribution of the annual NOx concentration in the urban area of Jakarta in 2010 under business-as-usual scenario
4.59
4.37 Transport contribution of the annual NOx concentration in the urban area of Jakarta in 2010 under business-as-usual scenario
4.59
xvii

LIST OF ABBREVIATIONS ADO Automotive Diesel Oil
BAPEDAL Badan Pengendalian Dampak Lingkungan
BAU business-as-usual
Bodetabek Bogor Depok Tangerang Bekasi
CEA Cost-effectiveness Analysis
CNG Compressed Natural Gas
CO carbon monoxide
CO2 carbon dioxide
CORINAIR Coordination Information on the Environment in the European Community – Air)
EMEP European Monitoring and Evaluation Program
GDP Gross Domestic Product
GIS Geographic Information System
g gram
g/lit gram per liter
GRDP Gross Regional Domestic Product
HC hydrocarbons
HSD High Speed Diesel
IDO Industrial Diesel Oil
IPCC Intergovernmental Panel on Climate Change
IPPS Industrial Pollution Projection System
Jabodetabek Jakarta Bogor Depok Tangerang Bekasi
JICA Japan International Cooperation Agency
xviii

JMDPR Jabotabek Metropolitan Development Plan Review
kg kilogram
kL kiloliter
LPG Liquified Petroleum Gas
LPS Large Point Source
m3 cubic meter
min minute
MFO Marine Fuel Oil
MoMR Ministry of Mining & Natural Resources
MTBE methyl tetra buthyl ether
NMSE Normalized Mean Square Errors
NOx nitrogen oxides
PM10 particulate matter with diameter up to 10 microns
SEE Standard Errors of Estimates
SO2 sulphur dioxide
toe ton oil equivalent
TSP Total Suspended Particulates
U.S.EPA United States of Environmental Protection Agency
μg microgram
UTM Universal Transverse Mercator
VKT Vehicle Kilometer Traveled
VOC Volatile Organic Carbon
WHO World Health Organization
xix

xx
CHAPTER 1
INTRODUCTION
1.1 Framing the Problem
Road transport is a significant source of air pollution in urban centers (Johansson, 1995;
Chin, 1996). The impact of its exhaust emissions on human health and the environment
has raised much concern worldwide. Road transport, like any other modes of transport
has been partly responsible for greater atmospheric impacts such as acid deposition,
stratospheric ozone depletion, and climate change (Colville et al, 2001). To date, urban
traffic air pollution continues to be the focus of many air quality reviews and studies
despite the growing interest shown in global air pollution issues over the last decade.
For many years efforts to reduce traffic air pollution have been made through various
control measures including the introduction of vehicle technology, improvement of
transport system and fuel quality. As a result, traffic emissions have been reduced
substantially and some countries, mostly developed countries, reported that their
nation’s urban air quality has been improved (U.S.EPA, 2002; European Environment
Agency, 2005). In developing countries, however, with accelerating urban growth likely
to cause great increase in car ownership and use, efforts to reduce traffic emissions
remain to be seen. The challenge for the authority will be whether to act upon control
measures now to prevent air quality from getting more severe in the future or to delay
the implementation further until the damage costs in health, productivity, and economy
become enormous.

Many developing countries have developed their own air quality policy and strategy
based on their needs for improved air quality and relative findings of the status of air
quality and level of emissions. In many cases, the common strategy is often derived
from other countries’ experience, which has been proved to be successful. While it is not
necessary for a developing country to start from “the scratch” in finding what control
options work best for the country, the adoption should be done in a careful manner
because a control measure is country-specific. It may work in a certain country but may
not work in other country or may require modification to make it workable.
Indonesia, for example, first embarked its air pollution agenda in 1992 with the issuance
of “Blue Sky” program aimed at reducing air pollution in target provinces. Air quality-
related regulations have been revised or newly issued since then, including the revision
of the national ambient standard and the establishment and continued improvement of
emissions standards for both mobile and stationary sources. Control measures for traffic-
related emissions as stated in the program provisions, which are also in line with
recommendations from previous foreign-funded studies include emission regulations
through inspection and maintenance, phase-out of leaded gasoline, reduction of sulfur
content in diesel fuel, introduction of clean vehicle technology and use of smokeless oil
for two-stroke vehicles (Shah et al, 1997; Japan International Cooperation Agency –
JICA and Environmental Impact Control Agency – BAPEDAL, 1997a).
Despite the availability of regulatory instruments and proposed action plans for
Indonesia, implementation has not begun until today. Lacks of public and political wills
are the major factor, which contributes to the implementation failure of many
1.2

regulations. Provisions with regard to institutional resources, technical procedures, and
detailed administration of the regulations are not clearly defined. Unclear lines of
authority and responsibility of government agencies have often attributed to the delay of
the formulation of these implementing provisions (D. Kuper, personal communication,
October 2, 1996). Other shortcomings, in general, include lack of control and law
enforcement and shortage of well-trained personnel (Shah et al, 1997).
The newly enacted Regional Autonomy Law No. 22/1999 that stipulates in its provisions
an extended transfer of environmental policy resources and regulatory authority from the
central government to local governments is significant for the interest of air pollution
control efforts. Some areas of many environmental problems will be addressed by local
governments. Such transfer would pose a potentially formidable test for both the local
government and the public as they become much closer to the real problem and are more
challenged to tackle the problem. Public participation is central that will help the local
government to move forward to formulate and execute its action plans without further
delay (Shah, 2004).
The Provincial Government of Jakarta, in this regard, has taken initiative and advanced
into setting up a coordinating body that will oversee the implementation of emission
regulations in the Province of Jakarta. The approach is directed towards achieving air
quality objectives (air quality standards) and economic objectives (reduction of damage
costs) by implementing cost-effective air pollution control measures in line with the
national pollution control strategy. Road transport is being the target source of control.
Through active role of advocacy groups and other interest groups in Jakarta, air
1.3