
UNIVERSITI PUTRA MALAYSIA TUMOR EXTRACTION FOR … · Oleh itu, identifikasi secara automatik dan...
25
UNIVERSITI PUTRA MALAYSIA TUMOR EXTRACTION FOR BRAIN MAGNETIC RESONANCE IMAGING USING MODIFIED GAUSSIAN DISTRIBUTION QUSSAY ABBAS SALIH AL-BADRI. Fk 2006 19
-
Upload
truongminh -
Category
Documents
-
view
220 -
download
0
Transcript of UNIVERSITI PUTRA MALAYSIA TUMOR EXTRACTION FOR … · Oleh itu, identifikasi secara automatik dan...

UNIVERSITI PUTRA MALAYSIA
TUMOR EXTRACTION FOR BRAIN MAGNETIC RESONANCE IMAGING USING MODIFIED GAUSSIAN DISTRIBUTION
QUSSAY ABBAS SALIH AL-BADRI.
Fk 2006 19

TUMOR EXTRACTION FOR BRAIN MAGNETIC RESONANCE IMAGING USING MODIFIED GAUSSIAN DISTRIBUTION
BY
QUSSAY ABBAS SALIH AL-BADRI
Thesis Submitted to the School of Graduate Studies, Universiti Putra Malaysia, in Fulfilment of the Requirement for the Degree of Doctor of Philosophy
January 2006

DEDICATION
In the name of God, Most Gracious, Most Merciful
Dedication to
This thesis is dedicated to my parents, and my brothers who have always been with
me all the time, for all the sacrifices they made to help me reach this point.
My Parents,
Professor Dr. Abbas Salih Al-Badri
Professor Dr. Layla Abd Al-Wahab
My Brothers,
Oday, Ghaith, Meis, and the rest of my family
Abstract of thesis presented to the Senate of Universiti Putra Malaysia in fulfilment of the requirements for the degree of Doctor of Philosophy
TUMOR EXTRACTION FOR BRAIN MAGNETIC RESONANCE IMAGING USING MODIFIED GAUSSIAN DISTRIBUTION
BY
QUSSAY ABBAS SALIH AL-BADRI
January 2006
Chairman: Associate Professor Abdul Rahman Ramli, PhD
Faculty : Engineering
Magnetic Resonance Imaging (MRI) is extensively used in the study of brain.
Segmentation of MR brain images is necessary for a number of clinical
investigations of various complexity, change detection, cortical labeling, and
visualization in surgical planning. The volume of enhancing lesions, following the
administration of paramagnetic contrast agent is an important indicator of pathology
in multiple sclerosis (MS). Manual estimation of enhancing lesion volumes
introduces significant errors, and operator bias, besides being time consuming and
subjective. Therefore, there is a need for automatic identification and estimation of
volumes of the present MS lesions specially by dealing with a large number of
images that are typically acquired in multi-center clinical trials.
In the developed techniques, 150 T1- and T2-weighted spin echo images were taken
from the routine scans of Kuala Lumpur General Hospital.

Multiple sclerosis lesions visualized by morphological MRI are classified through a
feature map technique on T1 weighted MRI tissue. Gray level morphology methods
are used to make tissue types in the images more homogenous and minimize
difficulties with connections to outside tissue. A method for hzzy connectedness
and combinations of the different segmentation techniques were experimented. A
gain-based correction method; probability density function model are used to cluster
white and gray matters, cerebrospinal fluid, and meninges. Results of segmentation
have been validated by a group of neuro-radiologists.
3D visualization has been implemented for the segmented regions as well as brain
lesion. The visualization of the segmented structures uses a combination of volume
rendering and surface rendering.
The mutual information algorithms used in this work has been developed and
experimented in the system and has proven to yield more accurate and stable results
than other algorithms.
Currently testing the validation of the proposed segmentation in a validation study
that compares resulting MS lesion as well as gray and white matter tissue structures
with Neural Network expert segmentation system. The proposed method versus
Neural Network rater validation showed an average validation score of overlap ratio
of >85% for gray and white matters tissue segmentation and for MS lesion the rater
validation showed an average overlap ratio of > 87%.
Abstrak tesis yang dikemukakan Senat Universisti Putra Malaysia sebagai memenuhi keperluan untuk ijazah Doktor of Falsafah
PENYARIAN TUMUR UNTUK RESONANS MAGNETIK PENGIMEJAN OTAK PENGUBAHSUAIAN DENGAN TABURAN GAUSSIAN
Oleh
QUSSAY ABBAS SALIH AL-BADRI
Januari 2006
Pengerusi: Profesor Madya Abdul Rahman Ramli, PhD
Fakulti : Kejuruteraan
Kaedah Pengimejan Resonans Magnetik atau (MRI) digunakan secara meluas di
dalam bidang kajian otak. Segmentasi imej otak MR diperlukan untuk siasatan
klinikal bagi pelbagai kerumitan, dan pengesanan pertukaran, pelabelan kortikal,
dan visualisasi perancangan pembedahan. Jumlah pertambahan lesion, berikutan
pentadbiran ejen kontras paramagnetic merupakan petunjuk penting bagi patologi
berbilang sklerosis (MS). Jumlah lesion yang bertambah yang dianggarkan secara
manual memperlihatkan ralat yang ketara, kecenderungan operator, mengambil
masa serta subjektif. Oleh itu, identifikasi secara automatik dan anggaran jumlah
pertambahan lesion dalam MS adalah perlu terutamanya apabila menguruskan
sejumlah besar imej yang lazimnya diambil dalam percubaan klinikal di pelbagai
tempat.
Dalam teknik yang dibangunkan ini, lebih daripada 150 imej TI-and-T2-weighted
spin echo diambil dari imbas rutin di Hospital Besar Kuala Lumpur. - . - - -. . -. - - - -

Penambahan bukan-lesion menerusi pemetaan kebarangkalian hngsi ketumpatan
yang digambarkan oleh morfologikal MRI, diklasifikasikan menerusi teknik
pemetaan sifat, dan ke atas tisu berpemberat TI MRI. Kaedah morfologi tahap
kelabu digunakan supaya jenis tisu lebih seragam, selain mengurangkan kesulitan
dengan tisu luar. Kombinasi kaedah penambahan tersebut dengan teknik segmentasi
berbeza dieksperimentasi. Kaedah perolehan berdasarkan pembetulan dipilih; model
fungsi kebarangkalian ketumpatan digunakan untuk mengelompok bahan-bahan
putih dan kelabu, cecair cerebrospinal dan meninges. Keputusan segmentasi
disahkan oleh ahli neuro-radiologi,
Visualisasi 3D dilaksanakan untuk segmentasi bahagian dan lesion otak. visualisasi
struktur segmen tersebut menggunakan kombinasi terjemahan jumlah dan
te rjemahan permukaan.
Algoritma informasi bersama yang digunakan dalarn kerja ini telah dibangunkan
dan dieksperimen di dalam sistem ini dan terbukti kesahihan dan ketepatannya
berbanding dengan algoritma yang lain.
Kesahihan ketepatan segmentasi yang dicadangkan dalam perbandingan MS lesion
terutamanya dalam tahap kelabu dan putih tisu struktur menggunakan rangkaian
neural sistem segmentasi. Kaedah yang dicadangkan dibandingkan antara rangkaian
neural menunjukkan purata kebolehpercayaan dalam nisbah > 85% untuk tahap
kelabu dan putih tisu struktur serta MS lesion menunjukkan purata nisbah > 87%.

ACKNOWLEDGEMENTS
First of all, I would like to express my utmost thanks and gratitude to Almighty
Allah S.W.T for giving me the ability to finish this thesis successfully.
The author gratefblly wish to express his profound appreciation and gratitude to his
supervisor, Associate Professor Dr. Abdul Rahman Ramli, for his supervision,
guidance, supporting, and constructive suggestion and comments throughout the
duration of the project until it turns to real success.
The author also indebted to the members of his supervisory committee, Associate
Professor Dr. Rozi Mahmud and Dr. Rahmita Wirza, for their affectionate guidance,
prompt decision and valuable assistance during this period.
Appreciation also to the assistance rendered by the respective lecturers, staffs,
technicians of the faculty of engineering for providing the facilities required for
undertaking this project.
The author would like to thank his family for the encouragement and support
without which is impossible for the success of this project, specially my lovely wife
Suzan A. Tahir which she stand supporting me all the way until the end of my study
and my friends, for offering helps and supports all the time.
vii
I certify that an Examination Committee has met on 27' January 2006 to conduct the final examination of Qussay A. Salih on his Doctor of Philosophy thesis entitled "Tumor Extraction for Brain Magnetic Resonance Imaging Using Modified Gaussian Distribution" in accordance with Universiti Pertanian Malaysia (Higher Degree) Act 1980 and Universiti Pertanian Malaysia (Higher Degree) Regulations 1 98 1. The Committee recommends that the candidate be awarded the relevant degree. Members of the Examination Committee are as follows:
Senan Mahmod Abdullah, PhD Associate Professor Faculty of Engineering Universiti Putra Malaysia (Chairman)
Ishak Aris, PhD Associate Professor Faculty of Engineering Universiti Putra Malaysia (Internal Examiner)
Mohammad Hamiruce Marhaban, PhD Lecturer Faculty of Engineering Universiti Putra Malaysia (Internal Examiner)
Ir. Sevanathan Narainasamy, PhD Professor Faculty of Computer Science and Information Technology Universiti Malaya (External Examiner)
School of Graduate Studies Universiti Putra Malaysia
Date: 27 MAR 2m
This thesis submitted to the Senate of Universiti Putra Malaysia and has been accepted as fulfilment of the requirement for the degree of Doctor of Philosophy. The members of the Supervisory Committee are as following:
Abdul Rahman Ramli, PhD Associate Professor Faculty of Engineering Universiti Putra Malaysia (Chairman)
Rozi Mahmud, PhD Associate Professor Faculty of Medicine and Health Sciences Universiti Putra Malaysia (Member)
Rahmita Wirza, PhD Lecturer Faculty of Computer Science and Information Technology Universiti Putra Malaysia (Member)
AINI IDERIS, PhD ProfessorIDean School of Graduate Studies Universiti Putra Malsyaia
Date: 1 3 APR 2006

DECLARATION
I hereby declare that the thesis is based on my original work except for quotations and citations, which have been duly acknowledged. I also declare that it has not been previously or concurrently submitted for any other degree at UPM or other institutions.
Date: f / /d /04

TABLE OF CONTENTS
ZDICATION 3STRACT 3STRAK XNOWLEDGEMENTS 'PROVAL ZCLARATION ST OF TABLES ST OF FIGURES ST OF ABBREVIATIONS
CHAPTER
1 INTRODUCTION 1.1 The Brain Segmentation Problem 1.2 Problem Statement 1.3 Motivation 1.4 Scope of the Thesis 1.5 Objective of Thesis 1.6 Thesis Organization
Page . . 11 . . . 111
v vii . . . Vll l
X ... Xl l l
xiv xix
2 LITERATURE REVIEW 12 2.1 MRI Segmentation Challenge 13 2.2 Image Formation in MRI 15 2.3 MRI Enhancement of Collected Data 16
2.3.1 Partial Volume Effect 2 1 2.3.2 Radio Frequency and Magnetic Field Inhomogeneities 22 2.3.3 Imaging Sequence Effects 23 2.3.4 Constructing a Model for the Brain 24 2.3.5 MR Imaging of Brain Tumors 2 5 Manual Labeling of MRI 2 8 MRI Segmentation Background 29 Region MRI Segmentation Definitions 3 0 Multi-Spectral Segmentation 3 1 Snakes 3 3 Balloons 34 Iterative Optimization 34 Hierarchical Clustering 34 Nonparametric Clustering 35 The Sum-of-Squared-Error Criterion 3 6 The Scatter Matrices 3 6 EM (Expectation-Maximization) Segmentation 37 Mathematic Morphology 40 Artificial Neural Networks 42

2.17.1 Match-Based Learning, Error-Based Learning, and Stable Fast Learning
2.17.2 Model of Fuzzy C-mean Method (FCM) 2.17.3 Modified FCM Algorithm (M-FCM) 2.17.4 Neural Classification of Multiple Sclerosis Lesions Validation of MRI Segmentation Visualization Techniques 2.19.1 Volume Visualization 2.19.2 Viewing Algorithms 2.19.3 Surface Rendering 2.19.4 Volume Rendering Conclusion
METHODOLOGY 3.1 Description of Input Data 3.2 Segmenting the Brain Tissue
3.2.1 Removal of Thin Connectors Using Morphological Operations
3.2.2 Gain Correction Fuzzy Connected Techniques 3D Object Based Visualization Techniques 3.4.1 Surface Rendering
3.4.1.1 Ray Casting 3.4.2 Volume Rendering Implementation Conclusion
RESULTS AND DISCUSSION 4.1 Removal of Thin Connector Using Morphological Operation 4.2 Gain Correction with Morphological Filter Delineation 4.3 Fuzzy Connected Techniques for Tumor and Tissue Extraction 4.4 Intensity Evaluation of ROI of T1 and T2 Weighted MRI 4.5 Intensity Evaluation Difficulties of T l Weighted MRI 4.6 Validation of Lesion Identification 4.7 Visualization Brain Views 4.8 Discussion
CONCLUSION 5.1 Suggestion for Future Work
REFERENCES APPENDICES
BIODATA OF THE AUTHOR
LIST OF PUBLICATIONS FROM THIS THESIS
xii
LIST OF TABLES
Table
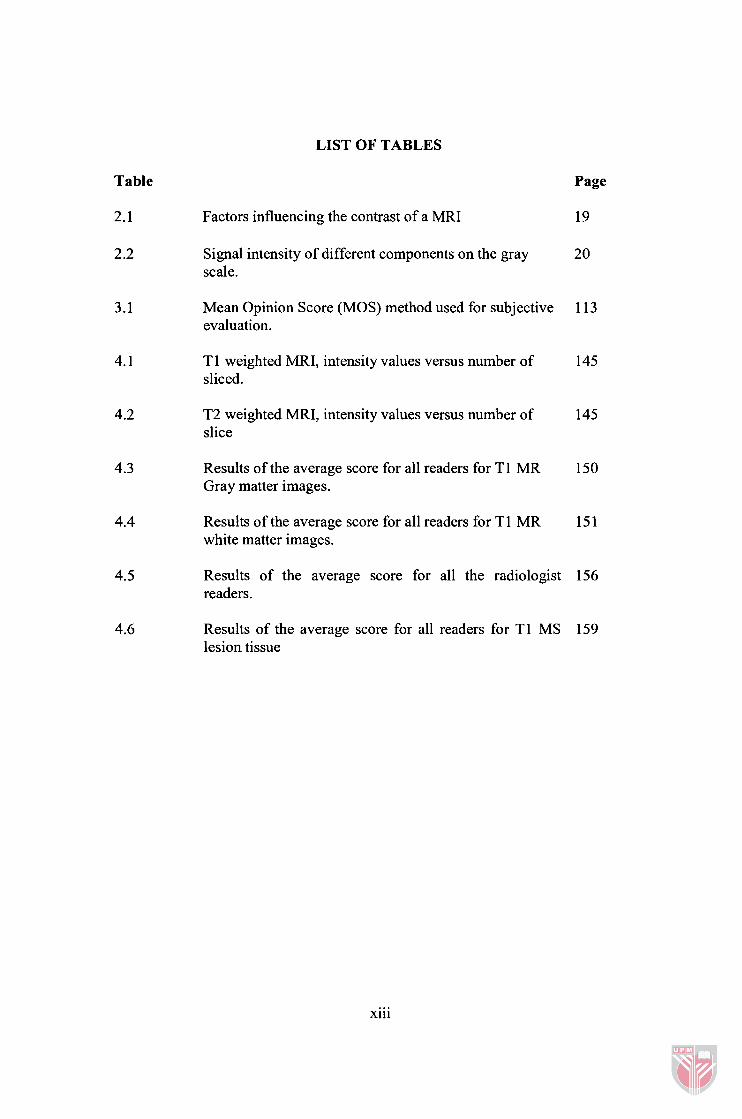
2.1 Factors influencing the contrast of a MRI
Signal intensity of different components on the gray scale.
Page
19
Mean Opinion Score (MOS) method used for subjective 1 13 evaluation.
T 1 weighted MRI, intensity values versus number of sliced.
T2 weighted MRI, intensity values versus number of slice
Results of the average score for all readers for T1 MR Gray matter images.
Results of the average score for all readers for T1 MR white matter images.
Results of the average score for all the radiologist 156 readers.
Results of the average score for all readers for T1 MS 159 lesion tissue
... X l l l

LIST OF FIGURES
Figure Page
Samples of MRI used in the study and their histograms, (a) TI- weighted image, (b) histogram of T1 weighted image intensity distributions, (c) T2- weighted image, (d) histogram of T1 weighted image intensity distributions.
Distribution of different components of brain on T1 and T2 weighted scale from (left to right)
An annotated gradient echo MRI axial slice (air, CSF and cranium are dark in this images)
(Left) T1 -weighted axial view of brain with metastatic disease appears as small, white nodules. (Right) Coronal TI-weighted view of same brain.
T1 weighted images before and after contrast agent injection and a T2 weighted image showing a large gliobalstoma that has developed in the left occipital lobe.
T2 weighted MRI show early stage MS (Left) axial view, (Right) Coronal view
Entropy calculation
Valley seeking algorithms
Intensity distributions for the head and brain in MRI
Illustrate from top to bottom a binarized MR coronal cross section, erosion of the MRI with a circular structuring element of radius 3, dilation of the largest connected component in the eroded image with a circular structuring element of radius 4.
Sample of axial slice T1 weighted brain MRI illustrate the intensity inhomogneity difficulties.
Proposed image segmentation and 3D reconstruction techniques
Sample of three sagittal, axial and coronal slice (from left to right) slice positions for MR brain images Morphological operation using erosion and dilation on grayscale brain image for extracting the central largest component (brain).
Translation operations on Euclidean (left) and digital (right) setting
xiv

3.6 Erosion on Euclidean (left) and digital (right) setting
3.7 Dilation on Euclidean (left) and digital (right) setting
3.8 Grayscale Dilation based on Umbra transform and Surface in digital setting 74 Theoretically, given two signals f and g, dilation off by g can be computed as S[U[fl O U[g]] where 8 is the binary dilation operator.
3.9 Grayscale opening operation shows how it can eliminate the peak of the signal.
3.10 Grayscale closing shows how it can fill the hole of the signal.
3.1 1 Novel grayscale morphological operation, [original + (Opening)-(Closing)]
3.12 Voxel intensity for pure tissue classes is represented as an M-element column 84 vector, and the fraction of pure tissue class k as the possible tissue type of a linear intensity distribution.
3.13 Pure and non-pure tissue based on pixel intensity distribution and probability 87 density function.
3.14 Scattered pure and no-pure tissue
3.15 Topological coupling between neighboring clusters.
3.16 Two Gaussian distribution and linear combination of the Gaussian classes
3.17 The generalized combined Gaussian distribution mixture classes (pure and non- 90 pure).
3.18 Scatter voxel representation for pure and non-pure classes of multiple Gaussian 91 models (a) before the multiple Gaussian distribution, (b) after applying multiple Gaussian.
3.19 Two possible partitions of 12 data points into two clusters
3.20 Figure 3.20: Fuzzy connected segmentation. Sections for MR imaging scene with T2 weighted (a). Sections created with f k z y connected segmentation demonstrate the union of white matter and gray matter tissue (b), the cerebrospinal fluid (c), and the union of multiple sclerosis lesions (d).
3.2 1 Illustrates the principle of the ray casting method used in render surfaces.
3.22 Tri-linear interpolations between voxel centers

3.23 The implemented techniques steps by step from MRI data input to display 2D 1 1 1 MR imaginary segmentation and 3D visualization.
4.1 Axial view of brain surface and tissues surface for (a) healthy (b) and (c) non- 119 healthy patients that show a tumor suspected patient.
4.2 MRI T1 weighted brain image (a) Original axial view, (b) connected regions, 120 (c) morphological operations added with feature extraction performed by using 3x3 blocks, (d) Converting the entropy values to the labeled values by creating binary mask.
4.3 MRI brain extraction of coronal cross section sample 1
4.4 MRI brain extraction of coronal cross section sample 2
4.5 MRI brain extraction of axial cross section sample
4.6 MRI T1 weighted brain image (e) extracting the maximum labeled area scalar, 123 ( f ) Retrieves the morphological operation data.
4.7 Clustering variance of region size N/5, for MRI T1 weighted brain image.
4.8 TI weighted MRI axial slice, (a) original brain image (b) brain image segment 127
4.9 Morphological operations of the blocks of feature set
4.10 Figure 4.10 Histogram of the original image segment listed in (a), and enhanced 128 image segment in (b).
4.1 1 Misclassified clustering output of MRI as (fat, muscle, nervs, and gray and white matters).
4.12 (a) Input test image, (b) output of clustering algorithm
4.13 Brain clustering algorithm involved in brain segmentation (a) original image, 131 (b) histogram normalization on original image, (c) morphological operation filters (erosion and dilation) effects, (d) histogram normalization after erosion and dilation enhancement effects, (e) binary mask, ( f ) retrieves the final brain mask images.
4.14 Output of brain clustering algorithm
4.15 Grayscale morphological operations followed by contour image intensity: (a) 133 original image, (b) grayscale morphological erosion and conditional delineation, (c) original image 3D surface, (d) 3D surface of grayscale erosion and conditional dilation.
xvi
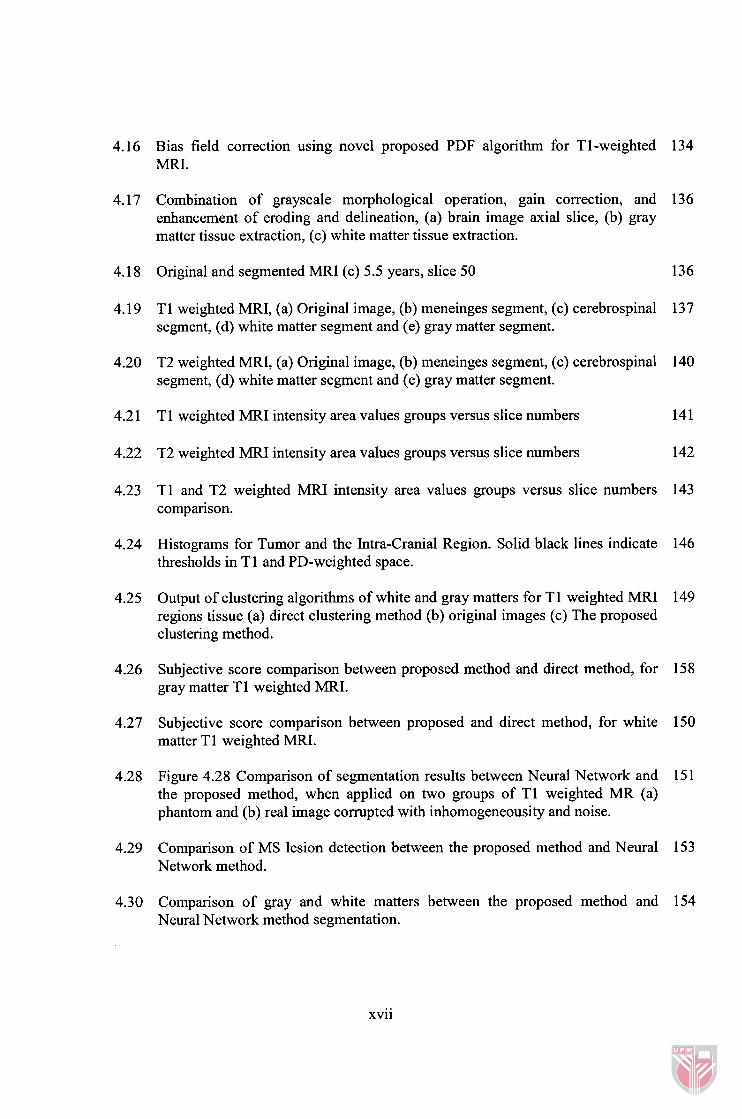
4.16 Bias field correction using novel proposed PDF algorithm for TI-weighted 134 MRI.
4.17 Combination of grayscale morphological operation, gain correction, and 136 enhancement of eroding and delineation, (a) brain image axial slice, (b) gray matter tissue extraction, (c) white matter tissue extraction.
4.18 Original and segmented MRI (c) 5.5 years, slice 50
4.19 T1 weighted MRI, (a) Original image, (b) meneinges segment, (c) cerebrospinal 137 segment, (d) white matter segment and (e) gray matter segment.
4.20 T2 weighted MRI, (a) Original image, (b) meneinges segment, (c) cerebrospinal 140 segment, (d) white matter segment and (e) gray matter segment.
4.21 T1 weighted MRI intensity area values groups versus slice numbers
4.22 T2 weighted MRI intensity area values groups versus slice numbers
4.23 T1 and T2 weighted MRI intensity area values groups versus slice numbers 143 comparison.
4.24 Histograms for Tumor and the Intra-Cranial Region. Solid black lines indicate 146 thresholds in T1 and PD-weighted space.
4.25 Output of clustering algorithms of white and gray matters for T1 weighted MRI 149 regions tissue (a) direct clustering method (b) original images (c) The proposed clustering method.
4.26 Subjective score comparison between proposed method and direct method, for 158 gray matter T1 weighted MRI.
4.27 Subjective score comparison between proposed and direct method, for white 150 matter T 1 weighted MRI.
4.28 Figure 4.28 Comparison of segmentation results between Neural Network and 151 the proposed method, when applied on two groups of T1 weighted MR (a) phantom and (b) real image corrupted with inhomogeneousity and noise.
4.29 Comparison of MS lesion detection between the proposed method and Neural 153 Network method.
4.30 Comparison of gray and white matters between the proposed method and 154 Neural Network method segmentation.
xvii

4.31 Four separate runs contour clustering for T1 weighted MRI having MS, (a) 155 original image, (b) morphological operation, (c) gain correction using probability density function, (d) enhanced with delineation.
4.32 Delineation of gain enhanced MS lesions on two contiguous slices. Same 158 lesions superimposed on the TI-weighted images are shown the last two images in row respectively where lesion highlighted in white color.
4.33 3D visualization for (a) Full brain structure, (b) selected slices 3D view, (c) Z- 160 axis, (d) brain tissue without skin as well as bone, and lastly (e) white matter tumor detection over second MRI slice.
4.34 3D MRI brain tumor reconstruction and detection GUI interface using the 162 proposed clustering model.
xviii
MRI
NMR
CT
PET
FMRI
SPECT
RF
CSF
MPT
KNN
EM
MAP
SE
TSE
FOV
PCMR
PV
MLE
ROI
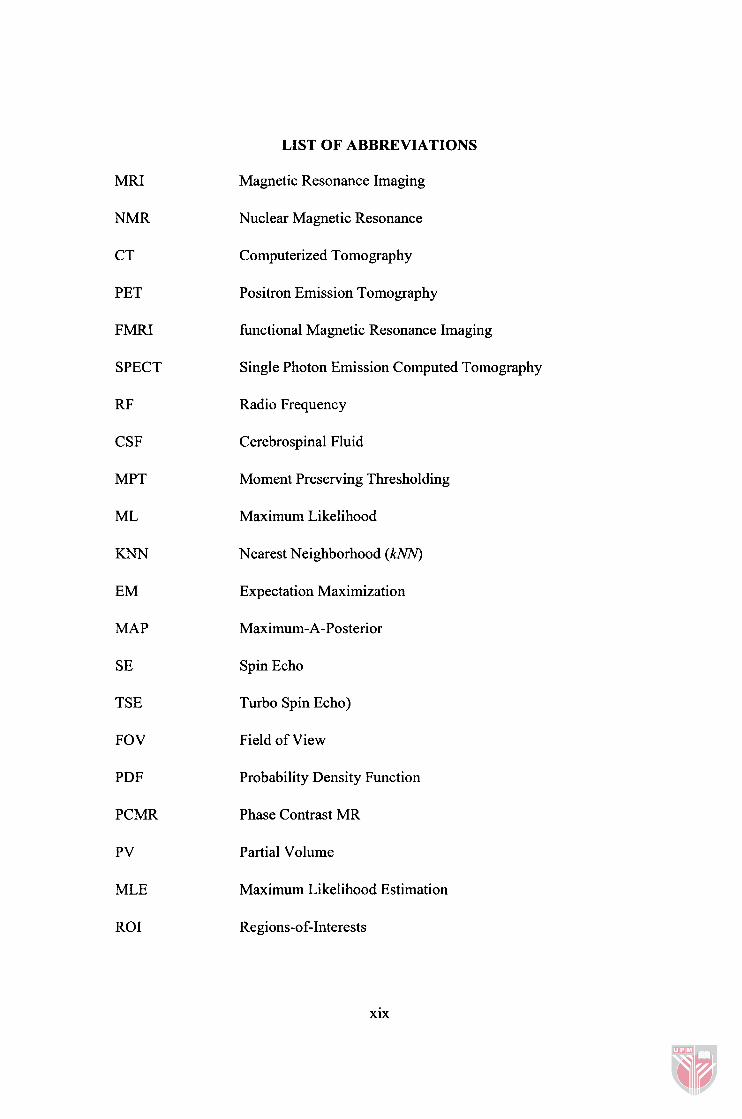
LIST OF ABBREVIATIONS
Magnetic Resonance Imaging
Nuclear Magnetic Resonance
Computerized Tomography
Positron Emission Tomography
hnctional Magnetic Resonance Imaging
Single Photon Emission Computed Tomography
Radio Frequency
Cerebrospinal Fluid
Moment Preserving Thresholding
Maximum Likelihood
Nearest Neighborhood (kNN)
Expectation Maximization
Maximum-A-Posterior
Spin Echo
Turbo Spin Echo)
Field of View
Probability Density Function
Phase Contrast MR
Partial Volume
Maximum Likelihood Estimation
xix

UPMMC
MOS
University Putra Malaysia Medical Center
Mean Opinion Score

CHAPTER I
INTRODUCTION
Recently radiologists can review images of several cross sections of a brain and
abdomen. Some times, they required to make 3D reconstruction in order to make a
clinical diagnosis or to evaluate the results of a therapy on a patient. In recent years,
the interdisciplinary field of medical image processing has produced several
automatic and semi-automatic tools to assist medical practitioners and researchers.
For instance, tools for 3D visualization of anatomy (i.e. reconstruction and
rendering) used in surgical planning as well as educational purposes, are available in
several hospitals and research laboratories.
The validations of automatically anatomical structures models are frequently non-
rigid and exhibit substantial morphological variation from subject to subject. Hence
the task of segmenting these structures from medical images is one of the
difficulties to identify a region in an image with only approximate knowledge of its
shape, size, gray level appearance, and spatial location. Different segmentation
applications are available to add some knowledge in each of these categories, and
the challenge is to combine them to overcome lack of information in one category is
offset by the information in the others. In this thesis, methodology for segmentation
of brain tissue of MRI and MS lesion will be studied. By applying a series of

combined techniques that exploit gray level, topological and spatial information in
the brain images will be discussed.
The specific techniques used are probability of density function segmentation for an
intensity based correction and classification of the data. Where it combined with a
binary and grayscale morphology and connectivity for incorporation of relative
topological information. Four steps have been implemented where the segmentation
of the brain divided base on the brain structure intensity and statistical distribution
of the tissues.
The goals of medical image processing include increased automation of the existing
tools that have proven useful to the medical community yet still require assistance
from experts.
1.1 The Brain Segmentation Problem
Segmentation is an important step in most medical image analysis. In many
classification processes, segmentation forms the first step. The applications of
segmentation include diagnosis, evaluation and treatment of the disease. Since
manual segmentation is tedious, time consuming and subjective, attempts have been
made to automatically classify and quantify tissues, organs, and disease states from
images obtained by various medical imaging modalities.
Segmentation of medical images is a challenging task due to the complexity of the
images and the absence of models of anatomy that fully capture the possible
deformities in each structure. Due to the relative low signal to noise ratios and
inherent artifacts generally present in medical images, their segmentation is
particularly difficult. Because of these problems, even though many algorithms have
been reported, most of them have inconsistent results and limited applications. Thus,
only a few algorithms are being used in practice.
No other imaging modality has witnessed the explosive growth and development
that Magnetic Resonance Imaging (MRI) has over the past 10 years. Once labeled
NMR, for Nuclear Magnetic Resonance imaging, the nuclear term has been
removed due to its negative connotations among the general public. Using a
combination of the inherent magnetic resonance properties of tissue and application
of radio frequency pulses, MRI obtains images by measuring various tissue
characteristics. The result of frequency information is converted, using Fourier
Transform techniques, to spatial intensity information of slices through the body.
These slices can be integrated using advanced computer graphics techniques to
produce 3D views of the imaged tissues.
MRI is extensively used in brain studies, that it is an advanced medical imaging
technique providing rich information about the anatomy of human soft tissue.
Brain tissue is a particularly complex structure, and its segmentation is an important
step for derivation of computerized anatomical atlases, as well as pre-and intra-
operative guidance for therapeutic intervention.
MRI segmentation has been proposed for a number of clinical investigations of
varying complexity. Measurements of tumor volume and its response to therapy
have used image grayscale methods as applied to X-Ray Computerized Tomography
(CT) or simple MRI datasets (Cline et al, 1987). However, the differentiation of
tissues within tumors that have similar MRI characteristics such as edema, necrotic
or scar tissue have proven to be important in the evaluation of response to therapy.
Hence, multi-spectral methods have been proposed (Vannier el at, 199 1 ; Clarke, et
al, 1993). Recently, multi-modality approaches, such as Positron Emission
Tomography (PET) and functional Magnetic Resonance Imaging (fMRI) studies
using radiotracers (Tjuvajev et al, 1994), or contrast materials (Tjuvajev et al, 1994;
Buchbinder et al, 1991) have been suggested to provide superior tumor tissue
specification and to identify active tumor tissue. Hence, segmentation methods need
to include these additional image data sets. In the same context, a similar
progression of segmentation methods is evolving for the planning of surgical
procedures primarily in neurological investigations (Hill et al, 1993; Zhang, 1990;
Cline et al, 1987), surgery simulations (Hu et al, 1990; Kamada et al, 1993) or the
actual implementation of surgery in the operating suite where both normal tissues
and the localization of the lesion or mass needs to be accurately identified.
The methods proposed include grayscale image segmentation and multi-spectral
segmentation for anatomical images with additional recent efforts directed toward
the mapping of functional metrics fMRI to provide locations of important functional
regions of the brain as required for optimal surgical planning.


![Scan Me - portal.unimap.edu.myportal.unimap.edu.my/portal/page/portal30/Lecture... · [Anda menguruskan penghasilan ubat baru di pasaran.Peranan anda adalah:] ... of the pharmaceutical](https://static.fdocuments.us/doc/165x107/6085d1571d9bfe335e46c6be/scan-me-anda-menguruskan-penghasilan-ubat-baru-di-pasaranperanan-anda-adalah.jpg)