
Università degli Studi di Trieste Berton.pdf · Dipartimento di Biochimica, Biofisica e Chimica...
98
Università degli Studi di Trieste PhD program in MOLECULAR MEDICINE PhD Thesis Role of p27 Kip1 in Cell Proliferation and Motility during Oncogenic Transformation Stefania Berton Anno Accademico 2006-2007 (XX ciclo)
Transcript of Università degli Studi di Trieste Berton.pdf · Dipartimento di Biochimica, Biofisica e Chimica...
Università degli Studi di Trieste
PhD program in MOLECULAR MEDICINE
PhD Thesis
Role of p27Kip1 in Cell Proliferation and Motility during Oncogenic Transformation
Stefania Berton
Anno Accademico 2006-2007 (XX ciclo)
UNIVERSITA' DEGLI STUDI DI TRIESTE Sezione Didattica
Ripartizione Segreterie Laureati – Segreteria Dottorati di Ricerca P.le Europa, 1 -I -34127 – TRIESTE
Tel. +39 040 5583182 Fax +39 040 5583250 e-mail [email protected]
UNIVERSITA' DEGLI STUDI DI TRIESTE Sede Amministrativa del Dottorato di Ricerca
CENTRO DI RIFERIMENTO ONCOLOGICO (CRO) DI AVIANO Sede Convenzionata
XX CICLO DEL DOTTORATO DI RICERCA IN MEDICINA MOLECOLARE
ROLE OF p27Kip1 IN CELL PROLIFERATION AND MOTILITY DURING ONCOGENIC TRANSFORMATION
(Settore scientifico-disciplinare MED06)
DOTTORANDA COORDINATORE DEL COLLEGIO DEI DOCENTI
Dr. STEFANIA BERTON CHIAR.MO PROF. GIANNINO DEL SAL UNIVERSITA' DEGLI STUDI DI TRIESTE
SUPERVISORE E RELATORE
Dr. GUSTAVO BALDASSARRE UNIVERSITA' DEGLI STUDI DI TRIESTE
SUPERVISOR Dr. Gustavo Baldassarre, MDDivision of Experimental Oncology 2, National Cancer Institute (CRO)Via Franco Gallini, 2. 33081 Aviano, (PN), ItalyTel.: +39 0434 659759 (Office), +39 0434 659233 (Lab.)Fax: +39 0434 659428email: [email protected]
EXTERNAL SUPERVISOR
Dr. Matthew Fero, Assistant Member,Clinical Research Division, D2-100Fred Hutchinson Cancer Research Center1100 Fairview Ave. N, Seattle, WA 98109Ph: (206) 667-5065 Lab: (206) 667-3333, Fax: (206) 667-1494email: [email protected]
PRESIDENTE EFFETTIVO
Prof.ssa Savoia Anna,Università degli Studi di Trieste, Dip. Scienze Riproduzione e SviluppoIRCCS Burlo Garofano via dell’Istria 65/1, 34137 TRIESTE.
COMPONENTE EFFETTIVO
Prof.ssa Giordano SilviaUniversità degli Studi di TorinoDip. Scienze OncologicheStrada Provinciale 142 di Plobesi, 10060 Candiolo (TO)
COMPONENTE EFFETTIVO
Prof. Brancolini ClaudioUniversità degli Studi di UdineDip. Scienze e Tecniche BiomedichePiazzale Kolbe 4, 33100 UDINE.
PRESIDENTE SUPPLENTE
Prof. Vittur FrancoUniversità degli Studi di TriesteDipartimento di Biochimica, Biofisica e chimica delle Macromolecole (BBCM), P.le Europa 1, 34127 TRIESTE.
COMPONENTE SUPPLENTE
Prof. Gustincich StefanoScuola Superiore di Studi Avanzati di Trieste, Settore di Neurobiologia,Area Science Park SS 14, Km163.5 34012, Basovizza (TS)
COMPONENTE SUPPLENTE
Dott. Massimo LevreroUniversità degli Studi di Roma “La Sapienza”Dip. Medicina Interna, Regina Elena Cancer Institute,via delle Messi d’Oro 156, 00158 ROMA
COORDINATORE DEL
CORSO DI DOTTORATO
Prof. Del Sal GianninoUniversità degli Studi di TriesteDipartimento di Biochimica, Biofisica e Chimica delle Macromolecole (BBCM), LNCIB Area Science ParkPadriciano 99 34012, Basovizza
DIRETTORE DEL DIPARTIMENTO
DI RIFERIMENTO (BBCM)
Prof. Renato GennaroUniversità degli Studi di TriesteDipartimento di Biochimica, Biofisica e Chimica delle Macromolecole (BBCM),P.le Europa 1, 34127 TRIESTE

A chi ogni giorno mi regala un sorriso… A chi da una vita mi sostiene…
A chi mai mi fa mancare un abbraccio…
TABLE OF CONTENTS
ABSTRACT……………………………………………………………………...... 1
Papers included in the Thesis……………………………………………………. 2
Papers not directly included in the Thesis……………………………………..... 3
Abbreviations……………………………………………………………………… 4
INTRODUCTION……………………………………………………………….... 5
1. Cell motility in 3D environment as a cue for metastatic process……………. 5
2. The RAS-GTPases superfamily in actin and tubulin cytoskeleton………….. 12
3. p27Kip1 and cell cycle: a finely designed picture…………………………….. 18
3.1 p27 and tumors: the utility of knock out model.……….………………. 23
3.2 p27 shows a role in cell migration……………………………………... 25
4. The oncogenic v-Src and its normal mammalian counterpart c-Src.………... 28
4.1 Structure and regulation of Src………………………………………… 28
4.2 The v-Src transformed phenotype ……………………………………... 30
4.3 Molecular mechanisms of Src functions……………………………….. 31
4.4 Src is altered in tumors…………………………………………………. 32
AIM OF THE STUDY……………………………………………………………. 34
MATERIAL AND METHODS…………………………………………………... 35
1. Cell cultures and development of stable cell lines…………………………... 35
2. Cell culture in 3D collagen lattices………………………………………….. 35
3. Time-lapse microscopy and quantification of cell migration……………….. 35
4. Transwell-based migration assay……………………………………………. 36
5. Matrigel™ and Collagen I evasion assay…………………………………… 37
6. Cell adhesion assay.…………………………………………………………. 37
7. Preparation of cell lysates, immunoprecipitation and immunoblotting.…….. 38
8. Growth curve, MTT assay and FACS analysis……………………………… 39
9. Kinase assay…………………………..……………………………………... 39
10. Double thymidine block and nocodazole assay.…………………………… 40
11. Anchorage-independent cell growth……………………………………….. 40
12. In vivo analysis………………………………………………………........... 40
13. RNA extraction and RT-PCR from tissue samples ………………………... 41
14. Immunofluorescence analysis……………………………………………... 42
15. Statistical analysis………………………………………………………….. 42
RESULTS …………………………………………………………………………. 43
1. p27-/- v-src transformed cells exhibit higher proliferation potential than p27+/
+ cells……………………………………………………………………… 43
2. p27 expression discriminates between mesenchymal and amoeboid morph-dynamics.………………………………………………………………………. 49
3. The amoeboid motility of p27-/- v-src cells is associated with higher cell speed and invasive ability.……………………………………………………... 51
4. p27 expression in p27-/- v-src cells reduced proliferation and tumor growth.. 57
5. p27T187A but not p271-170 rescued cell shape and motility……………………. 60
6. Migration rate and invasive potential were reduced after p27T187A expression 63
7. H-Ras transformation induces in p27-/- the same proliferative advantage displayed after v-src over-expression…………………………………………... 67
8. p27-/- fibroblasts displayed an increased cell motility also after H-Ras transformation………………………………………………………………….. 72
9. p27-rescue in p27-/- H-Ras transformed cells: a more complicated scenario... 73
DISCUSSION……………………………………………………………………... 77
1. p27 controls cell proliferation in transformed cell cultures and in vivo tumor growth.…………………………………………………………………………. 78
2. p27 influences 3D cellular morph-dynamics and in vivo tumor dissemination…………………………………………………………………… 79
Acknowledgements………………………………………………………………... 83
REFERENCES……………………………………………………………………. 84
ABSTRACT
In many human cancers, p27 down-regulation correlates to a worse prognosis suggesting that
p27 levels could represent an important determinant in cell transformation and cancer
development. Using a mouse model system based on v-src-induced transformation, we show
that p27 absence is linked to a more aggressive phenotype, with an increased cell growth and
motility. In 3D systems, transformed p27null fibroblasts shift from a mesenchymal spindle-
like shape to a more rounded cell morphology, accompanied by amoeboid-like morph-
dynamics, membrane ruffling zones and loss of dendritic-like cell extensions. Importantly, the
acquirement of amoeboid motility in p27-/- transformed cells is associated with a higher ability
to move in and colonize distant sites, in vivo. The reintroduction of different p27 mutants in
transformed p27null cells clearly demonstrates that the control of cell proliferation and
motility by p27 represents two distinct functions, both necessary to fully act as a tumor
suppressor. In fact, while the N-terminus region is necessary to block cell proliferation, p27
controls cell shape and motility through its C-terminus domain.
Interestingly, both the proliferative and motile advantage displayed by v-src-transformed
p27-/- cells highlighted also after transformation with the oncogene H-Ras, suggesting the
existence and the involvement of common pathways responsible for p27 functions.
All together, our results demonstrate that p27 expression is an important determinant both in
the first steps of cell transformation and tumor establishment as well as in the following
progression to tumor dissemination and colonization of distant sites. Moreover, our study
demonstrate for the first time that p27 can affect the motile and the invasive behavior by
driving and regulating cell plasticity that, in turn, influences tumor cell morphology and
movement.
- 1 -
During the Ph.D. course I worked on the role of the CKI p27kip1 in tumor cell growth and
motility. In particular, I studied the role of p27 in cell proliferation, motility and invasion both
in vitro and in mouse models in vivo. These studies led to the understanding that p27 was able
to block not only cancer cell growth but also invasion and metastasis formation. In particular
for the first time it was demonstrated that p27 can affect the motile and the invasive behavior
by driving and regulating cell plasticity that, in turn, influences tumor cell morphology and
movement. In this period, two papers describing most of the data presented in the PhD thesis
are in preparation.
Berton S, Belletti B, Wolf K, Lovat F, Colombatti A, Friedl P, Baldassarre G. ”p27kip1
expression regulates the switch from mesenchymal to amoeboid motility in v-src transformed
fibroblasts”. 2008. In preparation.
Belletti B, Berton S, Pellizzari I, Fabris L, Wolf K, Lovat F, Schiappacassi M, D’Andrea S,
Nicoloso MS, Colombatti A, Friedl P, Baldassarre G. “p27kip1 controls cell morphology and
motility in 3D through the regulation of MT dynamics and vesicular trafficking”. 2008. In
preparation.
- 2 -
Papers not directly included in the Thesis.
Belletti B, Nicoloso MS, Schiappacassi M, Chimienti E, Berton S, Lovat F, Colombatti A,
Baldassarre G. “p27(kip1) functional regulation in human cancer: a potential target for
therapeutic designs”. Curr Med Chem. 2005;12(14):1589-605. Review.
Belletti B, Vaidya JS, D’Andrea S, Entschladen F, Roncadin M, Lovat F, Berton S, Perin T,
Candiani E, Reccanello S, Veronesi A, Canzonieri V, Trovò MG, Zaenker KS, Colombatti A,
Baldassarre G and Massarut S. “Targeted intraoperative radiotherapy impairs the stimulation
of breast cancer cell proliferation and invasion caused by surgical wounding”. Clin Cancer
Res. 2008 Mar 1;14(5):1325-1332.
Belletti B, Nicoloso MS, Schiappacassi M, Berton S, Lovat F, Wolf K, Canzonieri V,
D’Andrea S, Zucchetto A, Friedl P, Colombatti A and Baldassarre G. “Stathmin activity
influences sarcoma cell shape, motility and metastatic potential”. Mol Biol Cell. 2008 Feb 27.
Schiappacassi M, Lovat F, Canzonieri V, Belletti B, Berton S, Santoni A, Vecchione A,
Colombatti A, and Baldassarre G. “p27Kip1 expression inhibits glioblastoma growth,
invasion and tumor-induced neoangiogenesis”. Accepted for publication, 2008. Mol Cancer
Ther.
Biondi C, Ferretti ME, Lunghi L, Medici S, Cervellati F, Abelli L, Adinolfi E, Vesce F,
Bartolini G, Papi A, D’Andrea S, Berton S, Baldassarre G. “Somatostatin as a regulator of
first trimester human trophoblast functions”. Accepted for publication, 2008. Placenta.
- 3 -
ABBREVIATIONS
ECM: extracellular matrix
2D: two-dimension/two-dimensional
3D: three-dimension/three-dimensional
MMPs: matrix metallo-proteinases
EMT: epithelial-mesenchymal transition
MAT: mesenchymal–amoeboid transition
GEFs: guanine nucleotide exchange factors
GAPs: GTPase-activating proteins
MTs: microtubules
MTOC: microtubule organizing centre
LOH: loss of eterozygosity
MEFs: mouse embryo fibroblasts
SFK: Src family kinase
RSV: Rous sarcoma virus
SH: SRC homology (domain)
ts: temperature sensitive
FATIMA: fluorescence-assisted transmigration assay
CAFCA: centrifugal assay for fluorescence-based cell adhesion
HRP: horseradish peroxidase
- 4 -
Introduction
INTRODUCTION
1. Cell motility in 3D environment as a cue for metastatic process.
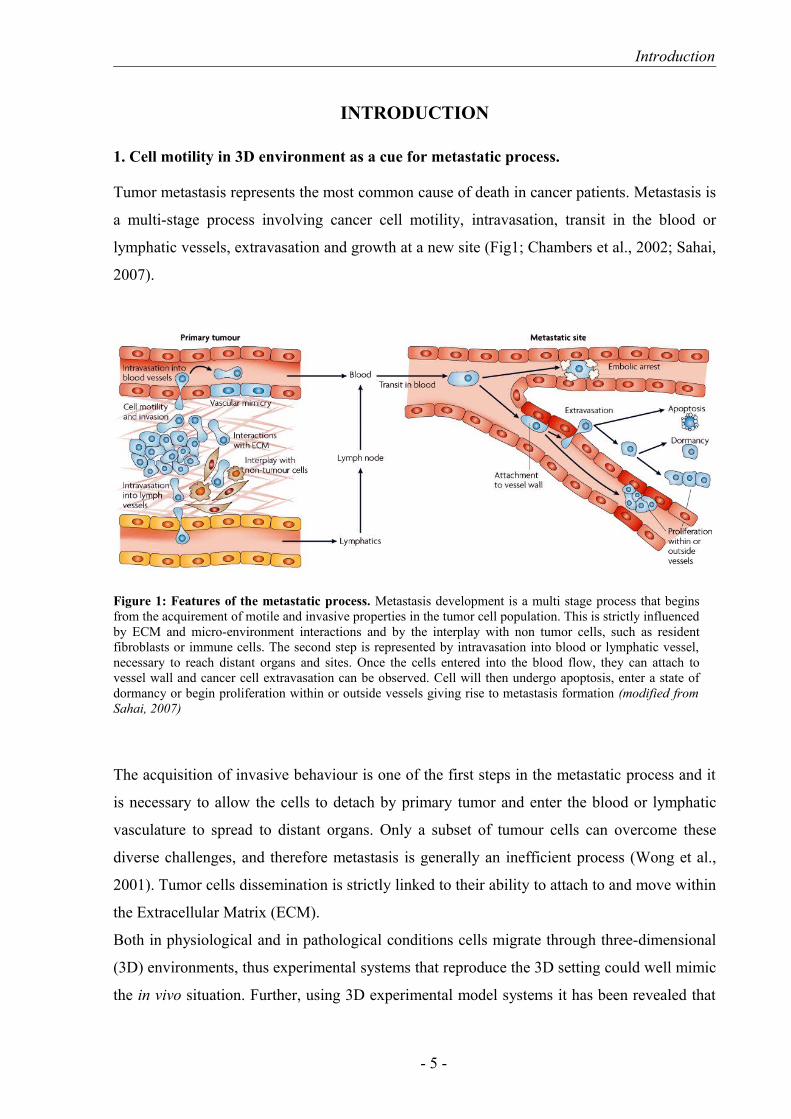
Tumor metastasis represents the most common cause of death in cancer patients. Metastasis is
a multi-stage process involving cancer cell motility, intravasation, transit in the blood or
lymphatic vessels, extravasation and growth at a new site (Fig1; Chambers et al., 2002; Sahai,
2007).
The acquisition of invasive behaviour is one of the first steps in the metastatic process and it
is necessary to allow the cells to detach by primary tumor and enter the blood or lymphatic
vasculature to spread to distant organs. Only a subset of tumour cells can overcome these
diverse challenges, and therefore metastasis is generally an inefficient process (Wong et al.,
2001). Tumor cells dissemination is strictly linked to their ability to attach to and move within
the Extracellular Matrix (ECM).
Both in physiological and in pathological conditions cells migrate through three-dimensional
(3D) environments, thus experimental systems that reproduce the 3D setting could well mimic
the in vivo situation. Further, using 3D experimental model systems it has been revealed that
- 5 -
Figure 1: Features of the metastatic process. Metastasis development is a multi stage process that begins from the acquirement of motile and invasive properties in the tumor cell population. This is strictly influenced by ECM and micro-environment interactions and by the interplay with non tumor cells, such as resident fibroblasts or immune cells. The second step is represented by intravasation into blood or lymphatic vessel, necessary to reach distant organs and sites. Once the cells entered into the blood flow, they can attach to vessel wall and cancer cell extravasation can be observed. Cell will then undergo apoptosis, enter a state of dormancy or begin proliferation within or outside vessels giving rise to metastasis formation (modified from Sahai, 2007)
Introduction
exists a higher complexity in the cell migration and in the adaptation responses in 3D
compared to the classical 2D environment (Friedl and Wolf, 2003; Wolf and Friedl, 2006;
Sahai and Marshall, 2003; Cukierman et al., 2001). For example, the adhesive mechanisms
are quite different in cells that move on the ECM substrates (2D) or through ECM lattices
(3D). In fact, fully mature focal contacts have only been observed in cells that are firmly
attached to 2D substrates, whereas when cells are placed in 3D substrates, integrins tend to
cluster in less assembled focal interactions (Friedl and Wolf, 2003). Moreover, the speed and
character of cell motility in vivo is quite different from that normally observed on 2D
substrates in vitro (Condeelis and Segall, 2003). In vivo in fact, cancer cells move at high
speeds (up to 15µm a minute) and can change shape and direction rapidly, whereas, in 2D
cultures, the more adhesive interactions reduce the migration speed and the possibility to
switch between different migration mechanisms (Condeelis and Segall, 2003).
A five-step model of cell migration in 2D was well established over the past 30 years
(Lauffenburger and Horwitz, 1996) but this model does not perfectly fit with 3D-motility. For
example, when a cell moves in a 3D environments an additional important feature is the
proteolytic remodelling of the ECM (Friedl and Wolf, 2003).
The first step in 3D migration is represented by the protrusion formation at the leading edge.
For this process it is necessary that the actin polymerizes by coupling to the actin-nucleating
ARP2/3 complex and the multifunctional adaptor protein WASP. The ARP2/3-WASP
complex is linked to the inner leaflet of the plasma membrane via clustered phosphoinosites
and here can interact with actin filaments and induce their branching. During protrusion
formation, the integrinic receptors come in contact with ECM ligands and cluster in plasma
membrane. Clustered integrins recruit adaptor and signaling proteins via their intracellular
domains, thereby inducing phosphorylation and dephosphorylation signals into the cell and
stabilizing focal contacts.
The assembly of focal contacts is also directly or indirectly induced by several signaling
pathways, such as PI3K, PKC and RhoGTPases. Before and while focal contacts develop,
actin filaments locally elongated and assemble, through the action of crosslinking proteins,
such as α-actinin and myosin II. The branched actin networks below the inner leaflet of
plasma membrane are termed cortical actin, whereas cytoplasmic bundles and elongated
cables of actin filaments are termed stress fibres. After the focal contact formation, surface
proteases become concentrated near substrate binding sites. Here proteases cleave ECM
components, such as collagen, fibronectin, laminins and pro-MMPs obtaining active soluble
MMPs and inducing a focalized proteolysis of the matrix.
- 6 -
Introduction
The fourth step is represented by cell contraction induced by the actin-myosin II binding.
Active myosin II binds to actin filaments and generates actomyosin contraction that, in turn,
promotes the shortening of cell’s length axis and generates inward tension. By several and not
completely understood mechanisms, cell substrate linkages resolve preferentially in the back
of the cells, whereas the leading edge remains attached to the ECM. Myosin II is activated by
myosin light chain (MCL) that in turn is phosphorylated by the myosin light chain kinase. On
the contrary, the MLC phosphatase, that is inhibited by the Rho effector ROCK,
dephosphorylates MLC thus inhibiting actomyosin contraction. Following focal contact
disassembly, the trailing edge, together with the cell body and the nucleus, slowly glide
forward (Friedl and Wolf, 2003).
In vitro and in vivo observations have shown that tumor cells possess a broad spectrum of
migration mechanisms to infiltrate the surrounding tissue matrices (Friedl and Wolf, 2003;
Friedl 2004). They can disseminate as single cells, referred to as “individual cell migration”
or expand in solid cell strands, sheets, files or clusters, called “collective migration” (Friedl
and Wolf, 2003).
In many tumors, both single cells and collectives are simultaneously present. Whereas
leukemias, lymphomas and most solid stromal tumors, such as sarcomas, disseminate via
single cells, epithelial tumors commonly use collective migration mechanisms (Friedl and
Wolf, 2003).
Between the so called “individual migration”, the mesenchymal and the amoeboid
mechanisms are the most known. Mesenchymal migration, typical of fibroblasts, is mainly
found in cells from connective tissue-tumors, such as fibrosarcomas, gliomas and de-
differentiated epithelial cancers and it is characterized by a fibroblast-like spindle shape (Wolf
et al., 2003; Friedl and Wolf, 2003). It is dependent on integrin-mediated adhesion dynamics
and on proteases focalization and it is characterized by a relative low velocity (Friedl and
Wolf, 2003).
The amoeboid motility is a less adhesive mechanism and it is integrin independent. The
mechanism is propulsive and the cells, highly deformable, are able to circumnavigate, rather
than to degrade, the ECM barriers, moving faster than cells that use mesenchymal strategy
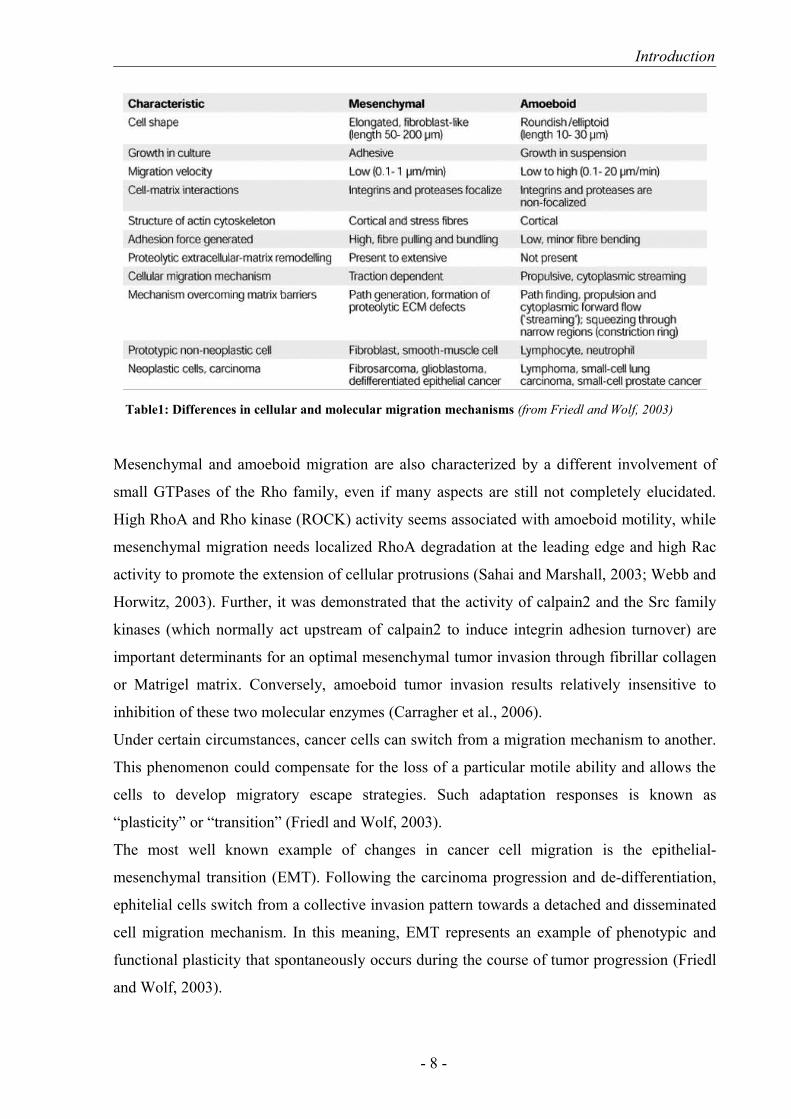
(Table1; Friedl and Wolf, 2003; Wyckoff et al., 2006).
- 7 -
Introduction
Mesenchymal and amoeboid migration are also characterized by a different involvement of
small GTPases of the Rho family, even if many aspects are still not completely elucidated.
High RhoA and Rho kinase (ROCK) activity seems associated with amoeboid motility, while
mesenchymal migration needs localized RhoA degradation at the leading edge and high Rac
activity to promote the extension of cellular protrusions (Sahai and Marshall, 2003; Webb and
Horwitz, 2003). Further, it was demonstrated that the activity of calpain2 and the Src family
kinases (which normally act upstream of calpain2 to induce integrin adhesion turnover) are
important determinants for an optimal mesenchymal tumor invasion through fibrillar collagen
or Matrigel matrix. Conversely, amoeboid tumor invasion results relatively insensitive to
inhibition of these two molecular enzymes (Carragher et al., 2006).
Under certain circumstances, cancer cells can switch from a migration mechanism to another.
This phenomenon could compensate for the loss of a particular motile ability and allows the
cells to develop migratory escape strategies. Such adaptation responses is known as
“plasticity” or “transition” (Friedl and Wolf, 2003).
The most well known example of changes in cancer cell migration is the epithelial-
mesenchymal transition (EMT). Following the carcinoma progression and de-differentiation,
ephitelial cells switch from a collective invasion pattern towards a detached and disseminated
cell migration mechanism. In this meaning, EMT represents an example of phenotypic and
functional plasticity that spontaneously occurs during the course of tumor progression (Friedl
and Wolf, 2003).
- 8 -
Table1: Differences in cellular and molecular migration mechanisms (from Friedl and Wolf, 2003)
Introduction
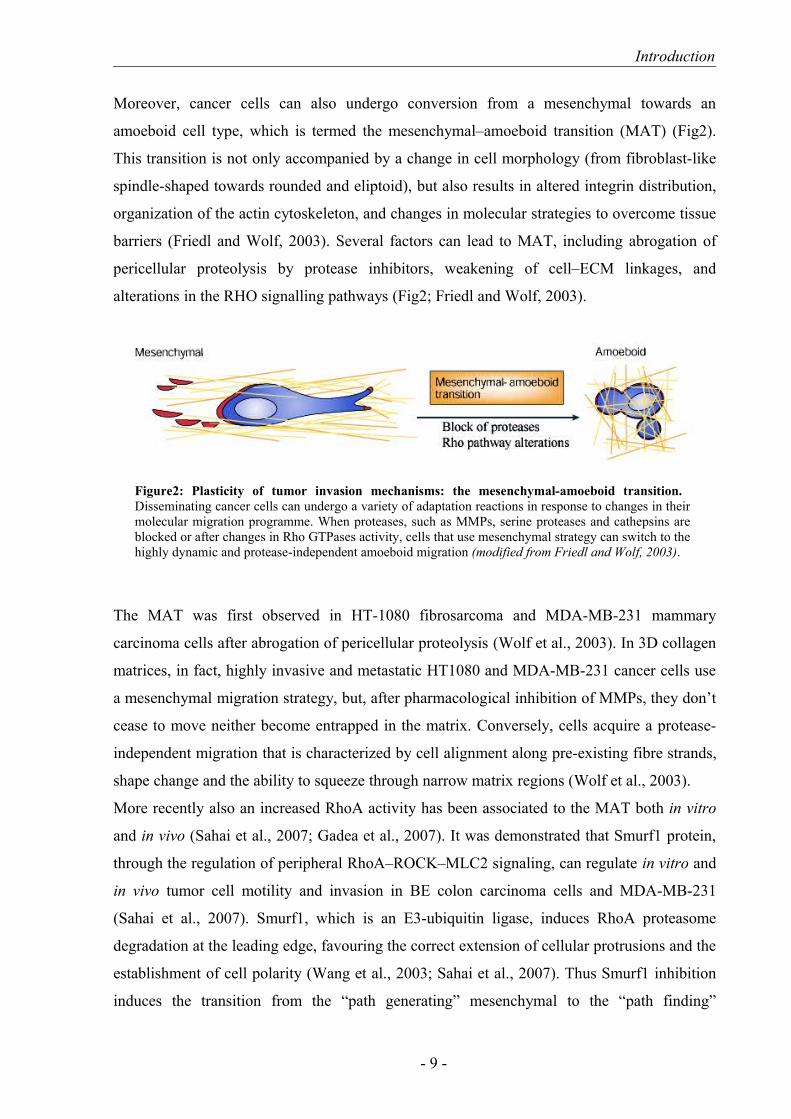
Moreover, cancer cells can also undergo conversion from a mesenchymal towards an
amoeboid cell type, which is termed the mesenchymal–amoeboid transition (MAT) (Fig2).
This transition is not only accompanied by a change in cell morphology (from fibroblast-like
spindle-shaped towards rounded and eliptoid), but also results in altered integrin distribution,
organization of the actin cytoskeleton, and changes in molecular strategies to overcome tissue
barriers (Friedl and Wolf, 2003). Several factors can lead to MAT, including abrogation of
pericellular proteolysis by protease inhibitors, weakening of cell–ECM linkages, and
alterations in the RHO signalling pathways (Fig2; Friedl and Wolf, 2003).
The MAT was first observed in HT-1080 fibrosarcoma and MDA-MB-231 mammary
carcinoma cells after abrogation of pericellular proteolysis (Wolf et al., 2003). In 3D collagen
matrices, in fact, highly invasive and metastatic HT1080 and MDA-MB-231 cancer cells use
a mesenchymal migration strategy, but, after pharmacological inhibition of MMPs, they don’t
cease to move neither become entrapped in the matrix. Conversely, cells acquire a protease-
independent migration that is characterized by cell alignment along pre-existing fibre strands,
shape change and the ability to squeeze through narrow matrix regions (Wolf et al., 2003).
More recently also an increased RhoA activity has been associated to the MAT both in vitro
and in vivo (Sahai et al., 2007; Gadea et al., 2007). It was demonstrated that Smurf1 protein,
through the regulation of peripheral RhoA–ROCK–MLC2 signaling, can regulate in vitro and
in vivo tumor cell motility and invasion in BE colon carcinoma cells and MDA-MB-231
(Sahai et al., 2007). Smurf1, which is an E3-ubiquitin ligase, induces RhoA proteasome
degradation at the leading edge, favouring the correct extension of cellular protrusions and the
establishment of cell polarity (Wang et al., 2003; Sahai et al., 2007). Thus Smurf1 inhibition
induces the transition from the “path generating” mesenchymal to the “path finding”
- 9 -
Figure2: Plasticity of tumor invasion mechanisms: the mesenchymal-amoeboid transition. Disseminating cancer cells can undergo a variety of adaptation reactions in response to changes in their molecular migration programme. When proteases, such as MMPs, serine proteases and cathepsins are blocked or after changes in Rho GTPases activity, cells that use mesenchymal strategy can switch to the highly dynamic and protease-independent amoeboid migration (modified from Friedl and Wolf, 2003).
Introduction
amoeboid migration that is associated to high activities of Rho, ROCK, and MLC2 necessary
to generate cortical contractile forces used for matrix deformation (Sahai et al., 2007). A
recent work has shown also how p53 deficiency in mouse embryonic fibroblasts cultured in
3D matrices induces a switch from an elongated spindle morphology to a markedly spherical
and flexible one associated with highly dynamic membrane blebs (Gadea et al., 2007).
In a recent study, it was shown that the non-metastatic breast cancer cells had a much more
elongated morphology than their metastatic counterparts and, interestingly, conversion of
cells that normally move with an elongated morphology to a more rounded morphology
increased both their ability to move and to enter tumor vessels (Wyckoff et al., 2006). The
authors showed that amoeboid tumor cells generate sufficient actomyosin force to deform
collagen fibers and are able to push through the ECM. This study suggests that tumor cells
with an elongated morphology may need to adopt a more rounded shape, characterized by the
increased cortical acto-myosin contraction, to efficiently intravasate within blood vessels and
withstand greater mechanical stress (Wyckoff et al., 2006).
Following introduction into the circulation, tumor cells rapidly lodge in capillaries (Fig1).
Several different mechanisms for this arrest have been described, although their respective
relevance to human disease is unclear. For example, the arrest can simply be caused by the
large physical size of tumor cells relative to the capillary lumen or alternatively, tumor cells
can actively adhere to endothelia even when not restricted by the diameter of the vessel
(Sahai, 2007). After the attachment of tumor cells to vessel walls, leukocytes may be
recruited, and they are thought to be the first cells to extravasate and cancer cells following
them. It was described that extravasation typically occurs a few hours after attachment to the
vessel wall; cell protrusions and deformation of the nucleus has been observed crossing an
endothelium, implying that it is an active process (Tsuji et al., 2006). It is likely that many of
the same molecular mechanisms required for cell mobilization from the primary tumour will
be used for extravasation, but the actin remodelling and protease function have not been
investigated in detail in this step of metastatic process (Sahai, 2007).
An important factor that determines the cell attachment and extravasation is the shear stress –
the physical force exerted on cells in the vessels as a result of blood flow. Non-metastatic
cells are generally more susceptible to shear stress and they are rapidly sheared and detached.
Of course, the entity of the shear stress can vary considerably between tissues; for example,
blood pressure in liver capillaries is low, whereas it is much higher in muscle, and the
morphologies of tumor cells arresting at these locations are correspondingly different (Sahai,
- 10 -
Introduction
2007). However, a causal link between local blood pressure in the different organs and
metastatic efficiency remains to be clarified.
Once tumor cells arrived at the secondary sites, most of them undergo apoptosis within 24
hours (Fig1; Chambers et al., 2002). Non-metastatic cells are more prone to apoptosis than
their metastatic counterparts, indicating that increased cell survival at this stage of the
metastatic process correlates with overall metastatic capability (Kim et al., 2004). Some
oncogenes that promote cell proliferation and survival in the primary tumor are also shown to
be involved in promoting the survival of cancer cells at metastatic sites. For example, the
overexpression of BCL2 or active HRAS increased the survival and proliferation of cells that
had lodged within lungs and the liver, respectively (Wong et al, 2001). Moreover, various
external factors contribute to reduced tumor cell survival at metastatic sites. For example, the
lack of the normal pro-survival adhesion signals present in the tissue of origin of the cancer
cells may lead to anoikis, the so called apoptosis induced by lack of attachment to a substrate,
or tumor cells may be cleared by immune cells (Sahai, 2007).
Not all the cells that survive at secondary sites will begin to proliferate because not all tumor
cells have the same replicative potential. A new model suggests that only when the so called
'cancer stem cell' (described as a cell that is able to self-renew and to divide giving rise to
another malignant cell) arrives at a secondary site, macroscopic metastasis are formed
(Bjerkvig et al., 2005). In all other cases there will be limited or no proliferation of the
disseminated cells.
Even if many aspects remain to understand, altogether the data collected and the advances in
microscopy and imaging probes allowed us to dissect more in detail the metastatic process,
till now considered a 'black box' research.
- 11 -

Introduction
2. The RAS-GTPases superfamily in actin and tubulin cytoskeleton.
GTPases are molecular switches that control a wide variety of signal transduction pathways in
all eukaryotic cells. They are known mainly for their pivotal role in regulating the actin
cytoskeleton, but in the last decade many studies have revealed their ability to influence also
cell polarity, microtubule dynamics, membrane transport pathways and transcription factor
activity. Being GTPase enzymes, they use a simple biochemical strategy to control complex
cellular processes. They cycle between two conformational states: one bound to GTP ('active'
state), the other bound to GDP ('inactive' state) and they are able to hydrolyze GTP to GDP.
In the 'on' (GTP) state, GTPases recognize target proteins and generate a response until GTP
hydrolysis returns the switch to the 'off' state (Fig3). The RAS-GTPase superfamily is the
most known family of these enzimes and mammalian cells contain several hundred GTPase
switches. These small, monomeric GTPases fall into five major groups: Rho, Ras, Rab, Arf
and Ran (Etienne-Manneville and Hall, 2002).
Rho activity is very carefully regulated and, for this family, in the human genome over 60
activators (GEFs) and over 70 inactivators (GAPs) are expressed. The Rho gene was
identified in 1985, but only in 1992 some observations provided the first insights into the
cellular function of Rho GTPases. Constitutively activated mutants of Rho and Rac (a
member of the family) were found to induce respectively the assembly of contractile actin and
- 12 -
Figure3: The RhoGTPases cycle. They cycle between an active (GTP-bound) and an inactive (GDP-bound) conformation. In the active state, they interact with one of over 60 target proteins (effectors). All Rho GTPases are prenylated at their C terminus, and this is required for function. The cycle is highly regulated by three classes of protein: the guanine nucleotide exchange factors (GEFs), that catalyse nucleotide exchange and mediate activation; the GTPase-activating proteins (GAPs), that stimulate GTP hydrolysis, leading to inactivation; and the guanine nucleotide exchange inhibitors (GDIs) that extract the inactive GTPase from membranes (From Etienne-Manneville and Hall, 2002).
Introduction
myosin filaments (stress fibers) and actin-rich surface protrusions (lamellipodia) when
introduced into fibroblasts (Ridley and Hall, 1992; Ridley et al., 1992; Nobes and Hall, 1999).
Later, Cdc42, another member of this family, was shown to promote the formation of actin-
rich, finger-like membrane extensions (filopodia) (Nobes and Hall, 1995; Nobes and Hall,
1999). The conclusion that Rho, Rac and Cdc42 regulate three separate signal transduction
pathways linking plasma membrane receptors to the assembly of distinct actin structures has
been confirmed in a wide variety of mammalian cell types as well as in yeast, flies and worms
(Etienne-Manneville and Hall, 2002). But how these proteins work together to regulate cell
migration is not so well defined and the picture appears more complicated.
It has become a dogma that Rac and Cdc42 drive protrusion at the front of the cell, whereas
Rho drives contraction at the rear and that there is an antagonistic relationship between Rac
and Rho, with the two proteins suppressing each other's activities and phenotypes (Burridge
and Doughman, 2006). This, however, has turned out to be a too simple model in some cases.
For example, although Rac and Cdc42 promote actin polymerization and extension of the
leading edge of cells, Rho can also promote actin polymerization through its interaction with
the protein mDia, and this can contribute to membrane extension (Higashida et al., 2004). In
particular, a localized RhoA activation is required for the induction of membrane ruffling, the
induction of which is a typical phenotype of activated Rac (Kurokawa and Matsuda, 2005).
Nevertheless, the activity of Rho downstream effector ROCK has been shown to suppress cell
protrusion in a variety of cells (Tsuji et al., 2002; Worthylake and Burridge, 2003; Xu et al.,
2003). Altogether these effectors and their spatial and temporal activation are required for cell
polarization during migration (Ridley et al., 2003). Although localized Rac-induced actin
polymerization is considered the driving force, migration may be facilitated by other cellular
activities. The microtubule cytoskeleton, for example, is highly polarized during migration.
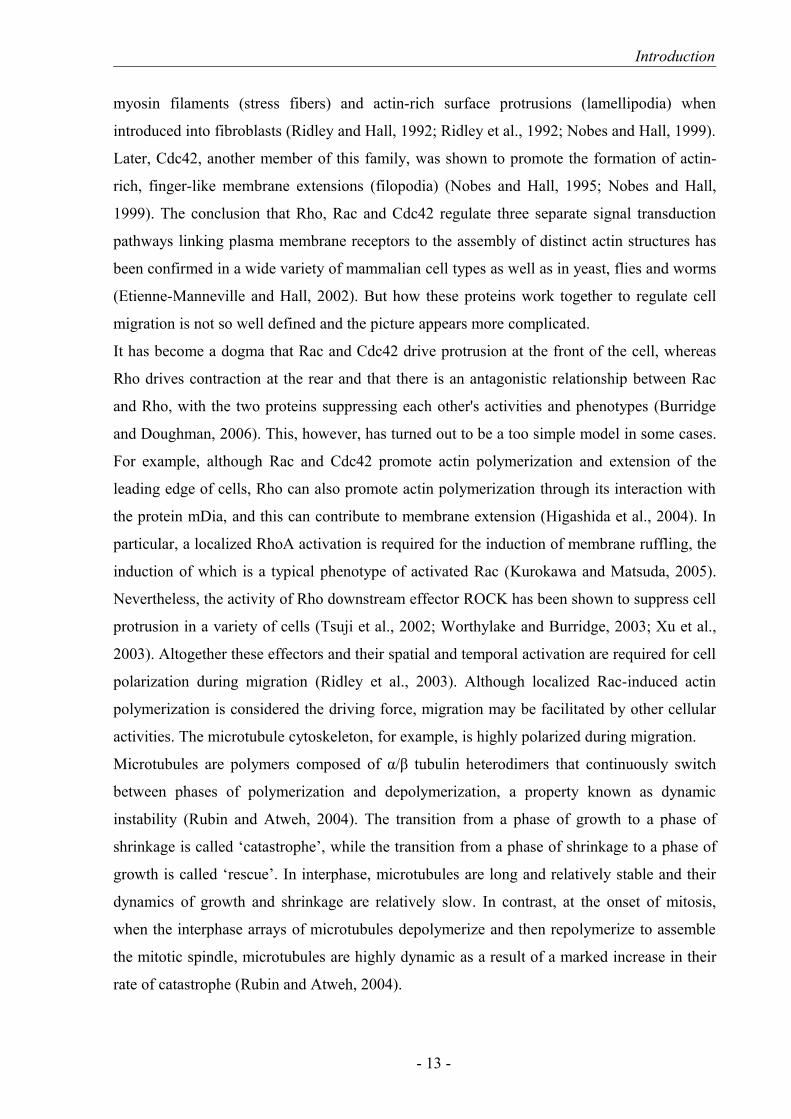
Microtubules are polymers composed of α/β tubulin heterodimers that continuously switch
between phases of polymerization and depolymerization, a property known as dynamic
instability (Rubin and Atweh, 2004). The transition from a phase of growth to a phase of
shrinkage is called ‘catastrophe’, while the transition from a phase of shrinkage to a phase of
growth is called ‘rescue’. In interphase, microtubules are long and relatively stable and their
dynamics of growth and shrinkage are relatively slow. In contrast, at the onset of mitosis,
when the interphase arrays of microtubules depolymerize and then repolymerize to assemble
the mitotic spindle, microtubules are highly dynamic as a result of a marked increase in their
rate of catastrophe (Rubin and Atweh, 2004).
- 13 -

Introduction
The most striking polarization of the microtubule cytoskeleton in many migrating cells is the
orientation of the centrosome, the organizing centre of the radial interphase microtubule
network (MTOC), either in front of or behind the nucleus, with respect to the direction of
migration and respect to the cell type (Fig4; Yvon et al., 2002; Etienne-Manneville and Hall,
2002). Partly as a result of centrosome position, microtubules themselves are polarized and
tend to be aligned along the axis of cell migration; many of them, particularly stabilized,
detyrosinated microtubules, are preferentially oriented with their plus ends facing the leading
edge (Fig4; Wittmann and Waterman-Storer, 2001). Many observations have suggested that
microtubules are required to establish cell polarity during motility. For example fibroblasts
require an intact microtubule cytoskeleton to maintain their polarization and, in neurons, it is
fundamental to axonal growth (Wittmann and Waterman-Storer, 2001).
There are three major hypotheses suggesting how microtubules contribute to cell polarity and
migration. First, microtubules could serve as tracks for directed membrane and organelle
transport towards the leading edge of the cell providing building material for the protruding
lamellipodium. Second, growing microtubules could directly promote lamellipodial protrusion
and stabilize the leading edge to maintain a directed movement of the cell. Third, microtubules
do not regulate protrusion but instead locally regulate adhesion and contraction. But besides
these hypothesis, direct evidence suggests that Rho GTPases might also influence the
organization and dynamics of microtubules and, conversely, a microtubule-dependent
regulation of Rho GTPases exists (Wittmann and Waterman-Storer, 2001). The
- 14 -
Figure4: Microtubule polimerization in a migrative cell. a) In many cell types, the centrosome reorients towards the direction of migration (black arrow). b) Stable, detyrosinatedmicrotubules (in blue) appear to be oriented preferentially in the direction of migration. c) Microtubules exhibit net growth near the leading edge and, d) as a result of actin-dependent retrograde flow (orange arrow) buckle and break in the cell body, creating depolymerising microtubule minus ends and dynamic plus ends. e) Microtubule plus-end-binding proteins that might stabilize growing microtubule ends in the leading edge. The open arrow indicates the direction of cell migration. Thick black lines represent microtubules. Green and red arrows indicate growing or shrinking microtubules, respectively, and plus and minus signs indicate microtubule polarity (from Wittmann and Waterman-Storer, 2001).
Introduction
depolymerization of microtubules induces formation of contractile actin bundles and focal
adhesions and increases the level of GTP-bound RhoA, whereas the induction of microtubule
polymerization leads to lamellipodia formation and activation of Rac1 (Wittmann and
Waterman-Storer, 2001). Moreover, Rho (acting through p160Rho kinase and mDia)
promotes the accumulation of detyrosinated microtubules, Rac (acting through p65Pak)
inactivates the microtubule destabilizing protein, stathmin and Cdc42 regulate the orientation
of the MTOC (Etienne-Manneville and Hall, 2002).
Besides the RhoGTPase family, with RhoA, Rac1 and Cdc42 as most studied members,
RasGTPase proteins and their signaling pathways have been extensively studied. The
RasGTPases were discovered as proteins encoded by retroviral oncogenes that had been
hijacked from the host genome by the Kirsten (K-RAS) and Harvey (H-RAS) rat sarcoma
viruses. The prototypical RAS GTPase proteins -H-RAS, N-RAS and K-RAS- were so
identified as the products of active oncogenes in human tumours, even if they primary
contribute to cell-cycle regulation in normal, non-transformed cells. H-RAS, N-RAS and K-
RAS are highly related proteins, sharing approximately 84% identity, and their divergence
being almost exclusively confined to the carboxyl terminus. Although there might be
differences in the signalling pathways that they activate and in their subcellular distribution,
these three proteins show similar functions. Ras GTPases are targeted to endosomes, Golgi
stacks, the plasma membrane and mitochondria, where they are constitutively associated by
means of farnesylation and palmitoylation (Ten Klooster and Hordijk, 2007).
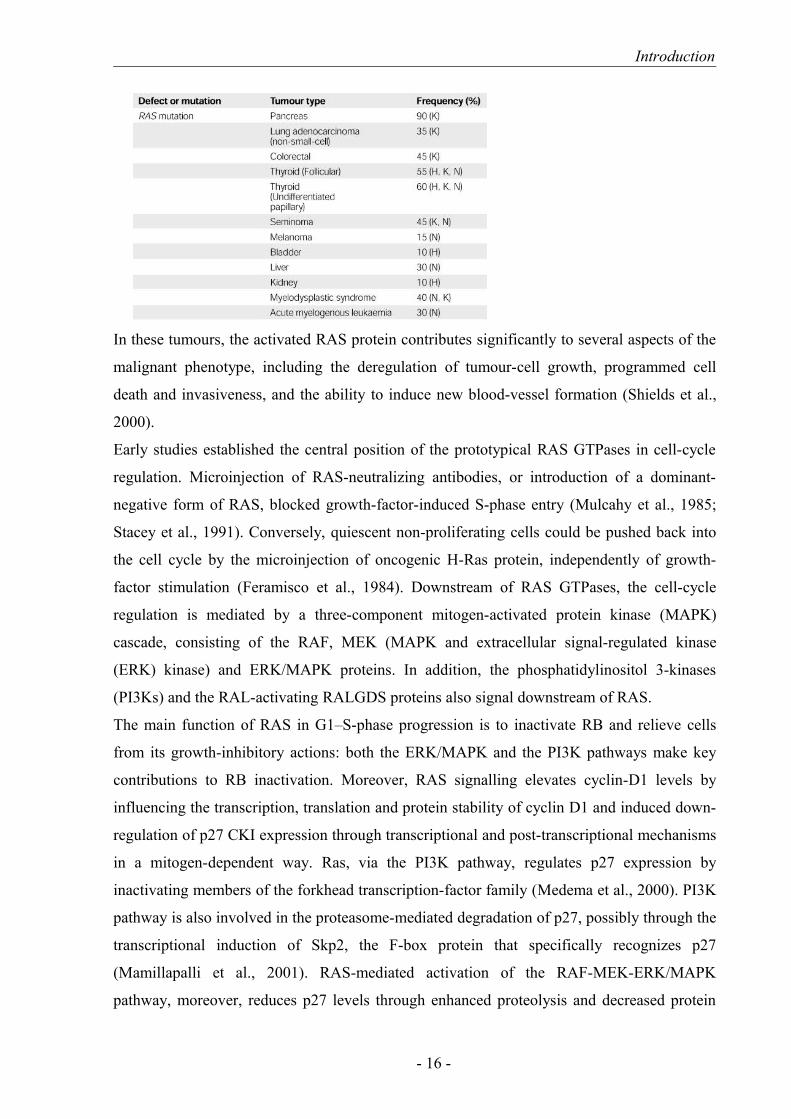
Human tumours very frequently express RAS proteins that have been activated by point
mutation: 30% of all tumours have undergone an activating mutation in one of the RAS
genes, with K-Ras mutations almost ubiquitous in pancreatic tumors and common in lung and
colorectal cancer, H-Ras mutations has been found in bladder and kidney cancer and N-Ras
mutations is common in leukemias (Table2; Bos, 1989; Downward, 2003).
- 15 -
Table2: Activation of RAS pathway in different tumors (Modified from Downward, 2003)
Introduction
In these tumours, the activated RAS protein contributes significantly to several aspects of the
malignant phenotype, including the deregulation of tumour-cell growth, programmed cell
death and invasiveness, and the ability to induce new blood-vessel formation (Shields et al.,
2000).
Early studies established the central position of the prototypical RAS GTPases in cell-cycle
regulation. Microinjection of RAS-neutralizing antibodies, or introduction of a dominant-
negative form of RAS, blocked growth-factor-induced S-phase entry (Mulcahy et al., 1985;
Stacey et al., 1991). Conversely, quiescent non-proliferating cells could be pushed back into
the cell cycle by the microinjection of oncogenic H-Ras protein, independently of growth-
factor stimulation (Feramisco et al., 1984). Downstream of RAS GTPases, the cell-cycle
regulation is mediated by a three-component mitogen-activated protein kinase (MAPK)
cascade, consisting of the RAF, MEK (MAPK and extracellular signal-regulated kinase
(ERK) kinase) and ERK/MAPK proteins. In addition, the phosphatidylinositol 3-kinases
(PI3Ks) and the RAL-activating RALGDS proteins also signal downstream of RAS.
The main function of RAS in G1–S-phase progression is to inactivate RB and relieve cells
from its growth-inhibitory actions: both the ERK/MAPK and the PI3K pathways make key
contributions to RB inactivation. Moreover, RAS signalling elevates cyclin-D1 levels by
influencing the transcription, translation and protein stability of cyclin D1 and induced down-
regulation of p27 CKI expression through transcriptional and post-transcriptional mechanisms
in a mitogen-dependent way. Ras, via the PI3K pathway, regulates p27 expression by
inactivating members of the forkhead transcription-factor family (Medema et al., 2000). PI3K
pathway is also involved in the proteasome-mediated degradation of p27, possibly through the
transcriptional induction of Skp2, the F-box protein that specifically recognizes p27
(Mamillapalli et al., 2001). RAS-mediated activation of the RAF-MEK-ERK/MAPK
pathway, moreover, reduces p27 levels through enhanced proteolysis and decreased protein
- 16 -
Introduction
synthesis both in a CDK2 dependent and independent way (Delmas et al., 2001; Rivard et al.,
1999).
Ras signaling pathways are well known for their involvement in tumour initiation, but less is
known about their contribution to invasion and metastasis. Most models of cell motility place
Ras proteins as upstream regulators of Rho family proteins, controlling the activation states of
RhoA, Rac1, and cdc42 in response to growth factor or cytokine stimulation (Bar-Sagi and
Hall, 2000). For example, K-Ras, more efficiently than H-Ras, is able to stimulate both cell
motility and Rac1 activation in fibroblasts (Walsh and Bar-Sagi, 2001). Activation of a Ras-
Raf-MAPK cascade was also shown to stimulate motility in fibroblasts through calpain
activation and subsequent rear detachment (Glading et al., 2000). In COS cells, Ras mediated
downstream activation of MAP kinase cascade, was shown to be necessary for cell motility, at
least in part through its effects on myosin light chain phosphorylation status (Klemke et al.,
1997; Cheresh et al., 1999). In breast epithelial cells, activated R-Ras was shown to stimulate
migration in a PI3K and PKC dependent way (Keely et al., 1999). Moreover, the Ras-
activated Raf-MEK-ERK pathway can specifically control the expression of integrin receptors
in a variety of human and murine cell lines, inducing changes in cell adhesion and migration
(Woods et al., 2001). Ras can also control cell motility by regulating focal adhesions and
stress fibres formation and it is seems to be involved in the epithelial-mesenchymal transition
in a variety of cell lines (Nobes and Hall, 1999; Huber et al., 2005). Moreover, in some Ras-
transformed cancer cells, including epithelial cancer and transformed fibroblasts, lack of
stress fibre formation has been correlated to the Rac-dependent induction of an amoeboid-like
behaviour, accompanied by high migration velocity both in vitro and in vivo (Friedl and
Wolf, 2003).
As suggested by these data and given the growing number of Ras effectors, it is not surprising
that Ras can regulate cell motility interfering with many downstream pathways and using a
variety of mechanisms, that only in part are elucidated (Oxford and Theodorescu, 2003) .
- 17 -
Introduction
3. p27Kip1 and cell cycle: a finely designed picture.
Besides cell migration and motility, ECM is essential also for cell survival and proliferation.
The cell-ECM contact induces the activation of several signaling pathways that control cell
cycle progression (Giancotti and Ruoslahti, 1999). The mitotic cell cycle is a tightly regulated
universal process that ensure the correct division of one cell into two daughter cells and that
underlies the growth and development of all living organisms. To ensure proper progression
through the cell cycle, cells have developed a series of checkpoints that prevent them from
entering into a new phase until they have successfully completed the previous one (Hartwell
and Weinert, 1989). The progression along the different phases of cell cycle is positively
regulated by the sequential activation of the so called cyclin dependent kinases (CDKs),
evolutionary conserved serine-threonine kinases. CDKs are activated along the different
phases by associating with their regulatory partner member of the cyclin family. Conversely
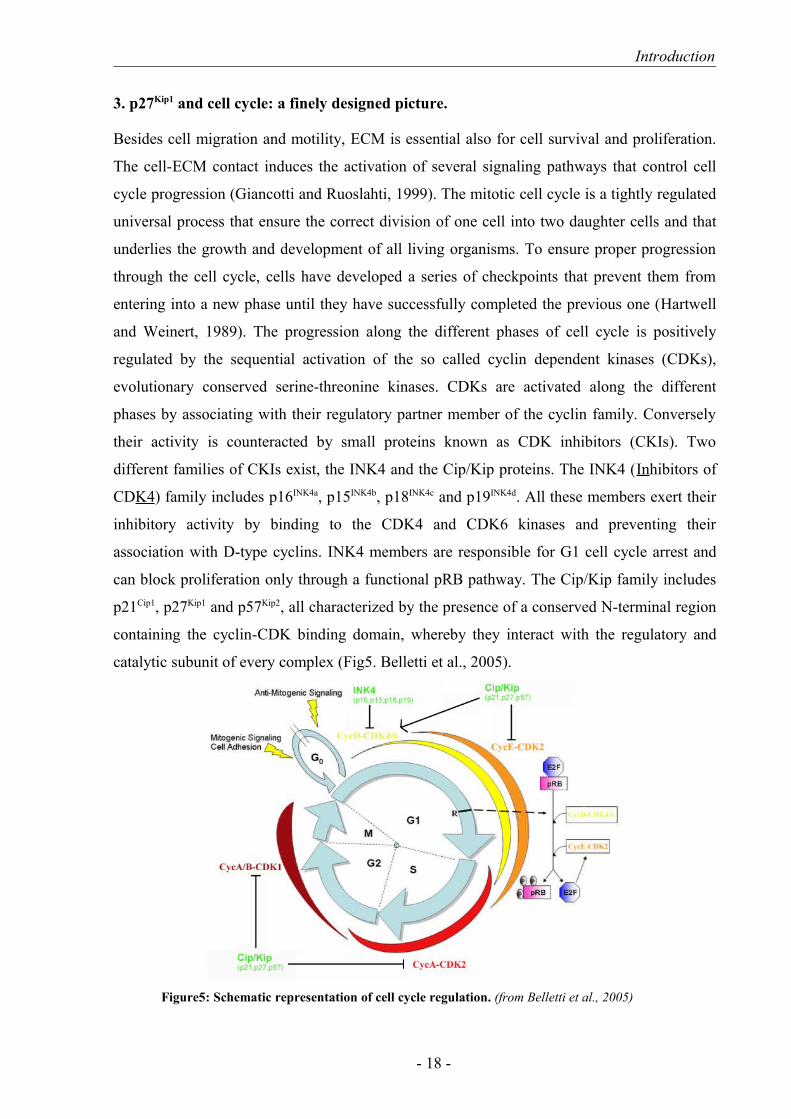
their activity is counteracted by small proteins known as CDK inhibitors (CKIs). Two
different families of CKIs exist, the INK4 and the Cip/Kip proteins. The INK4 (Inhibitors of
CDK4) family includes p16INK4a, p15INK4b, p18INK4c and p19INK4d. All these members exert their
inhibitory activity by binding to the CDK4 and CDK6 kinases and preventing their
association with D-type cyclins. INK4 members are responsible for G1 cell cycle arrest and
can block proliferation only through a functional pRB pathway. The Cip/Kip family includes
p21Cip1, p27Kip1 and p57Kip2, all characterized by the presence of a conserved N-terminal region
containing the cyclin-CDK binding domain, whereby they interact with the regulatory and
catalytic subunit of every complex (Fig5. Belletti et al., 2005).
- 18 -
Figure5: Schematic representation of cell cycle regulation. (from Belletti et al., 2005)
Introduction
Among these inhibitors, p27Kip1 (hereafter p27) is well known for its role in G1-S transition. It
interacts with and inhibits cyclinE-CDK2 and cyclinA-CDK2 activity, blocking cell cycle
progression. The crystal structure of the human p27 bound to the phosphorylated cyclinA-
CDK2 complex revealed that p27 binds the complex as an extended structure interacting with
both cyclin A and Cdk2 (Russo, 1996). On cyclin A, it binds in a groove formed by conserved
cyclin box residues. On Cdk2, it binds and rearranges the amino-terminal lobe and also inserts
into the catalytic cleft, mimicking the ATP (Russo, 1996).
The human p27 gene (CDKN1B) resides in a region of chromosome 12p13 and contains two
coding and one non coding exons. The murine cdkn1b gene is located in a syntenic region on
distal chromosome 6 and is similar to the human p27 gene. The cDNA sequence is more than
90% homologous to the human p27 cDNA (Philipp-Staheli et al., 2001). p27 sequence
contains 198 aminoacids (197 in mouse) and presents some regulatory domains. From the
residue 153 to 169 is present a nuclear localization signals, while a leucine rich nuclear export
signal, responsible for p27 shuttling from nucleus to cytoplasm, is localized between
aminoacids 32-45.
p27 expression in normal cultured cells is finely regulated and high levels of the protein
induce the arrest in G1 phase and cells accumulation in G0. p27 levels increase in response to
various stimuli that inhibit cell proliferation, such as cell-cell contact, loss of adhesion to
extracellular matrix, induction of differentiation or TGFβ, INF-γ, c-AMP, rapamicin and
lovastatin treatments (Belletti et al., 2005). The exit from the quiescent status requires the
down-regulation of p27, which in turn results in CDKs activation. The enforced expression of
p27 in tumor cells could also result in apoptotic cell death, probably due to the conflicting
signals between proliferation and block of cell cycle progression.
p27 is mainly regulated at post-translational level. In contrast, p27 mRNA is usually constant
through out the whole cell cycle. p27 could be regulated by sequestering into higher order
complexes with cyclinD-CDK4 after activation of the MAPK pathway, that promotes cyclin
D transcription (Cheng et al., 1998; Susaki et al., 2007). Also the proto-oncogene c-Myc, by
increasing the expression of cyclin D and cyclin E, is responsible for p27 sequestration and
this molecular event appears essential for Myc-induced cell cycle progression (Vlach et al.,
1996).
Moreover, p27 can be displaced in the cytoplasm, with consequent progression in cell cycle,
after activation of the Raf-Mek-Erk and PI3K-Akt pathways in a phosphorylation-dependent
manner (described afterwards in detail. Philipp-Staheli et al., 2001).
- 19 -

Introduction
But the most important way for p27 regulation seems to be its ubiquitin-proteasome
dependent degradation (Fig6).
p27 proteolysis is cytoplasmatic and phosphorylation-independent in early G1, but it is
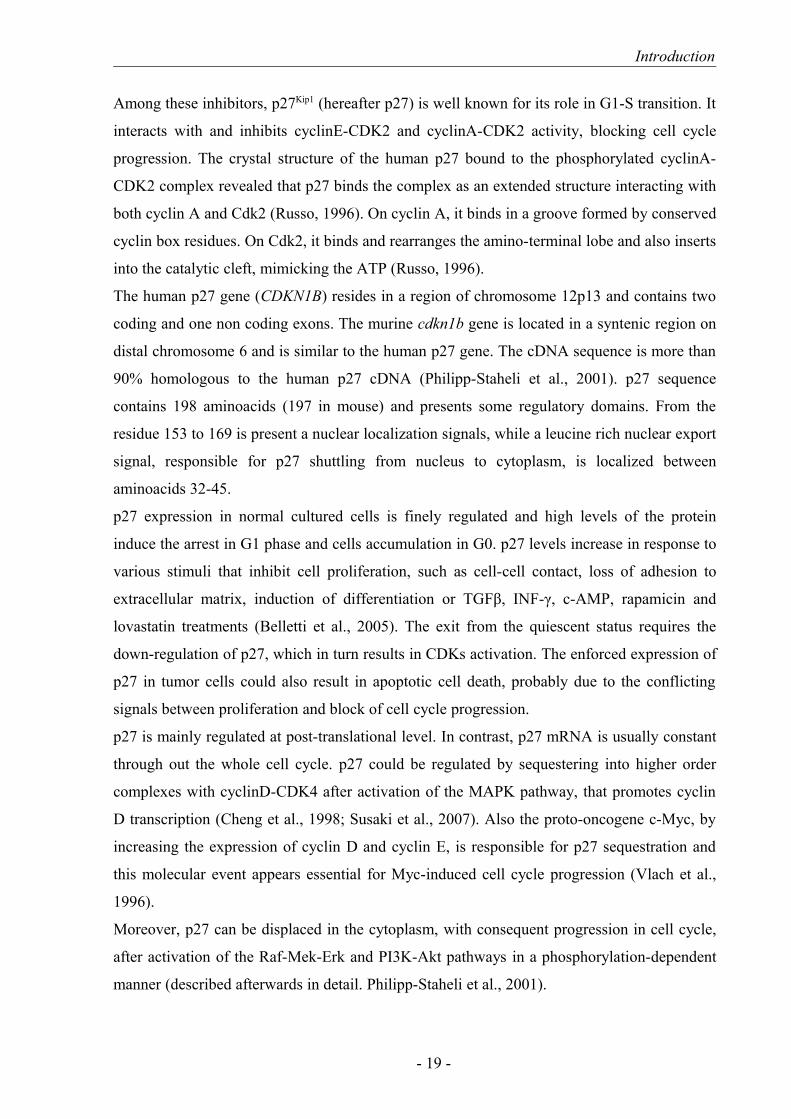
nuclear and phosphorylation-dependent in late S-G2 phase (Fig7). The G0-G1 degradation is
mediated by the KPC complex (Kip1 ubiquitination-promoting complex), consisting of KPC1
and KPC2 proteins, that interacts with and ubiquitinates p27 in the cytoplasm (Kamura et al.,
2004; Kotoshiba et al., 2005). The nuclear export of p27 by CRM1 is necessary for KPC-
mediated proteolysis and the recognition by CRM1 needs p27 phosphorylation on Ser10
(Kamura et al., 2004; Boehm et al., 2002; Ishida et al., 2002). Recently a role of cyclin D2 in
p27 translocation from the nucleus into the cytoplasm for its KPC-dependent degradation was
demonstrated (Susaki et al., 2007)
Instead, the S-G2 degradation is mediated by an SCF ubiquitin ligase, composed by Skp1, a
cullin subunit called CulI, Rbx1/Roc1 and the F-box protein Skp2 that specifically recognizes
p27 (Hara et al., 2001; Zeng et al., 2002). Skp2 binds to p27 and promotes its degradation
- 20 -
Figure6: Intracellular pathways known to regulate p27 expression and function. (From Belletti et al., 2005)
Introduction
only when p27 is phosphorylated on the conserved Thr187 by cyclinE-CDK2 or cyclinA-
CDK2 complexes (Montagnoli et al., 1999; Carrano et al., 1999).
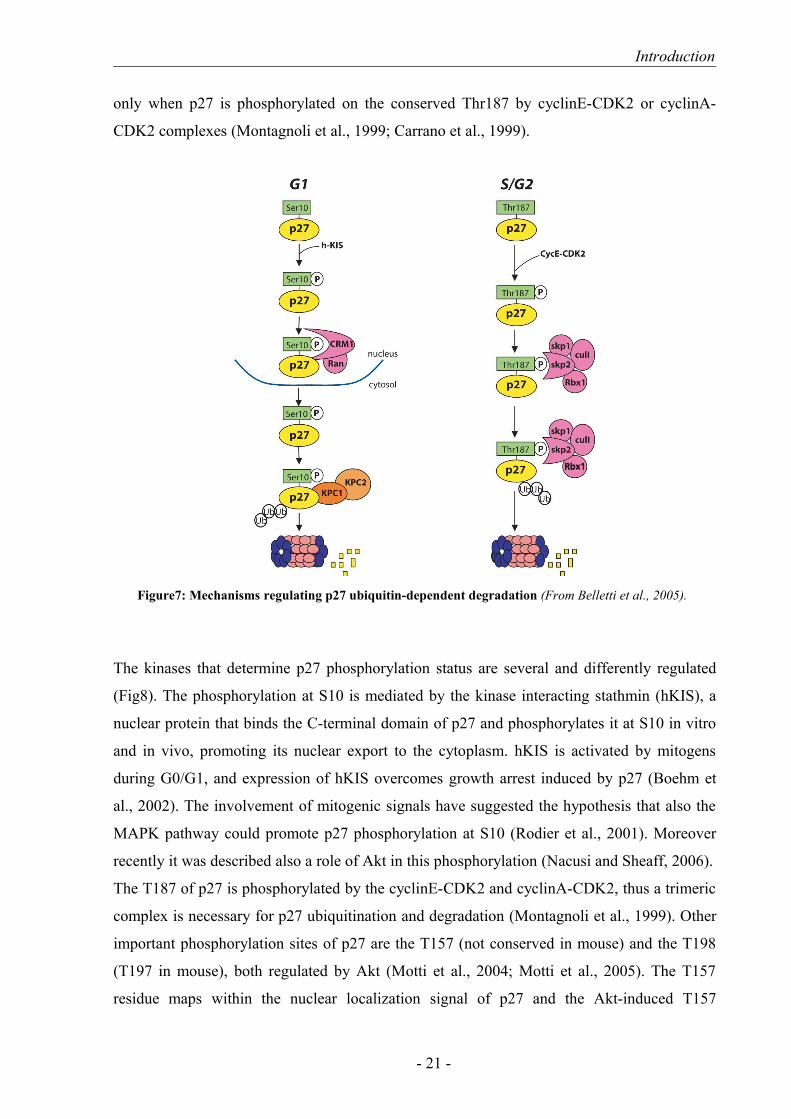
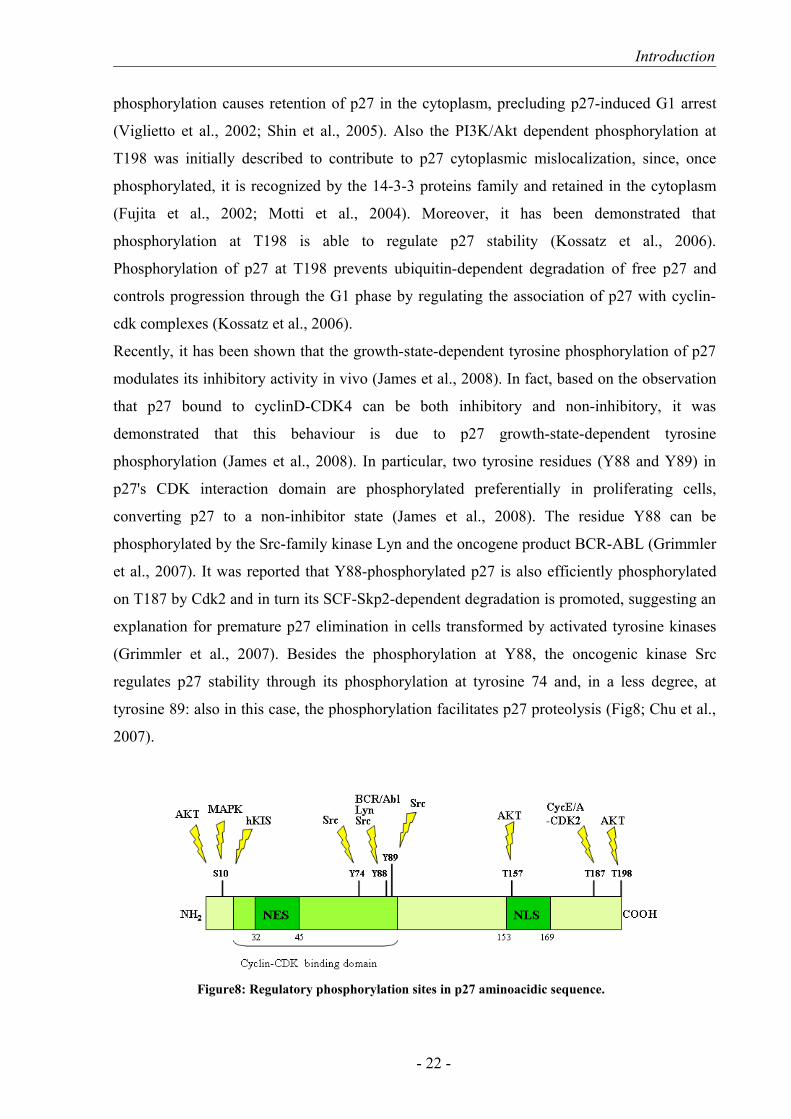
The kinases that determine p27 phosphorylation status are several and differently regulated
(Fig8). The phosphorylation at S10 is mediated by the kinase interacting stathmin (hKIS), a
nuclear protein that binds the C-terminal domain of p27 and phosphorylates it at S10 in vitro
and in vivo, promoting its nuclear export to the cytoplasm. hKIS is activated by mitogens
during G0/G1, and expression of hKIS overcomes growth arrest induced by p27 (Boehm et
al., 2002). The involvement of mitogenic signals have suggested the hypothesis that also the
MAPK pathway could promote p27 phosphorylation at S10 (Rodier et al., 2001). Moreover
recently it was described also a role of Akt in this phosphorylation (Nacusi and Sheaff, 2006).
The T187 of p27 is phosphorylated by the cyclinE-CDK2 and cyclinA-CDK2, thus a trimeric
complex is necessary for p27 ubiquitination and degradation (Montagnoli et al., 1999). Other
important phosphorylation sites of p27 are the T157 (not conserved in mouse) and the T198
(T197 in mouse), both regulated by Akt (Motti et al., 2004; Motti et al., 2005). The T157
residue maps within the nuclear localization signal of p27 and the Akt-induced T157
- 21 -
Figure7: Mechanisms regulating p27 ubiquitin-dependent degradation (From Belletti et al., 2005).
Introduction
phosphorylation causes retention of p27 in the cytoplasm, precluding p27-induced G1 arrest
(Viglietto et al., 2002; Shin et al., 2005). Also the PI3K/Akt dependent phosphorylation at
T198 was initially described to contribute to p27 cytoplasmic mislocalization, since, once
phosphorylated, it is recognized by the 14-3-3 proteins family and retained in the cytoplasm
(Fujita et al., 2002; Motti et al., 2004). Moreover, it has been demonstrated that
phosphorylation at T198 is able to regulate p27 stability (Kossatz et al., 2006).
Phosphorylation of p27 at T198 prevents ubiquitin-dependent degradation of free p27 and
controls progression through the G1 phase by regulating the association of p27 with cyclin-
cdk complexes (Kossatz et al., 2006).
Recently, it has been shown that the growth-state-dependent tyrosine phosphorylation of p27
modulates its inhibitory activity in vivo (James et al., 2008). In fact, based on the observation
that p27 bound to cyclinD-CDK4 can be both inhibitory and non-inhibitory, it was
demonstrated that this behaviour is due to p27 growth-state-dependent tyrosine
phosphorylation (James et al., 2008). In particular, two tyrosine residues (Y88 and Y89) in
p27's CDK interaction domain are phosphorylated preferentially in proliferating cells,
converting p27 to a non-inhibitor state (James et al., 2008). The residue Y88 can be
phosphorylated by the Src-family kinase Lyn and the oncogene product BCR-ABL (Grimmler
et al., 2007). It was reported that Y88-phosphorylated p27 is also efficiently phosphorylated
on T187 by Cdk2 and in turn its SCF-Skp2-dependent degradation is promoted, suggesting an
explanation for premature p27 elimination in cells transformed by activated tyrosine kinases
(Grimmler et al., 2007). Besides the phosphorylation at Y88, the oncogenic kinase Src
regulates p27 stability through its phosphorylation at tyrosine 74 and, in a less degree, at
tyrosine 89: also in this case, the phosphorylation facilitates p27 proteolysis (Fig8; Chu et al.,
2007).
- 22 -
Figure8: Regulatory phosphorylation sites in p27 aminoacidic sequence.

Introduction
3.1. p27 and tumors: the utility of knock out model.
Even though p27 has shown a new "dark side" displaying oncogenic functions in some less
specialized cell types and in some circumstances (Sicinski et al., 2007; Besson et al., 2007;
Besson et al., 2004; Denicourt et al., 2007), p27 is well known to be a tumor suppressor gene.
But, while prototypic tumor suppressor genes follow the Knutson’s “two-hit” criterion, p27 is
haplo-insufficient for tumor suppression (Fero et al., 1998). Animals lacking one copy of
Cdkn1b gene develop tumors spontaneously late in life and are highly sensitive to tumor
induction when challenged with carcinogens, displaying increased tumor frequency and
decreased latency (Fero et al., 1998). Thus, a reduced dosage of p27, rather than its absolute
absence, can contribute to cancer susceptibility. Nullizygous animals for p27 display a further
increase in tumor rate and this observation lead many to defined p27 as a “dosage-dependent”
tumor suppressor gene.
The use of mouse models resulted extremely useful to address the question of whether p27 is
a causal or a secondary effect of tumor development. p27-/- mice display increased body size
of about 20-30% respect to wild-type littermates, due to increased cellularity of tissues,
demonstrating a role of p27 in the control of tissue growth also in vivo (Fig9. Fero et al.,
1996; Nakayama et al., 1996; Kiyokawa et al., 1996).
Accordingly with the dosage-dependency of tumor suppressive potential of p27, heterozygous
mice showed about 50% of p27 protein expression and an intermediate phenotype in terms of
weight. This suggests that also in vivo the control of proliferation and body size is extremely
sensitive to the levels of p27 protein. Further, p27-/- mice are prone to spontaneous pituitary
adenomas and develop multiple organ hyperplasia. Challenging with radiation or chemical
carcinogens, p27-/- mice are susceptible to developing tumors in multiple tissues, including
- 23 -
Figure9: p27wt versus p27ko mouse. p27ko mice display an increase in body size of about 20/30% compared to wild type mice (From Philipp-Staheli et al., 2001).
Introduction
adenomas and adenocarcinomas of the intestine and lung, granulosa cell tumors of the ovary
and uterine tumors. In addition to a reduced tumor free survival, p27-heterozygous and null
mice show increased tumor multiplicity in different sites.
p27 deficiency enhances the malignancy and frequency of tumor formation in cooperation
with several oncogenic stimuli, pointing to p27 as a major rate-limiting factor for tumor
progression. For example, about 50% of PTEN+/- mice develop prostatic intraepithelial
neoplasia after 9 months from birth, but concomitant inactivation of p27 (that normally is not
associated to prostatic cancer) in PTEN+/- mice leads to prostate adenocarcinoma with 100%
of penetrance within 3 months from birth (Di Cristofano et al., 2001). Similar results are
obtained when p27 deficiency is combined with loss of eterozygosity (LOH) for pRB locus,
resulting in developing of pituitary adenocarcinoma and high grade of thyroid C cell
carcinoma (Park et al., 1999). Moreover, Myc over-expression results in decreased mice
survival when associated to p27 deficiency and the absence of p27 in INK4a/ARF null
background result in increased lethality, higher incidence of lymphomas and appearance of
metastasis (Martin-Caballero et al., 2004). p27 results also as adjuvant and promoter of p53-
driven tumorigenesis, since their concomitant absence in mice induces an accelerated tumor
development, increased morbidity and the detection of tumor types not observable in p53
single mutants (Philipp-Staheli et al., 2004).
In colon, p27 null background combined with ApcMin/+ accelerate tumor development and
increase tumor malignancy; loss of the CBP transcription factor in thymocytes, combined to
p27+/- background, results in the development of T-cell lymphoma already after 13 weeks
(compared to a 24 latency period in p27wt background) (Philipp-Staheli et al., 2002; Kang-
Decker et al., 2004).
Together these data demonstrate that at least in mice, p27 functionally interacts and
collaborates with several tumor suppressor genes and oncogenes to reduce the malignant
phenotype, supporting the idea that p27 represents a nodal point in tumor suppression. This
could, at least in part, explains why loss of p27 is so often associated with tumor development
and progression in human cancers.
An increased body of literature reports frequent p27 functional inactivation in human cancers.
LOH for p27 is not uncommon in human malignancies, but silencing or mutations of the
remaining allele are very rare, which is consistent with the notion that p27 loss in tumors is
mainly due to an accelerated proteolysis (Belletti et al., 2005). Accordingly, a plethora of
studies shows the involvement of p27 protein reduction or loss in many tumors, such as
carcinomas of the colon, breast, prostate, lung and ovary as well as brain tumors, lymphomas
- 24 -
Introduction
and soft tissue sarcomas (Belletti et al., 2005). Multivariate analyses show that reduced p27
levels are of independent prognostic significance for many of these tumors (Belletti et al.,
2005). Other observations suggest that p27 in tumors can also be down-regulated by different
mechanisms, as its cytoplasmic delocalization (Belletti et al., 2005).
3.2. p27 shows a role in cell migration.
Among the non-cell cycle dependent functions of p27, regulation of cell motility is one of the
most controversial. This function requires the cytoplasmic localization of p27 so results
dependent on all those mechanisms that rule p27 shuttling from nucleus to cytoplasm. Many
authors have demonstrated a role of p27 in cell migration, but the conclusions appear at least
apparently in contrast. It was shown that p27 stimulates the migration in cortical neurons, in
hepatocellular carcinoma cells and in mouse embryonic fibroblasts where it induces
rearrangements of the actin cytoskeleton (Kawauchi et al., 2006; Itoh et al., 2007; McAllister
et al., 2003; Besson et al., 2004). Conversely p27 seems to reduces cell migration in
endothelial cells, vascular smooth muscle cells, mesangial cells, sarcoma tumor cells and
normal mouse fibroblasts (Daniel et al., 2004; Goukassian et al., 2001; Sun et al., 2001;
Baldassarre et al., 2005).
In particular, we have demonstrated that p27 expression inhibits the migration of HT-1080
fibrosarcoma cells and murine fibroblasts and that the migration-inhibitory activity of p27 is
localized to the C-terminal 28 amino acids of the protein (Baldassarre et al., 2005). Using a
yeast two-hybrid assay, we identified stathmin as a partner protein that binds to p27 C-
terminus and confirmed their in vivo interactions in HT-1080 sarcoma cells, pork brain,
mouse fetal brain and normal mouse fibroblasts adherent to fibronectin.
Stathmin, also referred to as Op18, is a ubiquitous cytosolic phosphoprotein highly conserved
among vertebrates: human and Xenopus stathmin are 79% identical (Maucuer et al., 1993).
The 149 amino acid protein plays an important role in regulating microtubule dynamics in
both interphase and mitosis and so it is crucial for maintenance of cell shape, intracellular
transport, cell motility and cell division. As described previously, microtubules continuously
switch between phases of polymerization and depolymerization, a property known as dynamic
instability (Rubin and Atweh, 2004).
Microtubule dynamics are regulated by several families of proteins, including microtubule-
associated proteins (MAPs) and microtubule-destabilizing proteins. Stathmin is a major
microtubule-destabilizing protein that promotes microtubule depolymerization by two distinct
mechanisms (Fig10; Howell et al., 1999; Rubin and Atweh, 2004). The first is a catastrophe-
- 25 -

Introduction
promoting microtubule-depolymerization activity that requires the N-terminal region of the
stathmin molecule and is necessary for the regulation of the mitotic spindle. The second is a
tubulin-sequestering activity that requires the C-terminal region and is mainly important in the
regulation of microtubule dynamics during interphase (Howell et al., 1999; Rubin and Atweh,
2004).
Stathmin is negatively regulated by phosphorylation at four serine residues, Ser16, Ser25,
Ser38 and Ser63 in response to a number of signals, including those necessary for cell
proliferation, differentiation and progression through the cell cycle (Cassimeris, 2002). In
particular, stathmin phosphorylation seems to be necessary for the cells to enter mitosis.
Several studies have demonstrated that phosphorylation at Ser16 and Ser63 inhibit stathmin to
a greater extent than phosphorylations at Ser25 and Ser38 and probably, multiple
phosphorylations of stathmin serve to amplify the inhibition of this protein's activity
(Cassimeris, 2002).
Besides its role in mitotic spindle formation, many literature data support the pro-migrative
role of stathmin. For example, the RNA interference inactivation of Drosophila stathmin
expression resulted in germ cell migration arrest and induced important anomalies in nervous
system development (Ozon et al., 2002). Stathmin expression is also required in border cells
of the Drosophila ovary for normal migration (Borghese et al., 2006). Moreover, reducing the
expression of stathmin with an antisense oligonucleotide, results in the inhibition of migration
- 26 -
Figure10: Stathmin regulation of microtubule dynamics Microtubules continuously switch between phases of polymerization and depolymerization. Stathmin can sequester un-polymerized tubulin by binding two αβ-tubulin heterodimers, thus diminishing the pool of tubulin available for polymerization. Stathmin can also bind to the end of polymerized microtubules and increase the rate of catastrophe by inducing a conformational change that promotes microtubule depolymerization. (From Rubin and Atweh, 2004)
Introduction
of new neurons from the sub-ventricular zone to the olfactory bulb via the rostral migratory
stream, suggesting a role for stathmin in the migration of newborn neurons in the adult rodent
brain (Jin et al., 2004).
Accordingly, we have demonstrated that p27, binding the C-terminus of stathmin, interferes
with its ability to sequester tubulin, leading to increased microtubule stabilization that in turn
impairs migration function. Also in our systems, in fact, stathmin has a pivotal role in cell
migration regulation: stathmin-null mouse embryo fibroblasts (MEFs) showed migration
defects rescued by transfection of stathmin cDNA and stathmin inhibition reduces cell
motility, while its over-expression increases migration in HT-1080 cells (Baldassarre et al.,
2005). But intriguingly, in our system the stathmin activity in cell migration results to be
regulated by p27 expression and together these data represent the first indication that
cytoplasmic p27 regulates migration by a direct effect on microtubule dynamic via-stathmin
(Iancu-Rubin and Atweh, 2005).
- 27 -
Introduction
4. The oncogenic v-Src and its normal mammalian counterpart c-Src.
Several oncogenes are able to induce mouse fibroblasts transformation. Among them, one of
the most powerful is certainly v-Src, whose normal counterpart in the mammalian cell (c-Src,)
was the first proto-oncogene to be discovered in the vertebrate genome (Takeya and
Hanafusa, 1983). The viral src gene of Rous sarcoma virus (RSV) encodes the first
recognized tyrosine kinase (Hunter and Sefton, 1980). Src is a member of a multigene family
(the prototype Src family kinase (SFK)) of membrane-associated non-receptor tyrosine
kinases that comprises nine members, some of which (Src, Fyn and Yes) are ubiquitous and
some of which display more-restricted expression (Thomas and Brugge, 1997).
4.1. Structure and regulation of Src
Both the avian and human forms of c-Src protein are composed of a unique amino-terminal
domain, four SRC homology (SH) domains and a C-terminal tail containing a negative-
regulatory tyrosine residue (Tyr527, chicken; Tyr530, human) (Xu et al., 1997). The functions
of the N-terminal domain are not well defined, but mutations in this region seems to reduce
the transforming potential of v-Src. The SH domains consist of the SH1 kinase domain,
containing the auto-phosphorylation site necessary for full Src activation (Tyr416, chicken;
Tyr419, human); the SH2 domain, interacting with the negative-regulatory Tyr527/530; the
SH3 domain, which interacts with the kinase domain in the inactive form of the protein; and
the SH4 domain, which contains the myristoylation site, important for membrane localization
(Fig11. Yeatman, 2004).
As mentioned before, the C-terminal tail and the SH2 and SH3 domains are involved in the
negative regulation of c-Src. Crystallographic studies have shown that interactions between
the C-terminus and the SH2 domain, and between the kinase domain and the SH3 domain,
cause the c-Src molecule to assume a closed configuration that hides the kinase domain and
reduces substrate interaction (Yamaguchi and Hendrickson, 1996). Mutational studies
primarily involving the avian forms of Src, have clearly elucidated a closed, inactive
conformation and an open, active state. The inhibitory residue (Tyr527/530) can bind to the
SH2 domain when phosphorylated and Src results inactive. When dephosphorylated, Src is
active and show the potential for autophosphorylation and for downstream interactions with
Src substrates (Cooper et al., 1986). Thus, phosphatases that dephosphorylate human c-Src at
Tyr530 can bring about activation, even when protein levels are normal. Instead, the C-
terminal phosphate of c-Src can be removed by several protein phosphatases. Protein tyrosine
phosphatase- (PTP ) has been shown to dephosphorylate the terminal tyrosine residue in
- 28 -
Introduction
vitro and in vivo, and PTP1, SH2-containing phosphatase 1 (SHP1) and SHP2 might also
regulate c-Src (Yeatman, 2004). The most direct evidence for a role in c-Src activation in
cancer among these phosphatases is for PTP1B, which is present at higher levels in breast
cancer cell lines and can dephosphorylate c-Src (Bjorge et al., 2000). Conversely, inactivation
of c-Src by phosphorylation of the terminal tyrosine residue is now known to be performed by
CSK and its homologue CHK, resulting in the closed, inactive c-Src conformation described
above (Frame et al., 2002; Yeatman, 2004). In addition to Thy527 dephosphorylation, c-Src is
also activated by the direct binding to the SH2 and SH3 domains of focal-adhesion kinase
(FAK) or its molecular partner CRK-associated substrate (CAS, also known as p130CAS)
(Yeatman, 2004).
Moreover, c-Src can also be activated as a result of a variety of extracellular signals. For
example, interactions with ligand-activated receptor tyrosine kinases, such as EGFR, PDGFR,
ERBB2 (HER2/NEU), FGFR, CSF1 and HGF can result in augmented and even synergistic
c-Src activation. In particular, the activation of growth-factor receptors leads to their
association with the SH2 domain, which disrupts inhibitory intramolecular interactions and
promote c-Src activation (Yeatman, 2004). Other modes of c-Src regulation include
ubiquitination, with subsequent degradation by the proteasome. The CBL ubiquitin ligase,
found deregulated in some cancer cells, has been shown to be important in suppressing v-Src
transformation through ubquitin-dependent degradation (Kim et al., 2004).
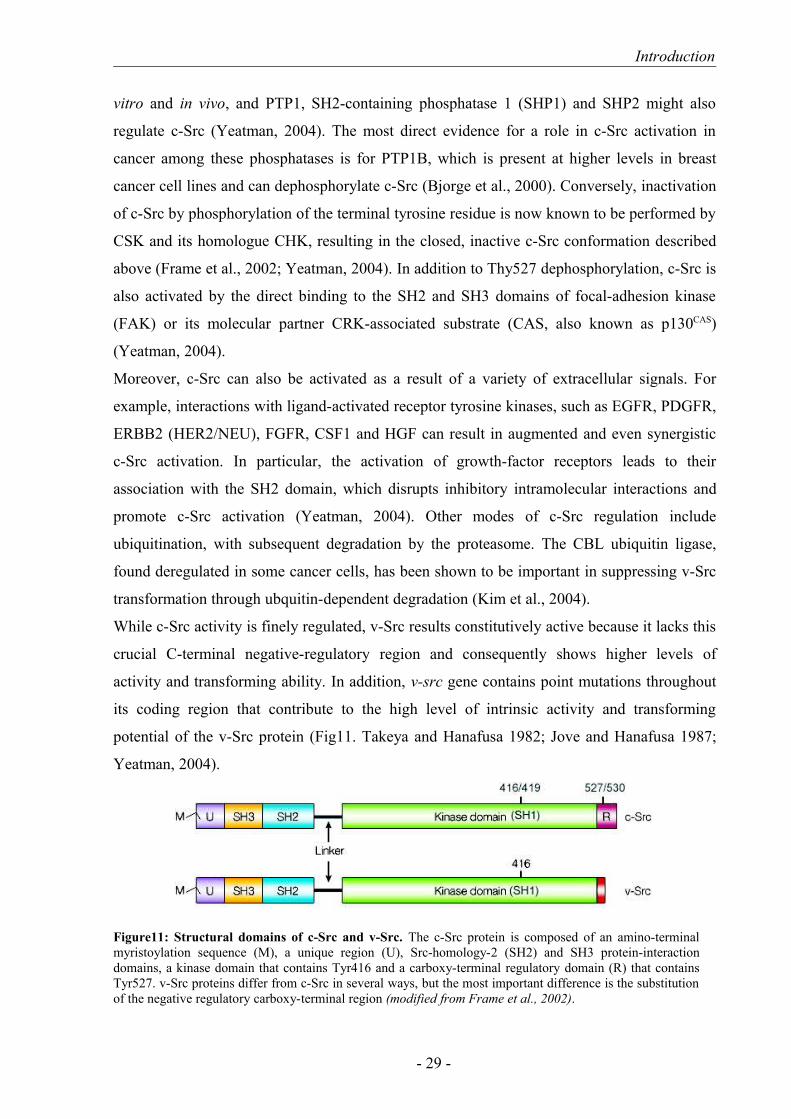
While c-Src activity is finely regulated, v-Src results constitutively active because it lacks this
crucial C-terminal negative-regulatory region and consequently shows higher levels of
activity and transforming ability. In addition, v-src gene contains point mutations throughout
its coding region that contribute to the high level of intrinsic activity and transforming
potential of the v-Src protein (Fig11. Takeya and Hanafusa 1982; Jove and Hanafusa 1987;
Yeatman, 2004).
- 29 -
Figure11: Structural domains of c-Src and v-Src. The c-Src protein is composed of an amino-terminal myristoylation sequence (M), a unique region (U), Src-homology-2 (SH2) and SH3 protein-interaction domains, a kinase domain that contains Tyr416 and a carboxy-terminal regulatory domain (R) that contains Tyr527. v-Src proteins differ from c-Src in several ways, but the most important difference is the substitution of the negative regulatory carboxy-terminal region (modified from Frame et al., 2002).
Introduction
4.2. The v-Src transformed phenotype
The highly activated v-Src oncogene has been revealed very useful to understand the function
of SRC proteins. The generation of RSV mutants that were non-conditionally defective or
temperature sensitive (ts) for transformation provided the first demonstration that a protein, v-
Src, can initiate and maintain cell transformation (Martin, 2001). v-Src transformation of
normal fibroblasts is a visible event, leading to morphological changes in transfected cells.
Transformed cells have a loss of bundled actin filaments and a reduction in the number and
the size of cell–substrate adhesions (focal adhesions) into which actin filaments are tethered
(Frame et al., 2002; Yeatman, 2004). This results in conversion from a well-spread
morphology to a more refractile and fusiform cell shape, particularly in established cell lines.
The lost of the intercellular, integrin-based cytoskeletal attachments could induce also the
more extreme cell rounding and detachment from the substratum (Jove and Hanafusa, 1987).
v-Src-transformed cells are also more motile and more able to invade the basement-membrane
matrix. Over the course of weeks, v-Src transformation can result in overgrown clumps of
cells, known as foci, where cells lose their density inhibition - a hallmark of a cancer cell.
These changes are consistent with the processes that are needed for a cancer cell to
disaggregate from the primary tumor, invade the surrounding tissue and metastasize to distant
organ sites. In addition to these effects, the v-Src oncoprotein has growth-promoting
functions in fibroblasts. v-Src-transformed cells suppress the expression of p27, leading to
more rapid transit through the G1 phase and a failure to enter the quiescent state when
deprived of serum mitogens (Johnson et al., 1998; Riley et al., 2001). As well as suppression
of p27, activation of ts v-Src in quiescent cells sequentially induces expression of cyclins D1,
E and A and activity of cyclinD1/D3-CDK4/6, cyclinE-CDK2 and cyclinA-CDK2 (Riley et
al., 2001). These combined effects on positive and negative regulators of the cell cycle require
the activities of the PI3K and MEK pathways downstream of v-Src and drive cells through G1
and into S-phase (Riley et al., 2001). Recently, a direct phosphorylation of src on p27 Y74 has
been also shown (see above). In vivo, transfected cells grow rapidly to form visible tumors
within days of injection, and these tumors are capable of local invasion and metastasis to
distant sites (Yeatman, 2004).
v-Src is transported to the cell periphery, where it has a crucial function in the regulation of
the actin cytoskeleton and cellular adhesions, even if v-Src was also reported to be present in
the perinuclear region of transformed cells (Rohrschneider, 1979). The effects of v-Src on the
actin cytoskeleton and focal adhesion are responsible for the rounded morphology and
- 30 -

Introduction
reduced adhesiveness of transformed cells. Many aspects have apparent parallels in the
biology of c-Src, which is also transported to equivalent peripheral sites where its activity is
required for cell migration. Although such parallels can be drawn, this is not to imply that v-
Src simply reproduces an extreme and uncontrolled copy of the biological function of c-Src in
normal homeostasis. Even when over-expressed, c-Src cannot transform cells because its
kinase activity is subject to tight negative regulation (Thomas and Brugge, 1997). However,
constitutively activated c-Src can induce oncogenic transformation, which implies that v-Src
and c-Src share at least some effectors that determine the transformed phenotype (Frame et
al., 2002).
4.3. Molecular mechanisms of Src functions
The complexity of Src phenotype is indicative of how wide its activity is. As mentioned
before, v-src shows growth-promoting effects in fibroblasts, modulating the activity of both
positive and negative cell cycle regulators. v-Src acts also as a survival factor affecting the
fine balance between survival and death and promoting cell cycle progression in unfavorable
conditions such as low serum concentration, via PI3K and AKT signaling. Moreover, v-Src is
able to overcome the normal adhesion requirement for proliferation and induces anchorage
independent growth (Frame, 2002).
But first of all, Src is well known to be a key regulator of cellular actin and adhesion network.
Src is localized in the focal adhesions and assembled into supramolecular structures with over
other 50 different cytoskeletal proteins. Focal adhesions are disassembled when the cell needs
to move along or away from the ECM and Src contributes to this process leading to disruption
of focal adhesions and actin stress fibers. This occurs both during normal cellular migration
and mitosis, when cells round up and lose their matrix attachments and during transformation,
when the integrity of these structures is disrupted, permitting increased motility (Hynes,
1992). v-Src, as c-Src, induces, a block downstream the RhoA signaling through activation of
p190 RhoGAP, leading to focal-adhesion disruption. Src is also thought to affect focal
adhesions by inducing tyrosine phosphorylation of R-Ras, by dephosphorylation and
activation of the actin-severing protein cofilin and by phosphorylation and activation of FAK.
Moreover, Src might affect migration and invasion by regulating matrix metalloproteinases
(MMPs), tissue inhibitors of MMPs (TIMPs) and E-cadherin levels (Yeatman, 2004). In
particular the E-cadherin down-regulation is a key event in the carcinoma progression and
Src, in cooperation with EGF and HGF, promotes it by stimulating the ubiquitination of E-
cadherin and leading to its endocytosis. In epithelial cancers the disruption or the weakening
- 31 -
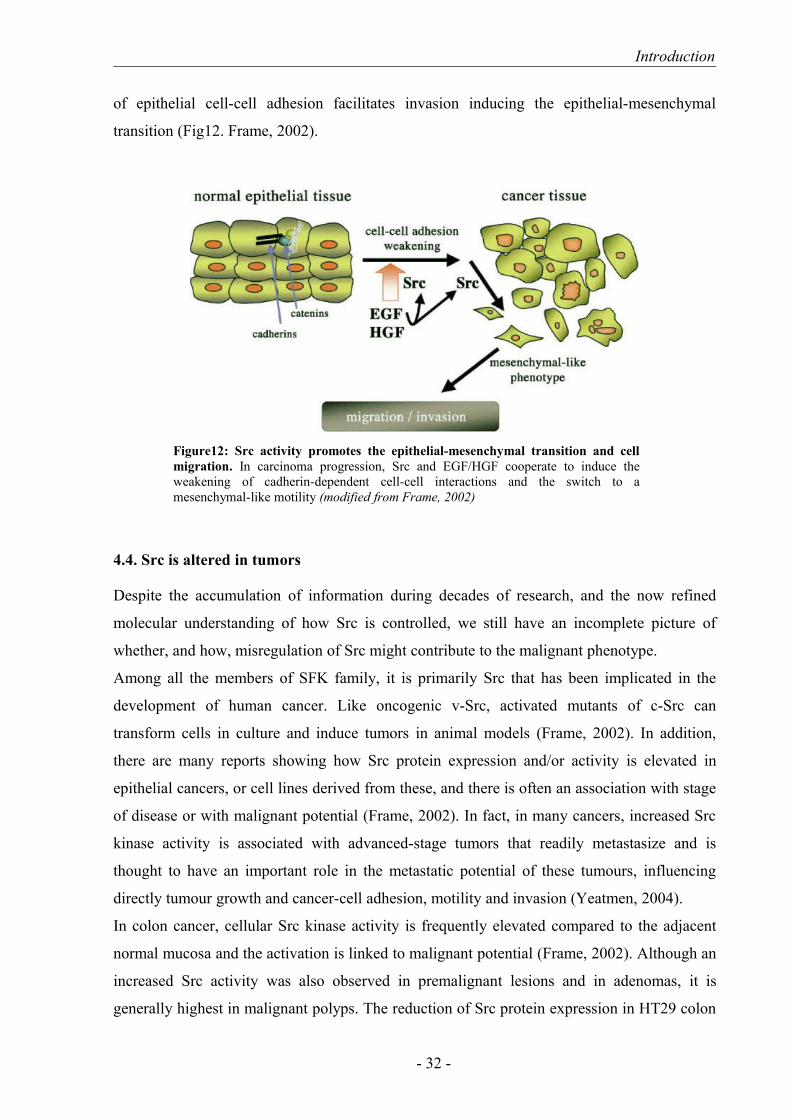
Introduction
of epithelial cell-cell adhesion facilitates invasion inducing the epithelial-mesenchymal
transition (Fig12. Frame, 2002).
4.4. Src is altered in tumors
Despite the accumulation of information during decades of research, and the now refined
molecular understanding of how Src is controlled, we still have an incomplete picture of
whether, and how, misregulation of Src might contribute to the malignant phenotype.
Among all the members of SFK family, it is primarily Src that has been implicated in the
development of human cancer. Like oncogenic v-Src, activated mutants of c-Src can
transform cells in culture and induce tumors in animal models (Frame, 2002). In addition,
there are many reports showing how Src protein expression and/or activity is elevated in
epithelial cancers, or cell lines derived from these, and there is often an association with stage
of disease or with malignant potential (Frame, 2002). In fact, in many cancers, increased Src
kinase activity is associated with advanced-stage tumors that readily metastasize and is
thought to have an important role in the metastatic potential of these tumours, influencing
directly tumour growth and cancer-cell adhesion, motility and invasion (Yeatmen, 2004).
In colon cancer, cellular Src kinase activity is frequently elevated compared to the adjacent
normal mucosa and the activation is linked to malignant potential (Frame, 2002). Although an
increased Src activity was also observed in premalignant lesions and in adenomas, it is
generally highest in malignant polyps. The reduction of Src protein expression in HT29 colon
- 32 -
Figure12: Src activity promotes the epithelial-mesenchymal transition and cell migration. In carcinoma progression, Src and EGF/HGF cooperate to induce the weakening of cadherin-dependent cell-cell interactions and the switch to a mesenchymal-like motility (modified from Frame, 2002)
Introduction
cancer cells using an antisense approach suppresses their growth both in vitro and in vivo.
Further, higher Src activity is often observed in metastases compared to the corresponding
primary tumors and activation of Src by receptor tyrosine kinases occurs in cells that have
high metastatic potential (Frame, 2002). Taken together, current evidence implies that there is
generally an early increase in Src activity accompanying tumour initiation and a stepwise
increase during the progression of colon cancer.
There is also circumstantial evidence that Src activity might be playing a role in breast and
other epithelial cancers. For example, Src is over-expressed or shows an elevated activity in
breast carcinomas compared to normal tissue, in breast cancer cells lines and in mouse models
of mammary tumours (Frame, 2002). Src is also frequently up-regulated in pancreatic cancers
and cell lines derived from these, as well as in ovarian, esophageal, lung, head and neck and
gastric cancers (Frame, 2002).
Src expression and activity are increased also in melanoma cell lines and in melanoma
tumors. In melanoma, Src can activate STAT3, STAT5 and other downstream targets and
their activated forms are present in both primary and metastatic melanoma in humans,
although the expression level is variable (Frame, 2002).
All these observation strongly suggests that the elevated expression and/or activity of Src
facilitate malignant progression. However, the way in which Src activation is stimulated and
how this contributes to the cancer phenotype, are still not completely defined.
- 33 -
AIM OF THE STUDY
In cancer, the uncontrolled cell proliferation and the ability to invade tissues and form
metastasis, are two of the most important features. Thus, the understanding of molecular
mechanisms that regulate the cell growth and the motility behaviour becomes crucial for the
development of new anticancer therapies.
Among all the molecular effectors that could have a role in tumor progression, particular
interest has received the inhibitor of cyclin-CDK complexes p27kip1 (p27). p27 represents an
ideal target displaying on one hand an inhibitory effect in cell cycle progression and on the
other hand by regulating cell motility, as recently demonstrated by different authors.
In this PhD project we aimed to clarify whether and how p27 contributes to the proper
coordination of proliferation and motility in the process of neoplastic transformation. In
particular, we decided to evaluate if the presence or absence of p27 could be associated to
different responses after oncogenic stimuli. We used murine immortalized fibroblasts, derived
from embryos wild type or knock out for the cdkn1b gene, encoding for the p27 protein, and
then transformed by over-expression of v-src oncogene. The Harvey-Ras oncogene was used
in the same manner to highlight common responses or different “oncogene-specific” effects.
The selected cell clones were then analysed with several in vitro and in vivo experimental
approaches in order to characterize both their proliferative and motile behaviour and to gain
new information about p27 functions in the first steps of neoplastic transformation as well as
in the later stages of tumor progression.
- 34 -
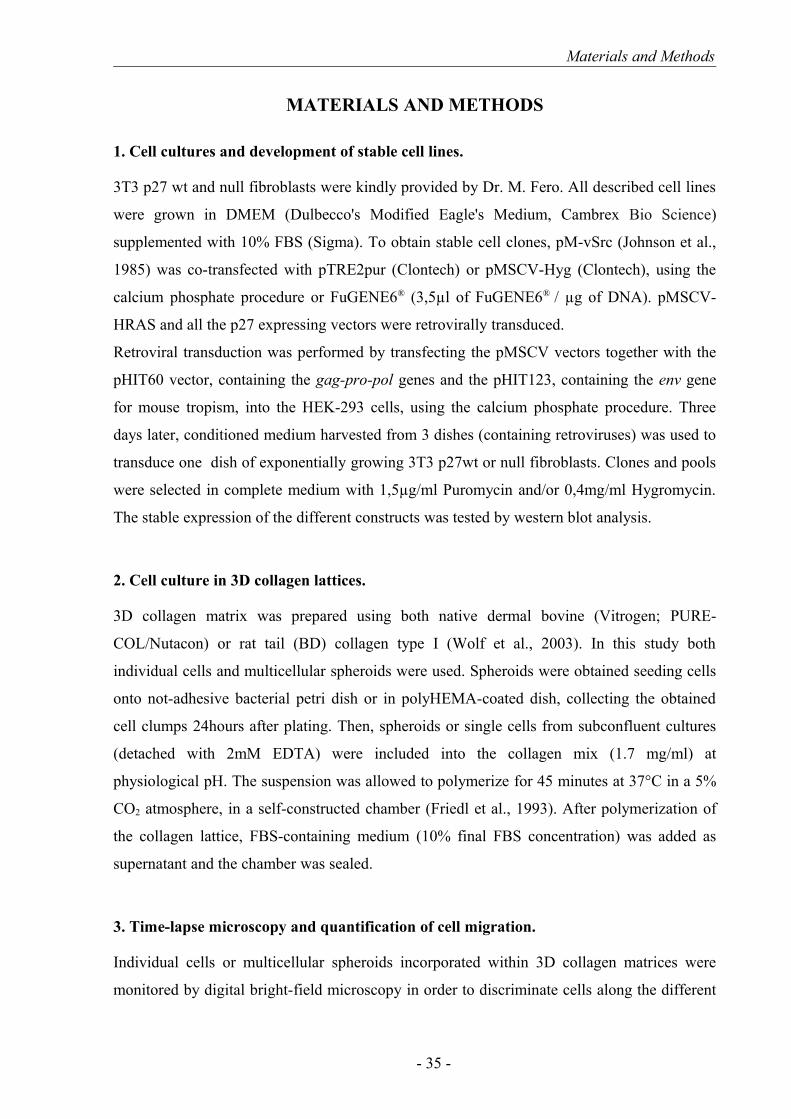
Materials and Methods
MATERIALS AND METHODS
1. Cell cultures and development of stable cell lines.
3T3 p27 wt and null fibroblasts were kindly provided by Dr. M. Fero. All described cell lines
were grown in DMEM (Dulbecco's Modified Eagle's Medium, Cambrex Bio Science)
supplemented with 10% FBS (Sigma). To obtain stable cell clones, pM-vSrc (Johnson et al.,
1985) was co-transfected with pTRE2pur (Clontech) or pMSCV-Hyg (Clontech), using the
calcium phosphate procedure or FuGENE6® (3,5µl of FuGENE6® / µg of DNA). pMSCV-
HRAS and all the p27 expressing vectors were retrovirally transduced.
Retroviral transduction was performed by transfecting the pMSCV vectors together with the
pHIT60 vector, containing the gag-pro-pol genes and the pHIT123, containing the env gene
for mouse tropism, into the HEK-293 cells, using the calcium phosphate procedure. Three
days later, conditioned medium harvested from 3 dishes (containing retroviruses) was used to
transduce one dish of exponentially growing 3T3 p27wt or null fibroblasts. Clones and pools
were selected in complete medium with 1,5µg/ml Puromycin and/or 0,4mg/ml Hygromycin.
The stable expression of the different constructs was tested by western blot analysis.
2. Cell culture in 3D collagen lattices.
3D collagen matrix was prepared using both native dermal bovine (Vitrogen; PURE-
COL/Nutacon) or rat tail (BD) collagen type I (Wolf et al., 2003). In this study both
individual cells and multicellular spheroids were used. Spheroids were obtained seeding cells
onto not-adhesive bacterial petri dish or in polyHEMA-coated dish, collecting the obtained
cell clumps 24hours after plating. Then, spheroids or single cells from subconfluent cultures
(detached with 2mM EDTA) were included into the collagen mix (1.7 mg/ml) at
physiological pH. The suspension was allowed to polymerize for 45 minutes at 37°C in a 5%
CO2 atmosphere, in a self-constructed chamber (Friedl et al., 1993). After polymerization of
the collagen lattice, FBS-containing medium (10% final FBS concentration) was added as
supernatant and the chamber was sealed.
3. Time-lapse microscopy and quantification of cell migration.
Individual cells or multicellular spheroids incorporated within 3D collagen matrices were
monitored by digital bright-field microscopy in order to discriminate cells along the different
- 35 -
Materials and Methods
axes. The pictures were collected every 4 or 5 min for 20 hours, using a CCD camera
mounted onto the microscope. A 10X (for speed analysis) or 20X (for morphological
analysis) objectives were used. The cells were maintained at 37°C during all the recording
time using a remote temperature control system and a heating device. At the end of the
recording, pictures were used to create a movie (10 images per second, Quicktime), and used
for cell tracking analysis. After conversion of pixel values into micrometers, single cell
migration was quantified by computer-assisted cell tracking of at least 40 randomly selected
cells for each experiment, obtaining several locomotion parameters, such as velocity, speed
and paths.
Velocity describes the actual translocation efficiency of cells in the process of migration,
delineating the “true” speed without interference of stopping frequencies. Speed represents a
more general parameter describing overall motility as a function of the fraction of locomoting
cells and their locomotor duration, individual step lengths and step number. Using the xy
coordinates of cell paths, the speed and velocity were calculated as the length of each cell path
divided by time (step interval, 12 minutes). Statistical analysis was obtained from the two-
tailed unpaired Student's t-test or the two-tailed unpaired Mann-Whitney test.
4. Transwell-based migration assay.
Cell lines were tested for invasion and motility by fluorescence-assisted transmigration assay
(FATIMA, Spessotto et al., 2000), in response to haptotactic stimuli of ECM substrates. The
procedure is based on the use of transwell-like inserts (HTS FluoroBlok™, Becton-Dickinson,
Falcon, Milan, Italy) carrying fluorescence shielding porous polyethylene terephthalate (PET)
membranes with 8μm pores.
For haptotaxis, bottom side of HTS Fluoroblok™ were coated with 20µg/ml fibronectin in
carbonate buffer at 4°C overnight and then saturated with PBS 1% BSA for 2 hours at room
temperature. Cells were labeled with DiI (Molecular Probes) for 20 minutes at 37°C before
being seeded on the Fluoroblok™ upper chamber and then incubated at 37°C for the indicated
times.
Migratory behavior of the cells was monitored at different time-points by detection of
fluorescence from the top (corresponding to non-migrated cells) and the bottom
(corresponding to migrated cells) sides of the membrane using the computer-interfaced
GENios Plus (TECAN Italia Srl). Each experiment was performed at least 3 times, in
- 36 -
Materials and Methods
duplicate. As a further control, after the last measurement, Fluoroblok™ membranes were
fixed in 4% PFA and mounted on a slide, to allow the manual count of migrated cells.
5. Matrigel™ and Collagen I evasion assay.
For 3D Matrigel™ and Collagen I evasion assay, cells (7,5x10⁵/ml) were included in
Matrigel™ (6 mg/ml, Becton Dickinson) or in Collagen I (1,7 mg/ml, Becton Dickinson)
drops and maintained 1 hr up side down to polymerize at 37°C. Collagen I was diluted in a
mix solution containing DMEM-10X (w/o phenol red), 7,5% sodium bicarbonate and
complete medium. Then drops were incubated for the indicated times in complete medium.
Cell motility was observed by transmission microscopy using a Nikon TS100/F microscope
and images collected using a CCD camera (Leica). Cells outside each drop (five drops/cell
line/experiment) were counted to estimate the cell line evasion ability.
The evasion ability was also estimated by measuring the distance covered by the cells from
the drop edges, after 5 days from inclusion. To perform this analysis, cells were stained with
crystal violet and then pictures were taken. After conversion from pixel to millimeters, the
actual distance covered was calculated.
6. Cell adhesion assay.
The quantitative cell adhesion assay used in this study has been previously described (using
centrifugal assay for fluorescence-based cell adhesion-CAFCA; Giacomello et al., 1999;
Spessotto et al., 2000). Briefly, six-well strips miniplates (of flexible polyvinyl chloride),
covered with double-sided tape (bottom units), were coated with the different substrates
(20µg/ml Collagen I, 10 µg/ml Vitronectin and 10µg/ml Fibronectin. BSA was used as
negative control). Cells were labeled with the vital fluorochrome Calcein AM (Molecular
Probes) for 15 minutes at 37°C and then dispensed into the bottom CAFCA miniplates, which
were then centrifuged to synchronize the contact of the cells with the substrate. The
miniplates were then incubated for 20 minutes at 37°C and then mounted together with
another CAFCA miniplate to create communicating chambers for subsequent reverse
centrifugation. The relative number of cells bound to the substrate (i.e. remaining in the wells
of the bottom miniplates) and cells that fail to bind to the substrate (i.e. remaining in the wells
of the top miniplates) was estimated by top/bottom fluorescence detection in a computer-
interfaced GENios Plus microplate fluorometer (TECAN Italia S.r.L., Milan, Italy).
- 37 -
Materials and Methods
The analysis of signal transduction pathways activated after cell adhesion was performed
seeding about 1x10⁶ cells in 100mm dishes, coated with 20µg/ml collagen I. At the indicated
time points (15, 30, 60 minutes), cells were collected and total protein extracts were obtained
as described below (point 7).
7. Preparation of cell lysates, immunoprecipitation and immunoblotting.
Total cell proteins were extracted using cold NP40 lysis buffer (0,5% NP40; 50mM HEPES
pH7; 250mM NaCl; 5mM EDTA; 0,5mM EGTA pH8) containing a protease inhibitor
cocktail (Complete™, Roche), 1mM sodium orthovanadate and 1mM DTT. After incubation
on ice for 30 min, the lysates were centrifuged at max speed for 10 min at 4°C to recover the
supernatant.
Immunoprecipitation experiments were performed using 0.5mg of total lysate, adding HNTG
buffer (20mM HEPES, 150mM NaCl, 10%Glycerol, 0.1%Triton X-100, protease inhibitor
cocktail, 1mM sodium orthovanadate and 1mM DTT) with the specific agarose-conjugated
primary antibodies, gently rocking overnight at 4°C. When primary antibodies were not
agarose-conjugated, Protein A or Protein G Sepharose 4 Fast Flow (Amersham Biosciences),
was added for the last 2 hr of incubation. Immunoprecipitates were then washed six times in
HNTG buffer and then nine parts were resuspended in 3X Laemli Sample Buffer (50mM
TrisHCl pH6,8, 2% SDS, 10% glycerol, 0,5% Bromophenol Blue, with fresh 50mM DTT) for
immunoblot analysis and one part was resuspended in kinase buffer (20mM TrisHCl pH6.8,
10mM MgCl2) to perform a kinase assays (see the following chapter).
For immunoblot analysis, proteins were separated in 4-20% SDS-PAGE (Criterion Precast
Gel, Biorad) and transferred to nitrocellulose membranes (Amersham). Membranes were
blocked with 5% dried milk in TBS-0,1% Tween or in Odyssey Blocking Buffer (Licor,
Biosciences) and incubated at 4°C overnight with primary antibodies.
Primary antibodies were from: Transduction Laboratories (p27, CDK1, CDK2, FAK,
Cofilin), Santa Cruz (CDK1, CDK2-AC, Cyclin B1, Cyclin A, vinculin, c-Src, H-Ras,
pY705-Stat3, Stat3, Akt), Cell Signaling (pS473-Akt, pT202/Y204-p42/44-MAPK, p42/44-
MAPK, pS3-Cofilin), Biosource (pY397-Fak, pS473-Akt).
Then, membranes were washed, incubated 1 hour at room temperature with horseradish
peroxidase (HRP)-conjugated secondary antibodies, for chemi-luminescent detection (ECL
Kit, Amersham Inc.) or with Alexa-conjugated secondary antibodies for infrared detection
- 38 -

Materials and Methods
(Odyssey Infrared Detection System, Licor). For immunoprecipitates, Rabbit IgG and Mouse
IgG True Blot (eBioscience) secondary HRP-conjugated antibodies were used.
The Restore™ Western Blot Stripping Solution (Pierce) was used to strip the membranes,
when re-blotting was needed.
8. Growth curve, MTT assay and FACS analysis.
Cell proliferation was evaluated using growth curves, MTT assay and FACS analysis after
Propidium Iodide labeling. For MTT assay (Sigma), 1000 cells/well were seeded in 96 well
plates. At the indicated times, MTT solution (3-(4,5-Dimethylthiazol-2-yl)-2,5-
diphenyltetrazolium bromide, a tetrazole) in complete medium (0,28mg/ml final
concentration) was added and incubated at 37°C for 4 hours. During this incubation, MTT is
reduced to purple formazan in the mitochondria of living cells. The medium was then discard
and the formazan salts were dissolved in DMSO. The colorimetric reaction was measured and
quantified at 560 nm in Elisa plate reader.
For cell growth, 1x10⁵ cells/well were seeded in 6 well plates in complete medium in
duplicate. At the indicated time, cells were detached in trypsin-EDTA and counted.
Cell cycle distribution was analyzed by FACS analysis. Cells were collected and fixed in ice-
cold 70% ethanol and maintained at -20°C until ready for the staining procedure. Cells were
then washed and resuspended in propidium iodide staining solution (50µg/ml propidium
iodide and 0,1mg/ml RNaseA, in PBS 1X). Stained cells were subjected to flow cytometry
analysis (FACS) with a FACScan and a FACSCalibur instrument (BD Biosciences). The data
were analysed using WinMDI2.8 software.
9. Kinase assay.
After immunoprecipitation with anti-CDK1, -CDK2, -CyclinA or -CyclinB1 antibodies, or
with the control antibodies, the associated kinase activity was evaluated, as follows. Samples
were mixed with a kinase reaction solution containing 50µM not labelled ATP + γATP-P32
and 2µg of H1-Histon as substrate in buffered solution (20mM TrisHCl pH6.8, 10mM
MgCl2). The reaction was carried out at 30°C for 30 min and then 2X Laemli Sample Buffer
was added. After denaturation at 95°C for 5 min, proteins were loaded on a 4-20% SDS-
PAGE (Criterion Precast Gel, Biorad). The gel was then dried and exposed on an
- 39 -

Materials and Methods
autoradiographic film (Amersham-Hyperfilm MP) at -80°C and developed after different time
intervals.
10. Double thymidine block and nocodazole assay.
The double thymidine block was used to synchronize the cell cycle progression. Thymidine is
a deoxynucleoside able to inhibit DNA replication if added in excess in the medium, inducing
a reversible block at the G1/S transition. We performed a first treatment with 2mM thymidine
for 15-16 hours in cells plated at about 20-30% of confluence. At the end of the first
incubation, the cells were detached and seeded again at 30% of confluence and released in
complete medium (DMEM-10%FBS) for 8 hours. Then a second thymidine block was
performed (12 hours with 2mM thymidine in complete medium) at the end of which most of
the cells resulted blocked at the beginning of S-phase. At this point, cells were released in
complete medium for 6 hours and then incubated 5 hours with 50ng/ml nocodazole.
Nocodazole is a MT destabilizing drug that inhibits the assembling of the mitotic spindle and
blocks the cells at the beginning of M phase (in pro-metaphase). To analyse the progression
along the mitosis, cells were collected at T0 (i.e. in pro-metaphase) and after 30, 60, 90, 120
and 180 minutes of release in complete medium and analyzed by FACS.
11. Anchorage-independent cell growth
To evaluate the cell ability to grow in an anchorage independent manner, soft agar assay was
performed. Cells (1 × 10³ and 5 × 10³) were suspended in 2ml TOP agar medium
(DMEM-10%FBS containing 0.4% Low Melting Agarose-SIGMA). The cell suspension was
then layered on 2ml of jellified BOTTOM agar medium (DMEM-10%FBS containing 0.6%
Low Melting Agarose) in six-well tissue culture plates in triplicate. DMEM-10%FBS with
1,5µg/ml Puromycin and/or 0,4mg/ml Hygromycin (depending from the selection needed)
was added to the plates every 3 days, as a feeder layer. On day 8 for Src clones and day 12 for
Ras clones, the number of colonies was counted in 15 randomly selected fields, at 10X
magnification.
12. In vivo analysis
Primary tumors were established by s.c. injection of transformed cells into the flank of
female athymic nude mice (Harlan, 8 weeks of age). 1x10⁶ v-src transformed cells and 2 x10⁶
- 40 -

Materials and Methods
H-Ras transformed cells were injected. The tumor growth was followed every other day
measuring the mass with a calibre. 15 days from injection in the case of v-src transformed cell
and 22 days in the case of H-Ras cells, the animals were sacrificed and tumor analysis was
performed. To analyze the invasive potential, spleen, lung and blood samples were also
collected and rapidly frozen to preserve RNA integrity.
In a second type of experiment we tried to evaluate the ability of the transformed cells to
settle and colonize distant sites. To this aim, 1x10⁶ cells have been injected into the tail vein.
After about 20 days, the animals were sacrificed and lungs were fixed in Bouin’s solution to
look for foci formation.
13. RNA extraction and RT-PCR from tissue samples
Isolation of RNA from spleen, lung and blood samples was performed using RNeasy-Mini Kit
(QIAGEN), according to the manufacture’s instructions. Disruption of the tissue sample was
achieved by grinding the frozen tissue thoroughly with lead blocks. The homogenization was
performed passing the lysate at least 5 times through a blunt 23-gauge needle fitted to an
RNase-free syringe.
RNA were then quantified and retro-transcribed with AMV Reverse transcriptase (according
to provider’s instruction, Promega) and the obtained cDNAs were amplified with nested PCR,
in order to evaluate the presence of ectopic injected cells in tissue samples.
The following primers were used:
pTREforward1 5’-CAGCAGGCAGAAGTATGCAA-3’,
pTREforward2 5’-TGCAAAGCATGCATCTCAAT-3’,
pTREreverse1 5’-CGTGAGGAAGAGTTCTTGCAG-3’,
pTREreverse2 5’-AGTTCTTGCAGCTCGGTGAC-3’,
pMSCVforward 5’-CCCTTGAACCTCCTCGTTCGACC-3’,
pMSCVreverse 5’-GAGACGTGCTACTTCCATTTGTC-3’,
H-RASforward 5’-GGATCCATGACGGAATATAAG-3’
H-RASreverse 5’-GAATTCTCAGGAGAGCACACA-3’
p27-170reverse 5’-GGATCCCTCGAGTGTTCTGTTGGCTCTTTT-3’.
Samples were normalized by amplification of 18S ribosomal subunit. PCR products were then
resolved on 1% agarose gels stained with ethidium bromide.
- 41 -
Materials and Methods
14. Immunofluorescence Analysis
For immunofluorescence staining, cells included in Matrigel™ or collagen I drops were fixed
in PBS 4% paraformaldehyde (PFA) at room temperature (RT), permeabilized in PBS 0.2%
Triton X-100 and blocked in PBS 1% BSA and 10% normal goat serum for at least 2 hours.
Incubation with FITC-conjugated monoclonal anti-α-tubulin antibody (SIGMA) and
Phallotoxin-AlexaFluor546 (Molecular probes-Invitrogen) for actin detection was performed
at RT for two hours in PBS 1% BSA and 1% normal goat serum. Cover slips were mounted in
Mowiol 4–88 (Calbiochem-Novabiochem) containing 2.5% (w/v) DABCO (Sigma). To
visualize collagen fibers, laser light at a low density (the “reflection” parameter in confocal
microscopy) was used and the light reflected by the sample was detected, allowing a sensitive
recognition of fibers. Images were acquired with a Leica TCS SP2 confocal system (Leica
Microsystems Heidelberg, Mannheim, Germany), using the Leica Confocal Software (LCS).
15. Statistical analysis
Statistical significance of the results was determined by using the paired and unpaired
Student’s t-test. A p value <0.01 was considered significant.
- 42 -
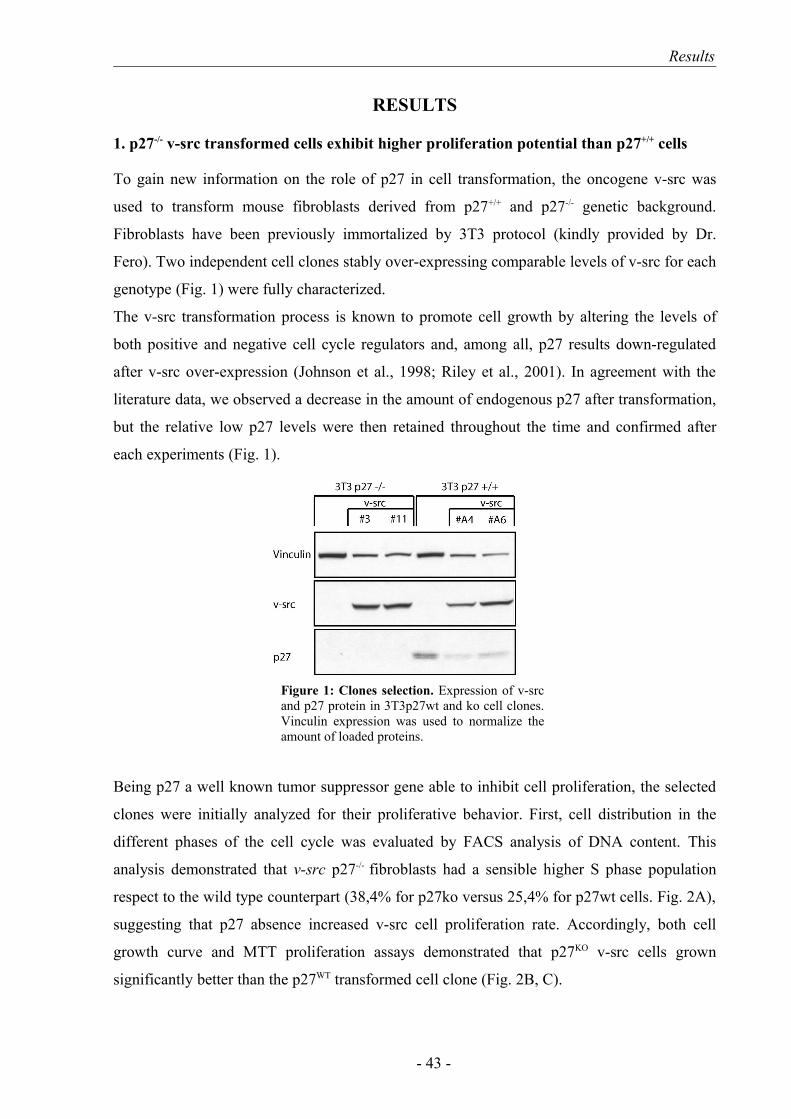
Results
RESULTS
1. p27-/- v-src transformed cells exhibit higher proliferation potential than p27+/+ cells
To gain new information on the role of p27 in cell transformation, the oncogene v-src was
used to transform mouse fibroblasts derived from p27+/+ and p27-/- genetic background.
Fibroblasts have been previously immortalized by 3T3 protocol (kindly provided by Dr.
Fero). Two independent cell clones stably over-expressing comparable levels of v-src for each
genotype (Fig. 1) were fully characterized.
The v-src transformation process is known to promote cell growth by altering the levels of
both positive and negative cell cycle regulators and, among all, p27 results down-regulated
after v-src over-expression (Johnson et al., 1998; Riley et al., 2001). In agreement with the
literature data, we observed a decrease in the amount of endogenous p27 after transformation,
but the relative low p27 levels were then retained throughout the time and confirmed after
each experiments (Fig. 1).
Being p27 a well known tumor suppressor gene able to inhibit cell proliferation, the selected
clones were initially analyzed for their proliferative behavior. First, cell distribution in the
different phases of the cell cycle was evaluated by FACS analysis of DNA content. This
analysis demonstrated that v-src p27-/- fibroblasts had a sensible higher S phase population
respect to the wild type counterpart (38,4% for p27ko versus 25,4% for p27wt cells. Fig. 2A),
suggesting that p27 absence increased v-src cell proliferation rate. Accordingly, both cell
growth curve and MTT proliferation assays demonstrated that p27KO v-src cells grown
significantly better than the p27WT transformed cell clone (Fig. 2B, C).
- 43 -
Figure 1: Clones selection. Expression of v-src and p27 protein in 3T3p27wt and ko cell clones. Vinculin expression was used to normalize the amount of loaded proteins.
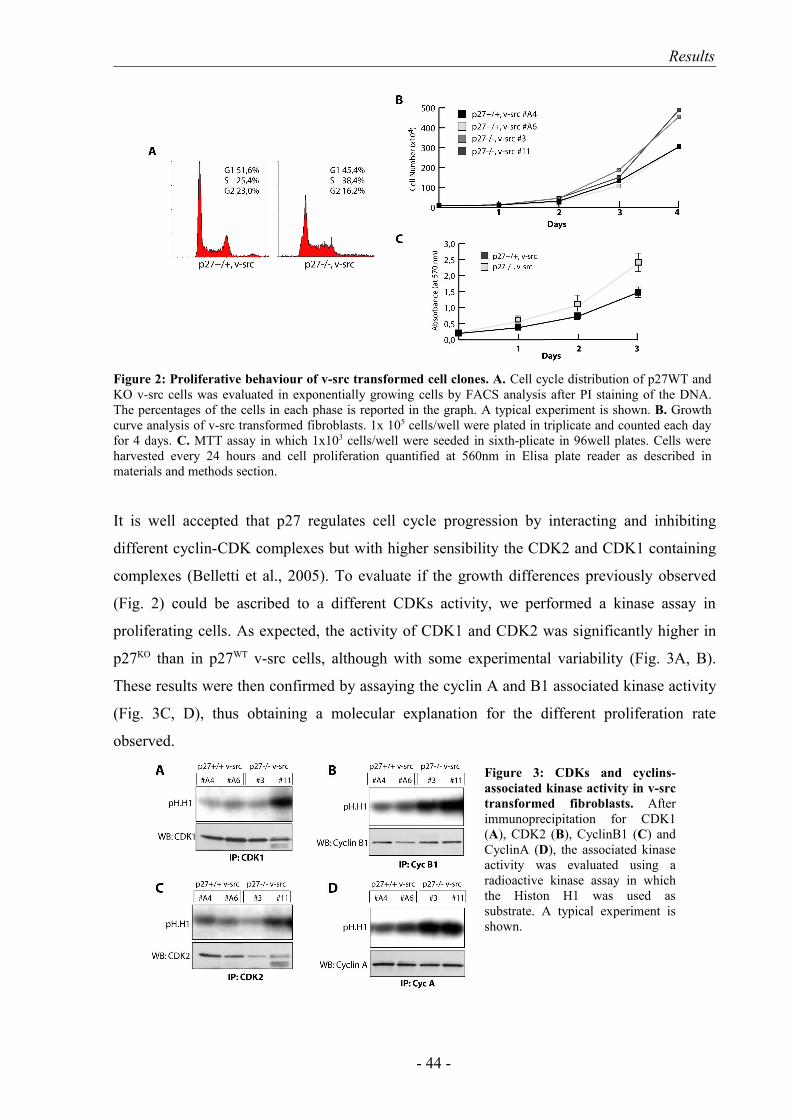
Results
It is well accepted that p27 regulates cell cycle progression by interacting and inhibiting
different cyclin-CDK complexes but with higher sensibility the CDK2 and CDK1 containing
complexes (Belletti et al., 2005). To evaluate if the growth differences previously observed
(Fig. 2) could be ascribed to a different CDKs activity, we performed a kinase assay in
proliferating cells. As expected, the activity of CDK1 and CDK2 was significantly higher in
p27KO than in p27WT v-src cells, although with some experimental variability (Fig. 3A, B).
These results were then confirmed by assaying the cyclin A and B1 associated kinase activity
(Fig. 3C, D), thus obtaining a molecular explanation for the different proliferation rate
observed.
- 44 -
Figure 2: Proliferative behaviour of v-src transformed cell clones. A. Cell cycle distribution of p27WT and KO v-src cells was evaluated in exponentially growing cells by FACS analysis after PI staining of the DNA. The percentages of the cells in each phase is reported in the graph. A typical experiment is shown. B. Growth curve analysis of v-src transformed fibroblasts. 1x 10⁵ cells/well were plated in triplicate and counted each day for 4 days. C. MTT assay in which 1x10³ cells/well were seeded in sixth-plicate in 96well plates. Cells were harvested every 24 hours and cell proliferation quantified at 560nm in Elisa plate reader as described in materials and methods section.
Figure 3: CDKs and cyclins-associated kinase activity in v-src transformed fibroblasts. After immunoprecipitation for CDK1 (A), CDK2 (B), CyclinB1 (C) and CyclinA (D), the associated kinase activity was evaluated using a radioactive kinase assay in which the Histon H1 was used as substrate. A typical experiment is shown.

Results
It is well known that p27 is a major regulator of the G1-S phase transition. To specifically
analyze its contribution in this phase of the cell cycle in v-src transformed cells, we tried to
synchronize the cells in the G1 phase by serum starvation and then re-stimulating cell cycle
enter by release in complete medium. As control, normal p27+/+ and p27-/- 3T3 fibroblasts
were used. After 24 hours of serum starvation, both p27WT and p27KO normal cells arrested in
G1 phase and re-entered in S phase after about 15 hours of serum stimulation (Fig. 4A). This
result was then confirmed by western blot analysis of typical markers of S (cyclin A) or G2-M
(cyclin B1) phases of the cell cycle (Fig. 4B) in which we observed an increase in cyclin A
levels after about 15 hours and of cyclin B1 after 21 hours from serum stimulation.
Differently by normal cells, transformed v-src fibroblasts were less sensitive to growth factor
deprivation (Fig. 5). However both FACS analysis of DNA content (Fig. 5A) and western blot
(Fig. 5B), demonstrated that p27+/+ v-src cells are more sensitive to serum deprivation than
- 45 -
Figure 4: Serum dependent cell cycle entry of normal p27wt and null fibroblasts. A. FACS analysis of 3T3 fibroblasts serum starved for 24 hours (T0) and then released in complete medium for 9, 15 and 21 hours. B. The cells treated as in A were analyzed by western blot for the expression of the indicated proteins. Vinculin expression was used as loading control. A typical experiment is shown.
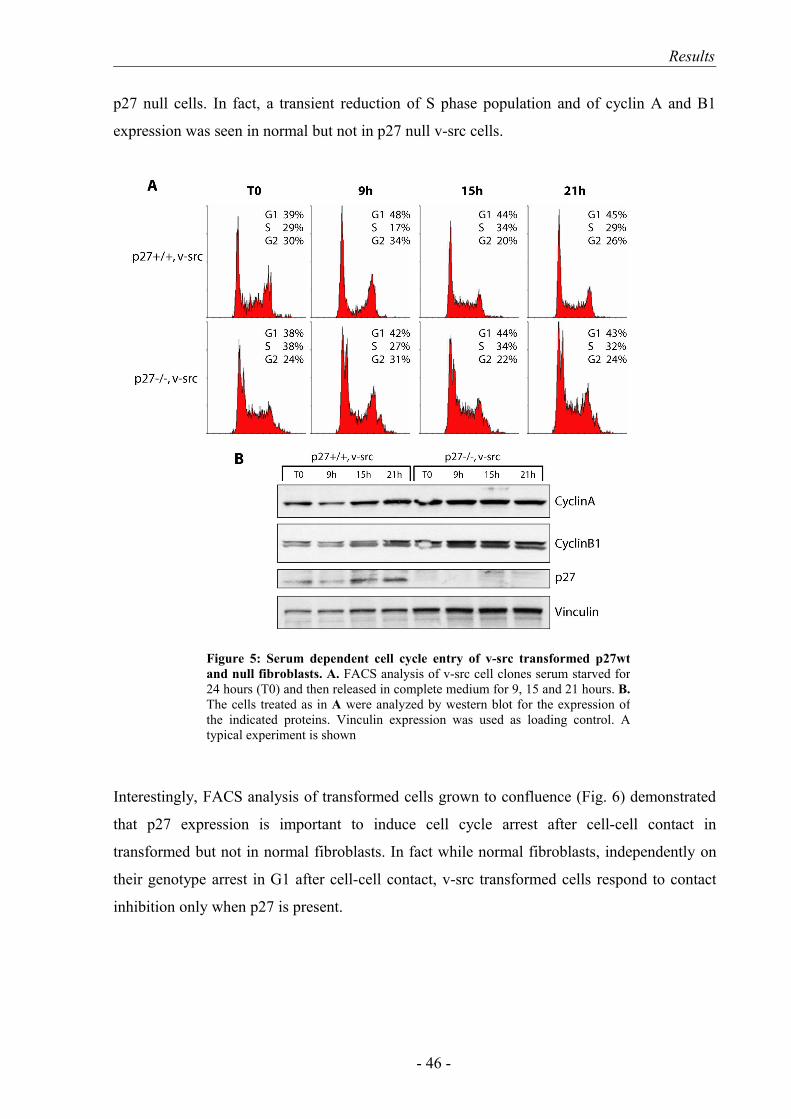
Results
p27 null cells. In fact, a transient reduction of S phase population and of cyclin A and B1
expression was seen in normal but not in p27 null v-src cells.
Interestingly, FACS analysis of transformed cells grown to confluence (Fig. 6) demonstrated
that p27 expression is important to induce cell cycle arrest after cell-cell contact in
transformed but not in normal fibroblasts. In fact while normal fibroblasts, independently on
their genotype arrest in G1 after cell-cell contact, v-src transformed cells respond to contact
inhibition only when p27 is present.
- 46 -
Figure 5: Serum dependent cell cycle entry of v-src transformed p27wt and null fibroblasts. A. FACS analysis of v-src cell clones serum starved for 24 hours (T0) and then released in complete medium for 9, 15 and 21 hours. B.The cells treated as in A were analyzed by western blot for the expression of the indicated proteins. Vinculin expression was used as loading control. A typical experiment is shown

Results
Overall these data demonstrated that p27 plays an important role in the control of cell cycle
progression of v-src transformed fibroblasts and that, in these cells, it has a major function in
the transition between G1 and S phase.
We next analyzed whether v-src fibroblasts were effectively transformed and tumorigenic and
if p27 had any effects on the process of transformation. A typical hallmark of transformed
fibroblasts is the ability to grow in an anchorage independent way and in several model
systems v-src has been proved to be able to confer this ability (Pawlak and Helfman, 2001).
Thus, as a first approach, p27+/+ and p27-/- v-src cells were assayed in a soft agar assay and, as
expected, both resulted able to grow in an anchorage independent way. However, p27 null
cells displayed a significant increase in the number and the size of formed colonies (Fig.
7A,B), a result that is in line with the 2D proliferation assays.
- 47 -
Figure 6: Proliferative behaviour of cells grown to confluence. Normal and v-src transformed cells were grown to confluence and then analysed by FACS. A typical experiment in which two different cell clones/genotype have been analyzed is shown. The distribution of the cells in the different phases of the cell cycle is reported in each histogram.
Figure 7: Characterization of anchorage-independent growth. v-src transformed cells were tested in soft agar assay in triplicate (0,4% TOP, 0,6% BOTTOM of agar concentration). After 8 days, colonies were counted (A) and representative pictures (B) were collected. 10X objective was used and for each cell lines 15 fields were counted. (Student’s t test: p27wt vs p27ko: p<0,001).
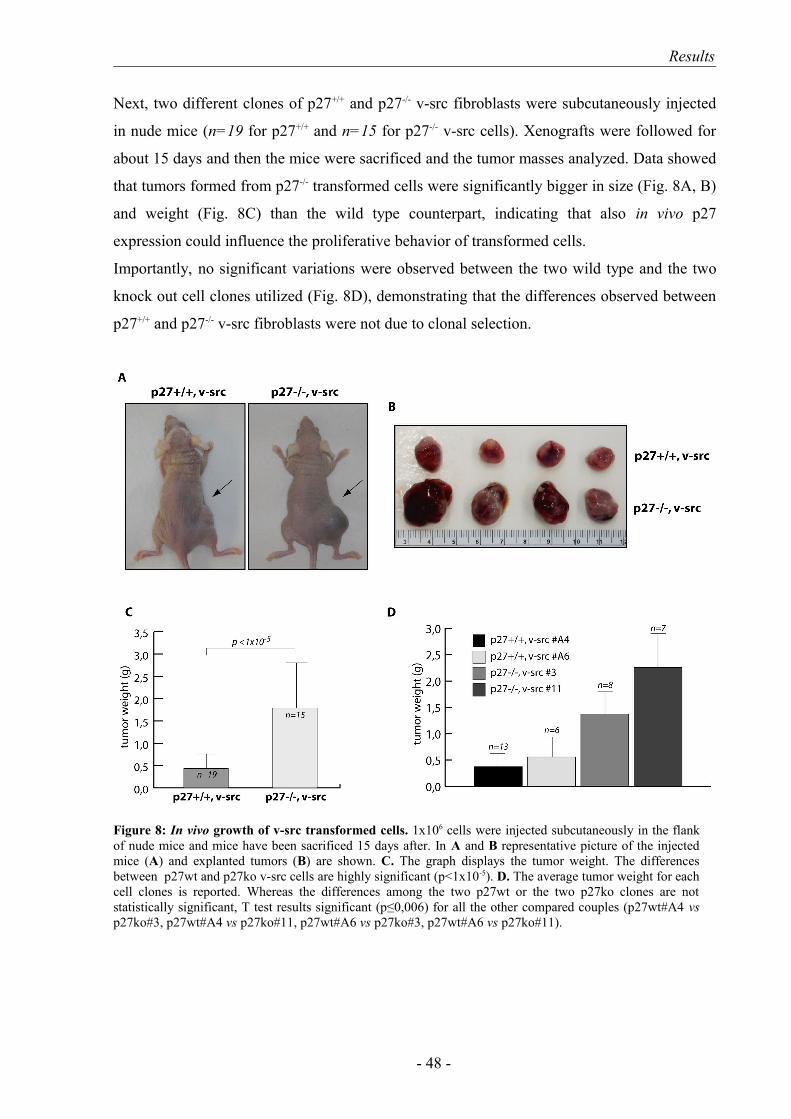
Results
Next, two different clones of p27+/+ and p27-/- v-src fibroblasts were subcutaneously injected
in nude mice (n=19 for p27+/+ and n=15 for p27-/- v-src cells). Xenografts were followed for
about 15 days and then the mice were sacrificed and the tumor masses analyzed. Data showed
that tumors formed from p27-/- transformed cells were significantly bigger in size (Fig. 8A, B)
and weight (Fig. 8C) than the wild type counterpart, indicating that also in vivo p27
expression could influence the proliferative behavior of transformed cells.
Importantly, no significant variations were observed between the two wild type and the two
knock out cell clones utilized (Fig. 8D), demonstrating that the differences observed between
p27+/+ and p27-/- v-src fibroblasts were not due to clonal selection.
- 48 -
Figure 8: In vivo growth of v-src transformed cells. 1x10⁶ cells were injected subcutaneously in the flank of nude mice and mice have been sacrificed 15 days after. In A and B representative picture of the injected mice (A) and explanted tumors (B) are shown. C. The graph displays the tumor weight. The differences between p27wt and p27ko v-src cells are highly significant (p<1x10⁻⁵). D. The average tumor weight for each cell clones is reported. Whereas the differences among the two p27wt or the two p27ko clones are not statistically significant, T test results significant (p≤0,006) for all the other compared couples (p27wt#A4 vs p27ko#3, p27wt#A4 vs p27ko#11, p27wt#A6 vs p27ko#3, p27wt#A6 vs p27ko#11).
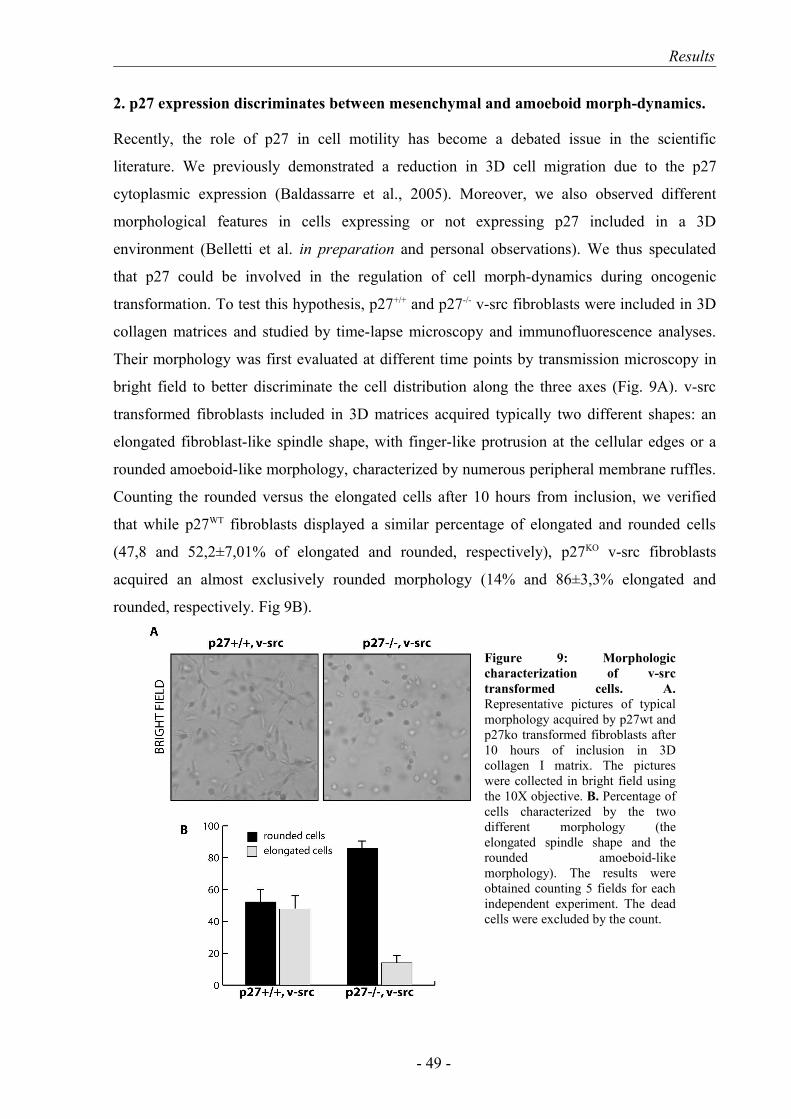
Results
2. p27 expression discriminates between mesenchymal and amoeboid morph-dynamics.
Recently, the role of p27 in cell motility has become a debated issue in the scientific
literature. We previously demonstrated a reduction in 3D cell migration due to the p27
cytoplasmic expression (Baldassarre et al., 2005). Moreover, we also observed different
morphological features in cells expressing or not expressing p27 included in a 3D
environment (Belletti et al. in preparation and personal observations). We thus speculated
that p27 could be involved in the regulation of cell morph-dynamics during oncogenic
transformation. To test this hypothesis, p27+/+ and p27-/- v-src fibroblasts were included in 3D
collagen matrices and studied by time-lapse microscopy and immunofluorescence analyses.
Their morphology was first evaluated at different time points by transmission microscopy in
bright field to better discriminate the cell distribution along the three axes (Fig. 9A). v-src
transformed fibroblasts included in 3D matrices acquired typically two different shapes: an
elongated fibroblast-like spindle shape, with finger-like protrusion at the cellular edges or a
rounded amoeboid-like morphology, characterized by numerous peripheral membrane ruffles.
Counting the rounded versus the elongated cells after 10 hours from inclusion, we verified
that while p27WT fibroblasts displayed a similar percentage of elongated and rounded cells
(47,8 and 52,2±7,01% of elongated and rounded, respectively), p27KO v-src fibroblasts
acquired an almost exclusively rounded morphology (14% and 86±3,3% elongated and
rounded, respectively. Fig 9B).
- 49 -
Figure 9: Morphologic characterization of v-src transformed cells. A. Representative pictures of typical morphology acquired by p27wt and p27ko transformed fibroblasts after 10 hours of inclusion in 3D collagen I matrix. The pictures were collected in bright field using the 10X objective. B. Percentage of cells characterized by the two different morphology (the elongated spindle shape and the rounded amoeboid-like morphology). The results were obtained counting 5 fields for each independent experiment. The dead cells were excluded by the count.

Results
We also evaluated the cytoskeletric structures of transformed cells in 3D using
immunofluorescence and confocal microscopy analysis. p27WT and p27KO v-src fibroblasts
were cultured for 10 hours in collagen matrix and then fixed and stained for tubulin (green)
and actin (red) (Fig. 10). The analysis highlighted the structural differences between cell
expressing or not expressing p27. Most of transformed p27+/+ cells retained a fibroblast-like
elongated morphology with cellular protrusions supported both by the microtubule network
and actin stress fibers. Conversely, p27-/- v-src cells mainly displayed a rounded shape, lose
the dendritic-like extensions and showed an actin cortical distribution and a lower content of
microtubule (Fig. 10).
The same morphological differences were observed also performing time lapse video
microscopy of spheroids included in 3D collagen matrix.
Spheroids are cell clusters obtained by seeding cells in not-adhesive Petri dish or in
polyHEMA-coated plates, thus favouring the cell-cell contacts and in turn the formation of
cellular clumps. After 24 hours spheroids are collected and included in a 3D matrices to
evaluate the 3D cell morphology and motility in a different condition than individual cell
inclusion.
As shown in the photogram at 3, 6 and 9 hours from inclusion and in the movies resulting
from the collection of pictures taken every 4 minutes for at least 12 hours, p27-/- v-src cells
- 50 -
Figure 10: Cytosckeletric structures in v-src transformed cells in 3D matrix. Cells included in 3D collagen I matrix were evaluated after 10 hours of inclusion for their actin and tubulin cytoskeleton. The actin network was stained with Phallotoxin-AlexaFluor546 (RED), whereas for tubulin detection FITC-conjugated monoclonal anti-α-tubulin antibody (GREEN) was used. In grey the collagen fibers are represented (using reflection parameter in confocal microscopy).
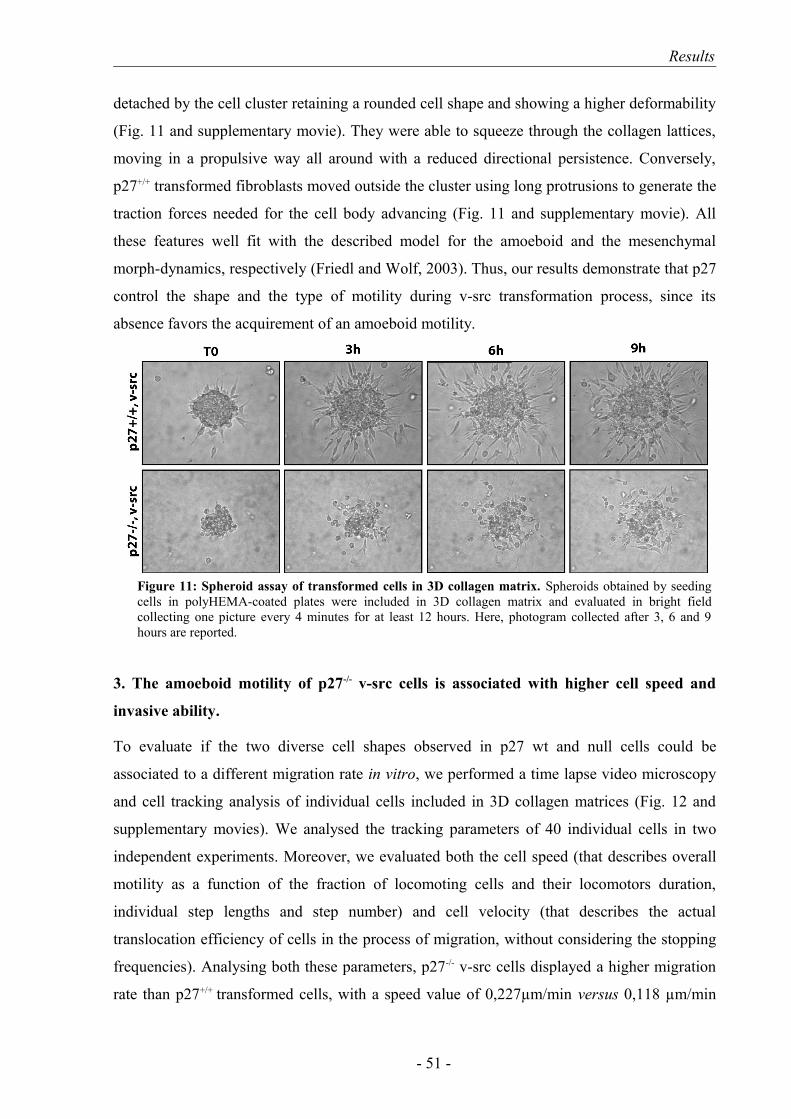
Results
detached by the cell cluster retaining a rounded cell shape and showing a higher deformability
(Fig. 11 and supplementary movie). They were able to squeeze through the collagen lattices,
moving in a propulsive way all around with a reduced directional persistence. Conversely,
p27+/+ transformed fibroblasts moved outside the cluster using long protrusions to generate the
traction forces needed for the cell body advancing (Fig. 11 and supplementary movie). All
these features well fit with the described model for the amoeboid and the mesenchymal
morph-dynamics, respectively (Friedl and Wolf, 2003). Thus, our results demonstrate that p27
control the shape and the type of motility during v-src transformation process, since its
absence favors the acquirement of an amoeboid motility.
3. The amoeboid motility of p27-/- v-src cells is associated with higher cell speed and
invasive ability.
To evaluate if the two diverse cell shapes observed in p27 wt and null cells could be
associated to a different migration rate in vitro, we performed a time lapse video microscopy
and cell tracking analysis of individual cells included in 3D collagen matrices (Fig. 12 and
supplementary movies). We analysed the tracking parameters of 40 individual cells in two
independent experiments. Moreover, we evaluated both the cell speed (that describes overall
motility as a function of the fraction of locomoting cells and their locomotors duration,
individual step lengths and step number) and cell velocity (that describes the actual
translocation efficiency of cells in the process of migration, without considering the stopping
frequencies). Analysing both these parameters, p27-/- v-src cells displayed a higher migration
rate than p27+/+ transformed cells, with a speed value of 0,227µm/min versus 0,118 µm/min
- 51 -
Figure 11: Spheroid assay of transformed cells in 3D collagen matrix. Spheroids obtained by seeding cells in polyHEMA-coated plates were included in 3D collagen matrix and evaluated in bright field collecting one picture every 4 minutes for at least 12 hours. Here, photogram collected after 3, 6 and 9 hours are reported.
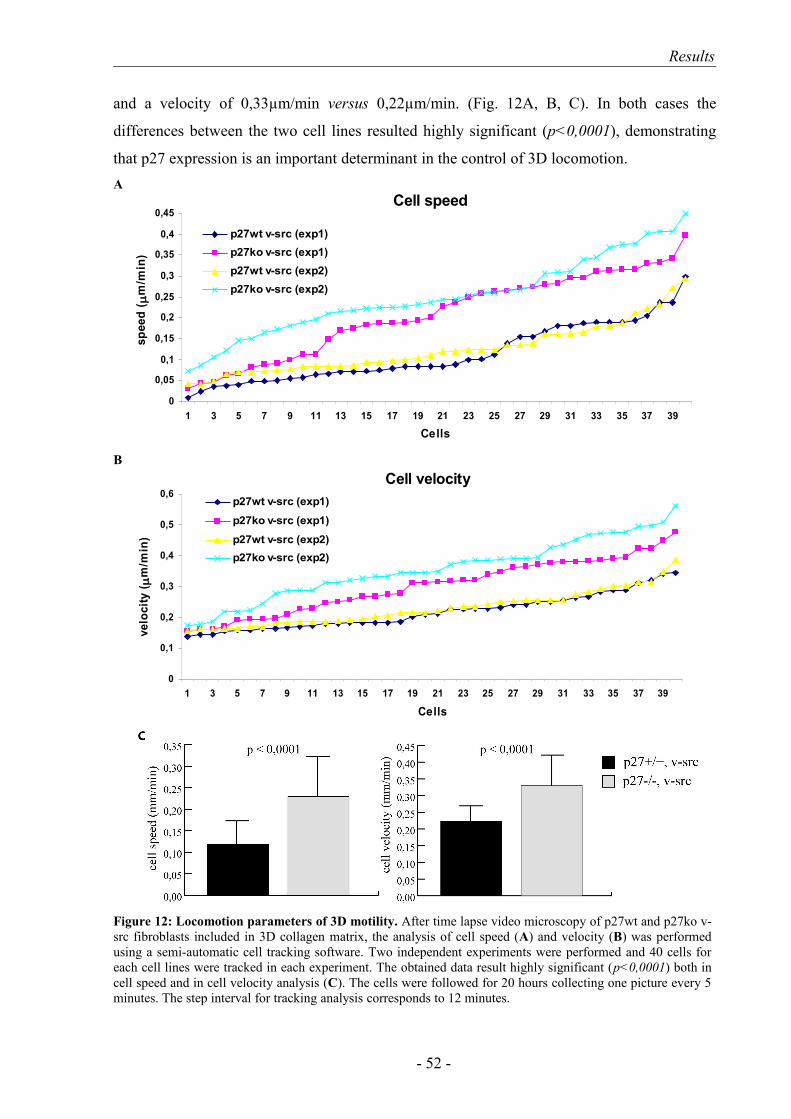
Results
and a velocity of 0,33µm/min versus 0,22µm/min. (Fig. 12A, B, C). In both cases the
differences between the two cell lines resulted highly significant (p<0,0001), demonstrating
that p27 expression is an important determinant in the control of 3D locomotion. A
Cell speed
0
0,05
0,1
0,15
0,2
0,25
0,3
0,35
0,4
0,45
1 3 5 7 9 11 13 15 17 19 21 23 25 27 29 31 33 35 37 39
Cells
spee
d ( m
m/m
in)
p27wt v-src (exp1)p27ko v-src (exp1)p27wt v-src (exp2)p27ko v-src (exp2)
BCell velocity
0
0,1
0,2
0,3
0,4
0,5
0,6
1 3 5 7 9 11 13 15 17 19 21 23 25 27 29 31 33 35 37 39
Cells
velo
city
(m
m/m
in)
p27wt v-src (exp1)
p27ko v-src (exp1)
p27wt v-src (exp2)p27ko v-src (exp2)
- 52 -
Figure 12: Locomotion parameters of 3D motility. After time lapse video microscopy of p27wt and p27ko v-src fibroblasts included in 3D collagen matrix, the analysis of cell speed (A) and velocity (B) was performed using a semi-automatic cell tracking software. Two independent experiments were performed and 40 cells for each cell lines were tracked in each experiment. The obtained data result highly significant (p<0,0001) both in cell speed and in cell velocity analysis (C). The cells were followed for 20 hours collecting one picture every 5 minutes. The step interval for tracking analysis corresponds to 12 minutes.
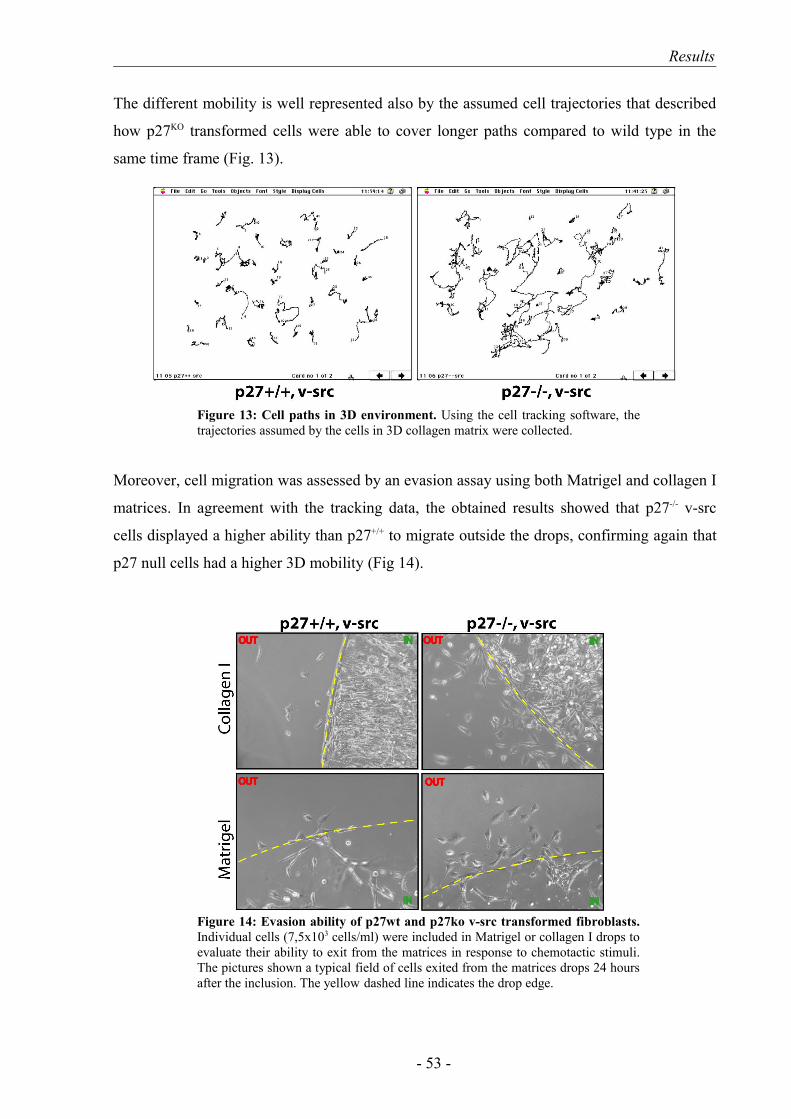
Results
The different mobility is well represented also by the assumed cell trajectories that described
how p27KO transformed cells were able to cover longer paths compared to wild type in the
same time frame (Fig. 13).
Moreover, cell migration was assessed by an evasion assay using both Matrigel and collagen I
matrices. In agreement with the tracking data, the obtained results showed that p27-/- v-src
cells displayed a higher ability than p27+/+ to migrate outside the drops, confirming again that
p27 null cells had a higher 3D mobility (Fig 14).
- 53 -
Figure 13: Cell paths in 3D environment. Using the cell tracking software, the trajectories assumed by the cells in 3D collagen matrix were collected.
Figure 14: Evasion ability of p27wt and p27ko v-src transformed fibroblasts. Individual cells (7,5x10³ cells/ml) were included in Matrigel or collagen I drops to evaluate their ability to exit from the matrices in response to chemotactic stimuli. The pictures shown a typical field of cells exited from the matrices drops 24 hours after the inclusion. The yellow dashed line indicates the drop edge.
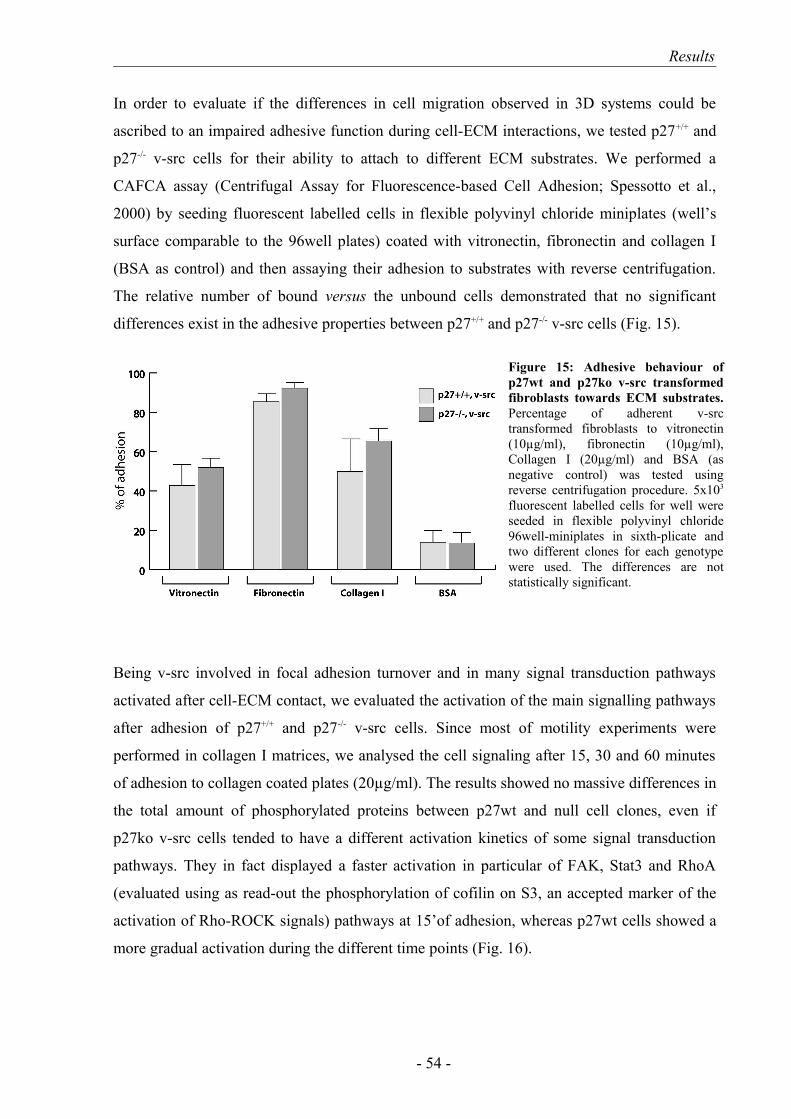
Results
In order to evaluate if the differences in cell migration observed in 3D systems could be
ascribed to an impaired adhesive function during cell-ECM interactions, we tested p27+/+ and
p27-/- v-src cells for their ability to attach to different ECM substrates. We performed a
CAFCA assay (Centrifugal Assay for Fluorescence-based Cell Adhesion; Spessotto et al.,
2000) by seeding fluorescent labelled cells in flexible polyvinyl chloride miniplates (well’s
surface comparable to the 96well plates) coated with vitronectin, fibronectin and collagen I
(BSA as control) and then assaying their adhesion to substrates with reverse centrifugation.
The relative number of bound versus the unbound cells demonstrated that no significant
differences exist in the adhesive properties between p27+/+ and p27-/- v-src cells (Fig. 15).
Being v-src involved in focal adhesion turnover and in many signal transduction pathways
activated after cell-ECM contact, we evaluated the activation of the main signalling pathways
after adhesion of p27+/+ and p27-/- v-src cells. Since most of motility experiments were
performed in collagen I matrices, we analysed the cell signaling after 15, 30 and 60 minutes
of adhesion to collagen coated plates (20µg/ml). The results showed no massive differences in
the total amount of phosphorylated proteins between p27wt and null cell clones, even if
p27ko v-src cells tended to have a different activation kinetics of some signal transduction
pathways. They in fact displayed a faster activation in particular of FAK, Stat3 and RhoA
(evaluated using as read-out the phosphorylation of cofilin on S3, an accepted marker of the
activation of Rho-ROCK signals) pathways at 15’of adhesion, whereas p27wt cells showed a
more gradual activation during the different time points (Fig. 16).
- 54 -
Figure 15: Adhesive behaviour of p27wt and p27ko v-src transformed fibroblasts towards ECM substrates. Percentage of adherent v-src transformed fibroblasts to vitronectin (10µg/ml), fibronectin (10µg/ml), Collagen I (20µg/ml) and BSA (as negative control) was tested using reverse centrifugation procedure. 5x10³
fluorescent labelled cells for well were seeded in flexible polyvinyl chloride 96well-miniplates in sixth-plicate and two different clones for each genotype were used. The differences are not statistically significant.
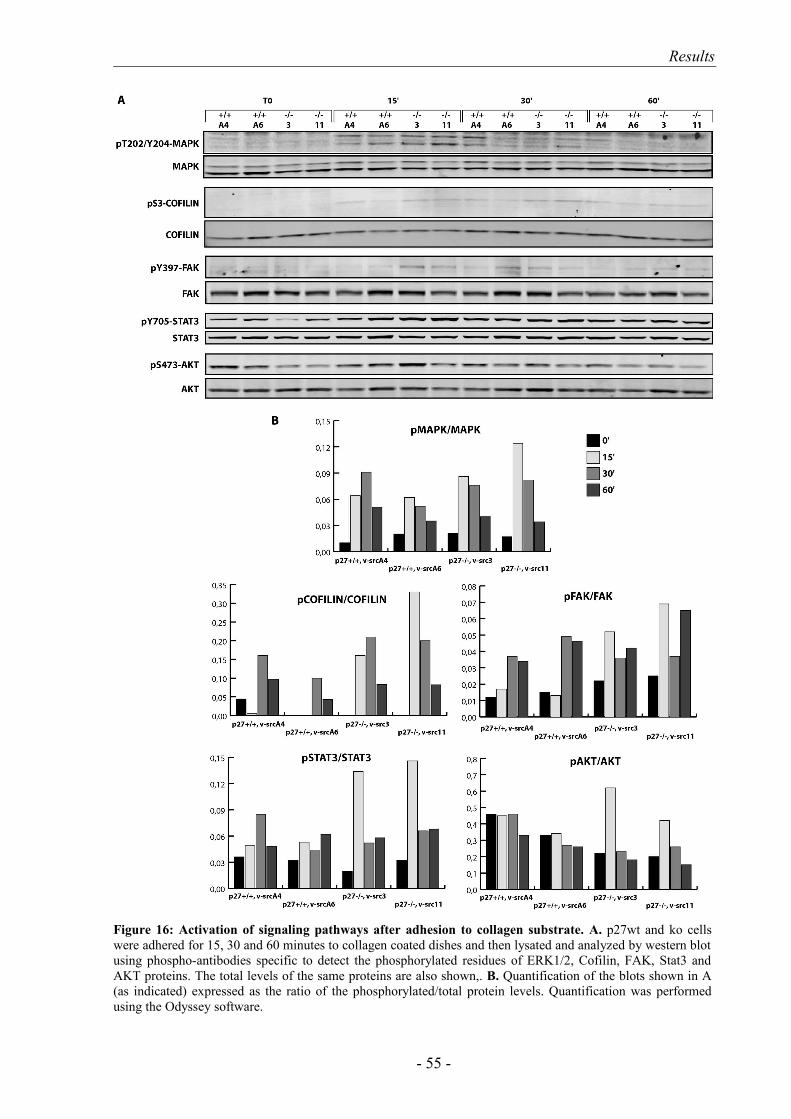
Results
- 55 -
Figure 16: Activation of signaling pathways after adhesion to collagen substrate. A. p27wt and ko cells were adhered for 15, 30 and 60 minutes to collagen coated dishes and then lysated and analyzed by western blot using phospho-antibodies specific to detect the phosphorylated residues of ERK1/2, Cofilin, FAK, Stat3 and AKT proteins. The total levels of the same proteins are also shown,. B. Quantification of the blots shown in A (as indicated) expressed as the ratio of the phosphorylated/total protein levels. Quantification was performed using the Odyssey software.
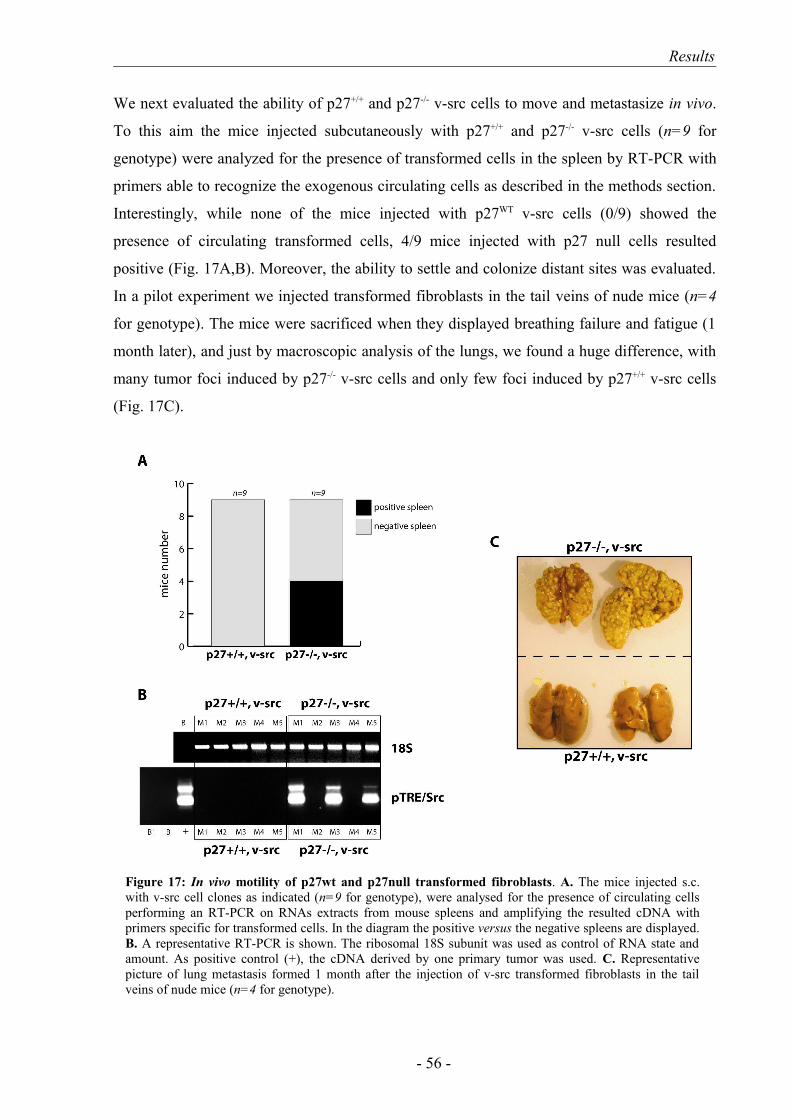
Results
We next evaluated the ability of p27+/+ and p27-/- v-src cells to move and metastasize in vivo.
To this aim the mice injected subcutaneously with p27+/+ and p27-/- v-src cells (n=9 for
genotype) were analyzed for the presence of transformed cells in the spleen by RT-PCR with
primers able to recognize the exogenous circulating cells as described in the methods section.
Interestingly, while none of the mice injected with p27WT v-src cells (0/9) showed the
presence of circulating transformed cells, 4/9 mice injected with p27 null cells resulted
positive (Fig. 17A,B). Moreover, the ability to settle and colonize distant sites was evaluated.
In a pilot experiment we injected transformed fibroblasts in the tail veins of nude mice (n=4
for genotype). The mice were sacrificed when they displayed breathing failure and fatigue (1
month later), and just by macroscopic analysis of the lungs, we found a huge difference, with
many tumor foci induced by p27-/- v-src cells and only few foci induced by p27+/+ v-src cells
(Fig. 17C).
- 56 -
Figure 17: In vivo motility of p27wt and p27null transformed fibroblasts. A. The mice injected s.c. with v-src cell clones as indicated (n=9 for genotype), were analysed for the presence of circulating cells performing an RT-PCR on RNAs extracts from mouse spleens and amplifying the resulted cDNA with primers specific for transformed cells. In the diagram the positive versus the negative spleens are displayed. B. A representative RT-PCR is shown. The ribosomal 18S subunit was used as control of RNA state and amount. As positive control (+), the cDNA derived by one primary tumor was used. C. Representative picture of lung metastasis formed 1 month after the injection of v-src transformed fibroblasts in the tail veins of nude mice (n=4 for genotype).
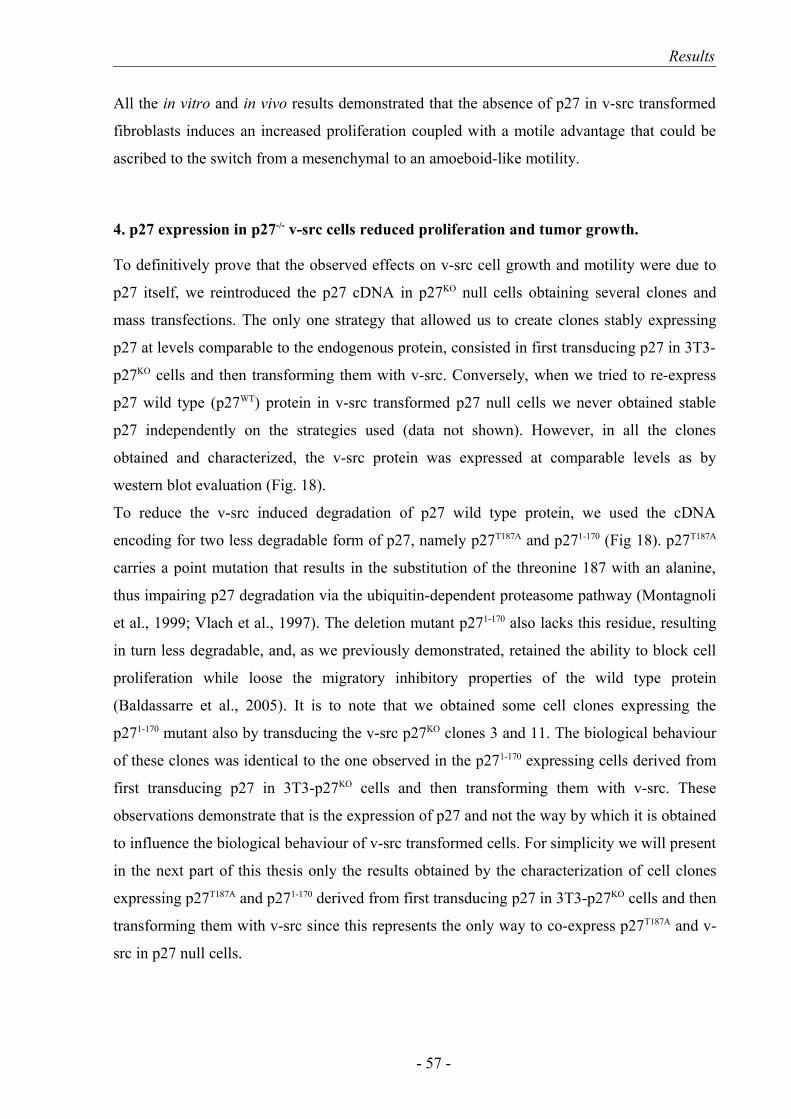
Results
All the in vitro and in vivo results demonstrated that the absence of p27 in v-src transformed
fibroblasts induces an increased proliferation coupled with a motile advantage that could be
ascribed to the switch from a mesenchymal to an amoeboid-like motility.
4. p27 expression in p27-/- v-src cells reduced proliferation and tumor growth.
To definitively prove that the observed effects on v-src cell growth and motility were due to
p27 itself, we reintroduced the p27 cDNA in p27KO null cells obtaining several clones and
mass transfections. The only one strategy that allowed us to create clones stably expressing
p27 at levels comparable to the endogenous protein, consisted in first transducing p27 in 3T3-
p27KO cells and then transforming them with v-src. Conversely, when we tried to re-express
p27 wild type (p27WT) protein in v-src transformed p27 null cells we never obtained stable
p27 independently on the strategies used (data not shown). However, in all the clones
obtained and characterized, the v-src protein was expressed at comparable levels as by
western blot evaluation (Fig. 18).
To reduce the v-src induced degradation of p27 wild type protein, we used the cDNA
encoding for two less degradable form of p27, namely p27T187A and p271-170 (Fig 18). p27T187A
carries a point mutation that results in the substitution of the threonine 187 with an alanine,
thus impairing p27 degradation via the ubiquitin-dependent proteasome pathway (Montagnoli
et al., 1999; Vlach et al., 1997). The deletion mutant p271-170 also lacks this residue, resulting
in turn less degradable, and, as we previously demonstrated, retained the ability to block cell
proliferation while loose the migratory inhibitory properties of the wild type protein
(Baldassarre et al., 2005). It is to note that we obtained some cell clones expressing the
p271-170 mutant also by transducing the v-src p27KO clones 3 and 11. The biological behaviour
of these clones was identical to the one observed in the p271-170 expressing cells derived from
first transducing p27 in 3T3-p27KO cells and then transforming them with v-src. These
observations demonstrate that is the expression of p27 and not the way by which it is obtained
to influence the biological behaviour of v-src transformed cells. For simplicity we will present
in the next part of this thesis only the results obtained by the characterization of cell clones
expressing p27T187A and p271-170 derived from first transducing p27 in 3T3-p27KO cells and then
transforming them with v-src since this represents the only way to co-express p27T187A and v-
src in p27 null cells.
- 57 -
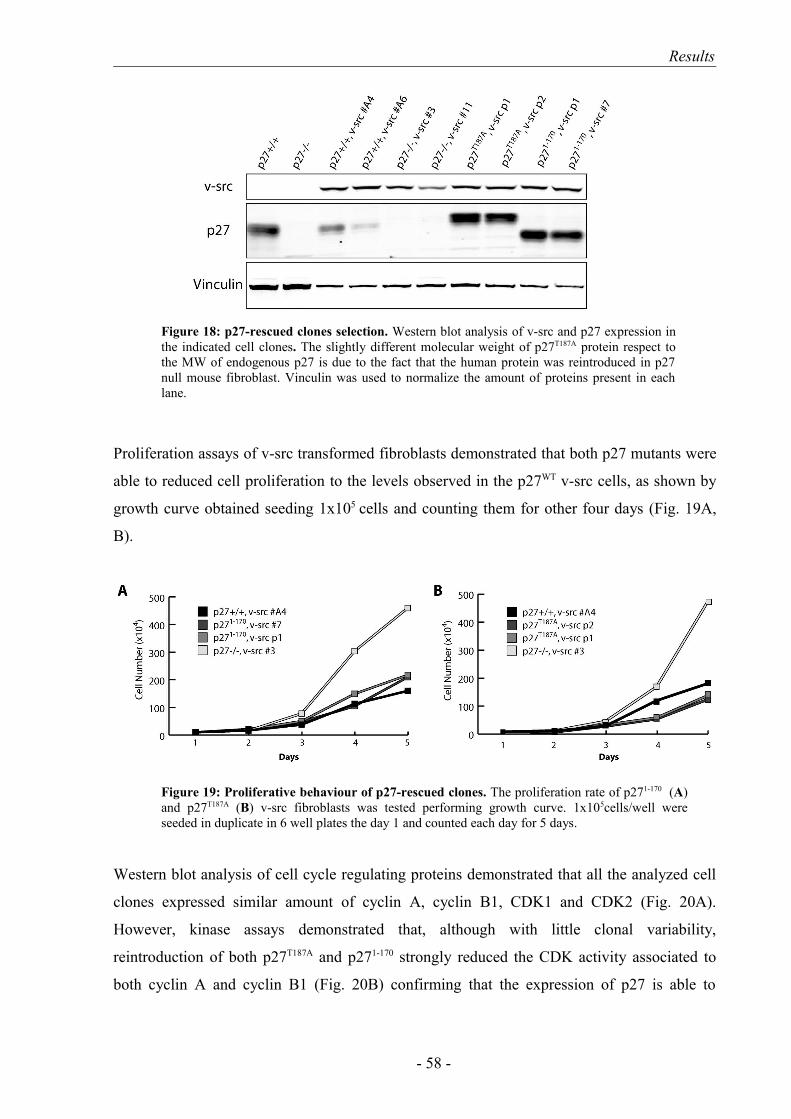
Results
Proliferation assays of v-src transformed fibroblasts demonstrated that both p27 mutants were
able to reduced cell proliferation to the levels observed in the p27WT v-src cells, as shown by
growth curve obtained seeding 1x10⁵ cells and counting them for other four days (Fig. 19A,
B).
Western blot analysis of cell cycle regulating proteins demonstrated that all the analyzed cell
clones expressed similar amount of cyclin A, cyclin B1, CDK1 and CDK2 (Fig. 20A).
However, kinase assays demonstrated that, although with little clonal variability,
reintroduction of both p27T187A and p271-170 strongly reduced the CDK activity associated to
both cyclin A and cyclin B1 (Fig. 20B) confirming that the expression of p27 is able to
- 58 -
Figure 18: p27-rescued clones selection. Western blot analysis of v-src and p27 expression in the indicated cell clones. The slightly different molecular weight of p27T187A protein respect to the MW of endogenous p27 is due to the fact that the human protein was reintroduced in p27 null mouse fibroblast. Vinculin was used to normalize the amount of proteins present in each lane.
Figure 19: Proliferative behaviour of p27-rescued clones. The proliferation rate of p271-170 (A) and p27T187A (B) v-src fibroblasts was tested performing growth curve. 1x10⁵cells/well were seeded in duplicate in 6 well plates the day 1 and counted each day for 5 days.

Results
negatively regulate cell proliferation through an inhibitory effect on the cyclin/CDKs
complexes activity.
We next evaluated whether p27 could rescue also the transformed and tumorigenic potential
in vitro and in vivo. First using soft agar assay, we showed that both p27T187A and p271-170 were
able to reduce anchorage independent cell growth in term of both size and number of the
colonies (Fig. 21A, B) demonstrating that during v-src transformation p27 is an important
determinant for cell growth in semisolid media.
- 59 -
Figure 20: Cyclin-CDK expression and activity in v-src p27-rescued cell lines. A. The expression of cyclin A, cyclin B1, CDK1 and CDK2 in exponentially growing cells was evaluated by western blot. Vinculin was used to normalize the protein lysates. B. A representative panel of kinase assay performed after immunoprecipitation for cyclin A (marker for S phase) and cyclin B1 (marker for G2-M phases). The Histon H1 was used as substrate to evaluate the rate of phosphorylation (with γATP-P32 radioactive labelling).
Figure 21: Analysis of the anchorage-independent growth in p27-rescued clones. A. A soft agar assay was performed using two different clones for each cell lines. The diagram was obtained counting, with 10x objective, the colonies in 15 fields for each cell lines. p27T187A and p271-170 significantly reduced colonies number compared to p27ko v-src clones (*: p=0,007 and §: p<0,0001). B. A representative picture of colonies in 3D agar is reported to show the different colony sizes obtained by each cell line.
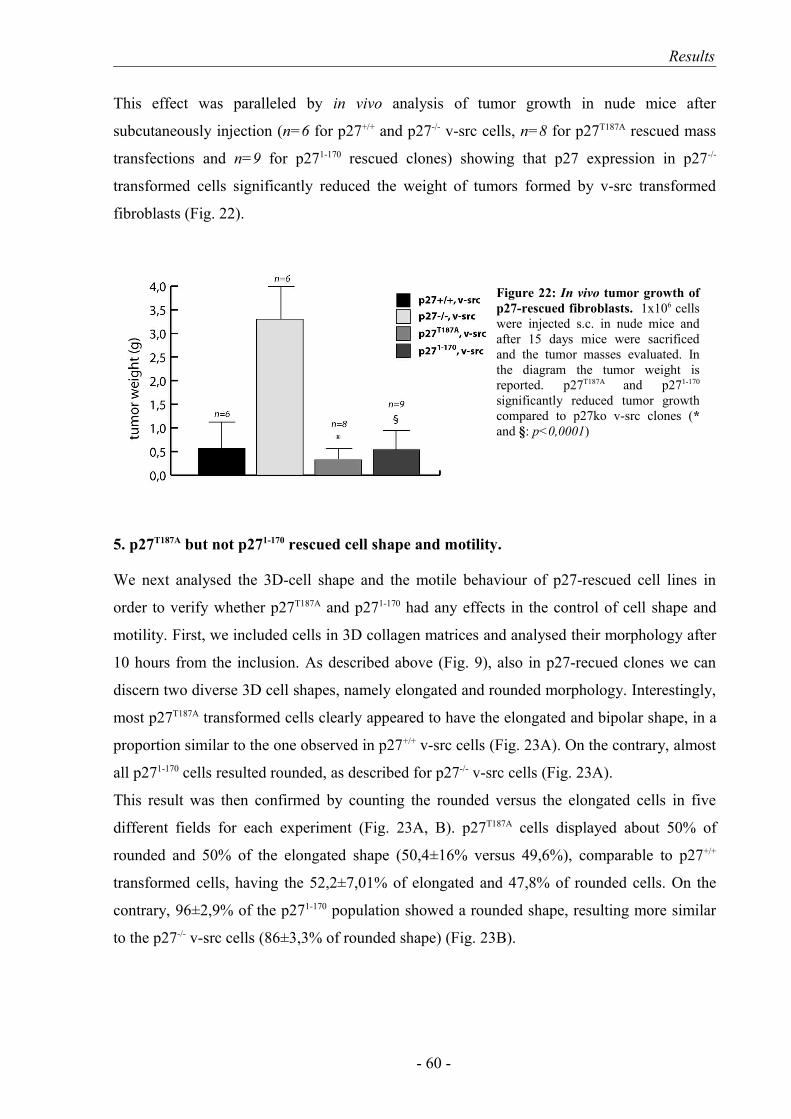
Results
This effect was paralleled by in vivo analysis of tumor growth in nude mice after
subcutaneously injection (n=6 for p27+/+ and p27-/- v-src cells, n=8 for p27T187A rescued mass
transfections and n=9 for p271-170 rescued clones) showing that p27 expression in p27-/-
transformed cells significantly reduced the weight of tumors formed by v-src transformed
fibroblasts (Fig. 22).
5. p27T187A but not p271-170 rescued cell shape and motility.
We next analysed the 3D-cell shape and the motile behaviour of p27-rescued cell lines in
order to verify whether p27T187A and p271-170 had any effects in the control of cell shape and
motility. First, we included cells in 3D collagen matrices and analysed their morphology after
10 hours from the inclusion. As described above (Fig. 9), also in p27-recued clones we can
discern two diverse 3D cell shapes, namely elongated and rounded morphology. Interestingly,
most p27T187A transformed cells clearly appeared to have the elongated and bipolar shape, in a
proportion similar to the one observed in p27+/+ v-src cells (Fig. 23A). On the contrary, almost
all p271-170 cells resulted rounded, as described for p27-/- v-src cells (Fig. 23A).
This result was then confirmed by counting the rounded versus the elongated cells in five
different fields for each experiment (Fig. 23A, B). p27T187A cells displayed about 50% of
rounded and 50% of the elongated shape (50,4±16% versus 49,6%), comparable to p27+/+
transformed cells, having the 52,2±7,01% of elongated and 47,8% of rounded cells. On the
contrary, 96±2,9% of the p271-170 population showed a rounded shape, resulting more similar
to the p27-/- v-src cells (86±3,3% of rounded shape) (Fig. 23B).
- 60 -
Figure 22: In vivo tumor growth of p27-rescued fibroblasts. 1x10⁶ cells were injected s.c. in nude mice and after 15 days mice were sacrificed and the tumor masses evaluated. In the diagram the tumor weight is reported. p27T187A and p271-170
significantly reduced tumor growth compared to p27ko v-src clones (* and §: p<0,0001)
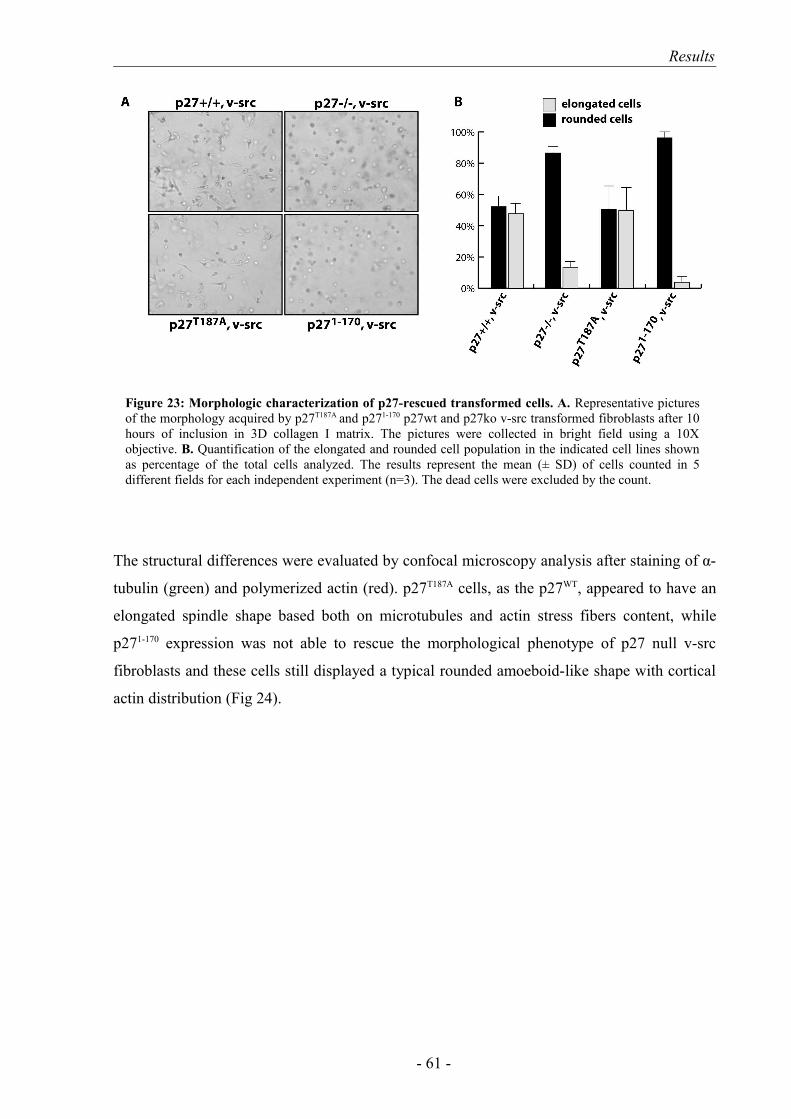
Results
The structural differences were evaluated by confocal microscopy analysis after staining of α-
tubulin (green) and polymerized actin (red). p27T187A cells, as the p27WT, appeared to have an
elongated spindle shape based both on microtubules and actin stress fibers content, while
p271-170 expression was not able to rescue the morphological phenotype of p27 null v-src
fibroblasts and these cells still displayed a typical rounded amoeboid-like shape with cortical
actin distribution (Fig 24).
- 61 -
Figure 23: Morphologic characterization of p27-rescued transformed cells. A. Representative pictures of the morphology acquired by p27T187A and p271-170 p27wt and p27ko v-src transformed fibroblasts after 10 hours of inclusion in 3D collagen I matrix. The pictures were collected in bright field using a 10X objective. B. Quantification of the elongated and rounded cell population in the indicated cell lines shown as percentage of the total cells analyzed. The results represent the mean (± SD) of cells counted in 5 different fields for each independent experiment (n=3). The dead cells were excluded by the count.
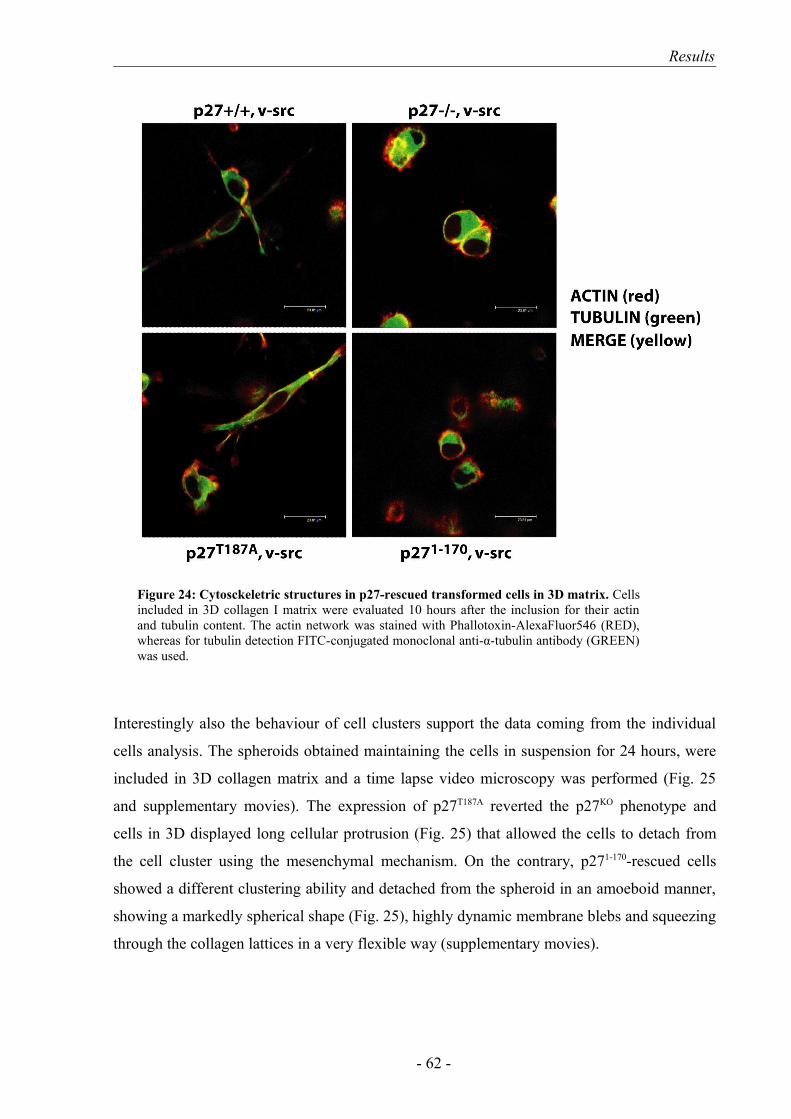
Results
Interestingly also the behaviour of cell clusters support the data coming from the individual
cells analysis. The spheroids obtained maintaining the cells in suspension for 24 hours, were
included in 3D collagen matrix and a time lapse video microscopy was performed (Fig. 25
and supplementary movies). The expression of p27T187A reverted the p27KO phenotype and
cells in 3D displayed long cellular protrusion (Fig. 25) that allowed the cells to detach from
the cell cluster using the mesenchymal mechanism. On the contrary, p271-170-rescued cells
showed a different clustering ability and detached from the spheroid in an amoeboid manner,
showing a markedly spherical shape (Fig. 25), highly dynamic membrane blebs and squeezing
through the collagen lattices in a very flexible way (supplementary movies).
- 62 -
Figure 24: Cytosckeletric structures in p27-rescued transformed cells in 3D matrix. Cells included in 3D collagen I matrix were evaluated 10 hours after the inclusion for their actin and tubulin content. The actin network was stained with Phallotoxin-AlexaFluor546 (RED), whereas for tubulin detection FITC-conjugated monoclonal anti-α-tubulin antibody (GREEN) was used.

Results
6. Migration rate and invasive potential were reduced after p27T187A expression.
The different motility acquired by p27-rescued clones in 3D matrices was coupled by a higher
ability of p271-170 cells to evade from 3D matrices, as demonstrated by evasion assays of
individual cells included in Collagen I and Matrigel drops. As shown in Fig. 26A, 24 hours
after inclusion only few p27+/+ v-src and p27T187A rescued cells were present outside the
matrix. Conversely, p271-170 expression was not able to reduce cell migration of p27 null v-src
cells and many cells were present outside the drops in the same time frame (Fig. 26A).
Counting all the evaded cells (five drops for each cell lines) we confirmed the result in both
the collagen and the Matrigel matrix, suggesting a similar motile behaviour in both the
matrices (Fig. 26B).
- 63 -
Figure 25: Spheroid assay of p27T187A and p271-170 v-src cells in 3D collagen matrix. Spheroids obtained by seeding cells in Petri dish were included in 3D collagen matrix and evaluated in bright field by collecting one picture every 5 minutes for at least 12 hours. Here, photogram collected with a 20X objective after 3, 6 and 9 hours are reported.
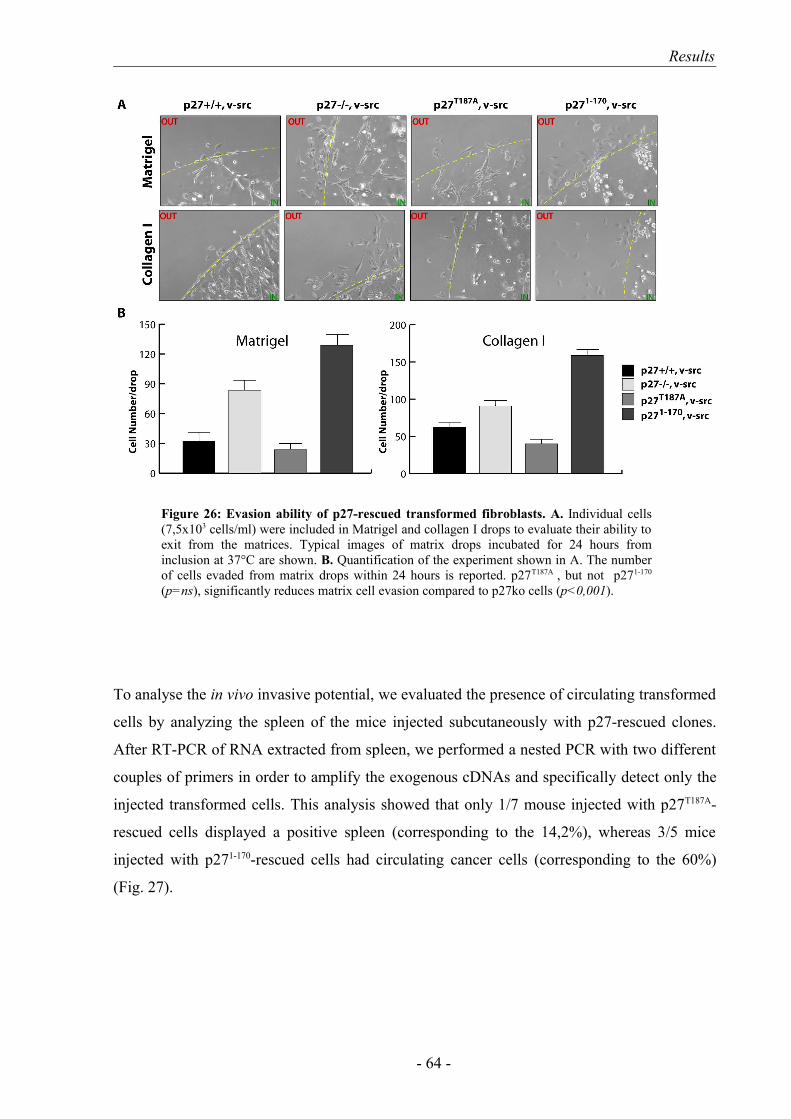
Results
To analyse the in vivo invasive potential, we evaluated the presence of circulating transformed
cells by analyzing the spleen of the mice injected subcutaneously with p27-rescued clones.
After RT-PCR of RNA extracted from spleen, we performed a nested PCR with two different
couples of primers in order to amplify the exogenous cDNAs and specifically detect only the
injected transformed cells. This analysis showed that only 1/7 mouse injected with p27T187A-
rescued cells displayed a positive spleen (corresponding to the 14,2%), whereas 3/5 mice
injected with p271-170-rescued cells had circulating cancer cells (corresponding to the 60%)
(Fig. 27).
- 64 -
Figure 26: Evasion ability of p27-rescued transformed fibroblasts. A. Individual cells (7,5x10³ cells/ml) were included in Matrigel and collagen I drops to evaluate their ability to exit from the matrices. Typical images of matrix drops incubated for 24 hours from inclusion at 37°C are shown. B. Quantification of the experiment shown in A. The number of cells evaded from matrix drops within 24 hours is reported. p27T187A , but not p271-170
(p=ns), significantly reduces matrix cell evasion compared to p27ko cells (p<0,001).
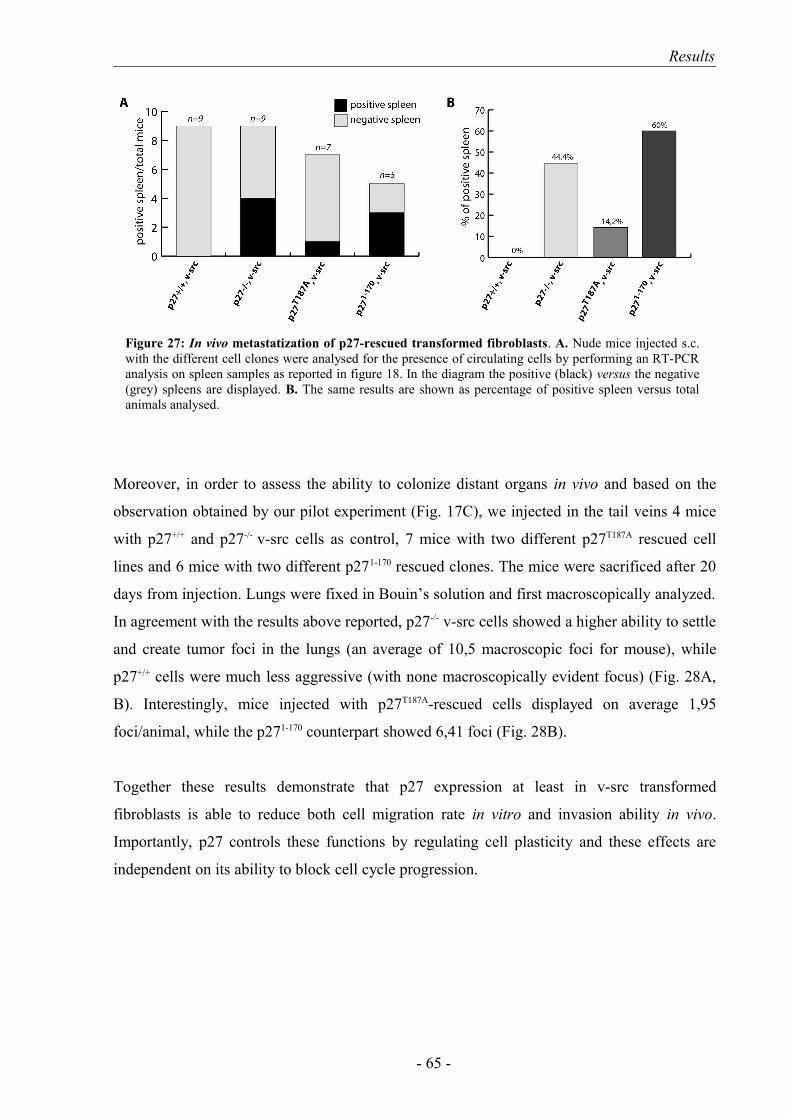
Results
Moreover, in order to assess the ability to colonize distant organs in vivo and based on the
observation obtained by our pilot experiment (Fig. 17C), we injected in the tail veins 4 mice
with p27+/+ and p27-/- v-src cells as control, 7 mice with two different p27T187A rescued cell
lines and 6 mice with two different p271-170 rescued clones. The mice were sacrificed after 20
days from injection. Lungs were fixed in Bouin’s solution and first macroscopically analyzed.
In agreement with the results above reported, p27-/- v-src cells showed a higher ability to settle
and create tumor foci in the lungs (an average of 10,5 macroscopic foci for mouse), while
p27+/+ cells were much less aggressive (with none macroscopically evident focus) (Fig. 28A,
B). Interestingly, mice injected with p27T187A-rescued cells displayed on average 1,95
foci/animal, while the p271-170 counterpart showed 6,41 foci (Fig. 28B).
Together these results demonstrate that p27 expression at least in v-src transformed
fibroblasts is able to reduce both cell migration rate in vitro and invasion ability in vivo.
Importantly, p27 controls these functions by regulating cell plasticity and these effects are
independent on its ability to block cell cycle progression.
- 65 -
Figure 27: In vivo metastatization of p27-rescued transformed fibroblasts. A. Nude mice injected s.c. with the different cell clones were analysed for the presence of circulating cells by performing an RT-PCR analysis on spleen samples as reported in figure 18. In the diagram the positive (black) versus the negative (grey) spleens are displayed. B. The same results are shown as percentage of positive spleen versus total animals analysed.
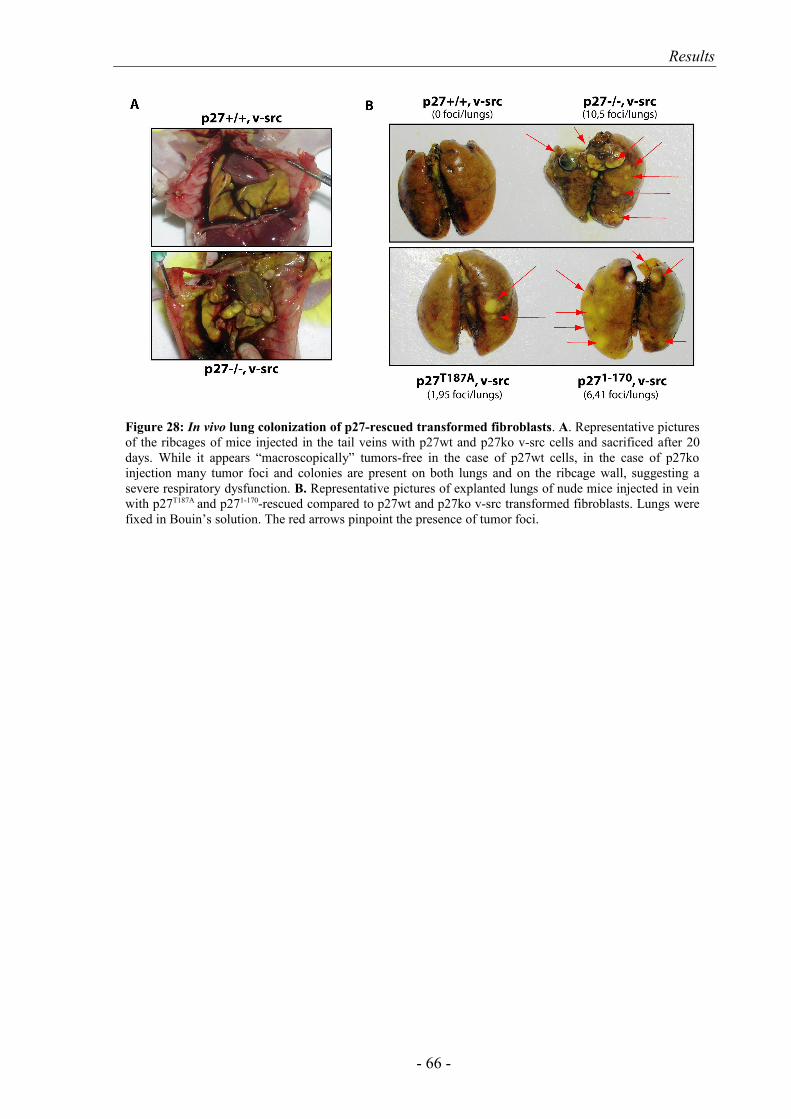
Results
- 66 -
Figure 28: In vivo lung colonization of p27-rescued transformed fibroblasts. A. Representative pictures of the ribcages of mice injected in the tail veins with p27wt and p27ko v-src cells and sacrificed after 20 days. While it appears “macroscopically” tumors-free in the case of p27wt cells, in the case of p27ko injection many tumor foci and colonies are present on both lungs and on the ribcage wall, suggesting a severe respiratory dysfunction. B. Representative pictures of explanted lungs of nude mice injected in vein with p27T187A and p271-170-rescued compared to p27wt and p27ko v-src transformed fibroblasts. Lungs were fixed in Bouin’s solution. The red arrows pinpoint the presence of tumor foci.
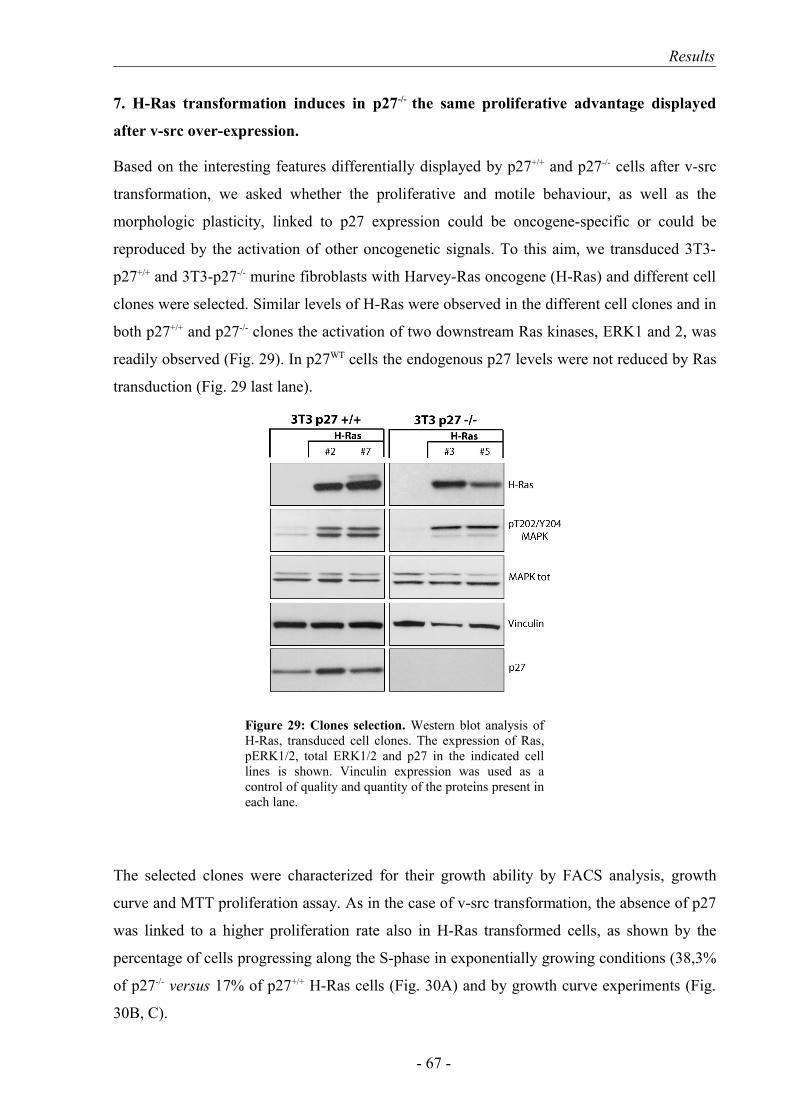
Results
7. H-Ras transformation induces in p27-/- the same proliferative advantage displayed
after v-src over-expression.
Based on the interesting features differentially displayed by p27+/+ and p27-/- cells after v-src
transformation, we asked whether the proliferative and motile behaviour, as well as the
morphologic plasticity, linked to p27 expression could be oncogene-specific or could be
reproduced by the activation of other oncogenetic signals. To this aim, we transduced 3T3-
p27+/+ and 3T3-p27-/- murine fibroblasts with Harvey-Ras oncogene (H-Ras) and different cell
clones were selected. Similar levels of H-Ras were observed in the different cell clones and in
both p27+/+ and p27-/- clones the activation of two downstream Ras kinases, ERK1 and 2, was
readily observed (Fig. 29). In p27WT cells the endogenous p27 levels were not reduced by Ras
transduction (Fig. 29 last lane).
The selected clones were characterized for their growth ability by FACS analysis, growth
curve and MTT proliferation assay. As in the case of v-src transformation, the absence of p27
was linked to a higher proliferation rate also in H-Ras transformed cells, as shown by the
percentage of cells progressing along the S-phase in exponentially growing conditions (38,3%
of p27-/- versus 17% of p27+/+ H-Ras cells (Fig. 30A) and by growth curve experiments (Fig.
30B, C).
- 67 -
Figure 29: Clones selection. Western blot analysis of H-Ras, transduced cell clones. The expression of Ras, pERK1/2, total ERK1/2 and p27 in the indicated cell lines is shown. Vinculin expression was used as a control of quality and quantity of the proteins present in each lane.
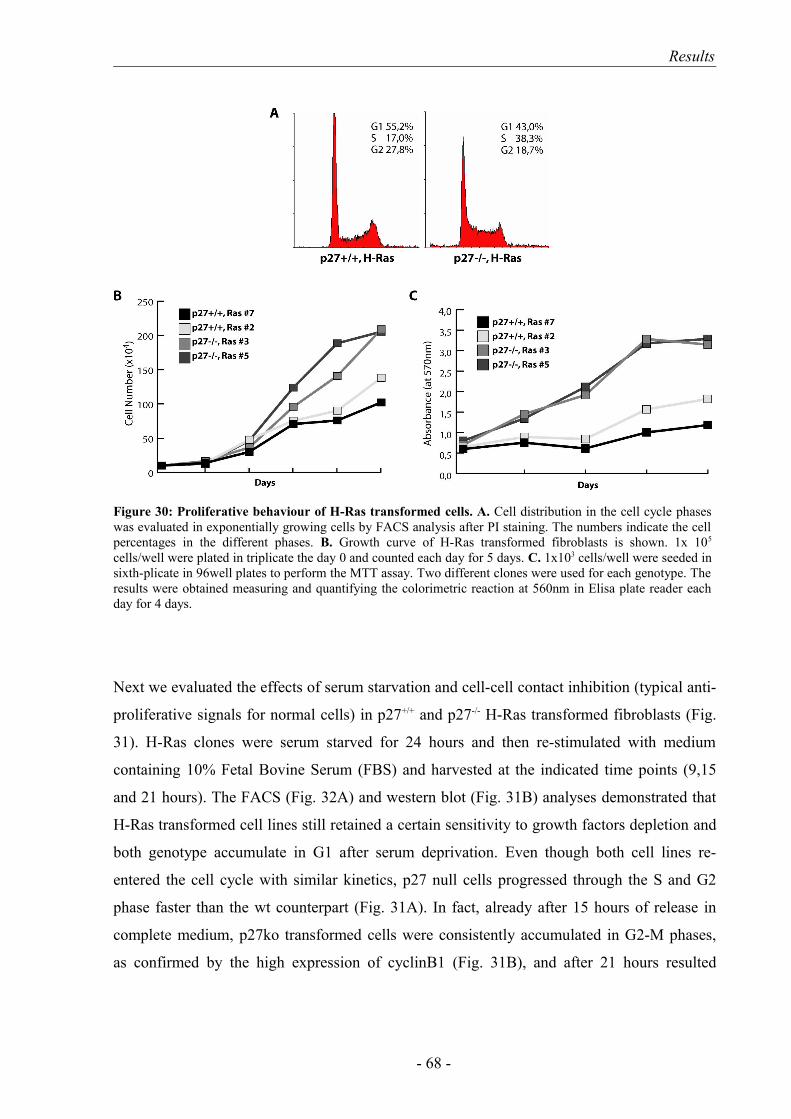
Results
Next we evaluated the effects of serum starvation and cell-cell contact inhibition (typical anti-
proliferative signals for normal cells) in p27+/+ and p27-/- H-Ras transformed fibroblasts (Fig.
31). H-Ras clones were serum starved for 24 hours and then re-stimulated with medium
containing 10% Fetal Bovine Serum (FBS) and harvested at the indicated time points (9,15
and 21 hours). The FACS (Fig. 32A) and western blot (Fig. 31B) analyses demonstrated that
H-Ras transformed cell lines still retained a certain sensitivity to growth factors depletion and
both genotype accumulate in G1 after serum deprivation. Even though both cell lines re-
entered the cell cycle with similar kinetics, p27 null cells progressed through the S and G2
phase faster than the wt counterpart (Fig. 31A). In fact, already after 15 hours of release in
complete medium, p27ko transformed cells were consistently accumulated in G2-M phases,
as confirmed by the high expression of cyclinB1 (Fig. 31B), and after 21 hours resulted
- 68 -
Figure 30: Proliferative behaviour of H-Ras transformed cells. A. Cell distribution in the cell cycle phases was evaluated in exponentially growing cells by FACS analysis after PI staining. The numbers indicate the cell percentages in the different phases. B. Growth curve of H-Ras transformed fibroblasts is shown. 1x 10⁵
cells/well were plated in triplicate the day 0 and counted each day for 5 days. C. 1x10³ cells/well were seeded in sixth-plicate in 96well plates to perform the MTT assay. Two different clones were used for each genotype. The results were obtained measuring and quantifying the colorimetric reaction at 560nm in Elisa plate reader each day for 4 days.
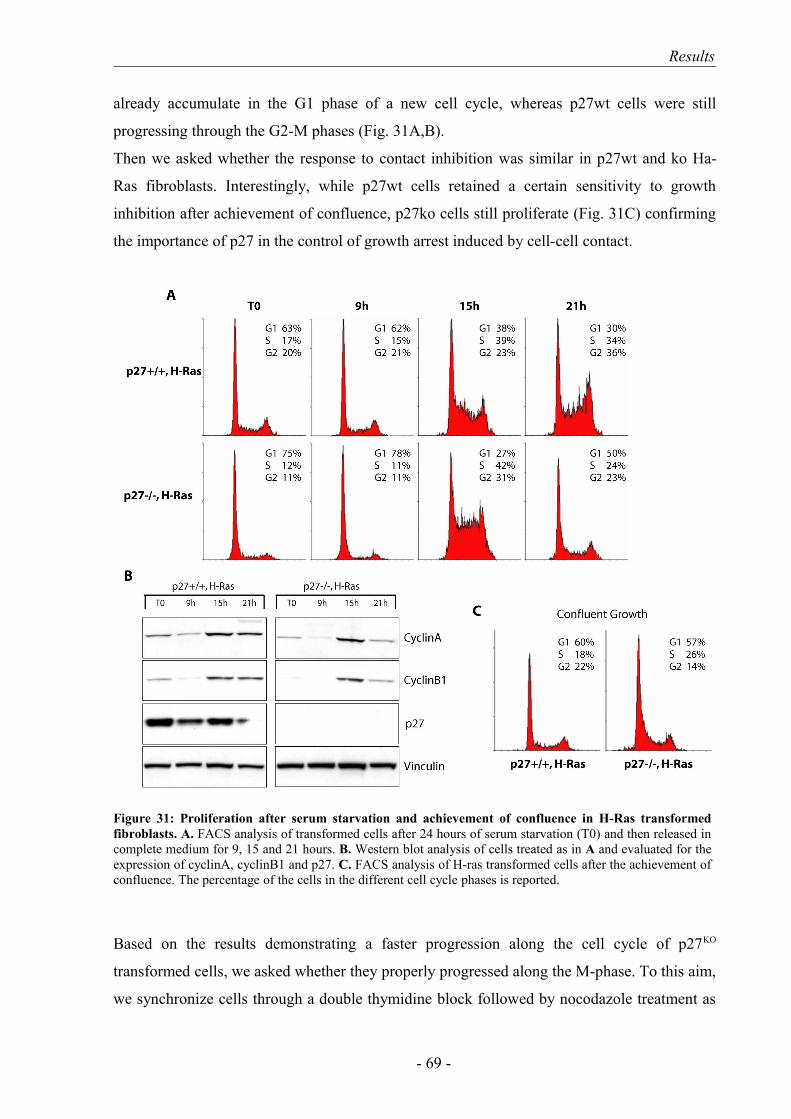
Results
already accumulate in the G1 phase of a new cell cycle, whereas p27wt cells were still
progressing through the G2-M phases (Fig. 31A,B).
Then we asked whether the response to contact inhibition was similar in p27wt and ko Ha-
Ras fibroblasts. Interestingly, while p27wt cells retained a certain sensitivity to growth
inhibition after achievement of confluence, p27ko cells still proliferate (Fig. 31C) confirming
the importance of p27 in the control of growth arrest induced by cell-cell contact.
Based on the results demonstrating a faster progression along the cell cycle of p27KO
transformed cells, we asked whether they properly progressed along the M-phase. To this aim,
we synchronize cells through a double thymidine block followed by nocodazole treatment as
- 69 -
Figure 31: Proliferation after serum starvation and achievement of confluence in H-Ras transformed fibroblasts. A. FACS analysis of transformed cells after 24 hours of serum starvation (T0) and then released in complete medium for 9, 15 and 21 hours. B. Western blot analysis of cells treated as in A and evaluated for the expression of cyclinA, cyclinB1 and p27. C. FACS analysis of H-ras transformed cells after the achievement of confluence. The percentage of the cells in the different cell cycle phases is reported.
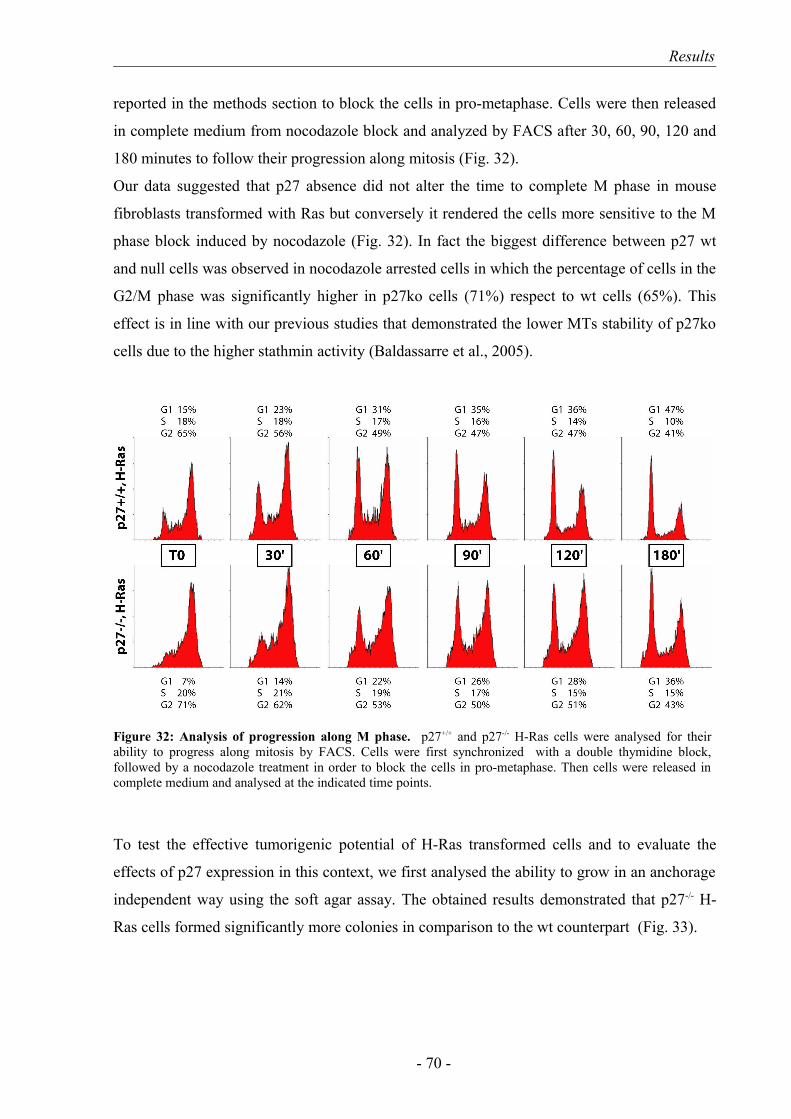
Results
reported in the methods section to block the cells in pro-metaphase. Cells were then released
in complete medium from nocodazole block and analyzed by FACS after 30, 60, 90, 120 and
180 minutes to follow their progression along mitosis (Fig. 32).
Our data suggested that p27 absence did not alter the time to complete M phase in mouse
fibroblasts transformed with Ras but conversely it rendered the cells more sensitive to the M
phase block induced by nocodazole (Fig. 32). In fact the biggest difference between p27 wt
and null cells was observed in nocodazole arrested cells in which the percentage of cells in the
G2/M phase was significantly higher in p27ko cells (71%) respect to wt cells (65%). This
effect is in line with our previous studies that demonstrated the lower MTs stability of p27ko
cells due to the higher stathmin activity (Baldassarre et al., 2005).
To test the effective tumorigenic potential of H-Ras transformed cells and to evaluate the
effects of p27 expression in this context, we first analysed the ability to grow in an anchorage
independent way using the soft agar assay. The obtained results demonstrated that p27-/- H-
Ras cells formed significantly more colonies in comparison to the wt counterpart (Fig. 33).
- 70 -
Figure 32: Analysis of progression along M phase. p27+/+ and p27-/- H-Ras cells were analysed for their ability to progress along mitosis by FACS. Cells were first synchronized with a double thymidine block, followed by a nocodazole treatment in order to block the cells in pro-metaphase. Then cells were released in complete medium and analysed at the indicated time points.
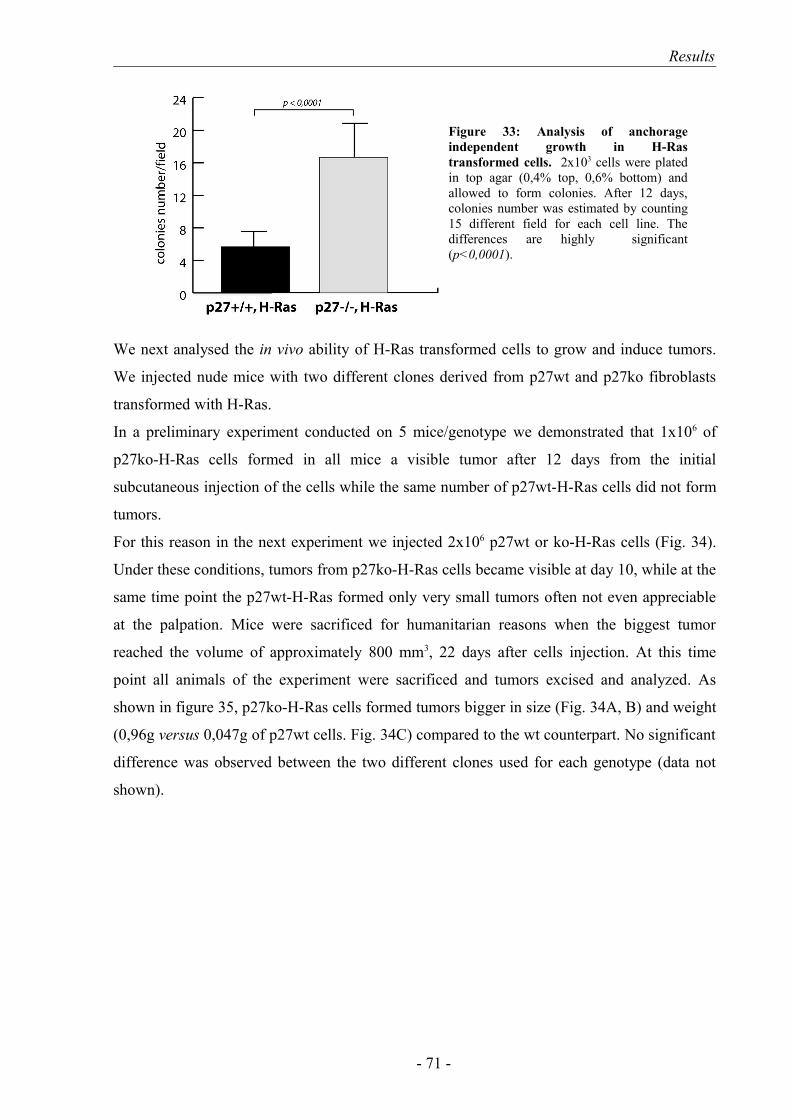
Results
We next analysed the in vivo ability of H-Ras transformed cells to grow and induce tumors.
We injected nude mice with two different clones derived from p27wt and p27ko fibroblasts
transformed with H-Ras.
In a preliminary experiment conducted on 5 mice/genotype we demonstrated that 1x10⁶ of
p27ko-H-Ras cells formed in all mice a visible tumor after 12 days from the initial
subcutaneous injection of the cells while the same number of p27wt-H-Ras cells did not form
tumors.
For this reason in the next experiment we injected 2x10⁶ p27wt or ko-H-Ras cells (Fig. 34).
Under these conditions, tumors from p27ko-H-Ras cells became visible at day 10, while at the
same time point the p27wt-H-Ras formed only very small tumors often not even appreciable
at the palpation. Mice were sacrificed for humanitarian reasons when the biggest tumor
reached the volume of approximately 800 mm3, 22 days after cells injection. At this time
point all animals of the experiment were sacrificed and tumors excised and analyzed. As
shown in figure 35, p27ko-H-Ras cells formed tumors bigger in size (Fig. 34A, B) and weight
(0,96g versus 0,047g of p27wt cells. Fig. 34C) compared to the wt counterpart. No significant
difference was observed between the two different clones used for each genotype (data not
shown).
- 71 -
Figure 33: Analysis of anchorage independent growth in H-Ras transformed cells. 2x10³ cells were plated in top agar (0,4% top, 0,6% bottom) and allowed to form colonies. After 12 days, colonies number was estimated by counting 15 different field for each cell line. The differences are highly significant (p<0,0001).

Results
8. p27-/- fibroblasts displayed an increased cell motility also after H-Ras transformation.
To evaluate whether H-Ras transformed cells were differentially able to migrate or invade the
ECM components as observed in v-src model, p27+/+ and p27-/- fibroblasts were analysed in
Matrigel evasion assay and in haptotactic-like migration assay toward fibronectin (Fig. 35).
The results demonstrated that the absence of p27 conferred higher ability to exit from 3D
matrices, as shown in Figure 35A, since p27-/- H-Ras cells are consistently present outside the
matrigel drops after 2 days from inclusion, whereas p27+/+ cells are still entrapped in the
matrix (Fig. 35A). Moreover, p27-/- H-Ras cells displayed also an increase in the migration
rate in haptotactic-like experiments, compared to p27 wt counterpart (Fig. 35B).
- 72 -
Figure 34: In vivo growth of H-Ras transformed cells. 2x10⁶ cells were injected subcutaneously in the flank of nude mice and mice have been sacrificed 22 days after. In A and B representative picture of the injected mice (A) and explanted tumors (B) are shown. C. The graph displays the tumor weight. Data represent the mean (±SD) of 5 mice/genotype. The differences between p27wt and p27ko H-Ras cells are highly significant (p<1x10⁻⁴).

Results
Further, we tested in vivo motility by analysing the metastatization potential of p27+/+ and
p27-/- H-Ras cells after injection in nude mice. Thus all the animals injected s.c. were analysed
for the presence of circulating transformed cells in the blood and for the presence of distant
metastasis in lungs by RT-PCR. Data shown that p27WT Ras cells were not able to invade the
blood or the lungs while p27 null tumour cells were present both in the blood (3/5) and in the
lungs (4/5) in p27ko of nude mice (part of these results are reported in Fig. 39), demonstrating
that p27 absence increased the metastatic potential also of H-ras transformed fibroblasts.
9. p27-rescue in p27-/- H-Ras transformed cells: a more complicated scenario.
In order to understand whether the expression of p27 protein was able to revert the
proliferative and motile phenotype shown in vitro and the oncogenic potential shown in vivo,
we de novo expressed p27 cDNA into p27-/- H-Ras cells. We used a p27 wild type form and
the deletion mutant lacking the last 28 aminoacids (p271-170) described above to generate
stable mass transfections (Fig. 36).
- 73 -
Figure 35: In vitro motility of H-Ras transformed cells. A. Matrigel evasion assay. Representative pictures showing the motile behaviour of p27wt and p27ko H-Ras cells included in 3D matrigel. The pictures were collected two days after the inclusion. The yellow dashed line indicates the drop edge. B. Migration assay. The diagram shows the percentage of cells migrated toward Fibronectin substrate in transwell-based migration assay. Data were collected after 3, 5 and 7 hours from the seeding.
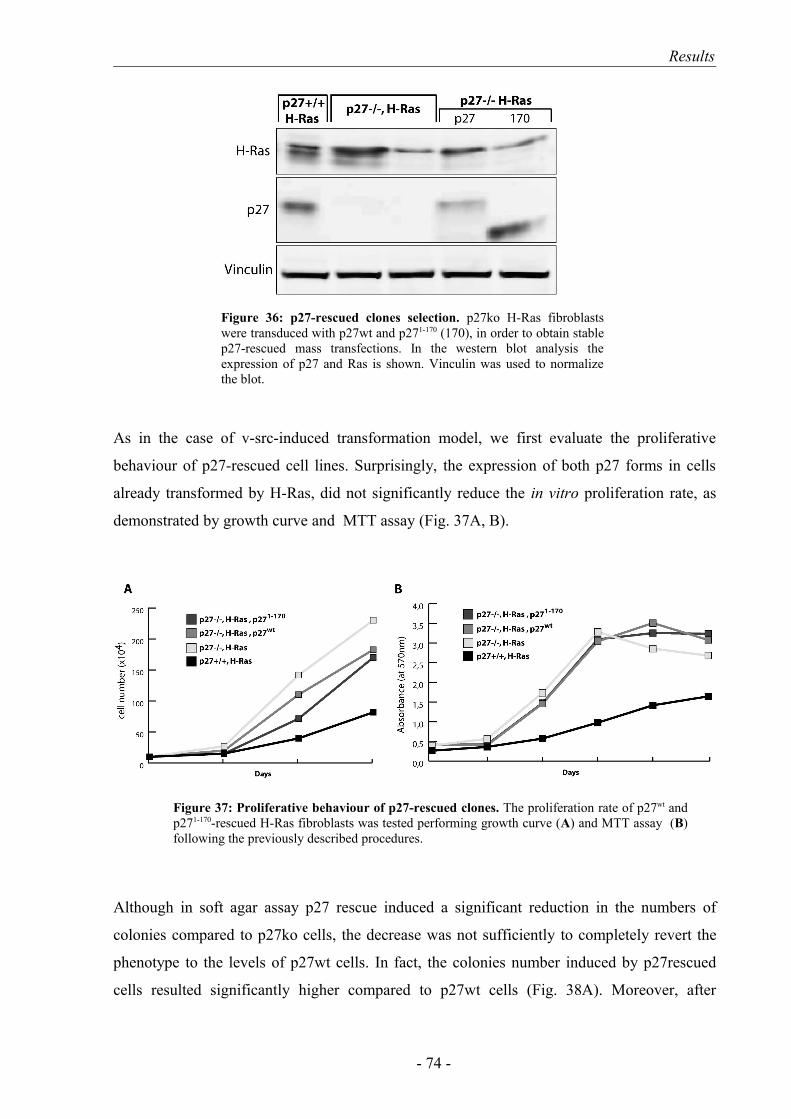
Results
As in the case of v-src-induced transformation model, we first evaluate the proliferative
behaviour of p27-rescued cell lines. Surprisingly, the expression of both p27 forms in cells
already transformed by H-Ras, did not significantly reduce the in vitro proliferation rate, as
demonstrated by growth curve and MTT assay (Fig. 37A, B).
Although in soft agar assay p27 rescue induced a significant reduction in the numbers of
colonies compared to p27ko cells, the decrease was not sufficiently to completely revert the
phenotype to the levels of p27wt cells. In fact, the colonies number induced by p27rescued
cells resulted significantly higher compared to p27wt cells (Fig. 38A). Moreover, after
- 74 -
Figure 36: p27-rescued clones selection. p27ko H-Ras fibroblasts were transduced with p27wt and p271-170 (170), in order to obtain stable p27-rescued mass transfections. In the western blot analysis the expression of p27 and Ras is shown. Vinculin was used to normalize the blot.
Figure 37: Proliferative behaviour of p27-rescued clones. The proliferation rate of p27wt and p271-170-rescued H-Ras fibroblasts was tested performing growth curve (A) and MTT assay (B) following the previously described procedures.

Results
injection in nude mice, the expression of p27 in both forms was not sufficient to reduce tumor
growth (Fig. 38B).
All the results collected about the proliferative behaviour suggest that additional genetic
alterations probably came out after H-Ras transformation and made the phenotype not more
reversible with the expression of p27.
Interestingly, when motility of p27-rescued cells was analysed, we noticed that the
reintroduction of p27wt cDNA but not p271-170 in H-Ras transformed cells strongly affected
cell motility both in vitro (in evasion assay. Fig. 39A) and in vivo, as analysed by RT-PCR
looking for circulating cells in the blood and for distant metastasis in lungs (Fig. 39B).
All together, the results collected using the H-Ras model well confirm those obtained after v-
src- transformation, suggesting that the proliferative and motile advantage, displayed after
oncogene transformation in cells lacking p27, could be, at least in part, ascribed to common
“oncogene-independent” pathways.
- 75 -
Figure 38: Analysis of tumorigenic potential in p27-rescued H-Ras transformed cells. A. Soft agar assay was performed to evaluate the anchorage-independent cell growth. Colonies were counted after 12 days from seeding in 3D agar and 15 field for each cell lines were analysed. B. In the graph, the weight of tumors induced by H-Ras transformed cells are reported. For the experiment, 5 mice/genotype were used and 1x10⁶ cells were injected s.c.
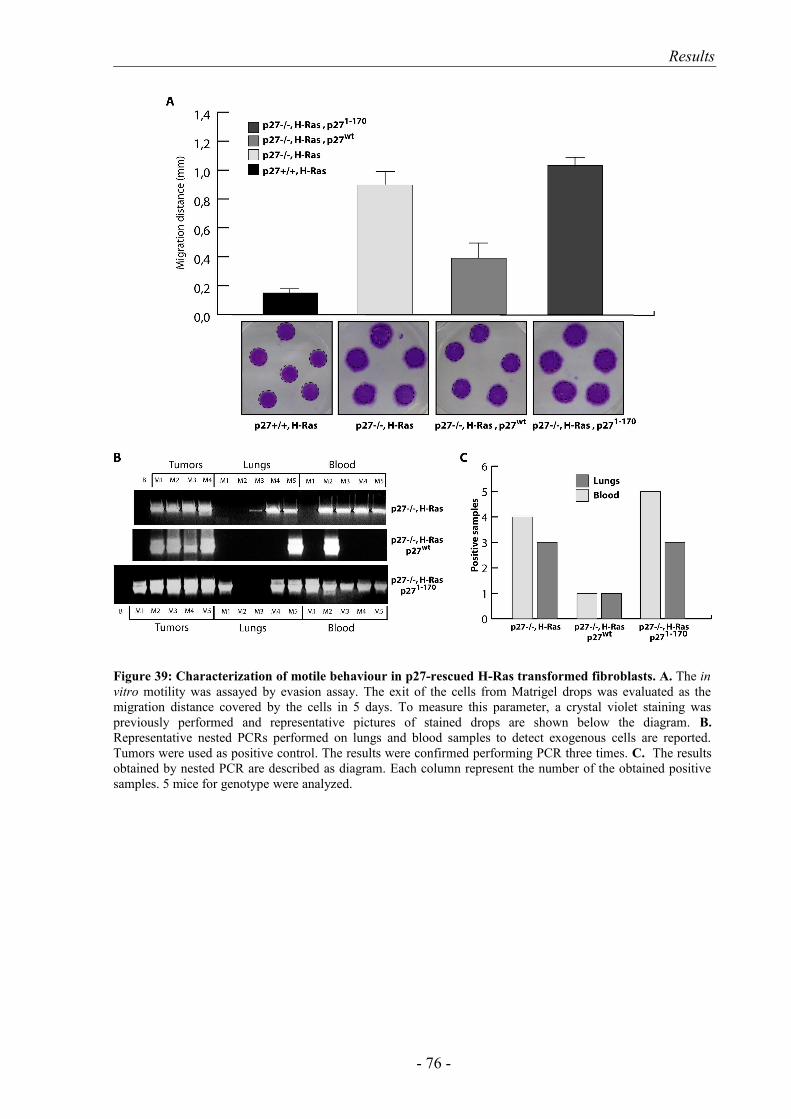
Results
- 76 -
Figure 39: Characterization of motile behaviour in p27-rescued H-Ras transformed fibroblasts. A. The in vitro motility was assayed by evasion assay. The exit of the cells from Matrigel drops was evaluated as the migration distance covered by the cells in 5 days. To measure this parameter, a crystal violet staining was previously performed and representative pictures of stained drops are shown below the diagram. B. Representative nested PCRs performed on lungs and blood samples to detect exogenous cells are reported. Tumors were used as positive control. The results were confirmed performing PCR three times. C. The results obtained by nested PCR are described as diagram. Each column represent the number of the obtained positive samples. 5 mice for genotype were analyzed.
Discussion
DISCUSSION
Uncontrolled cell proliferation as well as tissue invasion and metastasis represent two of the
most important hallmarks in cancer (Hanahan and Weinberg, 2000). Metastasis is one of the
main cause of death in cancer patients affected by several types of neoplasia and the
progression to a metastatic tumor phenotype often is associated to a worse prognosis
(Condeelis and Segall, 2003). Thus, one of the most successful strategy in cancer treatment
could be represented by the combination of drugs that minimize the growth of existing tumors
and, at the same time, limit their spread and diffusion to new sites. But, while treatments for
primary tumor growth have clear and measurable end points, the development of anti-
metastasis treatments is more difficult and will depend on a detailed understanding of the
basic steps in metastasis formation, beginning at the primary tumor and ending with the
establishment of new tumors in distant organs (Condeelis and Segall, 2003).
The recent advances in techniques of in vivo imaging and in the use and development of
animal models have clearly demonstrated the complexity of motile strategies and molecular
adaptive responses displayed by the cells when placed in a more physiological context than
classical experimental 2D environment (Friedl and Wolf, 2003; Wolf and Friedl, 2006; Sahai
and Marshall, 2003; Condeelis and Segall, 2003). Moreover, emerging evidences have
suggested that the several described migration mechanisms could be associated to a different
ability of tumor cells to locally invade and/or to disseminate at distance, resulting differently
able to induce metastasis in vivo.
Among all the molecular effectors that could display a role in tumor progression, particular
interest has received the inhibitor of cyclin-CDK complexes p27kip1 (p27). p27 represents an
ideal target displaying on one hand an inhibitory effect in cell cycle progression (Belletti et
al., 2005) and on the other hand by reducing cell migration both in vitro and in vivo
(Baldassarre et al., 2005; Schiappacassi et al., submitted 2008; Yuan et al., 2007). Moreover,
many human cancers express decreased amounts of p27 compared to normal tissues. The
reduced p27 expression often correlates with increased tumor aggressiveness and a poor
clinical outcome, and p27 protein levels result an independent prognostic factor for many of
these tumors (Bloom and Pagano, 2003; Slingerland and Pagano, 2000; Philipp-Staheli et al.,
2001).
Thus, in this PhD thesis we have focused our attention on the role of p27 in the process of
neoplastic transformation, pinpointing the effects strictly associated to p27 expression or to its
absence. To this aim, we have used murine fibroblasts, previously immortalized with 3T3
- 77 -
Discussion
protocol, derived from embryos wild type or knock out for the cdkn1b gene, encoding for the
p27 protein. 3T3p27+/+ and p27-/- were then transformed by over-expression of v-src oncogene
and different cell clones were analysed and fully characterized. H-Ras oncogene was used in
the same manner to highlight common responses or different “oncogene-specific” effects.
1. p27 controls cell proliferation in transformed cell cultures and in vivo tumor growth.
The characterization of in vitro proliferative behaviour demonstrated that p27 absence in v-src
transformed cells correlated with an increased cell growth, as demonstrated by the S-phase
cell fraction and growth curves. The same result was also observed after H-Ras
transformation, indicating that the proliferative advantage could be an “oncogene-
independent” effect.
Whether this observation agrees with the role of p27 as tumor suppressor gene, it differs from
the behaviour described in normal fibroblasts, in which the absence of p27 is not associated,
at least apparently, to major differences in the proliferation rate (our observations and
Nakayama et al., 1996). These observations suggest that the correct cell cycle progression in
normal p27-/- cells is ensured by compensatory and redundant mechanisms that, after
challenging with oncogene stimuli, result no more sufficient to exert a full inhibition of cell
cycle progression and, consequently, to control the cell proliferation. These effects of p27
seem to be mediated by a higher CDK1 and CDK2 activity that could be readily observed in
p27-/- v-src fibroblasts. Moreover, although p27+/+ and p27-/- embryonal fibroblasts are
characterized by similar proliferative response to contact inhibition (Nakayama et al., 1996),
we were able to highlight some differences after oncogenes transformation between the two
genotypes. In particular, p27 expression resulted important to retain at least a partial activity
in cell cycle inhibition after cell-cell contact in both v-src and H-Ras transformed cells. This
observation is of extreme importance in the understanding of cell transformation process since
loss of contact inhibition of cell growth is a hallmark of cancer cells. Our observation,
although not completely confirmed in normal p27 null mouse fibroblasts, was not completely
unexpected since previous work linked the contact-dependent block of cell proliferation to
p27 expression (Polyak et al., 1994; Coats et al., 1996). Moreover, the observation that p27ko
mice are bigger in size respect to the wild type littermate (Nakayama et al, 1996; Fero et al.,
1996; Kiokawa et al., 1996) suggests that also in vivo the cell-cell contact inhibition could not
properly works. In accord with our in vitro and in vivo observations it has been demonstrated
that p27 null animals are not able to guarantee the same response after oncogenetic
challenges. In fact, even if p27 KO mice are relatively free of malignancies, they show a
- 78 -
Discussion
decreased tumor-free survival following γ-irradiation and an increased tumor-related mortality
following treatment with chemical carcinogens, with a dose dependent effect (Fero et al.,
1998).
The in vitro proliferative advantage of transformed p27 null cells was confirmed also in vivo,
as demonstrated by the growth of xenograft sarcomas after s.c. injection in nude mice. In both
v-src and H-Ras models, p27 absence is strictly associated to the induction of significantly
bigger masses. But while in v-src transformation p27-rescued expression impairs tumor
growth and completely reverts the phenotype, in H-Ras model the picture appears more
complicated. In fact the expression of p27 is not sufficient to decrease in vivo growth,
suggesting that other genetic alterations could be induced during Ras transformation.
Moreover, the tumor suppressive activity of p27 is well supported by the data collected using
an adenoviral approach for target gene therapy in glioblastomas (Schiappacassi et al.,
accepted for publication 2008). In this tumor model, the over-expression of p27 strongly
impairs the in vivo tumor growth, suggesting that p27 expression could be an important
determinant in progression of several tumor types (Schiappacassi et al., accepted for
publication 2008).
2. p27 influences 3D cellular morph-dynamics and in vivo tumor dissemination.
The more interesting feature demonstrated in this study is represented by the description of a
new p27 function in the control of cellular morph-dynamics.
Tumor cells possess a broad spectrum of migration mechanisms to infiltrate surrounding
matrices and to overcome tissue barriers, but they haven’t been clearly elucidated yet (Friedl
and Wolf, 2003; Friedl, 2004). In our work, we have observed that after v-src transformation,
3T3 fibroblasts can assume mainly two different cell morphologies in 3D collagen context.
They can display an elongated spindle-like cell shape, typical of mesenchymal cells,
characterized by finger-like protrusions at the cellular edges and actin stress fibers and,
moreover, they can assume a rounded amoeboid-like cell shape, with several peripheral
membrane ruffles, lost of the dendritic-like extensions and an actin cortical distribution.
Interestingly, the percentage of cells that display the two different morphologies significantly
changes according to p27 expression. The absence of p27 increases the number of rounded
cells from the 52,2% to the 86%, whereas only the 14% of p27 null cells appear elongated.
Till now, no one study has demonstrated a correlation between the expression of any cell
cycle inhibitors and cell shape, even if it is known that cell proliferation requires important
- 79 -
Discussion
rearrangements in cell morphology to allow a proper cell division (Théry and Bornens, 2006;
Meyers et al., 2006). The use of different p27 cDNAs allowed us to map the function of cell
shape regulation in the C-terminus region of p27 protein. In fact, although p27 full length
protein completely reverts the morphologic traits of p27null v-src cells, the deletion mutant
lacking the last 28 aminoacids (p271-170) is not able to rescue the morphology and,
consequently, cells result almost all rounded and amoeboid.
Importantly the different cell morphologies assumed by p27+/+ and p27-/- v-src cells in 3D
matrices strongly influence the motile behavior and the migration rate. With the aid of time
lapse video microscopy and cell tracking software to analyze migration parameters, we had
the opportunity to study and directly visualized motility of individual and clustered cells in
3D environment, mimicking in a fascinating way a “physiologic” context. Using these
experimental approaches, p27-/- v-src cells clearly display an amoeboid motility characterized
by a very flexible cell shape associated with highly dynamic membrane blebs and by the
ability to rapidly squeeze through the matrix lattices overcoming the ECM barriers.
Conversely, p27+/+ transformed cells mainly display a mesenchymal migration mechanism,
establishing long cellular protrusions to generate the traction forces necessary for cell body
advancing. Further, the amoeboid migration mechanism assumed by p27null cells induces a
higher cells speed compared to the mesenchymal strategy and cells move faster than the wt
counterpart. Importantly the in vitro behavior is associated in vivo to a high ability to settle at
distant sites and induce metastasis formation, suggesting that, besides the role in primary
tumor growth, p27 absence induces a more aggressive phenotype also by increasing the
invasion capability and metastasis induction.
Our previous observations have highlighted similar morphological and migration differences
also in normal cells expressing or not p27 (Belletti et al., in preparation 2008). The absence of
p27 or its down-regulation in fibroblasts results both in a more rounded cell shape compared
to the typical elongated mesenchymal-like morphology of p27-expressing cells and in higher
migration rates (Belletti et al., in preparation 2008).
We have previously demonstrated that p27 binds and inhibits the MTs destabilizing protein
Stathmin and, through this interaction, p27 could play a pivotal role in in vitro motility
(Baldassarre et al., 2005). In fact by inhibiting Stathmin, p27 induces stabilization of the MT
network thus impairing cell migration. Recently we have demonstrated that p27/stathmin
interaction controls also tumor cell invasion in in vivo models, confirming our previous in
vitro results (Schiappacassi et al., accepted for publication 2008).
- 80 -

Discussion
Whether p27/stathmin interaction could be involved also in the motile phenotype observed
during v-src transformation is still to be determined, although some of the collected data
strongly suggest this possibility. In fact, our preliminary results, collected using a small
interference adenoviral system able to strongly reduce stathmin levels, suggest that the
migration rate of p27-/- v-src cells is significantly down-regulated, whereas the same siRNA
does not significantly change the motility of p27-expressing cells. Moreover, we have
demonstrated that the expression of p271-170 in p27null cells does not revert neither the
morphologic traits nor the migration advantage and we previously demonstrated that this
deletion mutant is not able to bind and inhibit stathmin (Baldassarre et al., 2005). Conversely
a full length p27 cDNA completely rescues the phenotype both in vitro and in vivo. Thus, at
least in part, the motility inhibition exerted by p27 seems to be mediated by its interaction
with stathmin.
Besides the p27 function in the control of MTs stability, we can not excluded a p27-mediated
effect in the regulation of the actin cytoskeleton too. In fact, during cell migration both the
tubulin and actin cytoskeleton result to play crucial functions (Etienne-Manneville, 2004).
Besson et al., demonstrated that in over-expression conditions, p27 directly interacts with
RhoA and inhibits its activity (Besson et al., 2004). These authors showed that p27 absence is
associated to higher RhoA activity, resulting in an increase of actin stress fibers and focal
adhesions that in turn impairs motility in 2D experimental systems. An excessive adhesive
potential is well known to reduce migration on 2D substrates, but in 3D environments, fully
mature focal contacts are not usually observed (Friedl and Wolf, 2003). In 3D contexts, cells
are less adhesive and can switch rapidly from a migration mechanisms to another, a
phenomen called cell plasticity (Friedl and Wolf, 2003; Condeelis and Segall, 2003). Thus, in
3D matrices an up-regulation in RhoA activity could favour cell motility rather than impair it.
RhoA is known for its ability to form actin stress fibers and focal adhesions through the
recruitment and activation of its effectors mDia and the Rho-kinases, ROCK1 and ROCK2.
But the recent analyses of motile behaviour in 3 dimensional environments have suggested
that Rho-GTPases can display a major versatility and less “fixed” functions (Higashida et al.,
2004). For example a localized RhoA activation is required for the induction of membrane
ruffling, typical morphological trait of amoeboid cells (Kurokawa and Matsuda, 2005).
Recently, an increase in RhoA activity, rather than impaired motility, was associated to the
transition from a mesenchymal to an amoeboid motility in 3D systems (Sahai et al., 2007;
Gadea et al., 2007).
- 81 -
Discussion
Thus, in our model, we can speculate that the absence of p27 could induce high RhoA activity
that in turn determines the switch to the amoeboid morph-dynamics observed in p27-/- v-src
fibroblasts. Moreover, the acquirement of an amoeboid motility results more advantageous in
a 3D environment because allows to easier pass through ECM lattices in vitro (Friedl and
Wolf, 2003) and overcome tissue barriers in vivo. The data we collected evaluating the
phosphorylation levels of cofilin (target protein phosphorylated on Ser3 by active RhoA) have
highlighted a different kinetics of RhoA activity in p27-/- src cells compared to the wild type
counterpart, following cell-ECM contact. Interestingly, in the same assay we observed a
different kinetics of FAK, AKT, STAT3 and ERK1,2 activation, suggesting that in p27 null
cells there is a general modification of the signal trasduction pathways activated following
cell adhesion to ECM. One possible explanation for this observation resides in the recent
demonstration that the MT network controls vesicular transport in adherent cells
(Balasubramanian et al., 2007). It is thus possible that p27, by modifying MT stability through
stathmin inhibition, control in turn the vesicular recycling of several proteins necessary for the
proper control of cell growth and motility. Studies are in course in our laboratory to test this
hypothesis in our model systems.
In conclusion, our results demonstrated that p27 expression is an important determinant both
in the first steps of cell transformation and tumor establishment and in the following
progression to tumor dissemination and colonization of distant sites. The fact that p27 in
transformed cells controls not only cell cycle progression but also the regulation of cellular
morph-dynamics makes it an attractive target for new anticancer therapies.
- 82 -
AKNOWLEDGEMENTS
I’m really grateful especially to Dr. Barbara Belletti, Dr. Francesca Lovat and Dr. Monica
Schiappacassi for skilful experimental assistance and for friendly advice. I’d like to thank all
the other members of SCICC group and all the colleagues of the Division of Experimental
Oncology 2. I am grateful to Prof. Peter Friedl for the opportunity to work in his lab and to
Dr. Katarina Wolf for the skilful experimental advice. I wish to thank Dr. Matthew Fero for
critical comments and Prof. Alfonso Colombatti for helpful suggestions. A special thank to
Dr. Gustavo Baldassarre for scientific discussions and critical comments.
- 83 -
References
REFERENCES
Balasubramanian N, Scott DW, Castle JD, Casanova JE, Schwartz MA. 2007. Arf6 and microtubules in adhesion-dependent trafficking of lipid rafts. Nat Cell Biol. Dec;9(12):1381-91
Baldassarre G, Belletti B, Nicoloso MS, Schiappacassi M, Vecchione A, Spessotto P, Morrione A, Canzonieri V, Colombatti A. 2005. p27(Kip1)-stathmin interaction influences sarcoma cell migration and invasion. Cancer Cell. Jan;7(1):51-63.
Bar-Sagi D, Hall A. 2000. Ras and Rho GTPases: a family reunion. Cell. Oct 13;103(2):227-38. Review.
Belletti B, Nicoloso MS, Schiappacassi M, Chimienti E, Berton S, Lovat F, Colombatti A, Baldassarre G. 2005. p27(kip1) functional regulation in human cancer: a potential target for therapeutic designs. Curr Med Chem.;12(14):1589-605. Review.
Besson A, Gurian-West M, Schmidt A, Hall A, Roberts JM. 2004. p27Kip1 modulates cell migration through the regulation of RhoA activation. Genes Dev. Apr 15;18(8):862-76.
Besson A, Hwang HC, Cicero S, Donovan SL, Gurian-West M, Johnson D, Clurman BE, Dyer MA, Roberts JM. 2007. Discovery of an oncogenic activity in p27Kip1 that causes stem cell expansion and a multiple tumor phenotype. Genes Dev. Jul 15;21(14):1731-46.
Bjerkvig R., Tysnes B. B., Aboody K. S., Najbauer J. & Terzis A. J. 2005. Opinion: the origin of the cancer stem cell: current controversies and new insights. Nature Rev. Cancer 5, 899–904.
Bjorge JD, Pang A, Fujita DJ. 2000. Identification of protein-tyrosine phosphatase 1B as the major tyrosine phosphatase activity capable of dephosphorylating and activating c-Src in several human breast cancer cell lines. J Biol Chem. Dec 29;275(52):41439-46.
Bloom J, Pagano M. 2003. Deregulated degradation of the cdk inhibitor p27 and malignant transformation. Semin Cancer Biol. Feb;13(1):41-7. Review.
Boehm M, Yoshimoto T, Crook MF, Nallamshetty S, True A, Nabel GJ, Nabel EG. 2002. A growth factor-dependent nuclear kinase phosphorylates p27(Kip1) and regulates cell cycle progression. EMBO J. Jul 1;21(13):3390-401.
Borghese L, Fletcher G, Mathieu J, Atzberger A, Eades WC, Cagan RL, Rørth P. 2006. Systematic analysis of the transcriptional switch inducing migration of border cells. Dev Cell. Apr;10(4):497-508.
Bos JL. 1989. Ras oncogenes in human cancer: a review. Cancer Res. Sep 1;49(17):4682-9. Review.
Brown MT, Cooper JA. 1996. Regulation, substrates and functions of src. Biochim Biophys Acta. Jun 7;1287(2-3):121-49. Review.
Burridge K, Doughman R. 2006. Front and back by Rho and Rac. Nat Cell Biol. Aug;8(8):781-2.
Carragher NO, Walker SM, Scott Carragher LA, Harris F, Sawyer TK, Brunton VG, Ozanne BW, Frame MC. 2006. Calpain 2 and Src dependence distinguishes mesenchymal and amoeboid modes of tumour cell invasion: a link to integrin function. Oncogene. Sep 21;25(42):5726-40.
- 84 -
References
Carrano AC, Eytan E, Hershko A, Pagano M. 1999. SKP2 is required for ubiquitin-mediated degradation of the CDK inhibitor p27. Nat Cell Biol. Aug;1(4):193-9.
Cassimeris L. 2002. The oncoprotein 18/stathmin family of microtubule destabilizers. Curr Opin Cell Biol. Feb;14(1):18-24. Review.
Chambers AF, Groom AC, MacDonald IC. 2002. Dissemination and growth of cancer cells in metastatic sites. Nat Rev Cancer. Aug;2(8):563-72. Review.
Cheng M, Sexl V, Sherr CJ, Roussel MF. 1998. Assembly of cyclin D-dependent kinase and titration of p27Kip1 regulated by mitogen-activated protein kinase kinase (MEK1). Proc Natl Acad Sci U S A. Feb 3;95(3):1091-6.
Cheresh DA, Leng J, Klemke RL. 1999. Regulation of cell contraction and membrane ruffling by distinct signals in migratory cells. J Cell Biol. Sep 6;146(5):1107-16.
Chu I, Sun J, Arnaout A, Kahn H, Hanna W, Narod S, Sun P, Tan CK, Hengst L, Slingerland J. 2007. p27 phosphorylation by Src regulates inhibition of cyclin E-Cdk2. Cell. Jan 26;128(2):281-94.
Coats S, Flanagan WM, Nourse J, Roberts JM. 1996. Requirement of p27Kip1 for restriction point control of the fibroblast cell cycle. Science. May 10;272(5263):877-80.
Coleman ML, Marshall CJ, Olson MF. 2004. RAS and RHO GTPases in G1-phase cell-cycle regulation. Nat Rev Mol Cell Biol. May;5(5):355-66. Review.
Condeelis J, Segall JE. 2003. Intravital imaging of cell movement in tumours. Nat Rev Cancer. Dec;3(12):921-30. Review.
Cooper J. A., Gould K. L., Cartwright C. A., Hunter T. 1986. Tyr527 is phosphorylated in pp60c-src: implications for regulation. Science 231, 1431–1434.
Cukierman E, Pankov R, Stevens DR, Yamada KM. 2001. Taking cell-matrix adhesions to the third dimension. Science. Nov 23;294(5547):1708-12.
Daniel C, Pippin J, Shankland SJ, Hugo C. 2004. The rapamycin derivative RAD inhibits mesangial cell migration through the CDK-inhibitor p27KIP1. Lab Invest. May;84(5):588-96.
Delmas C, Manenti S, Boudjelal A, Peyssonnaux C, Eychène A, Darbon JM. 2001. The p42/p44 mitogen-activated protein kinase activation triggers p27Kip1 degradation independently of CDK2/cyclin E in NIH 3T3 cells. J Biol Chem. Sep 14;276(37):34958-65.
Denicourt C, Saenz CC, Datnow B, Cui XS, Dowdy SF. 2007. Relocalized p27Kip1 tumor suppressor functions as a cytoplasmic metastatic oncogene in melanoma. Cancer Res. Oct 1;67(19):9238-43.
Di Cristofano A, De Acetis M, Koff A, Cordon-Cardo C, Pandolfi PP. 2001. Pten and p27KIP1 cooperate in prostate cancer tumor suppression in the mouse. Nat Genet. Feb;27(2):222-4.
Downward J. 2003. Targeting RAS signalling pathways in cancer therapy. Nat Rev Cancer. Jan;3(1):11-22. Review.
Etienne-Manneville S, Hall A. 2002. Rho GTPases in cell biology. Nature. Dec 12;420(6916):629-35. Review.
Etienne-Manneville S. 2004. Actin and microtubules in cell motility: which one is in control? Traffic. Jul;5(7):470-7. Review.
Feramisco JR, Gross M, Kamata T, Rosenberg M, Sweet RW. 1984. Microinjection of the oncogene form of the human H-ras (T-24) protein results in rapid proliferation of quiescent cells. Cell. Aug;38(1):109-17.
- 85 -
References
Fero ML, Randel E, Gurley KE, Roberts JM, Kemp CJ. 1998. The murine gene p27Kip1 is haplo-insufficient for tumour suppression. Nature. Nov 12;396(6707):177-80.
Fero ML, Rivkin M, Tasch M, Porter P, Carow CE, Firpo E, Polyak K, Tsai LH, Broudy V, Perlmutter RM, Kaushansky K, Roberts JM. 1996. A syndrome of multiorgan hyperplasia with features of gigantism, tumorigenesis, and female sterility in p27(Kip1)-deficient mice. Cell. May 31;85(5):733-44.
Frame MC, Fincham VJ, Carragher NO, Wyke JA. 2002. v-Src's hold over actin and cell adhesions. Nat Rev Mol Cell Biol. Apr;3(4):233-45. Review.
Frame MC. 2002. Src in cancer: deregulation and consequences for cell behaviour. Biochim Biophys Acta. Jun 21;1602(2):114-30. Review.
Friedl P, Noble PB, Zänker KS. 1993. Lymphocyte locomotion in three-dimensional collagen gels. Comparison of three quantitative methods for analyzing cell trajectories. J Immunol Methods.;165:157–165.
Friedl P, Wolf K. 2003. Tumour-cell invasion and migration: diversity and escape mechanisms. Nat Rev Cancer. May;3(5):362-74. Review.
Friedl P. 2004. Prespecification and plasticity: shifting mechanisms of cell migration. Curr Opin Cell Biol. Feb;16(1):14-23. Review.
Fujita N, Sato S, Katayama K, Tsuruo T. 2002. Akt-dependent phosphorylation of p27Kip1 promotes binding to 14-3-3 and cytoplasmic localization. J Biol Chem. Aug 9;277(32):28706-13.
Gadea G, de Toledo M, Anguille C, Roux P. 2007. Loss of p53 promotes RhoA-ROCK-dependent cell migration and invasion in 3D matrices. J Cell Biol. Jul 2;178(1):23-30
Giacomello E, Neumayer J, Colombatti A, Perris R. 1999. Centrifugal assay for fluorescence-based cell adhesion adapted to the analysis of ex vivo cells and capable of determining relative binding strengths. Biotechniques. Apr;26(4):758-62, 764-6.
Giancotti FG, Ruoslahti E. 1999. Integrin signaling. Science. Aug 13;285(5430):1028-32. Review.
Glading A, Chang P, Lauffenburger DA, Wells A. 2000. Epidermal growth factor receptor activation of calpain is required for fibroblast motility and occurs via an ERK/MAP kinase signaling pathway. J Biol Chem. Jan 28;275(4):2390-8.
Goukassian D, Díez-Juan A, Asahara T, Schratzberger P, Silver M, Murayama T, Isner JM, Andrés V. 2001. Overexpression of p27(Kip1) by doxycycline-regulated adenoviral vectors inhibits endothelial cell proliferation and migration and impairs angiogenesis. FASEB J. Sep;15(11):1877-85.
Grimmler M, Wang Y, Mund T, Cilensek Z, Keidel EM, Waddell MB, Jäkel H, Kullmann M, Kriwacki RW, Hengst L. 2007. Cdk-inhibitory activity and stability of p27Kip1 are directly regulated by oncogenic tyrosine kinases. Cell. Jan 26;128(2):269-80.
Hanahan D, Weinberg RA. 2000. The hallmarks of cancer. Cell. Jan 7;100(1):57-70. Review
Hara T, Kamura T, Nakayama K, Oshikawa K, Hatakeyama S, Nakayama K. 2001. Degradation of p27(Kip1) at the G(0)-G(1) transition mediated by a Skp2-independent ubiquitination pathway. J Biol Chem. Dec 28;276(52):48937-43.
Hartwell LH, Weinert TA. 1989. Checkpoints: controls that ensure the order of cell cycle events. Science. Nov 3;246(4930):629-34. Review.
- 86 -
References
Higashida C, Miyoshi T, Fujita A, Oceguera-Yanez F, Monypenny J, Andou Y, Narumiya S, Watanabe N. 2004. Actin polymerization-driven molecular movement of mDia1 in living cells. Science. Mar 26;303(5666):2007-10.
Howell B, Larsson N, Gullberg M, Cassimeris L. 1999. Dissociation of the tubulin-sequestering and microtubule catastrophe-promoting activities of oncoprotein 18/stathmin. Mol Biol Cell. Jan;10(1):105-18.
Huber MA, Kraut N, Beug H. 2005. Molecular requirements for epithelial-mesenchymal transition during tumor progression. Curr Opin Cell Biol. Oct;17(5):548-58. Review.
Hunter T, Sefton BM. 1980. Transforming gene product of Rous sarcoma virus phosphorylates tyrosine. Proc Natl Acad Sci U S A. Mar;77(3):1311-5..
Hynes RO. 1992. Integrins: versatility, modulation, and signaling in cell adhesion. Cell. Apr 3;69(1):11-25. Review.
Iancu-Rubin C, Atweh GF. 2005. p27(Kip1) and stathmin share the stage for the first time. Trends Cell Biol. Jul;15(7):346-8. Review.
Ishida N, Hara T, Kamura T, Yoshida M, Nakayama K, Nakayama KI. 2002. Phosphorylation of p27Kip1 on serine 10 is required for its binding to CRM1 and nuclear export. J Biol Chem. Apr 26;277(17):14355-8.
Itoh Y, Masuyama N, Nakayama K, Nakayama KI, Gotoh Y. 2007. The cyclin-dependent kinase inhibitors p57 and p27 regulate neuronal migration in the developing mouse neocortex. J Biol Chem. Jan 5;282(1):390-6.
James MK, Ray A, Leznova D, Blain SW. 2008. Differential modification of p27Kip1 controls its cyclin D-cdk4 inhibitory activity. Mol Cell Biol. Jan;28(1):498-510.
Jin K, Mao XO, Cottrell B, Schilling B, Xie L, Row RH, Sun Y, Peel A, Childs J, Gendeh G, Gibson BW, Greenberg DA. 2004. Proteomic and immunochemical characterization of a role for stathmin in adult neurogenesis. FASEB J. Feb;18(2):287-99.
Johnson D, Frame MC, Wyke JA. 1998. Expression of the v-Src oncoprotein in fibroblasts disrupts normal regulation of the CDK inhibitor p27 and inhibits quiescence. Oncogene. Apr 16;16(15):2017-28.
Johnson PJ, Coussens PM, Danko AV, Shalloway D. 1985. Overexpressed pp60c-src can induce focus formation without complete transformation of NIH 3T3 cells. Mol Cell Biol. May;5(5):1073-83.
Jove R, Hanafusa H. 1987. Cell transformation by the viral src oncogene. Annu Rev Cell Biol.;3:31-56. Review.
Kamura T, Hara T, Matsumoto M, Ishida N, Okumura F, Hatakeyama S, Yoshida M, Nakayama K, Nakayama KI. 2004. Cytoplasmic ubiquitin ligase KPC regulates proteolysis of p27(Kip1) at G1 phase. Nat Cell Biol. Dec;6(12):1229-35.
Kang-Decker N, Tong C, Boussouar F, Baker DJ, Xu W, Leontovich AA, Taylor WR, Brindle PK, van Deursen JM. 2004. Loss of CBP causes T cell lymphomagenesis in synergy with p27Kip1 insufficiency. Cancer Cell. Feb;5(2):177-89.
Kawauchi T, Chihama K, Nabeshima Y, Hoshino M. 2006. Cdk5 phosphorylates and stabilizes p27kip1 contributing to actin organization and cortical neuronal migration. Nat Cell Biol. Jan;8(1):17-26.
Keely PJ, Rusyn EV, Cox AD, Parise LV. 1999. R-Ras signals through specific integrin alpha cytoplasmic domains to promote migration and invasion of breast epithelial cells. J Cell Biol. May 31;145(5):1077-88.
- 87 -
References
Kim JW, Wong CW, Goldsmith JD, Song C, Fu W, Allion MB, Herlyn M, Al-Mehdi AB, Muschel RJ. 2004. Rapid apoptosis in the pulmonary vasculature distinguishes non-metastatic from metastatic melanoma cells. Cancer Lett. Sep 30;213(2):203-12.
Kiyokawa H, Kineman RD, Manova-Todorova KO, Soares VC, Hoffman ES, Ono M, Khanam D, Hayday AC, Frohman LA, Koff A. 1996. Enhanced growth of mice lacking the cyclin-dependent kinase inhibitor function of p27(Kip1).Cell. May 31;85(5):721-32.
Klemke RL, Cai S, Giannini AL, Gallagher PJ, de Lanerolle P, Cheresh DA. 1997. Regulation of cell motility by mitogen-activated protein kinase. J Cell Biol. Apr 21;137(2):481-92.
Kossatz U, Vervoorts J, Nickeleit I, Sundberg HA, Arthur JS, Manns MP, Malek NP. 2006. C-terminal phosphorylation controls the stability and function of p27kip1. EMBO J. Nov 1;25(21):5159-70.
Kotoshiba S, Kamura T, Hara T, Ishida N, Nakayama KI. 2005. Molecular dissection of the interaction between p27 and Kip1 ubiquitylation-promoting complex, the ubiquitin ligase that regulates proteolysis of p27 in G1 phase. J Biol Chem. May 6;280(18):17694-700.
Kurokawa K, Matsuda M. 2005. Localized RhoA activation as a requirement for the induction of membrane ruffling. Mol Biol Cell. Sep;16(9):4294-303.
Lauffenburger DA, Horwitz AF. 1996. Cell migration: a physically integrated molecular process. Cell. Feb 9;84(3):359-69. Review.
Malumbres M, Barbacid M. 2001. To cycle or not to cycle: a critical decision in cancer. Nat Rev Cancer. Dec;1(3):222-31. Review.
Mamillapalli R, Gavrilova N, Mihaylova VT, Tsvetkov LM, Wu H, Zhang H, Sun H. 2001. PTEN regulates the ubiquitin-dependent degradation of the CDK inhibitor p27(KIP1) through the ubiquitin E3 ligase SCF(SKP2). Curr Biol. Feb 20;11(4):263-7.
Mansour SJ, Matten WT, Hermann AS, Candia JM, Rong S, Fukasawa K, Vande Woude GF and Ahn N G. 1994. Transformation of mammalian cells by constitutively active MAP kinase kinase. Science 265: 966–970
Martin GS. 2001. The hunting of the Src. Nat Rev Mol Cell Biol. Jun;2(6):467-75. Review.
Martín-Caballero J, Flores JM, García-Palencia P, Collado M, Serrano M. 2004. Different cooperating effect of p21 or p27 deficiency in combination with INK4a/ARF deletion in mice. Oncogene. Oct 28;23(50):8231-7.
Maucuer A, Moreau J, Méchali M, Sobel A. 1993. Stathmin gene family: phylogenetic conservation and developmental regulation in Xenopus. J Biol Chem. Aug 5;268(22):16420-9.
McAllister SS, Becker-Hapak M, Pintucci G, Pagano M, Dowdy SF. 2003. Novel p27(kip1) C-terminal scatter domain mediates Rac-dependent cell migration independent of cell cycle arrest functions. Mol Cell Biol. Jan;23(1):216-28.
Medema RH, Kops GJ, Bos JL, Burgering BM. 2000. AFX-like Forkhead transcription factors mediate cell-cycle regulation by Ras and PKB through p27kip1. Nature. Apr 13;404(6779):782-7.
Meyers J, Craig J, Odde DJ. 2006. Potential for control of signaling pathways via cell size and shape. Curr Biol. Sep 5;16(17):1685-93.
- 88 -
References
Montagnoli A, Fiore F, Eytan E, Carrano AC, Draetta GF, Hershko A, Pagano M. 1999. Ubiquitination of p27 is regulated by Cdk-dependent phosphorylation and trimeric complex formation. Genes Dev. May 1;13(9):1181-9.
Motti ML, Califano D, Troncone G, De Marco C, Migliaccio I, Palmieri E, Pezzullo L, Palombini L, Fusco A, Viglietto G. 2005. Complex regulation of the cyclin-dependent kinase inhibitor p27kip1 in thyroid cancer cells by the PI3K/AKT pathway: regulation of p27kip1 expression and localization. Am J Pathol. Mar;166(3):737-49.
Motti ML, De Marco C, Califano D, Fusco A, Viglietto G. 2004. Akt-dependent T198 phosphorylation of cyclin-dependent kinase inhibitor p27kip1 in breast cancer. Cell Cycle. Aug;3(8):1074-80.
Mulcahy LS, Smith MR, Stacey DW. 1985. Requirement for ras proto-oncogene function during serum-stimulated growth of NIH 3T3 cells. Nature. Jan 17-23;313(5999):241-3.
Nacusi LP, Sheaff RJ. 2006. Akt1 sequentially phosphorylates p27kip1 within a conserved but non-canonical region. Cell Div. Jun 16;1:11.
Nakayama K, Ishida N, Shirane M, Inomata A, Inoue T, Shishido N, Horii I, Loh DY, Nakayama K. 1996. Mice lacking p27(Kip1) display increased body size, multiple organ hyperplasia, retinal dysplasia, and pituitary tumors. Cell. May 31;85(5):707-20.
Nobes CD, Hall A. 1995. Rho, rac, and cdc42 GTPases regulate the assembly of multimolecular focal complexes associated with actin stress fibers, lamellipodia, and filopodia. Cell. Apr 7;81(1):53-62.
Nobes CD, Hall A. 1999. Rho GTPases control polarity, protrusion, and adhesion during cell movement. J Cell Biol. Mar 22;144(6):1235-44.
Oxford G, Theodorescu D. 2003. Ras superfamily monomeric G proteins in carcinoma cell motility. Cancer Lett. Jan 28;189(2):117-28. Review.
Ozon S, Guichet A, Gavet O, Roth S, Sobel A. 2002. Drosophila stathmin: a microtubule-destabilizing factor involved in nervous system formation. Mol Biol Cell. Feb;13(2):698-710.
Park MS, Rosai J, Nguyen HT, Capodieci P, Cordon-Cardo C, Koff A. 1999. p27 and Rb are on overlapping pathways suppressing tumorigenesis in mice. Proc Natl Acad Sci U S A. May 25;96(11):6382-7.
Pawlak G, Helfman DM. 2001. Cytoskeletal changes in cell transformation and tumorigenesis. Curr Opin Genet Dev. Feb;11(1):41-7. Review.
Philipp-Staheli J, Kim KH, Liggitt D, Gurley KE, Longton G, Kemp CJ. 2004. Distinct roles for p53, p27Kip1, and p21Cip1 during tumor development. Oncogene. Jan 29;23(4):905-13.
Philipp-Staheli J, Kim KH, Payne SR, Gurley KE, Liggitt D, Longton G, Kemp CJ. 2002. Pathway-specific tumor suppression. Reduction of p27 accelerates gastrointestinal tumorigenesis in Apc mutant mice, but not in Smad3 mutant mice. Cancer Cell. May;1(4):355-68.
Philipp-Staheli J, Payne SR, Kemp CJ. 2001. p27(Kip1): regulation and function of a haploinsufficient tumor suppressor and its misregulation in cancer. Exp Cell Res. Mar 10;264(1):148-68
Polyak K, Kato JY, Solomon MJ, Sherr CJ, Massague J, Roberts JM, Koff A. 1994. p27Kip1, a cyclin-Cdk inhibitor, links transforming growth factor-beta and contact inhibition to cell cycle arrest. Genes Dev. Jan;8(1):9-22.
- 89 -
References
Ridley AJ, Hall A. 1992. The small GTP-binding protein rho regulates the assembly of focal adhesions and actin stress fibers in response to growth factors. Cell. Aug 7;70(3):389-99.
Ridley AJ, Paterson HF, Johnston CL, Diekmann D, Hall A. 1992. The small GTP-binding protein rac regulates growth factor-induced membrane ruffling. Cell. Aug 7;70(3):401-10.
Ridley AJ, Schwartz MA, Burridge K, Firtel RA, Ginsberg MH, Borisy G, Parsons JT, Horwitz AR. 2003. Cell migration: integrating signals from front to back. Science. Dec 5;302(5651):1704-9. Review.
Riley D, Carragher NO, Frame MC, Wyke JA. 2001. The mechanism of cell cycle regulation by v-Src. Oncogene. Sep 20;20(42):5941-50.
Rivard N, Boucher MJ, Asselin C, L'Allemain G. 1999. MAP kinase cascade is required for p27 downregulation and S phase entry in fibroblasts and epithelial cells. Am J Physiol. Oct;277(4 Pt 1):C652-64.
Rodier G, Montagnoli A, Di Marcotullio L, Coulombe P, Draetta GF, Pagano M, Meloche S. 2001. p27 cytoplasmic localization is regulated by phosphorylation on Ser10 and is not a prerequisite for its proteolysis. EMBO J. Dec 3;20(23):6672-82.
Rohrschneider LR. 1979. Immunofluorescence on avian sarcoma virus-transformed cells: localization of the src gene product. Cell. Jan;16(1):11-24. PMID: 217542
Rubin CI, Atweh GF. 2004. The role of stathmin in the regulation of the cell cycle. J Cell Biochem. Oct 1;93(2):242-50. Review.
Russo AA, Jeffrey PD, Patten AK, Massagué J, Pavletich NP. 1996. Crystal structure of the p27Kip1 cyclin-dependent-kinase inhibitor bound to the cyclin A-Cdk2 complex. Nature. Jul 25;382(6589):325-31.
Sahai E, Garcia-Medina R, Pouysségur J, Vial E. 2007. Smurf1 regulates tumor cell plasticity and motility through degradation of RhoA leading to localized inhibition of contractility. J Cell Biol. Jan 1;176(1):35-42.
Sahai E, Marshall CJ. 2003. Differing modes of tumour cell invasion have distinct requirements for Rho/ROCK signalling and extracellular proteolysis. Nat Cell Biol. Aug;5(8):711-9.
Sahai E. 2007. Illuminating the metastatic process. Nat Rev Cancer. Oct;7(10):737-49. Review.
Shields JM, Pruitt K, McFall A, Shaub A, Der CJ. 2000. Understanding Ras: 'it ain't over 'til it's over'. Trends Cell Biol. Apr;10(4):147-54. Review.
Shin I, Rotty J, Wu FY, Arteaga CL. 2005. Phosphorylation of p27Kip1 at Thr-157 interferes with its association with importin alpha during G1 and prevents nuclear re-entry. J Biol Chem. Feb 18;280(7):6055-63.
Sicinski P, Zacharek S, Kim C. 2007. Duality of p27Kip1 function in tumorigenesis.Genes Dev. Jul 15;21(14):1703-6. Review.
Slingerland J, Pagano M. 2000. Regulation of the cdk inhibitor p27 and its deregulation in cancer. J Cell Physiol. Apr;183(1):10-7.
Spessotto P, Giacomello E, Perris R. 2000. Fluorescence assays to study cell adhesion and migration in vitro. Methods Mol Biol.;139:321-43. Review.
Stacey DW, Feig LA, Gibbs JB. 1991. Dominant inhibitory Ras mutants selectively inhibit the activity of either cellular or oncogenic Ras.Mol Cell Biol. Aug;11(8):4053-64.
- 90 -
References
Sun J, Marx SO, Chen HJ, Poon M, Marks AR, Rabbani LE. 2001. Role for p27(Kip1) in Vascular Smooth Muscle Cell Migration. Circulation. Jun 19;103(24):2967-72.
Susaki E, Nakayama K, Nakayama KI. 2007. Cyclin D2 translocates p27 out of the nucleus and promotes its degradation at the G0-G1 transition. Mol Cell Biol. Jul;27(13):4626-40.
Takeya T, Hanafusa H. 1982. DNA sequence of the viral and cellular src gene of chickens. II. Comparison of the src genes of two strains of avian sarcoma virus and of the cellular homolog. J Virol. Oct;44(1):12-8..
Takeya T, Hanafusa H. 1983. Structure and sequence of the cellular gene homologous to the RSV src gene and the mechanism for generating the transforming virus. Cell. Mar;32(3):881-90.
Ten Klooster JP, Hordijk PL. 2007. Targeting and localized signalling by small GTPases. Biol Cell. Jan;99(1):1-12. Review.
Théry M, Bornens M. 2006. Cell shape and cell division. Curr Opin Cell Biol. Dec;18(6):648-57. Epub 2006 Oct 12. Review.
Thomas SM, Brugge JS. 1997. Cellular functions regulated by Src family kinases. Annu Rev Cell Dev Biol.;13:513-609. Review.
Tsuji K, Yamauchi K, Yang M, Jiang P, Bouvet M, Endo H, Kanai Y, Yamashita K, Moossa AR, Hoffman RM. 2006. Dual-color imaging of nuclear-cytoplasmic dynamics, viability, and proliferation of cancer cells in the portal vein area.Cancer Res. Jan 1;66(1):303-6.
Tsuji T, Ishizaki T, Okamoto M, Higashida C, Kimura K, Furuyashiki T, Arakawa Y, Birge RB, Nakamoto T, Hirai H, Narumiya S. 2002. ROCK and mDia1 antagonize in Rho-dependent Rac activation in Swiss 3T3 fibroblasts. J Cell Biol. May 27;157(5):819-30.
Viglietto G, Motti ML, Bruni P, Melillo RM, D'Alessio A, Califano D, Vinci F, Chiappetta G, Tsichlis P, Bellacosa A, Fusco A, Santoro M. 2002. Cytoplasmic relocalization and inhibition of the cyclin-dependent kinase inhibitor p27(Kip1) by PKB/Akt-mediated phosphorylation in breast cancer. Nat Med. Oct;8(10):1136-44.
Vlach J, Hennecke S, Alevizopoulos K, Conti D, Amati B. 1996. Growth arrest by the cyclin-dependent kinase inhibitor p27Kip1 is abrogated by c-Myc. EMBO J. Dec 2;15(23):6595-604.
Vlach J, Hennecke S, Amati B. 1997. Phosphorylation-dependent degradation of the cyclin-dependent kinase inhibitor p27. EMBO J. Sep 1;16(17):5334-44.
Walsh AB, Bar-Sagi D. 2001. Differential activation of the Rac pathway by Ha-Ras and K-Ras. J Biol Chem. May 11;276(19):15609-15.
Wang HR, Zhang Y, Ozdamar B, Ogunjimi AA, Alexandrova E, Thomsen GH, Wrana JL. 2003. Regulation of cell polarity and protrusion formation by targeting RhoA for degradation. Science. Dec 5;302(5651):1775-9.
Webb DJ, Horwitz AF. 2003. New dimensions in cell migration. Nat Cell Biol. Aug;5(8):690-2.
Wittmann T, Waterman-Storer CM. 2001. Cell motility: can Rho GTPases and microtubules point the way? J Cell Sci. Nov;114(Pt 21):3795-803. Review.
Wolf K, Friedl P. 2006. Molecular mechanisms of cancer cell invasion and plasticity. Br J Dermatol. May;154 Suppl 1:11-5. Review.
Wolf K, Mazo I, Leung H, Engelke K, von Andrian UH, Deryugina EI, Strongin AY, Bröcker EB, Friedl P. 2003. Compensation mechanism in tumor cell migration: mesenchymal-amoeboid transition after blocking of pericellular
- 91 -
References
proteolysis. J Cell Biol. Jan 20;160(2):267-77. Wong CW, Lee A, Shientag L, Yu J, Dong Y, Kao G, Al-Mehdi AB, Bernhard EJ,
Muschel RJ. 2001. Apoptosis: an early event in metastatic inefficiency. Cancer Res. Jan 1;61(1):333-8.
Woods D, Cherwinski H, Venetsanakos E, Bhat A, Gysin S, Humbert M, Bray PF, Saylor VL, McMahon M. 2001. Induction of beta3-integrin gene expression by sustained activation of the Ras-regulated Raf-MEK-extracellular signal-regulated kinase signaling pathway. Mol Cell Biol. May;21(9):3192-205.
Worthylake RA, Burridge K. 2003. RhoA and ROCK promote migration by limiting membrane protrusions. J Biol Chem. Apr 11;278(15):13578-84.
Wyckoff JB, Pinner SE, Gschmeissner S, Condeelis JS, Sahai E. 2006. ROCK- and myosin-dependent matrix deformation enables protease-independent tumor-cell invasion in vivo. Curr Biol. Aug 8;16(15):1515-23.
Xu J, Wang F, Van Keymeulen A, Herzmark P, Straight A, Kelly K, Takuwa Y, Sugimoto N, Mitchison T, Bourne HR. 2003. Divergent signals and cytoskeletal assemblies regulate self-organizing polarity in neutrophils. Cell. Jul 25;114(2):201-14.
Xu W, Harrison SC, Eck MJ. 1997. Three-dimensional structure of the tyrosine kinase c-Src. Nature. Feb 13;385(6617):595-602.
Yamaguchi H, Hendrickson WA. 1996. Structural basis for activation of human lymphocyte kinase Lck upon tyrosine phosphorylation. Nature. Dec 5;384(6608):484-9.
Yeatman TJ. 2004. A renaissance for SRC. Nat Rev Cancer. Jun;4(6):470-80. Review
Yuan Y, Qin L, Liu D, Wu RC, Mussi P, Zhou S, Songyang Z, Xu J. 2007. Genetic screening reveals an essential role of p27kip1 in restriction of breast cancer progression. Cancer Res. Sep 1;67(17):8032-42.
Yvon AM, Walker JW, Danowski B, Fagerstrom C, Khodjakov A, Wadsworth P. 2002. Centrosome reorientation in wound-edge cells is cell type specific. Mol Biol Cell. Jun;13(6):1871-80.
Zheng N, Schulman BA, Song L, Miller JJ, Jeffrey PD, Wang P, Chu C, Koepp DM, Elledge SJ, Pagano M, Conaway RC, Conaway JW, Harper JW, Pavletich NP. 2002. Structure of the Cul1-Rbx1-Skp1-F boxSkp2 SCF ubiquitin ligase complex. Nature. Apr 18;416(6882):703-9.
- 92 -


![filomonnu ezhuthiya leghanam - Parayil Publishersparayilpublishers.com/bbcm/OT/04_sangyapusthakam.pdf164 kwJym-]p-kvXIw ∂Xp hfsc kt¥m-j-I-c-am-bn-cn- pw. F∂m¬, ]ndp-]n-dp-∏v,](https://static.fdocuments.us/doc/165x107/5aa917507f8b9a72188c7244/filomonnu-ezhuthiya-leghanam-parayil-publish-kwjym-p-kvxiw-xp-hfsc-ktm-j-i-c-am-bn-cn-.jpg)


