UNIVERSIDADE ESTADUAL DE CAMPINAS INSTITUTO DE … · Orientador: Prof. Dr. Wesley Rodrigues Silva...
187
UNIVERSIDADE ESTADUAL DE CAMPINAS INSTITUTO DE BIOLOGIA BRUNA GONÇALVES DA SILVA EFEITOS DE ESTRADAS E TRILHAS NA VEGETAÇÃO, DISPONIBILIDADE DE FRUTOS E AVIFAUNA EM UMA ÁREA PROTEGIDA DE MATA ATLÂNTICA DO SUDESTE DO BRASIL EFFECTS OF ROADS AND TRAILS ON VEGETATION, FRUIT AVAILABILITY AND BIRDS IN A PROTECTED AREA OF ATLANTIC FOREST IN SOUTHEASTERN BRAZIL CAMPINAS 2017
Transcript of UNIVERSIDADE ESTADUAL DE CAMPINAS INSTITUTO DE … · Orientador: Prof. Dr. Wesley Rodrigues Silva...

UNIVERSIDADE ESTADUAL DE CAMPINAS
INSTITUTO DE BIOLOGIA
BRUNA GONÇALVES DA SILVA
EFEITOS DE ESTRADAS E TRILHAS NA VEGETAÇÃO, DISPONIBILIDADE DE
FRUTOS E AVIFAUNA EM UMA ÁREA PROTEGIDA DE MATA ATLÂNTICA
DO SUDESTE DO BRASIL
EFFECTS OF ROADS AND TRAILS ON VEGETATION, FRUIT AVAILABILITY
AND BIRDS IN A PROTECTED AREA OF ATLANTIC FOREST IN
SOUTHEASTERN BRAZIL
CAMPINAS
2017

BRUNA GONÇALVES DA SILVA
EFEITOS DE ESTRADAS E TRILHAS NA VEGETAÇÃO, DISPONIBILIDADE DE
FRUTOS E AVIFAUNA EM UMA ÁREA PROTEGIDA DE MATA ATLÂNTICA DO
SUDESTE DO BRASIL
EFFECTS OF ROADS AND TRAILS ON VEGETATION, FRUIT AVAILABILITY AND
BIRDS IN A PROTECTED AREA OF ATLANTIC FOREST IN SOUTHEASTERN
BRAZIL
Tese apresentada ao Instituto de Biologia da Universidade
Estadual de Campinas como parte dos requisitos exigidos para
a obtenção do título de Doutora em Ecologia.
Thesis presented to the Institute of Biology of the University of
Campinas in partial fulfillment of the requirements for the
degree of Doctor in Ecology.
Orientador: Prof. Dr. Wesley Rodrigues Silva
Co-orientadora: Prof a Dra. Ingrid Koch
CAMPINAS
2017
ESTE ARQUIVO DIGITAL CORRESPONDE À VERSÃO
FINAL DA TESE DEFENDIDA PELA ALUNA BRUNA
GONÇALVES DA SILVA E ORIENTADA PELO
PROFESSOR DOUTOR WESLEY RODRIGUES SILVA.


Campinas, 03 de maio de 2017
COMISSÃO EXAMINADORA
Prof. Dr. Wesley Rodrigues Silva
Profa. Dra. Erica Hasui
Prof. Dr. Augusto João Piratelli
Prof. Dr. Alexander Vicente Christianini
Prof. Dr. Flavio Antonio Maës dos Santos
Os membros da Comissão Examinadora acima assinaram a Ata de Defesa, que se encontra no
processo de vida acadêmica do aluno.

Dedicatória
“À natureza, que nos ensina a arte de ser, em vez de fazer,
de experimentar, em vez de possuir”
Ted O´Neal 2002. Nature Therapy. Ilustração de R.W. Alley

Agradecimentos
Agradeço ao professor e orientador Dr. Wesley Rodrigues Silva por ter sido bastante
acolhedor e por sua ajuda e atenção durante o desenvolvimento da pesquisa e nas decisões
importantes. À professora e orientadora Dra. Ingrid Koch pela disposição em fazer parte deste
trabalho, por todo auxílio durante a elaboração dos artigos e considerações feitas, e por sua
amizade.
À Msc. Ana Carolina Devides Castello por toda a parceria e contribuição realizada ao
primeiro capítulo dessa tese, pela disponibilidade em campo e pela amizade. Ao pesquisador
Dr. Alexsander Zamorano Antunes agradeço pela parceria, contribuições, amizade e atenção.
Ao pesquisador Dr. Alexander Christianini pelas considerações feitas aos dois primeiros
capítulos da tese. À Profa. Dra. Fiorella Fernanda Mazini Capelo (Myrtaceae) e Marcelo Monge
(Asteraceae) e Dra. Ingrid Koch pelo auxílio na identificação das plantas. À Leonardo Ré Jorge
pela contribuição com as análises estatísticas e sugestões ao trabalho. À Alice Ramos de Moraes
pelas considerações feitas ao quarto capítulo da tese.
Aos companheiros de laboratório e amigos que estiveram no campo comigo, Cristiane
Patrícia Zaniratto, Janaína Rosa Cortinoz, Marisol Rios, Ana Carolina Devides Castello, Eric
Yasuo Kataoka, João de Deus Vidal e Mario Alejandro Marin Uribe ajudando com a coleta de
dados, a marcar parcelas em lugares difíceis, na chuva, no frio, no calor, subindo e descendo os
morros.
Aos membros da pré-banca, os professores Dr. Marco Aurélio Pizo, Dr. Flávio Antonio
Maes dos Santos e Dra. Erica Hasui pelas sugestões na fase de pré banca, e aos membros da
banca de defesa Dr. Flávio Antonio Maes dos Santos, Dr. Augusto Piratelli, Dr. Alexander
Vicente Christianini e Dra. Erica Hasui, e suplentes Dr. Marco Aurélio Pizo, Dr. Alexsander
Zamorano Antunes e Dr. Martín Pareja, pela disponibilidade e atenção.
Agradeço à Fundação de Amparo à Pesquisa do Estado de São Paulo, FAPESP pela
concessão da bolsa e apoio financeiro à pesquisa (2013/11175-6). À Universidade Estadual de
Campinas, ao Instituto de Biologia e a secretaria de Pós-Graduação em Ecologia pela
infraestrutura, atenção e auxílio. Ao Instituto Florestal do Estado São Paulo pela permissão para
trabalhar no Parque Estadual Carlos Botelho. À toda equipe do Parque Estadual Carlos Botelho,
em especial ao gestor José Luiz Camargo Maia pelo apoio e incentivo a pesquisa, assim como
pelo fornecimento de dados da Unidade de Conservação. À todos que participaram direta ou
indiretamente deste trabalho.

Resumo
A dinâmica de clareiras imposta por trajetos, como estradas e trilhas, em meio a
ambientes florestais pode afetar os ecossistemas naturais e os processos ecológicos. Grande
parte dos remanescentes de Mata Atlântica são intersectados por inúmeras estradas e trilhas,
que cruzam até mesmo Unidades de Conservação. A presença dos trajetos pode afetar a
comunidade de plantas e a fauna, como a estrutura do habitat, os processos reprodutivos das
plantas e o comportamento da fauna. No entanto, os efeitos da largura dos trajetos e de seu uso
na fauna e na flora na Mata Atlântica não são bem conhecidos. Neste estudo nós investigamos
se (1) a comunidade de plantas, (2) a disponibilidade de frutos e (3) a comunidade de aves
frugívoras são afetadas por esses trajetos, e (4) realizamos um diagnóstico dos impactos e suas
implicações, propondo estratégias locais de conservação relacionadas às vias de uso intensivo.
Os dados foram coletados entre 2013 e 2015 em três trajetos em meio a floresta, com diferentes
larguras e usos: estrada principal (20 m de largura – uso intensivo), estrada secundária (10 m
de largura – baixo uso), trilha turística (2 m de largura – uso intensivo) - e em uma área controle
sem trajetos, com oito parcelas de 100 m2 para cada área. Foi analisada, de forma comparativa,
a estrutura e composição da vegetação, a disponibilidade espacial e temporal de frutos e a
avifauna consumidora de frutos. Este estudo mostrou que a estrutura e a composição da
vegetação são alteradas nas bordas de vias largas (10 – 20 m) quando comparadas com vias
estreitas (2 m) ou a região controle; que a disponibilidade de frutos zoocóricos é maior em área
contínua distante das bordas dos trajetos e que a produção de frutos anemocóricos foi maior nas
bordas do trajeto mais largo. Picos de frutificação ocorreram nas bordas dos trajetos, não sendo
evidenciados em área contínua (controle). Aves mais especialistas na dieta frugívora foram
mais abundantes no controle e na estrada com baixo uso, enquanto onívoros foram mais
abundantes no trajeto mais largo. A largura da via, juntamente com a intensidade de uso e a
disponibilidade de frutos, foram os componentes mais importantes na determinação da
comunidade de aves. Para os frugívoros, o uso intensivo do trajeto foi mais importante que a
largura da via. Nossos resultados demonstram como a comunidade de plantas e a avifauna
consumidora de frutos respondem à presença e à intensidade de uso de estradas e trilhas em
meio a uma floresta ombrófila densa contínua. A alteração do habitat, a limitação de recursos
alimentares e a presença de distúrbios podem gerar o desaparecimento de algumas espécies em
longo prazo, comprometer processos ecológicos e consequentemente, a conservação da Mata
Atlântica, já intensivamente fragmentada. A regulamentação da implantação e do uso de vias
em meio a Unidades de Conservação, assim como estratégias de monitoramento e educacionais,
são essenciais para minimizar os impactos nas comunidades naturais da Mata Atlântica.

Palavras chave: clareiras lineares, conservação, impactos, floresta tropical, frugívoros, plantas.
Abstract
The dynamics of gaps imposed by roads and trails can affect natural ecosystems and
ecological processes. Great part of the Atlantic Forest remnants is intersected by numerous
roads and trails, which cross even protected areas. The presence of pathways may affect the
plant and animals communities, such as habitat structure, plant reproductive processes and
wildlife behavior. However, the effects of width and usage of the pathways on fauna and flora
in the Atlantic Forest are not well known. Here we investigate if (1) the plant community, (2)
fruit availability, and (4) fruit-eating bird community are affected by pathwyas, and (4) make a
diagnosis of the pathway’s impact and propose local strategies of conservation related to the
intensive use of pathways. Data were gathered between 2013 and 2015 in three pathways inside
forest, with varying widths and use – main road (20m wide - high usage), secondary road (10m
wide - low usage), touristic trail (2m wide - high usage) – and in a control area, with eight 100
m2 plots within each area. We sampled the structure and composition of vegetation, fruit
availability and seasonality and fruit-eating bird community. This study showed that vegetation
structure and composition change at the wide pathways edges (10-20 m) when compared to
narrow pathways (2 m) or the control area; that the availability of zoocoric fruits is greater in a
continuous area far from the pathways edges and the production of anemocoric fruits was larger
at the edges of wider pathways. Fruiting peaks occurred at the pathways edges, but not in the
control area. Frugivorous birds were more abundant in control and on the pathway with low
use, while omnivores were more abundant in the wider pathway. Pathway width coupled with
pathway use and fruit availability were the most important components in determining the bird
community. For frugivores, the usage is more important than width. Our results demonstrate
that pathways presence and use generate responses in plant community, changes in fruit
production, and affect the birds. Habitat changing, food resources limitation, and the presence
of disturbances that may scare the fauna can lead to the disappearance of some species in the
long term, jeopardizing ecological processes and, consequently, the conservation of the
severely fragmented Atlantic Forest. Regulating the implementation and use of roads in
protected areas, as well as monitoring and educational strategies, are essential to minimize
impacts on natural communities in the Atlantic forest.
Key words: linear gaps, conservation, impacts, tropical forest, frugivorous, plants.

Sumário
Introdução geral ..................................................................................................................................................... 11
CAPÍTULO I - Pathways affect vegetation structure and composition in the Atlantic Forest in southeastern
Brazil ..................................................................................................................................................................... 24
Abstract ............................................................................................................................................................. 25
Introduction ....................................................................................................................................................... 25
Materials and methods ....................................................................................................................................... 27
Results ............................................................................................................................................................... 32
Discussion ......................................................................................................................................................... 39
References ......................................................................................................................................................... 43
Supplementary data ........................................................................................................................................... 51
CAPÍTULO II –Fruit availability along roads and footpaths in an Atlantic rain forest area ................................. 73
Abstract ............................................................................................................................................................. 74
Introduction ....................................................................................................................................................... 75
Material and Methods ........................................................................................................................................ 77
Results ............................................................................................................................................................... 82
Discussion ......................................................................................................................................................... 89
References ......................................................................................................................................................... 92
Supplementary Material .................................................................................................................................... 99
CAPÍTULO III – Impact of park roads and trails on a community of Atlantic forest fruit-eating birds ............. 108
Abstract ........................................................................................................................................................... 109
Introduction ..................................................................................................................................................... 110
Material and Methods ...................................................................................................................................... 112
Results ............................................................................................................................................................. 119
Discussion ....................................................................................................................................................... 125
References ....................................................................................................................................................... 128
Appendix. ........................................................................................................................................................ 136
CAPÍTULO IV – Impactos causados por vias de uso intensivo sobre a flora e a fauna do Parque Estadual Carlos
Botelho: implicações e estratégias para a conservação ....................................................................................... 139
O Parque Estadual Carlos Botelho e suas vias de uso intensivo ...................................................................... 140
Implicações para a conservação ...................................................................................................................... 145
Estratégias de conservação .............................................................................................................................. 147
Considerações finais ........................................................................................................................................ 152
Referências ...................................................................................................................................................... 153
Apêndice .......................................................................................................................................................... 158
Considerações finais ............................................................................................................................................ 181
ANEXOS ............................................................................................................................................................. 186
Anexo I – Declaração referente a bioética e biossegurança ............................................................................ 186
Anexo II – Declaração referente a direitos autorais......................................................................................... 187

11
Introdução geral
Florestas tropicais e suas ameaças
As florestas tropicais recobrem apenas cerca de 10% da superfície terrestre, mas são de
grande importância para os processos atmosféricos e para a manutenção da biodiversidade
mundial, formando um dos sistemas mais ricos da Terra (Cramer et al., 2006; Groombridge e
Jenkins, 2003), abrigando mais de dois terços das espécies do planeta (Myers et al., 2000;
Ribeiro et al., 2011). Um conjunto muito diversificado de formações compõe essas florestas,
incluindo florestas úmidas, manguezais, florestas de altitude, florestas secas e savanas
arborizadas (Groombridge e Jenkins, 2003). Pequenas mudanças nesses habitats podem gerar
consequências importantes para a manutenção da biodiversidade e dos processos ecológicos
(Lewis, 2006). Estima-se que as florestas tropicais úmidas ocupavam cerca de 16 milhões de
km2, mas que hoje sua área tenha sido reduzida para cerca da metade de sua distribuição
original (Primack e Rodrigues, 2001) (Figura 1 A). Esse processo de destruição é decorrente
de mudanças e pressões que podem ocorrer desde as formas mais extremas, como a conversão
do uso da terra para agricultura ou fazendas de gado, até as mais pontuais, como a extração
ilegal de recurso vegetal, a caça e a fragmentação (Mayaux et al., 2005).
No conjunto de florestas tropicais, a Mata Atlântica é a segunda maior floresta pluvial
tropical no continente americano, estendendo-se de 4° a 32° S e cobrindo uma ampla faixa de
zonas climáticas e formações vegetais (Fundação SOS Mata Atlântica e INPE, 2001; Myers et
al., 2000; Ribeiro et al., 2011). Inicialmente ocupava mais de 1,5 milhões de km2, mas hoje
está restrita a fragmentos que, juntos, somam uma área com menos de 100.000 km2, o que
torna essa formação uma das mais ameaçadas (Fundação SOS Mata Atlântica e INPE, 2001;
Myers et al., 2000; Ribeiro et al., 2009) (Figura 1 B). Esse domínio, apesar de amplamente
impactado, abriga mais de 8.000 espécies endêmicas de plantas vasculares, anfíbios, répteis,
aves e mamíferos (Myers et al., 2000). Uma das regiões mais importantes para a conservação
da biodiversidade da Mata Atlântica, que é considerada um hotspot de biodiversidade, está
localizada no sudeste do Brasil, no estado de São Paulo (Fundação SOS Mata Atlântica e INPE,
2001). Essa região abriga remanescentes de floresta que se concentram principalmente ao longo
das regiões escarpadas e montanhosas do Vale do Ribeira, Litoral e Vale do Paraíba. Grande
parte dessas florestas encontra-se sob proteção em Unidades de Conservação, somando
1.730.000 ha de Floresta Atlântica de encosta (Fundação SOS Mata Atlântica e INPE, 2001).

12
Figura 1 – Distribuição de florestas tropicais. A. Distribuição original das florestas tropicais.
Base de dados: Global Forest Monitoring Project (http://glad.geog.umd.edu/projects/gfm/).
Acesso em: 10 de agosto de 2016. B. Distribuição original da Mata Atlântica e os
remanescentes. Base de dados: Cobertura original do domínio Mata Atlântica – IBGE
(http://mapas.ibge.gov.br/en/); Remanescentes – SOS Mata Atlântica
(http://mapas.sosma.org.br/dados/). Acesso em: 10 de agosto de 2016.

13
Apesar de grande parte da Mata Atlântica no sudeste do Brasil estar em unidades de
conservação, esta sofre diversas pressões e impactos, pois encontra-se na região mais populosa
do país, o que contribui para o processo de fragmentação. A fragmentação de um habitat ocorre
mesmo quando a área total não é significativamente reduzida, como quando uma barreira linear
é implantada em meio a um ambiente florestal contínuo (Laurance et al., 2014; Schonewald-
Cox e Buechner, 1992). A implantação de aceiros, redes de transmissão elétrica, estradas e
trilhas são exemplos de infraestruturas lineares que podem gerar esse tipo de fragmentação
(Primack e Rodrigues, 2001; Trombulak e Frissell, 2000). A região sudeste do Brasil é
atravessada por inúmeras clareiras lineares, como estradas que conectam o interior dos estados
de São Paulo e Paraná aos seus litorais, além do intenso uso de trilhas em unidades de
conservação (UCs), destinadas aos serviços de deslocamento, vigilância, manutenção e, mais
recentemente, ao desenvolvimento do ecoturismo.
Clareiras lineares em florestas e seus efeitos
A perda do habitat gerada pela implantação de uma infraestrutura linear, o aumento do
efeito de borda, o uso intensivo, a poluição, a facilitação para invasão de espécies e doenças, a
facilitação para ocupação humana, o aumento da mortalidade da fauna por atropelamento e a
clareira atuando como barreira para a dispersão de espécies, são indicadas como as principais
pressões geradas por clareiras lineares em meio a florestas tropicais (Goosem, 2007; Laurance
et al., 2009; Laurance e Goosem, 2008). A presença de vias de transporte, como as estradas e
trilhas, gera uma barreira fragmentando o habitat e ocasionando a alteração da paisagem
(Goosem, 2007; Laurance et al., 2009), e um aumento na quantidade de borda por área de
habitat (Murcia, 1995) (Figura 2). Quando imaginamos um fragmento quadrado hipotético de
100 ha, supondo que o efeito de borda é de 100 m no sentido do interior da floresta, a região
de interior com características de uma floresta madura é de 64 ha (Figura 2 A). Com a
implantação de duas estradas cortando esse fragmento, embora essas infraestruturas ocupem
pouca área, o efeito de borda é gerado a partir dessas estradas, reduzindo a área de interior de
floresta para 34,8 ha (Figura 2 B) (Primack e Rodrigues, 2001).

14
Figura 2 – Área de habitat de uma área protegida hipotética reduzida por fragmentação e efeito
de borda (área sombreada). A) Efeito de borda nos limites da área protegida. B) Fragmentação
da área protegida por clareiras lineares e aumento do efeito de borda (traços em azul indicam
a presença de estradas). Fonte: (Primack e Rodrigues, 2001).
As alterações decorrentes da presença de clareiras lineares, como as vias de transporte,
podem penetrar no sentido do interior da floresta e alcançar até 400 metros de distância
(Laurance et al., 1997; Rodrigues, 1998), causando alguns efeitos nas comunidades de plantas
e animais (Goosem, 1997; Laurance et al., 2009) e afetando processos ecológicos (Couto-
Santos et al., 2015; Prieto et al., 2014; Reznik et al., 2012). As florestas tropicais apresentam
uma distribuição diferencial de espécies, que está relacionada com as diferentes tolerâncias
específicas ao habitat (e.g. seca, sombra, nutrientes) (Baltzer e Thomas, 2010; Engelbrecht et
al., 2007; Sterck et al., 2006). As espécies são, ao menos parcialmente, separadas em diferentes
nichos de recursos e condições dentro de uma comunidade local e esses fatores moldam sua
distribuição e abundância (Kraft e Ackerly, 2010; Sterck et al., 2014). Assim, os efeitos das
vias de transporte estão relacionados às respostas das espécies às alterações no habitat (Kraft e
Ackerly, 2010).
Impacto de vias de transporte na flora e na fauna
As bordas criadas pela implantação de clareiras lineares antrópicas, como as vias de
transporte, em meio a fragmentos florestais estão sujeitas a uma série de alterações
microclimáticas (Laurance et al., 2009; Pohlman et al., 2007). Nessas bordas observa-se um
aumento da intensidade luminosa juntamente com a temperatura e uma redução da umidade do

15
solo, bem como uma maior exposição às variações na intensidade do vento (Laurance e
Goosem, 2008; Pohlman et al., 2007). Esses efeitos se mostram mais intensos em clareiras
antrópicas quando comparados com clareiras naturais (como rios) (Pohlman et al., 2007). Além
disso, os efeitos decorrentes do efeito de borda são decorrentes de diferenças nas larguras das
clareiras e na sua natureza (antrópicas ou naturais) (Pohlman et al., 2007). Durante o processo
de implantação da via ocorrem alterações na topografia, com as atividades de terraplanagem
que alteram o relevo (Montgomery, 1994; Webb et al., 1999), o que gera a compactação do
solo, que juntamente com o fluxo de veículos e a pavimentação, altera a percolação da água, o
escoamento superficial e a disponibilidade de nutrientes (Reid e Dunne, 1984). O aumento do
nível de poluentes no ar também pode ocorrer devido à presença de veículos (Black et al., 1985;
Forman e Alexander, 1998).
Essas alterações intensas geradas pelas vias de transporte podem afetar as comunidades
de plantas e de animais das áreas adjacentes (Ahmed et al., 2014; Couto-Santos et al., 2015;
Oliveira et al., 2011; Prieto et al., 2014; Reznik et al., 2012; Wolf et al., 2013). A comunidade
de plantas pode ter sua estrutura e composição alterada, com espécies tolerantes a perturbações
e espécies exóticas ocorrendo nas bordas (Couto-Santos et al., 2015; Prieto et al., 2014).
Contudo, os estudos não apresentam resultados conclusivos para a comunidade arbórea da
Floresta Ombrófila Densa em Mata Atlântica, pois foram desenvolvidas observações apenas
na comunidade de sub-bosque da floresta (Prieto et al., 2014), ou realizados em floresta
estacional, onde muitas espécies de plantas apresentam variação sazonal dos processos
fenológicos (ex. perdendo suas folhas na estação seca), podendo responder de maneira distinta
à alterações nas condições climáticas quando comparadas com espécies perenifólias típicas de
florestas ombrófilas (Couto-Santos et al., 2015). Além disso, esses estudos não compararam
clareiras lineares com diferentes larguras em meio a matriz florestal (Couto-Santos et al., 2015;
Prieto et al., 2014), o que poderia revelar os diferentes efeitos gerados por clareiras com
diferentes características.
As mudanças no microclima e, consequentemente, na disponibilidade de recursos para
as plantas, juntamente com as alterações na composição da vegetação, podem afetar os
processos fenológicos da comunidade e a produção de estruturas reprodutivas (Gressler, 2010;
Pohlman et al., 2007; Reznik et al., 2012). Picos na produção de frutos, mudança na quantidade
e no tamanho médio de inflorescências foram observados em bordas de clareiras lineares,
antrópicas ou naturais (rios) (Gressler, 2010; Pohlman et al., 2007; Reznik et al., 2012). A

16
produção de frutos nas florestas tropicais é fundamental para a manutenção da fauna frugívora
e de processos ecossistêmicos (Jordano et al., 2006). No entanto, o efeito de clareiras lineares
antrópicas na disponibilidade espacial e temporal de recursos para fauna frugívora tem sido
pouco investigado e apresenta resultados inconclusivos (Ramos e Santos, 2006; Reznik et al.,
2012). Apenas um estudo foi conduzido no nível de comunidade e revela alterações na
dinâmica temporal da frutificação, mas ausência de efeitos na distribuição das síndromes de
dispersão (Reznik et al., 2012). Esse estudo foi conduzido comparando diferentes matrizes
florestais, uma com predominância de herbáceas e outra de arbustos e árvores até 4 m de altura.
Assim, resultados distintos podem ser encontrados ao se acompanhar a comunidade arbustivo-
arbórea das bordas de trajetos com diferentes características em meio a mesma matriz florestal.
Outro estudo desenvolvido no nível de espécie não revelou padrões claros, não sendo
observadas diferenças na produção de frutos total, mas sim no número de frutos por flor, sendo
que os autores enfatizam a necessidade de se considerar outros fatores, como a característica
da clareira e tipo da matriz (Ramos e Santos, 2006).
Vias de transporte, como estradas e trilhas, que permeiam extensivamente as formações
florestais (Laurance et al., 2014), afetam a fauna em vários aspectos, podendo gerar efeitos na
riqueza, abundância ou no comportamento das espécies (Ahmed et al., 2014; Goosem, 2001;
Laurance et al., 2004; Oliveira et al., 2011; Wolf et al., 2013). A riqueza em comunidades de
aves pode ser alterada nas proximidades de trajetos e pode ocorrer também a redução da
ocorrência de espécies exclusivas e/ou mais sensíveis nas proximidades das bordas (Ahmed et
al., 2014; Whitworth et al., 2015; Wolf et al., 2013). As vias também geram a inibição do
movimento em alguns grupos da fauna, como detectado para aves (Develey e Stouffer, 2001;
Laurance et al., 2004; Oliveira et al., 2011) e para pequenos mamíferos que, principalmente
durante a época reprodutiva, evitam cruzar as estradas (Goosem, 2001). No entanto, esses
estudos foram conduzidos em formações florestais da Austrália e da Amazônia (Ahmed et al.,
2014; Develey e Stouffer, 2001; Goosem, 2004, 2001; Laurance et al., 2004; Wolf et al., 2013).
Na Mata Atlântica do sudeste do Brasil apenas um estudo foi conduzido, que mostra que
algumas espécies de aves de sub-bosque, sensíveis ao efeito de borda, não cruzam as vias de
transporte (Oliveira et al., 2011). As características locais da formação florestal e das vias são
fatores regionais importantes a serem considerados ao se investigar os efeitos dos trajetos na
fauna (Laurance et al., 2014). No entanto, não foram conduzidos estudos que abordem os
impactos de diferentes trajetos na comunidade de aves frugívoras e que busquem compreender
17
quais as principais alterações no habitat causadas pela presença e uso dos trajetos afetam as
aves.
Importância das características locais e de estratégias de conservação em áreas
protegidas permeadas por vias de transporte
Os impactos das clareiras lineares não são os mesmos para todos os táxons e podem
variar geograficamente dependendo das condições climáticas e da formação vegetal
considerada (Whitworth et al., 2015). É desejável que esses estudos sejam realizados em
diferentes formações florestais englobando uma ampla gama de espécies, pois as condições de
microclima são distintas entre as formações vegetais, o que resulta em um conjunto de espécies
particular adaptado às condições locais (Engelbrecht et al., 2007; Kraft e Ackerly, 2010; Sterck
et al., 2014). Por exemplo, ao se comparar dois biomas tropicais, como a savana brasileira em
sentido restrito e a Mata Atlântica, observa-se que no primeiro grande parte das espécies de
plantas são adaptadas à exposição ao sol, enquanto que para o segundo muitas espécies são
tolerantes a sombra e a um ambiente úmido (Eiten, 1972; Oliveira Filho e Ratter, 2002). Ou
mesmo ambientes florestais como uma floresta estacional com espécies caducifólias e uma
floresta ombrófila com espécies perenifólias, e que possuem diferentes tolerâncias à presença
ou ausência de variação sazonal das condições. Considerando essas diferenças, pode-se inferir
que a abertura de uma clareira linear traga diferentes respostas nas comunidades locais.
A grande heterogeneidade de formações da Mata Atlântica, por sua ampla extensão
latitudinal e longitudinal, variação altitudinal (0 – 2.900 m) e de gradientes de solo e clima (por
exemplo, precipitação 1.000 – 4.200 mm anuais) (Ribeiro et al., 2011), gera a necessidade de
uma abordagem regional dos estudos de impactos das estradas e trilhas que interseccionam
esse domínio. Adicionalmente, a variação nas características das estradas e trilhas, como a
largura e a intensidade de uso antrópico (Whitworth et al., 2015), são importantes aspectos a
serem observados, pois podem resultar em diferentes efeitos. Alterações na estrutura do habitat
e na disponibilidade de recursos poderiam afetar as comunidades diferentemente entre trajetos
largos e estreitos, com uso restrito ou intensivo, e esses aspectos precisam ser investigados.
Não se sabe o quanto a largura ou o tipo de uso dos trajetos pode ampliar os efeitos de um
trajeto, e esse conhecimento é necessário para a implantação de medidas de proteção e manejo
de áreas protegidas intersectadas por vias.

18
Concomitante com estudos que identifiquem os impactos das clareiras lineares sobre as
espécies é necessário realizar estudos que apontem como tais impactos poderiam ser reduzidos
e mitigados dentro do contexto local das áreas protegidas afetadas (Taylor e Goldingay, 2010).
A principal ação que tem sido proposta para minimizar impactos de estradas e trilhas é a
construção de passagens de fauna acopladas a cercas ou barreiras de direcionamento, estando
ausentes estratégias como a limitação do uso e a educação ambiental (Taylor e Goldingay,
2010). No entanto, um monitoramento que avalie a eficiência das estratégias implantadas é de
extrema importância e tem sido negligenciado. Os estudos disponíveis não têm abordado os
efeitos de algumas variáveis na eficácia das ações de proteção, como a interferência da
atividade humana e a sensibilidade das espécies aos impactos dos trajetos (Clevenger, 2005).
As estratégias e ações de mitigação precisam ser elaboradas de acordo com as características
de cada via de transporte, da paisagem em que a via está inserida e da zona de amortecimento.
São essenciais estudos que realizem essas descrições e proponham linhas de ação específicas
para cada região e/ou unidade de conservação afetada.
Considerando o contexto apresentado, o objetivo geral desse estudo foi investigar se (1)
a comunidade de plantas, (2) a disponibilidade de frutos e (3) a comunidade de aves frugívoras
são afetadas por trajetos que intersectam a Mata Atlântica no sudeste do Brasil, bem como (4)
realizar um diagnóstico dos impactos, propondo estratégias locais de conservação. Essa tese
foi dividida em capítulos, cujos objetivos específicos estão listados a seguir, e as expectativas
em relação a cada objetivo se encontram nos respectivos capítulos.
O Capítulo 1 investiga o impacto de trajetos de diferentes larguras na estrutura e
composição de espécies de plantas, considerando formas de vida, categorias sucessionais,
ocorrência de espécies exóticas e ameaçadas, e a predominância de síndromes de dispersão. O
Capítulo 2 avalia a influência de trajetos de diferentes larguras na disponibilidade espacial e
temporal de frutos, considerando o número de espécies e indivíduos em frutificação,
quantidade de frutos produzida, síndromes de dispersão e a sazonalidade. O Capítulo 3 compara
a comunidade de aves frugívoras entre as áreas afetadas por trajetos, considerando a largura e
a intensidade de uso, estrutura da vegetação e a disponibilidade de frutos. E, finalmente, no
Capítulo 4 é apresentado um diagnóstico dos impactos gerados na flora e em alguns grupos da
fauna por duas vias de uso intensivo em uma área protegida, com sugestões de estratégias de
conservação aplicáveis no contexto local da unidade de conservação.

19
Referências
Ahmed, S.E., Lees, A.C., Moura, G., Gardner, T.A., Barlow, J., Ferreira, J., Ewers,
R.M., 2014. Road networks predict human influence on Amazonian bird communities. Proc.
R. Soc. 281, 20141742.
Baltzer, J.L., Thomas, S.C., 2010. A second dimension to the leaf economics spectrum
predicts edaphic habitat association in a Tropical Forest. PLoS One 5, e13163.
doi:10.1371/journal.pone.0013163
Black, F., Braddock, J., Bradow, R., Ingalls, M., 1985. Highway motor vehicles as
sources of atmosferic particles : Projected Trends 1977 to 2000. Environ. Int. 11, 205–233.
Clevenger, A., 2005. Conservation value of wildlife crossings : measures of
performance and research directions. GAIA 14/2, 124–129.
Couto-Santos, A.P.L. do, Conceição, A.A., Funch, L.S., 2015. The role of temporal
scale in linear edge effects on a submontane Atlantic forest arboreal community. Acta Bot.
Brasilica 29, 190–197. doi:10.1590/0102-33062014abb3732
Cramer, W., Nakicenovic, N., Wigley, T., Yohe, G., 2006. Tropical forests and
atmospheric carbon dioxide: current conditions and future scenarios, in: Avoiding Dangerous
Climate Change. p. 406.
Develey, P.F., Stouffer, P.C., 2001. Effects of roads on movements by understory birds
in mixed-species flocks in Central Amazonian Brazil. Conserv. Biol. 15, 1416–1422.
doi:10.1046/j.1523-1739.2001.00170.x
Eiten, G., 1972. The cerrado vegetation of Brazil. Bot. Rev. 38, 201–341.
Engelbrecht, B., Comita, L., Condit, R., Kursar, T., Tyree, M., Turner, B., Hubbell, S.,
2007. Drought sensitivity shapes species distribution patterns in tropical forests. Nature 447,
80–82.
Forman, R.T.T., Alexander, L.E., 1998. Roads and their major ecological effects. Annu.
Rev. Ecol. Syst. 29, 207–231. doi:10.1146/annurev.ecolsys.29.1.207
20
Fundação SOS Mata Atlântica, INPE, 2001. Atlas dos remanescentes florestais da Mata
Atlântica e ecossistemas associados no período de 1995–2000. Fundação SOS Mata Atlântica
e Instituto Nacional de Pesquisas Espaciais (INPE), São Paulo.
Goosem, M., 2007. Fragmentation impacts caused by roads through rainforests. Curr.
Sci. 93, 1587–1595.
Goosem, M., 2004. Linear infrastructure in the tropical rainforests of far north
Queensland : mitigating impacts on fauna of roads and powerline clearings. Conserv. Aust.
For. Fauna 418–434.
Goosem, M., 2001. Effects of tropical rainforest roads on small mammals: inhibition of
crossing movements. Wildl. Res. 28, 351–364.
Goosem, M., 1997. Internal Fragmentation: The effects of roads, highways, and
powerline clearings on movements and mortality of Rainforest vertebrates, in: Laurance WF,
Bierregaard Jr. RO (Eds) Tropical Forest Remnants. University of Chicago Press, Chicago. pp.
241–255.
Gressler, E., 2010. Fenologia de espécies de floresta atlântica, Núcleo Picinguaba,
Parque Estadual da Serra do Mar, Estado de São Paulo: comparação entre estratos e influência
de borda natural. Tese doutorado pp 262.
Groombridge, B., Jenkins, M.D., 2003. World atlas of biodiversity. Berkeley, CA:
University of California Press.
Jordano, P., Galetti, M., Pizo, M. a, Silva, W.R., 2006. Ligando frugivoria e dispersao
de sementes a biologia da conservacao, in: Biologia Da Conservacao: Essencias. pp. 411–436.
Kraft, N.J.B., Ackerly, D.D., 2010. Functional trait and phylogenetic tests of
community assembly across spatial scales in an Amazonian forest. Ecol. Monogr. 80, 401–422.
Laurance, S.G.W., Stouffer, P.C., Laurance, W.F., 2004. Effects of road clearings on
movement patterns of understory rainforest birds in Central Amazonia. Conserv. Biol. 18,
1099–1109.
Laurance, W.F., Bierregaard, J.R.O., Gascon, C., Didham, R.K., Smith, A.P., Lynam,
A.J., Viana, V.M., Lovejoy, T.E., Siving, K.E., Sites, J.J.W., Andersen, M., Tocher, M.D.,
Kramer, E.A., Restrepo, C., Moritz, C., 1997. Tropical forest fragmentation: syntesis of a

21
diverse and dynamic discipline, in: Tropical Forest Remnants: Ecology, Management and
Conservation of Fragmented Communities (Laurance, W.F. and Bierregaard, Jr.R.O., Eds.).
University of Chicago Press, Chicago, EUA. pp. 502–514.
Laurance, W.F., Clements, G.R., Sloan, S., O’Connell, C.S., Mueller, N.D., Goosem,
M., Venter, O., Edwards, D.P., Phalan, B., Balmford, A., Van Der Ree, R., Arrea, I.B., 2014.
A global strategy for road building. Nature 513, 229–232. doi:10.1038/nature13717
Laurance, W.F., Goosem, M., 2008. Impacts of Habitat Fragmentation and Linear
Clearings on Australian Rainforest Biota, in: Living in a Dynamic Tropical Forest Landscape.
pp. 295–306. doi:10.1002/9781444300321.ch23
Laurance, W.F., Goosem, M., Laurance, S.G.W., 2009. Impacts of roads and linear
clearings on tropical forests. Trends Ecol. Evol. 24, 659–669. doi:10.1016/j.tree.2009.06.009
Lewis, S.L., 2006. Tropical forests and the changing earth system. Philos. Trans. R.
Soc. 361, 195–210. doi:10.1098/rstb.2005.1711
Mayaux, P., Holmgren, P., Achard, F., Eva, H., Stibig, H.-J., Branthomme, A., 2005.
Tropical forest cover change in the 1990s and options for future monitoring. Philos. Trans. R.
Soc. 360, 373–384. doi:10.1098/rstb.2004.1590
Montgomery, D.R., 1994. Road surface drainage, channel initiation, and slope
instability. Water Resour. Res. 30, 1925–1932.
Murcia, C., 1995. Edge effects in fragmented forests: implications for conservation.
TREE 10, 58–62.
Myers, N., Mittermeier, R. a., Mittermeier, C.G., da Fonseca, G. a. B., Kent, J., 2000.
Biodiversity hotspots for conservation priorities. Nature 403, 853–8. doi:10.1038/35002501
Oliveira, P.R.R., Alberts, C., Francisco, M.R., 2011. Impact of road clearings on the
movements of three understory insectivorous bird species in the Brazilian Atlantic Forest.
Biotropica 43, 628–632.
Oliveira Filho, A.T., Ratter, J.A., 2002. Vegetation physiognomies and woody flora of
the cerrado biome., in: The Cerrados of Brazil. Ecology an Natural History of a Neotropical
Savanna (P.S. Oliveira & R.J. Marquis, Eds.). Columbia University Press, New York. pp. 91–
120.

22
Pohlman, C.L., Turton, S.M., Goosem, M., 2007. Edge effects of linear canopy
openings on Tropical Rain Forest understory microclimate. Biotropica 39, 62–71.
Prieto, P. V., Sansevero, J.B.B., Garbin, M.L., Braga, J.M. a, Rodrigues, P.J.F.P., 2014.
Edge effects of linear canopy openings on understorey communities in a lowland Atlantic
tropical forest. Appl. Veg. Sci. 17, 121–128. doi:10.1111/avsc.12043
Primack, R.B., Rodrigues, E., 2001. Biologia da Conservação.
Ramos, F.N., Santos, F.A.M., 2006. Floral visitors and pollination of Psychotria
tenuinervis (Rubiaceae): Distance from the anthropogenic and natural edges of an Atlantic
Forest fragment. Biotropica 38, 383–389. doi:10.1111/j.1744-7429.2006.00152.x
Reid, L.M., Dunne, T., 1984. Sediment production from forest road surfaces. Water
Resour. Res. 20, 1753–1761.
Reznik, G., Pires, J.P.D.A., Freitas, L., 2012. Efeito de bordas lineares na fenologia de
espécies arbóreas zoocóricas em um remanescente de Mata Atlântica. Acta Bot. Brasilica 26,
65–73. doi:10.1590/S0102-33062012000100008
Ribeiro, M.C., Martensen, A.C., Metzger, J.P., Tabarelli, M., Scarano, F., Fortin, M.-
J., 2011. The Brazilian Atlantic Forest: a shrinking biodiversity hotspot, in: Zachos, F.E.,
Habel, J.C. (Eds.), Biodiversity Hotspots: Distribution and Protection of Conservation Priority
Areas. springer, pp. 405–434. doi:10.1007/978-3-642-20992-5
Ribeiro, M.C., Metzger, J.P., Martensen, A.C., Ponzoni, F.J., Hirota, M.M., 2009. The
Brazilian Atlantic Forest: How much is left, and how is the remaining forest distributed?
Implications for conservation. Biol. Conserv. 142, 1141–1153.
doi:10.1016/j.biocon.2009.02.021
Rodrigues, E., 1998. Edge effects on the regeneration of forest fragments in North
Paraná. PhD Thesis, Harvard University.
Schonewald-Cox, C.M., Buechner, M., 1992. Park protection and public roads, in: P.
L. Fiedler E S. K. Jain (Eds), Conservation Biology: The Theory and Practice of Nature
Conservation, and Management. pp. 373–396.

23
Sterck, F., Markesteijn, L., Toledo, M., Schieving, F., Poorter, L., 2014. Sapling
performance along resource gradients drives tree species distributions within and across
tropical forests. Ecology 95, 2514–2525.
Sterck, F.J., Poorter, L., Schieving, F., 2006. Leaf traits determine the growth ‐ survival
trade ‐ off across rain forest tree species. Am. Nat. 167, 758–765.
Taylor, B.D., Goldingay, R.L., 2010. Roads and wildlife: Impacts, mitigation and
implications for wildlife management in Australia. Wildl. Res. 37, 320–331.
doi:10.1071/WR09171
Trombulak, S.C., Frissell, C.A., 2000. Review of Ecological Effects of Roads on
Terrestrial and Aquatic Communities. Conserv. Biol. 14, 18–30.
Webb, E.L., Stanfield, B.J., Jensen, M.L., 1999. Effects of topography on rainforest tree
community structure and diversity in American Samoa, and implications for frugivore and
nectarivore populations. J. Biogeogr. doi:10.1046/j.1365-2699.1999.00326.x
Whitworth, A., Beirne, C., Rowe, J., Ross, F., Acton, C., Burdekin, O., Brown, P., 2015.
The response of faunal biodiversity to an unmarked road in the Western Amazon. Biodivers.
Conserv. 24, 1657–1670. doi:10.1007/s10531-015-0883-y
Wolf, I.D., Hagenloh, G., Croft, D.B., 2013. Vegetation moderates impacts of tourism
usage on bird communities along roads and hiking trails. J. Environ. Manage. 129, 224–234.
doi:10.1016/j.jenvman.2013.07.017

24
CAPÍTULO I - Pathways affect vegetation structure and composition in the Atlantic
Forest in southeastern Brazil
Artigo publicado em Acta Botanica Brasilica
Aceito em 8 de fevereiro de 2017.
doi: 10.1590/0102-33062016abb0402.
Bruna Gonçalves da Silva1*,
Ana Carolina Devides Castello2,
Ingrid Koch3
and Wesley Rodrigues Silva4
1 Programa de Pós-Graduação em Ecologia, Departamento de Biologia Animal, Universidade
Estadual de Campinas, Rua Monteiro Lobato, 255, 13083-862, Campinas, SP, Brazil
2 Programa de Pós-Graduação em Ciências Biológicas, Departamento de Botânica,
Universidade Estadual Paulista Júlio de Mesquita Filho, campus Botucatu, Rubião Júnior, s/n,
18618-970, Botucatu, SP, Brazil
3 Departamento de Biologia Vegetal, Instituto de Biologia, Universidade Estadual de
Campinas, Rua Monteiro Lobato, 255, 13083-862, Campinas, SP, Brazil
4 Departamento de Biologia Animal, Universidade Estadual de Campinas, Rua Monteiro
Lobato, 255, 13083-862, Campinas, SP, Brazil
* Corresponding author: [email protected]

25
Abstract
Although impacts generated by gaps can affect vegetation, few studies have addressed these
impacts in the Atlantic Forest. Our aim was to investigate the effects of pathways of varying
widths on vegetation structure and composition, considering dispersal syndromes, diversity,
life forms, successional categories and threatened and exotic species occurrence in the Atlantic
Forest. We studied three pathways with widths of 2, 10 and 20 m, intersecting a protected area
in southeastern Brazil. To assess edge effects, plots were established adjacent to paths (edge)
and 35 m from the edge (neighborhood), and in a control area without pathways. Wider
pathways (10 and 20 m) exhibited reduced tree height and diameter, high liana density, exotic
species, and a high proportion of pioneer and anemochorous species. In conclusion, our results
indicate that the vegetation structure of narrow pathways (2 m) is similar to the control area,
and that wide linear gaps cause negative effects on vegetation and extend to a distance of at
least 35 m into the forest interior. Considering that linear gaps generate permanent effects to
vegetation and may affect other organisms, we suggest that these effects must be considered
for successful management of protected areas, including planning and impact mitigation.
Keywords: Carlos Botelho State Park, conservation, linear gaps, plants, roads, trails
Introduction
Pathway construction amidst forests creates gaps that increase habitat fragmentation,
one of the main threats to tropical forests (Gascon et al. 2000). Unlike natural forest gaps,
anthropic linear gaps are practically immutable due to maintenance activities, imposing
persistent effects on the conditions and resources of the forest nearby (Laurance et al. 2009).
The effects of pathways relate to topography (e.g. earthmoving), soil conditions, microclimatic
conditions, light exposure, which create distinct environments compared to the forest interior
(Tabarelli et al. 1999; Webb et al. 1999; Laurance et al. 2009), affecting habitat structure and
species composition (Mantovani 2001; Enoki et al. 2012).
Tall trees and shade tolerant species usually inhabit old-growth tropical forest interiors
(Liebsch et al. 2008). Environments with increased light availability create conditions for the
colonization of early-successional species, normally wind-dispersed (Tabarelli et al. 1999;

26
Laurance et al. 2009). The maintenance of these conditions over time and space allows the
permanence of species associated with disturbed environments (Murcia 1995). Consequently,
a permanent shift in plant community structure and composition might occur (Mantovani
2001).
Several studies addressed the changes in vegetation structure and composition at the
edges of linear forest gaps (Demir 2007; Enoki et al. 2012; Otto et al. 2013; Li et al. 2014) and
just a few conducted in tropical forests focused on linear gaps caused by roads, gas pipelines
and power lines (Reznik et al. 2012; Prieto et al. 2014; Couto-Santos et al. 2015), or pastures
(Ribeiro et al. 2009a). In those studies, linear gaps affected the phenodynamics of animal
dispersed plants (Reznik et al. 2012), tree species structure and richness (Ribeiro et al. 2009a;
Couto-Santos et al. 2015), and proportion of pioneer species (Prieto et al. 2014). However, the
extent to which the pathway width affects those forest attributes has never been properly
assessed and understood.
The largest remaining portion of the Atlantic Forest, one of the biodiversity hotspots,
lies in the Southeastern Brazil (Myers et al. 2000; Ribeiro et al. 2009b; Ribeiro et al. 2011a).
Ecosystems within the Atlantic forest are being continuously degraded by illegal (e.g.
poaching, selective logging), and legal (e.g. infrastructure installations such as roads, power
lines, natural gas pipelines) impact vectors (Terborgh & Schaik 2002; Ribeiro et al. 2011a). On
the other hand, roads and pathways are part of the necessary infrastructures that allow the
management and surveillance of any park, which are also sometimes used for educational,
ecotourism and research purposes. Therefore, research on the impacts of gaps generated by
pathways and their associated influence on vegetation integrity is a promising approach to
guide a more critical discussion on the two sides of the conservation issue (effective
management x effective protection), contributing for decisions on the landscape changes and
management strategies along the Atlantic forest continuum.
In this study we investigate the impacts of pathways of varying widths on the vegetation
structure and species composition in an Atlantic forest protected area in southeastern Brazil,
through the assessment of different life forms, successional categories, threatened and exotic
species and the predominance of dispersal syndromes. We hypothesize that impacts in the
wider pathway are more pronounced than in areas where pathways are narrow or absent. These
impacts differentially affect the vegetation structure and composition among pathways, with

27
wider ones characterized by plants with low height and small diameter, a high proportion of
pioneer and wind dispersed species, and the occurrence of exotic species.
Materials and methods
Study site
We conducted this study at Carlos Botelho State Park (CBSP), a 37,644.36 ha protected
area, part of the Atlantic Forest continuum, located between 24º06’55” - 24º14’41”S and
47º47’18” - 48º07’17”W, in the Sao Paulo state, southeastern Brazil (Fig. 1A). Altitudinal
amplitude within the CBSP ranges from 20 to 1000 m. The climate is tropical, with mean
annual temperature of 18 ºC, and annual precipitation between 1500 - 2200 mm (Ferraz &
Varjabedian 1999). The predominant vegetation type is Dense Ombrophilous Forest, which is
divided into the following categories along the altitudinal gradient (Kronka et al. 2005):
Lowland Dense Ombrophilous Forest (0 - 50 m), Submontane Dense Ombrophilous Forest (51
- 500 m) and Montane Dense Ombrophilous Forest (501 - 1500 m).
Pathways selected for sampling are located at an average altitude of 800 m, in the
Montane Dense Ombrophilous Forest (Fig. 1B). Several ecological aspects for plant
communities (e.g. density, richness, diversity and species composition) are more affected in
the first 35 m from forest edges (Rodrigues 1998). Thus, to include edge effects, we sampled
at the pathways edge and 35 m from the edge (neighborhood) (Fig. 1C). We selected a single
path per pathway type because in the same forest continuum and elevation there are no replicas
for the pathway types. We collected data on the following pathway types: main road, secondary
road and trail (Fig. 1B). In addition, we established a control area, reputedly close to a reference
state of conservation (Fig. 1B) (SMA 2008). All sampled plots are distributed within the same
forest matrix, climate, altitude, and are spatially close (minimum distance between plots within
the same pathway = 200 m and between pathways = 600 m). The control area is at least 1000
m away from the forest edge. Given the small spatial scale of the study, it is possible to assume
that differences between plots are more related to direct effects of the pathways instead of
purely spatial effects. The topography distribution of the plots encompassed mostly slopes,
with some at hilltops and stream valleys, a similar pattern across all survey pathways.

28
Figure 1. A. Location of Carlos Botelho State Park, SE Brazil. B. Situation of the pathways
and control area sampled – 1: main road, 2: trail, 3: control area, 4: secondary road. C.
Distribution of plots along the pathway (four adjacent to the pathway - edge - and four 35 m
towards the forest interior - neighborhood).
Types of pathway
The main road within the CBSP is a dirt road of 112 km long (named SP-139) and about
20 m wide that intersects a total of 33 km of the state park area, with a completely open canopy
(Fig. 2A). The secondary road is a dirt road approximately 12 km long and mostly 10 m wide,
with the canopy covered at some points (Fig. 2B). The trail is approximately 4.5 km, 2.0 m
wide, with the canopy covered along its total extension (Fig. 2C). The control area is
representative of the mature forest occurring in most of the park (Fig. 2D), without apparent
anthropic influence (SMA 2008).

29
Figure 2. Sampling areas at Carlos Botelho State Park, São Paulo state, SE Brazil. Different
pathways used as treatments – A: main road (20 m of width), B: secondary road (10 m of
width), C: trail (2 m of width), D: control area.
Sampling Design
In each pathway we a priori selected a stretch of 1400 m along its total extension that
was parallel to the pathway. We disregarded the first 500 m of each pathway in order to
minimize forest edge effects, and only achieve pathway edge effects. Along each selected
stretch eight 10 x 10 m sampling plots were alternately set: four adjacent to the path (edge) and
four 35 m from the edge (neighborhood) (Fig. 1B). Plots were separated at least by 200 m of
each other along the path to secure the independence of sampling units (Dias & Couto 2005;
Lenza et al. 2011) (Fig. 1B). At the control area we set the eight plots in the same manner,
except that there was no pathway. We used the pathways width (2, 10 and 20 m), named here

30
as “type of pathway”, as a proxy of edge effects. In this design, the “type of pathway”
(including control area) and “distance to edge” (0 and 35 m) are considered as treatments.
Vegetation survey
Vegetation structure and abundance - We recorded the following variables from
individuals with diameter at breast height (DBH) ≥ 3.18 cm: total height, DBH and tree crown
diameter (Durigan 2003). Total height (measured from ground) and tree crown diameter (by
estimating the canopy radius) were visually estimated using a 3 m stick as a parameter. The
same person made all measurements. Based on total height, individuals were classified into
three strata: high understory (1.5 - 5 m), intermediate level (5.1 - 11 m) and canopy (above 11
m). We also measured the low understory density of each plot by counting the number of
individuals with 10 - 100 cm in height (DBH was always lower than 3.18 cm), in four sub-plots
of 1 x 1 m at sampling points randomly assigned within each 10 x 10 m plot. Subplots were
only installed for measuring the understory density, where individuals were counted but not
identified. We excluded bamboo species (Merostachys sp.) from low understory density
surveys, because they were considered as a separate variable (see below).
Abundance of epiphytes, vines (considering the herbaceous or woody) and bamboos
(Merostachys sp.) in each plot was also recorded and classified in categories according to the
percentage of the plot area cover. For epiphytes and vines we considered the categories low (<
20%), medium (20 - 50%) and high (> 50%), and for bamboos we established lower abundance
thresholds (10% - low, 10-30% - medium and > 30% - high). We recorded the presence of
exotic species inside plots and along the pathways. This methodology was adapted from the
Brazilian Ministry of Environment Resolution No. 01/94 (CONAMA 2015).
Canopy openness in each plot was measured using hemispherical photographs (Frazer
et al. 2001), taken with a Nikon Coolpix 4500 camera with a fish-eye FC-E8 lens. We
positioned the camera, with the aid of a tripod, at an approximate 60 cm height, at the centre
of each plot. Photographs were taken in cloudy days to avoid over exposure to direct sunlight,
which may influence image analysis (Frazer et al. 2001). We converted the resulting images in
black and white colours in ImageJ software (2015). The canopy openness was estimated based
on white pixels, which correspond to the percentage of gaps.

31
Vegetation composition - We considered the following variables to assess vegetation
composition in each plot: life forms, diversity, successional categories, threatened and exotic
species occurrence and predominance of dispersal syndromes. We identified and tagged all
individuals with DBH ≥ 3.18 cm. Plant species were identified by collecting individual
reproductive branches under SISBIO (#23627-1) and IBAMA (#4968681) collection
permission. Identification was based on the literature and consultation to botanists. Vouchers
were deposited at the Universidade Estadual de Campinas herbarium (UEC).
We grouped species according to two general successional categories: pioneer,
including pioneer and early secondary, and non-pioneer, including late secondary and climax
species (São Paulo 2008; Ronquim & Torresan 2011; Lingner et al. 2013). Dispersal syndromes
were identified as zoochorous, anemochorous and autochorous following Pijl (1970). In
addition, we considered the species’ level of threat, according to the list of threatened flora of
São Paulo state (São Paulo 2008), the red book of Brazilian flora (Martinelli & Moraes 2013)
and IUCN’s list of threatened flora (IUCN 2015). The species list was organized according to
the taxonomical arrangement adopted by the Angiosperm Phylogeny Group IV (APG 2016).
Species names were cross-checked with the List of Species of the Brazilian Flora (2015).
Data analyses
Vegetation structure and abundance - Plots were considered as independent sampling
units. We applied a two-way ANOVAs for tree crown diameter, DBH and total height
(considering mean values for plots), canopy openness for plot and percentage of individuals
per stratum (high understory, intermediate level and canopy) and low understory density as
response variables and “type of pathway” and “distance to edge” as predictors. The
assumptions of normality and homogeneity of variance were verified using the Shapiro-Wilk
test and confirmed visually in graphic analyses. When a significant ANOVA was obtained (P
< 0.01), a post hoc HSD Tukey test was used to investigate differences between treatments,
where P < 0.05 was considered significant.
Vegetation composition - We tested the difference in species composition for “type of
pathway” and “distance to edge”, considering abundance and richness, using the permutational
multivariate analysis of variance (Permanova; Anderson 2001) (P < 0.01 was considered
significant). We used the “adonis” function of the R vegan package with Bray-Curtis distances
and 10,000 permutations. In order to verify general tendencies of variation in vegetation

32
composition, we performed an ordination analysis with non-metric multidimensional scaling
(NMDS; Minchin 1987). We adopted this approach to better identify and interpret similarities
between treatments. All analyses were performed in the R environment (R Core Team 2015).
We performed a diversity profile analysis, because it enables comparisons, as opposed
to description of diversity indices only. With α = 1, it is equivalent to Shannon’s diversity index
(H’), and α = 2, it is equivalent to Simpson’s diversity index (D); α = 0 corresponds to richness
values in different pathways. Therefore, we were able to compare treatments according to
evenness and richness. These analyses were conducted using PAST (Hammer et al. 2001).
To evaluate differences in the proportion of zoochorous and pioneers species between
the “type of pathway” and “distance to edge” we used generalized linear models with a
binomial distribution. Significance of the factors was assessed by means of a Chi-squared
Analysis of Deviance (P < 0.01 was considered significant). The analyses were carried out in
the R statistical software (R Core Team 2015).
Results
Vegetation structure and abundance
We sampled 1019 individual trees (DBH ≥ 3.18 cm) and 2302 individuals in the low
understory (10 - 100 cm, DBH < 3.18 cm). Mean crown diameter, mean DBH, mean total
height, canopy openness, tree percentage per stratum (except intermediate stratum) and low
understory density were affected by type of pathway (Tab. 1). For those variables, trail and
control areas were similar, but they significantly differed from main and secondary roads,
which were also similar to each other (Tab. 2). The trail and control area had higher values for
DBH, tree crown diameter, tree height and number of individuals in the canopy stratum,
whereas main and secondary roads had higher values for canopy openness and number of
individuals in the high and low understory (Tab. 2).

33
Table 1. ANOVA results. Variables of vegetation structure considering type of pathway,
distance to edge (35 m) and interaction, at Carlos Botelho State Park - SP, Brazil. DBH -
diameter at breast height. P < 0.01 was considered significant.
Df F p
Tree crown diameter*
Type of pathway
(TP)
3 18.64 <0.0001
Distance to edge
(DE)
1 0.007 0.934
TP x DE 2 0.714 0.499
Residuals 25
DBH (cm)*
Type of pathway 3 13.09 <0.0001
Distance to edge 1 0.57 0.457
TP x DE 2 0.72 0.493
Residuals 25
Total height (m)*
Type of pathway 3 29.94 <0.0001
Distance to edge 1 0.91 0.349
TP x DE 2 0.57 0.571
Residuals 25
Canopy openness
Type of pathway 3 13.34 <0.0001
Distance to edge 1 1.53 0.227
TP x DE 2 0.91 0.415
Residuals 25
Percentage of trees
surveyed on the high-
understory (1.5 – 5 m)
Type of pathway 3 23.02 <0.0001
Distance to edge 1 0.163 0.69
TP x DE 2 0.527 0.597
Residuals 25
Percentage of trees
surveyed on the
intermediate level (5.1 –
11 m)
Type of pathway 3 2.3 0.101
Distance to edge 1 0.04 0.835
TP x DE 2 0.34 0.714
Residuals 25
Percentage of trees
surveyed on the canopy
level (above 11 m)
Type of pathway 3 10.49 0.0001
Distance to edge 1 0.03 0.859
TP x DE 2 0.02 0.974
Residuals 25
Low-understory (10 cm –
100 cm height)*
Type of pathway 3 6.41 0.002
Distance to edge 1 0.28 0.596
TP x DE 2 0.08 0.923
Residuals 25
* = Mean values for plot

34
Table 2. HSD Tukey’s test. Variables of vegetation structure among type of pathway at Carlos
Botelho State Park - SP, Brazil. DBH - diameter at breast height. P < 0.05 was considered
significant.
Main road
Secondary
road Trail Control area
Tree crown diameter* 1.77 ± 0.62 a 1.55 ± 0.13 a 2.98 ± 0.43 b
2.77 ± 0.48 b
DBH (cm)* 8.34 ± 0.96 a 9.35 ± 1.30 a 12.37 ±
1.51 b
12.62 ± 2.44
b
Total height (m)* 6.04 ± 1.18 a 6.61 ± 1.33 a 10.69 ±
1.23 b
10.58 ± 1.33
b
Canopy openness 12.87 ±
1.41a 11.67 ± 1.49 a
9.31 ± 1.23
b 9.15 ± 1.53 b
Percentage of trees surveyed on the
high-understory (1.5 – 5 m) 50.96 a 43.88 a 10.47 b 10.33 b
Percentage of trees surveyed on the
intermediate level (5.1 – 11 m) 40.32 a 42.61 a 32.19 a 53.99 a
Percentage of trees surveyed on the
canopy level (above 11 m) 8.7 a 13.5 a 25.13 b 36.15 b
Low-understory (10 cm – 100 cm
height)*
24.43 ± 9.42
a 21.17 ± 9.35 a
11.37 ±
2.48 b
12.25 ± 3.00
b
Total number of trees with DBH ≥
3.18 cm 310 237 259 213
a, b = Variables significantly different according to HSD Tukey test p < 0.05
* = Mean values for plot
We found low epiphytes abundance, and low/medium herbaceous vines abundance for
main road. In main and secondary roads, abundance of both epiphytes and herbaceous vines
ranged from low to high. For trail and control area, epiphytes abundance was medium to high,
and abundance of herbaceous vines was low, with predominance of woody vines (i.e. lianas).
Bamboo (Merostachys sp.) clumps predominated in some points of the main and secondary
roads (low, medium and high abundance), while in the control and trail areas bamboo
abundance was low. In the main and secondary roads we recorded Urochloa sp. (=Brachiaria
sp.), an exotic species, and the invasive Pteridium sp.. Additionally, we observed Citrus x
limon and Eucalyptus sp. present along the main and secondary roads outside the sampled plots.
Vegetation composition
Only the type of pathway influenced plant composition (PERMANOVA; type of
pathway: F3,25 = 1.78, p < 0.001), while distance to the edge (F1,25 = 1.12, p = 0.283) and their

35
interaction (F2,25 = 1.08, p = 0.995) were not significant. The ordination analysis (NMDS), final
stress: 0.22, was consistent with results generated by PERMANOVA, and plots surveyed in
the main road were grouped and separated from plots in the control area and trail, highlighting
a marked difference between these areas. There was a distribution of points along axis 1 going
from the wider pathways to the control area. However, no pattern was observed along axis 2.
Data of the secondary road plots data formed an undefined grouping pattern (Fig. 3).
Figure 3. Scaling analysis (nMDS) of plant community among surveyed plots of treatments
type of pathway and distance to edge in Carlos Botelho State Park, SP, Brazil. M: main road,
S: secondary road, T: trail (e - edge, n - neighborhood), C: control area (nMDS, Final stress:
0.22).

36
The control area and secondary road presented equal number of species (84 spp.),
followed by trail (80 spp.) and main road (76 spp.). The control area and main road had the
highest number of exclusive species (27 spp.), followed by secondary road (24 spp.) and trail
(17 spp.). Secondary road and trail shared a high number of species (43 spp.). In contrast,
control area and main road had the lowest number of shared species. Only 17 species were
sampled in all areas (Tab. S1 in supplementary material). Of the total species (178 spp.), 15 are
listed in threatened flora lists (São Paulo 2008; Martinelli & Moraes 2013; IUCN 2015). Six
species are listed as vulnerable and five as endangered; four are listed in more than one list of
threatened flora (Tab. S1 in supplementary material). Main road was the pathway with the
lowest number of threatened species. The diversity profile analysis demonstrated that the
diversity index is similar among the areas (Fig. 4). However, when assigned more weight to
evenness (α = 2) main road plots and trail edge plots had the lowest values, and when assigned
more weight to richness secondary road had high values (Fig. 4).
Figure 4. Diversity profile of plant community among pathways at Carlos Botelho State Park,
SP, Brazil. M: main road, S: secondary road, T: trail, (e – edge, n – neighborhood), C: control
area. α = 1, it is equivalent to Shannon’s diversity index (H’), and α = 2, it is equivalent to
Simpson’s diversity index (D); α = 0 corresponds to richness values. Please see the PDF version
for color reference.

37
Zoochorous species predominated in all areas, representing more than 70% of the total
species number (Fig. 5A). There was no difference in zoochorous species predominance among
types of pathway and distance to edge (Tab. 3, Fig. 5A). The number of individuals, on the
other hand, was smaller in the main road edge compared to neighborhood and other pathways
and control area (Tab. 3, Fig. 5B).
The proportion of pioneer species and individuals was different for type of pathway and
distance to edge (Tab. 3, Fig. 5C, D). Wider pathways presented higher values when compared
to the trail and control area (Tab. 3, Fig. 5C, D). The edge plots of wider pathways had the
highest values when compared to their own neighborhood plots (Fig. 5C, D).
Table 3. Results for generalized linear model for proportion of dispersal syndromes:
zoochorous vs. non-zoochorous (anemochorous plus autochorous) species and individuals; and
proportion of successional categories: pioneer vs. non-pioneer species and individuals,
considering “type of pathway”, “distance to edge” and interaction, at Carlos Botelho State Park
- SP, Brazil. P < 0.01 was considered significant.
Dispersal syndromes
Species Df Deviance p
Type of pathway 3 2.855 0.414
Distance to edge 1 2.785 0.095
Type of pathway x Distance to edge 2 0.684 0.71
NULL 31 32.722
Individuals Df Deviance p
Type of pathway 3 28.505 <0.0001
Distance to edge 1 16.663 <0.0001
Type of pathway x Distance to edge 2 11.532 0.003
NULL 31 111.828
Successional categories
Species Df Deviance p
Type of pathway 3 31.158 <0.0001
Distance to edge 1 15.117 0.0001
Type of pathway x Distance to edge 2 0,085 0.958
NULL 31 79.437
Individuals Df Deviance p

38
Type of pathway 3 92.778 <0.0001
Distance to edge 1 45.155 <0.0001
Type of pathway x Distance to edge 2 5.500 0.063
NULL 31 192.702
Figure 5. Proportion of dispersal syndromes - zoochorous vs. non-zoochorous (anemochorous
plus autochorous) species and individuals; and proportion of successional categories: pioneer
vs. non-pioneer species and individuals among “type of pathway” and “distance to edge” at
Carlos Botelho State Park, SP, Brazil. The box-plots are displaying the median, the first and
39
third quartile, and the maximum and minimum values of the data sets. A: Zoochorous species,
B: Zoochorous individuals, C: Pioneer species, D: Pioneer individuals.
Discussion
Changes in vegetation were detectable beyond the edges in wider (10 and 20 m)
pathways, at least 35 m towards the forest interior. Different widths can determine the degree
of microclimatic changes in the edge zone of a pathway (Pohlman et al. 2007). Light
availability, high temperatures, low relative humidity, variation in soil nutrient availability and
sediment runoff are variables that change according to the characteristics of linear gaps (Reid
& Dunne 1984; Denslow 1987). Edges of wide pathways are more exposed to those factors
when compared to narrow pathways, and can modify both the vegetation structure and the
successional process in their vicinities (Goosem 1997). The distribution of plant species in
tropical forests reflects different specific tolerances to drought, shade, and nutrient stress
(Sterck et al. 2006; Engelbrecht et al. 2007; Baltzer & Thomas 2010), implying that species
are at least partially separated for different resource niches within a local community (Kraft &
Ackerly 2010; Sterck et al. 2014).
Species composition differed in pathways with different widths. The control area and
the narrow pathway (trail) exhibited similar species composition, but differed from the wider
pathway (main road). Plots along the 10 m-width secondary road varied widely in species
composition. The secondary road had half the width of the main road and canopy connection
occurs in some points along its extension. This characteristic can promote high habitat
heterogeneity and contribute to mixed species composition. Shade-tolerant species occurring
in secondary road plots (e.g. Micropholis crassipedicellata, Ocotea odorifera and Myrcia
eugeniopsoides) were also found in trail and control plots, but pioneer species (e.g. Tibouchina
pulchra and Miconia cabucu) occurred mostly in main road plots. Thus, the high species
diversity in the secondary road may be explained by a combination of species with different
ecological requirements (Allouche et al. 2012), corroborating the intermediate disturbance
hypothesis (Connel 1978; Molino & Sabatier 2001). The low diversity in trail can be probably
related to the selective logging that occurred during the extractive period (near the 40’s) of

40
charcoal production (SMA 2008), as indicated by the presence of some charcoal ovens along
the trail (SMA 2008).
A wide linear gap such as the main road (20 m) may disturb microclimate conditions
and resource availability for plants, affecting the species distribution and eventually causing
differences in the vegetation structure and composition between the edges and their inner
adjacent areas (Hartshorn 1980; Sterck et al. 2014). Recruitment of generalist species can be
facilitated by a wide pathway gap, which would benefit from highly variable ecological
conditions found at the edge of the main road (Forman & Alexander 1998), resulting in species
dominance (Denslow 1980), as demonstrated by the low evenness found in the main road. An
increase in 10 m between the secondary and main road widths can be sufficient to determine
differences in species composition, which emphasizes the importance of the gap size in the
structuring of local plant communities (Denslow 1980; Zhu et al. 2014).
The predominance of species of different successional groups also depends on the gap
size and the environmental conditions prevailing at the pathway edges (Denslow 1980), as
verified for pioneer species, which have a positive relationship with gap size (Denslow 1980;
Laurance et al. 2009). Shade intolerant pioneer species usually establish from the seed bank
that existed prior to clearing or from subsequent recruitment (Tabarelli & Peres 2002). When
a linear gap is established in a forested area, microclimatic conditions are inevitably altered,
which allows pioneer species germination and/or seed dispersal (Webb et al. 1999). On the
other hand, non-pioneer species are much less abundant and are prone to death at edges
(Tabarelli & Peres 2002).
Wider pathways benefit anemochorous species because the aerodynamic design of their
propagules enable them to be easily wind-transported for long distances in open environments
(Howe & Smallwood 1982; Jara-Guerrero et al. 2011). Changes in the frequency of dispersal
strategies are a result of favorable habitat conditions and disperser activity (wind vs. vertebrate
dispersal) coupled with specific life forms (shrubs vs. trees) and the species frequency in these
groups through successional stages (Tabarelli & Peres 2002). Accordingly, the wider pathway
was characterized by a low frequency of zoochorous and a high density of anemochorous
species. Gap size also determines the abundance of shrubs and small trees, since these life
forms have greater densities in large rather than in small gaps (Zhu et al. 2014), as demonstrated
by the higher densities of individuals smaller than 1m height in the wider pathways.

41
Atlantic Forest threatened species with restricted distributions were also affected by
pathway width, with lower numbers occurring in the wider pathway. The exception was
Euterpe edulis, a dominant palm species in undisturbed areas of the Atlantic forest (Guilherme
et al. 2004), which, contrary to our expectations, was among the most abundant species in all
pathways. Possibly, the high survival rates of juvenile in gaps, compared to areas with dense
canopy cover, may explain this unexpected pattern (Nakazono et al. 2001; Ribeiro et al.
2011b).
Vine abundance is also positively related to increases in linear gaps (Laurance et al.
2001; Bataghin et al. 2010). High abundance of vines at forest edges results from their demand
for intense light exposure and the presence of slender trees that provide support for their
fixation (Putz 1984). On the other hand, epiphytes are more sensitive to microclimate variations
(Hietz 1998), require tall trees as substrate, and are therefore negatively related to linear gap
width (Gonçalves & Waechter 2002; Wolf 2005). Not surprisingly, we found low abundance
of epiphytes in areas intersected by wide pathways.
Intense management and traffic favor dispersal of exotic species along pathways (Dar
et al. 2015), which is the case in our study, mainly at the main road. Despite the low traffic in
the secondary road inside CBSP, exotic species were also recorded for this pathway, suggesting
that even light traffic can promote the dispersal of exotic species. Moreover, the traffic-
mediated dispersal of exotic species overcome competition with native plants, as many exotic
species can withstand extreme conditions, like high light exposure, and succeed in colonising
and establishing at the edges of pathways (Dar et al. 2015).
Plant communities with high number of individuals with small diameter and height
were more frequent in the pathway edges but not in the control area, which indicates a typical
initial regeneration phase (Guariguata & Ostertag 2001; Couto-Santos et al. 2015). This
condition was probably set well before the park creation (between 40's and 70's), with the
implantation of the pathways, and remained stable over time due to path maintenance.
In tropical forests, areas adjacent to linear gaps are characterized by low species
richness, high proportion of pioneers and anemochorous plants and presence of exotic species,
as reported in this study and others (Ribeiro et al. 2009a; Reznik et al. 2012; Prieto et al. 2014).
We also found that pathway width influences the nearby vegetation as much as its presence.

42
Therefore, the impacts of pathways on the vegetation and, subsequently, on their associated
fauna should be carefully considered for conservation and management purposes (Dewalt et
al. 2003; Watson et al. 2004). Unfortunately, despite under state protection, our study area will
probably continue to suffer impacts, because the roads are permanent. Additionally,
modifications promoted by linear gaps may change over time according to the adopted
management decisions and actions (Pickering et al. 2010; Müllerová et al. 2011), jeopardizing
the status and distribution of several native plant species, as well as the control of the exotic
ones, mostly in the wider pathways.
In conclusion, our study highlights that pathways wider than 10 m intersecting native
forest areas negatively affect the vegetation structure and species composition, modifying the
predominance of life forms and the (distribution/proportion) of dispersal syndromes, with
consequences for the successional categories, threatened species, besides increasing the
occurrence of exotic species. These changes are permanent, interrupt the process of species
turnover in ecological succession, and increase the intensity of effects according to the pathway
width. We expect that changes in the vegetation should also influence the resource availability
and habitat use by the fauna (Restrepo et al. 1999; Dewalt et al. 2003; Watson et al. 2004). Our
study stresses the importance of assessing the trade-offs between the consequences for
conservation and the necessities of management of Atlantic Forest protect areas crossed by
different kinds of pathways.
Acknowledgements
The authors thank Fundação de Amparo à Pesquisa do Estado de São Paulo (FAPESP),
for providing financial support (Grant 2013/11175-6); Instituto Florestal do Estado de São
Paulo for collection permits; Fiorella F. M. Capelo and Marcelo Monge for helping with
specimens identification; Leonardo Ré Jorge for statistical assistance, comments and
suggestions; Alexander Vicente Christianini for comments and suggestions; Cristiane Patrícia
Zaniratto, Eric Yasuo Kataoka, João de Deus Vidal Júnior and Mario Alejandro Marin Uribe
for assistance with field work.

43
References
Allouche O, Kalyuzhny M, Moreno-Rueda G, Pizarro M, Kadmon R. 2012. Area-
heterogeneity tradeoff and the diversity of ecological communities. Proceedings of the
National Academy of Sciences 109: 17495-17500.
Anderson MJ. 2001. A new method for non-parametric multivariate analysis of variance.
Austral Ecology 26: 32-46.
APG. 2016. An update of the Angiosperm Phylogeny Group classification for the orders
and families of flowering plants: APG IV. Botanical Journal of the Linnean Society 181:
1-20.
Baltzer JL, Thomas SC. 2010. A second dimension to the leaf economics spectrum predicts
edaphic habitat association in a Tropical Forest. PLoS One 5: e13163.
doi:10.1371/journal.pone.0013163
Bataghin FA, Barros F, Pires JSR. 2010. Distribuição da comunidade de epífitas vasculares
em sítios sob diferentes graus de perturbação na Floresta Nacional de Ipanema, São
Paulo, Brasil. Revista Brasileira de Botânica 33: 501-512.
CONAMA – Conselho Nacional do Meio Ambiente. 2015. Resolução no. 1/1994. Define
vegetação primária e secundária nos estágios pioneiro, inicial e avançado de regeneração
da Mata Atlântica, afim de orientar os procedimentos de licenciamento de exploração da
vegetação nativa no Estado de São Paulo. <https://www.conama.gov.br>. 01 Oct. 2015.
Connell J. 1978. Diversity in tropical rain forests and coral reefs. Science 199: 1302-1310
Couto-Santos APL, Conceição AA, Funch LS. 2015. The role of temporal scale in linear
edge effects on a submontane Atlantic forest arboreal community. Acta Botanica
Brasilica 29: 190-197.
Dar PA, Reshi ZA, Shah MA. 2015. Roads act as corridors for the spread of alien plant
species in the mountainous regions: A case study of Kashmir Valley, India. Tropical
Ecology 56: 183-190.

44
Demir M. 2007. Impacts, management and functional planning criterion of forest road
network system in Turkey. Transportation Research Part A: Policy and Practice 41: 56-
68.
Denslow JS. 1980. Gap partitioning among tropical rainforest trees. Biotropica 12: 47-55
Denslow JS. 1987. Tropical rainforest gaps and tree species diversity. Annual Review of
Ecology, Evolution, and Systematics 18: 431-451.
Dewalt SJ, Maliakal SK, Denslow JS. 2003. Changes in vegetation structure and
composition along a tropical forest chronosequence: implications for wildlife. Forest
Ecology and Management 182: 139-151.
Dias AC, Couto, HTZ. 2005. Comparação de métodos de amostragem na Floresta
Ombrófila Densa - Parque Estadual Carlos Botelho/SP-Brasil. Revista do Instituto
Florestal 17: 63-72.
Durigan G. 2003. Métodos para análise de vegetação arbórea. In: Cullen Jr L, Rudran R,
Valladares-Padua C. (orgs.) Métodos de estudos em biologia da conservação e manejo
da vida Silvestre. Curitiba, Editora UFPR. p. 455-479.
Engelbrecht BMJ, Comita LS, Condit R, et al. 2007. Drought sensitivity shapes species
distribution patterns in tropical forests. Nature 447: 80-82.
Enoki T, Kusumoto B, Igarashi S, Tsuji K. 2012. Stand structure and plant species
occurrence in forest edge habitat along different aged roads on Okinawa Island,
southwestern Japan. Journal of Forest Research 19: 97-104.
Ferraz LPM, Varjabedian R. 1999. Evolução histórica da implantação e síntese das
informações disponíveis sobre o Parque Estadual Carlos Botelho. São Paulo, Secretaria
do Meio Ambiente/Instituto Florestal.
Forman RTT, Alexander LE. 1998. Roads and their major ecological effects. Annual
Review of Ecology, Evolution, and Systematics 29: 207-231.

45
Frazer GW, Fournier RA, Trofymow JA, Hall RJ. 2001. A comparison of digital and film
fisheye photography for analysis of forest canopy structure and gap light transmission.
Agricultural and Forest Meteorology 109: 249-263.
Gascon C, Williamson GB, Fonseca GAB. 2000. Receding forest edges and vanishing
reserves. Science 288: 1356-1358.
Gonçalves CN, Waechter JL. 2002. Epífitos vasculares sobre espécimes de Ficus
organensis isoladas no norte da planície costeira do Rio Grande do Sul: padrões de
abundância e distribuição. Acta Botanica Brasilica 16: 429-441.
Goosem M. 1997. Internal Fragmentation: The effects of roads, highways, and powerline
clearings on movements and mortality of Rainforest vertebrates. In: Laurance WF,
Bierregaard Jr RO. (eds.). Tropical Forest Remnants. Chicago, University of Chicago
Press. p. 241-255.
Guariguata MR, Ostertag R. 2001. Neotropical secondary forest succession: Changes in
structural and functional characteristics. Forest Ecology and Management 148: 185-206.
Guilherme FAG, Morellato LPC, Assis MA. 2004. Horizontal and vertical tree community
structure in a lowland atlantic rain forest, southeastern Brazil. Revista Brasileira de
Botânica 27: 725-737.
Hammer Ø, Harper DAT, Ryan PD. 2001. Paleontological statistics software package for
education and data analysis. Palaeontologia Electronica 4: 9-18.
Hartshorn GS. 1980. Neotropical forest dynamics. Biotropica 12: 23-30.
Hietz P. 1998. Diversity and conservation of epiphytes in a changing environment. Pure
Applied Chemistry 70: 23-27.
Howe HF, Smallwood J. 1982. Ecology of seed dispersal. Annual Review of Ecology,
Evolution, and Systematics 13: 201-208.
ImageJ. 2015. Imagine Processing and Analysis in Java. <https://imagej.nih.gov/ij/>. 01
Jul. 2015.

46
IUCN. 2015. The IUCN red list of threatened species. <http://www.iucnredlist.org/>. 01
Oct. 2015.
Jara-Guerrero A, Cruz M, Méndez M. 2011. Seed dispersal spectrum of woody species in
South Ecuadorian Dry Forests: Environmental correlates and the effect of considering
species abundance. Biotropica 43: 722-730.
Kraft JB, Ackerly DD. 2010. Functional trait and phylogenetic tests of community
assembly across spatial scales in an Amazonian forest. Ecological Monographs 80: 401-
422.
Kronka FJN, Nalon MA, Matsukuma CK, et al. 2005. Inventário florestal da vegetação
natural do Estado de São Paulo. São Paulo, Secretaria do Meio Ambiente/Instituto
Florestal.
Laurance WF, Albernaz AKM, Costa C. 2001. Is deforestation accelerating in the Brazilian
Amazon? Environmental Conservation 28: 305-311.
Laurance WF, Goosem M, Laurance SGW. 2009. Impacts of roads and linear clearings on
tropical forests. Trends in Ecology & Evolution 24: 659-669.
Lenza E, Pinto JRR, Pinto AS, Maracahipes L, Bruziguessi ER. 2011. Comparacao da
vegetacao arbustivo-arborea de uma area de cerrado rupestre na Chapada dos Veadeiros,
Goias, e areas de cerrado sentido restrito do Bioma Cerrado. Revista Brasileira de
Botânica 34: 247-259.
Li Y, Yu J, Ning K, Du S, Han G, Qu F. 2014. Ecological effects of roads on the plant
diversity of coastal wetland in the Yellow River Delta. Science World Journal 2014: 1-
8.
Liebsch D, Marques MCM, Goldenberg R. 2008. How long does the Atlantic Rain Forest
take to recover after a disturbance? Changes in species composition and ecological
features during secondary succession. Biological Conservation 141: 1717-1725.
Lingner DV, Schorn LA, Vibrans AC, et al. 2013. Fitossociologia do componente
arbóreo/arbustivo da Floresta Ombrófila Densa no estado de Santa Catarina. In: Vibrans

47
AC, Sevegnari L, Gasper AL, Ligner DV. (eds.) Inventário Florístico Florestal de Santa
Catarina. Blumenau, Editora da FURB. p. 159-200.
List of Species of the Brazilian Flora .2015. List of Species of the Brazilian Flora.
<http://floradobrasil.jbrj.gov.br/>. 01 Oct. 2015.
Mantovani W. 2001. A paisagem dinâmica. In: Leonel C. (org.) Intervales. São Paulo,
Secretaria do Meio Ambiente. p. 81-91.
Martinelli G, Moraes M. 2013. Livro vermelho da flora do Brasil. Rio de Janeiro, Andrea
Jakobsson/Instituto de Pesquisas Jardim Botânico do Rio de Janeiro.
Minchin PR. 1987. An evaluation of the relative robustness of techniques for ecological
ordination. Vegetatio 69: 89-107.
Molino JF, Sabatier D. 2001. Tree diversity in Tropical Rain Forests: A Validation of the
Intermediate Disturbance Hypothesis. Science 294: 1702-1704.
Müllerová J, Vítková M, Vítek O. 2011. The impacts of road and walking trails upon
adjacent vegetation: Effects of road building materials on species composition in a
nutrient poor environment. Science of the Total Environment 409: 3839-3849.
Murcia C. 1995. Edge effects in fragmented forests: implications for conservation. Tree 10:
58-62.
Myers N, Mittermeier RA, Mittermeier CG, Fonseca, GA, Kent J. 2000. Biodiversity
hotspots for conservation priorities. Nature 403: 853-8.
Nakazono EM, Costa MC, Futatsugi K, Paulilo MTS. 2001. Crescimento inicial de Euterpe
edulis Mart. em diferentes regimes de luz. Revista Brasileira de Botânica 24: 173-179.
Otto R, Arteaga MA, Delgado JD, Arévalo JR, Blandino C, Fernández-Palacios JM. 2013.
Road edge effect and elevation patterns of native and alien plants on an oceanic island
Tenerife, Canary Islands. Folia Geobotanica 49: 1-18.

48
Pickering CM, Hill W, Newsome D, Leung YF. 2010. Comparing hiking, mountain biking
and horse riding impacts on vegetation and soils in Australia and the United States of
America. Journal of Environmental Management 91: 551-562.
Pijl L. 1970. Principles of dispersal in higher plants. Verlag Berlin Heidelberg, Springer.
Pohlman CL, Turton SM, Goosem M. 2007. Edge effects of linear canopy openings on
Tropical Rain Forest understory microclimate. Biotropica 39: 62-71.
Prieto PV, Sansevero JBB, Garbin ML, Braga JMA, Rodrigues PJFP. 2014. Edge effects
of linear canopy openings on understory communities in a lowland Atlantic tropical
forest. Applied Vegetation Science 17: 121-128.
Putz FE. 1984. The Natural History of Lianas on Barro Colorado Island. Ecology 65: 1713-
1724.
R Core Team. 2015. R: A Language and Environmental for Statistical Computing.
<https://www.r-project.org/>. 01 Oct. 2015.
Reid LM, Dunne T. 1984. Sediment production from forest road surfaces. Water Resources
Research 20: 1753-176.
Restrepo C, Gomez N, Heredia S. 1999. Anthropogenic edges, treefall gaps, and fruit-
frugivore interactions in a Neotropical Montane Forest. Ecology 80: 668-685.
Reznik G, Pires JPDA, Freitas L. 2012. Efeito de bordas lineares na fenologia de espécies
arbóreas zoocóricas em um remanescente de Mata Atlântica. Acta Botanica Brasilica 26:
65-73.
Ribeiro MC, Martensen AC, Metzger JP, Tabarelli M, Scarano F, Fortin MJ. 2011a. The
Brazilian Atlantic Forest: a shrinking biodiversity hotspot. In: Zachos FE, Habel JC.
(eds.) Biodiversity Hotspots: Distribution and Protection of Conservation Priority Areas.
Verlag Berlin Heidelberg, Springer. p. 405-434.
Ribeiro MC, Metzger JP, Martensen AC, Ponzoni FJ, Hirota, MM. 2009b. The Brazilian
Atlantic Forest: How much is left and how is the remaining forest distributed?
Implications for conservation. Biological Conservation 142: 1141-1153.

49
Ribeiro MT, Nunes F, Santos FAM. 2009a. Tree structure and richness in an Atlantic forest
fragment: distance from anthropogenic and natural edges. Revista Árvore 33: 1123-1132.
Ribeiro TM, Martins S, Lana VM, Silva K. 2011b. Sobrevivência e crescimento inicial de
plântulas de Euterpe edulis Mart. transplantadas para clareiras e sub-bosque em uma
Floresta Estacional Semidecidual, em Viçosa, MG. Revista Árvore 35: 1219-1226.
Rodrigues E. 1998. Edge effects on the regeneration of forest fragments in North Paraná.
PhD Thesis, Harvard University, Cambridge, MA.
Ronquim CC, Torresan FE. 2011. Avaliação da sustentabilidade e planejamento ambiental
em propriedade do setor silvicultural.
<http://ainfo.cnptia.embrapa.br/digital/bitstream/item/122959/1/4451.pdf>. 01 Oct.
2015.
São Paulo E. 2008. Resolução SMA - 8, de 8.03.2007. Listagem das espécies arbóreas e
indicação de sua ocorrência natural nos biomas/ecossistemas e regiões ecológicas do
Estado de São Paulo, com a classificação sucessional e a categoria de ameaça de extinção.
São Paulo, SMA.
SMA – Secretaria do Meio Ambiente do Estado de São Paulo. 2008. Plano de manejo do
Parque Estadual Carlos Botelho. <http://fflorestal.sp.gov.br/planos-de-manejo/planos-
de-manejo-planos-concluidos/>. 01 Oct. 2015.
Sterck FJ, Poorter L, Schieving F. 2006. Leaf traits determine the growth-survival trade-off
across Rain Forest tree species. The American Naturalist 167: 758-765.
Sterck F, Markesteijn L, Toledo M, Schieving F, Poorter L. 2014. Sapling performance
along resource gradients drives tree species distributions within and across tropical
forests. Ecology 95: 2514-2525.
Tabarelli M, Peres CA. 2002. Abiotic and vertebrate seed dispersal in the Brazilian Atlantic
forest: Implications for forest regeneration. Biological Conservation 106: 165-176.

50
Tabarelli M, Mantovani W, Peres CA. 1999. Effects of habitat fragmentation on plant guild
structure in the montane Atlantic forest of southeastern Brazil. Biological Conservation
9: 119-127.
Terborgh J, Schaik C. 2002. Por que o mundo necessita de parques. In: Terborgh J, Schaik
C, Davenport L, Rao M. (orgs.) Tornando os parques eficientes: estratégias para a
conservação da natureza nos trópicos. Curitiba, Editora da UFPR e Fundação O
Boticário. p. 25-36.
Watson JEM, Whittaker RJ, Dawson TP. 2004. Habitat structure and proximity to forest
edge affect the abundance and distribution of forest-dependent birds in tropical coastal
forests of southeastern Madagascar. Biological Conservation 120: 315-331.
Webb EL, Stanfield BJ, Jensen ML. 1999. Effects of topography on rainforest tree
community structure and diversity in American Samoa, and implications for frugivore
and nectarivore populations. Journal of Biogeography 26: 887-897.
Wolf JHD. 2005. The response of epiphytes to anthropogenic disturbance of pine-oak
forests in the highlands of Chiapas, Mexico. Forest Ecology and Management 212: 376-
39.
Zhu J, Lu D, Zhang W. 2014. Effects of gaps on regeneration of woody plants: a meta-
analysis. Journal of Forest Research 25: 501-510.

51
Supplementary data
Pathways affect vegetation structure and composition in an Atlantic Rainforest in Southeastern Brazil
Acta Botanica Brasilica
Bruna Gonçalves da Silva1, Ana Carolina Devides Castello2, Ingrid Koch3 & Wesley Rodrigues Silva4
1 Universidade Estadual de Campinas – UNICAMP, Departamento de Biologia Animal, Programa de Pós-Graduação em Ecologia, Rua Monteiro
Lobato, 255, ZIP Code: 13083-862 – Campinas – SP, Brazil.
2 Universidade Estadual Paulista “Júlio de Mesquita Filho” – campus Botucatu, Departamento de Botânica, Programa de Pós-Graduação em
Ciências Biológicas (Botânica), Distrito de Rubião Júnior, s/n, ZIP Code: 18.618-970 – Botucatu – SP, Brazil.
3 Universidade Estadual de Campinas – UNICAMP, Departamento de Biologia Vegetal, Instituto de Biologia, Rua Monteiro Lobato, 255, ZIP
Code: 13083-862 – Campinas – SP, Brazil.
4Universidade Estadual de Campinas – UNICAMP, Departamento de Biologia Animal, Rua Monteiro Lobato, 255, ZIP Code: 13083-862 –
Campinas – SP, Brazil.

52
Table S1 – Plant species surveyed of different types of pathway and distance to edge (E: edge, N: neighborhood) in Carlos Botelho State Park, SP,
Brazil. The values are numbers of individuals with diameter at breast height ≥ 3.18 cm. SG: successional groups (P: pioneer, NP: non-pioneer,
UN: undetermined), DS: dispersal syndromes (ZOO: zoochorous, ANE: anemochorous, AUT: autochorous, UN: undetermined), LT: level of threat
(VU: vulnerable, EN: endangered), SP: list of threatened flora of São Paulo state, BR: red book of Brazilian flora, IUCN: IUCN’s list of threatened
flora.
Species Vernacular
name Control area
Main road Secondary road Trail SG DS LT
E N E N E N
Ferns
Cyatheaceae
Alsophila setosa
Kaulf. Samambaiaçu 3 26 25 9 1 15 7 UN UN
Cyathea delgadii
Sternb.
Xaxim-
espinhento 9 3 3 0 4 7 5 UN UN
Angiosperms
Anacardiaceae Tapirira
guianensis Aubl. Peito-de-pombo 0 0 0 1 0 0 0 P ZOO
Annonaceae
Guatteria
australis A.St.-
Hil.
Pindaúva-preta 3 2 6 2 5 0 3 NP ZOO
Apocynaceae
Aspidosperma
olivaceum
Müll.Arg.
Guatambu 0 0 1 0 0 0 1 NP ANE
Aquifoliaceae Ilex dumosa
Reissek Caúna 0 2 4 1 2 0 0 NP ZOO

53
Species Vernacular
name Control area
Main road Secondary road Trail SG DS LT
E N E N E N
Ilex sp. 0 1 0 0 0 0 0 UN UN
Araliaceae
Dendropanax
australis Fiaschi
& Jung-Mend.
Pau-toa 1 0 0 0 0 0 0 UN UN
Schefflera calva
(Cham.) Frodin
& Fiaschi
Embirutó 0 0 0 0 0 1 0 NP ZOO
Arecaceae
Euterpe edulis
Mart. Palmito-jussara 31 8 20 9 13 27 18 NP ZOO
VU
(SP,
BR)
Geonoma
gamiova
Barb.Rodr.
Guaricanga-de-
folha-larga 2 0 0 0 0 0 0 NP ZOO
Geonoma
schottiana Mart. Guaricanga 2 0 0 0 1 0 1 NP ZOO
Asteraceae
Baccharis
montana DC. Vassoura 0 1 0 0 0 0 0 UN UN
Piptocarpha
organensis
Cabrera
Vassourãozinho 0 2 0 0 0 0 0 P ANE
Piptocarpha
oblonga
(Gardner) Baker
Braço-do-rei 0 1 0 0 0 0 1 NP ANE

54
Species Vernacular
name Control area
Main road Secondary road Trail SG DS LT
E N E N E N
Verbesina
glabrata Hook.
&Arn.
0 0 1 0 0 0 0 P ANE
Bignoniaceae
Jacaranda
montana
Morawetz
Caroba 0 0 0 1 0 0 0 UN UN
Jacaranda
puberula Cham. Caroba 0 0 0 3 6 1 1 NP ANE
Burseraceae Protium
widgrenii Engl. Breu 1 0 1 0 0 0 0 NP ZOO
Celastraceae Maytenus
robusta Reissek
Coração-de-
bugre 1 0 0 0 1 0 0 NP ZOO
Chrysobalanaceae
Hirtella
hebeclada
Moric. ex DC.
Uva-de-facho 1 0 0 0 0 0 1 NP ZOO
Parinari
brasiliensis
(Schott) Hook.f.
Gonçalo-alves 1 0 0 0 1 0 0 NP ZOO EN
(BR)
Clethraceae Clethra scabra
Pers. Carne-de-vaca 0 13 6 1 0 0 0 P ANE
Clusiaceae Clusia criuva
Cambess.
Mangue-do-
mato 0 2 2 0 0 0 0 P ZOO

55
Species Vernacular
name Control area
Main road Secondary road Trail SG DS LT
E N E N E N
Combretaceae
Buchenavia
hoehneana
N.F.Mattos
Piuna 0 0 0 0 0 1 0 UN UN VU
(IUCN)
Cunoniaceae
Lamanonia
ternata Vell. Guaraperê 0 0 0 0 0 1 0 NP ANE
Weinmannia
paulliniifolia
Pohlex Ser.
Gramimunha 1 0 0 0 0 0 0 P ANE
Elaeocarpaceae
Sloanea hirsuta
(Schott) Planch.
exBenth.
Sapopema 0 0 0 0 1 2 0 NP ZOO
Euphorbiaceae
Alchornea
glandulosa
Poepp. &Endl.
Tapiá 7 4 0 2 0 2 1 P ZOO
Sapium
glandulosum
(L.) Morong
Pau-de-leite 0 0 0 0 1 0 0 P ZOO
Sebastiania
brasiliensis
Spreng.
Branquilho 0 0 0 0 0 1 0 NP AUT
Fabaceae
Abarema
langsdorffii
(Benth.)
Barneby &
J.W.Grimes
Raposeira-
branca 1 1 0 0 0 0 0 NP AUT/ZOO

56
Species Vernacular
name Control area
Main road Secondary road Trail SG DS LT
E N E N E N
Andira
anthelmia (Vell.)
Benth.
Angelim-
amargoso 0 1 2 0 0 1 0 NP ZOO
Andira
fraxinifolia
Benth.
Pau-angelim 0 1 1 1 0 0 1 NP ZOO
Copaifera
trapezifolia
Hayne
Copaiba 0 0 0 0 0 0 1 NP ZOO
Dahlstedtia
pinnata (Benth.)
Malme
Timbó 1 0 1 0 0 0 1 NP AUT
Inga laurina
(Sw.) Willd. Ingá-feijão 0 0 0 1 0 0 3 NP ZOO
Lonchocarpus
nitidus (Vogel)
Benth.
Rabo-de-bugio 0 0 0 0 0 0 1 UN UN
Machaerium
nyctitans (Vell.)
Benth.
Bico-de-pato 0 1 0 0 0 0 0 NP ANE
Myrocarpus
frondosus
Allemão
Cabreúva 1 0 0 1 0 1 0 NP ANE
Ormosia minor
Vogel Olho-de-cabra 0 0 1 0 0 0 0 NP ZOO

57
Species Vernacular
name Control area
Main road Secondary road Trail SG DS LT
E N E N E N
Pterocarpus
rohrii Vahl Aldrago 4 0 0 0 3 0 1 NP ZOO
Senna multijuga
(Rich.)
H.S.Irwin &
Barneby
Pau-cigarra 0 5 1 0 0 0 0 P ANE
Tachigali
denudata
(Vogel)
Oliveira-Filho
Passariúva 1 0 0 0 1 0 0 P ANE
Centrolobium
robustum (Vell.)
Mart. exBenth.
Araribá 0 0 1 0 0 0 0 NP ANE
Humiriaceae
Vantanea
compacta
(Schnizl.)
Cuatrec.
Guaraparim 1 0 0 0 0 0 0 NP ZOO
Indeterminate Indet. 1 0 0 0 0 1 0 0 UN UN
Indet. 2 0 0 0 0 0 0 1 UN UN
Lamiaceae Vitex polygama
Cham. Tarumã 1 0 0 0 0 0 0 NP ZOO
Lauraceae
Aiouea
acarodomatifera
Kosterm.
Canela 1 0 0 1 0 0 0 NP ZOO VU
(SP)

58
Species Vernacular
name Control area
Main road Secondary road Trail SG DS LT
E N E N E N
Aniba firmula
(Nees& Mart.)
Mez
Pau-rosa 2 0 0 1 0 2 1 NP ZOO
Aniba viridis
Mez
Canela-de-
mono 2 0 1 2 0 0 1 NP ZOO
Cinnamomum
hirsutum Lorea-
Hern.
Garuva-da-
serra 0 0 1 0 0 0 0 UN UN
Cryptocarya
mandioccana
Meisn.
Cajati 0 0 0 0 1 0 0 NP ZOO
Endlicheria
paniculata
(Spreng.)
J.F.Macbr.
Canela-frade 0 0 0 2 1 1 0 NP ZOO
Lauraceae sp1 1 1 0 0 0 0 0 UN UN
Lauraceae sp2 0 0 0 0 1 0 0 UN UN
Lauraceae sp3 0 0 0 1 0 0 0 UN UN
Lauraceae sp4 0 0 0 0 0 5 0 UN UN
Lauraceae sp5 0 2 0 0 0 0 0 UN UN
Licaria
armeniaca
(Nees) Kosterm.
Canela 0 0 1 0 0 0 0 NP ZOO
Nectandra
debilis Mez Canela-fogo 2 0 0 1 0 0 1 NP ZOO
EN
(SP)

59
Species Vernacular
name Control area
Main road Secondary road Trail SG DS LT
E N E N E N
CR
(IUCN)
Nectandra
leucantha Nees Canela-amarela 2 0 1 1 1 1 0 NP ZOO
Nectandra
oppositifolia
Nees
Canela-amarela 0 2 1 5 1 1 0 P ZOO
Ocotea aciphylla
(Nees & Mart.)
Mez
Canela-
amarela-de-
cheiro
1 0 0 0 0 0 0 NP ZOO
Ocotea
catharinensis
Mez
Canela-
coqueiro 1 0 0 1 0 1 4 NP ZOO
VU
(BR,
IUCN)
Ocotea dispersa
(Nees & Mart.)
Mez
Canela-sabão 1 2 4 0 1 1 2 P ZOO
Ocotea elegans
Mez
Canela-
sassafrás-do-
campo
5 0 1 2 0 1 4 NP ZOO
Ocotea
odorifera (Vell.)
Rohwer
Canela-
sassafrás 1 0 0 1 2 0 2 NP ZOO
EN
(BR)
Ocotea puberula
(Rich.) Nees Canela-guaicá 0 0 0 0 0 1 0 NP ZOO

60
Species Vernacular
name Control area
Main road Secondary road Trail SG DS LT
E N E N E N
Ocotea
tabacifolia
(Meisn.) Rohwer
0 0 0 1 1 0 0 NP ZOO
VU
(SP)
EN
(BR)
Ocotea
teleiandra
(Meisn.) Mez
Canela-fogo 0 0 0 0 1 0 1 NP ZOO
Ocotea venulosa
(Nees) Baitello
Canelão-
amarelo 0 0 0 2 0 0 0 NP ZOO
Persea venosa
Nees & Mart. Pau-andrade 1 0 0 0 0 0 0 NP ZOO
Magnoliaceae
Magnolia ovata
(A.St.-Hil.)
Spreng.
Pinha-do-brejo 0 0 1 0 0 0 0 NP ZOO
Melastomataceae
Leandra
variabilis Raddi 0 0 0 1 3 0 1 UN ZOO
Miconia cabucu
Hoehne Pixiricão 0 0 10 13 5 1 2 NP ZOO
Miconia
cinnamomifolia
(DC.) Naudin
Jacatirão 0 0 0 1 0 0 0 P ZOO

61
Species Vernacular
name Control area
Main road Secondary road Trail SG DS LT
E N E N E N
Miconia
cubatanensis
Hoehne
Pixirica 0 0 0 0 2 0 0 P ZOO
Miconia
paniculata (DC.)
Naudin
0 2 1 4 4 0 2 UN UN
Miconia
petropolitana
Cogn
Pixirica 1 0 0 0 0 0 1 NP ZOO
Miconia
racemifera
(DC.) Triana
Pixirica 0 0 3 0 0 0 0 NP ZOO
Miconia
sellowiana
Naudin
Pixirica 0 0 1 0 0 0 0 P ZOO
Miconia valtheri
Naudin 0 0 0 6 0 0 0 P ZOO
Tibouchina
fothergillae
(Schrank &
Mart. ex DC.)
Cogn.
Quaresmeira 0 1 0 0 0 0 0 UN ANE
Tibouchina
pulchra Cogn.
Manacá-da-
serra 0 21 6 2 1 1 1 P ANE
Meliaceae
Cabralea
canjerana
(Vell.) Mart.
Canjerana 4 3 4 0 2 5 5 NP ZOO

62
Species Vernacular
name Control area
Main road Secondary road Trail SG DS LT
E N E N E N
Guarea
macrophylla
Vahl
Café-bravo 1 0 0 0 0 0 0 NP ZOO
Cedrela fissilis
Vell. Cedro 0 0 0 0 1 0 0 NP ANE
VU
(BR),
EN
(IUCN)
Monimiaceae
Mollinedia
boracensis
Peixoto
2 0 0 0 0 0 1 UN UN
Mollinedia
gilgiana Perkins 1 0 0 0 0 0 0 NP ZOO
VU
(SP),
CR
(IUCN)
Mollinedia
luizae Peixoto 1 0 0 0 0 1 0 NP ZOO
VU
(SP,
BR)
Mollinedia
oligantha
Perkins
Capixim 0 0 0 1 0 0 0 NP ZOO
Mollinedia sp. 0 0 0 0 0 1 0 NP ZOO
Mollinedia
schottiana
(Spreng.)
Perkins
Pimenteira 7 0 2 0 1 4 6 NP ZOO
Mollinedia
widgrenii A.DC. Capixim 0 0 0 2 0 0 0 NP ZOO

63
Species Vernacular
name Control area
Main road Secondary road Trail SG DS LT
E N E N E N
Moraceae
Brosimum
glaziovii Taub.
Maminha-
cadela 0 2 0 0 0 0 0 NP ZOO
EN
(IUCN)
Ficus insipida
Willdenow 0 0 0 1 0 0 0 P ZOO
Ficus
luschnathiana
(Miq.) Miq.
Figueira-do-
brejo 0 1 0 0 0 0 0 NP ZOO
Sorocea
bonplandii
(Baill.)
W.C.Burger et
al.
Cincho 2 1 0 0 0 2 3 NP ZOO
Myrtaceae
Calyptranthes
lanceolata
O.Berg
Guamirim 2 0 0 1 0 0 0 NP ZOO
Calyptranthes
obovata Kiaersk. Guamirim 2 0 0 0 0 0 0 NP ZOO
Campomanesia
guaviroba (DC.)
Kiaersk.
Guabiroba 0 1 0 1 1 1 2 NP ZOO
Eugenia
brevistyla
D.Legrand
Guamirim 1 0 0 0 0 0 0 NP UN

64
Species Vernacular
name Control area
Main road Secondary road Trail SG DS LT
E N E N E N
Eugenia
capitulifera
O.Berg
Mamoneira 1 0 0 0 0 0 0 NP ZOO
Eugenia cf.
involucrata DC.
Cereja-do-rio-
grande 4 0 1 0 0 0 0 NP ZOO
Eugenia
copacabanensis
Kiaersk.
Bapuana 1 0 0 0 0 0 0 NP ZOO
Eugenia florida
DC. Pitanga-preta 3 0 0 0 0 0 0 NP ZOO
Eugenia mosenii
(Kausel) Sobral Cuxita 6 0 0 0 0 0 0 NP ZOO
Eugenia prasina
O.Berg Araçarana 0 0 0 3 1 0 1 NP ZOO
VU
(IUCN)
Eugenia
pruinosa
D.Legrand
0 0 0 0 0 0 1 NP ZOO EN
(BR)
Eugenia sp1 0 0 1 0 0 0 1 UN UN
Eugenia sp2 3 0 0 2 0 1 0 UN UN
Eugenia sp3 1 0 0 1 0 0 0 UN UN
Eugenia sp4 0 0 0 0 0 1 0 UN UN
Eugenia
subavenia
O.Berg
Guamirim 2 0 0 0 0 1 1 NP ZOO

65
Species Vernacular
name Control area
Main road Secondary road Trail SG DS LT
E N E N E N
Eugenia
supraaxillaris
Spring
Fruta-de-tatu 0 0 0 0 0 0 2 NP ZOO
Marlierea
eugeniopsoides
(D.Legrand &
Kausel)
D.Legrand
Cambucá 2 0 0 0 0 0 0 NP ZOO
Myrceugenia
myrcioides
(Cambess.)
O.Berg
Araçarana 4 0 0 0 0 0 0 NP ZOO
Myrceugenia
seriatoramosa
(Kiaersk.)
D.Legrand &
Kausel
Guamirim 1 0 0 0 0 0 0 NP ZOO
Myrcia
anacardiifolia
Gardner
Guamirim 1 0 0 0 0 0 0 NP ZOO
Myrcia
brasiliensis
Kiaersk.
0 0 1 0 1 0 1 NP ZOO
Myrcia
eugeniopsoides
(D.Legrand &
Kausel) Mazine
1 0 0 0 1 0 2 NP ZOO

66
Species Vernacular
name Control area
Main road Secondary road Trail SG DS LT
E N E N E N
Myrcia
pubipetala Miq.
Guamirim-
chorão 2 0 0 1 1 0 0 NP ZOO
Myrcia sp1 0 0 0 0 1 0 0 UN UN
Myrcia
splendens (Sw.)
DC.
Guamirim-
miúdo 6 5 2 7 3 2 1 NP ZOO
Myrciaria
floribunda
(H.West ex
Willd.) O.Berg
Camboinzinho 1 0 0 0 0 0 0 NP ZOO
Myrtaceae sp1 0 0 0 0 0 1 0 UN UN
Myrtaceae sp2 0 1 0 0 0 0 0 UN UN
Myrtaceae sp3 4 0 1 0 1 1 0 UN UN
Myrtaceae sp4 2 0 0 0 0 1 1 UN UN
Plinia
complanata
M.L.Kawas. &
B.Holst
0 0 0 0 0 1 0 UN UN EN
(BR)
Psidium
cattleianum
Sabine
Araçá-rosa 0 3 0 2 0 0 0 NP ZOO
Nyctaginaceae
Guapira
opposita (Vell.)
Reitz
Moço-mole 6 0 2 0 3 0 3 NP ZOO

67
Species Vernacular
name Control area
Main road Secondary road Trail SG DS LT
E N E N E N
Oleaceae
Chionanthus
filiformis (Vell.)
P.S.Green
Azeitona-
silvestre 0 0 0 0 2 0 0 UN UN
Phyllanthaceae
Hyeronima
alchorneoides
Allemão
Aracurana-da-
serra 0 1 2 3 0 1 0 NP ZOO
Polygonaceae Coccoloba
alnifolia Casar. Pau-de-estalo 0 0 0 0 1 0 0 UN UN
Primulaceae
Cybianthus sp. 0 0 0 1 1 0 0 UN UN
Myrsine
coriacea (Sw.)
R.Br. ex Roem.
&Schult.
Capororoca 0 6 2 1 0 0 0 P ZOO
Myrsine
umbellata Mart. Capororocão 1 4 4 5 3 1 0 NP ZOO
Stylogyne
depauperata
Mez
3 0 2 0 0 0 0 NP ZOO
Stylogyne
lhotzkyana
(A.DC.) Mez
3 0 0 0 0 0 0 NP ZOO
Stylogyne
pauciflora Mez Pau-de-charco 1 1 0 0 1 0 0 NP ZOO

68
Species Vernacular
name Control area
Main road Secondary road Trail SG DS LT
E N E N E N
Rosaceae
Prunus
myrtifolia (L.)
Urb.
Pessegueiro-
bravo 0 1 1 0 0 0 0 NP ZOO
Rubiaceae
Alseis floribunda
Schott
Quina-de-são-
paulo 1 0 0 0 0 0 0 NP AUT
Amaioua
intermedia Mart.
ex Schult.
&Schult.f.
Marmelada 2 0 0 0 0 0 1 NP ZOO
Bathysa
australis (A.St.-
Hil.) K.Schum.
Fumão 1 2 2 0 0 10 7 NP AUT
Chomelia
brasiliana
A.Rich.
1 0 0 0 0 1 0 NP ZOO
Cordiera
concolor
(Cham.) Kuntze
0 0 0 1 0 0 0 NP ZOO
Faramea
montevidensis
(Cham.
&Schltdl.) DC.
Café-do-mato 0 0 0 1 0 2 0 NP ZOO

69
Species Vernacular
name Control area
Main road Secondary road Trail SG DS LT
E N E N E N
Ixora
gardneriana
Benth.
Ixóra-arbórea 6 0 0 0 0 0 2 NP ZOO
Psychotria
gracilenta
Müll.Arg.
0 0 0 0 0 0 0 P ZOO
Psychotria
leiocarpa Cham.
& Schltdl.
Cafeeiro-do-
mato 0 3 2 1 0 0 0 NP ZOO
Psychotria
mapourioides
DC.
Café-do-mato 0 0 1 0 0 0 0 NP ZOO
Psychotria nuda
(Cham. &
Schltdl.) Wawra
Grandiúva-
d'anta 0 1 1 0 0 2 0 NP ZOO
Psychotria
vellosiana
Benth.
Quina-mole 0 3 1 0 0 0 0 NP ZOO
Rudgea
jasminoides
(Cham.)
Müll.Arg.
Buquê-de-noiva 1 0 0 0 0 0 0 NP ZOO
Rutaceae
Esenbeckia
grandiflora
Mart.
Guaxupita 2 0 1 1 1 2 0 NP AUT

70
Species Vernacular
name Control area
Main road Secondary road Trail SG DS LT
E N E N E N
Zanthoxylum
rhoifolium Lam.
Mamica-de-
cadela 1 0 0 2 1 0 0 NP ZOO
Salicaceae
Casearia
decandra Jacq. Guaçatonga 1 1 1 2 1 0 0 NP ZOO
Casearia
obliqua Spreng. Cambroé 1 1 1 0 0 11 1 P ZOO
Casearia
sylvestris Sw. Guaçatonga 0 2 1 3 0 0 0 NP ZOO
Xylosma
glaberrima
Sleumer
Açucará-manso 0 1 1 0 0 0 0 P ZOO
Sapindaceae
Allophylus
edulis (A.St.-Hil.
et al.) Hieron. ex
Niederl.
Chal-chal 0 0 0 1 0 0 0 P ZOO
Cupania
oblongifolia
Mart.
Pau-magro 6 0 3 1 7 5 2 NP ZOO
Cupania
vernalis
Cambess.
Arco-de-
peneira 3 0 1 0 3 0 0 NP ZOO
Cupania
zanthoxyloides
Radlk.
Cupânia-veludo 0 0 0 0 0 0 2 P ZOO

71
Species Vernacular
name Control area
Main road Secondary road Trail SG DS LT
E N E N E N
Diatenopteryx
sorbifolia Radlk. Correeiro 1 0 0 0 0 0 0 P ANE
Matayba
elaeagnoides
Radlk.
Camboatá-
branco 1 0 0 0 0 0 0 NP ZOO
Matayba
guianensis Aubl. Camboatá 0 2 3 0 0 0 0 P ZOO
Matayba
intermedia
Radlk.
Camboatá-
branco 0 1 2 0 0 0 0 NP ZOO
Matayba
juglandifolia
(Cambess.)
Radlk.
Camboatá-
branco 3 0 0 0 0 0 1 NP ZOO
Sapotaceae
Micropholis
crassipedicellata
(Mart. &
Eichler) Pierre
Bacubixá 2 0 0 1 2 1 1 NP ZOO
Pouteria caimito
(Ruiz &Pav.)
Radlk.
Abiu 1 0 0 0 0 0 0 NP ZOO
Pouteria torta
(Mart.) Radlk. Abiu-piloso 3 0 0 0 1 1 4 NP ZOO
Solanaceae
Cestrum cf.
schlechtendalii
G.Don
Berinjelinha-
da-mata 0 0 0 1 0 0 0 NP ZOO
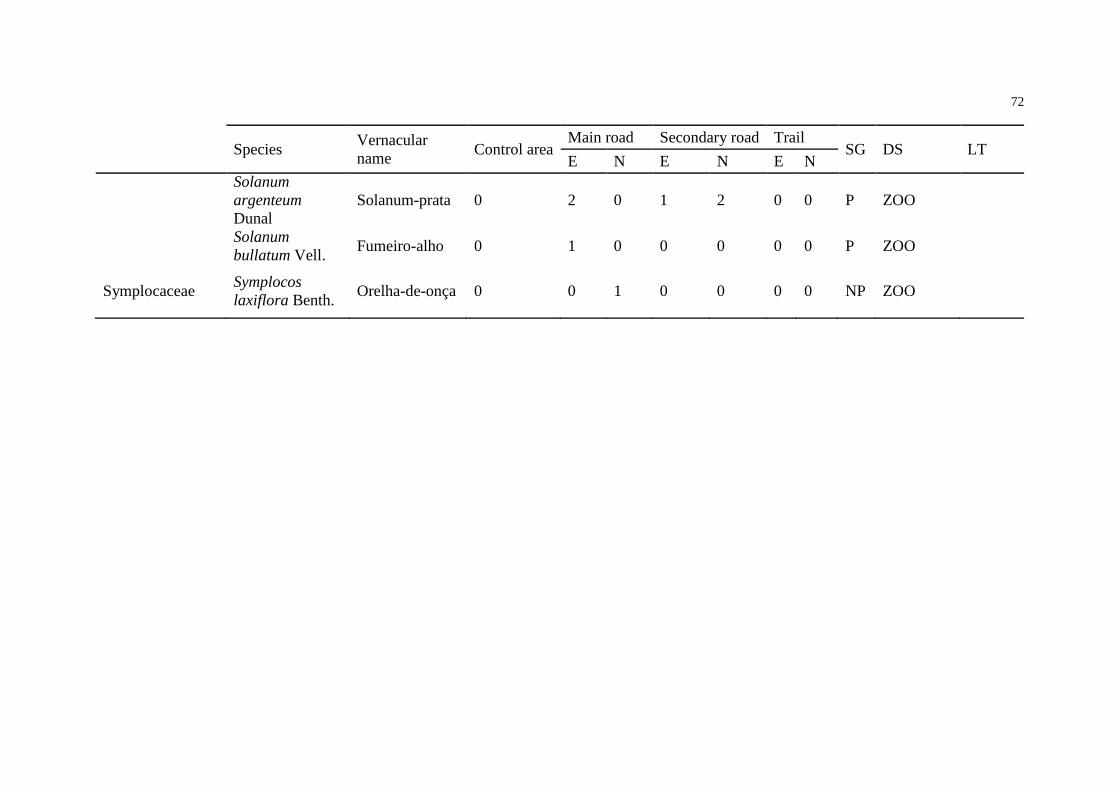
72
Species Vernacular
name Control area
Main road Secondary road Trail SG DS LT
E N E N E N
Solanum
argenteum
Dunal
Solanum-prata 0 2 0 1 2 0 0 P ZOO
Solanum
bullatum Vell. Fumeiro-alho 0 1 0 0 0 0 0 P ZOO
Symplocaceae Symplocos
laxiflora Benth. Orelha-de-onça 0 0 1 0 0 0 0 NP ZOO

73
CAPÍTULO II –Fruit availability along roads and footpaths in an Atlantic rain
forest area
Artigo nas normas da revista Plant Ecology & Diversity
Bruna Gonçalves da Silva1*, Ingrid Koch2, Wesley Rodrigues Silva3
1 Universidade Estadual de Campinas – UNICAMP, Departamento de Biologia Animal,
Programa de Pós-Graduação em Ecologia, Rua Monteiro Lobato, 255, ZIP Code: 13083-
862 – Campinas – SP, Brazil. E-mail: [email protected]
2 Universidade Estadual de Campinas – UNICAMP, Departamento de Biologia Vegetal,
Instituto de Biologia, Rua Monteiro Lobato, 255, ZIP Code: 13083-862 – Campinas – SP,
Brazil. E-mail: [email protected]
3 Universidade Estadual de Campinas – UNICAMP, Departamento de Biologia Animal,
Rua Monteiro Lobato, 255, ZIP Code: 13083-862 – Campinas – SP, Brazil. E-mail:
*Silva, B.G. (corresponding author, [email protected]) Phone: +55 19 3521-6325
Acknowledgements
We thank Fundação de Amparo à Pesquisa do Estado de São Paulo – FAPESP,
for the doctoral scholarship to BGS; Instituto Florestal do Estado de São Paulo for
permission to work at Carlos Botelho State Park; Ana Carolina Devides Castello, Fiorella
Fernanda Mazine Capelo (Myrtaceae) and Marcelo Monge (Asteraceae) for plant
identifications; Leonardo Ré Jorge for statistical assistance, comments and suggestions;
Alexander Vicente Christianini for comments and suggestions; Cristiane Patrícia
Zaniratto, Eric Yasuo Kataoka, João de Deus Vidal, Ana Carolina Devides Castello and
Mario Alejandro Marin Uribe for field work assistance. This work was supported by the
Fundação de Amparo à Pesquisa do Estado de São Paulo – FAPESP, under Grant
2013/11175-6.

74
Abstract
Background: Linear openings - roads and footpaths - are associated with edge effect.
The magnitude of these effects depends, largely, on the width of the pathways. Thus,
different pathways width result in different effects on forest structure, composition and
function.
Aim: We investigated the effects of pathways of varying widths on the temporal and
spatial fruit production of the forest nearby.
Methods: We studied three paths, 2, 10 and 20m wide, in the Atlantic forest in southeast
Brazil. A total of 3,762 woody individuals (taller than 50 cm) were surveyed and their
fruit production monitored over a 2-year period in eight plots (100 m2 each) per pathway
along edges and neighborhood (35 m toward the forest interior), and in a control area
without paths.
Results: The number of species and individuals bearing fruit was higher in wider
pathways than along footpath and control, and the amount of zoochorous fruits produced
was higher in the control than along all pathways. The widest pathway had the highest
amount of non-zoochorous fruits. Fruiting peaks occurred only in the forest with
pathways, while in the control fruiting was not seasonal.
Conclusions: Pathways affect the amount of fruits produced, dispersal syndromes
predominance and temporal fruit availability. These effects on fruit availability extend
toward the forest interior beyond 35 m in wide pathways. The establishment of permanent
paths can affect food resources for frugivores in space and time.
Key-words – Dispersal syndromes, food resource for frugivores, fruit production, linear
forest gaps, seasonality.
.
75
Introduction
Variations in the fruit available in a habitat may occur, for example, among
patches with different regeneration stages or, temporally, with fluctuations in
phenological fruiting curves that can occur in tropical forests (Longman & Jenik 1987;
Morellato et al. 2000). Although studies reveal a continuous fruit production and a
predominance of trees producing fleshy fruits (zoochory) in Atlantic Forest mature areas
(Morellato et al. 2000; Almeida-neto et al. 2008), variation in the conditions of disturbed
areas with gaps can affect plant phenological processes (Restrepo et al. 1999; Laurance
et al. 2003). Phenological changes, as the occurrence of peaks and depressions in fruit
production, may affect the abundance, species richness and temporal pattern of fruit-
bearing species and fruiting intensity in fragment edges (Restrepo et al. 1999; Laurance
et al. 2003; Cara 2006; Felton et al. 2006), altering the level of fruit availability in a given
habitat (Longman and Jenik 1987).
Along the edges, higher irradiation changes micro-climatic conditions on the
forest floor causing higher temperatures, lower humidity, higher wind speed and air
turbulence, and shifts in soil nutrient availability, resulting in an environment that is
different from that in the closed forest interior (Goosem 1997; Laurance et al. 1998;
Laurance et al. 2016). These changes can cause various degrees of edge effect (Murcia
1995; Laurance et al. 1998; Webb et al. 1999), that can be felt in the forest away from the
edges at greater or lesser intensity, depending on the gap characteristics (Pohlman et al.
2007; Broadbent et al. 2008; Laurance et al. 2009), and can affect plant and animal
communities (Goosem 1997; Laurance et al. 1998). The changes in plant species
composition include increased occurrence of heliophylous pioneer species, which with
time may substitute species adapted to shade (Tabarelli et al. 1999; Tabarelli and Peres
2002). Eventually, the seasonal patterns of reproduction by trees and thus fruit availability
for consumers may change (Denslow 1987; Heideman 1989; DeWalt et al. 2003).
The responses of plants to different gap characteristics are a subject that still
deserves more investigation (Cara 2006; Ramos & Santos 2006). Different patterns can
be found in the literature when compared natural and anthropic gaps, presenting
inconclusive results (Restrepo et al. 1999; Ramos & Santos 2006; Reznik et al. 2012), as
higher fruit production in natural gaps (Restrepo et al. 1999; Ramos & Santos 2006),
contrasting with low fruit and flower production in anthropic ones (Ramos & Santos

76
2006), and changes in the temporal dynamics of fruiting in anthropic linear gaps, but no
effect on the distribution of the dispersal syndromes (Reznik et al. 2012), even though it
is known that there is a predominance of zoochory in advanced stage of regeneration.
Besides that, the gap size is an important variable that can structure the local plant
communities (Denslow 1980; Zhu et al. 2014). For example, size of anthropogenic gaps
is positively related with density of typical plants of secondary stage of regeneration (Zhu
et al. 2014). Thus, the gap size could affect the spatial and temporal reproductive process
in plants. However, there are no studies that investigate and compare these reproductive
processes among anthropogenic gaps with different sizes.
Concerning anthropogenic gaps, several kinds of highways, roads and footpaths
form linear gaps that intersect tropical forests remnants (MMA 2000), potentially
affecting the adjacent plant and animal communities (Goosem 1997; Laurance et al.
2009). Such impacts have been studied in tropical areas and focused mainly on the fauna
(Whitworth et al. 2015), movement of seed dispersers (Laurance et al. 2004) and
composition of seed disperser communities (Ahmed et al. 2014; Astudillo et al. 2014). A
few studies have investigated the impacts of pathways on vegetation (Prieto et al. 2014;
Couto-Santos et al. 2015; Silva et al. 2017), and identified that roads and footpaths of
varying widths within a tropical forest can result in differential effects on its structure and
composition (Silva et al. 2017). However, the extent to which these effects can modify
the plant reproductive phenology and fruit offer (Reznik et al. 2012) has not yet been
investigated. Unlike natural forest gaps, that rapidly close after their formation (Denslow
1987), man-made ‘linear gaps’ are practically immutable in time and space and can affect
fruit offer permanently (Laurance et al. 2009), bringing consequences for the local fauna.
Studies that compare anthropic linear gaps with different widths can help to
understand the impact of kinds of road or footpath in the reproductive processes of plants
in tropical forests. Additionally, addressing the influence of pathways in fruit offer can
provide an important tool for understanding the space-time organization of food
resources. Thus, our objective was to assess the impacts of pathways of varying widths
on temporal and spatial fruit availability in the surrounding tracts in a protected area in
the Atlantic forest. We hypothesize that pathways presence have impacts in fruit offer in
the Atlantic forest, and that the effects will be perceived in (1) the number of species and
fruit-bearing individuals, (2) the temporal fruit offer, (3) the predominance of dispersal
syndromes, and also that (4) the propagation of those impacts toward the forest interior

77
will be dependent upon the pathway width. We predicted that: (1) the number of species
and fruit-bearing individuals will be higher at the forest edges, (2) forest edges will
present well defined peaks in fruit production, (3) forest adjacent to narrow pathways and
areas without pathways will produce more zoochorous fruits than those adjacent to wider
pathways, and (4) the propagation of those impacts toward the forest interior will be more
intense in the wider pathways.
Material and Methods
Study area
We conducted this study in a continuous forest in the southeastern Brazil at the Carlos
Botelho State Park (CBSP), a 37,644.36 ha area, located between 24º 06’ 55” – 24º 14’
41” S and 47º 47’ 18” – 48º 07’ 17” W (Figure 1 a). The climate is tropical, with mean
annual temperature of 18ºC, and annual precipitation from 1500 - 2200 mm (Ferraz and
Varjabedian 1999). The study areas selected for sampling are located at an average
altitude of 800 m, in the Montane Dense Ombrophilous Forest, where we collected data
along some park’s pathways with different widths, named: main road (20m width),
secondary road (10m) and footpath (2m) (Figure 1 b).
As in the Atlantic Forest several ecological aspects of plant communities (e.g. density,
richness, diversity and species composition) are more affected in the first 35 m from forest
edges (Rodrigues 1998) and in order to ensure edge effects, we sampled at the edge and
neighborhood (35 m from the edge toward the forest interior) (Figure 1 c). Considering
that local conditions of climate and domain are determinants to plants responses we used
a single pathway per pathway type, because there are no other pathways with the same
characteristics in the same forest continuum and elevation. In addition, we established a
control area, reputedly close to a reference state of conservation (Figure 1 b). All sampled
plots were distributed within the same forest matrix, climate, altitude, and are spatially
close (distant 200m inside the same pathways and about 600m among pathways). Given
the small spatial scale of the study, it is possible to assume that differences between plots
are more related to direct effects of the pathways instead of purely spatial effects.

78
Figure 1. A. Location of Carlos Botelho State Park, São Paulo state, SE Brazil. B.
Different pathways: 1) main road (20 m wide), 2) footpath (2 m wide), 3) control area, 4)
secondary road (10 m wide). C. Distribution and spacing of plots along the pathway, e:
edge, n: neighborhood. In gray the forest remnants - (Fundação SOS Mata Atlântica and
INPE 2001).
Types of pathway
The pathways studied were implanted before the park creation (between the 40's
and 70's). The main road within the CBSP is mostly 20 m wide, was implanted near the
40’s and intersects a total of 33 km of the state park area, with a completely open canopy
(Figure 2 a). The secondary road, implanted before the 70’s, is approximately 12 km long
and mostly 10 m wide, with canopy cover at some points (Figure 2 b). The footpath,
opened in the 40’s, is approximately 4.5 km long, 2.0 m wide, with canopy cover along
its total extension (Figure 2 c). The control area is representative of the species
composition and structure of the mature forest occurring in most of the park, without
apparent anthropic influence (SMA 2008) (Figure 2 d).

79
Figure 2. Sampled pathways at Carlos Botelho State Park, São Paulo state, SE Brazil,
used as treatments: A: main road (20 m wide), B: secondary road (10 m wide), C: footpath
(2 m wide), D: control area.
Sampling design
In each pathway, we selected a stretch of 1400 m at least 500 m from the forest
edge, in order to minimize natural edge effects. Along that stretch, eight 10 x 10 m
sampling plots were alternately set: four adjacent to the pathway (edge) and four 35 m
toward the forest interior (neighborhood) (Figure 1 c). Plots were placed at intervals of
200 m along the pathwayto secure the independence of sampling units (Lenza et al. 2011)
(Figure 1 c). At the control area we used the same sampling design, except that there was
no pathway.
Data sampling

80
Data collection was carried out during July 2013 to June 2015. We measured fruit
availability considering the following variables: (i) the number of species and fruit-
bearing individuals; (ii) amount of fruits produced; (iii) dispersal syndromes and (iv)
seasonality in fruit production.
We marked and identified each woody individual taller than 50 cm with fruits
inside plots. Fruiting and flowering branches were collected for further identification,
under SISBIO (collection permit #23627-1) and IBAMA (#4968681), based on reference
literature and with the aid of botanical specialists. The vouchers were deposited at the
herbarium of the Universidade Estadual de Campinas (UEC). The species list
(Supplementary Material Table 1) was organized according to the familial classification
of the Angiosperm Phylogeny Group III (APG 2016). Species names were checked on
the species list of Flora of Brazil (2015). Dispersal syndromes for fruiting individuals
were classified according to Van der Pijl (1982) general classification: zoochorous and
non-zoochorous (anemochorous plus autochorous), based on field observations and
information from the literature.
We recorded fruit presence or absence on a monthly basis with the aid of a 10x36
binocular (between July 2013 and June 2015). Fieldwork was conducted preferentially
during the last fortnight of each month, assuring a 30-day interval between each data
collection event to make it possible to sample differences in phenological dynamics. For
fruit quantification we also used the Fournier’s intensity index (FI) (Fournier 1974).
According to the index, each phenophase is classified in a scale from 0 to 4, in which: 0
= absence of resource; 1 = presence of fruit in 1 to 25% of branches; 2 = 26 to 50%; 3 =
51 to 75%; 4 = 76 to 100% of branches. To measure total fruit availability per plot, we
summed FIs of each individual weighted by diameter at breast height (DBH) as a
surrogate for plant size (Reznik et al. 2012). This was then standardized as a percentage
of maximum fruit availability (Equation 1).
%𝐹𝐼 = [∑ (𝑥𝑖 × 𝐷𝐵𝐻)𝑛𝑖=1
(∑𝐷𝐵𝐻) × 4] × 100

81
Equation 1. Fournier’s intensity index (FI), where n is the number of individuals sampled
in the plot, xi is the value of the semi quantitative scale attributed to the individual, and
DBH is the individual diameter at breast height.
Data analysis
The number of fruiting species and individuals and amount of fruits produced (total,
zoochorous, non-zoochorous) were treated as the response variables in linear mixed-
effects models (Zuur et al. 2009). As fixed effects, we considered “type of pathway” and
“distance to pathway edge”. To account for temporal autocorrelation, we used year and
month as random effects. We used a model selection approach to assess which of the
fixed effect combinations better fitted the data. Five models with the random effects and
all combinations of the predictor variables used as fixed effects were built: a) a full model,
including type of pathways, distance to pathway edge and their interaction, b) a model
without interaction, c) a model without distance to pathway edge d) a model just with
distance to pathway edge and e) null model containing no fixed effects. The assumptions
of normality and homogeneity of variance were examined visually and through the
Shapiro-Wilk test (Zar 1996). A post hoc HSD Tukey test was used to investigate
differences between the types of pathway and distance to pathway edge for number of
fruiting species and individuals and amount of fruits produced. We used the R lme4
package in the R statistical environment for these analyses (R Core Team 2016).
To evaluate differences in the proportion of dispersal syndromes (zoochory
compared to non-zoochorous species) between the types of pathway and at different
distances to the edge we used a generalized linear model with binomial distribution.
Significance of the factors was assessed by means of a Chi-squared Analysis of Deviance.
A post hoc HSD Tukey test was used to investigate differences between the types of
pathway and distance to pathway edge. All analyses were carried out in the R statistical
software (R Core Team 2016) and we considered plots as independent sampling units. To
model selection analysis, the models were compared using the Akaike Information
Criterium – AICc (Akaike 1974) by which the model with the lowest AICc is the one with
the better fit (dAICc = 0) (Zuur et al. 2009).
Seasonality – To assess temporal variation in the number of species and fruit-bearing
individuals, as well as in amount of fruits produced, we used circular statistics, which
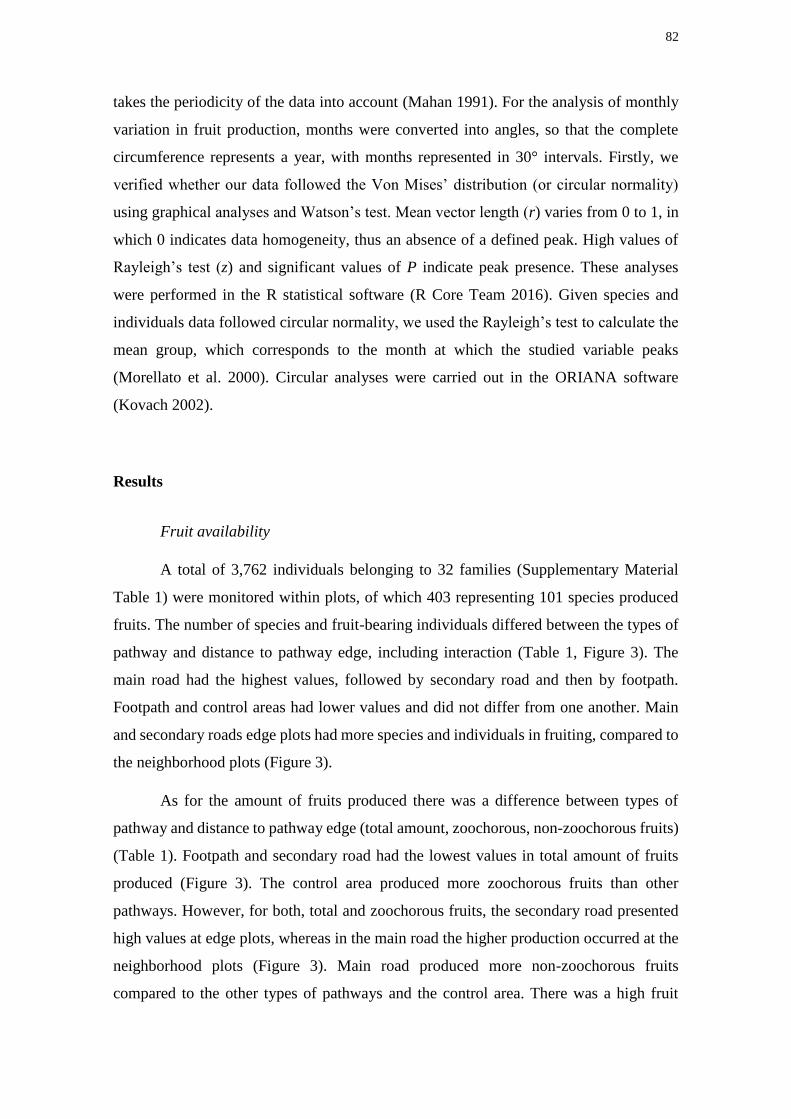
82
takes the periodicity of the data into account (Mahan 1991). For the analysis of monthly
variation in fruit production, months were converted into angles, so that the complete
circumference represents a year, with months represented in 30° intervals. Firstly, we
verified whether our data followed the Von Mises’ distribution (or circular normality)
using graphical analyses and Watson’s test. Mean vector length (r) varies from 0 to 1, in
which 0 indicates data homogeneity, thus an absence of a defined peak. High values of
Rayleigh’s test (z) and significant values of P indicate peak presence. These analyses
were performed in the R statistical software (R Core Team 2016). Given species and
individuals data followed circular normality, we used the Rayleigh’s test to calculate the
mean group, which corresponds to the month at which the studied variable peaks
(Morellato et al. 2000). Circular analyses were carried out in the ORIANA software
(Kovach 2002).
Results
Fruit availability
A total of 3,762 individuals belonging to 32 families (Supplementary Material
Table 1) were monitored within plots, of which 403 representing 101 species produced
fruits. The number of species and fruit-bearing individuals differed between the types of
pathway and distance to pathway edge, including interaction (Table 1, Figure 3). The
main road had the highest values, followed by secondary road and then by footpath.
Footpath and control areas had lower values and did not differ from one another. Main
and secondary roads edge plots had more species and individuals in fruiting, compared to
the neighborhood plots (Figure 3).
As for the amount of fruits produced there was a difference between types of
pathway and distance to pathway edge (total amount, zoochorous, non-zoochorous fruits)
(Table 1). Footpath and secondary road had the lowest values in total amount of fruits
produced (Figure 3). The control area produced more zoochorous fruits than other
pathways. However, for both, total and zoochorous fruits, the secondary road presented
high values at edge plots, whereas in the main road the higher production occurred at the
neighborhood plots (Figure 3). Main road produced more non-zoochorous fruits
compared to the other types of pathways and the control area. There was a high fruit

83
production in the main road for both neighborhood and edge plots. For footpath and
secondary road, edge plots produced more non-zoochorous fruits than the neighborhood
plots of these same pathways (Figure 3).
Table 1. Selected models by Akaike Information Criterium (AICc) (dAICc = 0) to the
response variables: number of species and individuals in reproductive phase and fruit
production (total amount, zoochorous, non-zoochorous fruits) among the studied types of
pathways, considering distance to edge and interaction, at Carlos Botelho State Park –
SP, Brazil, (n = 32 plots sampled along 24 months).
Models
Specie
s
Individual
s Total Zoo
Non-
zoo
D
f dAICc dAICc
dAIC
c
dAIC
c dAICc
Type of pathway x distance to edge
1
0 0 0 0 0 0
Type of pathway + distance to edge 8 14.6 31.9 39.8 22.8 15.8
Type of pathway 7 80.5 128.6 41.3 23.7 17.3
Distance to edge 5 106.4 144.4 64.2 70.8 54.2
NULL 4 167.4 214 66.3 73.3 58.8

84
Figure 3. Number of species and individuals in fruiting phase and amount of fruits
produced (total, zoochorous, non-zoochorous fruit production) among the studied types
of pathways considering distance to pathway edge, at Carlos Botelho State Park – SP,
Brazil. Collected data across eight plots 10 x 10 m2 per type of pathway (n = 32 plots per
24 months). The box-plots are displaying the median, the first and third quartile, and the

85
maximum and minimum values of the data sets. Significant different variables according
to HSD Tukey’s test p < 0.05 were indicated with letters for differences between pathways
and asterisks for differences between edge and neighborhood.
Zoochory was the predominant dispersal syndrome in all areas and represented
more than 70% of the total number of fruiting species and individuals. The proportion of
zoochorous species did not vary among types of pathway, but was different between the
distances to the edge (Table 2). The proportion of zoochorous individuals was different
among types of pathway and between distances to the edge (Table 2). For both species
and individuals, the proportion of zoochory was higher in the neighborhood (Figure 4).
For individuals the values were smaller for the main road plots compared to the remaining
types of pathways, demonstrating that the largest proportion of non-zoochoric fruits was
produced in the widest pathway (Figure 4).
Table 2. Results for generalized linear model for proportion of dispersal syndrome:
zoochorous vs. non-zoochorous species and fruit-bearing individuals considering “type
of pathway”, “distance to pathway edge” and their interaction, at Carlos Botelho State
Park – SP, Brazil, (n=32 plots).
Dispersal syndromes
Species Df Deviance P
Type of pathway 3 3.087 0.378
Distance to edge 1 4.454 0.034
Type of pathway x distance to edge 2 3.967 0.137
NULL 31 34.808
Individuals Df Deviance P
Type of pathway 3 17.053 0.0006
Distance to edge 1 7.701 0.005
Type of pathway x distance to edge 2 2.47 0.29
NULL 31 61.934

86
Figure 4. Proportions along 24 months of dispersal syndromes – zoochorous vs. non-
zoochorous species and individuals in fruiting phase among “type of pathways” and
“distance to pathway edge” at Carlos Botelho State Park, SP, Brazil. A: Zoochorous
species, B: Zoochorous individuals. Data collected across eight 10 x 10 m2 plots per type
of pathway. The box-plots are displaying the median, the first and third quartile, and the
maximum and minimum values of the data sets. Significantly different variables
according to HSD Tukey’s test p < 0.05 were indicated with letters for differences
between pathways and asterisks for differences between edge and neighborhood.

87
Seasonality
We found seasonality in the number of species and fruit-bearing individuals
(Supplementary Material Figure 1). A high seasonality was more apparent for
reproductive processes involving individuals (Table 3). For number of species in fruiting,
only main road edge plots peaked in April, and secondary road peaked in January (Table
3). The control area and footpath had a less marked seasonality (Table 3). Conversely,
high seasonality was observed for the number of individuals in fruiting in all types of
pathways, except for the footpath neighborhood plots, whose peaks occurred between
January and May (Table 3).
We also detected seasonality in amount of fruits produced (Table 3,
Supplementary Material Figure 2). In the main road, fruit availability was seasonal both
in neighborhood and edge plots, with total amount fruits and amount of non-zoochorous
fruits, peaking in May (Table 3). In this area, zoochorous fruits peaked in April in the
edge and in late December in the neighborhood (Table 3). Footpath also showed seasonal
fruit production, with differential peaks, between edge and neighborhood. Total fruit
production and zoochorous fruits peaked in June and July in edge plots and in October in
neighborhood plots, but non-zoochorous fruit peaks varied depending on the distance to
pathway edge (peaks in March and January) (Table 3). The control area showed an
unseasonal pattern for all fruiting categories (Table 3).
Table 3. Calculated parameters for variation in total amount of fruits produced,
zoochorous, non-zoochorous fruits (anemochorous plus autochorous), number of species
and fruit-bearing individuals during two years (2013 – 2015) in areas affected by
pathways within Carlos Botelho State Park – SP, Brazil, considering two treatments for
each area: edge (E) and neighborhood (N). Data collected across eight 10 x 10 m2 plots
per type of pathway (n = 32 plots per 24 months).
Species
Main road Secondary road Footpath Control
E N E N E N
Mean group Apr Mar Jan Mar Apr Jan Feb
Mean vector length
(r) 0.15 0.10 0.10 0.07 0.09 0.08 0.09
Standard Error of
Mean 13.80° 24.35° 23.23° 38.44° 30.97° 40.70° 24.30°
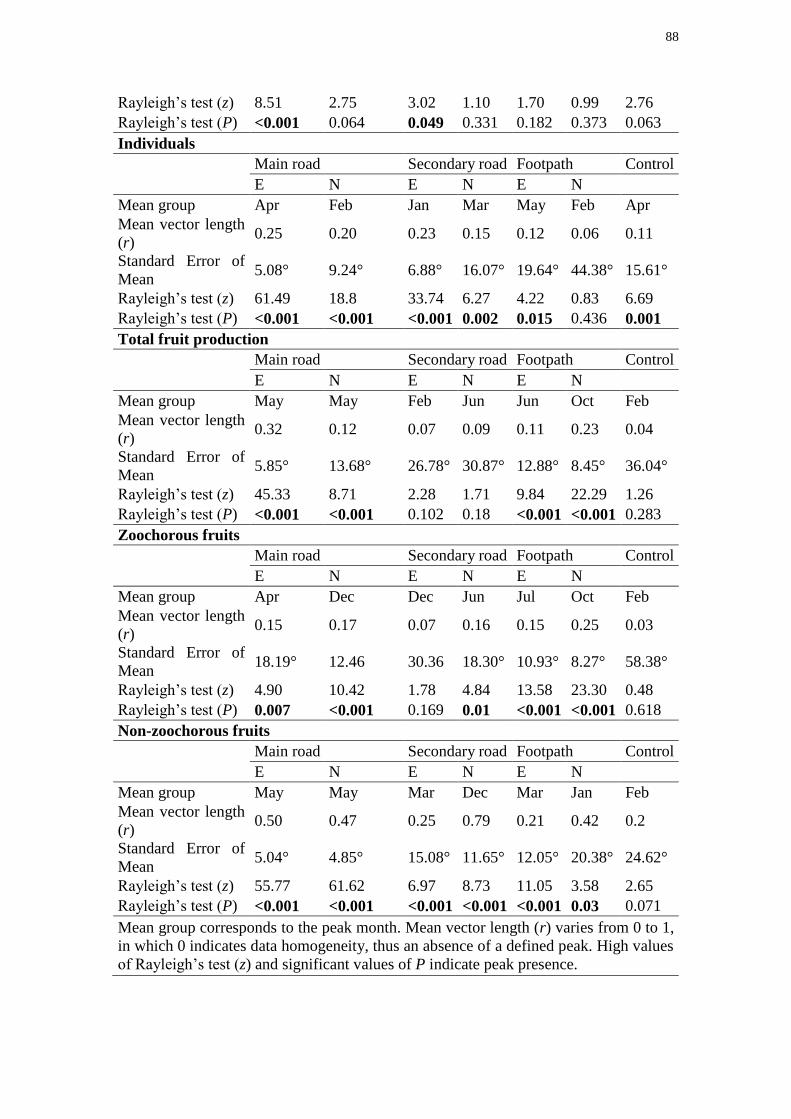
88
Rayleigh’s test (z) 8.51 2.75 3.02 1.10 1.70 0.99 2.76
Rayleigh’s test (P) <0.001 0.064 0.049 0.331 0.182 0.373 0.063
Individuals
Main road Secondary road Footpath Control
E N E N E N
Mean group Apr Feb Jan Mar May Feb Apr
Mean vector length
(r) 0.25 0.20 0.23 0.15 0.12 0.06 0.11
Standard Error of
Mean 5.08° 9.24° 6.88° 16.07° 19.64° 44.38° 15.61°
Rayleigh’s test (z) 61.49 18.8 33.74 6.27 4.22 0.83 6.69
Rayleigh’s test (P) <0.001 <0.001 <0.001 0.002 0.015 0.436 0.001
Total fruit production
Main road Secondary road Footpath Control
E N E N E N
Mean group May May Feb Jun Jun Oct Feb
Mean vector length
(r) 0.32 0.12 0.07 0.09 0.11 0.23 0.04
Standard Error of
Mean 5.85° 13.68° 26.78° 30.87° 12.88° 8.45° 36.04°
Rayleigh’s test (z) 45.33 8.71 2.28 1.71 9.84 22.29 1.26
Rayleigh’s test (P) <0.001 <0.001 0.102 0.18 <0.001 <0.001 0.283
Zoochorous fruits
Main road Secondary road Footpath Control
E N E N E N
Mean group Apr Dec Dec Jun Jul Oct Feb
Mean vector length
(r) 0.15 0.17 0.07 0.16 0.15 0.25 0.03
Standard Error of
Mean 18.19° 12.46 30.36 18.30° 10.93° 8.27° 58.38°
Rayleigh’s test (z) 4.90 10.42 1.78 4.84 13.58 23.30 0.48
Rayleigh’s test (P) 0.007 <0.001 0.169 0.01 <0.001 <0.001 0.618
Non-zoochorous fruits
Main road Secondary road Footpath Control
E N E N E N
Mean group May May Mar Dec Mar Jan Feb
Mean vector length
(r) 0.50 0.47 0.25 0.79 0.21 0.42 0.2
Standard Error of
Mean 5.04° 4.85° 15.08° 11.65° 12.05° 20.38° 24.62°
Rayleigh’s test (z) 55.77 61.62 6.97 8.73 11.05 3.58 2.65
Rayleigh’s test (P) <0.001 <0.001 <0.001 <0.001 <0.001 0.03 0.071
Mean group corresponds to the peak month. Mean vector length (r) varies from 0 to 1,
in which 0 indicates data homogeneity, thus an absence of a defined peak. High values
of Rayleigh’s test (z) and significant values of P indicate peak presence.

89
Discussion
Our results highlight that the effects of pathways intersecting native vegetation
cause changes on fruit production patterns and point that the differences found between
pathways can be assigned to changes in the ecological processes generated by linear gaps
presence and width, because the areas were very close to each other, minimizing spatial
effects. Temporal effects due to time of the pathways implantation also are minimized
because the vegetation condition is the same since the period following the pathways
implantation and remains stable over time due to pathway maintenance (Silva et al. 2017).
Pathways influenced fruit availability patterns and their effects are present even 35 m
from the edge. However, these impacts occur in different ways depending on pathway
width, which corroborates our general assumption. Number of species and fruit-bearing
individuals was higher in wide pathways (10 to 20 m), especially at the edges.
Considering that total richness of trees and shrubs, plus sample effort, is similar among
the sampled areas (Silva et al. 2017), the difference in the number of fruiting species
possibly reflects the effect of pathways. Wider pathways also produced more non-
zoochorous fruit and exhibited temporal variation in fruit production, with peaks and
troughs through the year. Although being a narrow pathway with a vegetation structure
and composition similar to control (Silva et al. 2017), the footpath also affects the
temporal fruit availability. In the control area, in turn, most of the produced fruits were
zoochorous and there was no evidence of fruit peaks.
It is known that forested areas under pathway influence are more susceptible to
environmental oscillation in micro-climatic conditions (Guariguata and Ostertag 2001),
which affects the vegetation structure and composition (Laurance et al. 2003; Couto-
Santos et al. 2015; Silva et al. 2017). These habitat changes influence plant reproduction
(Tabarelli et al. 1999; Enoki et al. 2012). Indeed, edge plots of wide pathways (10 m and
20 m) showed more species and fruit-bearing individuals through time, compared to the
respective neighborhood plots and even to the footpath (2 m wide) and control area. The
higher number of species and fruit-bearing individuals at edges of wide pathways can be
associated to higher plant density and canopy openness, which are related to forest gap
effects and are more pronounced at forest edges (Guariguata and Ostertag 2001; Silva et
al. 2017).

90
Fruiting patterns are mainly caused by differences among species in their response
to environmental conditions (Laurance et al. 2003). By generating different
environments, forest gaps may affect the distribution and composition of plant species,
as already observed for the Atlantic forest (Oliveira et al. 2004; Couto-Santos et al. 2015).
In our areas (Silva et al. 2017), differences in tree and shrub community composition
were observed, where generalist and pioneer species with non-zoochorous fruits were
predominant at edges of wider pathways (10 to 20) when compared to control. The same
differences in species composition are likely to be the main source of variation in fruit
type and predominance of dispersal syndrome in fruiting plants among types of pathways
and distances to edge.
Zoochory was the predominant dispersal syndrome for fruiting species in all areas,
as also found by Reznik et al. (2012), who investigated the phenological patterns of linear
gaps formed by gas pipelines and power lines inside forests. However, in our study,
zoochorous species produced more fruit in the control area. On the contrary, non-
zoochorous species accounted for the majority of total fruit production in the wider
pathway (20m). Possibly, the high number of non-zoochorous species and individuals at
the wider pathway indicates that the dry and highly variable environmental conditions
that predominate at its edges favor wind dispersal and the establishment of species
belonging to this syndromes (Howe and Smallwood 1982; Jara-Guerrero et al. 2011).
Reznik et al. (2012) reported the predominance of anemochory in plants that bore fruit at
the edges, and Tabarelli and Peres (2002) also found similar results for early successional
stages in the Atlantic forest.
Different responses in plant species can be caused by modified environmental
conditions at edges that extend toward the forest interior. In our study, production of dry
fruits (non-zoochorous) did not differ between the edge and neighborhood of the wider
pathway plots (main road), indicating that such environmental changes in wider pathways
affect non-zoochorous species at least 35 m toward the forest interior. On the other hand,
higher zoochorous fruit production in the neighborhood plots of the wider pathway may
indicate that edge effects on this syndrome decrease toward the forest interior, where
more suitable conditions may favor the establishment of species with fleshy fruits
(Liebsch et al. 2008). This suggests that non-zoochorous and zoochorous species might
have different physiological responses to the edge effect, a speculation to be investigated
in future studies. This pattern could also be influenced by life form frequencies in the

91
habitat, since in earlier successional stages there are more shrubs and small trees, usually
dispersed by abiotic means (Tabarelli and Peres 2002). Conversely, in more advanced
stages tall trees dispersed by vertebrates are dominant (Tabarelli and Peres 2002).
Pathway effects are not limited to static changes in fruit production, but also affect
the temporal fruiting pattern, increasing seasonality. In fact, climatic factors (e.g. day
length, temperature and precipitation) do not limit fruit production in the humid Atlantic
forest (Morellato et al. 2000). Mature forests in which zoochorous plants predominate
tend to be less seasonal, with zoochorous fruits being produced throughout the year
(Morellato et al. 2000; Almeida-neto et al. 2008). However, despite this low climatic
seasonality, in some parts of the Atlantic forest (Morellato et al. 2000) areas intersected
by linear gaps are particularly affected, presenting fruiting peaks (Reznik et al. 2012). In
our study site, pathways produced fruiting peaks not observed in the control area. This
increase in phenological seasonality may be caused by the degree to which plants are
exposed to more harsh environmental conditions generated by permanent linear gaps and
differences in species composition (Reid and Dunne 1984; Denslow 1987; Heideman
1989; Webb et al. 1999).
Distribution and availability of fruits in the landscape are important for
maintenance of the local fauna (Jordano et al. 2006; Díaz Vélez et al. 2015). About 20-
50% of bird and mammal species eat fruits at least during part of the year (Fleming 1987).
Zoochorous fruit availability may change frugivore movement patterns (Herrera 1984;
Hasui et al. 2007; Díaz Vélez et al. 2015). Fruit-eating birds in tropical forests, for
example, are capable to migrate between patches and gradients in search for fruits
(Jordano et al. 2006). Our results showed that spatial and temporal fruit availability for
frugivores is affected by the presence of pathways, which could affect seed dispersers in
space and time, compromising structure and conservation of plant-animal interactions and
reflecting changes in the vegetation composition (Cardoso da Silva and Tabarelli 2000;
Morellato et al. 2016). Absence of seed dispersal services can impair such a pattern, acting
as a filter for seedling recruitment and successful colonization (Duncan and Chapman
1999; Cardoso da Silva and Tabarelli 2000).
In conclusion, our study revealed that pathways with different widths might have
pervasive spatial and temporal effects on the fruit availability in tropical forests, affecting
the food provided for frugivores throughout the year. These effects can extend to at least
35 m toward the forest interior, depending on the pathway width and the way in which

92
environmental conditions influence species. The presence pathways can reduce the
amount of zoochorous fruits at the edges over time. On the other hand, mature forests
may provide better resources for frugivorous species, because they are available
throughout the year, and in higher quantity when compared to edges of 20 m-wide linear
gaps. In addition, there is a difference in the types of fruits produced among the areas
affected by pathways, with a predominance of non-zoochory at the edges of the wide
pathways and of zoochory in the areas without pathways. Therefore, we expect that the
variation in the spatial-temporal fruit availability imposed by pathways to the Atlantic
forest may have consequences for frugivorous species and the process of seed dispersal.
Notes on contributors
Bruna Gonçalves da Silva is an ecologist researcher at Jardim Botânico de Jundiaí. His
research interests include ecology of tropical environments, anthropic impacts on the
biodiversity, road ecology, animal-plant interactions and the natural history.
Ingrid Koch is a Professor in Angiosperm Systematics at the Department of Plant
Biology, Universidade Estadual de Campinas. Her research interests includes plant
morphology, reproduction and taxonomy besides plant distribution and vegetation
ecology.
Wesley Rodrigues Silva is a Professor in Vertebrate Zoology and Ecology at the
Department of Ecology, Universidade Estadual de Campinas. His research interest has a
focus on mutualistic plant-animal interactions.
References
Ahmed SE, Lees AC, Moura G, Gardner TA, Barlow J, Ferreira J, Ewers RM. 2014. Road
networks predict human influence on Amazonian bird communities. Proc R Soc.
281:20141742.
Akaike H. 1974. A new look at the statistical model identification. IEEE Trans Autom
Control New York, NY. 19:716–723.
Almeida-neto M, Campassi F, Galetti M, Jordano P, Oliveira-filho A. 2008. Vertebrate

93
dispersal syndromes along the Atlantic forest: Broad-scale patterns and
macroecological correlates. Glob Ecol Biogeogr. 17:503–513.
APG. 2016. An update of the Angiosperm Phylogeny Group classification for the orders
and families of flowering plants: APG IV. Bot J Linn Soc. 181:1–20.
Astudillo PX, Samaniego GM, Machado PJ, Aguilar JM, Tinoco BA, Graham CH, Latta
SC, Farwig N. 2014. The impact of roads on the avifauna of páramo grasslands in
Cajas National Park, Ecuador. Stud Neotrop Fauna Environ. 49:204–212. Available
from: http://www.tandfonline.com/doi/abs/10.1080/01650521.2014.960778
Broadbent EN, Asner GP, Keller M, Knapp DE, Oliveira PJC, Silva JN. 2008. Forest
fragmentation and edge effects from deforestation and selective logging in the
Brazilian Amazon. Biol Conserv. 141:1745–1757.
Cara P. 2006. Efeito de borda sobre a fenologia, as síndromes de polinização e a dispersão
de sementes de uma communidade arbórea na Floresta Atlântica ao norte do rio São
Francisco. Ph.D. dissertação (Biologia Vegetal), Federal University of
Pernambuco, Brazil.
Cardoso da Silva JM, Tabarelli M. 2000. Tree species impoverishment and the future
flora of the Atlantic forest of northeast Brazil. Nature. 404:72–74.
Couto-Santos APL do, Conceição AA, Funch LS. 2015. The role of temporal scale in
linear edge effects on a submontane Atlantic forest arboreal community. Acta Bot
Brasilica. 29:190–197. Available from: http://www.scielo.br/pdf/abb/v29n2/0102-
3306-abb-29-02-
00190.pdf\nhttp://www.scielo.br/scielo.php?script=sci_arttext&pid=S0102-
33062015000200190&lng=en&nrm=iso&tlng=en
Denslow JS. 1980. Gap partitioning among tropical rainforest trees. Trop succession.:47–
55.
Denslow JS. 1987. Tropical rainforest gaps and tree species diversity. Ann Rev Ecol Syst.
18:431–451.
DeWalt SJ, Maliakal SK, Denslow JS. 2003. Changes in vegetation structure and
composition along a tropical forest chronosequence: Implications for wildlife. For
Ecol Manage. 182:139–151.
94
Díaz Vélez MC, Silva WR, Pizo M a, Galetto L. 2015. Movement patterns of frugivorous
birds promote functional connectivity among Chaco Serrano Woodland fragments
in Argentina. Biotropica. 47:475–483. Available from:
http://dx.doi.org/10.1111/btp.12233
Duncan RS, Chapman CA. 1999. Seed dispersal and potential forest succession in
abandoned agriculture in tropical Africa. Ecol Appl. 9:998–1008.
Enoki T, Kusumoto B, Igarashi S, Tsuji K. 2012. Stand structure and plant species
occurrence in forest edge habitat along different aged roads on Okinawa Island,
southwestern Japan. J For Res. 19:97–104. Available from:
http://link.springer.com/10.1007/s10310-012-0383-9
Felton A, Felton AM, Wood J, Lindenmayer DB. 2006. Vegetation structure, phenology,
and regeneration in the natural and anthropogenic tree-fall gaps of a reduced-impact
logged subtropical Bolivian forest. For Ecol Manage. 235:186–193.
Ferraz LPM, Varjabedian R. 1999. Evolução histórica da implantação e síntese das
informações disponíveis sobre o Parque Estadual Carlos Botelho. São Paulo:
Secretaria do Meio Ambiente/Instituto Florestal.
Fournier LA. 1974. Un método cuantitativo para la medición de características
fenológicas en árboles. Turrialba. 24:422–423.
Fundação SOS Mata Atlântica, INPE. 2001. Atlas dos remanescentes florestais da Mata
Atlântica e ecossistemas associados no período de 1995–2000. Fundação SOS Mata
Atlântica e Instituto Nacional de Pesquisas Espaciais (INPE), São Paulo.
Goosem M. 1997. Internal Fragmentation: The effects of roads, highways, and powerline
clearings on movements and mortality of Rainforest vertebrates. In: Laurance WF,
Bierregaard Jr RO Trop For Remnants Univ Chicago Press Chicago. p. 241–255.
Guariguata MR, Ostertag R. 2001. Neotropical secondary forest succession: Changes in
structural and functional characteristics. For Ecol Manage. 148:185–206.
Hasui E, Gomes VSDM, Silva WR. 2007. Effects of vegetaion traits on habitat
preferences of frugivorous birds in Atlantic rain forest. Biotropica. 39:502–509.
Available from: file:///D:/PDF EndNote/Frugivory/1.pdf
Heideman PD. 1989. Temporal and spatial variation in the phenology of flowering and

95
fruting in a tropical rainforest. J Ecol. 77:1059–1079.
Herrera CM. 1984. Adaptation to frugivory of mediterranean avain seed dispersers.
Ecology. 65:609–617.
Howe HF, Smallwood J. 1982. Ecology of seed dispersal. Ann Rev Ecol Syst. 13:201–
208.
Jara-Guerrero A, De la Cruz M, Méndez M. 2011. Seed dispersal spectrum of woody
species in South Ecuadorian Dry Forests: environmental correlates and the effect
of considering species abundance. Biotropica. 43:722–730.
Jordano P, Galetti M, Pizo M a, Silva WR. 2006. Ligando frugivoria e dispersao de
sementes a biologia da conservacao. In: Biol da Conserv essencias. p. 411–436.
Kovach W. 2002. Oriana for Windows. Version 2.02. Pentraeth, Wales, UK: Kovach
Computing Services.
Laurance SGW, Stouffer PC, Laurance WF. 2004. Effects of road clearings on movement
patterns of understory rainforest birds in Central Amazonia. Conserv Biol.
18:1099–1109.
Laurance W, Camargo JLC, Fearnside PM, Lovejoy TE, Williamson GB, Mesquita RCG,
Meyer CFJ, Bobrowiec PED, Laurance SGW. 2016. An Amazonian Forest and Its
Fragments as a Laboratory of Global Change. In: Nagy L, Forsb B, Artaxo P
Interact Between Biosph Atmos Hum L Use Amaz Basin Springer, Heidelb. pp
407-439.
Laurance WF, Ferreira L V, Merona JMR, Laurance, Susan G. 1998. Rain forest
fragmentation and the dynamics of amazonian tree communities. Ecology.
79:2032–2040.
Laurance WF, Goosem M, Laurance SGW. 2009. Impacts of roads and linear clearings
on tropical forests. Trends Ecol Evol. 24:659–669.
Laurance WF, Rankin-de Merona JM, Andrade A, Laurance SG, D’Angelo S, Lovejoy
TE, Vasconcelos HL. 2003. Rain-forest fragmentation and the phenology of
Amazonian tree communities. J Trop Ecol. 19:343–347.
Lenza E, Pinto JRR, Pinto ADS, Maracahipes L, Bruziguessi EP. 2011. Comparação da

96
vegetação arbustivo-arbórea de uma área de cerrado rupestre na Chapada dos
Veadeiros, Goiás, e áreas de cerrado sentido restrito do Bioma Cerrado. Rev Bras
Botânica. 34:247–259.
Liebsch D, Marques MCM, Goldenberg R. 2008. How long does the Atlantic Rain Forest
take to recover after a disturbance? Changes in species composition and ecological
features during secondary succession. Biol Conserv. 141:1717–1725.
List of Species of the Brazilian Flora. 2015. List of Species of the Brazilian Flora
http://floradobrasil.jbrj.gov.br/ [accessed: 1.06.2015].
Longman K, Jenik E. 1987. Tropical Forest and its environment. Longman Singapore.
Singapore.
Mahan R. 1991. Circular statistical methods: applications in spatial and temporal
performance analysis. United States Army Research Institute for the Behavioral and
Social Sciences.
MMA. 2000. Avaliação e ações prioritárias para a conservação da biodiversidade da Mata
Atlântica e Campos Sulinos. Brazil.
Morellato LPC, Alberton B, Alvarado ST, Borges B, Buisson E, Camargo MGG, Cancian
LF, Carstensen DW, Escobar DFE, Leite PTP, et al. 2016. Linking plant phenology
to conservation biology. Biol Conserv. 195:60–72. Available from:
http://dx.doi.org/10.1016/j.biocon.2015.12.033
Morellato PLC, Talora DC, Takahasi A, Bencke CC, Romera EC, Zipparro VB. 2000.
Phenology of Atlantic Rain Forest Trees: A Comparative Study. Biotropica.
32:811–823. Available from: http://doi.wiley.com/10.1111/j.1744-
7429.2000.tb00620.x
Murcia C. 1995. Edge effects in fragmented forests: implications for conservation. TREE.
10:58–62.
Oliveira MA, Grillo AS, Tabarelli M. 2004. Forest edge in the Brazilian Atlantic forest:
drastic changes in tree species assemblages. Oryx. 38:389–394.
Van der Pijl. 1982. Principles of Dispersal in Higher Plants.
Pohlman CL, Turton SM, Goosem M. 2007. Edge effects of linear canopy openings on
97
Tropical Rain Forest understory microclimate. Biotropica. 39:62–71.
Prieto P V., Sansevero JBB, Garbin ML, Braga JM a, Rodrigues PJFP. 2014. Edge effects
of linear canopy openings on understorey communities in a lowland Atlantic
tropical forest. Appl Veg Sci. 17:121–128.
R Core Team. 2016. R: A language and environment for statistical computing.R
Foundation for Statistical Computing, Vienna, Austria. http://www.R-project.org.
Ramos FN, Santos FAM. 2006. Floral visitors and pollination of Psychotria tenuinervis
(Rubiaceae): Distance from the anthropogenic and natural edges of an Atlantic
Forest fragment. Biotropica. 38:383–389.
Reid LM, Dunne T. 1984. Sediment production from forest road surfaces. Water Resour
Res. 20:1753–1761.
Restrepo C, Gomez N, Heredia S. 1999. Anthropogenic Edges , Treefall Gaps , and Fruit-
Frugivore Interactions in a Neotropical. Ecology. 80:668–685.
Reznik G, Pires JPDA, Freitas L. 2012. Efeito de bordas lineares na fenologia de espécies
arbóreas zoocóricas em um remanescente de Mata Atlântica. Acta Bot Brasilica.
26:65–73.
Rodrigues E. 1998. Edge effects on the regeneration of forest fragments in North Paraná.
PhD Thesis, Harvard University.
Silva BG, Castello ACD, Koch I, Silva WR. 2017. Pathways affect vegetation structure
and composition in the Atlantic Forest in southeastern Brazil. Acta Bot Brasilica.
31:108–119.
SMA. 2008. Secretaria do Meio Ambiente do Estado de São Paulo. Plano de manejo do
Parque Estadual Carlos Botelho. [cited 2016 May 17]. Available from:
http://fflorestal.sp.gov.br/planos-de-manejo/planos-de-manejo-planos-concluidos/
Tabarelli M, Mantovani W, Peres CA. 1999. Effects of habitat fragmentation on plant
guild structure in the montane Atlantic forest of southeastern Brazil. Biol Conserv.
9:119–127.
Tabarelli M, Peres CA. 2002. Abiotic and vertebrate seed dispersal in the Brazilian
Atlantic forest: Implications for forest regeneration. Biol Conserv. 106:165–176.

98
Webb EL, Stanfield BJ, Jensen ML. 1999. Effects of topography on rainforest tree
community structure and diversity in American Samoa, and implications for
frugivore and nectarivore populations. J Biogeogr. 26:887–897.
Whitworth A, Beirne C, Rowe J, Ross F, Acton C, Burdekin O, Brown P. 2015. The
response of faunal biodiversity to an unmarked road in the Western Amazon.
Biodivers Conserv. 24:1657–1670. Available from:
http://link.springer.com/10.1007/s10531-015-0883-y
Zar JH. 1996. Biostatistical analysis. Prentice-Hall, Inc, London, UK.
Zhu J, Lu D, Zhang W. 2014. Effects of gaps on regeneration of woody plants : A meta-
analysis. J For Res. 25:501–510.
Zuur A, Ieno E, Walker N, Saveliev A, Smith G. 2009. Mixed effects models and
extensions in Ecology with R. Springer Science. New York. USA.

99
Supplementary Material
Silva, B.G. et al. Fruit availability along roads and footpaths in an Atlantic rain forest
area
Supplementary Material Figure 1. Number of species and fruit-bearing individuals.
Figure 1. Number of species and fruit-bearing individuals during a two-year survey in
four areas (three pathways and a control area) within Carlos Botelho State Park – SP,
Brazil. A, B: main road; C, D: secondary road; E, F: footpath; G,H: control area.

100
Supplementary Material Figure 2. Amount of fruits produced: zoochorous and non-
zoochorous fruits.
Figure 2. Average number of fruits produced during two years estimated by Fournier’s
index, considering zoochorous and non-zoochorous fruits (anemochorous plus
autochorous) in four areas within Carlos Botelho State Park – SP, Brazil. A: main road
edge, B: main road neighborhood, C: secondary road edge, D: secondary road
neighborhood, E: footpath edge, F: footpath neighborhood, G: control area, ZOO:
zoochorous, NON-ZOO: anemochorous plus autochorous.
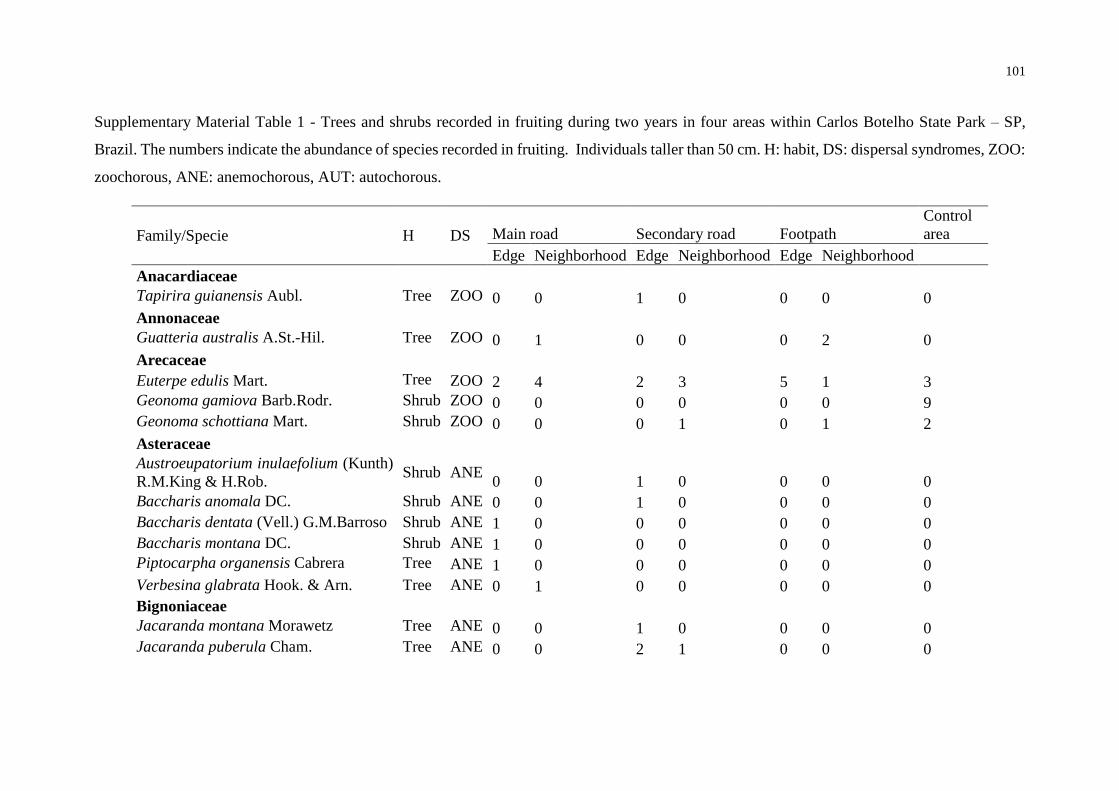
101
Supplementary Material Table 1 - Trees and shrubs recorded in fruiting during two years in four areas within Carlos Botelho State Park – SP,
Brazil. The numbers indicate the abundance of species recorded in fruiting. Individuals taller than 50 cm. H: habit, DS: dispersal syndromes, ZOO:
zoochorous, ANE: anemochorous, AUT: autochorous.
Family/Specie H DS Main road Secondary road Footpath
Control
area
Edge Neighborhood Edge Neighborhood Edge Neighborhood
Anacardiaceae
Tapirira guianensis Aubl. Tree ZOO 0 0 1 0 0 0 0
Annonaceae
Guatteria australis A.St.-Hil. Tree ZOO 0 1 0 0 0 2 0
Arecaceae
Euterpe edulis Mart. Tree ZOO 2 4 2 3 5 1 3
Geonoma gamiova Barb.Rodr. Shrub ZOO 0 0 0 0 0 0 9
Geonoma schottiana Mart. Shrub ZOO 0 0 0 1 0 1 2
Asteraceae
Austroeupatorium inulaefolium (Kunth)
R.M.King & H.Rob. Shrub ANE
0 0 1 0 0 0 0
Baccharis anomala DC. Shrub ANE 0 0 1 0 0 0 0
Baccharis dentata (Vell.) G.M.Barroso Shrub ANE 1 0 0 0 0 0 0
Baccharis montana DC. Shrub ANE 1 0 0 0 0 0 0
Piptocarpha organensis Cabrera Tree ANE 1 0 0 0 0 0 0
Verbesina glabrata Hook. & Arn. Tree ANE 0 1 0 0 0 0 0
Bignoniaceae
Jacaranda montana Morawetz Tree ANE 0 0 1 0 0 0 0
Jacaranda puberula Cham. Tree ANE 0 0 2 1 0 0 0

102
Family/Specie H DS Main road Secondary road Footpath
Control
area
Edge Neighborhood Edge Neighborhood Edge Neighborhood
Chrysobalanaceae
Parinari brasiliensis (Schott) Hook.f. Tree ZOO 0 0 0 0 0 0 1
Clethraceae
Clethra scabra Pers. Tree ANE 4 2 0 0 0 0 0
Clusiaceae
Clusia criuva Cambess. Tree ZOO 1 1 0 0 0 0 0
Elaeocarpaceae
Sloanea hirsuta (Schott) Planch. ex
Benth. Tree ZOO
0 0 0 0 2 0 1
Erythroxylaceae
Erythroxylum ambiguum Peyr. Shrub ZOO 6 7 6 0 0 0 0
Euphorbiaceae
Alchornea glandulosa Poepp. & Endl. Tree ZOO 0 0 0 0 1 0 2
Sebastiania brasiliensis Spreng. Tree AUT 0 0 0 0 1 0 0
Fabaceae
Centrolobium robustum (Vell.) Mart. ex
Benth. Tree ANE
0 1 0 0 0 0 0
Copaifera trapezifolia Hayne Tree ZOO 0 0 0 0 0 1 0
Inga laurina (Sw.) Willd. Tree ZOO 0 0 0 0 0 1 0
Myrocarpus frondosus Allemão Tree ANE 0 0 0 0 0 0 1
Senna multijuga (Rich.) H.S.Irwin &
Barneby
Tree ANE
0 1 0 0 0 0 0
Humiriaceae
Vantanea compacta (Schnizl.) Cuatrec. Tree ZOO 0 0 0 0 0 0 1

103
Family/Specie H DS Main road Secondary road Footpath
Control
area
Edge Neighborhood Edge Neighborhood Edge Neighborhood
Lamiaceae
Hyptis lacustris A.St.-Hil. ex Benth. Shrub ANE 1 0 0 0 0 0 0
Lauraceae
Aiouea acarodomatifera Kosterm. Tree ZOO 0 0 1 0 0 0 1
Aniba firmula (Nees & Mart.) Mez Tree ZOO 0 0 0 0 0 0 1
Aniba viridis Mez Tree ZOO 0 1 2 0 0 1 0
Cryptocarya mandioccana Meisn. Tree ZOO 0 0 0 2 0 0 0
Endlicheria paniculata (Spreng.)
J.F.Macbr.
Tree ZOO
0 0 2 0 0 0 0
Nectandra leucantha Nees Tree ZOO 0 0 1 1 0 0 0
Nectandra oppositifolia Nees Tree ZOO 0 0 2 1 0 0 0
Ocotea dispersa (Nees & Mart.) Mez Tree ZOO 0 3 0 1 1 0 0
Ocotea odorifera (Vell.) Rohwer Tree ZOO 0 0 0 0 0 1 0
Ocotea tabacifolia (Meisn.) Rohwer Tree ZOO 0 0 1 0 0 0 0
Ocotea teleiandra (Meisn.) Mez Tree ZOO 1 0 2 1 0 2 0
Ocotea venulosa (Nees) Baitello Tree ZOO 0 0 1 0 0 0 0
Persea venosa Nees & Mart. Tree ZOO 0 0 0 0 0 0 1
Melastomataceae
Clidemia hirta (L.) D.Don Shrub ZOO 1 0 0 0 0 0 0
Leandra acutiflora (Naudin) Cogn. Shrub ZOO 0 0 2 1 0 0 4
Leandra melastomoides Raddi Shrub ZOO 1 0 1 0 0 0 0
Leandra variabilis Raddi Shrub ZOO 0 0 0 1 0 1 0
Miconia cabucu Hoehne Tree ZOO 0 9 2 2 1 1 0
Miconia cubatanensis Hoehne Tree ZOO 0 0 0 2 0 0 0

104
Family/Specie H DS Main road Secondary road Footpath
Control
area
Edge Neighborhood Edge Neighborhood Edge Neighborhood
Miconia latecrenata (DC.) Naudin Tree ZOO 1 0 0 0 0 0 0
Miconia paniculata (DC.) Naudin Tree ZOO 2 0 3 0 0 2 0
Miconia racemifera (DC.) Triana Tree ZOO 0 6 0 0 0 0 0
Miconia sellowiana Naudin Tree ZOO 0 1 0 0 0 0 0
Miconia tristis Spring Tree ZOO 2 0 0 0 0 1 0
Miconia valtheri Naudin Tree ZOO 0 0 4 0 0 0 0
Pleiochiton blepharodes (DC.) Reginato
et al. Shrub ZOO
1 0 3 0 0 0 0
Tibouchina fothergillae (Schrank &
Mart. ex DC.) Cogn.
Tree ANE
1 0 0 0 0 0 0
Tibouchina pulchra Cogn. Tree ANE 17 4 2 0 1 0 0
Meliaceae
Cabralea canjerana (Vell.) Mart. Tree ZOO 0 0 0 0 0 1 0
Monimiaceae
Mollinedia boracensis Peixoto Tree ZOO 0 0 0 0 0 0 1
Mollinedia elegans Tul. Tree ZOO 0 0 0 1 0 0 0
Mollinedia gilgiana Perkins Tree ZOO 0 0 0 0 0 0 1
Mollinedia oligantha Perkins Tree ZOO 0 0 1 0 0 0 0
Mollinedia schottiana (Spreng.) Perkins Tree ZOO 0 0 0 1 0 0 2
Moraceae
Brosimum glaziovii Taub. Tree ZOO 2 0 0 0 0 0 0
Myrtaceae
Campomanesia guaviroba (DC.)
Kiaersk. Tree ZOO
1 0 0 0 0 1 0

105
Family/Specie H DS Main road Secondary road Footpath
Control
area
Edge Neighborhood Edge Neighborhood Edge Neighborhood
Eugenia copacabanensis Kiaersk. Tree ZOO 0 0 0 0 0 0 1
Eugenia mosenii (Kausel) Sobral Tree ZOO 0 0 0 0 0 0 1
Eugenia prasina O.Berg Tree ZOO 0 0 0 0 0 1 0
Marlierea eugeniopsoides (D.Legrand
& Kausel) D.Legrand
Tree ZOO
0 0 0 0 0 0 1
Myrceugenia myrcioides (Cambess.)
O.Berg
Tree ZOO
0 0 0 0 1 0 1
Myrcia eugeniopsoides (D.Legrand &
Kausel) Mazine
Tree ZOO
0 0 0 1 0 4 0
Myrcia pubipetala Miq. Tree ZOO 0 0 0 1 0 0 0
Myrcia splendens (Sw.) DC. Tree ZOO 1 0 1 0 0 0 3
Psidium cattleianum Sabine Shrub ZOO 3 0 1 0 0 0 0
Nyctaginaceae
Guapira opposita (Vell.) Reitz Tree ZOO 0 0 0 1 0 0 0
Ochnaceae
Ouratea parviflora (A.DC.) Baill. Shrub ZOO 0 0 0 0 0 3 0
Oleaceae
Chionanthus filiformis (Vell.) P.S.Green Tree ZOO 0 0 0 1 0 0 0
Phyllanthaceae
Hyeronima alchorneoides Allemão Tree ZOO 1 0 0 0 0 0 0
Piperaceae
Piper aduncum L. Shrub ZOO 5 3 26 0 3 0 7
Piper pseudopothifolium C.DC. Shrub ZOO 0 0 0 0 0 1 0
Primulaceae

106
Family/Specie H DS Main road Secondary road Footpath
Control
area
Edge Neighborhood Edge Neighborhood Edge Neighborhood
Cybianthus sp. Shrub ZOO 0 0 0 1 0 0 0
Myrsine coriacea (Sw.) R.Br. ex Roem.
& Schult.
Tree ZOO
2 2 1 0 0 0 0
Myrsine umbellata Mart. Tree ZOO 4 2 4 2 1 0 0
Stylogyne pauciflora Mez Shrub ZOO 0 0 0 0 3 1 7
Rubiaceae
Bathysa australis (A.St.-Hil.) K.Schum. Tree AUT 0 0 0 0 2 0 1
Ixora gardneriana Benth. Tree ZOO 0 0 0 0 0 1 2
Psychotria gracilenta Müll.Arg. Shrub ZOO 8 2 6 8 0 0 0
Psychotria leiocarpa Cham. & Schltdl. Shrub ZOO 0 1 0 0 0 0 0
Psychotria nuda (Cham. & Schltdl.)
Wawra
Shrub ZOO
6 2 0 0 2 1 0
Psychotria vellosiana Benth. Shrub ZOO 16 3 0 0 0 0 0
Rutaceae
Esenbeckia grandiflora Mart. Tree AUT 0 0 0 1 0 0 1
Salicaceae
Casearia obliqua Spreng. Tree ZOO 1 0 0 0 5 0 0
Casearia sylvestris Sw. Tree ZOO 1 0 1 0 0 0 0
Sapindaceae
Allophylus edulis (A.St.-Hil. et al.)
Hieron. ex Niederl. Tree ZOO
0 0 1 0 0 0 0
Cupania oblongifolia Mart. Tree ZOO 0 1 0 0 0 0 0
Cupania vernalis Cambess. Tree ZOO 0 1 0 1 0 0 1
Diatenopteryx sorbifolia Radlk. Tree ANE 0 0 0 0 0 0 1

107
Family/Specie H DS Main road Secondary road Footpath
Control
area
Edge Neighborhood Edge Neighborhood Edge Neighborhood
Matayba elaeagnoides Radlk. Tree ZOO 0 0 0 0 0 0 1
Sapotaceae
Micropholis crassipedicellata (Mart. &
Eichler) Pierre
Tree ZOO
0 0 1 1 0 0 1
Pouteria torta (Mart.) Radlk. Tree ZOO 0 0 0 0 0 0 1
Solanaceae
Cestrum cf. schlechtendalii G.Don Shrub ZOO 0 0 1 0 0 0 0
Solanum argenteum Dunal Tree ZOO 2 0 1 2 0 0 0
Solanum bullatum Vell. Tree ZOO 1 0 0 0 0 0 0

108
CAPÍTULO III – Impact of park roads and trails on a community of Atlantic forest
fruit-eating birds
Artigo nas normas da revista Biodiversity and Conservation
Title page
Bruna Gonçalves da Silva1, Ingrid Koch2, Wesley Rodrigues Silva3
1 Universidade Estadual de Campinas – UNICAMP, Departamento de Biologia Animal,
Programa de Pós-Graduação em Ecologia, Rua Monteiro Lobato, 255, ZIP Code: 13083-
862 – Campinas – SP, Brazil. E-mail: [email protected]
2 Universidade Estadual de Campinas – UNICAMP, Departamento de Biologia Vegetal,
Instituto de Biologia, Rua Monteiro Lobato, 255, ZIP Code: 13083-862 – Campinas – SP,
Brazil. E-mail: [email protected]
3 Universidade Estadual de Campinas – UNICAMP, Departamento de Biologia Animal,
Rua Monteiro Lobato, 255, ZIP Code: 13083-862 – Campinas – SP, Brazil. E-mail:
Silva, B.G. (corresponding author, [email protected])1 Phone: +55 19 3521-6325
Acknowledgements
We thank Fundação de Amparo à Pesquisa do Estado de São Paulo – FAPESP,
for the doctoral scholarship and financial support to the first author (Grant 2013/11175-
6); Instituto Florestal do Estado de São Paulo for permission to work at Carlos Botelho
State Park; Leonardo Ré Jorge for statistical assistance, comments and suggestions;
Cristiane Patrícia Zaniratto, Ana Carolina Devides Castello, Alexander Zamorano
Antunes and Mario Alejandro Marin Uribe for field work assistance.

109
Abstract
Roads and trails in forested areas may affect birds, depending on the species
sensitivity to habitat disturbance. Our aim was to assess the impact of pathways with
different widths and uses on fruit-eating birds. We hypothesized that the abundance,
richness, diversity and community composition of birds respond to the effects of
pathways. These effects should be modulated by the dependence on fruits in the diet. Data
were collected in a main road (20m wide - high usage), secondary road (10m wide - low
usage), in a touristic trail (2m wide - high usage) – and in a control area, all areas inside
the Atlantic Forest in southeastern Brazil. We established eight sampling plots and point
counts at the edge of each pathway. The control area showed the highest diversity,
followed by the wider pathway (main road). The main road, however, presented the
lowest richness and abundance of large frugivores and the highest abundance of
omnivores. Pathway width, fruit availability and pathway use were the most important
components structuring the bird communities. Our study revealed that the impacts
generated by pathways in forested areas may have negative consequences for the local
communities of fruit-eating birds, particularly when they are large and/or extensively
used. We expect that this low occurrence of large frugivorous birds in forest tracts highly
disturbed by paths may affect local seed dispersal processes. Park managers should be
aware of these factors and care about management and the public use of the pathway
network, in order to maintain the services provided by frugivorous birds.
Key words: frugivores, conservation, linear gaps, tropical forest, pathway management,
Carlos Botelho State Park.

110
Introduction
Tropical forests have been rapidly devastated due to habitat loss and
fragmentation (Laurance et al. 1997; Gascon et al. 2000), and initiatives in forest
conservation have led to the establishment of many protected areas in tropical countries
(Bruner et al. 2001, Myers et al. 2000). The Atlantic Forest is one of the world’s
biodiversity hotspots, with high levels of endemism, threatened species and subject to
high rates of species loss (Brooks et al. 1999; Myers et al. 2000). The current area covered
by the Atlantic Forest remnants represents approximately 11% of its original extent
(Ribeiro et al. 2011). Most Atlantic forest remnants are parks located in southeastern
Brazil, home to the majority of remaining viable populations of endemic plant and animal
species, but also the most populous region in the country (Aleixo and Galetti 1997; SNUC
2000).
Forest disturbance and fragmentation occurs even when a given habitat area is not
directly affected, e.g., when the Atlantic forest parks are intersected by linear gaps, as
roads, railways, river channels, power lines, firebreaks, or other barriers to organismal
dispersal (Schonewald-Cox and Buechner 1992; Laurance et al. 2014). The presence of
linear gaps in forested areas can create edges, which favour the arrival and establishment
of exotic and/or invasive species, and access to hunters and other illegal activities that
affect both the flora and fauna, as well as an increase in roadkill (i.e. animals ran over by
motor vehicles) and changes in animal behaviour (Forman and Alexander 1998).
The edge effect generated by linear forest gaps of varying widths affects
habitat in several ways, such as in vegetation structure and composition (Couto-Santos et
al. 2015; Silva et al. 2017a), phenological processes (Reznik et al. 2012), and resource
availability for fauna (Silva et al. 2017b). Moreover, the type of pathway usage is an
important aspect in faunal maintenance near those areas (Forman and Alexander 1998).
Changes generated by pathways may affect the relationships between fauna and its
habitat, depending on the response of species with different degree of sensitivity to
disturbances and dependence on a fruit diet (Hasui et al. 2007), considering that the
degree of frugivory affect sensitivity of birds to habitat components (Aleixo 1999; Hasui
et al. 2007). The more habitat sensitive bird species may be absent or leave the area and
stop foraging and nesting (Helldin and Seiler 2003; Kangas et al. 2010), which may result

111
in a gradual loss of species diversity near pathways (Reijnen et al. 1995; Martínez-Abraín
et al. 2010; Jack et al. 2015).
The understanding of how animals respond to roads and trails disturbance in space
and time is an urgent and important question to be addressed. Birds are related with
several ecological process in tropical forest, as seed dispersal, and pathways are
recognized for negatively affecting bird communities in several natural environments
(Helldin and Seiler 2003; Laurance et al. 2004; Marsden et al. 2004; Kangas et al. 2010;
Ahmed et al. 2014). It is known that the presence of these anthropogenic gaps cause
changes in bird community composition and species behavior, e.g. the movement of
dispersal agents, in a tropical forest in the Amazon (Laurance et al. 2004; Ahmed et al.
2014). However, the relationship between pathways width and usage and bird
communities in tropical forests is poorly understood. Birds with specialized fruit diets
are responsible for most of the seed dispersal processes of plants with fleshy fruits in the
Atlantic forest. These frugivores are usually more sensitive to disturbances and may have
their abundance reduced in disturbed areas (Staggemeier and Galetti 2007; Almeida-neto
et al. 2008; Galetti et al. 2013).
In this context, we aimed to assess the impact of pathways on the fruit-eating
forest birds, considering that vegetation structure and composition, as well fruit
availability, are also affected by pathway (Silva et al. 2016a; Silva et al. 2016b). We
hypothesize that abundance, richness, diversity and community composition of fruit-
eating birds respond to habitat changes caused by pathways. These effects should be
modulated by width and usage intensity of pathways and by the sensitivities of different
bird species, here represented by dependence on fruits in the diet. We expect to find a
different bird community composition, with high abundance and richness of disturbance-
sensitive and diet specialist species in areas without pathways or in low-use pathways,
while in the vicinity of high-use or wide pathways we expect to find high abundance and
richness of diet opportunist and disturbance-tolerant species. We also expect to find
higher diversity at the areas without pathways.

112
Material and Methods
Study area
Fieldwork was carried out at Carlos Botelho State Park (CBSP), a 37,644.36 ha area
located between 24º 06’ 55” – 24º 14’ 41” S and 47º 47’ 18” – 48º 07’ 17” W, in São
Paulo state, southeastern Brazil (Figure 1 A), with altitudes ranging between 20 and 1000
m. Mean annual temperature is 18ºC and annual precipitation varies between 1500 - 2200
mm (Ferraz and Varjabedian 1999). The park is integrates in the Atlantic forest
continuum and the predominant vegetation type is Dense Ombrophilous Forest (Kronka
et al. 2005; SMA 2008). The study sites are located at Montane Dense Ombrophilous
Forest areas, around 800 m a.s.l. We collected data in four areas intersected by different
types of pathways: a main road (wide pathway with high usage), a secondary road (wide
pathway with low usage), a trail (narrow pathway with high usage) and a control area
(without pathway and usage, reputedly close to a reference state of conservation). Since
several ecological processes, such as species composition and plant density, are more
affected within the first 35 m from forest edges (Rodrigues 1998), and that vegetation
structure and composition, besides fruit availability, are affected by the pathways sampled
at this distance (Silva et al. 2017a; Silva et al. 2017b), we set up plots alternately adjacent
to the path and 35 m distant from them (Fig. 1 B, C). We used a single path per pathway
type because the characteristics as width, soil and usage are very specific for each
pathway, and there are no similar areas in the same forest continuum and elevation.
In each type of pathway we selected a stretch of 1400 m along its total extension,
along which eight 10 x 10 m sampling plots were established, completing 32 plots. To
ensure independent samples these plots were separated by at least 200 m from one another
along the path (Fig. 1 C). At the control area, we set up the plots in the same manner,
except that there was no pathway. In this design, type of pathway (including control area)
was considered as treatment.

113
Fig. 1. A: Location of Carlos Botelho State Park, São Paulo state, SE Brazil. B: Different
pathways used as treatments: (1) main road (wide pathway - high usage), (2) trail (narrow
pathway - high usage), (3) control area (without pathway and usage), (4) secondary road
(wide pathway - low usage), C: Distribution of plots along the pathway. In green the forest
remnants - (SOS - Mata Atântica 2015)
Types of pathways
We surveyed the following characteristics of each type of pathway: width, use
intensity (vehicle traffic and people movement) and intensity of maintenance. Pathway

114
width was measured at each of the eight sampling points established according to figure
1C, starting from the forest edge. Use intensity of the main road and trail, which consists
of vehicle and/or people numbers, were are accounted by park staff. The intensity of use
of the secondary road was estimated through interviews with the park personnel. Park
staff also provided information for the intensity of maintenance for all pathways, which
consists to terrain conservation, handrails and stairs on the trail, and recovery from the
slopes on the road. For maintenance we elaborated an index for this variable, ranging
from 0 to 2, where 0 indicates absence of maintenance (control area), 1 indicates moderate
maintenance with about one intervention per month (secondary road) and 2 indicates high
maintenance with at the least one intervention per week (main road and trail).
The main road within the CBSP is a 20 m wide dirt pathway that intersects the
park along 33 km with a completely open canopy (Fig. 2 A), being intensively used by
people and vehicles (average of 6000 vehicles and 90 people walking per month) and
need high maintenance. The secondary road is about 10 m wide and extends
approximately 12 km with the canopy partially covered (Fig. 2 B). This pathway is
sporadically used for researchers, surveillance, maintenance, and small groups of visitors
(average of 20 vehicles and 40 people per month). Vegetation structure and composition
for main and secondary roads are similar, with reduced tree height and diameter, high
liana density, few exotic species, and a high proportion of pioneer and anemochorous
species (Silva et al. 2017a), yet they differ in the degree of usage, which is higher for
main road.
The trail is a narrow (1.5 to 2.0 m wide) pathway, being part of the surveillance
walking trail network, with approximately 4.5 km long, a complete canopy cover along
its total extension (Fig. 2 C), is heavily used by the park visitors (average of 200 people
per month) and need high maintenance. The control area is representative of the mature
forest occurring in most of the park (Fig. 2D), without apparent anthropic influence (SMA
2008; Silva pers. obs). Vegetation structure of the trail is similar to the control area (Silva
et al. 2017a), with high tree height and diameter, high density of epiphytes, and high
proportion of zoochorous and non-pioneer species.

115
Fig. 2. Sampled areas at Carlos Botelho State Park, São Paulo state, SE Brazil. Different
pathways used as treatments: A: main road (20m wide - high usage), B: secondary road
(10m wide - low usage), C: trail (2m wide - high usage), D: control area (no pathway).
Data sampling
Fruit-eating birds
We measured the relative abundance and richness of fruit-eating birds monthly
during two years at each plot. We observed the avifauna for a total of 128 h in the 32
fixed hearing points. Each point was surveyed 24 times, resulting in a total 240 min of
observation per survey point. We used the unlimited fixed-point count method (Bibby et
al. 1992). The points were located in the center of each plot, where the observer stood for
10 min recording all bird species seen or heard (Develey 2004). Observations occurred
during the first three hours after dawn.

116
Observations were made with a 10x36 binocular and birds were identified by both
visualization and vocalization. The adopted nomenclature followed the species list of the
Brazilian Committee of Ornithological Records (Piacentini et al. 2015). To represent the
sensitivity to disturbance we used as reference the degree of dependence on a fruit diet
(Aleixo 1999; Hasui et al. 2007). To characterize fruit-eating birds as to the diet we used
two types of diet: frugivores and omnivores, based on the guild classification proposed
by Wilman et al. (2014) and Poulin et al. (1994). Threatened species were classified
according to the São Paulo state endangered species list (São Paulo 2014).
Influence of habitat
Vegetation structure – Vegetation structure in the plots was characterized by quantitative
observations on the phytophysiognomy (Durigan 2003; Silva et al. 2017a), considering
the following variables: diameter at breast height (DBH), total tree height, tree crown
diameter and canopy openness. We collected these variables only from individuals that
met the inclusion criterion: perimeter at breast height (PBH) ≥ 10 cm. Based on the total
tree height we considered two arboreal strata to evaluate density of trees and shrubs:
understory (1.50 – 5 m) and canopy (above 11 m). Individuals in the intermediate stratum
were not considered because their densities did not differ among pathways (see in Silva
et al. 2016a).
Canopy cover was measured using hemispherical photographs (Frazer et al. 2001),
taken with a Nikon Coolpix 4500 camera with a fish-eye FC-E8 lens. We positioned the
camera, with the aid of a tripod, at an approximate 60 cm height, at the center of each
plot. Photographs were taken in cloudy days to avoid over exposure due to direct sunlight,
which may influence image analysis (Frazer et al. 2001). We converted the resulting
images in black and white colors in ImageJ software (Rasband 2015). The canopy cover
was estimated based on white pixels, which correspond to the percentage of gaps.
Zoochorous fruits – Direct plant observations at each plot were conducted with the aid of
a 10x36 binocular. We observed and identified the dispersal syndrome of each fruiting
species. Only individuals with zoochorous fruits were included (Van der Pijl 1982). We
included woody plants taller than 50 cm. We recorded fruit presence or absence on a
monthly basis (between July 2013 and June 2015). Observations were conducted
preferentially during the last fortnight of each month, assuring a 30-day interval between
each data collection event. For fruit quantification we used the Fournier’s intensity index

117
– FI (Fournier 1974). According to the index, each phenophase is classified in a scale
from 0 to 4, in which: 0 = absence of resource; 1 = presence of fruit in 1 to 25% of
branches; 2 = 26 to 50%; 3 = 51 to 75%; 4 = 76 to 100% of branches. To measure total
fruit availability per plot we summed FIs of each individual weighted by DBH as a
surrogate for plant size (Reznik et al. 2012). This was then standardized as a percentage
of maximum fruit availability (Eq. 1).
Eq. 1 Fournier’s intensity index – FI, where n is the number of individuals sampled in the
plot, xi is the value of the semi quantitative scale attributed to the individual, and DBH is
the individual diameter at breast height.
All woody fruiting individuals (trees and shrubs) were tagged and identified for
fruit size characterization. Species identification was based on literature and specialist
determination. The fruits were grouped into two categories according to their size: up to
14 mm, and larger than 14 mm (Cardoso da Silva and Tabarelli 2000). Dehiscent
zoochorous fruits were classified according to the seed width, as vertebrates directly
manipulate seeds (Cardoso da Silva and Tabarelli 2000).
Data analyses
Fruit-eating birds
We performed a diversity profile analysis, where α = 0 corresponds to richness
values in different pathways, α = 1 equivalent to Shannon’s diversity index (H’) and α =
2 equivalent to Simpson’s diversity index (D). Therefore, we were able to compare
treatments according to equitability (α ≥ 2) and richness (α ≤ 1).
The abundance and richness of fruit-eating birds were treated as the response
variables in a linear mixed-effects model (Zuur et al. 2009) designed to assess the
importance of a suite of factors related to spatial and temporal variation and to variation
in the survey effort that might potentially affect p. We tested whether these response
variables are influenced by type of pathway and type of diet (frugivore and omnivore)
(fixed effects) considering the monthly and annual variation (random effects) (Crawley
%𝐹𝐼 = [∑ (𝑥𝑖 × 𝐷𝐵𝐻)𝑛𝑖=1
(∑𝐷𝐵𝐻) × 4] × 100

118
2007). These models were compared using the corrected Akaike Information criterion –
AICc (Akaike 1974). The model with the lowest AICc and delta values indicate the model
with the best fit (dAICc = 0) (Zuur et al. 2009). The assumptions of normality and
homogeneity of variance were examined visually and through the Shapiro-Wilk test. We
used the R package lme4 (Bates et al. 2015). A post hoc HSD Tukey test was used to
investigate differences between the types of pathway for abundance and richness of fruit-
eating birds. Both analyses were held in the R statistical software (R Core Team 2016).
We tested the difference in bird species composition among the pathways using a
permutational multivariate analysis of variance (Permanova, Anderson 2001). We used
the “adonis” function of the R package vegan (Oksanen et al. 2016) with Bray-Curtis
dissimilarity and 10,000 permutations. In order to verify general tendencies of variation
in bird composition we performed an ordination analysis with non-metric
multidimensional scaling (nMDS, Minchin 1987). We adopted this approach to better
identify and interpret similarities between pathways. These analyses were performed in
the R environment (R Core Team 2016) and p < 0.05 was considered significant.
Influence of habitat and types of pathways
We used model selection to test the effect of habitat and type of pathway on the
bird community. For pathways, we used pathway width (1) and a composite variable for
pathway usage (2) that was obtained as the first axis of a principal component analysis
(PCA) (Pearman 2002) of log base 10 of vehicle traffic, people movement and
maintenance intensity. For habitat, we used vegetation structure (3) also as a composite
variable measured as the first axis of a PCA with DBH, total tree height, tree crown
diameter, canopy cover, understory tree density and canopy tree density. Zoochorous
fruits were represented by amount of large fruits (4) and amount of small fruits (5). To
test the explanation power of these five explanatory variables over the response-variables
(abundance and richness of fruit-eating birds, abundance and richness by type of diet) we
used model selection (Zar 1996). Initially, we tested the null hypothesis that none of the
explanatory variables is related to the response variables creating two models: a
maximum model with all explanatory variables and a null one, containing only the
response variable (Crawley 2007). These models were compared via the Akaike criterion
– AICc (Akaike 1974). For each maximum model that presented a low AICc value
compared to the null model, we performed model simplification, by gradually
suppressing the least significant variables (i.e., with high p-values) up to a minimum

119
model, with the best fit to the data (Crawley 2007). We included variables when their
presence decreased the AICc value, since they contributed to a best fit to the model (dAIC
= 0) (Crawley 2007). The minimum model capable of explaining the ecological pattern
was considered the one that presented the lowest AICc value (Crawley 2007). Residues
distribution normality was tested using the Shapiro-Wilk test and variance
homoscedasticity assessed via graphical analysis. As the data presented a normal
distribution and homogeneous variance, we used linear models (LM). We used the R lme4
package in the R statistical software (R Core Team 2016).
Avifauna composition was related to the types of pathways and habitat using
Canonic Correspondence Analysis (CCA) (Ter Braak 1986; Palmer 1993). The following
variables were considered: width (1); in this case, pathway usage was separated into its
three components: vehicle traffic (adjusted values in log 10) (2), people movement (3)
and maintenance intensity (4) to assess whether these components affect bird fauna
differently; vegetation structure (5), large fruits (6) and small fruits (7). CCA represents
a special case of multivariate regression (Ter Braak 1986), and explains community
variation detecting patterns of variation in species abundance that may be best explained
by the set of environmental variables (i.e., habitat and pathway variables) with no a priori
knowledge of potential predictor variables (Ter Braak 1986; Palmer 1993). The
significance of constraining factors was assessed by means of a permutational ANOVA
with 999 iterations. We used the R statistical software and for all analyses we considered
p < 0.05 significant (R Core Team 2016).
Results
Fruit-eating birds
We recorded 80 bird species, with a total of 4,818 contacts between frugivores
and omnivores (Appendix). Considering all bird species and abundances, the main road
and control area had practically the same diversity with high values among the four areas
regarding the Shannon index (when more weight is assigned to richness, α = 1) but the
control area had the highest diversity regarding the Simpson index (when more weight is
assigned to equitability, α = 2) (Fig. 3).

120
Fig. 3. Community’s diversity profile analysis of fruit-eating birds for four areas in the
Carlos Botelho State Park – SP, Brazil. α = 1 equivalent to Shannon’s diversity index
(H’) and α = 2 equivalent to Simpson’s diversity index (D).
Type of pathway and dependence on a fruit diet (frugivore and omnivore) affect
the bird relative abundance and richness (Table 1, Fig. 4A). Frugivore abundance was
higher in the control area compared to the pathways (Fig. 4A). The secondary road (a
pathway with low usage) presented high frugivore abundance compared to the main road
and trail (high usage pathways) (Fig. 4A). Frugivore richness was higher in the control
area and secondary road compared to the trail and main road (Fig. 4B). Omnivore
abundance was higher in the main road, but the control area had high omnivore abundance
compared to trail and secondary road (Fig. 4A). The omnivore richness was higher in the
main road and control area compared to the other pathways (Fig. 4B) (HSD Tukey <
0.05).
Table 1. Table 1Relative abundance and richness of fruit-eating birds by diet (frugivores
and omnivores) among the types of pathways during two consecutive years at Carlos
Botelho State Park, Brazil, (n = 24 sampling in 32 plots). .Selected models by Akaike
criteria (AICc).

121
Relative abundance by diet specialization
AICc dAICc Df
Type of pathway * type of diet 2498.6 0 11
Type of pathway + type of diet 2602.5 103.9 8
Type of diet 2676.7 178.1 5
Type of pathway 2744.1 245.5 7
NULL 2794.3 295.8 4
Richness by diet specialization
AICc dAICc Df
Type of pathway * type of diet 2020.5 0 11
Type of pathway + type of diet 2065.8 45.3 8
Type of diet 2120.9 100.3 5
Type of pathway 2282.4 261.9 7
NULL 2311.4 290.9 4
Fig. 4. Relative abundance (A) and richness (B) of frugivorous (F) and omnivorous (O)
birds in pathways during two consecutive years at Carlos Botelho State Park, Brazil (n =

122
32 plots, eight per area). Symbols above the plots (letters in frugivores and numbers in
omnivores) represent the significant differences (HSD Tukey < 0.05) in the datasets.
Five, two and one exclusive omnivore species were recorded in the main road,
secondary road and the trail respectively. Nine were recorded for the control, of which
six are canopy frugivores and three are omnivores (Appendix). Many canopy frugivorous
species had higher relative abundance in the control area, compared to the main road
(Appendix). Only 28 species were shared by all areas (Appendix).
Type of pathway influenced avifauna composition (PERMANOVA, F3,28 = 5.59,
P < 0.0001) and community data ordination (nMDS) was consistent with the
PERMANOVA’s result (Final stress: 0.20) (Fig. 5). We found a strong separation among
plots surveyed in the main road, trail and control area, what highlights the significant
difference in bird community composition among pathways. The secondary road and
control area plots were closely grouped, revealing the similarity in bird communities
between the two areas (Fig. 5). The first axis separated the pathways with more intense
use (trail and main road) from the low use locations.

123
Fig. 5. Ordination analysis (nMDS) for bird species composition among plots surveyed
in different types of pathway during two consecutive years at Carlos Botelho State Park,
Brazil. (Final stress: 0.20). M: main road, S: secondary road, T: trail, C: control area.
Influence of habitat and types of pathways
Fruit-eating bird community differs in terms of habitat sensitivity and types of
pathways (Table 2). The bird total richness and abundance were negatively affected by
usage and positively affected by small-fruit production and pathway width (Table 2).
Frugivore abundance and richness were negatively affected by pathway use and
positively affected by small fruit production, and the richness was also affected by
vegetation structure (Table 2). Omnivore abundance was affected by vegetation structure,
positively affected by pathway width and small fruit production (Table 2). Omnivore
richness could not be explained by any of the surveyed variables.
Table 2. Explanatory variables for relative abundance of fruit-eating birds, total richness
of fruit-eating birds, frugivore abundance and richness, and omnivore abundance and
richness for types of pathways and control area sampled during two consecutive years at
Carlos Botelho State Park, Brazil, (n = 24 sampling in 32 plots). Linear models selected
according to the Akaike information criteria (AICc)
Response variable Explanatory variables dAIC AICc R2 Df
Total relative abundance
Small fruits (+)
0 337.3 0.41 5 Width (+)
Pathway use (-)
Total richness
Small fruits (+)
0 217.9 0.29 5 Width (+)
Pathway use (-)
Frugivore relative abundance Small fruits (+)
0 276.8 0.76 4 Pathway use (-)
Frugivore richness
Vegetation structure
0 103.3 0.86 5 Small fruits (+)
Pathway use (-)
Omnivore relative abundance
Vegetation structure
0 326.1 0.24 5 Width (+)
Small fruits (+)
Omnivore richness NULL 0 119.23 _ 2

124
Habitat components and type of pathway affected the bird community
composition (Fig. 6 – CCA permutation test: F7,24 = 2.03, p < 0.001). Pathway width,
vegetation structure and quantity of zoochorous fruits clearly separated the bird
community in two groups: (i) the main and secondary road and (ii) control area and trail
(Fig. 6). The variables accounting for pathway usage also separated the community in
two groups: (i) trail and main road and (ii) control area and secondary road. Vegetation
structure was strictly related to pathway width (Fig. 6). When the first two axes of
canonical correspondence analysis (CCA) are considered there is a 22% explanation of
the variation in bird community composition by habitat and types of pathways (Fig. 6).
Fig. 6. Ordination diagram of the canonical correspondence analysis (CCA) showing the
association between habitat and types of pathways (explanatory variables: width, vehicle
traffic, people movement, maintenance intensity, vegetation structure and quantity of
small and large fruits) and fruit-eating bird composition (response variable). Arrows

125
length and position indicate the correlation between the explanatory variable and the axes
of the CCA. Small angles between arrows indicate strong correlation between variables.
Circles refer to species (red to frugivores and yellow to omnivores). Plots are indicated
with letters: M-main road, S-secondary road, T-trail, C-control area. Correlation
coefficients among explanatory variables and the first two axes of the CCA – axis 1 and
2, respectively: Width: -0.79, 0.57; Maintenance: -0.86, -0.06; Vehicles: -0.88, 0.35;
People: -0.51, -0.41; Vegetation structure: -0.58; 0.52; Large fruits: -0.16, 0.06; Small
fruits: 0.32, -0.36.
Discussion
Pathway usage and width, coupled with habitat changes caused by pathways
presence, as fruit availability, were the most important components in determining the
fruit-eating bird community. However, distinctively from vegetation (Silva et al. 2017a),
fruit-eating birds were more strongly affected by the intensive use than the pathway
width. Differences found between pathways can be assigned to changes in the ecological
processes generated by the presence of the linear gap, width and usage, because the areas
were very close to each other, minimizing spatial effects (Blake 2007; Silva et al. 2010).
The wide pathways, with a similar vegetation structure, but different fruit availability
(Silva et al. 2017a; Silva et al. 2017b) and usages, differed in the bird community
attributes. The narrow pathway and control area, with a similar vegetation structure and
different frit availability also differed in the bird communityThe control area showed the
highest diversity, richness and abundance of large frugivores, whereas the main road had
the lowest. This pattern highlights the impact caused by the intensive use of a
pathway.Anthropic disturbances in tropical forests may affect bird communities in
different ways depending on the type of change in habitat parameters (Aleixo 1999). The
edge effect generated by the presence of pathways in forested areas changes habitat
characteristics (Silva et al. 2017a), to which fauna may respond reducing their densities
near these structures (Benítez-lópez et al. 2010). As expected, bird responses vary
according to the degree of dependence on forested habitats (Watson et al. 2004). Forest-
dependent birds are sensitive to changes occurring at forest edges, such as changes in
habitat complexity (Watson et al. 2004) and increased light availability (Oliveira et al.

126
2011). Food resource availability, which may be altered by anthropic disturbance
(Laurance et al. 2003; Silva et al. 2017b), can also affect bird species distribution in the
landscape (Malizia 2001; Hasui et al. 2007).
Mature tropical forests naturally combine a diverse array of microhabitats due to
forest succession dynamics, which is one of the main processes that allows the high
biological diversity found in tropical forests (Tonhasca 2005). Rare and endemic bird
species with a strict frugivore diet are more abundant in primary tropical forests and may
be absent in secondary forests or disturbed areas (Aleixo 1999). Mature forests may also
hold high species richness of fruit-eating birds (Robinson and Terborgh 1997; Develey
2004) and present a different composition compared to disturbed areas (Ahmed et al.
2014). The same pattern for rare species was found in our study, with higher occurrence
of threatened frugivorous species (e.g. Aburria jacutinga, Triclaria malachitacea,
Selenidera maculirostris, Pteroglossus bailloni, Lipaugus lanioides) and high species
richness of fruit-eating birds in the control area, which has a vegetation structure that
closely resembles that of a primary tropical forest (Silva et al. 2017a). The high diversity
in the control area was also a result of the high equitability found in mature forests, as
pointed out by Tonhasca (2005).
Considering the different composition of mature and disturbed forests, areas near
road edges may have their total bird abundance and richness increased by the blend of
species from open and forested habitats (Ahmed et al. 2014; Yrjölä and Santaharju 2015),
as well as by the increase of their habitat heterogeneity (Helldin and Seiler 2003; Morelli
et al. 2014). These areas, intensely disturbed in space and time, may attract less specialist
species (Robinson and Terborgh 1997), as we found in the main road. Possibly, the
increase we verified in the total bird abundance, richness and diversity in the main road
plots occurred because this pathway crosses a highly preserved ecosystem (Aleixo 1999;
Bojorges-Baños and López-Mata 2006).
Species abundance near transportation structures may be reduced due to birds
withdrawing in response to motor vehicles’ noise (Reijnen et al. 1995; Wiacek et al.
2015). Intensive human use of forested areas for recreational purposes is also determinant
in reducing some bird species (Kangas et al. 2010; Wolf et al. 2013). Frequent and intense
human presence may scare birds away due to noise and human presence (Kangas et al.
2010).

127
Species substitution in a local scale is generated by changes in habitat conditions
and contributes to differences in fruit-eating bird species composition (Thiollay 2002;
Cohn-haft et al. 2012). Habitat loss for frugivores at road edges and touristic pathways is
a pattern evidenced in our study, in which we found low bird occurrence in areas with
intense human use (i.e., main road and trail). Despite the similarity in vegetation structure
between the trail and control area (Silva et al. 2017a), the first differed from the latter
with regard to bird abundance and richness, possibly as a result of the trail use in tourism
activities. Communities of temperate forest birds respond similarly to anthropic impacts
in forests in Australia and Finland (Kangas et al. 2010; Wolf et al. 2013), demonstrating
a generalization of avifauna responses to intense human presence. Likewise, the absence
of intensive human use in the secondary road allowed more frugivore species to occur in
this area, compared to the main road. The presence of typical forest species in the
secondary road (e.g. Carpornis cucullata, Brotogeris tirica and Pyrrhura frontalis) gave
this area a species composition more closely related to the control area, suggesting that
park managers should be careful about managing the use of pathways within protected
areas.
Frugivorous birds differ in their sensitiveness to vegetation composition according
to their fruit diet (Hasui et al. 2007). Changes in vegetation composition may influence
the predominance of dispersal syndromes, and consequently, fruit size and type (Jara-
Guerrero et al. 2011). We found a predominant production of small fruits (up to 14 mm
in diameter) for all areas, which represented more than 80% of the total zoochorous fruit
production. Fruit size is an important component that determines community abundance
and richness between frugivorous and omnivorous birds (Galetti et al. 2013). Plant
species with large diaspores may face constraints in seed dispersal as a result of the
absence of large frugivores. Conversely, plants with small-sized fruits can be dispersed
by a plethora of birds varying in size and diet (Galetti et al. 2013).
The low occurrence of large and rare frugivorous bird species in disturbed areas
may result in changes in plant population dynamics (Wolf et al. 2013; Jack et al. 2015;
Yrjölä and Santaharju 2015), with consequences to bird-plant interactions (Staggemeier
and Galetti 2007), and to the integrity of ecological processes (Leitão et al. 2016). Many
large-seeded plants may have a reduction in the dispersal and recruitment mechanisms
under low density of seed dispersers (Chapman and Chapman 1995). On the other hand,
an increase in the density of generalist small-sized bird species may favour the dispersal

128
of plant species with small-seeded fruits (Silva et al. 2002). Despite the high fruit
availability of the studied areas (Silva et al. 2017b), in the long term, a change in the
composition and functional role of seed dispersers, which can vary according to the type
of disturbance, could result in a sequential selection of plant species (Galetti et al. 2013).
Consequently, this process could spatially limit fruit availability for birds with varied diet
specializations (Cardoso da Silva and Tabarelli 2000).
Our study revealed the impact of pathways on the fruit-eating forest birds,
highlighted that habitat changes caused by pathways and heavily use may have
consequences for the conservation of frugivorous birds in the Atlantic Forest. As we
continuously lose forested areas and the primary forest remnants are increasingly
fragmented by pathways, it is very important to adequately manage the existing
infrastructure intersecting native vegetation, as well as to be cautious when implanting
new pathways. Anthropogenic impacts in mature forests usually leads to an increase in
the extinction of rare species, severely undermining the integrity of ecological processes
(Leitão et al. 2016). Since frugivores are extremely important in the maintenance,
functioning, and connectivity of ecosystems (McConkey et al. 2012; Díaz Vélez et al.
2015; Jordano 2016), we expect that the environmental disturbances caused by pathways
can affect seed dispersers in space and time, compromising the conservation and structure
of animal-plant interactions (Cardoso da Silva and Tabarelli 2000; Galetti et al. 2013;
Morellato et al. 2016)
References
Ahmed SE, Lees AC, Moura G, et al (2014) Road networks predict human influence on
Amazonian bird communities. Proc R Soc 281:20141742.
Akaike H (1974) A new look at the statistical model identification. IEEE Trans Autom
Control New York, NY 19:716–723.
Aleixo A (1999) Effects of selective logging on a bird community in the Brazilian
Atlantic Forest. Condor 101:537–548. doi: 10.2307/1370183
Aleixo A, Galetti M (1997) The conservation of the avifauna in a lowland Atlantic forest
in south-east Brazil. Bird Conserv Int 7:235–261. doi: 10.1017/S0959270900001556

129
Almeida-neto M, Campassi F, Galetti M, et al (2008) Vertebrate dispersal syndromes
along the Atlantic forest: Broad-scale patterns and macroecological correlates. Glob
Ecol Biogeogr 17:503–513. doi: 10.1111/j.1466-8238.2008.00386.x
Anderson MJ (2001) A new method for non-parametric multivariate analysis of variance.
Aust Ecol 26:32–46.
Bates D, Maechler M, Bolker B, Walker S (2015) Fitting Linear Mixed-Effects Models
Using lme4. J Stat Softw 67:1–48. doi: 10.18637/jss.v067.i01.
Benítez-lópez A, Alkemade R, Verweij PA (2010) The impacts of roads and other
infrastructure on mammal and bird populations : A meta-analysis. Biol Conserv
143:1307–1316. doi: 10.1016/j.biocon.2010.02.009
Bibby C, Burgess N, Hill D (1992) Bird census techniques. Orlando: Academic Press.
Blake JG (2007) Neotropical forest bird communities: a comparison of species richness
and composition at local and regional scales. Condor 109:237–255.
Bojorges-Baños JC, López-Mata L (2006) Asociación de la riqueza y diversidad de
especies de aves y estructura de la vegetación en una selva mediana subperennifolia
en el centro de Veracruz, México. Rev Mex Biodivers 77:235–249.
Brooks T, Tobias J, Balmford A (1999) Deforestation and bird extinctions in the Atlantic
forest. Anim Conserv 2:211–222. doi: 10.1017/S1367943099000542
Bruner AG, Gullison RE, Rice RE, Fonseca GAB (2001) Effectiveness of parks in
protecting tropical biodiversity. Science (80- ) 291:125–129.
Cardoso da Silva JM, Tabarelli M (2000) Tree species impoverishment and the future
flora of the Atlantic forest of northeast Brazil. Nature 404:72–74. doi:
10.1038/35003563
Chapman CA, Chapman LJ (1995) Survival without dispersers: Seedling recruitment
under parents. Conserv Biol 9:675–678. doi: 10.1046/j.1523-1739.1995.09030675.x
Cohn-haft M, Whittaker A, Stouffer PC (2012) A new look at the “Species-Poor” Central
Amazon: The avifauna north od Manaus, Brazil. Ornithol Monogr 205–235.
Couto-Santos APL do, Conceição AA, Funch LS (2015) The role of temporal scale in
linear edge effects on a submontane Atlantic forest arboreal community. Acta Bot

130
Brasilica 29:190–197. doi: 10.1590/0102-33062014abb3732
Crawley M (2007) Statistical Modelling. In: Crawley MJ. The R book. Jonh Wiley &
Sons.
Develey P (2004) Efeitos da fragmentação e do estado de conservação da floresta na
diversidade de aves de Mata Atlântica. PhD Dissertation. University of São Paulo,
São Paulo, Brasil.
Díaz Vélez MC, Silva WR, Pizo M a, Galetto L (2015) Movement patterns of frugivorous
birds promote functional connectivity among Chaco Serrano Woodland fragments
in Argentina. Biotropica 47:475–483. doi: 10.1111/btp.12233
Durigan G (2003) Métodos para análise de vegetação arbórea. In: Cullen Jr., L., Rudran,
R., Valladares-Padua, C. (Orgs.). Métodos de estudos em biologia da conservação e
manejo da vida silvestre. Editora UFPR, Curitiba. pp 455–479
Ferraz LPM, Varjabedian R (1999) Evolução histórica da implantação e síntese das
informações disponíveis sobre o Parque Estadual Carlos Botelho. Secretaria do Meio
Ambiente/Instituto Florestal, São Paulo
Forman RTT, Alexander LE (1998) Roads and their major ecological effects. Annu Rev
Ecol Syst 29:207–231. doi: 10.1146/annurev.ecolsys.29.1.207
Fournier LA (1974) Un método cuantitativo para la medición de características
fenológicas en árboles. Turrialba 24:422–423.
Frazer GW, Fournier RA, Trofymow JA, Hall RJ (2001) A comparison of digital and film
fisheye photography for analysis of forest canopy structure and gap light
transmission. Agric For Meteorol 109:249–263. doi: 10.1016/S0168-
1923(01)00274-X
Galetti M, Guevara R, Côrtes MC, et al (2013) Functional extinction of birds drives rapid
evolutionary changes in seed size. Science (80- ) 340:1086–1090. doi:
10.1126/science.1233774
Gascon C, Williamson GB, Fonseca GAB (2000) Receding forest edges and vanishing
reserves. Science (80- ) 288:1356–1358.
Hasui E, Gomes VSDM, Silva WR (2007) Effects of vegetaion traits on habitat

131
preferences of frugivorous birds in Atlantic rain forest. Biotropica 39:502–509.
Helldin JO, Seiler A (2003) Effects of roads on the abundance of birds in Swedish forest
and farmland. Iene 1–9.
Jack J, Rytwinski T, Fahrig L, Francis CM (2015) Influence of traffic mortality on forest
bird abundance. Biodivers Conserv 24:1507–1529. doi: 10.1007/s10531-015-0873-
0
Jara-Guerrero A, De la Cruz M, Méndez M (2011) Seed dispersal spectrum of woody
species in South Ecuadorian Dry Forests: environmental correlates and the effect of
considering species abundance. Biotropica 43:722–730. doi: 10.1111/j.1744-
7429.2011.00754.x
Jordano P (2016) Chasing Ecological Interactions. PLOS Biol 14:e1002559. doi:
10.1371/journal.pbio.1002559
Kangas K, Luoto M, Ihantola a., et al (2010) Recreation-induced changes in boreal bird
communities in protected areas. Ecol Appl 20:1775–1786. doi: 10.1890/09-0399.1
Kronka FJ., Nalon M., Matsukuma CK, et al (2005) Inventário florestal da vegetação
natural do Estado de São Paulo. Secretaria do Meio Ambiente/Instituto Florestal
Laurance SGW, Stouffer PC, Laurance WF (2004) Effects of road clearings on movement
patterns of understory rainforest birds in Central Amazonia. Conserv Biol 18:1099–
1109.
Laurance WF, Bierregaard JRO, Gascon C, et al (1997) Tropical forest fragmentation:
syntesis of a diverse and dynamic discipline. In: Tropical forest remnants: ecology,
management and conservation of fragmented communities (Laurance, W.F. and
Bierregaard, Jr.R.O., eds.). University of Chicago Press, Chicago, EUA. pp 502–514
Laurance WF, Clements GR, Sloan S, et al (2014) A global strategy for road building.
Nature 513:229–232. doi: 10.1038/nature13717
Laurance WF, Rankin-de Merona JM, Andrade A, et al (2003) Rain-forest fragmentation
and the phenology of Amazonian tree communities. J Trop Ecol 19:343–347. doi:
10.1017/S0266467403003389
Leitão RP, Zuanon J, Villéger S, et al (2016) Rare species contribute disproportionately

132
to the functional structure of species assemblages. Proc R Soc 283:20160084.
Malizia LR (2001) Seasonal fluctuations of birds, fruits, and flowers in a subtropical
forest of Argentina. Condor 103:45–61. doi: 10.1650/0010-
5422(2001)103[0045:SFOBFA]2.0.CO;2
Marsden SJ, Whiffin M, Galetti M, Fielding AH (2004) How well will Brazil’s system of
Atlantic forest reserves maintain viable bird populations? Biodivers Conserv
14:2835–2853. doi: 10.1007/s10531-004-0219-9
Martínez-Abraín A, Oro D, Jiménez J, et al (2010) A systematic review of the effects of
recreational activities on nesting birds of prey. Basic Appl Ecol 11:312–319. doi:
10.1016/j.baae.2009.12.011
McConkey KR, Prasad S, Corlett RT, et al (2012) Seed dispersal in changing landscapes.
Biol Conserv 146:1–13. doi: 10.1016/j.biocon.2011.09.018
Minchin PR (1987) An evaluation of the relative robustness of techniques for ecological
ordination. Vegetatio 69:89–107. doi: 10.1007/BF00038690
Morellato LPC, Alberton B, Alvarado ST, et al (2016) Linking plant phenology to
conservation biology. Biol Conserv 195:60–72. doi: 10.1016/j.biocon.2015.12.033
Morelli F, Beim M, Jerzak L, et al (2014) Can roads, railways and related structures have
positive effects on birds? - A review. Transp Res Part D Transp Environ 30:21–31.
doi: 10.1016/j.trd.2014.05.006
Myers N, Mittermeier R a., Mittermeier CG, et al (2000) Biodiversity hotspots for
conservation priorities. Nature 403:853–8. doi: 10.1038/35002501
Oksanen J, Blanchet FG, Friendly M, et al (2016) vegan: 2.4-0., Ecology Package. R
package version Https://CRAN.R-project.org/package=vegan.
Oliveira PRR, Alberts C, Francisco MR (2011) Impact of road clearings on the
movements of three understory insectivorous bird species in the Brazilian Atlantic
Forest. Biotropica 43:628–632.
Palmer MW (1993) Putting things in even better order: the advantages of canonical
correspondence analysis. Ecology 74:2215–2230.
Pearman P (2002) The scale of community structure: Habitat variation and avian guilds
133
in tropical forest understory. Ecol Monogr 72:93–126.
Piacentini V, Aleixo A, Agne C, et al (2015) Annotated checklist of the birds of Brazil
by the Brazilian Ornithological Records Committee / Lista comentada das aves do
Brasil pelo Comitê Brasileiro de Registros Ornitológicos. Rev Bras Ornitol 23:91–
298.
Poulin B, Gaëtan L, McNeil R (1994) Characteristics of feeding guilds and variation in
diets of bird species of tree adjacent tropical sites. Biotropica 26:187–197.
R Core Team (2016) R: A language and environment for statistical computing.R
Foundation for Statistical Computing, Vienna, Austria. http://www.R-project.org.
Rasband W (2015) ImageJ http://imagej.nih.gov/ij/index.html (accessed 7.8.15).
Reijnen R, Foppen R, Braak C, Thissen J (1995) The effects of car traffic on breeding
bird populations in woodland. III. Reduction of density in relation to the proximity
of main roads. J Appl Ecol 32:187–202. doi: 2
Reznik G, Pires JPDA, Freitas L (2012) Efeito de bordas lineares na fenologia de espécies
arbóreas zoocóricas em um remanescente de Mata Atlântica. Acta Bot Brasilica
26:65–73. doi: 10.1590/S0102-33062012000100008
Ribeiro MC, Martensen AC, Metzger JP, et al (2011) The Brazilian Atlantic Forest: a
shrinking biodiversity hotspot. In: Zachos FE, Habel JC (eds) Biodiversity hotspots:
distribution and protection of conservation priority areas. springer, pp 405–434
Robinson SK, Terborgh J (1997) Bird community dynamics along primary successional
gradients of an amazonian whitewater river. Ornithol Monogr 48:641–672. doi:
10.2307/40157559
Rodrigues E (1998) Edge effects on the regeneration of forest fragments in North Paraná.
PhD Thesis, Harvard University.
São Paulo (2014) Decreto no 60.133, de 7 de fevereiro de 2014 Declara as espécies da
fauna silvestre ameaçadas de extinção, as quase ameaçadas e as deficientes de dados
para avaliação no Estado de São Paulo e dá providências correlatas. Governo do
Estado de São Paulo.
Schonewald-Cox CM, Buechner M (1992) Park protection and public roads. In: P. L.

134
Fiedler e S. K. Jain (Eds), Conservation biology: The theory and practice of nature
conservation, and management. pp 373–396
Silva BG, Antunes AZ, Eston MR (2010) Local variation in bird communities
composition at Carlos Botelho State Park, São Miguel Arcanjo - SP, southeastern
Brazil and proposals for monitoring the impact of ecotourism. Rev do Inst Florest
22:215–232.
Silva BG, Castello ACD, Koch I, Silva WR (2017a) Pathways affect vegetation structure
and composition in the Atlantic Forest in southeastern Brazil. Acta Bot Brasilica
31:108–119. doi: 10.1590/0102-33062016abb0402
Silva BG, Koch I, Silva WR (2017b) Pathways influence fruit availability in the Atlantic
forest. Unpublish data.
Silva W, De Marco J, Hasui E, Gomes V (2002) Patterns of fruit-frugivore interactions
in two Atlantic Forest bird communities of southeastern Brazil: implications for
conservation. In: Levey DJ, Silva WR, Galetti M (eds.) Seed dispersal and frugivory:
ecology, evolution and conservation. Wallingford: CABI Publishing. pp 423–436
SMA (2008) Secretaria do Meio Ambiente do Estado de São Paulo. Plano de manejo do
Parque Estadual Carlos Botelho. http://fflorestal.sp.gov.br/planos-de-
manejo/planos-de-manejo-planos-concluidos/. Accessed 17 May 2016
SNUC NPAS (2000) Sistema Nacional de Unidades de Conservação da Natureza -
SNUC, lei no 9.985, de 18 de julho de 2000; decreto no 4.340, de 22 de agosto de
2002.
SOS - Mata Atântica (2015) Atlas da Mata Atlântica » SOS Mata Atlântica.
Staggemeier VG, Galetti M (2007) Impacto humano afeta negativamente a dispersão de
sementes de frutos ornitocóricos: uma perspectiva global. Rev Bras Ornitol 15:281–
287. doi: 10.1590/S1020-49892003000800012
Ter Braak CJF (1986) Canonical correspondence analysis: a new eigenvector technique
for multivariate direct gradient analysis. Ecology 67:1167–1179.
Thiollay J-M (2002) Avian diversity and distribution in French Guiana: patterns across a
large forest landscape. J Trop Ecol 18:471–498. doi: 10.1017/S026646740200233X

135
Tonhasca JA (2005) Ecologia e História Natural da Mata Atlântica. Editora Interciência.
Rio de Janeiro.
Van der Pijl (1982) Principles of Dispersal in Higher Plants.
Watson JEM, Whittaker RJ, Dawson TP (2004) Habitat structure and proximity to forest
edge affect the abundance and distribution of forest-dependent birds in tropical
coastal forests of southeastern Madagascar. Biol Conserv 120:315–331. doi:
10.1016/j.biocon.2004.03.004
Wiacek J, Polak M, Kucharczyk M, Bohatkiewicz J (2015) Landscape and urban planning
the influence of road traffic on birds during autumn period: implications for planning
and management of road network. Landsc Urban Plan 134:76–82. doi:
10.1016/j.landurbplan.2014.10.016
Wilman H, Belmaker J, Simpson J, et al (2014) EltonTraits 1.0: Species-level foraging
attributes of the world’s birds and mammals. Ecology 95:2027. doi: 10.1890/13-
1917.1
Wolf ID, Hagenloh G, Croft DB (2013) Vegetation moderates impacts of tourism usage
on bird communities along roads and hiking trails. J Environ Manage 129:224–234.
doi: 10.1016/j.jenvman.2013.07.017
Yrjölä RA, Santaharju JLM (2015) The impact of road construction on a community of
farmland birds the impact of road construction on a community of farmland birds.
Ann Zool Fennici 52:33–44.
Zar JH (1996) Biostatistical analysis. Prentice-Hall, Inc, London, UK.
Zuur A, Ieno E, Walker N, et al (2009) Mixed effects models and extensions in Ecology
with R. Springer Science. New York. USA.

136
Appendix. Number of fruit-eating birds recorded in the fixed-points in different types of
pathways at Carlos Botelho State Park, Brazil. Diet: F – Frugivores, O – Omnivores.
Status: CR – Critically endangered, VU – Vulnerable, NT – Near threatened.
Fruit-eating birds Diet Status Main
road
Secondary
road Trail Control
Galliformes
Cracidae
Penelope obscura Temminck, 1815 F 0 0 0 1
Aburria jacutinga (Spix, 1825) F CR 0 0 0 4
Columbiformes
Columbidae
Patagioenas picazuro (Temminck,
1813) F 5 31 1 22
Patagioenas plumbea (Vieillot, 1818) F 3 8 0 35
Psittaciformes
Psittacidae
Pyrrhura frontalis (Vieillot, 1817) F 37 88 27 99
Forpus xanthopterygius (Spix, 1824) F 0 0 0 15
Brotogeris tirica (Gmelin, 1788) F 3 24 7 13
Pionopsitta pileata (Scopoli, 1769) F 7 30 29 56
Pionus maximiliani (Kuhl, 1820) F 15 34 25 79
Triclaria malachitacea (Spix, 1824) F VU 0 2 7 14
Trogoniformes
Trogonidae
Trogon viridis Linnaeus, 1766 O 2 0 1 10
Trogon surrucura Vieillot, 1817 O 31 36 36 90
Trogon rufus Gmelin, 1788 O 10 17 13 37
Coraciiformes
Momotidae
Baryphthengus ruficapillus (Vieillot,
1818) O 0 3 2 4
Piciformes
Ramphastidae
Ramphastos dicolorus Linnaeus, 1766 F 17 13 11 38
Selenidera maculirostris
(Lichtenstein, 1823) F VU 0 0 0 8
Pteroglossus bailloni (Vieillot, 1819) F VU 0 0 0 5
Passeriformes
Tyrannidae
Mionectes rufiventris Cabanis, 1846 O 9 0 6 4
Tyranniscus burmeisteri (Cabanis &
Heine, 1859) O 0 2 0 11
Phyllomyias fasciatus (Thunberg,
1822) O 0 0 0 5
Phyllomyias griseocapilla Sclater,
1862 O 7 0 11 10

137
Camptostoma obsoletum (Temminck,
1824) O 33 14 7 9
Legatus leucophaius (Vieillot, 1818) O 9 2 0 0
Myiozetetes similis (Spix, 1825) O 4 3 0 0
Pitangus sulphuratus (Linnaeus,
1766) O 37 0 0 0
Conopias trivirgatus (Wied, 1831) O 0 2 0 0
Myiodynastes maculatus (Statius
Muller, 1776) O 8 0 0 4
Megarynchus pitangua (Linnaeus,
1766) O 4 0 0 0
Empidonomus varius (Vieillot, 1818) O 5 2 0 0
Sirystes sibilator (Vieillot, 1818) O 5 0 0 6
Myiarchus swainsoni Cabanis &
Heine, 1859 O 20 18 13 24
Attila rufus (Vieillot, 1819) O 16 20 6 40
Cotingidae
Carpornis cucullata (Swainson, 1821) F 8 126 36 180
Procnias nudicollis (Vieillot, 1817) F VU 41 70 43 92
Lipaugus lanioides (Lesson, 1844) F VU 0 0 0 3
Pyroderus scutatus (Shaw, 1792) F VU 26 9 7 60
Pipridae
Neopelma chrysolophum Pinto, 1944 O 4 2 0 0
Ilicura militaris (Shaw & Nodder,
1809) O 0 4 0 2
Chiroxiphia caudata (Shaw &
Nodder, 1793) O 142 127 106 128
Oxyruncidae
Oxyruncus cristatus Swainson, 1821 O 8 2 0 6
Tityridae
Schiffornis virescens (Lafresnaye,
1838) O 162 118 54 71
Tityra inquisitor (Lichtenstein, 1823) O 0 1 5 2
Tityra cayana (Linnaeus, 1766) O 0 0 2 0
Pachyramphus castaneus (Jardine &
Selby, 1827) O 0 0 2 4
Pachyramphus polychopterus
(Vieillot, 1818) O 0 0 0 4
Pachyramphus validus (Lichtenstein,
1823) O 7 0 4 4
Vireonidae
Cyclarhis gujanensis (Gmelin, 1789) O 22 10 19 29
Vireo olivaceus (Linnaeus, 1766) O 64 12 62 57
Hylophilus poicilotis Temminck, 1822 O 132 38 43 67
Turdidae
Turdus flavipes Vieillot, 1818 O 16 18 22 36
Turdus rufiventris Vieillot, 1818 O 8 7 6 0
Turdus leucomelas Vieillot, 1818 O 5 0 0 0

138
Turdus amaurochalinus Cabanis,
1850 O 5 0 0 0
Turdus albicollis Vieillot, 1818 O 67 48 44 84
Mitrospingidae
Orthogonys chloricterus (Vieillot,
1819) O 4 2 0 4
Thraupidae
Saltator similis d'Orbigny &
Lafresnaye, 1837 O 4 0 2 0
Orchesticus abeillei (Lesson, 1839) O 6 3 0 0
Cissopis leverianus (Gmelin, 1788) O NT 0 4 0 0
Trichothraupis melanops (Vieillot,
1818) O 8 10 4 0
Tachyphonus coronatus (Vieillot,
1822) O 16 2 2 5
Tangara sayaca (Linnaeus, 1766) O 8 9 5 0
Tangara cyanoptera (Vieillot, 1817) O 16 13 9 12
Tangara ornata (Sparrman, 1789) O 3 7 2 13
Tangara palmarum (Wied, 1823) O 5 3 0 0
Pipraeidea melanonota (Vieillot,
1819) O 4 0 0 5
Tangara seledon (Statius Muller,
1776) O 18 9 0 8
Tangara cyanocephala (Statius
Muller, 1776) O 22 17 4 9
Tangara desmaresti (Vieillot, 1819) O 19 6 0 7
Tangara cayana (Linnaeus, 1766) O 0 0 0 4
Tersina viridis (Illiger, 1811) O 11 2 0 0
Dacnis cayana (Linnaeus, 1766) O 5 0 2 3
Hemithraupis ruficapilla (Vieillot,
1818) O 16 4 4 5
Cardinalidae
Habia rubica (Vieillot, 1817) O 27 0 45 27
Parulidae
Setophaga pitiayumi (Vieillot, 1817) O 103 13 41 49
Icteridae
Cacicus chrysopterus (Vigors, 1825) O 17 8 2 12
Icterus pyrrhopterus (Vieillot, 1819) O 5 0 0 0
Fringillidae
Euphonia chlorotica (Linnaeus, 1766) O 0 2 0 5
Euphonia violacea (Linnaeus, 1758) O 0 3 0 4
Euphonia chalybea (Mikan, 1825) O VU 0 3 0 4
Euphonia pectoralis (Latham, 1801) O 4 2 3 0

139
CAPÍTULO IV – Impactos causados por vias de uso intensivo sobre a flora e a fauna
do Parque Estadual Carlos Botelho: implicações e estratégias para a conservação
A vegetação de Mata Atlântica, que originalmente cobria mais de 1,5 milhões de
km2 ao longo da área costeira do Brasil oriental, foi submetida a um processo gradual de
destruição nos últimos 500 anos e hoje cerca de 83% de sua área remanescente consiste
de fragmentos com menos de 50 ha, sendo que somente 0,03% são maiores que 10.000
ha (Ribeiro et al. 2011). A maior parte desses remanescentes localiza-se no interior de
Unidades de Conservação (UCs), que têm como principal objetivo a conservação da
natureza (SNUC 2000; SOS - Mata Atântica 2015). No entanto, muitas das UCs no Brasil
são intersectadas por infraestruturas de transporte, como rodovias e trilhas (MMA 2000),
o que gera uma série de impactos no habitat (Machlis and Neumann 1986; Schonewald-
Cox and Buechner 1992). Apesar desses impactos, a regulamentação de vias que cortam
as áreas protegidas, e o manejo adequado, podem fomentar o turismo e criar
oportunidades para a economia local (Dourojeanni 2003).
As “Estrada Parque”, propostas a partir do Plano do Sistema de Unidades de
Conservação do Brasil, II Etapa (Padua et al. 1982), que precederam o atual SNUC
(SNUC 2000), são definidas como uma “unidade de conservação linear de alto valor
educativo, cultural e recreativo que visa proteger a paisagem ao longo das vias de
acesso, cujos limites são estabelecidos com vistas à proteção de suas características e
mantidos em estado natural ou semi-natural, evitando-se intervenções que desfigurem a
estética da paisagem”. No entanto, essa definição não tem o objetivo primário de
conservar, mas sim de proteger paisagens e belezas cênicas vistas da estrada, o que resulta
na demanda de estratégias de manejo conciliatórias entre a destinação à proteção da
biodiversidade proposta pelas UCs de proteção integral (SNUC 2000) e o uso das Estradas
Parque (Dourojeanni 2003). Adicionalmente, outras vias de transporte, como as trilhas
em UCs, também existem em apoio às funções de acesso, educação ambiental e
ecoturismo, e são consideradas como uma necessidade em parques. Exigem, entretanto,
manutenção e proteção. À medida em que as condições de funcionalidade e o controle do
impacto dessas vias são mantidos, é possível alcançar a sustentabilidade das atividades
desenvolvidas nesse recurso (Griswold 1995).
Apesar de já existirem alguns indicadores de impactos de clareiras lineares, como
vias, em florestas tropicais (Forman e Alexander, 1998; Goosem, 1997), os impactos

140
podem ser distintos dependendo do tipo de clareira linear, como estradas, rodovias, linhas
de alta tensão, gasodutos, trilhas, ou mesmo as de origem natural, como rios. Além disso,
a formação vegetacional em que está inserida, como florestas estacionais ou ombrófilas,
deve ser considerada (Gressler 2010; Kangas et al. 2010; Reznik et al. 2012; Ahmed et
al. 2014; Prieto et al. 2014; Couto-Santos et al. 2015). Assim, para uma compreensão
efetiva dos impactos de estradas na Mata Atlântica é importante associar a caracterização
detalhada das vias que atravessam as formações florestais e realizar diagnósticos de seus
impactos locais, considerando a grande heterogeneidade gerada por sua extensão
latitudinal (3 S a 30 S) e longitudinal (35W a 60W), a variação altitudinal (0–2900 m) e
os gradientes de solo e clima (por exemplo, precipitação 1000-4200 mm anuais) (Ribeiro
et al. 2011).
As implicações dos impactos devem ser discutidas para terem seus efeitos
monitorados e, muitas vezes, manejados (Blockhus et al. 1992; Spellerberg 1994). As
informações locais melhoram o direcionamento das ações de conservação, além de
contribuírem com as decisões de implantação de futuras vias de transporte em meio às
florestas. Nesse contexto, é apresentado o diagnóstico dos impactos gerados na flora e em
alguns grupos da fauna por duas vias de uso intensivo em meio ao Parque Estadual Carlos
Botelho – Núcleo São Miguel Arcanjo - Unidade de Conservação da Mata Atlântica, e de
suas implicações para conservação. Além disso, são sugeridas estratégias de manejo
aplicáveis no contexto local do Parque.
O Parque Estadual Carlos Botelho e suas vias de uso intensivo
O Parque Estadual Carlos Botelho (PECB) é uma unidade de conservação (UC)
de proteção integral (São Paulo, 1982), que se localiza na região sudeste do Brasil (Figura
1). Ocupa uma área de 37.644,36 ha, distribuída pelos municípios de Capão Bonito, São
Miguel Arcanjo, Sete Barras e Tapiraí. A amplitude altitudinal na área do PECB vai de
20 a 1000 m. A temperatura média anual varia entre 18º e 20ºC e a pluviosidade anual
entre 1500 e 2200 mm. A vegetação predominante é a Floresta Ombrófila Densa (Ferraz
e Varjabedian, 1999; Kronka et al., 2005). O PECB conta com dois núcleos com estrutura
para visitação pública, um localizado no município de São Miguel Arcanjo a cerca de
800m de altitude e outro no município de Sete Barras a cerca de 95m de altitude (Figura
1).

141
Figura 1. Localizacao do Parque Estadual “Carlos Botelho”, estado de Sao Paulo, sudeste
do Brasil.
O PECB possui em seu interior um sistema de trilhas regulamentadas destinadas
ao ecoturismo, que possui cerca de 45 km de extensão em sua totalidade (SMA 2008). O
Parque recebe cerca de 14.000 visitantes anualmente, que desfrutam de diversos atrativos
turísticos conectados por esse sistema de trilhas (SMA 2008). Além disso, a rodovia SP-
139 atravessa a extensão territorial do PECB por 33 km, dividindo a área do parque em
dois fragmentos e ligando os dois núcleos da UC. Esse trecho da rodovia no PECB é
localmente conhecido como Serra da Macaca e foi decretado uma Estrada Parque,
inaugurada em 22 de novembro de 2015 (São Paulo 2008). Segundo o Plano de manejo
do PECB, na região do Núcleo São Miguel Arcanjo o parque conta com dois trajetos
caracterizados como de uso intensivo: o sistema de trilhas destinadas à visitação pública
e a Estrada Parque Serra da Macaca (EPSM) (SMA 2008).
Trilha
A trilha Represa-Fornos é um dos trechos do sistema de trilhas do PECB e possui
uma extensão de cerca de 4,5 km com aproximadamente 2 m de largura. O dossel é
conectado na maior parte da extensão da trilha (Figura 2 A). Dados históricos indicam
que a trilha foi aberta durante um período extrativista (próximo à década de 40), anterior
à criação do Parque (1982), para viabilizar a retirada de madeira e produção de carvão.
Ainda hoje são encontradas ruínas de cinco fornos de carvão ao longo do percurso da

142
trilha, que se tornaram um atrativo histórico-cultural. A trilha é percorrida por visitantes
acompanhados por monitor, podendo ser percorrida diversas vezes no mesmo dia. A trilha
Represa-Fornos é a mais utilizada para o ecoturismo no Parque, quando comparada aos
demais pontos turísticos que necessitam de monitoria (SMA 2008).
O Parque recebe muitas excursões com grupos que podem alcançar 50 pessoas,
sendo o percurso da trilha realizado por subgrupos de até 15 pessoas. Em períodos de alta
visitação transitam pela trilha cerca de 50 pessoas por dia. O tempo de duração do
percurso para cada grupo é de aproximadamente 3,5 h. Segundo o Plano de Manejo do
PECB, o grau de visitação para essa via é considerado entre mediano e alto e os cuidados
de manutenção e de infraestrutura são intensos, principalmente em corrimãos, pontes,
escadarias simples e área de pisoteio (SMA 2008).
A estrutura da vegetação da trilha Represa-Fornos é similar à estrutura de uma
floresta madura sem uso antrópico (Capítulo 1), mas, apesar de se tratar de uma clareira
linear estreita (2m de largura) houve sazonalidade na produção de frutos e esta
sazonalidade foi verificada até pelo menos 35 m da borda. Nos arredores da trilha
ocorreram picos na produção de frutos para fauna ao longo do tempo, com baixa produção
principalmente nos meses de janeiro e fevereiro. Na floresta madura, distante de trajetos,
a oferta de frutos para a fauna se manteve estável ao longo do ano (Capítulo 2).
A sensibilidade das espécies de aves ao distúrbio do habitat é relacionada à
especialidade na dieta, ou seja, espécies com dietas mais restritivas, como por exemplo
os frugívoros, tipicamente ocupam áreas com baixo impacto antrópico (Aleixo 1999;
Hasui et al. 2007). Isso pode ser verificado na área de Carlos Botelho pela menor
abundância e riqueza de aves frugívoras ao longo da trilha em relação a uma área de
floresta sem uso antrópico e com estrutura de vegetação semelhante (Capítulo 3). Embora
a disponibilidade temporal de frutos seja importante para a manutenção da fauna
frugívora, o uso intensivo da trilha também foi detectado como um fator prejudicial à
permanência da avifauna nas imediações dessa via (Capítulo 3). Quando comparados os
dados verificados nesta trilha com aqueles obtidos em uma via mais larga (10m) sem uso
antrópico intensivo, na mesma região do parque, com tempo de abertura da clareira linear
semelhante, e que apresenta vegetação alterada pelo efeito de borda e picos na produção
de frutos (Capítulos 1 e 2), registrou-se uma maior abundância de aves frugívoras
(Capítulo 3). Isso indica que as aves podem estar deixando de utilizar o entorno da trilha

143
devido ao uso antrópico intenso e não por alterações na estrutura do habitat e oferta de
recursos.
Estrada Parque
A Serra da Macaca interliga o planalto com a planície costeira. A estrada foi
construída por volta de 1937, anterior à criação do Parque (1982), e possui 112 km,
atravessando o PECB num trecho de 33 km, onde se apresenta com cerca de 20 m de
largura, incluindo o acostamento. É uma rodovia (SP-139) homogênea quanto à largura e
com dossel completamente aberto (Figura 2 B e C). Na estrada circulam veículos de
passeio, caminhões, motocicletas, caminhonetes, ônibus, bicicletas, cavalos e
caminhantes. A estrada não era considerada oficialmente uma Estrada Parque até o ano
de 2015, ano em que o trecho que corta o PECB, que consistia em uma estrada de terra
(Figura 2 B), foi pavimentado com bloquetes de concreto - uma tecnologia intermediária
entre asfalto e terra. Naquele ano foi então inaugurada oficialmente a Estrada Parque
Serra da Macaca (Figura 2 C).
O fluxo de circulação na Estrada Parque antes da pavimentação era de, em média,
6.000 veículos por mês, podendo alcançar cerca de 10.000 veículos por mês entre
dezembro e janeiro. Esse fluxo era limitado pelas condições de manutenção do leito, que
apresentava muitos buracos, além de trechos com formação de lama. Após a
pavimentação, a estrada teve seu fluxo aumentado pela melhora nas condições da via,
passando para uma média de 12.200 veículos por mês, atingindo 20.000 veículos por mês
entre dezembro e janeiro (t = -3.29, df = 13, p = 0,005). As atividades de manutenção são
responsabilidade do Departamento de Estradas de Rodagem, que as realiza
periodicamente. Essas atividades incluem conservação do leito e intervenção nas
encostas, buscando evitar desmoronamentos (SMA 2008).
No momento da implementação de uma Estrada Parque, os órgãos gestores que
articulam essa implantação devem contar com um plano de mitigação. Neste plano devem
constar medidas como a implantação de redutores de velocidade e de passagens
superiores e subterrâneas de fauna. No entanto, a inauguração Estrada Parque Serra da
Macaca ocorreu sem a implantação imediata dos redutores de velocidade, sinalização
adequada e atividades de monitoramento, contando apenas com 16 passagens superiores
de fauna em sistema de cordas. A Estrada Parque conta com oito pontes, e as margens
dos cursos d’agua sob essas infraestruturas foram consideradas como utilizaveis pela

144
fauna para transpor a barreira imposta pela presença da estrada, não tendo sido
implantadas passagens subterrâneas específicas para fauna. O funcionamento da Estrada
é restrito ao período diurno, com tráfego liberado apenas entre 06h e 20h, e esse uso
restrito colabora para a conservação.
A estrutura e a composição da vegetação nas imediações da EPSM são afetadas
pela presença dessa clareira linear (20 m de largura), até uma distância de pelo menos 35
m da borda (Capítulo 1). A altura e o diâmetro do tronco das árvores são reduzidos, há
uma alta densidade de lianas e uma alta proporção de espécies pioneiras com dispersão
anemocórica (Capítulo 1). Além disso, nas bordas são registradas espécies de plantas
exóticas como Urochloa sp. (=Brachiaria sp.), Citrus x limon (L.) Osbeck (limão),
Eucalyptus sp. (eucalipto) e Musa balbisiana Colla (banana). A produção de frutos
dispersos por animais é reduzida nas bordas da Estrada Parque e desigual ao longo do
tempo, quando comparada com as áreas de interior de floresta (Capítulo 2).
A ocorrência de aves frugívoras de grande porte nas imediações da estrada foi
reduzida, provavelmente por afugentamento decorrente do uso intensivo, pela alteração
do habitat e pela redução na oferta de frutos carnosos nas bordas (Capítulo 3). Ao longo
da estrada verificou-se riqueza e abundância baixas para frugívoros grandes e altas para
onívoros de pequeno porte, o que resultou em uma composição da comunidade de aves
bastante diferenciada nas imediações da estrada quando comparada com as vias sem uso
intensivo e com áreas no interior da floresta (Capítulo 3).
A EPSM atua como barreira para alguns grupos de animais, como aves e
mamíferos (Talebi, 2005; Oliveira et al., 2011). Espécies de aves de sub-bosque sensíveis
à perturbação do habitat, como Chamaeza campanisona (tovaca-campainha), nunca
cruzam a estrada, mesmo quando estimuladas por playback a partir da borda oposta
(Oliveira et al. 2011). Além disso, não há registros de indivíduos de Brachyteles
arachnoides (muriqui-do-sul), uma espécie de primata ameaçada de extinção, cruzando a
Estrada Parque (Talebi, 2005; SMA, 2008).
Os registros de atropelamentos de fauna, realizados antes da pavimentação,
apontam os invertebrados como o principal grupo atingido, seguido pelos répteis, anfíbios
e pequenos mamíferos (Fogaça et al., Unpub.). No caso das espécies noturnas, como
besouros e mariposas, a presença da EPSM associada à atração pelas lâmpadas dos faróis
dos automóveis pode ter um impacto considerável sobre espécies locais raras, como o

145
escaravelho Megasoma gyas (Antunes et al. 2007). No entanto, há também, registros de
atropelamento de grandes mamíferos, como Tapirus terrestris (anta) e Mazama bororo
(veado-mateiro) (Gestão PECB, comunicação pessoal).
Figura 2. Vias em meio ao Parque Estadual “Carlos Botelho”, Estado de Sao Paulo,
sudeste do Brasil. A. Trilha destinada ao ecoturismo, trecho Represa-Fornos; B. Estrada
Parque Serra da Macaca anterior à pavimentação; C. Estrada Parque Serra da Macaca
após a pavimentação.
Implicações para a conservação
Ao considerar o contexto de implantação das vias, anteriores à criação do PECB,
é importante pontuar que a criação dessa unidade de conservação impediu que as bordas
das vias fossem aumentadas, e consequentemente, que houvesse aumento da
fragmentação e dos impactos descritos acima.
Considerando, entretanto, os impactos destas vias após a implantação do PECB,
as mudanças na vegetação implicam na perda de espécies típicas de florestas maduras e
alterações no habitat utilizado pela fauna (Capítulo 1; Couto-Santos et al., 2015), e as
alterações na disponibilidade de frutos carnosos influenciam o uso da área para
forrageamento por animais frugívoros (Capítulo 2 e 3; Reznik et al., 2012). O
afugentamento das aves que ocorre próximo aos trajetos resulta também na redução de
locais adequados para a construção de seus ninhos, recursos necessários para a
manutenção de suas populações (Kangas et al. 2010; Wiacek et al. 2015). A perda de

146
indivíduos da fauna por atropelamento na EPSM e a interrupção do fluxo de indivíduos
entre os dois fragmentos do Parque que são divididos pela Estrada podem acarretar uma
redução nas populações do PECB (Primack e Rodrigues, 2001; SMA, 2008). O
isolamento das populações pela presença da barreira linear e consequente redução na
dispersão de indivíduos entre ambos os lados da estrada pode gerar perdas de
variabilidade genética com o tempo, contribuindo para o declínio populacional (Young et
al. 1996; Keller e Largiade 2003).
Considerando que alguns grupos faunísticos podem deixar de utilizar as
imediações das vias de uso intensivo como área de forrageio e reprodução, ficando mais
restritos às regiões distantes das bordas e das áreas de uso antrópico, pode ocorrer uma
perda de espécies sensíveis e de diversidade, tendo implicações para a conservação das
populações (Helldin and Seiler 2003; Kangas et al. 2010; Wiacek et al. 2015).
Adicionalmente, processos ecológicos importantes também podem ser perdidos,
envolvendo alterações na estrutura da vegetação, fenologia de plantas e conservação das
interações planta-animal (Morellato et al. 2016) e a ocorrência de extinções locais ou
funcionais (Galetti et al. 2013; Leitão et al. 2016).
Para avaliar as implicações destas vias para a conservação, caso permaneçam com
suas características atuais, é importante considerarmos a extensão das mesmas (Trilha
Represa-Fornos - 4,5 km e Estrada Parque Serra da Macaca – 33 km), e os efeitos
diagnosticados até 35 m de distância da borda. A partir destes dados estima-se que ao
menos 1.312.500 m2 ou 131 ha de floresta estão sob efeito dos impactos gerados pela
presença e uso intensivo dessas vias. Estes efeitos podem ser ainda mais impactantes e
alcançar até 400 metros de distância em direção ao interior, como demonstrado para
efeitos de borda na Amazônia (Laurance et al. 1997). Além disso, os impactos descritos
foram detectados por estudos realizados em período anterior à pavimentação da Estrada
Parque e poderão ser intensificados devido ao aumento do fluxo de veículos na Estrada
Parque, que ocorreu após a pavimentação. Os padrões ecológicos detectados nas vias do
PECB provavelmente irão se manter ao longo do tempo, considerando que são clareiras
antrópicas permanentes, o que aponta para a necessidade de implementar estratégias de
manejo visando minimizar seus impactos.

147
Estratégias de conservação
As estratégias de manejo para conservação devem buscar o envolvimento das
comunidades humanas da região e gerar subsídios para os programas de educação
ambiental das áreas protegidas (Padua et al. 2012). As atividades de monitoramento nas
vias devem ser desenvolvidas de forma participativa, com treinamento e envolvimento
das comunidades locais e monitores ambientais, que percorrem as trilhas e atrativos da
UC diariamente, e de pesquisadores-colaboradores que podem fornecer apoio técnico-
científico com a transmissão de dados de interesse ao setor de pesquisa científica da
gestão. Algumas estratégias de manejo aplicáveis no contexto local do Parque são
descritas a seguir.
Redução de acidentes e do afugentamento da fauna
Controle do número de visitantes e direcionamento de fluxo nas trilhas
Primeiramente é importante lembrar que o uso intensivo de trilhas não deve se
estender para áreas mais centrais da UC, conforme recomendações da Secretaria do Meio
Ambiente e que o zoneamento delineado do plano de manejo seja rigorosamente
respeitado (SMA 2008), para evitar a ampliação dos impactos já verificados. O
direcionamento do fluxo de visitantes aos trechos de trilha mais próximos às regiões de
borda pode auxiliar na redução do afugentamento da fauna, uma vez que as espécies da
fauna que são mais sensíveis costumam deixar de utilizar essas áreas pela simples
alteração do habitat devido ao efeito de borda (DeWalt et al. 2003; Watson et al. 2004).
Controle do fluxo e sinalização na Estrada Parque
Uma característica mitigadora da Estrada Parque Serra da Macaca é seu horário
de funcionamento restrito ao período diurno, o que reduz o impacto do uso intensivo,
principalmente em populações da fauna que possuem hábito noturno. Além disso,
sugerimos a implantação de um posto de controle com pedágio e sinalização massiva com
informações sobre as características de fauna e flora local e indicação da passagem de
animais. Sugerimos também a construção de quebra-molas, instalação de radares e a
proibição do trânsito de caminhões, como indicado para estradas nessa categoria
(Dourojeanni 2003). Com o apoio e concordância das partes envolvidas na instalação de
um pedágio, este poderá, além de restringir o trânsito, trazer recursos para a implantação

148
e manutenção de estruturas e para a contratação de pessoas que auxiliarão nas ações para
reduzir os impactos nas biotas locais (Dourojeanni 2003). Adicionalmente, deve haver a
manutenção constante da sinalização, a presença de patrulhas policiais e um plano de
contingência para acidentes com cargas perigosas.
Implantação de passagens de fauna na Estrada Parque
Sugerimos a construção de passagens de fauna na forma de viaduto vegetado sobre
o pavimento em pontos estratégicos indicados através de dados gerados pelo
monitoramento de atropelamentos ao longo do trecho da estrada (Figura 3 A). As
passagens devem contar com barreiras nas bordas, tais como alambrados, direcionando
os animais para os pontos de conexão. Outro tipo de passagem, mais comumente
utilizada, é a de pontes de cordas como as já instaladas ao longo da EPSM (Figura 3 B)
(Teixeira et al. 2013). Consideramos, entretanto, que estas estão em baixo número e que
apenas algumas espécies conseguem utilizar essas pontes de cordas para cruzar as
estradas, ao passo que a implantação de viadutos vegetados gera a continuidade da
vegetação e facilita o fluxo de indivíduos de espécies que não cruzam áreas abertas, o que
seria uma vantagem na conexão entre os dois fragmentos do PECB.
A implantação das passagens de fauna deve considerar que as populações podem
usar a paisagem de maneira distinta ao longo do ano em resposta à disponibilidade de
recursos, gerando mudanças nos pontos de travessia da estrada ao longo do tempo
(Vanthomme et al. 2015). Estudos de modelagem de movimento considerando as espécies
e épocas específicas podem embasar a implantação destas passagens, buscando garantir
a conectividade da paisagem em longo prazo (Vanthomme et al. 2015). A instalação
dessas estruturas de conexão deve ser seguida de um monitoramento sistemático, visando
à avaliação de seu uso e efetividade e a geração de informações para seu manejo.

149
Figura 3. Medidas mitigadoras para conexão da vida selvagem em paisagem fragmentada
por estradas. A. Viaduto vegetado construído para passagem da vida selvagem em
Montana, USA. B. Ponte de cordas para passagem de fauna, Estrada Parque Serra da
Macaca, Parque Estadual Carlos Botelho, Brasil.
Envolvimento da comunidade e educação ambiental
Uso direcionado ao ecoturismo
Pelo funcionamento atual da EPSM ela opera mais como uma rota entre o interior
e o litoral do que como uma Unidade de Conservação Linear. Sugerimos que esta opere
também como uma trilha contemplativa e interpretada a ser percorrida em veículos
adaptados para esta atividade. Os veículos poderão ser oferecidos pela própria unidade
ou por agências de turismo e educação locais autorizados, e os visitantes deverão ser
acompanhados por monitores ambientais que podem explorar assuntos ligados à
conservação da Mata Atlântica durante o trajeto. O desenvolvimento de atividades como
essa é uma opção interessante de lazer até mesmo para quem usa a estrada atualmente
apenas como rota de passagem. O fato da EPSM interligar dois núcleos de atendimento à
visitação pública (nos municípios de São Miguel Arcanjo e de Sete Barras) pode facilitar
a logística e manejo da visitação. Com esse tipo de operação a Estrada atenderia aos
objetivos de proteger paisagens e belezas cênicas e de fomentar o turismo controlado e a
educação ambiental, mantendo ao mesmo tempo a integridade do ecossistema em
questão.
Educação Ambiental
150
Incentivamos também a adequação dos programas de educação ambiental já
realizados pela UC ao tema dos impactos gerados pelas estradas e trilhas e principalmente
pelo seu uso. É possível incorporar o assunto dos impactos gerados por essas vias nos
programas de educação ambiental realizados com os visitantes do PECB. Esse mesmo
trabalho pode ser realizado com os usuários da Estrada Parque que, dada a sua categoria
de estrada, permite a intervenção para a realização de trabalhos de educação ambiental.
Para as trilhas indicamos a transmissão oral das informações em atividades educacionais
dinâmicas que abordem, por exemplo, a redução dos ruídos durante o passeio. E para a
EPSM sugerimos a intervenção dos mediadores que se encontram nos portais de entrada
da estrada, que podem transmitir informações de cuidados a serem tomados durante o
trajeto pela via e distribuir panfletos ou “folders” educativos sobre a presença da fauna
na Estrada, seguindo o exemplo do “Guia de aves da Serra da Macaca” (Apendice).
Monitoramento
Monitoramento da fauna para avaliação dos impactos ao longo do tempo
Sugerimos utilizar um grupo bem conhecido e relativamente fácil de amostrar
como indicador nas atividades de monitoramento. As aves destacam-se para a inclusão
em programas como esse por se encaixarem nesses requisitos quando comparadas a
outros grupos de animais (Bispo et al. 2016). A abundância relativa e a densidade de aves
podem indicar a qualidade do habitat e a efetividade das ações de manejo das
infraestruturas (SMA, 2008). A amostragem das espécies de aves pode ser concentrada
nos meses de sua maior atividade reprodutiva, de setembro a fevereiro, quando a detecção
é favorecida. E levando-se em conta as condições locais, a abordagem mais adequada
para a avaliação do impacto do uso público sobre a avifauna em cada uma das vias é o
monitoramento da presença e abundância relativa de algumas espécies através de método
de “ponto fixo” conforme protocolo proposto por Bispo et al. (2016) para unidades de
conservação em formações de Cerrado, Mata Atlântica e Amazônia. O protocolo propõe
a adoção de estações de monitoramento constituídas por 12 pontos fixos com uma
distância mínima de 200 metros entre eles e raio de detecção máximo de 50 metros (Bispo
et al. 2016). Para amostrar as variações altitudinais e climáticas que existem ao longo da
EPSM sugere-se a implementação de uma estação de monitoramento a cada 10 km de
extensão da via, enquanto que para a trilha Represa-Fornos uma estação seria suficiente.

151
As espécies de aves mais indicadas para esta finalidade são alguns frugívoros de
grande porte já amostrados no parque (Capítulo 3), como: Aburria jacutinga (jacutinga),
Penelope obscura (jacuaçu), Ramphastos dicolorus (tucano-de-bico-verde), Selenidera
maculirostris (araçari-poca), Carpornis cucullata (corocochó), Procnias nudicolis
(araponga), Pyroderus scutatus (pavó) e Triclaria malachitacea (sabiá-cica). Estas são
espécies de fácil visualização (Apêndice), ou com vocalizações bem conspícuas,
possibilitando seu registro por parte dos monitores ambientais e demais pesquisadores da
UC. São espécies sensíveis a perturbações e associadas a habitats mais preservados,
respondendo negativamente à presença de impactos antrópicos.
Outros dados importantes para o monitoramento da fauna são provenientes do
inventario dos atropelamentos na Estrada Parque, abrangendo invertebrados e
vertebrados. Esse monitoramento pode orientar a colocação das placas de advertência nos
locais de travessia, estes locais podem mudar de acordo com a variação temporal na
disponibilidade de recursos para fauna, que pode alterar suas rotas na paisagem, assim as
placas de advertência também devem ser alteradas em determinadas épocas do ano
(Vanthomme et al. 2015). Esse trabalho pode ser realizado percorrendo-se a via com
veículos ou caminhando e fazendo-se o registro quantitativo e qualitativo dos
atropelamentos, conforme protocolo proposto por Para e Campo (2013).
É interessante que o monitoramento através de caminhadas seja implementado,
pois o número de registros é significativamente maior quando comparados aos realizados
com veículos (Teixeira e Kindel, 2013). Esses registros geram dados que podem alimentar
o Banco de Dados Brasileiro de Atropelamento de Fauna Selvagem (BAFS), que serve
como subsídio para a implantação e adequação das medidas de mitigação dos impactos à
fauna no âmbito nacional. No caso da EPSM, os dados poderiam também alimentar um
banco de dados interno que auxiliaria no manejo das medidas de proteção à fauna que
utiliza a estrada, como o acréscimo de sinalização ou de novas passagens de fauna,
superiores ou subterrâneas.
Controle e erradicação de espécies exóticas
O monitoramento e controle de espécies exóticas, que são importantes para a
manutenção da integridade da vegetação nativa em uma UC (Leão et al., 2011; Sampaio
e Schmidt, 2013) estão previstos no Plano de Manejo do PECB como uma das principais
linhas de ação a serem desenvolvidas. A implantação das ações de manejo para as

152
espécies exóticas pode seguir a sequência proposta por Leão et al. (2011), composta por:
1) diagnóstico das ocorrências de populações e/ou indivíduos das espécies; 2)
estabelecimento de prioridades para manejo, priorizando as espécies com maior potencial
de invasão; e 3) estratégias de manejo, que abrangem a erradicação, contenção e controle,
e mitigação de impactos gerados pela espécie. Sugerimos especial atenção para as
espécies exóticas detectadas na Estrada Parque, como Urochloa sp. (=Brachiaria sp.),
Citrus x limon (L.) Osbeck (limão), Eucalyptus sp. (eucalipto) e Musa balbisiana Colla
(banana). Após a implantação das ações é importante um monitoramento anual para a
detecção de espécies exóticas e, se necessário, devem ser realizadas novas ações de
manejo (Leão et al. 2011).
Ações de compensação
Ampliação da área da Unidade de Conservação
Embora esta medida envolva o comprometimento de muitas instâncias, a
ampliação da área efetiva da UC na Zona de Amortecimento é uma estratégia
compensatória para os impactos causados. Essa ação deve ser subsidiada por estudos que
indiquem o tamanho da área impactada pela via. Para isso, estudos que considerem
maiores distâncias a partir das bordas das vias devem ser priorizados pelo setor de
pesquisa científica da UC.
Considerações finais
Apesar de ser de extrema importância a realização de mais estudos nas imediações
das vias de transporte, como trilhas e estradas, que cortam Unidades de Conservação,
envolvendo diversos grupos de fauna e flora, as interações entre eles e com seu habitat, o
conhecimento já existente, combinado com diagnósticos locais, pode e deve ser utilizado
para um direcionamento das estratégias de conservação.
Ainda faltam diretrizes para a implantação de Estradas-Parque no Brasil, o que
traz dificuldades nas ações de articulação entre os gestores das UCs, órgãos de
planejamento viário e órgãos ambientais, no momento de implementação destas vias. O
enquadramento das vias que intersectam UCs de protecao integral na categoria “Estrada
153
Parque”, por si so, nao diminui os conflitos gerados por seu uso. No caso da Estrada
Parque Serra da Macaca observamos que é preciso atenção dos responsáveis da UC com
as operações realizadas na estrada, para que esta não se torne mais um exemplo da
deficiência no manejo de infraestruturas de transporte que cruzam as UCs. Verificamos
também que há um grande potencial para que a EPSM seja um atrativo com retornos
positivos para o lazer e a educação ambiental.
O fato da Estrada Parque Serra da Macaca ter sido inaugurada após a
pavimentação, sem a implantação de todas as medidas de mitigação, veio demonstrar a
necessidade de maior diálogo entre os órgãos de planejamento viário, os órgãos
ambientais ligados à conservação e a equipe de gestão das áreas protegidas afetadas pela
implantação de infraestruturas de transporte. Uma maior colaboração entre os agentes
envolvidos possibilitaria a criação de programas de implementação conjuntos e melhor
planejamento das estratégias de conservação, considerando-se as condições regionais e
locais.
As sugestões derivadas de diagnósticos de impactos de vias de transporte podem
ser incentivadas junto aos órgãos responsáveis pela gestão das UCs. Os estudos e a
necessidades de monitoramento podem ser facilitados junto ao setor responsável pelos
trâmites de pesquisas científicas do PECB, que já possui um Plano de Manejo onde são
indicadas áreas prioritárias para o desenvolvimento de pesquisa científica. Desse modo
poderá haver melhor integração entre a conservação e o uso de infraestruturas antrópicas
na Unidade de Conservação, permitindo que os gestores dos parques possam ajustar as
medidas prioritárias para a conservação com base nos orçamentos e metas de gestão.
Referências
Ahmed SE, Lees AC, Moura G, et al (2014) Road networks predict human influence on
Amazonian bird communities. Proc R Soc 281:20141742.
Aleixo A (1999) Effects of selective logging on a bird community in the Brazilian
Atlantic Forest. Condor 101:537–548. doi: 10.2307/1370183
Antunes AZ, Eston MR, Santos AMR (2007) O escaravelho Megasona gyas (Herbst,
1775), espécie ameaçada de extinção, no Parque Estadual Carlos Botelho, Sete
Barras - SP. Rev do Inst Florest 19:129–135.

154
Bispo AÂ, Aguiar AG De, Nobre RDA, Machado CG (2016) Protocolo para
monitoramento de comunidades de aves em Unidades de Conservação Federais.
Biodiversidade Bras 6:153–173.
Blockhus JM, Dillenbeck M, Sayer JA, Wegge P (1992) Conservation biological diversity
in managed tropical forests. IUCN, Gland, Switzerland.
Capítulo 1 (2017) Pathways affect vegetation structure and composition in the Atlantic
Forest in southeastern Brazil. Universidade Estadual de Campinas
Capítulo 2 (2017) Pathways influence fruit availability in the Atlantic forest.
Universidade Estadual de Campinas
Capítulo 3 (2017) Impact of park roads and trails on a community of Atlantic forest fruit-
eating birds. Universidade Estadual de Campinas
Couto-Santos APL do, Conceição AA, Funch LS (2015) The role of temporal scale in
linear edge effects on a submontane Atlantic forest arboreal community. Acta Bot
Brasilica 29:190–197. doi: 10.1590/0102-33062014abb3732
DeWalt SJ, Maliakal SK, Denslow JS (2003) Changes in vegetation structure and
composition along a tropical forest chronosequence: Implications for wildlife. For
Ecol Manage 182:139–151. doi: 10.1016/S0378-1127(03)00029-X
Dourojeanni MJ (2003) Análise crítica dos planos de manejo de áreas protegidas no
Brasil. In: BAGER, A. (Ed.). Áreas protegidas: conservação no âmbito do Cone Sul.
Pelotas: Ed. Universidade Católica de Pelotas. pp 1–20
Ferraz LPM, Varjabedian R (1999) Evolução histórica da implantação e síntese das
informações disponíveis sobre o Parque Estadual Carlos Botelho. Secretaria do Meio
Ambiente/Instituto Florestal, São Paulo
Fogaça PD, Beisiegel BM, Lima ABF, et al (2004) Diagnóstico da fauna que usa a
Rodovia SP-139. Inst Florest Dados não publicados.
Forman RTT, Alexander LE (1998) Roads and their major ecological effects. Annu Rev
Ecol Syst 29:207–231. doi: 10.1146/annurev.ecolsys.29.1.207
Galetti M, Guevara R, Côrtes MC, et al (2013) Functional extinction of birds drives rapid
evolutionary changes in seed size. Science (80- ) 340:1086–1090. doi:
10.1126/science.1233774
Goosem M (1997) Internal Fragmentation: The effects of roads, highways, and powerline
clearings on movements and mortality of Rainforest vertebrates. In: Laurance WF,
Bierregaard Jr. RO (eds) Tropical Forest Remnants. University of Chicago Press,
Chicago. pp 241–255

155
Gressler E (2010) Fenologia de espécies de floresta atlântica, Núcleo Picinguaba, Parque
Estadual da Serra do Mar, Estado de São Paulo: comparação entre estratos e
influência de borda natural. Tese doutorado pp 262.
Griswold SS (1995) Sustainability and wilderness trails. In: Sustainable society and
protected areas: Contributed papers of the 8th Conference on Research and Resource
Management in Parks and on Public Lands, ed. R.M. Linn. Hancock, MI, USA: The
George Wright Society, pp 70–4
Hasui E, Gomes VSDM, Silva WR (2007) Effects of vegetaion traits on habitat
preferences of frugivorous birds in Atlantic rain forest. Biotropica 39:502–509.
Helldin JO, Seiler A (2003) Effects of roads on the abundance of birds in Swedish forest
and farmland. Iene 1–9.
Kangas K, Luoto M, Ihantola a., et al (2010) Recreation-induced changes in boreal bird
communities in protected areas. Ecol Appl 20:1775–1786. doi: 10.1890/09-0399.1
Keller I, Largiade CR (2003) Recent habitat fragmentation caused by major roads leads
to reduction of gene flow and loss of genetic variability in ground beetles. Proc R
Soc London 270:417–423. doi: 10.1098/rspb.2002.2247
Kronka FJ., Nalon M., Matsukuma CK, et al (2005) Inventário florestal da vegetação
natural do Estado de São Paulo. Secretaria do Meio Ambiente/Instituto Florestal
Laurance WF, Bierregaard JRO, Gascon C, et al (1997) Tropical forest fragmentation:
syntesis of a diverse and dynamic discipline. In: Tropical forest remnants: ecology,
management and conservation of fragmented communities (Laurance, W.F. and
Bierregaard, Jr.R.O., eds.). University of Chicago Press, Chicago, EUA. pp 502–514
Leão TCC, Almeida WR, Dechoum MS, Ziller SR (2011) Espécies exóticas invasoras no
nordeste do Brasil - Contextualização , manejo e políticas públicas. Recife
Leitão RP, Zuanon J, Villéger S, et al (2016) Rare species contribute disproportionately
to the functional structure of species assemblages. Proc R Soc 283:20160084.
Machlis GE, Neumann RP (1986) La situación de los parques nacionales en la región
neotropical. In: Cardich, E. (Ed). Actas de la 27a sesión de trabajo de la comisión de
parques nacionales y de áreas protegidas de la UICN: conservando el patrimonio
natural de la región neotropical. Bariloche, Argentina. pp 43–50
MMA (2000) Avaliação e ações prioritárias para a conservação da biodiversidade da
Mata Atlântica e Campos Sulinos. Brazil
Morellato LPC, Alberton B, Alvarado ST, et al (2016) Linking plant phenology to
conservation biology. Biol Conserv 195:60–72. doi: 10.1016/j.biocon.2015.12.033

156
Oliveira PRR, Alberts C, Francisco MR (2011) Impact of road clearings on the
movements of three understory insectivorous bird species in the Brazilian Atlantic
Forest. Biotropica 43:628–632.
Padua MTJ, Porto ELR, Borges GC, Bezerra MML (1982) Plano do Sistema de Unidades
de Conservação do Brasil – II Etapa. Ministério da Agricultura. IBDF/FBCN. Brasil.
Padua SM, Tabanez MF, Souza MG (2012) A abordagem participativa na educação para
a conservação da natureza. In: Cullen Jr., L., Rudran, R., e Valladares- Pádua, C.
(Org.) Métodos de estudos em Biologia da Conservação e Manejo da Vida Silvestre.
UFPR. p 652
Para M, Campo EDE (2013) Projeto malha. Centro Brasileiro de Estudos em Ecologia de
estradas, Lavras
Prieto P V., Sansevero JBB, Garbin ML, et al (2014) Edge effects of linear canopy
openings on understorey communities in a lowland Atlantic tropical forest. Appl
Veg Sci 17:121–128. doi: 10.1111/avsc.12043
Primack RB, Rodrigues E (2001) Biologia da Conservação.
Reznik G, Pires JPDA, Freitas L (2012) Efeito de bordas lineares na fenologia de espécies
arbóreas zoocóricas em um remanescente de Mata Atlântica. Acta Bot Brasilica
26:65–73. doi: 10.1590/S0102-33062012000100008
Ribeiro MC, Martensen AC, Metzger JP, et al (2011) The Brazilian Atlantic Forest: a
shrinking biodiversity hotspot. In: Zachos FE, Habel JC (eds) Biodiversity hotspots:
distribution and protection of conservation priority areas. springer, pp 405–434
Sampaio AB, Schmidt IB (2013) Espécies exóticas invasoras em Unidades de
Conservação Federais do Brasil. Biodiversidade Bras 3:32–49.
São Paulo (1982) Decreto no 19.499 de 10 de Setembro de 1982. Cria o Parque Estadual
“Carlos Botelho” e da providencias correlatas.
São Paulo (2008) Decreto 53.146 de 20 de junho de 2008. Define os parâmetros para a
implantação, gestão e operação de estradas no interior de Unidades de Conservação
de Proteção Integral no Estado de São Paulo e dá providências correlatas.
Schonewald-Cox CM, Buechner M (1992) Park protection and public roads. In: P. L.
Fiedler e S. K. Jain (Eds), Conservation biology: The theory and practice of nature
conservation, and management. pp 373–396
SMA (2008) Secretaria do Meio Ambiente do Estado de São Paulo. Plano de manejo do
Parque Estadual Carlos Botelho. http://fflorestal.sp.gov.br/planos-de-
manejo/planos-de-manejo-planos-concluidos/. Accessed 17 May 2016

157
SNUC NPAS (2000) Sistema Nacional de Unidades de Conservação da Natureza -
SNUC, lei no 9.985, de 18 de julho de 2000; decreto no 4.340, de 22 de agosto de
2002.
SOS - Mata Atântica (2015) Atlas da Mata Atlântica » SOS Mata Atlântica.
Spellerberg IF (1994) Evaluation and assessment for conservation: Ecological guidelines
for determining priorites for nature conservation. Chapman and Hall, London).
Teixeira FZ, Kindel A (2013) Vertebrate road mortality estimates : Effects of sampling
methods and carcass removal. Biol Conserv 157:317–323. doi:
10.1016/j.biocon.2012.09.006
Teixeira FZ, Printes RC, Fagundes JCG, et al (2013) Canopy bridges as road overpasses
for wildlife in urban fragmented landscapes. Biota Neotrop 13:117–123. doi:
10.1590/S1676-06032013000100013
Watson JEM, Whittaker RJ, Dawson TP (2004) Habitat structure and proximity to forest
edge affect the abundance and distribution of forest-dependent birds in tropical
coastal forests of southeastern Madagascar. Biol Conserv 120:315–331. doi:
10.1016/j.biocon.2004.03.004
Wiacek J, Polak M, Kucharczyk M, Bohatkiewicz J (2015) Landscape and urban planning
the influence of road traffic on birds during autumn period: implications for planning
and management of road network. Landsc Urban Plan 134:76–82. doi:
10.1016/j.landurbplan.2014.10.016
Young A, Boyle T, Brown T (1996) The population genetic consequences of habitat
fragmentation for plants. Trends Ecol Evol 11:413–418. doi: 10.1016/0169-
5347(96)10045-8

158
Apêndice
Guia de aves da Serra da Macaca

159

160

161

162

163

164
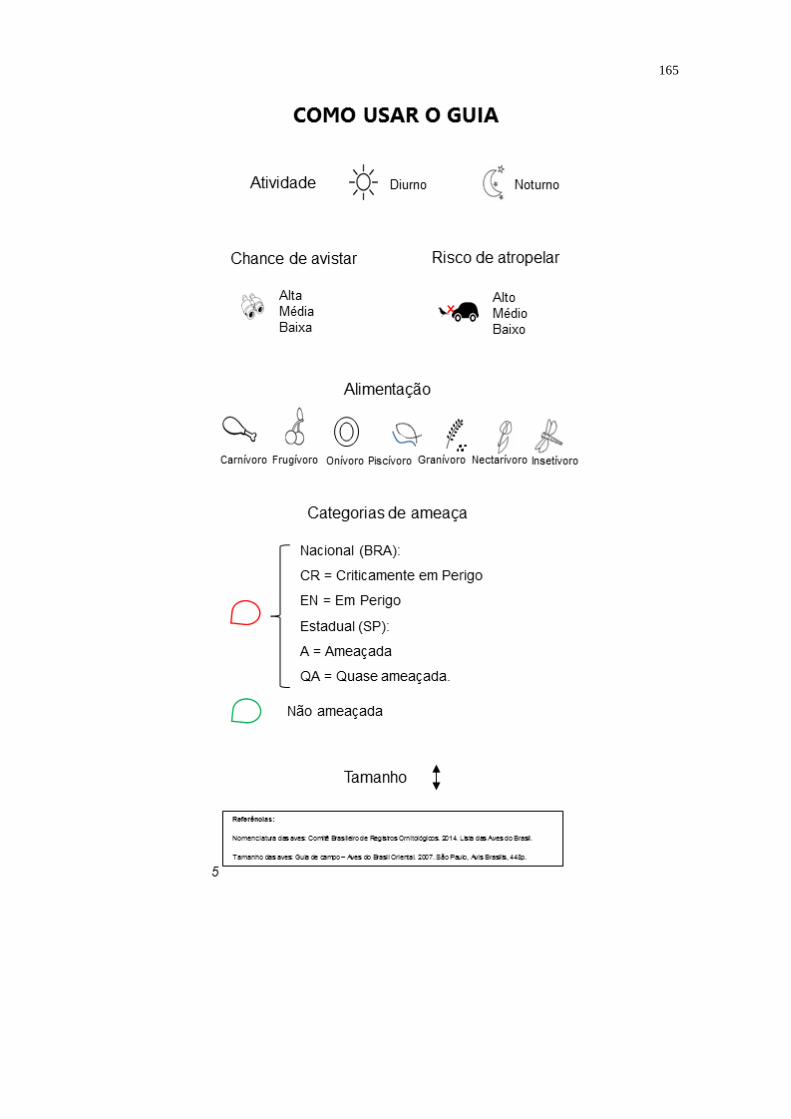
165

166

167

168

169

170

171

172

173

174

175

176

177

178

179

180

181
Considerações finais
Nesse estudo foi possível verificar que a presença de clareiras lineares e o seu uso
geram respostas na comunidade de plantas, alterações em processos reprodutivos como a
produção de frutos, e afetam a comunidade de aves consumidora de frutos. A largura da
clareira linear é um fator que direciona as respostas da comunidade de plantas, enquanto
que para comunidade de aves frugívoras a intensidade de uso e a disponibilidade de
alimentos são determinantes. A presença de um trajeto com mais de 10 m de largura
combinado com seu uso intensivo, em meio a uma floresta, traz acentuadas mudanças nas
comunidades da fauna e da flora. Destacou-se também a necessidade de avaliar os trajetos
e seus impactos de maneira independente para cada tipo de clareira linear que cruze uma
área florestal, considerando suas características físicas e de uso, assim como as demais
condições locais.
Os resultados corroboraram as previsões iniciais apontadas para a vegetação,
baseadas em estudos do efeito de borda de clareiras lineares realizados com outros grupos
de plantas ou em outras áreas de mata atlântica com outras características climáticas
(Couto-Santos et al., 2015; Prieto et al., 2014). Além disso, contribuem para o
conhecimento sobre o impacto de clareiras lineares na comunidade arbórea de Floresta
Ombrófila Densa em Mata Atlântica, pois revelam que a vegetação difere entre trajetos
largos e estreitos. Em trajetos largos (entre 10 e 20 m) houve maior ocorrência de plantas
com baixa altura e diâmetro a altura do peito, e uma proporção maior de pioneiras e
espécies anemocóricas quando comparadas às encontradas em trajetos estreitos (2 m de
largura) ou áreas sem trajetos. Além disso, destacou-se a ocorrência de espécies exóticas
nas imediações dos trajetos largos. Esses resultados reforçam a existência de respostas da
comunidade de plantas às alterações causadas pela presença da clareira linear, revelando
o impacto de um trajeto largo (com mais de 10 metros de largura) na estrutura do habitat
e na composição da comunidade.
No que concerne aos padrões de frutificação, os expressivos efeitos espaciais e
temporais da presença de trajetos com diferentes larguras na disponibilidade de frutos
obtidos nesse estudo fornecem informações que ainda estavam inconsistentes na literatura
(Ramos e Santos, 2006; Reznik et al., 2012). A produção de frutos para a fauna é maior
em áreas de floresta madura sem a presença de clareiras lineares, havendo produção ao
longo do ano todo, ao passo que nas áreas afetadas pelos trajetos ocorrem épocas com
182
picos e depressões de produção, com oscilação na disponibilidade de frutos. Além disso,
nosso estudo revelou que há uma diferença nos tipos de frutos produzidos entre as áreas
afetadas pelas clareiras lineares, com predominância de espécies não zoocóricas nas
bordas dos trajetos largos e de zoocoria nas áreas sem trajetos, informações que ainda não
eram conclusivas na literatura pois ainda não haviam sido detectados efeitos na
distribuição das síndromes de dispersão em área afetadas por trajetos. Foi observado
também que ao longo do trajeto mais largo a produção de frutos não zoocóricos não
diferiu entre borda e as parcelas a 35 m da borda, enquanto a proporção de zoocoria
aumentou nas parcelas a 35 m da borda. Na posse desses resultados foi possível perceber
que a variação na predominância das síndromes é sensível à intensidade com que o efeito
de borda penetra sentido interior, dependendo da largura da clareira e que isso afeta
diferentemente as diferentes síndromes de dispersão. Apesar de ser conhecido que as
espécies podem responder distintamente à uma alteração ambiental, esse padrão
observado traz questionamentos sobre as respostas ao efeito de borda entre grupos de
plantas que apresentam as diferentes síndromes de dispersão. Esses questionamentos
poderiam ser abordados em estudos futuros sobre as diferenças fisiológicas que poderão
ser consistentes entre espécies que apresentam uma mesma síndrome de dispersão.
A alteração na composição, riqueza e abundância de aves frugívoras da Mata
Atlântica nas proximidades de trajetos com uso intensivo corrobora as hipóteses iniciais
baseadas em estudos conduzidos em formações florestais da Austrália e da Amazônia
(Ahmed et al., 2014; Develey e Stouffer, 2001; Goosem, 2004, 2001; Laurance et al.,
2004; Wolf et al., 2013). Os trajetos largos favoreceram a ocupação e o aumento da
abundância de espécies mais generalistas nas bordas, que encontraram ali as condições
favoráveis para sua manutenção. Verificamos também que os trajetos sem uso intensivo
possibilitam a ocorrência de espécies mais sensíveis a perturbações, como as grandes aves
frugívoras. No entanto, nos trajetos com uso intensivo, largos ou estreitos, os grandes
frugívoros podem ser afugentados, havendo uma diminuição na sua ocorrência e
abundância. A implantação de trajetos como rodovias, que combinam a necessidade de
um leito normalmente superior a 20m e o uso intensivo por diversos meios de transporte,
resulta em grandes impactos no ambiente natural. O uso de trilhas de turismo também
deve ser manejado de forma adequada, já que foi possível observar que o uso público,
mesmo em um ambiente com vegetação madura, como a trilha amostrada nesse estudo,
pode afetar fortemente o comportamento da fauna.

183
A alteração do habitat, a limitação de recursos alimentares, e a presença de
distúrbios que afugentem a fauna geram o desaparecimento de algumas espécies das áreas
adjacentes aos trajetos amostrados. A diminuição de grandes aves frugívoras nas
imediações de clareiras antrópicas com uso intensivo pode implicar em alterações nos
processos de dispersão de sementes, e isso pode se refletir nas diferenças na composição
da vegetação observadas nas imediações das bordas. Esse processo tende a alterar a
dinâmica do ecossistema, pois com a ausência da fauna capaz de dispersar grandes
sementes, e a consequente seleção das espécies de plantas, pode ocorrer uma alteração
das comunidades florestais e o aumento de extinções locais. É recomendado que essas
hipóteses sejam futuramente investigadas.
O diagnóstico local dos impactos das vias de uso intensivo do Parque Estadual
Carlos Botelho possibilitou o direcionamento de estratégias de conservação às vias
consideradas, visando a melhor integração entre a conservação da floresta e o uso de
infraestruturas antrópicas no Parque. As estratégias de conservação sugeridas para serem
consideradas pelos gestores e demais órgãos envolvidos incluíram medidas mitigatórias
que visam a redução de acidentes e do afugentamento da fauna, o envolvimento da
comunidade e educação ambiental, monitoramento, e ações de compensação. Quando se
trata de ambientes sob pressão, como a Mata Atlântica, o manejo dessas estradas e trilhas
deve ser tratado com bastante atenção, observando-se as possíveis consequências para
espécies raras e ameaçadas, bem como as transformações nas comunidades e processo
ecológicos fundamentais para a manutenção do sistema, como as interações ecológicas.
Com isso, destaca-se o valor de se manter extensas áreas de florestas maduras sem trajetos
e com uso restrito. E quando houver necessidade de implementação de trajetos em meio
a florestas, que sejam realizados esforços visando um manejo adequado e utilização
controlada, principalmente quando ocorrerem no interior de áreas protegidas.
Os dados obtidos revelaram o impacto gerado pela implantação de trajetos em
uma Unidade de Conservação da Mata Atlântica no sudeste do Brasil. No entanto, apesar
de ser possível estender os principais padrões aqui encontrados para outras florestas
ombrófilas do Brasil, mais estudos são necessários para esta extrapolação. Para consolidar
as informações sobre esse tipo de impacto é recomendado que esforços similares sejam
conduzidos em outras regiões intersectadas por trajetos, envolvendo a flora e também
outros grupos da fauna. Contemplar diferentes distâncias de amostragem a partir da borda
no sentido do interior da floresta também é desejável pois, os resultados poderiam indicar

184
qual a real permeabilidade dos impactos gerados pela presença dessas infraestruturas
lineares em meio a um contínuo florestal. É importante também conduzir um
aprofundamento em outros processos ecológicos que podem ser impactados, incluindo os
diversos processos das interações entre animais e plantas.
Referências
Ahmed, S.E., Lees, A.C., Moura, G., Gardner, T.A., Barlow, J., Ferreira, J., Ewers, R.M.,
2014. Road networks predict human influence on Amazonian bird communities.
Proc. R. Soc. 281, 20141742.
Couto-Santos, A.P.L. do, Conceição, A.A., Funch, L.S., 2015. The role of temporal scale
in linear edge effects on a submontane Atlantic forest arboreal community. Acta Bot.
Brasilica 29, 190–197. doi:10.1590/0102-33062014abb3732
Develey, P.F., Stouffer, P.C., 2001. Effects of roads on movements by understory birds
in mixed-species flocks in Central Amazonian Brazil. Conserv. Biol. 15, 1416–1422.
doi:10.1046/j.1523-1739.2001.00170.x
Goosem, M., 2004. Linear infrastructure in the tropical rainforests of far north
Queensland : mitigating impacts on fauna of roads and powerline clearings. Conserv.
Aust. For. Fauna 418–434.
Goosem, M., 2001. Effects of tropical rainforest roads on small mammals: inhibition of
crossing movements. Wildl. Res. 28, 351–364.
Laurance, S.G.W., Stouffer, P.C., Laurance, W.F., 2004. Effects of road clearings on
movement patterns of understory rainforest birds in Central Amazonia. Conserv.
Biol. 18, 1099–1109.
Prieto, P. V., Sansevero, J.B.B., Garbin, M.L., Braga, J.M. a, Rodrigues, P.J.F.P., 2014.
Edge effects of linear canopy openings on understorey communities in a lowland
Atlantic tropical forest. Appl. Veg. Sci. 17, 121–128. doi:10.1111/avsc.12043
Ramos, F.N., Santos, F.A.M., 2006. Floral visitors and pollination of Psychotria
tenuinervis (Rubiaceae): Distance from the anthropogenic and natural edges of an
Atlantic Forest fragment. Biotropica 38, 383–389. doi:10.1111/j.1744-
7429.2006.00152.x

185
Reznik, G., Pires, J.P.D.A., Freitas, L., 2012. Efeito de bordas lineares na fenologia de
espécies arbóreas zoocóricas em um remanescente de Mata Atlântica. Acta Bot.
Brasilica 26, 65–73. doi:10.1590/S0102-33062012000100008
Wolf, I.D., Hagenloh, G., Croft, D.B., 2013. Vegetation moderates impacts of tourism
usage on bird communities along roads and hiking trails. J. Environ. Manage. 129,
224–234. doi:10.1016/j.jenvman.2013.07.017

186
ANEXOS
Anexo I – Declaração referente a bioética e biossegurança

187
Anexo II – Declaração referente a direitos autorais