UNIVERSIDADE DE LISBOA FACULDADE DE CIÊNCIAS … · recursos pesqueiros (uso de práticas bastante...
171
UNIVERSIDADE DE LISBOA FACULDADE DE CIÊNCIAS DEPARTAMENTO DE BIOLOGIA ANIMAL COMPARISON OF ROCKY REEF FISH COMMUNITIES AMONG PROTECTED, UNPROTECTED AND ARTIFICIAL HABITATS IN MADEIRA ISLAND COASTAL WATERS USING UNDERWATER VISUAL TECHNIQUES Cláudia Correia da Silva Ribeiro DOUTORAMENTO EM BIOLOGIA (BIOLOGIA MARINHA E AQUACULTURA) LISBOA 2008
Transcript of UNIVERSIDADE DE LISBOA FACULDADE DE CIÊNCIAS … · recursos pesqueiros (uso de práticas bastante...

UNIVERSIDADE DE LISBOA FACULDADE DE CIÊNCIAS
DEPARTAMENTO DE BIOLOGIA ANIMAL
COMPARISON OF ROCKY REEF FISH COMMUNITIES AMONG
PROTECTED, UNPROTECTED AND ARTIFICIAL HABITATS IN
MADEIRA ISLAND COASTAL WATERS USING UNDERWATER
VISUAL TECHNIQUES
Cláudia Correia da Silva Ribeiro
DOUTORAMENTO EM BIOLOGIA (BIOLOGIA MARINHA E AQUACULTURA)
LISBOA
2008


UNIVERSIDADE DE LISBOA FACULDADE DE CIÊNCIAS
DEPARTAMENTO DE BIOLOGIA ANIMAL
COMPARISON OF ROCKY REEF FISH COMMUNITIES AMONG
PROTECTED, UNPROTECTED AND ARTIFICIAL HABITAS IN
MADEIRA ISLAND COASTAL WATERS USING UNDERWATER
VISUAL TECHNIQUES
Cláudia Correia da Silva Ribeiro Bolseira da Fundação para a Ciência e a Tecnologia
(SFRH/BD5307/2001)
DOUTORAMENTO EM BIOLOGIA (BIOLOGIA MARINHA E AQUACULTURA)
Tese orientada pelo Prof. Doutor Armando Jorge Teles e Almeida
Tese co-orientada pelo Doutor George R. Sedberry
LISBOA
2008


Comparison of Rocky Reef Fish Communities Using Underwater Visual Techniques
RESUMO .......................................................................................................................... I
ABSTRACT .....................................................................................................................V
CHAPTER 1: GENERAL INTRODUCTION................................................................. 1
1.1 - STUDIES OF MADEIRAN MARINE FISH COMMUNITIES ............................................. 1 1.2 - MAIN PRESSURES IN WORLDWIDE COASTAL COMMUNITIES FOCUSING MADEIRA ISLAND .......................................................................................................................... 4 1.3 - THE IMPORTANCE OF THE STUDY OF COASTAL REEF FISH COMMUNITIES ............. 13
CHAPTER 2: OBJECTIVES ......................................................................................... 16
CHAPTER 3: VISUAL CENSUS TECHNIQUES: IT’S IMPORTANCE IN STUDIES OF COASTAL FISH COOMUNITIES ......................................................................... 18
CHAPTER 4: MPA’S..................................................................................................... 21
4.1 - CONSIDERATIONS ON MPAS................................................................................ 21 4.2 - GMR: THE FIRST PORTUGUESE MARINE RESERVE .............................................. 29
CHAPTER 5: MATERIAL AND METHODS .............................................................. 32
5.1 - STUDY AREA: GENERAL CHARACTERIZATION ...................................................... 32 5.1.1 - Characterization of Madeira subidal bottoms ............................................ 34 5.1.2 - Sampling locations ...................................................................................... 36
5.2 - SURVEY METHODS ............................................................................................... 37 5.2.1 - Transect method (T) .................................................................................... 38 5.2.2 - Point count or Stationary visual technique (PC) ........................................ 39 5.2.3 - Visual Fast Count Method (VFC) ............................................................... 40
5.3 – PHYSICAL AND ENVIRONMENTAL VARIABLES..................................................... 41 5.4 - DATA ANALYSIS .................................................................................................. 42
5.4.1 - Methods comparisons.................................................................................. 42 5.4.2 - Fish communities ensemble properties ....................................................... 43 5.4.3 - Univariate statistical analyses .................................................................... 44 5.4.4 - Multivariate statistical analyses ................................................................. 45 5.5.5 - Fish assemblages structure ......................................................................... 46
FISH GUILDS.................................................................................................... 46 a) Trophic structure ........................................................................................ 46 b) Spatial Organization/Ecological Type ....................................................... 47
DEPTH DISTRIBUTION .................................................................................. 47
CHAPTER 6: RESULTS ............................................................................................... 48
6.1 - SURVEYS METHODS ............................................................................................. 48 6.1.1 - Training program- diver ............................................................................. 48 6.1.2 - Method comparison..................................................................................... 48
6.2- FISH ASSEMBLAGES .............................................................................................. 61 6.2.1 - Species richness and Diversity.................................................................... 61 6.2.2 - Qualitative Similarity .................................................................................. 66 6.2.3.- Sighting Frequency ..................................................................................... 68
6.3 - ABUNDANCE........................................................................................................ 72 6.4 - ASSEMBLAGES STRUCTURE ................................................................................. 84
FISH GUILDS.................................................................................................... 84 a) Trophic structure ........................................................................................ 84 b) Mobility and spatial organization............................................................... 87

Cláudia Ribeiro
c) Demographic structure ............................................................................... 87 DEPTH EFFECT................................................................................................ 90
6.5 - PHYSICAL AND ENVIRONMENTAL PARAMETERS .................................................. 92
CHAPTER 7: DISCUSSION AND FINAL CONSIDERATIONS ............................... 96
7.1 - FISH CENSUS METHODOLOGY: DISCUSSION AND CONSIDERATIONS..................... 96 7.2 - MADEIRAN INSHORE ROCKY REEFS COMMUNITIES............................................. 105 7.3 - STRUCTURE OF FISH COMMUNITIES AND STRUCTURING FACTORS ...................... 113 7.4 - MARINE PROTECTED AREA: GMR ..................................................................... 119
7.4.1 - GMR species updating results................................................................... 119 7.4.2 - Reserve effect ............................................................................................ 122 7.4.3 - GMR Management Implications ............................................................... 129
7.5 - MADEIRA COASTAL FISH COMMUNITIES:IMPLICATIONS FOR MANAGEMENT ...... 132
ACKNOWLEDGMENTS............................................................................................ 134
REFERENCES ............................................................................................................. 135
ANNEXE...................................................................................................................... 155

Comparison of Rocky Reef Fish Communities Using Underwater Visual Techniques
i
RESUMO
O presente trabalho visou o estudo das comunidades de peixes dos recifes
rochosos da costa Sul da Ilha da Madeira com a finalidade de obter dados de referência
sobre a estrutura dos ictiopovoamentos que habitam a estreita faixa rochosa do litoral
madeirense. As comunidades foram caracterizadas em termos de riqueza específica,
composição, abundância, estrutura trófica, espacial, demográfica e dinâmica sazonal,
considerando os factores profundidade, tipo de substrato e localidade. Utilizaram-se três
métodos de contagem visuais (transecto, ponto fixo e ”visual fast count”),
frequentemente utilizados em estudos semelhantes realizados noutras regiões do planeta,
mas que aqui foram pela primeira vez aplicados em simultâneo, testando a sua
eficiência e desempenho para avaliação das comunidades de peixes existentes, bem
como uma revisão e actualização acerca deste tipo de metodologias. Avaliou-se o grau
de protecção das comunidades ictiológicas da Reserva Marinha do Garajau, estimando
os eventuais benefícios das medidas de protecção existentes e investigou-se também a
influencia de determinadas intervenções humanas como é o caso da implantação de
enrocamentos ao longo do litoral madeirense na estrutura das comunidades ictiológicas
que estes locais agregam. Pretendeu-se também avaliar e evidenciar uma lista dos
maiores problemas associados à gestão dos recursos ictiológicos costeiros da Ilha da
Madeira, identificando os parâmetros mais adequados a serem usados em decorrentes
projectos de monitorização dessas comunidades.
O período de amostragem decorreu entre a Primavera de 2002 e a Primavera de
2004, em três localidades da costa Sul da Ilha da Madeira, numa área marinha protegida
- Reserva Marinha do Garajau; uma área natural não protegida - Caniçal e uma área
costeira submetida a intervenção humana, artificial - o enrocamento do aeroporto da
Madeira.
De entre os métodos usados, foi com o “visual fast count” que se registou maior
número de espécies em todos os locais, revelando-se o mais adequado na avaliação da
riqueza específica duma dada área. No entanto, dado não ter fornecido estimativas de
densidades, devido à impossibilidade de quantificar a área amostrada, verificou-se
também ter sido conveniente a aplicação dos outros dois métodos (transecto ou ponto
fixo), os quais poderão ser aplicados em simultâneo ou cada um per si em futuros
programas de monitorização das comunidades de peixes costeiros na Ilha da Madeira.

Cláudia Ribeiro
ii
Num total de 183 mergulhos, completando 185 horas de trabalho subaquático,
contabilizou-se 61 taxa pertencentes a 33 famílias, muitas delas representadas por uma
única espécie, enquanto 5 famílias compreenderam praticamente 80% do total de
espécies observadas. Comparando o total de espécies observadas no presente estudo
com o número de espécies referidos para áreas litorais em regiões tropicais e
subtropicais, a diversidade de peixes litorais na Ilha da Madeira é consideravelmente
baixa, reforçando a ideia de diminuição da diversidade dos povoamentos ictiológicos
dos trópicos para as zonas mais temperadas. O facto das águas circundantes serem
oceânicas e oligotróficas, com baixa produtividade é uma possível explicação para a
reduzida diversidade de peixes observada na ilha. Adicionalmente a sobrexploração dos
recursos pesqueiros (uso de práticas bastante destrutivas como os explosivos) e a grande
intervenção humana a que a costa da Ilha da Madeira, sobretudo a costa Sul, tem sido
sujeita em resultado do desenvolvimento da ilha em termos turísticos, tal como sucedeu
no arquipélago vizinho das Ilhas Canárias, são outras possíveis razões para a baixa
diversidade observada.
A distribuição das espécies de peixes costeiros na área estudada apresentou
elevado nível de homogeneidade, tendo 34 espécies sido observadas nas três localidades.
Existe uma dominância espaço-temporal dum pequeno número de espécies que
compõem o ‘plafond’ de espécies comuns e que estão presentes independentemente do
factor considerado, pelo que qualquer que seja a relação dessas espécies com as
variáveis estruturantes da comunidade esse grupo tende a formar uma comunidade
estável, sugerindo assim uma ordem estrutural. De entre esse pequeno grupo de espécies
salientam-se: Abudefduf luridus, Chromis limbata, Thalassoma pavo, Sphoeroides
marmoratus, Sparisoma cretense que foram de entre as espécies observadas as mais
frequentes e abundantes nos recifes rochosos amostrados ao longo da costa Sul da Ilha
da Madeira. Desta evidência de homogeneidade na diversidade e distribuição dos peixes
nos recifes rochosos da ilha da Madeira advém informação muito importante para a
gestão dos recursos locais.
As comunidades de peixes litorais estudadas mostraram estruturar-se de acordo
com o tipo de substrato e profundidade. A análise multivariada através de ‘plots nMDS’
revelou uma boa separação das três localidades estudadas, evidenciando também uma
clara separação de acordo com a profundidade, registou-se maior número de peixes no
intervalo de profundidade 10-20m. Os parâmetros calculados com base nas estimativas
visuais das populações de peixes diferiram significativamente entre os tipos de substrato

Comparison of Rocky Reef Fish Communities Using Underwater Visual Techniques
iii
e também verificou-se um aumento do número de espécies, de abundância, e de alguns
grupos funcionais da comunidade de acordo com a profundidade. A análise da estrutura
trófica das comunidades de peixes dos recifes rochosos da ilha da Madeira, evidenciou
grande dominância dos carnívoros, quer em número de espécies observadas quer em
termos de abundância, ocorrendo também uma significativa contribuição da categoria
dos omnívoros, enquanto a os herbívoros estiveram sub-representados.
Os resultados obtidos demonstraram que a composição e estrutura das
comunidades de peixes litorais dos recifes rochosos da Ilha da Madeira são
significativamente influenciadas pela natureza dos recifes, nomeadamente naturais vs
artificiais. Verificou-se que o número total de espécies, abundância de espécies
demersais, frequência de ocorrência e tamanho dos indivíduos de algumas espécies
foram mais elevados nas localidades naturais do que no enrocamento do aeroporto da
Madeira.
O factor “protecção” não mostrou ter efeito significativo no total de espécies
observadas, enquanto os factores ‘profundidade’ e ‘estação do ano’ foram significativos
sobre a riqueza específica e abundância nos locais amostrados. De salientar que o mero,
Epinephelus marginatus, espécie incluída na lista vermelha da IUCN sob a categoria
“em perigo”, foi apenas observado na área da reserva, ainda que em reduzido número e
com baixa frequência de ocorrência, o que, tratando-se duma espécie gregária e
altamente territorial já era expectável. Todavia, as medidas de protecção estabelecidas
na Reserva Marinha do Garajau permitiram em certo grau alcançar alguns dos
objectivos propostos a quando da criação da reserva, com um aumento do número de
indivíduos de tamanho médio e grande em relação às duas outras localidades
amostradas. Adicionalmente, outras espécies exploradas pelos pescadores locais, como
sejam o bodião, Sparisoma cretense e o badejo, Mycteroperca fusca foram também
observadas com maior frequência de ocorrência e em maior número de indivíduos na
área da reserva.
Pese embora o presente trabalho forneça dados de referência com vista ao
prosseguimento de objectivos de gestão e conservação dos recursos ictiológicos
costeiros da Ilha da Madeira, é necessário continuar com uma eficiente monitorização
das comunidades costeiras existentes na ilha, considerando alguns dos factores
ponderados no presente trabalho bem como outros, cuja influencia nestas comunidades
não foi até à presente data investigada (e.g. processos de recrutamento e fixação das
espécies, complexidade dos habitats, etc.)

Cláudia Ribeiro
iv
A escassez de informação acerca das comunidades de peixes costeiros na Ilha da
Madeira pode ser referida como uma das razões para possíveis falhas na detecção de
efeitos significativos da acção humana sobre as comunidades estudadas. Daí que, os
resultados obtidos presentemente em conjunto com os resultados obtidos em trabalhos
prévios contribuirão para uma visão mais alargada e um melhor conhecimento das
comunidades de peixes costeiros na ilha da Madeira.

Comparison of Rocky Reef Fish Communities Using Underwater Visual Techniques
v
ABSTRACT
This study concentrates on fish species associated to rocky inshore reefs of the
south coast of Madeira Island in order to obtain base-line data on the structure of the
fish assemblages inhabiting the very limited shallow coastal habitats surrounding
Madeira Island. The faunistic features of the local fish communities were defined in
terms of species richness and composition; abundance; trophic, spatial and demographic
structure; and seasonal changes relating to type of substrate, depth, seasons and
locations. Three visual-census methods commonly used in similar studies performed
elsewhere (transect, point-count – PC and visual fast count - VFC) were used for fish
assessment with further comparison and evaluation of efficiency and performance for
each of them and other methods. I determined the extent to which Garajau Marine
Reserve (GMR) protected different assemblages of reef fishes, the effects of riprap
along the shore of the island as fish habitat, and how protection and artificial substate
can be used in the management of inshore fish resources of Madeira Island.
Censuses were seasonally conducted (three times/season) during a two-year
period from Spring 2002 to Spring 2004 in three locations on the south coast of Madeira
Island, including a marine protected area (GMR), a natural non-protected area (Caniçal)
and an artificial non-protected area (riprap of Madeira airport).
Methods comparison showed that the total number of species recorded by the
VFC was always higher than PC and transects methods in all locations, including all
bottoms types and both depth; however the use of standard methods such as transect or
point count are valuable for obtaining fish densities estimates and should be used in a
future monitoring program.
Diurnally active fishes (61 taxa), belonging to 33 families were recorded. Most
of the families were represented by a single species and five families included about
80% of the total of species observed. Considering the total number of species and
families recorded in this study, the pattern of fish species diversity in Madeira Island
was relatively low when compared with littoral areas of tropical and subtropical islands
in the Atlantic. This reinforces the statement that fish diversity characteristically
decreases from tropical to temperate latitudes. The fact that Madeira Island has oceanic
and oligotrophic surrounding waters coupled with the nearshore environment alterations
arisen from increased tourism development and the over-exploitation of fishery

Cláudia Ribeiro
vi
resources through the use of very destructive fishing practices, as happened in the
neighbour Canarian archipelago, can explain the reduced species diversity.
From the overall list of species observed, 34 appeared in the entire area of study,
revealing high level of similarity in species composition among areas. There was a
special-temporal dominance of a small group of species, which composed the group of
common species, whatever the location or any other factor considered in the sampling
design. In that group of species were included: Abudefduf luridus, Chromis limbata,
Thalassoma pavo, Sphoeroides marmoratus, Sparisoma cretense, as the most common
and abundantly observed. Moreover, the percentage of rare species in the entire area of
study was high; 27 species appeared in less than 25% of the visual counts.
Depth and season were significant factors affecting species composition and
abundance, but reserve designation did not significantly affect total abundance or mean
number of species observed. The present results indicate that species composition and
structure of the fish communities inhabiting the rocky reefs of Madeira Island were
influenced by reef type, namely natural vs artificial, and the total number of species and
the abundance of some demersal species observed in the artificial riprap of Madeira
airport were less than in the natural locations studied.
Total abundance inside the reserve was less than in fished areas, mainly due to
the presence of large schools of pelagic species outside the reserve. Though the results
of this study showed that temporal trend in species richness was not affected by reserve
effect, the sites examined in GMR have to some extent met the objective of preserving
significantly higher number of matured-sized fish and thereby showing potential
spawning stock. Additionally, considering just demersal fish abundance, several species,
particularly exploited species such as Sparisoma cretense and Mycteroperca fusca, were
more abundant and with higher frequency of occurrence inside the reserve and the
dusky grouper, a widely targeted species across its range was exclusively recorded
inside the reserve area, but with very low frequency and abundance.
Although this study provided base-line data for ecological management purposes
it is essential that further quantitative studies be conducted on densities, size structure as
well in settlement and recruitment processes, to fully acknowledge the inshore fish
communities inhabiting the island.
The paucity of information obtained till date on reef fish communities of
Madeira Island can be highlighted as a failure in the establishment and assessment of
the effects of human activities on coastal reefs resources. Hence, the combination of

Comparison of Rocky Reef Fish Communities Using Underwater Visual Techniques
vii
present results with the existing from few previous works will help to broaden our
understanding of the coastal reefs communities of Madeira Island.


Comparison of Rocky Reef Fish Communities Using Underwater Visual Techniques
1
Chapter 1: GENERAL INTRODUCTION
1.1 - Studies of Madeiran marine fish communities
Madeira archipelago, due its geographic position as oceanic islands in the
eastern Atlantic, is of particular interest to biologists because of its isolation, mode of
origin, climatic characteristics and consequent biological peculiarities (Báez, 1993).
Besides the intrinsic interest of islands, Madeira particularly had featured strongly the
development of evolutionary and ecological ideas from the earliest formal studies
(Darwin, 1859). Terrestrial biota has been more extensively studied than the marine
environment and the ichthyofauna works were mainly taxonomic. Moreover, the costs
and rigorous environmental conditions of the rugged coastline have made the consistent
acquisition of sufficient information difficult and the available scientific manpower is
often insufficient to generate the amount and diversity of information needed for
research or monitoring, as have been referred to other regions in the world (Pattengill,
1998).
The existing works on fishes focus on systematic ichthyology (Lowe, 1843-60;
Maul, 1948; Saldanha et al., 1986; Heemstra, 1991). Some were reports on fishes
species captured in expeditions, including checklists of the fish fauna (Maul, 1962;
Mead, 1964; Maul, 1976; Araújo et al., 2005) and descriptions of fish occurrence to
Madeira Island, (Maul, 1969; Araújo & Freitas, 2002; Freitas & Biscoito, 2002; Alves
& Alves, 2002), which continue to be reported to date. Indeed, some fish species
discovered to occur in Madeira Island in the last few years (e.g. Biscoito & Wirtz, 1994;
Alves & Alves, 2002; Araújo & Freitas, 2002; Freitas & Biscoito, 2002) are coastal and
not offshore/bathyal where it would be more natural to discover new species (Alves and
Alves, 2002). Additional investigations were carried out on particular aspects of certain
fish species (Morales-Nin & Sena-Carvalho, 1996; Andrade et al., 1998; Costa et al.,
1998) and in the biogeography of the Macaronesian ichthyofauna (Lloris et al., 1991).
Guides to fishes and invertebrates from Madeira archipelago are also available (Wirtz,
1994, 1995b; 2001; Araújo & Calado, 2003), whilst few studies have dealt with the
littoral zone and undertaken on the classification of marine communities in the island
(Augier, 1985; Bianchi et al., 1998; Neto et al., 2001). There are few quantitative
surveys conducted about community structure, mostly of the habitats remaining poorly
described and historic data on population densities for reef-associated species in
Madeira Island are almost completely lacking.

Cláudia Ribeiro
2
According to Bianchi et al. (1998) the hard-bottom littoral communities of the
whole Macaronesia are poorly known with the exception of the Canaries (Brito et al.,
2002). Morato et al. (2003) noted that little work has been done on the populations
inhabiting the shore habitats of the north Atlantic oceanic islands and Hawkins et al.
(2000) reinforced that much work remain to be done on Macaronesia shores and that
they are calling for further studies.
Only five studies on fish assemblages assessment using the visual census
methodology have been carried out in Madeira (Andrade & Albuquerque, 1995; Bianchi
et al., 1998; Delgado, 1998; Mello, 2000; Ribeiro et al., 2005). Additional papers have
been published on some of the islands of the Macaronesia Region (Báez & Sánchez-
Pinto, 1983; Beyhl et al., 1995): Azores (Azevedo, 1995; 1997; Harmelin-Vivien et al.,
2001), Desertas (Ré, 1978) Selvagens (Falcón et al., 2001), Canary Islands (Bortone et
al., 1991; Falcón et al., 1996; Bianchi et al., 2000; Hajagos & Van Tassel, 2001) and
Cape Verde Islands (Brito et al., 1999). Also lacking are data regarding the structure of
fish communities in the marine reserves of Madeira archipelago, and despite the
importance of Garajau Partial Nature reserve (hereafter named GMR), as the first
exclusive marine reserve in Portugal, the literature on its communities and environment
is scarce. Delgado (1998) reported a list of fishes and invertebrates in GMR through
underwater sightings and Mello (2000) reported a list of fish recorded in transect
surveys performed in the bay that gives name to the reserve (Garajau bay). Concerning
the other marine reserves in Madeira archipelago, there is a small note on the littoral
fish fauna of Desertas Islands, long before reserve establishment (Ré, 1978) and Falcón
et al. (2001) presented a checklist of inshore fishes of Selvagens Islands, obtained
during the expedition Macaronesia 2000. Therefore, this current lack of information
about the marine resources of Madeira coastal reefs, causes difficulties in the
assessment of human impacts on these assemblages, as been pointed by several authors
in other regions of the world (Otway, 1995; Connell & Lincoln Smith, 1999). That fact
should be target of concern due to recent increase in the level of human activities on the
marine environment in the world, including Madeira Island. There is an urgent need for
obtaining information on fish assemblages structure and of other marine resources in
order to identifye the effects of human activities on them.
The issue of nature conservation and sustainable use has been in certain level a
matter of concern in Madeira archipelago. Indeed, the first Portuguese natural reserve
was created in Selvagens Islands in 1971 in order to preserve the islands from the

Comparison of Rocky Reef Fish Communities Using Underwater Visual Techniques
3
exploitation that was suffering, mostly the bird life (Mendes et al., 2000). Despite being
one of the most densely populated regions in Europe, Madeira Island has more than
60% of the island declared as Nature Reserve Park. In 1982 the Regional Government
of Madeira declared approximately two thirds of the main island as natural park: Parque
Natural da Madeira (hereafter PNM) with a prohibition on capture or disturbance of
native species. Besides PNM, in Madeira archipelago there are also protected areas that
included marine environment (MPA – marine protected area) (see Figure 1 and Table I).
So far, four MPAs have been established in the archipelago, demonstrating the interest
in the protection of privileged areas and in heritage preservation (Freitas et al., 2004).
Nevertheless, even when the political will exists to manage coastal resources,
governments and communities often lack the skills and necessary resources for effective
management (Roberts, 1997) and without an effective enforcement and people
“education” about the importance of resources conservation, the results of MPAs
creation will be minors (see chapter 4 for more details on MPAs).
Table I - Marine Protected Areas in Madeira Archipelago a - Exclusively marine reserves; b - Biogenetic reserve by the European conseil; c- Classified by the European conseil
Marine reserves in Madeira archipelago have been established for many years,
(e.g. Garajau Marine Reserve was created 20 years ago) and inherently provide several
roles, but there’s no quantitative information on the marine resources they protect,
neither publications showing the efficacy of this course of protective action, nor
demonstration about the ways fish and remaining marine resources are affected by
reserve management strategy. In fact, concerning their impact over the littoral fishes,
there’s no quantification on the benefits they may provide, neither considerations about
optimal approaches for their design and management. As previously referred, only
Bianchi et al. (1998), Delgado (1998), Mello (2000) and Freitas et al. (2004) referred
Area (km2) Sea land total
Protected area Established
Management Enforcement References
Garajau Partial Nature Reserve (GMR)a
1986 3,76 PNM (Madeira Government)
During the day only Castro et al, 1985 Delgado, 1998 Mello, 200 SRARN, 2004
Sítio da Rocha do Navio Nature Reserve a
1997 3,1 14 17,1 PNM (Madeira Government)
Negligible SRARN, 2004
Ilhas Desertas Nature Reserveb
1990 82,49 14,23 96,72 PNM (Madeira Government)
During the day only Ré, 1978
Ilhas Selvagens Nature Reservec
1971 3,62. 58,35 94,55 PNM (Madeira Government)
During the day only Falcón et al., 2001

Cláudia Ribeiro
4
some description of benthic and fish communities from GMR and Falcón et al. (2001)
provided a basic list of the littoral fishes from Selvagens. Furthermore, many scientists
and managers now accept that an ecosystem approach is needed to evaluate the
establishment of marine or fish reserves. Efforts have been made in many forum to
explain the ‘ecosystem approach’ is an evolution in the management of human activities
in the seas and not a revolution (Rice, 2005). Thus, to achieve that type of management,
information on resources and their interdependencies is required, including potential
trophic interactions (Watson et al., 2000). Since till date, such studies have yet not been
conducted in Madeira Island and evidences available from reefs environments from
other regions cannot reliably be generalized to the type of existing marine reserves, it is
really important the development of marine resources assessment studies on the marine
reserves existing in Madeira archipelago. Furthermore, the evaluation of the
effectiveness of measures implemented in the marine protected areas is an essential step
for developing sustainable conservation strategies (Allison et al., 1998).
1.2 - Main pressures in worldwide coastal communities focusing Madeira Island
The habitats and their fish assemblages are potentially affected by several
anthropogenic pressures, which may have a direct influence on food resources either in
terms of distribution, abundance, growth, survival and behaviour. Hence, habitat is
relevant to how the environment affects the resources used by humans, how humans
change the ecosystem and to view management as an integrated task of planning and
managing, rather than a piecemeal activity-specific and jurisdiction-specific regulation
(Rice, 2005).
Habitat disturbance by fishing activities has been referred as the dominant
anthropogenic effect on the marine environment (Dayton et al., 1995; Jackson & Sala,
2001). In effect, Macaronesia shores have been heavily exploited for food since
colonization of the islands by people: the Guanche and subsequently the Spanish in the
Canaries; and the Portuguese in the Azores and Madeira (Hawkins et al., 2000). Fishing
has a long tradition in Madeira Island and has been an important factor in the success of
human colonization in the region (Mendes et al., 2000). For many years fish resources
in Madeira Island were exploited by a small artisanal fishery that harvested manly the
deep-see resource, the black scabbard fish, Aphanopus carbo, tunas (mainly Thunnus

Comparison of Rocky Reef Fish Communities Using Underwater Visual Techniques
5
obesus, Kwatsamus pelamis and T. alalunga) and pelagic species such as Trachurus
picturatus and Scomber japonicus. These three sectors compose the largest fraction of
the fishery production, while the fishery along shallow bottoms of the island is multi-
species and entirely artisanal as in the neighbour Canarian archipelago (Tuya et al.,
2006). The use of gill nets has been discouraged and in the last decade no licenses have
been issued by the regional fisheries department for this gear. Hook and line, traps and
spears are the commonly type of gears used, catching a wide number of species
including sea breams (Pagrus pagrus, Diplodus spp., Dentex gibbosus), parrotfish
(Sparisoma cretense), small groupers (Serranus atricauda) among others. However
these catches represent a small fraction of the total fished resources, namely 10% (by
weight) according to 1997 data (Mendes et al., 2000). Additionally, the use of illegal
fisheries with explosives were common in Madeira coastal waters (Castro et al., 1985)
and that type of fishing practice was habitat destructive, having repercussions on the
environment and all biological community. Besides the fish catches, limpets (Patella
aspera and P. candei) have also suffered from heavy exploitation in Madeira
archipelago.
The use of inappropriate fishing gears such as trammel nets and explosives, raw
sewage discharges, sand mining and land discharges are all activities occurring along
Madeira Island coast and therefore, affecting the marine environment. For instance,
Wirtz (2005) describe a large and dense sea grass meadow that existed in Machico bay,
that has now disappeared completely, since the extension of port and its piers had
changed the current system in the bay and the river had discharged large amounts of
mud over the area. Although the absence of more biological data to describe this
situation in Madeira Island, this same type of habitat impact have been reported to the
neighbour Canarian archipelago ( Bacallado et al., 1989; Bortone et al., 1994) where the
same type of inshore activities occurred and where habitat and faunal similarities
between archipelagos exist.
Although fishing is an ancient activity in Madeira island, this activity has low
weight on the economic structure either in terms of production (1.5% of the gross
domestic product) and in terms of employment (Mendes et al., 2000). Nevertheless, the
fishing value and relevance overwhelms the economic indicators, either by the food
resources it generates and its quality, assuming particular importance in insular regions,
as for the turistic attraction associated to fisheries.

Cláudia Ribeiro
6
Although Madeira has a vast EEZ (exclusive economic zone) about 500 times
the terrestrial area, its fishery resources are not very abundant due the features of the
ocean bottom, which include the almost inexistent continental shelf, and the low
primary production that is typical of an oceanic region without upwelling. The
vulnerabilility of the inshore marine resources of the island can be considered even
greater due its volcanic origin that lead to the narrow continental shelf, confining coastal
reef fish populations to few kilometers from shore (in about 0.5 to 1km). In that sense,
information on the levels of fishing pressure (artisanal, illegal, etc.) and other human
pressures along coastline is pivotal to the interpretation of spatial patterns of reef fish
and it’s importance determining on reef fish communities have been widely emphasized
in other regions of the world (Ferreira et al., 2004).
Human presence has increased in most natural habitats of the globe (Garrabou et
al., 1998), inducing habitat loss caused by coastal reclamation and development with
associated pollution that lead to changes in water clarity, sediment loading and added
nutrient input (Short & Wyllie-Echeverria, 1996). Madeira Island is no exception and
recent hotel, tourism and urban development lead to excessive growth with direct
impact on the marine environment. Indeed, tourism and recreation-related activities and
developments have been recognized as one of the main pressures on coastal seas (Jones,
2002). The increased anthropogenic pressure in Madeira Island has placed new and
unprecedented demands on the coastal marine resources with the continuous
degradation of inshore habitats. The coast have been extensively altered in the last
decade by artificial harbours, marinas, ripraps, beaches and hotels, has happened in the
neighbour Canarian archipelago (Hajagos & Van Tassel, 2001).
Development often involves modification or “armouring” of shorelines, defined
as the placement of bulkhead, seawalls and riprap in areas that lack substrate. These
structures can extend from the subtidal zone through the intertidal and into purely
terrestrial realm, oftening replace more than half of a bay’s natural shoreline. In effect,
extensive artificial rocky habitats in the form of rock groins, revetment walls and
wharves have been built along Madeira Island coast. The rubble mounds are well
known for being protective barriers against undesirable sea conditions and resultant
erosion effects and are also known to introduce modifications on the shore and also as
an effective aggregating device for marine organisms, especially fishes (Carlisle et al.,
1964; Johnson & Wit, 1978), even though they were not originally designed to do so
(Burchmore et al., 1985). Thus, in Madeira Island, several structures rubble mounds

Comparison of Rocky Reef Fish Communities Using Underwater Visual Techniques
7
alike have been implemented on the shore, some of them to protect beaches (Ponta
Delgada, Porto Moniz, etc.) or to create artificial beaches (Calheta), others were
deployed in constructions such as marinas (Marina da Quinta do Lorde - Caniçal,
Marina do Lugar de Baixo – Ponta do Sol, Marina da Calheta) or to extend the land, has
in Madeira airport construction (Figure 2). The environmental precautions taken in
those coastal interventions were minor, with silt and land being dumped on the sea and
no consistent environmental impact studies performed. Furthermore, the
deployment/construction of several ripraps or harbours along Madeira coast (Caniçal,
Machico, Airport, S. Pedro – Santa Cruz, Porto Novo, Reis Magos – Caniço, Ribeira
Brava, Ponta do Sol, etc. see Figure 3) lead to strong alterations on the shore with
aesthetical changes, wave movements, bottoms morphology and in biological
communities. These armoured structures are usually primarily designed as shoreline
support and though few exceptions, little consideration has been generally paid to the
ecological consequences of armouring. Thus, ecological roles and characteristics of
armoured biota are poorly documented in many places of the world (Davis et al., 2002),
which is the case of Madeira Island, where there is no previous reports about marine
communities associated to the locations where these ripraps were deployed/constructed
along the shore.
ARs have been used for a variety of purposes: to provide new habitat that will
theoretically increase numbers and biomass of depleted fish populations, directly
improving recreational and commercial fishing opportunities; they were also been used
to possibly mitigate other human activities (Grant et al., 1982; Grove, 1982; Matthews,
1985). Moreover, structures such oil, gas platforms and breakwaters and other structures
to control beach erosion serve secondarily as artificial reefs (Raymond, 1975; Wang,
1978), which is the case of the riprap of Madeira airport (ARMA).).
Additional man-made or artificial reefs (ARs) have been created by placing
suitable long-lived, stable and environmentally safe materials (usually steel or concrete)
on a selected area of the ocean bottom or coast. Indeed, that was the case in Jardim do
Mar (Southewest coast of Madeira Island) where the regional fishery department
deployed concrete ARs in the year 2000 and in the same year in Porto Santo Island it
was thunk a wreck, “o madeirense” an AR that is now searched for many scuba divers,
spear and recreational fishers (pers. obser). Generally, these structures are placed on
sandy bottom areas that would originally support low density fisheries or in areas where
fish populations have been depleted (Matthews, 1985). Once placed, it acts in the same

Cláudia Ribeiro
8
way that naturally occurring rock outcroppings do in providing hard substrates
necessary in the basic formation of a live-bottom reef community (Lindquist et al.,
1985). That fact is not new and most fishermen know that the best place to find fishes is
around a structure, such as a fallen log in a stream, a shipwreck or an artificial reef
(Gratwicke & Speight, 2005). Thus, human intervention via creation of artificial
habitats adds complexity to the aquatic environment (Bortone & Kimmel, 1991) with a
significant modification of the natural environment and its use has moved from attempts
to simply increase recreational fisheries to include using the structures to manage
multiple facets of the marine environment, as resource for protection and preservation,
tourism, mitigation, fish and invertebrate recruitment and production (Seaman, 2000).
Obviously the ability to use the artificial reef structures effectively in order to
accomplish the diverse goals will depend in turn, on the understanding of the potential
interactions between the structure itself and the immediate environment in which they
were placed (Sherman et al., 1999).
Strong conflicts happened in 2003-2004 with surfers and the ecologist
organization COSMOS against Madeira politicians and developers. “Save the Waves
Coalition” organization “fought” with Madeira government authorities in order to avoid
what they call today as the “Lost Jewel of the Atlantic”. Indeed, this organization
realized a movie titled “The Lost Jewel of the Atlantic” highlighting the consequences
that the seawalls built in Jardim do Mar, Lugar de Baixo and Ponta Delgada had on
wave movements and the repercussions in terms of surf and in some degree in surf-
tourism-related.

Comparison of Rocky Reef Fish Communities Using Underwater Visual Techniques
9
Figure 1 - Madeira archipelago with the protected areas under regulation of Parque Natural da Madeira and GMR. After deployment of any structure (ARs or ripraps), it become interactive
(positively and/or negatively) with surrounding habitat and therefore introducs a source
of variation in natural habitat (Bortone & Kimmel, 1991), creating a physical
discontinuity in bottom that causes several physical and biological modifications on the
environment (Charbonnel et al., 2001). This new substrate is thereby available to be
colonized and consequently comparison of fauna and flora of those artificial with
natural reefs is needed and is an inevitable consequence of the human comparative
process and a worthwhile endeavour (Bortone & Kimmel, 1991). Therefore, one of the

Cláudia Ribeiro
10
present project purposes was to describe the fish assemblage associated with such an
artificial structure, determine how it functioned as fish habitat and compared its fish
community to nearby natural reefs. Indeed understanding how fish species are attracted
to these structures could help in the future to incorporate specific design changes in
attempt. For instance, Hastings (1979) studying the fish fauna inhabiting rubble-mound
structures along the gulf of Mexico Atlantic coast of the United States, recommended
that jetties should be structured to provide maximum hard substrate availability and in
deeper depths.
Figure 2 – Madeira Airport landing strip construction. More than half width of the landing strip was from landfill in the sea. Besides the aforementioned causes of environmental degradation in Madeira
shore, there are also: 1) sediment extractive activity (sand) occurring along the South
coast of the island, with dredge boats pumping sediment from the near shore sand
bottoms; 2) strong runoff and discharges of sediments in stream mouths that cause a
huge decrease in water clarity, with ”brown waters” for many days affecting subtidal
communities, mostly algae that depend on the light and thus influencing the entire
communities, since macroalgae presence can in turn affect densities of fishes (Choat
and Ayling, 1987). Significative changes in the nature of the bottoms also will occur,
with rocks getting covered by sand and thus losing habitat complexity. This fact has
indirect effects in diversity and abundance, since inshore sandy substrata are
homogeneous environments that often support fish populations with lower abundance
and richness than the nearby rocky substrates with higher structural complexity
(Guidetti, 2000; Guidetti et al., 2002b). Thus, conservation and management of marine
resources in Madeira Island face a major problem that is to balance the human
extractive activities and habitat destruction against the capability of the ecosystems
replenishes and it sustains the resources.

Comparison of Rocky Reef Fish Communities Using Underwater Visual Techniques
11
Most impacts occur in coastal seas where the majority of critical areas for
ecosystem functioning and productivity are found. Therefore, the protection of such
critical areas is of paramount importance (Agardy, 1997) and some authors go further
claiming for iniatives to restore coastal marine ecosystems back to their original states
than using more recent “shifting baselines” as restoration targets (Jackson & Sala, 2001;
Pitcher, 2001). In fact, according to Jackson and Sala (2001) such ambitious measures
are necessary to restore ecosystem resilience to other anthropogenic impacts, such as
eutrophication and global warming. The anthropogenic disturbance and climate change
have caused dramatic shifts in the organization and structure of many coastal
communities, with the establishment of alternate stable states (Knowlton, 2004).
However, for the majority of the observers of coastal seas, most of the adverse effects of
disturbance are not apparent and even for people that are aware on the adverse effects of
certain uses, our lack of familiarity and empathy with most marine life and its general
lack of intrinsic appeal, mean that the reaction is more likely to be one of indifference.
There is a societal perception problem in this respect and many people do not appreciate
the importance of marine ecosystem goods and services (Peterson & Lubchenco, 1997),
coupled with the fact that marine populations do not follow familiar seasonal patterns
and that sea itself is also often seen as an adversary. Nevertheless, it is important to
remember that such alienation and perception hurdles can also positively affect and
influence human perception of the seas, with many people having a particular interest in
marine life because it is unusual, mysterious and unpredictable (Kenchington, 1990).
Unfortunately, human behaviour related to the sea is largely defined in terms of the
resources it provides, particularly as a place to harvest fish, dilute and disperse liquid
wastes and undertake marine navigation (Cole-King, 1995) and therefore marine
ecosystem conservation is generally a low societal priority (Jones, 2002).
The overwhelming value of biodiversity as an indicator of environmental health
and in the functioning of ecosystems is now largely recognised by academic scientists,
mass media, decision makers and public opinion (Bianchi & Morri, 2000). Moreover,
one of the ecological tenets justifying biodiversity conservation is that diversity begets
stability and therefore, biodiversity can represent a form of biological insurance against
the loss or poor performance of selected species (Tilman et al., 1994). Furthermore, and
more specifically, there is a growing awareness of the high value of coastal seas in
terms of the ecosystems services they provide (Constanza et al., 1997), leading to calls
for a more process-oriented approach to marine conservation. However, the increase

Cláudia Ribeiro
12
and widespread process of degradation of marine biota, reducing habitat availability for
species (Tilman et al., 1994), altering ecosystems structure and functioning (Gessner et
al., 2004) with further modifications of marine fish communities has the negative
potential to threaten biodiversity (Vanderklift et al., 1998; Roberts & Hawkins, 1999).
Some authors identify the rate of loss of biodiversity as a cause for alarm (Walker,
1995) and the evidence of marine biodiversity decline has been noted world-wide
(Pauly & Watson, 2003). In effect, regional ecosystems such as coastal (Jackson et al.,
2001) and oceanic (Worm et al., 2005) fish communities are rapidly loosing
populations, species or entire functional groups.
Major changes in communities might only be detectable over long periods
through long time-series that may suffer from inherent changes in survey methodology
(Trenkel et al., 2004). In spite of methodology problems, because of fishes’ dependence
on specific types of habitats and food, alterations that are detected over time in their
distribution and abundance may indicate significant environmental change. Warwick
(1993) determined that the aquatic flora and fauna associated with temperate rocky reefs
are relative diverse, abundant and sedentary and therefore regarded as suitable
indicators of environmental changes. The perturbations in marine system resulting from
human activity have resulted in habitat change and species loss with several authors
reporting that fish assemblages may respond to disturbances such sewage discharges
(Grigg, 1994; Chabanet et al., 1995) and alterations of benthic substrates (Shepherd et
al., 1992; Lewis, 1998). Alterations of rocky habitats have been also shown to induce a
marked decrease in species richness, abundance and size of the associated fishes (Lewis,
1997; Samoilys, 1998 Jennings & Kaiser, 1998). The fundamental alterations to
ecosystem structure include changes in species diversity, abundance, size structure, sex
ratios and behaviour, habitat structure, trophic dynamics, biogeochemistry and
biological interactions (Lubchenco et al., 2003). These alterations are often an
indication of underlying ecological changes (Hughes, 1996) and therefore, it is
important that conflicts between conservation and exploitation are solved if the goal of
sustainable development and protection of natural resources are to be assured. Indeed
this worldwide exploitation of marine organisms has prompted actions to minimize the
decline of economically valuable populations (Tuya et al., 2000).

Comparison of Rocky Reef Fish Communities Using Underwater Visual Techniques
13
1.3 - The importance of the study of coastal reef fish communities
Natural assemblages and populations have been widely used in applied ecology
to detect human impacts in marine environments (Warwick, 1993). Generally the
approach has been the measurement of a biological variable associated with
enviromental impact and monitors it in time and space (Guidetti et al., 2002a). Fishes,
that are often a major component of tropical and subtropical faunas are amongst the
most diverse vertebrate assemblages in the world (Caley, 1995) and have been more
particularly focus of monitoring and management programmes to evaluate the condition
of exploited assemblages and have also been extensivly studied in reef communities
(Hatcher et al., 1989). Additionally, the fish fauna is an effective reference point for the
assessment of the efficacy of MPA management (since fishes are target of exploitation)
and represents a main attraction of recreational activities such as scuba diving (Tunesi et
al., 2006). The growing demand for appropriate management strategy and enforcement
of the existing regulations led to an urgent need to obtain baseline data on regional
faunal assemblages. In fact, it has become apparent that much of the information
necessary to set in place properly constructed management strategies does not exist
(Craig et al., 2004). Hence, abundance estimation have been central in many ecological
field studies (Thompson & Mapstone, 1997), with baseline data on fish assemblages
needed to establish resource management guidelines in order to evaluate the responses
of these assemblages to man-made or natural perturbations and also to assist
ichthyologists in locating a specific population. These non-manipulative studies provide
descriptions of ecosystems structure and temporal dynamics and are used to explore
hypothesis (Sale et al., 1994). Furthermore, the study of oceanic island communities
due their isolation has been of great importance for development of current concepts of
biological evolution and biogeographical theories (Báez, 1993). Besides all these
reasons, it is extremely important to produce basic knowledge in terms of diversity and
abundance of local resources, in order to develop precise models and thus achieve better
understanding of the local rocky shore reefs systems. Therefore, for management of
natural resources, monitoring programs are valuable to documenting the status of
systems and very important to sustain the local preservation effort in the future (Ferreira
et al., 2001).
Rocky reefs supply food resources, nurseries and shelters to a variety of
organisms, sustaining biodiversity due three-dimensional complexity (Turner et al.,

Cláudia Ribeiro
14
1999). Therefore, degradation of these systems could have negative resonance in the
whole coastal biota and strong socio-economical implications (Witman & Dayton,
2001). The fish assemblages of Madeira littoral rocky reefs additionally have an
intrinsic value of economic revenue to the island, through artisanal fishery and
underwater tourism, which is a growing sector. Moreover, the coast of Madeira provides
unique conditions for the development of science, recreation and tourism (Freitas et al.,
2004).
Extensive literature about coral reef fishes exists (e.g. Sale, 1980b; Sale et al.,
1994), but only few have been done in temperate rocky habitats (Falcón et al., 1996;
Guidetti & Bussotti, 2000). Temperate reefs are useful models for studying structure of
reef assemblages because they have a fairly comparatively easy taxonomy, with fewer
problems in fish identification than with benthic invertebrate fauna identification
(Warwick, 1993). Indeed, the ease with which fish species can be recognized in the field
makes them an inexpensive source of comparison, and one that can be acquired rapidly
(Bond et al., 1999). Besides that, they allow the use of underwater visual methods,
techniques which are fast and effective standardised procedures for collecting
quantitative data in situ (Harmelin-Vivien et al., 1985), regularly used by researchers
(Denny & Babcock, 2004).
Reefs are structures composed by a variety of natural and artificial materials.
Natural reefs can be composed by living materials such as sponges, hard corals, and
vegetation and also by dead materials such as submerged logs, sipunculid worm casings
or nonliving material such as rocks, natural deposits, hardened volcanic extrusions, and
other geologic formations. The hardbottoms covered by macroalgae represent an
important source of primary production often sustaining well diversified animal
communities, that includes fishes (Choat & Ayling, 1987) and can even exert the crucial
role of nursery grounds for many fish species (García-Rubies & Macpherson, 1995),
providing substrate heterogeneity and physical relief (Bortone & Kimmel, 1991). The
reef areas are generally more complex than sea grass and algal beds and obviously more
complex than sandy areas. This habitat complexity as been largely recognized as one of
the factors affecting diversity, distribution, abundance and trophic organization of rocky
reef fishes (Ebeling et al., 1980; Angel & Ojeda, 2001). More complex habitats as
would be expected support more fishes, a pattern that has been noted by several authors
(Ebeling et al., 1980; Sedberry & Carter, 1993; Mateo & Tobias, 2001; Gratwicke &
Speight, 2005). Indeed, the increase in complexity reflects not only the potential shelter

Comparison of Rocky Reef Fish Communities Using Underwater Visual Techniques
15
sites available for fishes and their prey, but also the surface area available for
occupation by algae and invertebrates (Luckhurst & Luckhurst, 1978). Ebeling et al.
(1980) demonstrated that more complex rock-reef surfaces harbour greater diversity and
abundance of reef fishes and despite their lower complexity when compared to coral
reefs, rocky shores can also support a rich reef fauna and flora. According to Gratwicke
& Speight, (2005) complex habitats are best for increasing local fish species richness,
but it should be remembered that all habitat types, regardless of their complexity, are
important in maintaining regional fish diversity because some fishes use different
habitats types at different stages of their ontogenetic development (Sedberry & Carter,
1993), whilst others are habitat specialists (Kirsch et al., 2002).
The structural complexity of coastal habitats has been shown to play a major role
in structuring fish assemblages (García-Charton & Pérez-Ruzafa, 1999b; Guidetti et al.,
2002a; García-Charton et al., 2004) and studies examining fish distribution across reefs
environments have found the habitat structure as having a major influence on
distribution and abundance patterns (Russ, 1985; Choat & Ayling, 1987). Although
space may be ultimately limiting factor, since reefs are a patchy resource, many reef fish
populations are not at the carrying capacity of their environment because abundance is
infuenced by a variety of physical and biological influences on settlement from the
plankton (Victor, 1983; Richards & Lindeman, 1987; Doherty & Williams, 1988) and
early post-settlement mortality (Sale & Ferrel, 1988). Despite the role of reef structure,
as a determinant of community structure for resident reef fishes (Risk, 1972; Gladfelter
et al., 1980) others view reef structure as playing a relatively minor role in comparison
to the process of recruitment (Sale & Dybdahl, 1975; Sale, 1980a; Alevizon et al.,
1985). There is a increasing suggestion that single-factor explanations for fish
assemblage structure are inadequate, focusing on the relative importance of factors that
can act at different spatial scales (Bennett & Moyle, 1996). Today, it is widely
recognized that communities of fishes are determined by several interacting factors,
including recruitment from the planktonic larval phase, interactions among the species
and the history of disturbances (Russ & Alcala, 1998).

Cláudia Ribeiro
16
Chapter 2: OBJECTIVES
This study concentrates on species associated to rocky coastal/inshore reefs,
common habitats along Madeira Island shore that consequently suffer from human
pressure, exploitation and environmental degradation. Thus, the purposes of the present
study were:
1) Provide reference qualitative and quantitative data on the structure of fish
communities in common rocky habitats in the protected area of GMR, in a common
natural unprotected costal area of Madeira, and in a artificial unprotected riprap from
the several occurring along the Madeira coast; and to evaluate the short term variability
of the icthyofauna for further monitor possible changes in the structure of these
communities.
2) Define the faunistic features of local fish communities in terms of abundance
and species richness relative to sea-bottom type in the three locations; and investigate
whether locations differ significantly in the fish assemblage and if there were seasonal
changes either in abundance, species richness and composition.
3) Compare and evaluate the efficiency and performance of three visual-census
methods (transect, point count and visual fast count) which have been commonly used
elsewhere and firstly simultaneously used for fish assessment in the rocky bottoms of
Madeira Island.
4) Determine the extent to which Garajau Marine Reserve protects different
assemblages of reef fishes, assessing possible protection effects, estimating benefits
from protection measures in certain target species and assess the importance of GMR as
habitat for marine fishes.
5) Determine how a riprap placed in a typical zone of Madeira shore it function
as a fish habitat and how the fish community differed from the natural rocky reefs of the
other two locations surveyed in the south coast of Madeira Island.
6) Examine the effect or the role of the factors: location, depth, bottom type and
seasons in shaping/structuring and maintaining the rocky reef fish assemblages.
7) Provide a set-up of the problems associated with the management of coastal
fish resources of Madeira Island and assesses the current status of the GMR as a fishery
and habitat conservation tool and therefore select some easily assessed parameters for
monitoring, updating current research activities in the MPAs and provide a framework

Comparison of Rocky Reef Fish Communities Using Underwater Visual Techniques
17
for future management decisions and also examine the rationale of an expansion or
continuity of the MPAs program in Madeira Island.

Cláudia Ribeiro
18
Chapter 3: VISUAL CENSUS TECHNIQUES: IT’S IMPORTANCE IN STUDIES OF COASTAL FISH COOMUNITIES
Historically fish communities assessments were carried via destructive
techniques such as explosives and poisoning (Gosline, 1965; Smith & Tyler, 1973;
Chave & Eckert, 1974; Russel et al., 1978) or using typical collecting gears such as
trawling (Bardach, 1959). However, these destructive methods result in deleterious
impacts as death of many fishes and other organisms and often physically change the
habitat. Consequently, these approaches turn out unacceptable for intensive studies of
fish assemblages and they should not be repeated and used in the same area (Lipej et al.,
2003). Moreover, the spatial irregular biotopes and high physical relief preclude the use
of these conventional surface-tended collecting devices such as trawling and dredging to
quantitatively sample reef fishes assemblages (Bortone et al., 1986).
The development of SCUBA diving gear and related techniques had greatly
facilitated the collection and sampling of reef fishes, using the underwater visual census
techniques (hereafter UVCTs). Indeed, immediately after the advent of SCUBA diving
its potential for scientific observation of the marine environment was realized and
therefore researchers no longer needed to rely only on “blind” methods and could
actually see their object of study in its natural environment (Azevedo, 1995). This
sampling method was firstly used by Brock (1954) to count Hawaiian reef fishes and
has subsequently become widespread (Chave & Eckert, 1974; Hobson, 1974; Sale &
Douglas, 1984), forming the basis of most studies on reef fish ecology (Willis, 2001).
The majority of recent ecological surveys associated with shallow subtidal reefs involve
sampling by diver (Edgar et al., 2004). Furthermore, the UVCTs are the most practical
non-destructive way to assess populations of fish associated either to rocky or coral
reefs (Bell et al., 1985) and this non-destructive nature makes it appealing to workers
conducting repeated observations (Willis, 2001).
Transect is the oldest (Brock, 1954; Bardach, 1959) and the most frequently
used method for visually surveying fishes and macro-invertebrates (Thresher & Gunn,
1986; Bortone & Kimmel, 1991). Many workers have used visual census on strip
transects (Slobodkin & Fishelson, 1974; Sale & Sharp, 1983; Harmelin-Vivien et al.,
1985), which are essentially modifications of Brock’s technique. Generally it have been
accepted as being the most quantitative visual assessment technique (DeMartini &
Roberts, 1982) with a great practical advantage over other methods since it can rapidly
censuses diverse and abundant assemblages across large spatial scales. Though affected

Comparison of Rocky Reef Fish Communities Using Underwater Visual Techniques
19
by variation in fish detectability (Thresher & Gunn, 1986), its biases are generally
systematic and probably not as great as widely perceived (Edgar et al., 2004). After
transect development other techniques appeared, including quadrats (Hastings, 1979),
patch counts (Molles, 1978), species-time rapid visual techniques (RVT) (Jones &
Thompson, 1978), which can be suitable when the desired goal is only to rapidly
produce a species list (Bohnsack, 1982); visual fast count technique (VFC) (Kimmel,
1985) and the stationary visual census technique or point count (PC) (Bohnsack &
Bannerot, 1986).
The UVCTS have been considerably modified and adopted by a number of
workers and among the many alternatives for gathering data, they were regularly used
by researchers has an important tool of fish ecologists; non-destructive and generally
cost-efficient method to quantify reef fishes, estimate their sizes and study their
distribution. Nonetheless, as Sale and Douglas (1981) referred they seldom completely
sample the fish assemblages at a site, but according to Brock (1982) although the most
criptical as well the most abundant species were underestimated, they give good
estimates for diurnal active species whilst nocturnal species were undetected (Kimmel,
1985). In fact, and according to several authors (Harmelin, 1987, Harmelin-Vivien &
Francour, 1992; Francour, 1994) today UVCTS have proved to be one of the most
efficient methods to assess the abundance and diversity of coastal fish assemblages,
which led to their adoption in many coastal resources studies (Russ, 1985; Samoilys &
Carlos, 2000) and in the present study. A visual census permits an estimate of the
density of one or more species with relatively little expenditure of field time and
without the disadvantages inherent of disturbance caused by a mark-recapture, or a
destructive sampling procedure.
No single method is equally successful for all species (Bond et al., 1999) and is
therefore unlikely that any single method used provide an unbiased sample of all
community constituents, i.e., none is able to measure changes in fish assemblages
accurately and precisely without introducing its own biases (Lincoln Smith, 1988;
1989). As with all field census methods, UVCTs are selective in respect to factors such
as size, appearance and behaviour of targeted organisms (Edgar et al., 2004). Moreover,
the accuracy of these methods is difficult to be adequately verifyed and tested (Watson
& Quinn, 1997), raising a continued concern on this matter (Brock, 1982; Sale & Sharp,
1983; Andrew & Mapstone, 1987). There have been several attempts utilizing multiple
methods to substantiate and add the faunal analysis: transects, rotenone and mark-and-

Cláudia Ribeiro
20
recapture was used by Bardach (1959) studying a natural Caribbean reef, Chave and
Eckert (1974) used quadrats and transects to estimate relative abundance and quantify
relative abundance of Hawaii fishes; qualitative observations plus photography and
video were used by Simpson, (1977) to evaluate fish assemblages associated to an oil
platform; Hastings (1979) coupled estimates of relative abundance with quadrat counts
to assess fish communities in a Jetty in the north-eastern Gulf of Mexico; Brock (1982)
compared visual transect data with rotenone collections in Hawaii; DeMartini and
Roberts (1982) tested biases between visual transects and the species-time random
count method, Kimmel (1985) presented a new species-time method (VFC) and its
comparison with transect and rapid visual technique; Bortone et al., (1986) compared
several in situ methods for quantification of reef fish assemblages in Virgin Islands and
Bortone et al. (1989) compared transect, point method and random method for visually
assess reef fish communities in Puerto Rico.
UVCT comparisons have not been performed for the type of rocky coastal reefs
existing in Madeira Island. To date just the transect method had been used for fish
communities assessment in Madeira Island (Andrade and Albuquerque, 1995; Delgado,
1998, Mello, 2000, Ribeiro et al., 2005). Moreover, the UVCTs were chosen as survey
method because studies on fish assemblages in MPAs must by definition be based on
non-disruptive sampling when fish assemblages are to be studied or monitored
(Harmelin, 1987; Harmelin-Vivien & Francour, 1992; Francour, 1994; Mouillot et al.,
1999). Indeed, their use has long been suggested for assessing fish within MPAs
(Harmelin-Vivien et al., 1985; Harmelin, 1987), not altering the environmental integrity
ensured by the protection regime (La Mesa & Vachi, 1999). The use of destructive
sampling techniques are, for the most part, prohibited in MPAs (Willis et al., 2000) and
visual surveys are the most frequently used non-destructive technique for estimating
reef (Sale, 1980a; Harmelin, 1987) and seagrass fish assemblages that meet the previous
requirement and thereby it allows community assessment without organism removal
conversely to other traditional techniques (Barans & Bortone, 1983). They were used
for a number of purposes and in particular for sampling sensitive habitats and for
comparisons between reserves and nearby fished areas (Roberts & Polunin, 1991;
Polunin & Roberts, 1993; Letourneur, 1996). So that, in the present study three different
UVCT were used: transect method, point count or stationary visual technique and visual
fast count method.

Comparison of Rocky Reef Fish Communities Using Underwater Visual Techniques
21
Chapter 4: MPA’S
4.1 - Considerations on MPAs
This section reviews some of the relevant and current thinking on MPAs,
conservation and marine ecology.
The term marine protected areas (MPAs), includes intertidal reserves and areas
focused on the protection of shipwrecks, archaeological remains, etc. The IUCN defines
MPA as any area of littoral or subtidal terrain, together with its overlying water and
associated flora, fauna, historical and cultural features, which has been reserved by law
or other effective means to protect part or all of the enclosed environment (Kelleher &
Kenchington, 1992). The term is so broad and vague that it has little value (Ballantine,
1999) and generally may obscure marine nature conservation objectives (Jones, 1994).
A plethora of terms are used to describe such areas, also referred as marine reserves, no-
take areas, closed areas, marine harvest refuges and marine sanctuaries (Shirai &
Harada, 2003). Areas of the marine environment protected from various forms of human
exploitation depending upon the policy framework within which they were designated;
principal objectives, and the level of protection which is afforded to achieve these
objectives (Russ & Alcala, 1998). Ballantine (1999) argues that the term “marine
reserve” should be used generally in order to rationalize site-based approaches to marine
conservation, and that sites designated as such should always be strictly protected
against extractive activities and disturbance (Jones, 2002).
MPAs present diversity in size, environmental traits, protection level,
enforcement efficiency and human pressure from surrounding areas. Some comprise
exceptional features that limit their comparability; others are partially harvested by
professional and recreational fishers and/or heavily exploited by the tourism industry as
a source of aesthetic values and to promote interest in marine wildlife and related
tourism opportunities. Furthermore, in places where intense diving occurs, artificial fish
behaviour frequently occurs, especially when fish feeding or spearfishing is practiced.
Indeed, changes in observed communities’ structure may arise from the fish-diver
mutual attraction in reserves (Harmelin et al., 1995) or diver avoidance in areas that are
spearfished.
Marine reserves have been recognized widely as a powerful tool for marine
conservation (Lubchenco et al., 2003) and strongly advocated as an ideal tool for the
management of coastal fisheries (Roberts & Polunin, 1991; Agardy, 2000), based on the

Cláudia Ribeiro
22
perception that fishery management techniques have failed to prevent overexploitation
of targeted species (FAO, 1995; Murawski et al., 2000) and the depletion of no target
species, habitat degradation and associated disruption of the food chain (Polunin &
Roberts, 1993; Dayton et al., 1995; Pauly et al., 2002). Indeed marine reserves address
the main themes of marine ecosystem-based management by contributing to the
maintenance of biodiversity and ecological processes that maintain resilience while
enhancing fisheries, increasing opportunities for nonconsumptive activities and building
knowledge for improving coastal management (Dayton et al., 2000). Thereby, marine
reserves have been a fundamental legislative step in marine conservation and are
increasingly seen as refuges for conserving biodiversity (Kelleher & Kenchington,
1992; Jones, 1994; Gubbay, 1995; Denny & Babcock, 2004). Furthermore, it is argued
that marine species are potentially more vulnerable to extinction than has traditionally
been considered and its distribution and taxonomy is poorly known when compared to
terrestrial species (Edgar and Barret, 1999), so that MPAs have the potential to be an
important tool in reducing the risk of such extinctions (Jones, 2002). In fact, marine
reserves are thought to help to preserve resilience by protecting key species and habitat,
thus leaving ecosystems with more capacity to resist stresses (Green et al., 1999) and
for that reason have then receiving considerable attention as a management option
(Bohnsack, 1990; 1996) and more recently promoted as a viable and practical
complement/alternative to the classic fisheries management methods (Roberts &
Polunin, 1991).
It is true that MPAs have been established in the last 40 years in numerous
localities of the world (Bell, 1983; García-Rubies & Zabala, 1990; Francour, 1991,
Harmelin et al., 1995) with the purpose of conservation, recreation, education and
natural resource management (NRC (National Research Council), 2001; Lubchenco et
al., 2003) as a response to anthropogenic disturbance (Soto, 2002). The world’s first
official MPA which included a substantial subtidal area was established at Glacier Bay,
Alaska in 1925, including coastal waters of importance to whale and seal populations
and ten year latter the first primarily subtidal MPA was established at Fort Jefferson
Florida (Jones, 2002).
MPAs are experiments imposed by management and can provide privileged
areas where experimental works on natural processes under conditions of limited human
disturbances can be carried out. Indeed, the establishment of marine reserves thus
represents a manipulative removal experiment at a vast spatial scale (Edgar & Barret,

Comparison of Rocky Reef Fish Communities Using Underwater Visual Techniques
23
1999). Therefore, they can be used to test hypotheses about specific effects of fishing in
abundance and age structure of fish population and upon community (Bevilacqua et al.,
2006). Additionally, they are often seen as means of developing and demonstrating the
overall benefits of management approaches which enable multiple uses to co-exist on a
sustainable basis in areas which are subject to a diversity of pressures (Kenchington &
Agardy, 1990). Consequently, marine reserves and others forms of MPAs have been
established throughout the world and have increased popularity in tropical and warm-
temperature waters (Harmelin et al., 1995), particularly in developing countries (Côté et
al., 2001). They are seen as a tourist attraction and an impetus for economic
development (Juanes, 2001) mainly due the increasing level of interest in water-based
recreation (Davis & Tisdell, 1995). Nonetheless, the designation of MPAs has
proceeded in a relative slow manner, only 125 being recognised by 1974 and 1306 by
1994 which compared to the 37000 terrestrial protected areas listed by the IUCN
indicate clearly that the progress with marine site protection has lagged behind
terrestrial initiatives (Jones, 2002). That fact is inherently related to a number of
attributes of inshore marine environments that in a certain degree limit the potential
effectiveness of such site specific approaches. In real, the understanding of the structure
and function of marine ecosystems is poor when compared to the terrestrial systems,
due logistical problems for observing and studying marine environments, the related
high costs, the complex and dynamic nature, besides the fact that humans are
predominantly terrestrial species (Jones, 2002). Thus, its development is considered to
be the key approach for assuring the successful co-existence of activities, which rely
upon a shared resource base.
The selection of MPAs has historically been opportunistic (Brunckhorst &
Bridgewater, 1994) and the vast majority were established without baseline information
and monitoring (Agardy, 1997) as the case of GMR. However, in areas in which a lack
of scientific information precludes a conventional population-based management, the
establishment of MPAs simplifies management and reduces enforcement costs (Côté et
al., 2001). It is well established that the locations and boundaries of many marine
reserves have been delimited through political processes, using such criteria as
economics, logistic or public acceptance. Indeed, government agencies have particular
mandates that influence the determination of the goals and criteria for selection and
design of MPAs (Soto, 2002). Such approach raise questions about their effectiveness in
conservation of biodiversity, but no guiding principles on the design of MPAs have yet

Cláudia Ribeiro
24
been established and not many examples of managerial success with MPA have been
seen (Shirai & Harada, 2003).
Many MPAs are in fact “paper parks”; reserves with no funding, no institutional
structure, and no enforcement - but even those that are funded, organized, and enforced
often undertake no monitoring or evaluation (Tupper & Hunte, 1998). Therefore it is
very important to develop scientifically credible methods of reserve selection, resulting
in maximal representation of biodiversity in reserves (Vanderklift et al., 1998). Indeed
some of the reasons why marine reserves have not been more widely used include the
uncertainties concerning the yield improvements that reserve can offer, issues referring
the placement and size of reserves and opposition to prohibiting fishing in areas that are
currently fished (Ballantine, 1999). Moreover, MPA management must often address a
relatively wide range of conflicts at a relatively wide spatial scale. The principle of the
“freedom of the seas” is widely recognized which leads to a general expectation
amongst many stakeholders of relatively open access and a resistance to proposals for
implement access restrictions (Jones, 2002). Therefore, detailed objectives are an
essential basis for MPA selection and effectiveness evaluation (Vanderklift et al.,
1998).
Areas included within MPAs may be selected on the basis of factors such as
high species richness, presence of locally endemic or rare species, high productivity, or
importance to marine organisms for spawning areas, nursery grounds, migratory path-
ways and/or feeding grounds (Smith & Theberge, 1986). In fact, one of the main goals
of the establishement of MPAs is the durable use of species and ecosystems, with
particular reference to commercial fish species (Kelleher & Kenchington, 1992). In the
scenario of protected areas that have been focused on saving specific “glamour species”,
i.e. a species-specific approach in order to protected endangered species is referred by
many authors has costly and not protecting the myriad of other species and habitats in
which they live, nor the ecological processes on which they depend (Walker, 1995). In
the case of reserves established specially toward fish conservation there is a premise
that, to be an effective conservation tool, the reserve should encompass the entire area
used by an assemblage of fish (Griffiths & Wilke, 2002). Thereby, ten general
objectives are an essential basis for inshore MPAs, primarily focusing on nature
conservation: 1) protect rare and vulnerable habitats and species; 2) conserve a
representative set of habitat types; 3) maintain and restore ecological functions; 4)
promote research and education; 5) harvest refugia; 6) control tourism and recreation; 7)

Comparison of Rocky Reef Fish Communities Using Underwater Visual Techniques
25
promote integrated coastal management; 8) maintain aesthetic values; 9) maintain
traditional uses; 10) cultural symbolic value of set-aside areas (Jones, 2002).
More recently scientific papers stressing the effects of protection on fish
assemblages are available (Bell, 1983; Harmelin, 1987; García-Rubies & Zabala, 1990;
Francour, 1991; Roberts & Polunin, 1991; Lubchenco et al., 2003), presenting some
conclusions about the ecological effects within marine reserves and outside their
boundaries and also developing hypotheses about the expected response of individuals,
populations, communities and ecosystems to the establishment of marine reserves
(Roberts & Polunin, 1991; Jones, 1992; Jennings et al., 1996; Allison et al., 1998).
Since the latter 1990s, studies on MPA have increased dramatically and several have
characterized some of the local responses of marine communities to protection from
fisheries (García-Rubies & Zabala, 1990; Polunin & Roberts, 1993; Francour, 1994;
Harmelin et al., 1995) and there’s a growing body of research demonstrating that MPAs
have an effect on resident assemblages of organisms (Edgar & Barret, 1997; Babcock et
al., 1999; Edgar & Barret, 1999; García-Charton et al., 2004). Nonetheless, comparative
studies about the effectiveness of MPA with traditional management tactics although
important, have not been conducted frequently (Shirai & Harada, 2003) and few authors
have ventured appraisals of how theses effects enable MPAs to achieve their intended
objectives. Thus, some scientists question many of the findings arisen from MPAs,
pointing that most studies of reserves employ designs that cannot unequivocally deliver
a verdict on whether they work. Moreover, the potential of MPAs as a management
tool, has yet to be realized due the fact that the science underlying effective MPA
development and management is poorly understood (Mascia, 2001), relying almost
entirely on theoretical basis (Edgar and Barret, 1999) due the lack of understanding the
abiotic and biotic dynamics and processes that shape marine communities
(Kenchington, 1990). From this, fundamental implications arise in terms of selection,
design, management and evaluation of MPAs, that are mainly related to factors such as
a lack of long-term baseline monitoring studies, lack of knowledge on trophic
relationships over different spatial and temporal scales coupled with difficulties in
gaining scientific evidence to support claims relating sustainable exploitation levels and
cause-effect relationships. Nevertheless, Ludwig et al., (1993) argued that scientific
uncertainty should not necessarily an obstacle to conservation initiatives and therefore
actions should be taken on an iterative and adaptative basis recognizing the question,
rather than delaying actions in the quest for scientific certainty.

Cláudia Ribeiro
26
MPA management essentially involves the minimisation of negative
interventions, through the restriction of certain activities in certain areas in order to
maintain relatively natural ecosystems, rather than the promotion of positive
interventions, through the selective continuation of certain activities in order to maintain
semi-natural habitats (Jones, 2002).
The strongest study design for reserves is considered to be before-after/control-
impact (BACI) assessment. BACI provides an appropriate framework to detect
ecological degradation in natural habitats (Stewart-Oaten et al., 1986) and the simplest
BACI design would consist of “one sampling time before and one after the impact and
more than one (sampling) location per each of two groups (control and impact)”. The
means of the control-impact differences can then be contrasted for the two sampling
times. Nonetheless, Green, (1979) and Underwood (1991) considered more than one
sampling time before and after the impact and a greater number of locations (control-
impact) to be more desirable, developing an alternative design to the basic BACI which
they called “beyond BACI” (Underwood, 1991). In the case of marine reserves effects
assessment it would be suitable three or more reserves paired with several control
locations and data collected at intervals before and after protection in order to the effects
of protection can be separated from those of habitat. Nonetheless, it is not hardly
surprising that few studies have achieved that level of design sophistication and, very
few have collected data on fishing effort without which it is impossible to know
whether absence of an effect is because reserves do not work or is just due to lack of
protection (Gell & Roberts, 2003).
The most evident reserve effects are: (1) increased global species richness due to
higher frequency of rare target species; (2) increased abundance of individuals,
particularly those of species targeted by fishing; (3) recovery of balanced demographic
structures, with a higher frequency of large individuals, leading in particular to an
increase in average size/age reflecting greater longevity of the protected species; (4)
recovery of natural behaviour (Harmelin, 1999); (5) socio-economic effects as the
protection of a cultural heritage, tourism development with provision of recreational
sites for divers and naturalists (Edgar et al., 1997); (6) provision of foci for local public
education about coastal life and environmental protection (Edgar et al., 1997; Chateau
and Wantiez, 2005). In turns, one indirect effect of marine reserves creation has been
the stimulation of some research fields, such as direct non-destructive studies of fish
assemblages associated with reefs (Harmelin, 1999) and have the merit of acting as

Comparison of Rocky Reef Fish Communities Using Underwater Visual Techniques
27
‘fields’ for studying anthropogenic effects on marine ecosystems (Shirai & Harada,
2003), and protection of areas where natural ecosystem processes can be scientifically
investigated.
It has become accepted that elimination of fishing mortality within marine
fishing reserves can lead to an increase in abundance and mean individual size of fishes,
especially for the larger predatory species generally targeted by fishing (Galal et al.,
2002). In fact, the general benefit considered is the restoration of an equilibrated
assemblage structure with ‘normal’ proportions of large adults and of high-level
predators (Harmelin et al., 1995). Reserves can protect the ecosystem within them from
the damaging fishing practices and have the potential to re-establish a natural ecosystem
balance. Although, field studies have generally demonstrated that fish stocks build up
within a protected area (Roberts & Polunin, 1991), much less information exists on
fishery enhancements and in practice, fisheries benefits from reserves have rarely been
demonstrated or even measured (Nowlis & Roberts, 1999). Despite the numerous meta-
analysis and theoretical studies showing the potential benefits of MPAs for re-
establishing and conserving fish stocks, data that empirically demonstrate their
effectiveness, especially in temperate waters, are scarce (Babcock et al., 1999).
Most of the mechanisms supposed to work in marine reserves have not yet been
demonstrated, since they are subjected to confounding with other casual processes not
directly related to protection. The forces that drive the spatial and temporal variation in
community structure (species composition and richness, species abundance, trophic
organization, size structure, etc.) can be both, physical (habitat structure, light and
nutrient availability, currents and wave exposure, etc.) and biological (recruitment,
predation, competition, mutualism, disturbance, etc.) in nature. The influence of the
physical environment, i.e., “habitat structure” can be a source of confounding when
measuring the effect of protection. Predictions about the relative importance of different
components of habitat complexity are practically impossible because there have been no
systematic studies across a range of habitats (Gratwicke & Speight, 2005). The point is
that, the influence of habitat structure interferes with the effects of protection, and the
‘reserve effect’ on community structure has to be investigated in combination with
spatial variation of habitat at a multi-scale perspective to avoid confunding (García-
Charton & Pérez-Ruzafa, 1999a). In order to describe, evaluate and manage the
effectiveness of marine reserves, all different aspects of heterogeneity must be taken
into consideration and it is needed a conceptual as well methodological framework for

Cláudia Ribeiro
28
dealing with it. This lack of field evidence reflects the difficulty of performing
controlled and replicated experiments in unpredictable political and biological systems.
Many studies compare fish assemblages in reserves to “similar” or “nearly
identical” fished areas some time after the reserve has been established. The number of
sites compared ranges from one inside the reserve and one outside to several of each
(Bell, 1983). Regardless of the number of sites compared, it is incorrect to attribute
changes in fish production to a reserve effect if no data were gathered before the reserve
being established, since differences observed after the reserve was established may
reflect further degradation of the fished area due increased fishing pressure after reserve
formation rather than enhancement within reserve (Tupper & Hunte, 1998). There are
difficulties in effectively demonstrating the reserve effects and predict outcomes of the
reserve implementation mostly due inadequate sampling methodology, inadequate
survey design and failure in obtaining suitable time-series data (both before and after
reserve closure) with consistent methods (Willis et al., 2000). The several studies on
marine reserves lack data collected prior to reserve implementation (Roberts & Polunin,
1991; Edgar & Barret, 1997), which means that natural site-related and temporal
variations in densities cannot be easily distinguished from a ‘reserve effect’. This
problem is not always easy solved because reserve establishment is a political process
and funding agencies may be reluctant to fund surveys of proposed areas until
conferment of reserve status is sure.
Research is demonstrating that marine reserves are a powerful management and
conservation tool, but were not a panacea; they cannot alleviate all problems, such as
pollution, climate change or over-fishing occurring outside the reserves boundaries.
Clearly the ecological and management-related attributes of marine environments will
significantly influence the potential effectiveness of MPA initiatives (Jones, 2002).
Their efficiency depends on several factors such as: i) species concerned, ii) size and
location of the MPA, iii) exploitation level of the zone before protection, and iv)
information and surveillance by the MPA management agency. These features limit
results, which could be positives, nulls or negatives in relation to the ones prospected.
Definitely MPAs are emerging as a powerful tool, but should be complemented by
others approaches (Lubchenco et al., 2003).
Species that respond most rapidly to protection are usually relatively sedentary
and spend much of their life in reserves, such as invertebrates (e.g. scallops, clams) but
also some relatively sedentary reef fishes (Murawski et al., 2000). Evidences are also

Comparison of Rocky Reef Fish Communities Using Underwater Visual Techniques
29
increasing for the role of marine reserves in protecting more mobile animals. Although
fish capable of moving long distances are not expected to benefit from protection in
marine reserves, tagging studies revealed intra-species differences in movement
behaviour and thus forcing us to rethink the expectations on reserve performance. In
effect in many fish species a proportion of the population might remain within a
relatively small area, whilst others undertake significant movements (Gell and Roberts,
2003)
4.2 – GMR: the first Portuguese Marine Reserve
GMR lies on the southern slope of Madeira Island, east of Funchal (capital of the
island). It is a small reserve occupying a coast length of about six miles and
encompasses an area of 3.76 km2, but brings together within its boundaries a variety of
nearshore aquatic habitats as good examples of the major coastal communities of
Madeira Island. It stands between Ponta do Lazareto on the west, and Ponta da Oliveira
on the east, extending from the high-tide line to seaward to the 50 m depth contour
(figure 1). It was the first exclusive Portuguese marine reserve, declared in 1986 by the
regional legislative decree 23/86/M and was mostly supported by a group of citizens
passionate about the underwater world. After its creation, amateur diving was regulated
by the regional regulative decree number 1/97 of 14 January.
The reserve shoreline is rocky, high and irregular, with very steep cliffs reaching
altitudes occasionally above 100 m. From Ponta do Garajau to Ponta da Oliveira cliffs
are lower and more regular, with relatively easy access to the sea. Parts of the cliffs
bordering the reserve are included in the European ecological network of special
conservation areas: the Natura 2000 Network.
The reserve was established with the aim of stopping the progressive
desertification of coastal sea floors of Madeira Island and therefore to function as a fish
reserve and nursery and thus contribute to the resettlement of the fauna on bordering
areas. Before GMR creation, this area was visited by a considerable number of amateur
fishers, using explosives, gill nets of narrow mesh and spears, causing a big impact on
fish populations (Castro et al., 1985). Reserve creation was proposed by a group of
diving enthusiasts acknowledging the importance of the natural heritage of the site.
Thus, GMR was declared mainly because of the public interest in the fish fauna and not
actually due a scientific knowledge base. In fact, no assessment study was done in the

Cláudia Ribeiro
30
area before reserve was declared, unless the report made by Castro et al. (1985)
supporting GMR set-up, but did not present any quantitative data on the marine
resources of the area.
It is important to highlight that no baseline studies were available to show the
status of the fish communities before the marine reserve was put in place, thus
hampering the evaluation of the effectiveness of the protection regime, because other
facts such as intrinsic ecological differences between sites investigated inside and
outside reserve (lack of reserve replication) could confound results. After GMR
creation, only two studies were carried out inside the reserve: 1) Delgado (1998), with a
visual transects study, incorporated data on faunistical, bathymetrical and
geomorphologic aspects from some sites along the reserve and 2) Mello (2000) also
using visual transects, made a study for identification and quantification of the fish
fauna of Garajau Bay (a small bay inside the reserve).
Due to its geographical location, and mainly to its biological richness and
transparent waters, GMR has great potential to recreational, educational and scientific
purposes. Scuba diving is being very promoted in the reserve and act has a strong
reason for visit the region by several amateur divers. In fact, popularity of diving grows
in all parts of the world, being a rapidly growing component of the international tourism
industry (Davis & Tisdell, 1995; Garrabou et al., 1998). The estimated number of divers
per year in GMR is around 3000 (Freitas, pers. com.), which are controlled by Madeira
Natural Park ranges. A continued growth of this activity inside the reserve may interact
with the ecological values and promote environmental degradation, as happened
elsewhere (Australia, U.S.A e.g. Davis & Tisdell, 1995). There is a widespread concern
that large numbers of divers induce the degradation of marine habitats (Ward, 1990) and
thus, concepts of carrying capacity and thresholds should be kept in mind by the
managers of the protected area.
MPAs are also a focus for educational activities and initiatives to raise public
awareness in order to promote marine conservation in general and more specifically, for
promoting support for the effective management of MPAs. Therefore, environmental
education in the reserve also have an important role with regular visits by significant
number of students, most of these visits are supported by the vessel “Buteo” of Madeira
Natural Park (Freitas et al., 2004). The head quarters of the reserve is set in Cais do
Lazareto that is the westernmost limit, which besides marine ranges base also lodge
visitors and divers. It’s also where diffusion of information about the marine reserve

Comparison of Rocky Reef Fish Communities Using Underwater Visual Techniques
31
resources is made and where is displayed documentation about the reserve and the
marine environment in general.
The GMR has several implemented rules, which includes limitations of usage
within its boundaries such as prohibition of all kinds of fishing, either commercial or
game fishing, including spearfishing, prohibition to navigate using motor boats,
exception in beaches approach, prohibition to capture animals or marine plants and
extraction of sand or other materials of geologic origin, except for scientific research
with permitting of the reserve director. Swimming and amateur diving for recreational,
tourist and scientific reasons is allowed, as well as the practice of nautical sports, except
the ones using engines.
Whilst regulations that prohibit fishing and damage of the marine reserve
habitats have been carefully described in statute (regional legislative decree number
23/86/M), there are a number of practical constraints to their implementation, including
a lack of wardens and patrol boats and poor public awareness for marine resources
conservation. The reserve is patrolled, but its close proximity to the capital (Funchal) of
Madeira Island contributes to some problems. Cases of poaching are often reported by
reserve rangers, involving manly spearfishing, hand-lines and fish traps. Around 20 fish
traps and 3 nets were removed in 2004 from the GMR (Freitas, pers. com.). This illegal
fishing often occurs after dark and the gears are collected before the arrival of the
marine reserve staff on the following morning. There is also the sewage outfall of the
city of Funchal, which discharges inshore, near the coastline inside the reserve
boundaries. This is antithetical to tourism and environmental conservation and to date,
no studies have been performed on the effects of this outfall in the spatial distributions
of fishes and on the sessile macrobenthic assemblages. Besides sewage discharges, there
is sediment and litter dumping from small streams inside and on reserve neigbhourd. In
recent years, much soil was dumped through the rock cliffs over the reserve reaching
the sea and causing big “brown waters” areas that last for many days (pers. obser.);
which is an obvious antithesis with the environmental conservations purposes. Hence,
enforcement of regulations in the GMR should be improved through enforcement of
park legislation, increasing ranger patrols and patrol equipment.

Cláudia Ribeiro
32
Chapter 5: MATERIAL AND METHODS
5.1 - Study area: general characterization Madeira is an oceanic archipelago that came into existence about 3 million years
ago (Watkins & Abdel-Monem, 1971). Located from 32º37’52”N to 32º52’08” N and
16º39’19” W to 17º15’ 54”W about 754 km from the coast of Africa and 964 km
southwest of Lisbon (Fig. 2), the Archipelago consists of two major islands: Madeira
(the largest one) and Porto Santo (positioned northeast of Madeira), which are
inhabited; and five minor uninhabited islands (Desertas and Selvagens). It forms part of
the important Macaronesia biogeographic region, a heterogeneous group of oceanic
islands in the mid-Atlantic, that also include the archipelagos of Azores, Canaries and
Cape Verde (Báez & Sánchez-Pinto, 1983; Beyhl et al., 1995) and a part of continental
Africa also called the ‘macaronesia african enclave’, which includes the continental
west coast of Africa between the Canaries and Cape Verde.
Figure 3– Madeira Archipelago in the Eastern Atlantic including the Macaronesia Region and map of
Madeira Island with localization of the studies locations and other relevant sites referred in the text. 1 –
Garajau Marine Reserve (GMR), 2 – Artificial riprap of Madeira Airport (ARMA), 3 – Machico, 4 –
Unprotected area of Caniçal (UAC), 5 – Rocha do Navio Marine Reserve, 6 – Ponta Delgada, 7 – Porto
Moniz, 8 – Calheta, 9 – Ponta do Sol, 10 – Ribeira Brava, 11 – Câmara de Lobos
1
i 1
i 2 i3 i4
i5
i6 i7
i8 i9
10i i11

Comparison of Rocky Reef Fish Communities Using Underwater Visual Techniques
33
Madeira Island is volcanic in origin, characterized by very rugged and irregular
orography, sculpted by numerous watercourses (Figure 4) and shores mostly rough and
often steep. Madeira Island extends W-NW to E-SE along 58 km and has a total of 153
km coastline. The coast consists mostly of old lava streams, several small bays filled
with eroded rounded lava stones. The major coastal marine environments are rocky
shores characterized by small basalt-boulder beaches and basalt blocks, whilst sub-tidal
substrates are mainly composed by basalt that ends in a sand bottom. Madeira has a
very narrow or almost inexistent continental shelf, which slopes abruptly to 3000 m
depth (Caldeira et al., 2002).
Figure 4 - Madeira island map with water crosses distribution along the island (blue line). Map taken from” Atlas do Ambiente digital” - Instituto do Ambiente
Sand beaches in Madeira Island are rare, consisting of one small natural sand
beach in the southeastern end of the island and an artificial sand beach on the southwest
coast (Calheta, see Figure 3). Sand beaches predominate on the south coast of Porto
Santo Island.
The sea surface temperature (SST) in Madeira Island ranges from 15º to 25ºC. A
clear temperature difference between the north and the south coasts of the island,
coupled with the observations of the flow of the Azorean current/front indicate that
Madeira Island is at the subtropical front, where cold temperate waters from the north
meet warm tropical waters from the south. Winds are strongest during the late
spring/early summer and are predominantly from the north quadrant. Salinity ranges
between 36.6 and 39.8 PSU and biological production is known to be relatively low
Drainage bassin
Streams

Cláudia Ribeiro
34
with sea-surface chlorophyll concentrations of 0.07 mg l-1 (Caldeira et al., 2002), which
is a typical value for oligotrophic oceanic waters (Parsons et al., 1994).
5.1.1 - Characterization of Madeira subidal bottoms
The subtidal bottoms occurring in south coast of Madeira are mainly rocky
(boulders, vertical walls, platform and outcroppings) interspersed with areas of sand and
gravel and ending in a sand bottom. Generally the rock substrate is colonized by algae,
including representatives of chlorophyte genera Caulerpa, Codium, Ulva and Valonia,
the phaeophyte such as genera Colpomenia, Cystoseira, Dictyota, Padina, Sargassum,
Stypopodium and Zonaria and the rodophyte genera Asparagopsis, Corallina,
Lithophylum, Pterocladiella. (Levring, 1974; Neto et al., 2001). Down to about 5m
depth, the multispecific algal assemblage is dominated by the brown alga Sargassum
filipendula and mixed algae such as Codium adhaerens, Pterocladia capillacea and
Stypocaulon scoparium (Augier, 1985; Bianchi et al., 1998). In deeper rocky reefs
down to about 15-20 meters depth Dictyotales were dominate with species such as
Zonaria tournefortii and Stytopodium zonale, Dyctiota neglecta and Padina pavonica
being frequent whilst, in vertical surfaces, particularly in deepest parts the presence of
the red algae Asparagopsis armata and Cottoniella filamentosa, forming stands is
common. There are also references to Cymodocea nodosa beds occurring over sand
bottoms (Wirtz, 1995b; Wirtz, 1995a; Neto et al., 2001), but in small patches and
sparse. More recently there are report that the beds known till date had decreased in
these last years, e.g. a large and dense sea grass meadow in the bay of Machico (see
Figure 3) has now disappeared completely, because the extension of a pier has changed
the current system in the bay and the stream of Machico has unloaded large amounts of
mud over this area (Wirtz, 2005). Inhabiting the subtidal reefs were also found diverse
sessile macrofauna comprising sponges as Aplysina aerophoba, Batzella inops,
Chondrosia reniformis, Cliona celata and Phorbas fictius among others (Pestana, 2002)
and grazing invertebrates such as the echinoids: Arbacia lixula, Paracentrotus lividus,
in the shallower waters, whilst Spaerechinus granularis and Diadema antillarum are
more abundant and common in deeper reefs (Alves et al., 2001; 2003). The long-spined
sea-urchin appears in Madeira, Selvagens Islands, Canary Islands, Cape Verde Islands
and the Guinean Gulf (Lessios et al., 2001) and feeds on macroalgae (Augier, 1985;
Bianchi et al., 1998; Alves et al., 2001; 2003). As a consequence of its abundance and

Comparison of Rocky Reef Fish Communities Using Underwater Visual Techniques
35
feeding behaviour, the species has contributed to the decline of macroalgae populations,
with barren rocky reefs commonly found in Madeira and Canary Archipelago (Alves et
al., 2001). Tuya et al., 2004a) concluded that D. antillarum maintains low macroalgae
coverage, having strong impact on the structure of the shallow phytobenthic populations
on the Canarian Archipelago, as probably is happening in Madeira Island. D. antillarum
plays an important ecological role in the organization of rocky reefs across the eastern
Atlantic, structuring coastal communities, transforming large shallow rocky reefs
covered by fleshy erect algae into overgrazed substrates dominated by encrusting
coralline algae, so called ‘urchin barrens’ (Shears & Babcock, 2002), thereby determine
the composition and structure of benthic algal communities by inhibiting the
development of the physical structure and primary resources provided by macroalgae (
Alves et al., 2001, 2003; Tuya et al., 2004a). This dominating species, had suffered an
increase in density and distribution in the last years, thus having a major impact on
coastal ecosystems (Hernández et al., 2006). Indeed, several authors have observed and
commented upon the decline of macroalgae populations throught the Canary Islands
over the last decades as an indirect consequence of overexploitation of coastal fishery
resources, which may have favoured the demographic explosion of echinoids, such as
this D. antillarum on the shallow rocky bottoms, due removal of sea urchin predators
such as Bodianus scrofa, Ballistes capriscus and Diodon histrix (Garrido et al., 2000,
Hernández et al., 2007). More specifically, the decrease in fish populations in the last
century have altered the structure of functional groups of herbivores on many reefs,
especially during the last 3 decades (Gardener et al., 2003), leading to a change in
herbivory, that has shifted from being fish-dominated to echinoid-dominated (Bellwood
et al., 2004). Furthermore, Tuya et al. (2004b) determined that the presence of extensive
urchins barrens in the subtidal rocky reefs of Canary Islands was due the
overexploitation of inshore demersal fishes, the large macroalgal grazing daily rates of
D. antillarum and the low primary production in shallow waters around the coastlines.
In that sense, since Madeira Island also have all those factors acting in the litoral
environment and in agreement to the statement of Tuya et al. (2004b), they could also
be considered the cause for the extensive presence of sea urchins in the subtidal rocky
reefs of the island. The referred studies reported that D. antillarum may be responsible
for nearly denuded substrata, indicating an interaction between the sea-urchin and
macroalgae, embedded in majority of negligible effects of others herbivorous species.

Cláudia Ribeiro
36
5.1.2 – Sampling locations
Preliminary reconnaissance work was performed along the island in order to
identify major bottom types and to investigate the accessibilities to each place. Three
locations were established that address the objectives and be logistically simple. The
specific locations were chosen because of their proximity to shore and protection from
the dominant winds and seas. Thus, three sites on the south coast of Madeira Island
were chosen: a) Garajau Partial Nature Reserve (termed as GMR) – a natural protected
area, b) Unprotected natural area of Caniçal (hereafter termed as UAC) –and 3) artificial
riprap of Madeira airport (hereafter termed as ARMA) – an artificial unprotected area
(Figure 3).
Sampling locations were chosen to be as physically similar as possible in terms
of depth (0-20 meters), structure, topographic complexity, bottom types and equivalent
exposure to waves, currents, sea condition, and sun intensity in order to reduce any
confounding effects. Three typical rocky bottoms were included, namely rocky boulders
(Rb), platform (P) and vertical walls (W) within the natural protected and unprotected
locations, covering two depth ranges (0-10 meters = shallow and 10-20 meters = deep).
In the unprotected artificial location (ARMA), just rocky boulders bottoms were
sampled because the artificial structure comprised just that type of bottom. Six
comparative sampling sites were defined inside GMR and inside UAC: two in each
bottom type, whilst in ARMA just two sites were established in rocky boulder riprap
according the two depth strata. Walls and platform bottoms had less spatial separation
than rocky boulders reefs sampled, since they are less common along the shore and
when occurring are not so extense. Sites that are frequented by recreational divers were
avoided.
A) GMR
GMR coast comprised several pebble beaches, with rocky areas between them
(Delgado, 1998). The bottom at GMR is rocky down to depths of approximately 22 m;
deeper bottom was mainly made of fine sand or ground shells. Rocky boulders of
considerable dimension and some small rocks occurred infrequently on sand. The
transition area between rock and sand substrate is quite clear and steep, with some
abrupt walls. Rocky bottoms were divided into boulders, platform, ledges and vertical
relief, which are typical types of rocky habitats existing in Madeira Island and thus it

Comparison of Rocky Reef Fish Communities Using Underwater Visual Techniques
37
constitutes an interesting model as the commonness of its environment makes it easily
replicable along Madeira coast.
B) UAC
UAC is a typical natural unprotected coastal area of the island, located in the
southeast part of Madeira (Figure 3). The coast is rocky, formed by lava flows and
pebble beaches. Basalt boulders, walls, platforms and sand form the bottom in this area.
Often these rocky reefs were dotted with some algae and invertebrates – mostly
encrusting varieties, but bare rocks were also common. There are two streams in this
area on at west of the surveyed sites and the other at east. On rainy days, these streams
result in a large freshwater and sediment input, which cause a dramatic decrease of
underwater visibility. The shore in this area was targeted by walkway and harbour
construction and fishing pressure by artisanal and recreational fishers (hand-lines, fish
traps and spear fishing). SCUBA diving is also a frequent activity on this zone, due its
interesting subtidal reefs coupled with the easy accessibility from shore.
C) ARMA
The third location studied was the artificial riprap of Madeira airport (ARMA) at
Santa Cruz (Figure 3). This area suffered a huge alteration, indeed with the enlargement
of Madeira airport were deployed 3.4 million (or 3.4 x 10⁶) m3 of riprap and led to the
disappearance of an existing bay and associated habitats, which were replaced by an
artificial structure of a riprap runway foundation made of rocky boulders. The artificial
structure is formed by a rocky boulders platform of several meters width and ends in a
subtidal rocky boulder wall that runs parallel to the coast. The artificial habitat is an
unprotected area that consists on rocky boulders and rocky shelves extending to the
sandy substrate at a depth of approximately 15 – 20 m.
5.2 - Survey methods
The sampling design chosen for this study included the following underwater
visual census (UVCT) methods: i) transect (T) (Brock, 1954), ii) point count (PC)
(Bohnsack & Bannerot, 1986) and iii) an adaptation of the “Visual Fast count” (VFC) of
Kimmel (1985) based on Azevedo (1997). These methods were used in order to produce
data that would complement each other to obtain adequate descriptive information on

Cláudia Ribeiro
38
reefs communities and to evaluate how each method describes the diurnally active
ichthyofauna of Madeira Island rocky reefs. Transect and point count techniques were
chosen to obtain standard data on fish abundance (nº of individuals/ area). Although
both methods give density data, we choose to use both, due the fact that PC is a
commonly used method in coral reefs and elsewhere but never been used in Madeira
Island before. The VFC was chosen because of its ability to generate a more complete
species list. The methods were briefly described below and more details about the
techniques can be found in Harmelin-Vivien et al. (1985); Kimmel (1985) Bohnsack
and Bannerot (1986) and Azevedo (1997).
Censuses were seasonally conducted (3 times/season) in each depth stratum (0-
10m and 10-20m), bottom type (Rb, wall and platform) and location, during two years
from Spring 2002 to Spring 2004. Counts were conducted between 0900 and 1700 local
time. Counts of fishes followed Brock (1954) procedures: - if part of a school passed in
front of the diver, the members of the entire school were counted; - schools or
individuals fish which crossed the sampling area behind the diver or that re-crossed
were not counted or recounted during the census.
5.2.1 - Transect method (T) To perform transect surveys, one weight was attached to the free end of a 30 m
long tape measure and was dropped at the start point, with the diver simultaneously
delimiting the transect boundaries and making the census. The diver swam slowly as the
30 m line was unwound, estimating the number of individuals of every occurring
species, identifying to the lowest possible taxon within 2.5 m of either side (150 m2
transect area, Figure 5). This technique allowed to census the area on the first swim,
avoiding any possible disturbances effects associated with laying out the tape as in
“sequential” techniques and thereby, detecting the species before they were frightened
away and producing higher estimates than does sequential techniques (Fowler, 1987).
Fish size was assessed using four size classes (juveniles, small, medium and large) on
the basis of the maximum total length reported on literature in the region for each
species (Whitehead et al., 1986; Wirtz, 1994; González et al., 1998). At the starter
point, a Secchi disc was deployed and when reeling the tape up, the diver notes and
records physical and habitat data on the slates, recording as horizontal visibility the
distance at which for the first time it saw the Secchi disc.

Comparison of Rocky Reef Fish Communities Using Underwater Visual Techniques
39
5.2.2 - Point count or Stationary visual technique (PC)
The fish assemblages in the rocky reefs studied were also censused using the
stationary visual census technique or point count (Figure 5) modified from (Bohnsack &
Bannerot, 1986) The second major type of visual census techniques used for coral reef
fishes assessment is point counts, in which the observer usually is stationary (Thresher
and Gunn, 1986). In each point count, a line of 16 m was laid prior to the count and the
diver remained in the middle of the imaginary cylinder of 8 m radius rotating in one
direction, scanning the surrounding 8 m radius. Although the studies performed in the
neighbour Canarian archipelago using this method (Bortone et al., 1991; Falcón et al.,
1996) had always employed a radius of 5.6 m, Tuya et al. (2004a) referred that a radius
of 8 m allows the detection of certain species (e.g. Pagrus pagrus, Diplodus cervinus,
etc..) that shy way from the observer and that can be caused by the high anthropogenic
pressure exerted on coastal areas. In vertical walls bottoms, the radius used was 4
meters, since this type of habitat is more difficult to sample in the field (must transport
to a vertical plan). During the initial five minutes time period only the species seen
within the cylinder were recorded. Once completed that period, the observer counts all
fishes within the cylinder starting at the bottom of the list with the last species seen and
working up the list, recording the estimated number of individuals for each species and
their size (size classes). The species unlikely to remain in the cylinder (e.g. pelagic
species in schools or rare species) are enumerated as soon they were seen. In effect,
users of visual census frequently make a distinction between resident species,
individuals of which are expected to remain within the census site, and more vagile
species, whose individuals enter and leave the census site, either singly or in schools
(Sale, 1980b).

Cláudia Ribeiro
40
Figure 5 - Schematic representation of the three UVCTs used
5.2.3 - Visual Fast Count Method (VFC)
The third visual technique used, the Visual fast count (hereafter termed VFC) is
a method developed by Kimmel (1985) in which the diver/observer records the real
number of individuals of any species seen within a predetermined area or habitat. This
method is a time census method, a variant of the Rapid Visual Census technique (Jones
and Thompson, 1978). It is a semi-quantitative method that provides a relative
abundance index of the observed species, with expected frequencies being used in place
of the arbitrary scores of Jones and Thompson (1978).
According to Kimmel (1985) the VFC can easily be modified to better serve the
goals of the specific study by changing, for example, the number and/or length of
census intervals. They could be reduced when censusing in depauperate or less diverse
areas or increased in areas of extreme species richness, which is not the present case.
Furtermore, inappropriate length of census intervals could contribute to sample bias
(Scott & Ramsey, 1981) and so that, the total time used for each census was 15 min
subdivided in three 5 min intervals basing on the study of Azevedo (1997) in the Azores
Islands. Data were recorded on a prepared species list with three columns corresponding
to three five-min intervals. Size of fishes was also recorded.
In most cases, the fishes were identified underwater to the species level,
however, some species of the families Blenniidae, Clupeidae, Gobiidae and Mugillidae
and from the genus Bellone, Synodus and Seriola could not be identified to a lower
taxon level due to the difficulties in specific determination by direct visual observations,
Point Count Area sampled = 201 m2; Species number =3 sp/201 m2 nº of individuals = 13/201m2
Transect Area sampled = 150 m2 Species number =3 sp/150 m2 nº of individuals = 6/150m2
Visual Fast Count Area sampled = unknown nº of individuals = 6; species number= 3
2.5 m Radius = 8 m or 4m
30m

Comparison of Rocky Reef Fish Communities Using Underwater Visual Techniques
41
as haves been reported in other works using UVCTs (Falcón et al., 1996; Rilov &
Benayahu, 2000; Ferreira et al., 2001; Guidetti et al., 2002a; 2005). Each of those
taxons was then treated as a distinct species in the analysis.
5.3 – Physical and Environmental variables
In order to obtain information about the local habitats at each dive site sea-
weather conditions, horizontal visibility (horizontal Secchi disk visibility) and
temperature were recorded. Water clarity, visibility or turbidity are related to the
amount of light that is able to penetrate into depth, and thus biologically very important
factor that also influence the ability of divers make observations. Indeed, the number of
organisms potentially observed when using a visual technique is directly related to
water visibility, so in these particular surveys visibility was measured horizontally at the
depth of sampling. The salinity range in Madeira waters is narrow and in that sense it
was not measured, since it would not have a significant influence in the abundance of
the rocky reef fish communities.
Water samples were collected from surface at each dive for chlorophyll a
analysis, suspended particulate matter (SPM - non-filterable residue) and nutrients
analysis. Samples were collected using polyethylene bottles previously cleaned and kept
stored in an insulated box until reach the laboratory. Nutrient concentrations and
chlorophyll a were determined by chemical methods, after filtration of the samples
using a syringe with an attached cartridge and Whatman GF/F glass fibber filters. The
water samples for nutrient and the filter for chlorophyll a determinations were stored in
the freezer in polyethylene bottles at -25ºC. Spectrophotometry was used to measure
chlorophyll and nutrients (nitrate, nitrite, phosphate, silicate) according to standard
methods for seawater (Parsons et al., 2004). SPM was determined by the weight
difference before and after filtration of known volumes of seawater (1l) on
precombusted (500ºC) and preweigthed Whatman GF/C filters (Strickland and Parsons,
1972).
In studies involving large amount of field work, is almost inevitable a change of
observers from place to place and through time. The present survey program was
scheduled in a way that surveys were always performed by the two same
divers/observers (myself and a biology technician). The plan was defined in order to
reduce estimates variability, minimizing possible errors in abundance counts and size

Cláudia Ribeiro
42
estimates as have been suggested by some authors (Westera et al., 2003). Both divers
had formal and informal training in fish identification and were extremely familiar with
underwater fish identification from previous works (see Ribeiro et al., 2005), possessing
considerable experience in underwater visual censuses work. Besides, the two divers,
previously to this survey program had a training period that involved the familiarization
with both: the techniques (each diver used the three techniques chosen as survey
methodology, performing each a total of eight PC, eight transects and eight VFC
surveys) and identification of the reef species. Proficiency in the accurate and rapid
identification of species observed was achieved by referencing to the photographic texts
available (Wirtz, 1994; González et al., 1998).
5.4 - Data analysis
All biological surveys result in complex bodies of biotic and environmental data
from which patterns and relationships need to be extracted. Hence, there are several
strategies to analyze multispecies data and associated environmental variables. In the
current study, biotic data was analyzed first, letting species to tell their story and then, if
biotic groups were formed, the environmental and habitat related variables were tested
for statistical differences. This type of approach avoids the influence of any previous
assumptions about relationships between the biota and environment and thus
minimizing the danger of circular argument in seeking to deduce relationships (Field et
al., 1982).
5.4.1 - Methods comparisons
The data generated by the three UVCT were compared. To distinguish possible
differences among observers from real spatial or temporal patterns, the data obtained
from both divers was compared in order to evaluate the ability of the two in species
identification, quantification and the performance using the differents method. Observer
comparability was assessed using a paired T-test and the relative importance of the
factors “diver”, “method” and its interaction affecting the UVC fish estimates was
assessed using a two-factor ANOVA. The ANOVA model used included a fixed factor
diver (two levels) and the fixed factor method (three levels).
The three UVCTs were tested for qualitatively (species richness) and
quantitative (number of individuals by species) assessment. Data on species richness

Comparison of Rocky Reef Fish Communities Using Underwater Visual Techniques
43
was expressed considering the number of species (S) and species diversity trough
Shannon-Wiener diversity index (H´) according to each method. They were compared
using a multifactor ANOVA, acquainting the varying factors in each location. The
relative abundance obtained by each method was compared through a multivariate
approach, a two-way crossed “analysis of similarity (ANOSIM) (Clarke & Warwick,
2001), using the raw data log x+1 transformed before calculate the Bray-Curtis
similarities matrix.
Species frequency was calculated for each method and then compared in order to
determine which species have similar underwater detection rates with the three
techniques. The similarity among species observed in locations was compared for the
three UVCTs to determine if assemblages differed in locations accordingly to the
method used. The Bray-Curtis distance coefficient was used to compare similarity in
species composition and abundance among observers and sites. This index was choosen
due the fact that is sufficiently robust for marine data and differences among abundant
species contribute to the coefficient in the same degree as difference among rare species
(Legendre & Legendre, 1998). Species composition among the three methods within
each zone was compared using a Dice (=Sorensen) similarity index.
Cumulative species curves versus number of surveys (equivalent to sample time)
for each method used in the three locations were plotted to determine the rate at which
new species were observed and the effectiveness of sampling.
Original abundances data were converted in relative abundances in order to
standardize data collected through the three techniques, as in other studies that used data
collected by different methodologies (Floeter et al., 2004).
5.4.2 - Fish communities ensemble properties
Species composition, frequency, density and length frequency distribution were
assessed to allow the characterization of fish assemblage in space and time (Schmitt et
al., 2002). Furthermore, the structure of the fish communities was described by a
number of ensemble properties such as:1) species richness (S) –the number of species in
a site 2) Shannon diversity index (H’) (Pielou, 1966), 3) mean abundance of species, 4)
abundance of commercial and recreational fishery targeted species, 5) frequency of
occurrence 6) trophic and mobility guilds and 7) total abundance per location, habitat

Cláudia Ribeiro
44
and depth. These variables were calculated to provide a meaningful summary of data
and thus compared among and within study locations.
Frequency of occurrence of each species was assigned into four classes of
frequency: I – >75% - reef permanent species; II – 74.9-50% - frequent species; III –
49.9-25% occasional species and IV – <25% - rare species (Charbonnel et al., 1995).
The sighting frequency was determined for each species and represents the number of
times it was observed divided by the total number of surveys. Thereby, it measures the
ubiquity of each taxa, allowing to estimate the temporal variability of the fish
community (DeMartini et al., 1996).
5.4.3 - Univariate statistical analyses The sampling design included only one protected location against two
unprotected locations. Thus, an asymmetrical analyses of variance was employed to test
for differences between locations (Underwood, 1997). In each of the three locations the
same type of bottom (rocky boulders – Rb) was surveyed over two depth intervals
(shallow and deep) over four seasons (spring, summer, autumn and winter), performing
4 censuses per season. This was an orthogonal design with fixed factors. A second
analysis was also done using only the data associated with natural unprotected location
(UAC) and the natural reserve location (GMR), comparing the three types of rocky
bottoms.
Univariate tests were done using ANOVA. A multifactor ANOVA was used to
flag significant differences in the fish assemblages occurring among the factors
concerned in the study: locations, type of bottom, depth, seasons, and methods which
were considered fixed factors in this analysis. Prior to ANOVA, homogeneity of
variances was tested by Levene test and whenever necessary data were log (x+1)
transformed in order to reduce skewness and heterogeneity of variances, i.e. stabilize
variances (Underwood, 1997). This type of transformation has the effect of scaling
down the scores of abundant species so that they do not swamp the other data (Field et
al., 1982). When transformations did not produced homogeneous variances, ANOVA
was used anyway, due the fact that is quite robust to departures from the underlying
assumptions, especially when design contains large numbers of samples (Underwood,
1997) and setting α = 0.01 in order to compensate for the increased likelihood of Type I

Comparison of Rocky Reef Fish Communities Using Underwater Visual Techniques
45
error. Additional Tukey multiple comparisons of means tests were performed as a post-
hoc test (Zar, 1999).
5.4.4 - Multivariate statistical analyses
Multivariate analyses techniques (ANOSIM, and nMDS) were used to
investigate fish assemblage structures using the PRIMER software package 5.0
(Plymouth Marine Laboratory, UK; Clarke & Warwick, 2001). Fish data were
transformed log (x+1) to reduce weight given to abundant species and so that each
species contributed fairly evenly to each analysis (Clarke & Ainsworth, 1993).
To determine whether there were any spatial differences in fish communities
structure between locations, bottom types and depth strata, the multivariate patterns was
graphically represented in two-dimensional ordination plots by non-metric
multidimensional scaling (nMDS), generated from a Bray-Curtis similarity matrix. The
non-metric MDS is a much more flexible tool that makes no parametric assumptions at
all (Clarke & Green, 1988). This analysis, which dates to Shepard (1962) and Kruskal
(1964) has the ability to handle with missing data, replication and data of non-uniform
reliability for which it is desirable to give unequal weights to the dissimilarities in
seeking the best map (Field et al., 1982). The purpose of nMDS is to construct a map of
samples configuration, which attempted to satisfy all the conditions imposed by the
similarity matrix using the Bray-Curtis measure of similarity and that represent the best
graphical depiction in two dimensions of the biotic similarities between sites. The
usefulness of this two-dimensional display of relationships between sites is indicated by
the stress statistic, which if <0.1 indicates that the depiction is good and if >0.2 the
depiction is not so good (Clarke & Warwick, 2001). The ordination was based on the
mean abundances of species at each place from the seasonal series of samples, which
were averaged.
ANOSIM – “analysis of similarities”(Clarke & Warwick, 2001) was used to
determine the significance level of differences in the fish assemblage composition
(abundance) among the several factors concerned in the study. Primarily the concern
was on differences in fish composition among locations and bottoms types.

Cláudia Ribeiro
46
5.5.5 - Fish assemblages structure FISH GUILDS
A functional group can be defined as a permanent or temporary group of species
performing the same ecosystem process (Blondel, 2003). So, in order to study specific
groups that could have specific functional relationships, the structure of fish community
was evaluated through functional groups based on food preference or trophic structure
and spatial use of habitat.
This analysis can provide more information on the internal functioning and
hierarchical structure of fish communities, simplifying highly connected and complex
ecosystems, reducing these to an ecologically meaningful level of complexity and
thereby a useful tool for gathering broad-scale data on community structure (Garrison &
Link, 2000). Additionally, it allows comparisons of fish assemblages on equal terms,
stressing similarities among unrelated species and making possible comparisons across
different spatial regions (Angel & Ojeda, 2001).
a) Trophic structure
Fishes are an integral part of the reef food web, exerting predation pressure in all
trophic levels. Therefore, the trophic structure is considered a potential mean for
evaluating ecosystem condition and a useful characteristic for comparing fish
communities of oceanic regions (Parrish, 1989).
Species were assigned to one of the following trophic guilds according to the
classification of Bell and Harmelin-Vivien (1983). This classification was based on the
type of prey and its relative size to predator: herbivores (H), omnivores (O) and
carnivores (C) and this last category was subdivided according to the size of preys as
micro, meso and macrocarnivores as Azevedo (1995) made in a study of food web of a
ichthyological community in Azores. The trophic guilds categories were assigned to
every species censused, based whenever possible on the available information from
local studies (Ribeiro, 1998; Silva, 1999; Ferreira, 2002) or from studies conducted
elsewhere (Bell & Harmelin-Vivien, 1983; Azevedo, 1995, Gomes, 1999; Floeter et al.,
2001; Harmelin-Vivien et al., 2001). Using the UVCTs pooled data, the qualitative
trophic structure of the assemblages was calculated according to the number
(percentage) of species belonging to each category and the proportional abundance of

Comparison of Rocky Reef Fish Communities Using Underwater Visual Techniques
47
trophic categories was calculated from pooled transect and PC data (number of
individuals per m2)
b) Spatial Organization/Ecological Type
According to mobility and fish behaviour fish species were assigned to one of
three categories of ecological types basing on their mobility patterns and home-ranges
(Floeter et al., 2004): category 1 – very mobile species, usually associated to schooling
behaviour in the water column (carnivores and planktivores) or demersal fishes
performing wide horizontal displacements (e.g. roving herbivores, sparids and mullids);
category 2 – demersal fish species, more sedentary living in close association with
substratum, such as serranids, labrids, haemulids; category 3 – site attached species with
very small home ranges, some presenting territorial behaviour (e.g. damselfishes,
triperygids and gobies).
DEPTH DISTRIBUTION
A depth-stratified sampling program was conducted with two depth ranges
defined in each location over all types of bottoms: 0-10 m and 10-20 m, respectively
called “shallow” and “deep.
To separate the community and depth effects on species abundance from reserve
effect, data from protected vs. unprotected areas were compared using samples from
similar communities and depths as suggested by Garcia-Rubies and Zabala (1990).

Cláudia Ribeiro
48
Chapter 6: RESULTS
6.1 - Surveys methods 6.1.1 - Training program- diver
The diver comparison using a paired t-test indicated that fish counts taken by the
two observers (Cláudia Ribeiro - CR and Luís Costa - LC) differed significantly when
using transect and VFC method (Table II), whilst for mean nº of species and mean
diversity, H’ differences were not significant between observers. Data collected by the
point count method did not showed significant differences between observers for any
variable.
Divers using VFC method recorded statistically higher number of species
(Mean= 14.4 p<0.001), diversity H’ (mean= 1.7 p<0.001) and mean total abundance
(mean= 435 individuals, p<0.001), whilst when using point count and transect recorded
smaller, but similar values. By the second survey the VFC already censused up to 64%
of the total species censused and after 8 surveys it had produced a species list (31 spp),
that closely approached the total number of species recorded during this testing survey
program with the three methods pooled (Figure 6). Noting that transect and point counts
recorded similar cumulative number of species, but much inferior than VFC. Table II - Comparisons between the two divers (CR – Cláudia Ribeiro, LC- Luís costa) using the three UVCTs for Species richness, H' and number of individuals (log transformed). Surveys using each UVCT where conducted in the same reef. *** indicated significant differences at 0.001 level
Diver VFC T PC CR 13,9 7.3 6.9 Mean nº of species LC 15 9.4 8.5 CR 1.74 1.28 1.25 Mean H' LC 1.64 1.35 1.21 Mean nº of individuals CR 359,6 172,8 162,5 *** *** LC 417,6 245,3 243,75
6.1.2 - Method comparison
The two-year visual census survey resulted in a total of 183 dives, comprising
185 hours of underwater work (table III). The survey effort according to each technique
was nearly equal for all sites and any small existing difference was exclusively due to
technical and field constraints, such as bad weather.

Comparison of Rocky Reef Fish Communities Using Underwater Visual Techniques
49
02468
10121416182022242628303234
1 2 3 4 5 6 7 8nº of surveys
cum
ulat
ive
spec
ies
PC
T
VFC
T otal S
Figure 6 – Cumulative species comparison between methods used on the observers training program
Determining the area in random methods is a very difficult task and because of
that it was not possible to determine the area sampled, when using the VFC method.
However, and since the factor that limits area in this technique is the range of the
observer vision and not a pre-determined distance such as in point count and transect,
the area surveyed with the VFC would be obviously wider than the area of point count
or transect. Despite the fact that area sampled using VFC was not possible to measure, it
can be stated by field experience that it surveyed a wider area than PC and T. The VFC,
differently from PC and T was not confined to a preset distance and was only limited by
the range of observer vision. As shown in Table III the amount of area surveyed by PC
(about 200 m2 in Rb and Plat bottoms and 50 m2 in walls) and T (150 m2) differed
slightly, nonetheless the analyses of variance over the number of species and species
diversity (H’) did not show significant differences between this two methods. In fact,
difference in area surveyed by those two methods is not so big, unless in walls were
transect surveyed three times the area surveyed by PC. But even in walls, no significant
differences were registered either in fish species number and H’ between the two
methods (Table IV and Table V).
Relating to the time spent surveying, the VFC comparatively was most time-
consuming method, since it used a preset interval of 15 minutes per survey, clearly the
double of time-cost of PC and T in all locations (in average PC and T took half of that
time per survey – see Table III). Total time per survey was different among methods
and the VFC took generally the double of the time spent sampling with PC and T, whilst
between this two was nearly equal (Table III). It is worthwhile refere that VFC surveys
were divided in three 5 minutes intervals and species recording process in the second

Cláudia Ribeiro
50
and third interval was only for species that did not appeared in the first and second
intervals respectively. As expected the most common and visible species were recorded
in the first interval, whilst second and third 5 minutes period allowed the observer to see
the most secretive and free ranging species. Increasing the time spent surveying
obviously increase the chance of recording any species.
The total number of species recorded by the VFC method was always higher
than PC and T methods in all locations, bottoms types and at both depth strata (Table
III). The same happened for the the overall species list recorded. In fact, from a total of
sixty-one fish taxa recorded in the survey, 57 were recorded by means of VFC, 55 by
PC and 54 by T. Thus, VFC was the most effective sampling strategy, capturing the
majority of the diversity in all places studied. Totally, it accounted significantly higher
number of species than the other two methods used, ranging between 91-98% of the
total species censused in the locations studied. Nevertheless, this does not mean that
VFC accounted that range of the total fish species present in the areas. It should be
noted that the populations seen and sampled, only accounted a portion of all the species
living in the area of study. PC and T methods in turn registered less, but similar number
of species, between 64 to 89% of the total species list observed in each location.
Similar patterns occurred for the average number of species recorded by each
method per season. Indeed, significantly higher mean number of species was recorded
by VFC than PC and T for all seasons (highest mean value 21.2 by VFC) (Figure 7).
Multifactor ANOVA (Table IV and Table V) for each location tested the influence of
the considered factors over the dependent variables number of species (S) and species
diversity (H’). The methods used turned out to be significant for species richness and H’
(Figure 8) in all locations, so that these variables usually attained higher average value
with the VFC. Only in two cases (Table IV and V), the factor ‘method’, did not had
significant interactions with the remaining factors considered (location, depth, seasons),
indicating that differences observed across methods was influenced by attributes of each
method itself. Therefore, apparently each method was responsible for the variation
either in the number of species and species diversity (H’).
A cumulative total of 54, 50 and 39 species were recorded in the three locations
studied - UAC, GMR and ARMA respectively. The cumulative species list generated by
the three UVCTs, species relative abundance and sighting frequency according to each
method, location and depth strata are given in Table VI. Species included in the list
were just the recorded with PC, T and VFC surveys, whilst the species seen during

Comparison of Rocky Reef Fish Communities Using Underwater Visual Techniques
51
dives, other than in the referred surveys as for instance when swimming to the sampling
site, were not listed.
The most common species in all locations, e.g. Abudefduf luridus, Thalassoma
pavo, Chromis limbata and Canthigaster capistrata had sighting frequency values that
were nearly the same according to each of the three methods. The exception was made
for the scaridae, S. cretense which presented considerable different values between VFC
and PC and T. In effect, VFC surveys showed higher values of occurrence than PC and
the general trend was that greater occurrences for most species were registered with
VFC (see Table VI). Moreover, analyzing each location by depth strata, unique species
occurrences were mostly obtained with VFC method (
Table VII): 9-19% of the species exclusively recorded in each depth strata. This also
shows the trend to VFC record exclusively some species, mainly cryptic (e.g.
Aulostomus strigosus, Chelidonichthys lastoviza) and also some pelagic species such as
Clupeidae, Kyphosus sectator and Sarpa salpa.
From total species listed, four were exclusively recorded by VFC (a), one by PC
(b) and two by T (c) in the overall area studied (see table VI). The maximal similarities
between the overall species list derived from each UVCT used was 0.94 between PC
and transect, 0.93 between PC and VFC and 0.92 between transect and VFC (table
VIII). The qualitative similarities in species composition within methods at each
location and depth strata sampled were considerably high. The minimal value 0.79 was
obtained at the shallow UAC between PC and VFC methods and the maximal similarity
0.94 between T and PC methods in deep GMR. This similarity range [0.79 – 0.94]
suggest a good global association of species detected by the three methods and
consistent level of faunal composition similarity for the assemblages assessed regardless
the method used.

Cláudia Ribeiro
52
Table III- Comparison of survey parameters among the three UVCTs used for assessing the Madeira Island rocky reef fish assemblages; UAC- unprotected area of Caniçal, GMR – Garajau marine reserve, ARMA – artificial riprap of Madeira airport; PC- point count, T- transect; VFC- visual fast count; Rb- rocky boulders, W- wall; Plat- platform; ∑ - total number of species recorded plotting the different types of bottoms
UAC GMR ARMA
Survey parameters PC T VFC PC T VFC PC T VFCRb W Plat ∑ Rb W Plat ∑ Rb W Plat ∑ Rb W Plat ∑ Rb W Plat ∑ Rb W Plat ∑ Rb ∑
shal
low Nº of survey
Area/survey (m2)Time/survey (minutes)Mean species/surveyMeanH'/surveyTotal area (m2)Total time (minute)Total number of species
34 34 33201 50 2017.4 7 7.17.6 7.1 61.24 1.26 0.986834 1700 6633252 238 23422 22 15 27
33 33 33150 150 1505.8 5.8 5.67.7 6.7 5.51.26 1.64 0.964950 4950 4950191 191 18525 22 12 30
34 34 33- - -15 15 1511.7 11.8 9.51.5 1.54 1.32- - -510 510 49531 31 24 39
35 35 35201 50 2017.4 7 7.37.6 7.1 6.91.26 1.43 1.377035 1750 7035259 245 25622 24 23 33
35 35 35150 150 1505.8 6.5 5.66.5 8.0 7.31.17 1.39 1.365250 5250 5250203 228 19619 24 23 31
35 35 35- - - 15 15 1511.8 12.7 13.21.55 1.81 1.81- - -525 525 52531 34 36 44
34 34 35201 150 -7.3 5.7 157.3 6.6 10.31.18 1.11 1.436834 5100 -248 194 -25 23 31 32
Dee
p Nº of surveyArea/survey (m2)Time/survey (minutes)Mean species/surveyMeanH'/surveyTotal area (m2)Total time (minute)Total number of species
33 34 34201 50 2017.5 6.9 7.78.8 8.1 9.71.17 1.17 1.396633 1700 6834248 235 26229 29 28 38
33 34 34150 150 1506.3 6.1 6.59.3 8.1 9.51.26 1.15 1.384950 5100 5100208 207 22129 29 28 35
34 34 34- - -15 15 1514.5 14.2 16.91.63 1.40 1.74- - -510 510 51037 37 36 44
35 35 35201 50 2017.8 7.3 7.78.5 7.6 9.71.16 1.28 1.437035 1750 7035273 256 27029 24 30 37
35 35 35150 150 1506.2 6.6 6.58.5 7.6 9.41.13 1.2 1.255250 5250 5250217 231 22828 24 30 40
35 35 35- - -15 15 1515.1 12.6 13.61.42 1.49 1.47- - -525 525 52537 33 34 43
35 35 35201 150 -8 6.7 159.7 10.2 14.91.4 1.41 1.467035 5250 -280 235 -28 32 37 39

Comparison of Rocky Reef Fish Communities Using Underwater Visual Techniques
53
Table IV – Results of multifactor ANOVA on the effects of the variable factors in each location studied: Method – PC - point count, T - transect, VFC - visual fast count; Depth – S - shallow, D - deep; Seasons – Sp - spring, Sm - summer, Au - Autumn, W - winter; Type of bottom – Rb - rocky boulders, Wall, Plat - platform on the dependent variable number of species (S). F values marked with *, ** or *** indicate significant differences at levels 0.05, 0.01 and 0.001 respectively.
Table V - Results of multifactor ANOVA on the effects of the variable factors in each location studied: Method – PC - point count, T - transect, VFC - visual fast count; Depth – S - shallow, D - deep; Seasons – Sp - spring, Sm - summer, Au - Autumn, W - winter; Type of bottom – Rb - rocky boulders, Wall, Plat – platform on the dependent variable species diversity (H’). F values marked with *, ** or *** indicate significant differences at levels 0.05, 0.01 and 0.001 respectively.
Location
UAC GMR ARMA
Method F=73.77***(VFC≠PC,T) F= 57.96*** (VFC≠PC,T) F=5.425***(VFC≠PC,T)
Depth F=19.985***(S>D) F=33.23***(S>D) F=12.79***(S<D) Type of bottom F=2.495 F=18.09***(Rb≠Plat,Wall) - Season F=4.91**(Sm, ≠Au,Sp,W) F=7.736*** (Sp,Sm,Au≠W) F=2.68* (Au≠Sp,Sm,W) Depth x Method F=0.682 F=4.165* F=3.15* Depth x Season F= 3.62* F= 9.9*** F=2.9 Type of bottom x Method F= 0.559 F=0.349 -
Type of bottom x Depth F=34.14*** F=0.839 -
Depth x type of bottom x season F= 3.17 ** F=2.67*
Cumulative species curves were presented in Figure 9. Only the plots for rocky
boulders (Rb) bottoms were presented here, since the curves obtained for remaining
type of bottoms showed the same pattern as Rb. The plots indicated that the number of
species added began to level off with the increasing number of surveys in the three
locations and at both depth intervals. For each of the three techniques used, asymptotic
levels were reached, with few species being added after the ten survey and toward the
total of surveys performed in each location. Species detection occurred at a similar rate
but, relatively more rapidly at deeper than in the shallow depth interval in the three
locations. The VFC accumulated more species in fewer surveys than PC and T, having
more than 50% of the total list of species recorded after 5 VFC surveys. The remaining
two methods showed a much slower rise in the number of species they were able to
register, but in generally both accumulate species in a similar rate.
Location
UAC GMR ARMA
Method F=322.3***(VFC≠PC,T) F= 348.5*** (VFC≠PC,T) F=52.2***(VFC≠PC,T)
Depth F=213.9***(S<D) F=44.23***(S<D) F=90.21***(S<D) Season F=16.77***(Sm,Au≠Sp,W) F=11.06*** (Sm,Au≠Sp,W) F=6.13** (Sp,Sm, Au≠ W)Type of bottom F=11.3***(Rb≠Wall,Plat) F=444***( Plat≠Wall,Rb) - Depth x Method F=0.464 F=1.54 F=2.05 Depth x Season F= 0.413 F= 2.1 F=3.850** Type of bottom x Method F= 2.379 F=1.16 -
Type of bottom x Depth F=41.57*** F=9.184*** -
Depth x Method x Type of bottom F=0.136 F= 4.297** -

Cláudia Ribeiro
54
Figure 7 – Seasonal variation of mean number of species according to each visual census method used in
the rocky reefs of the three locations surveyed in the south coast of Madeira Island: GMR – Garajau
marine reserve, UAC – unprotected area of Caniçal, ARMA – artificial riprap of Madeira airport; Rb –
rocky boulders, W – wall, Plat – platform
01234567891011121314151617181920212223
Sha
llow
Dee
pS
hallo
wD
eep
Sha
llow
Dee
pS
hallo
wD
eep
Sha
llow
Dee
pS
hallo
wD
eep
Sha
llow
Dee
p
Rb
WP
lat
Rb
WP
lat
Rb
GM
RU
AC
AR
MA
Mean number of species (S)
PC T VFC

Comparison of Rocky Reef Fish Communities Using Underwater Visual Techniques
55
Figure 8 - Seasonal variation of Shannon diversity (H’) according to each visual census method used in the rocky reefs of the three locations surveyed in the south coast of Madeira Island: GMR – Garajau marine reserve, UAC – unprotected area of Caniçal, ARMA – artificial riprap of Madeira airport; Rb – rocky boulders, W – wall, Plat – platform
0
0,2
0,4
0,6
0,81
1,2
1,4
1,6
1,82
2,2
Sha
llow
Dee
pS
hallo
wD
eep
Sha
llow
Dee
pSh
allo
wD
eep
Sha
llow
Dee
pS
hallo
wD
eep
Sha
llow
Dee
p
Rb
WP
lat
Rb
WP
lat
Rb
GM
RUA
CA
RM
A
Mean H' diversityPC T V
FC

Cláudia Ribeiro
56
Table VI– Cumulative species list compiled from two years seasonal surveys at 3 locations on the South coast of Madeira Island using 3 UVCTs. RA - relative abundance and SF- sighting frequency (%) values according to each method. Species were listed in alphabetic order by family. Systematic order and nomenclature followed Brito et al, (2002) and Quéro et al. (2003). VFC - visual fast count (a exclusive record), PC – point count (b exclusive record), T – transect (c exclusive record). Species absence was indicated by –
shallowFAMILIES SPECIES
RA SF RA SF RA SF RA SF RA SF RA SF RA SF RA SF RA SFAulostomidae Aulostomus strigosus Wheeler, 1955 - - 0.02 1 0.02 3 - - - - - 0.01 3 0.01 3 0.01 6Apogonidae Apogon imberbis (Linnaeus, 1758) 0.01 1 0.19 10 0.7 25 0.02 2 0.02 4 0.06 11 - - - - - -Atherinidae Atherina presbyter Cuvier, 1829 1.14 1 - - 3.1 4 5.38 2 4.50 2 14 6 38.55 53 45.65 47 33.09 43Balistidae Balistes capriscus Gmelin, 1788 0.01 1 - - 0.01 4 - - - - <0.01 1 0.06 15 0.13 9 0.04 11Belonidae Belone sp - - - - 0.08 3 - - - - 0.01 3 - - - - 0.02 3Blenniidae indetermined - - - - - - - - - - - - 0.01 3 - - - -
Ophioblennius atlanticus (Valenciennes, 1836) 0.74 37 0.89 36 0.69 51 0.34 30 0.23 27 0.32 54 2.44 94 2.97 94 2.53 94Bothidae Bothus podas (Delaroche, 1809) 0.03 3 0.03 2 0.07 6 - - - - - - - - - - - -Carangidae Caranx crysos (Mitchill, 1815)b - - - - - - 0.23 1 - - - - - - - - - -
Pseudocaranx dentex (Bloch & Schneider, 1801) 0.58 6 0.15 7 0.27 24 - - 0.02 1 <0.01 2 0.03 6 0.06 9 0.07 14Seriola sp 0.01 1 - - <0.01 2 0.02 2 0,02 2 0.02 3 - - - - 0.01 3Thachinotus ovatus (Linnaeus, 1758) - - - - 0.14 2 0.02 2 - - 0.01 2 0.19 6 0.07 3 0.64 9
Clupeidae indetermineda - - - - - - - - - - 1,2 2 - - - - - -Dasyatidae Dasyatis pastinaca (Linnaeus, 1758)c - - - - - - - - - - - - - - - - - -Gobiesocidae Lepadogaster sp 0.02 2 0.01 1 <0.01 2 - - <0.01 1 <0.01 1 - - - - - -Gobiidae Gnatholepis thompsoni Jordan, 1904 - - - - - - 0.03 4 0.03 4 0.1 27 - - - - - -
indeterminedc - - - - - - - - - - - - - - - - - -Haemulidae Pomadasis incisus (Bowdich, 1825) - - 0.01 1 - - - - - - - - - - - - - -
Parapristipoma octolineatum (Valenciennes, 1833) - - - - - - - - 0.01 1 - - - - - - - -Kyphosidae Kyphosus sectator (Linnaeus, 1766)a - - - - 0.04 10 - - - - - - - - - - - -Labridae Bodianus scrofa (Valenciennes, 1839) 0.01 1 - - <0.01 2 0.04 5 0.02 4 0.02 8 - - - - - -
Centrolabrus trutta (Lowe, 1834) - - - - 0.01 3 - - <0.01 1 <0.01 1 - - - - - -Coris julis (Linnaeus, 1758) 0.01 1 0.02 1 0.12 9 0.01 1 - - 0.01 4 - - - - - -Symphodus mediterraneus (Linnaeus, 1758) - - - - - - - - - - - - - - - - - -Thalassoma pavo Linnaeus, 1758 20.70 98 21.1 97 22.84 96 12.2 96 12.63 95 13.61 99 16.44 100 29.09 100 22.10 97
Labrisomidae Labrisomus nuchipinnis (Quoy & Gaimard, 1824)a - - - - - - - - - - <0.01 1 - - - - - -Myliobatidae Myliobatis aquila (Linnaeus, 1758) - - - - <0.01 2 - - - - - - - - - - - -Mugilidae Indetermined 0.03 1 - - 0.07 2 0.05 2 - - <0.01 1 0.61 6 0.14 3 1.67 20Mullidae Mullus surmuletus Linnaeus, 1758 0.18 7 0.18 9 0.6 34 0.05 5 0.05 8 0.10 27 - - - - 0.01 3Muraenidae Enchelycore anatina (Lowe, 1837) 0.01 1 - - <0.01 2 - - - - - - - - - - - -
Gymnothorax unicolor (Delaroche, 1809) - - - - - - - - - - - - - - - - - -Muraena augusti (Kaup, 1856) - - 0.02 2 0.01 4 - - <0.01 1 <0.01 1 - - - - - -Muraena helena Linnaeus, 1758 - - - - - - - - - - - - - - - - - -
Pomacentridae Abudefduf luridus (Cuvier, 1830) 35.07 100 44.8 100 29.63 100 21.5 100 23.82 100 18.36 100 7.96 100 12.86 100 11.92 100Chromis limbata (Valenciennes, 1830) 18.48 49 14.8 46 14.43 70 19.82 84 22.15 85 19.83 94 0.07 9 0.03 6 1.06 54
Priacanthidae Heteropriacantus cruentatus (Lacepède, 1801) - - - - - - - - - - - - - - - - - -Scaridae Sparisoma cretense (Linnaeus, 1758) 4.61 80 4.4 82 14.43 95 0.78 47 0.73 53 1.08 93 0.3 53 0.59 50 0.67 83Scombridae Sarda sarda (Bloch, 1793) - - - - - - - - - - - - - - - - - -Scorpaenidae Scorpaena maderensis Valenciennes, 1833 1.09 46 1.61 40 0.93 71 0.35 24 0.48 32 0.50 73 0.03 3 0.04 9 0.04 6
Scorpaena scrofa Linnaeus, 1758a - - - - - - - - - - - - - - - - - -Serranidae Epinephelus marginatus (Lowe, 1834) - - 0.01 1 <0.01 1 - - - - - - - - - - - -
Mycteroperca fusca (Lowe, 1836) - - - - 0.02 4 - - <0.01 1 <0.01 1 - - 0.01 3 0.01 3Serranus atricauda Gunther, 1874 0.52 33 0.35 23 0.56 52 0.05 5 0.02 3 0.04 12 0.04 12 0.13 24 0.14 31
Sparidae Boops boops (Linnaeus, 1758) 5.78 8 0.88 9 1.4 15 29.40 19 28.49 19 20.76 33 25.03 29 0.42 12 14.68 51Dentex gibbosus (Rafinesque, 1810) 0.05 3 - - 0.01 3 - - 0.01 2 - - - - - - <0.01 3Diplodus cervinus (Lowe, 1810) 0.06 4 0.08 6 0.13 21 0.02 3 0.01 2 0.02 5 0.01 3 - - 0.02 6Diplodus sargus (Linnaeus, 1758) 0.90 14 1.1 23 1.66 48 0.86 21 0.30 16 1.16 38 0.81 56 0.37 38 1.12 63Diplodus vulgaris (E. Geoffroy St.-Hilaire, 1817) 0.65 11 1.54 20 1.86 46 0.45 10 0.69 12 0.77 32 0.17 21 0.11 12 0.08 14Oblada melanura (Linnaeus, 1758) 3.4 15 2.34 16 5.21 56 5.24 13 3.41 17 3.92 31 6.35 68 5.83 53 7.48 89Pagellus acarne (Risso, 1827) - - - - - - - - - - - - 0.19 6 0.42 9 0.29 14Pagellus erythrinus (Linnaeus, 1758) 0.01 1 0.01 1 0.12 10 - - - - 0.01 3 - - - - - -Pagrus pagrus (Linnaeus, 1758) 0.15 12 0.06 6 0.06 11 - - - - - - - - - - - -Spondyliosoma cantharus (Linnaeus, 1758) - - - - 0.02 1 0.03 1 0.1 1 0.08 2 - - - - <0.01 3Sarpa salpa (Linaneus, 1758) 0.76 10 0.55 18 3.11 56 - - - 0.04 3 - - - - 0.90 6
Synodontidae Synodus sp 0.21 13 0.32 26 0.67 71 0.32 22 0.16 22 0.50 75 0.01 3 0.06 9 0.04 17Sphyraenidae Sphyraena viridensis (Cuvier, 1829) - - 0.01 1 0.09 7 - - - - <0.01 2 0.03 3 - - 0.05 17Tetraodontidae Canthigaster capistrata (Lowe, 1839) 3.15 90 3.29 86 3.37 97 1.63 82 1.36 77 1.81 98 0.16 24 0.1 18 0.30 57
Sphoeroides marmoratus (Lowe, 1839) 0.44 23 0.43 24 1.07 71 0.45 32 0.33 33 0.94 81 0.41 41 0.76 47 0.87 74Triglidae Chelidonichthys lastoviza (Bonnaterre, 1788) 0.01 1 0.01 1 0.03 5 - - - - <0.01 1 - - - - - -Trypterygiidae Tripterygion delaisi Cadenat et Blache, 1971 1.17 47 0.8 43 0.73 60 0.71 40 0.38 36 0.67 77 0.04 12 0.13 21 0.14 34Uranoscopidae Uranoscopus scaber Linnaeus, 1758 - - - - - - - - - - - - - - - - - -
Total number of species 33 31 44 27 30 39 25 23 31 31
VFCGMR UAC ARMA
PC T VFC PC T VFC PC T

Comparison of Rocky Reef Fish Communities Using Underwater Visual Techniques
57
Table VI (continued) - Cumulative species list compiled from two years seasonal surveys at 3 locations on the South coast of Madeira Island using 3 UVCTs. RA - relative abundance and SF - sighting frequency (%) values according to each method. Species were listed in alphabetic order by family.Systematic order and nomenclature followed Brito et al, (2002) and Quéro et al. (2003). VFC - visual fast count (a exclusive record), PC – point count (b exclusive record), T – transect (c exclusive record). Species absence was indicated by –
deepFAMILIES SPECIES
RA SF RA SF RA SF RA SF RA SF RA SF RA SF RA SF RA SFAulostomidae Aulostomus strigosus Wheeler, 1955 <0.01 1 <0.01 1 0.03 13 - - - - <0.01 1 - - - - 0.01 9Apogonidae Apogon imberbis (Linnaeus, 1758) 0.04 6 <0.01 2 0.04 15 0.11 15 0.10 17 0.16 37 0.01 3 - - 0.01 6Atherinidae Atherina presbyter Cuvier, 1829 3.67 2 3.12 3 7.09 6 9.17 2 7.99 2 0.83 4 15.52 9 12.37 6 7.04 6Balistidae Balistes capriscus Gmelin, 1788 0.04 7 0.02 4 0.03 10 0.01 2 - - 0.01 5 0.11 14 10.12 17 0.08 29Belonidae Belone sp - - 0.04 1 0.03 4 - - - - 0.33 2 0.25 3 - - <0.01 3Blenniidae indetermined - - <0.01 1 - - - - - - - - - - - - - -
Ophioblennius atlanticus (Valenciennes, 1836) - - - - <0.01 2 <0.01 1 <0.01 1 0.01 3 0.03 6 0.09 17 0.14 57Bothidae Bothus podas (Delaroche, 1809) - - - - - - - - <0.01 2 0.01 4 - - - - - -Carangidae Caranx crysos (Mitchill, 1815)b - - - - - - - - - - - - - - - - - -
Pseudocaranx dentex (Bloch & Schneider, 1801) 0.55 6 1.24 3 0.48 14 0.97 6 0.39 4 0.30 16 0.01 3 0.01 3 0.01 9Seriola sp <0.01 1 <0.01 1 0.01 2 - - - - <0.01 1 0.01 3 - - 0.01 6Thachinotus ovatus (Linnaeus, 1758) 0.12 4 0.02 1 0.1 9 0.02 4 - - 0.31 3 0.32 9 - - 0.07 14
Clupeidae indetermineda - - - - - - - - - - - - - - - - - -Dasyatidae Dasyatis pastinaca (Linnaeus, 1758)c - - - - - - - - <0.01 1 - - - - - - - -Gobiesocidae Lepadogaster sp - - - - - - - - - - - - - - - - - -Gobiidae Gnatholepis thompsoni Jordan, 1904 0.02 3 0.01 3 0.03 10 0.01 2 <0.01 2 0.08 26 - - - - - -
indeterminedc - - - - - - - - <0.01 2 - - - - - - - -Haemulidae Pomadasis incisus (Bowdich, 1825) 0.02 3 0.06 4 0.06 15 4.97 14 2.80 13 6.68 34 0.06 11 0.37 11 0.24 34
Parapristipoma octolineatum (Valenciennes, 1833) - - - - - - 0.08 7 0.01 3 0.05 11 - - - - <0.01 3Kyphosidae Kyphosus sectator (Linnaeus, 1766)a - - - - - - - - - - - - - - - - - -Labridae Bodianus scrofa (Valenciennes, 1839) 0.15 25 0.11 20 0.08 30 0.07 14 0.05 13 0.09 36 - - - - - -
Centrolabrus trutta (Lowe, 1834) - - 0.01 1 - - 0.01 1 - - <0.01 1 - - - - - -Coris julis (Linnaeus, 1758) 0.02 2 0.02 3 0.03 14 0.11 10 0.10 10 0.14 29 - - - - - -Symphodus mediterraneus (Linnaeus, 1758) - - - - - - <0.01 1 <0.01 1 <0.01 1 - - - - - -Thalassoma pavo Linnaeus, 1758 4.53 90 4.63 91 6.21 98 3.08 92 3.35 100 4.52 100 9.03 97 12.22 97 9.84 100
Labrisomidae Labrisomus nuchipinnis (Quoy & Gaimard, 1824)a - - - - - - - - - - - - - - - - - -Myliobatidae Myliobatis aquila (Linnaeus, 1758) - - - - - - 0.01 2 <0.01 2 - - - - - - - -Mugilidae Indetermined - - - - <0.01 1 - - - - - - 0.01 3 0.02 3 0.07 9Mullidae Mullus surmuletus Linnaeus, 1758 0.41 10 0.57 15 0.22 23 - 19 0.46 30 0.66 54 1.54 60 2.55 69 1.15 86Muraenidae Enchelycore anatina (Lowe, 1837) - - - - <0.01 1 - - - - - - - - - - - -
Gymnothorax unicolor (Delaroche, 1809) 0.01 2 0.01 2 <0.01 3 <0.01 1 - - - - - - - - - -Muraena augusti (Kaup, 1856) 0.01 2 0.01 2 0.01 3 - - - - - - - - - - - -Muraena helena Linnaeus, 1758 - - - - - - - - - - - - 0.03 6 0.01 3 0.01 6
Pomacentridae Abudefduf luridus (Cuvier, 1830) 12 100 16.5 100 10.64 100 8.72 100 12.48 100 8.62 100 7.14 100 9.28 100 7.44 100Chromis limbata (Valenciennes, 1830) 34.2 93 35.4 98 26.98 100 33.65 95 41.60 98 30.40 98 3.81 80 4.50 91 5.90 94
Priacanthidae Heteropriacantus cruentatus (Lacepède, 1801) <0.01 1 <0.01 1 0.02 8 - - - - - - 0.01 3 0.01 3 0.01 6Scaridae Sparisoma cretense (Linnaeus, 1758) 0.87 60 0.87 62 1.13 97 0.53 42 0.58 60 0.73 88 0.28 31 0.37 40 0.31 69Scombridae Sarda sarda (Bloch, 1793) 0.03 1 0.01 1 <0.01 3 <0.01 1 - - 0.04 3 - - - - - -Scorpaenidae Scorpaena maderensis Valenciennes, 1833 0.73 49 0.68 45 0.55 77 0.42 40 0.36 41 0.35 69 0.08 14 0.06 11 0.09 46
Scorpaena scrofa Linnaeus 1758a - - - - - - - - - - <0.01 2 - - - - - -Serranidae Epinephelus marginatus (Lowe, 1834) - - - - 0.01 6 - - - - - - - - - - - -
Mycteroperca fusca (Lowe, 1836) 0.56 42 0.37 38 0.46 63 0.12 18 0.06 11 0.12 43 - - - - <0.01 3Serranus atricauda Gunther, 1874 0.4 41 0.33 36 0.4 55 0.24 32 0.16 32 0.2 52 0.25 43 0.28 49 0.23 60
Sparidae Boops boops (Linnaeus, 1758) 33.6 17 28.1 15 36.84 36 19.68 49 14.8 35 23.22 73 38.30 57 36.84 51 45.51 89Dentex gibbosus (Rafinesque, 1810) 0.08 7 0.04 6 0.04 15 0.12 16 0.19 20 0.25 40 0.38 31 0.35 37 0.33 57Diplodus cervinus (Lowe, 1810) 0.17 19 0.11 19 0.17 44 0.11 12 <0.01 8 0.10 24 - - - - 0.02 9Diplodus sargus (Linnaeus, 1758) 0.76 35 1.68 33 1.11 55 - 25 1.51 24 1.89 50 0.32 31 0.52 34 0.57 57Diplodus vulgaris (E. Geoffroy St.-Hilaire, 1817) 1.22 20 1.07 19 1.09 31 4.84 64 3.78 62 4.47 91 2.23 83 1.78 83 1.45 94Oblada melanura (Linnaeus, 1758) 1.51 18 1.08 18 2.61 47 8.27 24 7.35 25 12.19 48 17.09 60 15.52 60 16.46 86Pagellus acarne (Risso, 1827) - - - - - - - - - - - - - - - - - -Pagellus erythrinus (Linnaeus, 1758) - - <0.01 1 0.02 6 0.02 4 0.02 3 0.08 24 0.01 3 0.01 3 0.05 20Pagrus pagrus (Linnaeus, 1758) 0.08 8 0.09 8 0.12 25 0.02 4 0.03 5 0.03 17 0.03 3 0.02 3 0.02 11Spondyliosoma cantharus (Linnaeus, 1758) 0.19 2 - - 0.04 2 0.24 13 0.14 14 0.35 33 0.03 6 0.09 6 0.05 9Sarpa salpa (Linaneus, 1758) 0.18 3 0.19 4 0.35 11 - - - - 0.56 10 - - - - <0.01 3
Synodontidae Synodus sp 0.17 23 0.2 31 0.29 74 0.19 22 0.07 18 0.25 72 0.14 20 0.22 34 0.30 80Sphyraenidae Sphyraena viridensis (Cuvier, 1829) 0.07 5 0.05 2 0.14 19 - - - - 0.01 4 0.06 3 0.01 3 <0.01 3Tetraodontidae Canthigaster capistrata (Lowe, 1839) 2.97 95 2.8 91 1.98 98 1.52 81 1.17 84 1.32 95 1.04 74 0.98 77 0.90 94
Sphoeroides marmoratus (Lowe, 1839) 0.5 40 0.45 46 0.43 78 0.17 30 0.15 25 0.32 70 1.71 80 1.73 86 1.60 97Triglidae Chelidonichthys lastoviza (Bonnaterre, 1788) - - - - - - - - - - <0.01 2 - - - - - -Trypterygiidae Tripterygion delaisi Cadenat et Blache, 1971 0.12 18 0.08 10 0.11 40 0.09 17 0.12 26 0.30 71 0.11 20 0.11 23 0.06 26Uranoscopidae Uranoscopus scaber Linnaeus, 1758 - - - - - - <0.01 1 - - <0.01 1 - - - - - -
Total number of species 37 40 43 38 35 44 32 28 37
T VFCGMR UAC ARMA
PC T VFC PC T VFC PC

Cláudia Ribeiro
58
Table VII - Percentage of species exclusively recorded by each method in each location according depth strata. Methods: PC - point count, T - transect, VFC - visual fast count
Table VIII– qualitative similarities (presence-absence data Sorense index) within the UVCT used in locations studied
% Exclusive records Shallow PC T VFC
Deep PC T VFC
Artificial Riprap of Madeira Airport (ARMA) Unprotected natural area of Caniçal (UAC) Garajau marine reserve (GMR)
3.2 - 19.3 2 5 19 - 2.2 15.5
- - 13.5 2 4.1 14.58 - 4.4 9
Locations Methods PC T VFC Artificial
riprap of Madeira airport
Shallow PC T VFC
* 0.92 0.86
* 0.85
*
Deep
PC T VFC
* 0.93 0.93
* 0.86
*
Unprotected natural area
Caniçal Shallow
PC T VFC
* 0.81 0.79
* 0.81
*
Deep
PC T VFC
* 0.88 0.88
* 0.81
*
Garajau marine reserve
Shallow PC T VFC
* 0.81 0.85
* 0.8
Deep
PC T VFC
* 0.94 0.93
* 0.92
*

Comparison of Rocky Reef Fish Communities Using Underwater Visual Techniques
59
Figure 9 - Species accumulation curves in rocky boulders bottoms of the 3 locations (GMR – Garajau marine reserve, ARMA – artificial riprap of Madeira airport, UAC – unprotected area of Caniçal) for each visual census method and pooling data from the 3 methods
GMRshallow
02468
101214161820222426283032343638404244
0 1 2 3 4 5 6 7 8 9 10 11 12 13 14 15 16 17 18 19 20 21 22 23 24 25 26 27 28 29 30 31 32 33 34 35 36 37
cum
ulat
ive
num
ber o
f spe
cies
ARMAshallow
02468
101214161820222426283032343638404244
0 1 2 3 4 5 6 7 8 9 10 11 12 13 14 15 16 17 18 19 20 21 22 23 24 25 26 27 28 29 30 31 32 33 34 35 36 37
cum
ulat
ive
nº o
f spe
cies
UACshallow
02468
101214161820222426283032343638404244
0 1 2 3 4 5 6 7 8 9 10 11 12 13 14 15 16 17 18 19 20 21 22 23 24 25 26 27 28 29 30 31 32 33 34 35 36
nº of surveys
cum
ulat
ive
nº o
f spe
cies

Cláudia Ribeiro
60
Figure 9 (continued) - Species accumulation curves in rocky boulders bottoms of the 3 locations (GMR – Garajau marine reserve, ARMA – artificial riprap of Madeira airport, UAC – unprotected area of Caniçal) for each visual census method and pooling data from the 3 methods
GMRdeep
02468
101214161820222426283032343638404244
0 1 2 3 4 5 6 7 8 9 10 11 12 13 14 15 16 17 18 19 20 21 22 23 24 25 26 27 28 29 30 31 32 33 34 35 36 37
cum
ulat
ive
nº o
f spe
cies
PCdeep
Tdeep
VFCdeep
3methods
ARMAdeep
02468
101214161820222426283032343638404244
0 1 2 3 4 5 6 7 8 9 10 11 12 13 14 15 16 17 18 19 20 21 22 23 24 25 26 27 28 29 30 31 32 33 34 35 36 37
cum
ulat
ive
nº o
f spe
cies
UACdeep
02468
101214161820222426283032343638404244
0 1 2 3 4 5 6 7 8 9 10 11 12 13 14 15 16 17 18 19 20 21 22 23 24 25 26 27 28 29 30 31 32 33 34 35
nº of suveys
cum
ulat
ive
nº o
f spe
cies

Comparison of Rocky Reef Fish Communities Using Underwater Visual Techniques
61
6.2- Fish assemblages
An overall number of 61 diurnally active fish taxa, belonging to 33 families
were censused during the two-years survey period, using three UVCTs in three
locations of the South coast of Madeira Island. The total number of fish taxa presented
in this inventory underestimates the real species richness censused, i.e. the actual
number of species recorded in our sample was higher. This was due the fact that
individuals belonging to families Clupeidae, Gobiidae and Mugilidae and genera
Belone, Seriola and Synodus were not identified to species level by direct visual
observations, as happened in other studies, due to difficulties and even impossibility of
correct identification by visual contact (Harmelin, 1987; La Mesa & Vachi, 1999; Rilov
& Benayahu, 2000; Guidetti et al., 2005).
From the overall species list only two belonged to Chondrichthyes whilst
remaining taxa were Osteichthyes. Out of the 61 species observed, 34 (55.7% out of the
total recorded) appeared in the entire area of study, i.e., in all locations, composing the
‘pool’ of species common to all locations (scientific names bold typed in Table VI).
Almost half of the recorded species (44%) are fish consumed locally, but among them
the most targeted by artisanal and spearfishers were: S. cretense, C. limbata, S.
atricauda, Mycteroperca fusca, Epinephelus marginatus, Seriola sp and most of the
members of Sparidae family.
The families Sparidae (11 spp), Labridae (5 spp), Carangidae (4 spp),
Muraenidae and Serranidae (3 spp) contribute most to species richness, composing 78%
of the total species observed. Thus, concerning the number of species, sparids and
labrids prevail in the assemblages of rocky littoral reefs of Madeira Island, while many
other families were represented by few species. Indeed, 22 families were represented by
a singular species.
Communities indices
6.2.1 - Species richness and Diversity
The total number of fish species recorded showed comparable values in two of
the locations studied: fifty-four species recorded inside the natural unprotected area
(UAC) and fifty inside the protected area (GMR), corresponding namely to 88.5 and
82% of the whole assemblage (61 spp.) censused in this study. Comparisons made at a
higher taxonomic level genus and family, revealed the same trend: 51 genus and 31
families registered in the unprotected area and 47 genus and 29 families inside reserve.

Cláudia Ribeiro
62
Thus, factor “protection” turned to not have significant effect on the total number of
species observed in both natural locations.
Comparing the total number of species recorded in the natural locations (54 spp.
in UAC and protected 50 spp. in GMR has mentioned above) there’s a considerable
difference in relation to the number of species recorded in the artificial unprotected
location of the riprap of Madeira airport (ARMA) were just 39 species were observed in
the rubble mound. The number of genus and families were also comparatively less than
the recorded in the “natural” locations; namely 34 and 22. However, it is worthwhile to
mention that natural locations, UAC and GMR comprise three bottoms types whilst
ARMA just comprise rocky boulders (Rb). Thereby, comparing species richness in Rb
bottoms among locations did not differed much and is actually still comparable with the
values obtained on Rb bottoms in natural locations: forty-five and forty-one species
censused at GMR and UAC respectively.
The overall and mean number of species recorded by visual surveys in each
bottom type, depth strata and location was plotted in figure 10. The mean species
richness ranged between a minimal value of 10.2+2.2 in shallow platform bottoms of
the natural unprotected location and a maximum of 18.6+3.8 on the same bottom type
and location, but at deep depth interval. Per depth strata, the overall and mean species
richness over the Rb floors in the three locations was similar. Results of the multifactor
ANOVA comparing species richness in Rb bottoms across locations, depth, seasons and
years (Figure 11) reinforced the graphical analysis and did not revealead significant
differences between locations neither between years, but with an interaction registered
between factors year and location (F= 4.88; p<0.01). Statistical differences were seen
between seasons (F=5.670; p<0.001) and depths (F= 110.046; p<0.001). The pattern of
variation for both, total and mean number of species was similar, greater value in deep
than shallow stratum and in summer and autumn than in winter and spring seasons in
the three locations. Thus, the factor protection turned out to be not significant over this
community index, seasonally the mean species richness recorded in the rocky boulders
bottoms at the three locations (protected vs. unprotected) did not attain consistently
higher values inside the marine reserve.
A considerable global similarity occurred in the overall number of fish species
recorded in the natural protected and unprotected locations according to type of bottom,
exception made to platforms bottom where the total fish species censused was much
higher in the shallow strata inside the reserve than in the unprotected location. The
pattern was that the overall and mean number of species surveyed in the unprotected

Comparison of Rocky Reef Fish Communities Using Underwater Visual Techniques
63
area increase with depth in all bottoms types and also when pooling bottoms types (42
spp. in shallow and 48 spp. in deep strata respectively), whilst inside reserve that was
not so evident. In fact inside GMR, only in rocky boulder bottoms the difference
between shallow and deep strata was considerable, but in wall and platform bottoms the
overall and mean species richness over the two strata were very similar. Differences in
overall and mean species richness between shallow and deep strata tended to be higher
in the two unprotected (natural and artificial) than in the protected location (Figure 10).
The observed trend was an increase of the number of fish species from shallow to
deeper habitats; however inside reserve the increase was not so evident. In fact, inside
reserve only in rocky boulders reefs the number of species slightly increased from
shallow to deep strata.
In platform bottoms, the seasonal variation of mean species richness showed
significant differences among locations (F=4.928; p<0.05) and considerably higher
values were recorded in shallow strata inside reserve and conversely in deep strata of
the unprotected location (Figure 12). In wall substrate, no statistical differences among
locations were recorded, but as before, for the other two types of bottoms, overall and
mean species richness differed between shallow and deep strata, increasing with depth
and differing between seasons (Sm, Au>Sp, W; p<0.05).
The analyses of each location showed that in ARMA the mean number of
species gathered with the three UVCTs changed with depth, whilst factor season and
year did not exerted significant influence on this parameter. In turns, inside reserve the
number of species recorded differed significantly between type of bottom, depth and
seasons, with significant interactions between factors depth, season and year and factors
depth and bottom type (four factor ANOVA see Table IX). In the natural unprotected
area, UAC, the multifactor ANOVA was of more complex interpretation, since more
interactions between factors occurred; nevertheless pooling the three UVCTs the mean
number of species was significantly higher at deep strata than in shallow and in winter
time was significantly less than in the remaining seasons. Seasonally, the shallow wall
and platform habitats in the reserve tend to have relatively higher species richness than
the same habitats surveyed in the unprotected location. At the deep strata, besides
differences between locations were not so evident an opposite situation happened: in the
unprotected location the mean number of species per season tended to be higher than in
the reserve. Though, seasonal variation of species richness had similar pattern in all
locations, with an increase of species in warm seasons, mainly summer and autumn and
a decrease in the winter season for almost all sites (Figure 11 and Figure 12).

Cláudia Ribeiro
64
Figure 10 - Overall and mean number of species recorded using three UVCTs in each location studied over two depth strata: UAC- unprotected natural location of Caniçal, GMR – Garajau marine reserve –protected natural location, ARMA – artificial riprap of Madeira airport; Rb- rocky boulders bottom, W – wall, Plat – platform bottom. Typed number above X axe represents the total of species recorded in each substrate for the entire depth interval (shallow + deep)
0123456789
101112131415161718192021222324
Sp-0
2
Sm-0
2
Au-
02
W-0
2
Sp-0
3
Sm-0
3
Au-
03
W-0
3
Sp-0
2
Sm-0
2
Au-
02
W-0
2
Sp-0
3
Sm-0
3
Au-
03
W-0
3
Shallow Deep
Mea
n sp
ecie
s ric
hnes
s
GMRUACARMA
Figure 11– Seasonal variation of mean species richness (+ standard deviation – SD) recorded by the three UVCTs on rocky boulders bottoms in the locations studied
The seasonal variation of the Shannon diversity values (H´) in the three locations
with rocky boulders bottom is given in Figure 13. All locations had similar H’ values,
ranging from a minimal value 0.99 registered in Spring 2002 in deep rocky boulders
reefs of UAC and a maximum value of 1.83 obtained in deep reefs in the marine
0123456789
1011121314151617181920212223242526272829303132333435363738394041
UACRb UACW UACPlat GMRRb GMRW GMRPlat ARMARb
Spec
ies r
ichn
ess
Mean S
Total S
41 44 42 45 44 46 39
------ Deep ____ Shallow

Comparison of Rocky Reef Fish Communities Using Underwater Visual Techniques
65
reserve. The multifactor ANOVA over this index in the rocky boulders fish commnities
did not revealed significant differences within any of the other concerned factors.
The Shannon diversity index obtained for wall and platform bottoms showed
some statistical differences among the factors considered. The H’ values were higher in
GMR than in UAC, either in wall and platform bottoms (F= 22.77; p<0.001 and
F=10.56; p<0.001 respectively) and larger difference was observed in shallow than in
deep strata. Statistical differences were recorded in diversity values between the two
intervals of depth, registering higher values in shallow strata inside reserve whilst in
UAC was in the deep strata. Among seasons, the significant differences were just
registered between summer and the remaining seasons in walls bottom.
0123456789
1011121314151617181920212223242526
Sp-0
2
Sm-0
2
Au-
02
W-0
2
Sp-0
3
Sm-0
3
Au-
03
W-0
3
Sp-0
2
Sm-0
2
Au-
02
W-0
2
Sp-0
3
Sm-0
3
Au-
03
W-0
3
Shallow Deep
Mea
n sp
ecie
s ric
hnes
s
GMRW
UACW
GMRPlat
UACPlat
Figure 12- Seasonal variation of mean species richness (+ SD) on rocky boulders bottoms in the locations studied

Cláudia Ribeiro
66
Table IX – Multifactor ANOVA results for the number of species obtained by the three UVCTs in each location studied (ARMA – artificial riprap of Madeira airport, UAC – unprotected natural area of Caniçal, GMR – Garajau marine reserve); Seasons: Sp – spring, Sm – summer, Au – autumn. W – winter; Types of bottoms: Plat – platform, Rb – rocky boulders, W – wall; Year: 2002 and 2003
Locations ARMA UAC GMR
Depth 21.386***(S<D) 297.439***(S<D) 20.151***(S<D)Season 2.725 13.741*** (Sp, Sm, Au ≠W) 6.391***(Sp≠ Sm, Au, W)Type of bottom 0.152 4.829**(Plat≠W)Year 0.152 29.055*** 0.729Depth x Type of bottom 25.352*** 10.489***Season x Year 8.913***Depth xType of bottom x season 2.45*Depth x Season x Year 3.640*Type of bottom x Season x Year 2.52*
00,10,20,30,40,50,60,70,80,9
11,11,21,31,41,51,61,71,81,9
22,12,22,32,4
Sp02
Sm02
Au0
2
W02
Sp03
Sm03
Au0
3
W03
Sp02
Sm02
Au0
2
W02
Sp03
Sm03
Au0
3
W03
Shallow Deep
Mea
n H
'
GMR
UAC
ARMA
Figure 13 – Seasonal variation of mean Shannon diversity (+ SD) in the locations with rocky boulders bottoms
6.2.2 - Qualitative Similarity
As aforementioned, out of the overall list of species, thirty-four comprise the
‘pool’ of species common to all locations, bold typed in Table VI. The qualitative
similarities of community composition ranged from 59.6 - 87.5% for the possible
combinations of bottoms types within and between locations. This range indicated a
very consistent species composition and great homogeneity between reefs (Table X).
The taxonomic structure of the fish assemblage in the three locations studied
was characterized in terms of species number by the strong dominance of Sparidae (20-

Comparison of Rocky Reef Fish Communities Using Underwater Visual Techniques
67
28% in the three locations) and Labridae (9% in natural locations, exception was made
to the artificial airport riprap where that family was misrepresented with just one
species). Though, sparids were not the most frequent species in the locations studied,
and its sighting frequency values vary according to the several species of sparids and to
the locations considered (Table XI).
0
0,2
0,4
0,6
0,8
1
1,2
1,4
1,6
1,8
2
2,2
2,4
Sp02 Sm02 Au02 W02 Sp03 Sm03 Au03 W03 Sp02 Sm02 Au02 W02 Sp03 Sm03 Au03 W03
Shallow Deep
Mea
n H
'
GMRWUACWGMRPlatUACPlat
Figure 14 – Seasonal variation of mean Shannon diversity (+ SD) in wall and platform bottoms of GMR and UAC
The most significant qualitative difference between locations consisted in
occurrences of species that were unique to a site. They were mostly cryptic and rare
species that consequently had low probability of being recorded. Thirteen species
comprise the group of species observed only at one of the locations studied: eight of
them only occurred in the natural unprotected location (UAC) (Clupeidae and Gobiidae
undetermined, Caranx crysos, Dasyatis pastinaca, Labrisomus nuchipinnis, Scorpaena
scrofa, Symphodus mediterraneus and Uranoscopus scaber); three were unique to the
protected location (GMR) (Enchelycore anatina, E. marginatus and K. sectator) and
two species (Muraena helena and Pagellus acarne) unique to the artificial unprotected
location of Madeira airport riprap (ARMA). Moreover, these “unique species” were
neither common nor abundant at any bottom type and locality (see Table XI).
The occurrence of species in a particular type of bottom did not showed
consistenty among locations. For example Pomadasis incisus occurred in Rb bottom in
GMR and ARMA, but in UAC also occurred in platform bottom, where in fact was
more frequent and abundantly observed.

Cláudia Ribeiro
68
Table X- Proportion of reef associated species found at only one bottom type in each location (unique) and common species expressed as % of the total number of species recorded at a given pair of types of bottom
6.2.3.- Sighting Frequency The temporal variability of the fish assemblages was reflected in species sighting
frequency. There are resident or reef permanent fishes, i.e., those site-attached species
such as: A. luridus, T. pavo, C. capistrata, Sphoeroides marmoratus etc.; there’s also
wanderer fishes – those holding larger home ranges such as the scarid S. cretense or the
wrasse B. scrofa; and visitors – fishes that occasionally feed or rest on the rocky shores,
e.g. pelagic fishes like some carangids (e.g. Seriola sp., Pseudocaranx dentex).
Considering each type of bottom and depth strata sampled in the locations
studied the proportion of reef permanent species (SF>75%) ranged between 22-28% in
GMR, 23-32% in UAC and 22-27% in ARMA. Rocky boulders reefs presented lower
values of fishes belonging to that category than wall and platform in both natural
locations. The proportion of frequent species (sighting classe 50-74% see data analysis
section for more details) was smaller than the proportion of permanent species, ranging
around 6-13% in GMR, 0-21% in UAC and 16% in ARMA. Occasional species
(25<SF>49%) were generally less represented than permanent species, ranging between
5-28% inside reserve and between 6-16% in the natural unprotected area, whilst in the
artificial non-protected ranged between 8-13%. Rare species (SF<25%) dominated in
terms of proportion in all locations, indeed it ranged from 47 to 54% in GMR, from 34
to 58% in UAC and in ARMA represented in average 50% of the total number of
species recorded.
Out of the total list of species, A. luridus and T. pavo were the most frequent
species (category: reef permanent species accordingly to the adopted classification of
GMR UAC Unique
GMR Rb W Plat
Rb W Plat
Rb 4 - - - W 2 85.4 - - Plat 5.9 85.7 87.5 -
UAC Rb 5.6 72 68 68.6 - - - W 16 66 68.6 71.2 63.5 - - Plat 4.7 72 68 69 75.6 66.6 - ARMA
Rb 3.2 60 69.4 64.7 68.8 59.6 72.3

Comparison of Rocky Reef Fish Communities Using Underwater Visual Techniques
69
Charbonnel et al., 1995) in all locations, bottoms types and depth strata. They had 100%
sighting frequency for all possible combinations. Both species do not have commercial
value in Madeira Island, distributing from intertidal rock pools (mainly juveniles) to
more than 30 meters (pers. obs.). Besides being the most frequent species seen in this
study they were also very abundant and thereby dominant species, always included in
the ten most abundant species, appearing mostly in the first five ranked species (see
table XII).
A small group of species including C. capistrata, C. limbata, D. sargus, D.
vulgaris, Oblada melanura, Scorpaena maderensis, S. cretense, S. marmoratus,
Synodus sp. and T. delaisi had high sighting frequency in almost all localities, types of
bottoms and depth strata, ranging between the category of reef permanent to frequent
species. They were all included in the list of the ten most abundant species (Table XII)
according to each site studied. From the 34 species censused in all locations, 23 formed
up the list of the ten most abundant in each of the sites studied. This list of species
compose the basis of the assemblages in the bottoms types surveyed, therefore there
new-sighting in each sample is almost compulsory no matter location, depth, bottom
type, season or momentaneal environmental events occurred. A good representation of
the quantitative structure of the assemblages is given by the stock of species occupying
the list of the ten first abundance ranks in each site.
The percentage of rare species in the entire area of study was high, 27 species
appeared in less than 25% of the counts in all sites studied and some were recorded just
in one location. Important to sign the presence of the big grouper E. marginatus only
inside reserve in the three types of bottoms surveyed, thought with very low frequency
and abundance (one specimen each time). In the category of rare species were included
cryptic species as A. strigosus, Bothus podas, M. helena, Heteropriacanthus
cruentathus, benthic species as E. marginatus, Centrolabrus trutta, S. mediterraneus,
nectobentic species as K. sectator, P. acarne and also pelagic transient species as the
case of Belone sp., C. crysos, Seriola sp.

Cláudia Ribeiro
70
Table XI – Relative abundance (RA) and sighting frequency (SF) of species from pooled surveys in the three locations (GMR- garajau marine reserve, UAC – unprotected area of Caniçal, ARMA – artificial riprap of Madeira airport), types of bottoms (Rb- rocky boulders; W – wall, Plat – platform) and depths sampled (shallow = 0-10 m and deep = 10-20 m) ; ET- ecological types; TC – Trophic category (MiC – microcarnivores, MeC – mesocarnivores, MaC – macrocarnivores, H- herbivores, O – omnivores)
RA SF RA SF RA SF RA SF RA SF RA SF RA SFAulostomidae Aulostomus strigosus Wheeler, 1955 2 MiC - - 0.06 8.6 <0.01 2.9 - - - - - - 0.03 8.6Apogonidae Apogon imberbis (Linnaeus, 1758) 3 MeC - - 1.54 80 <0.01 2.9 <0.01 2.9 0.12 41.2 - - - -Atherinidae Atherina presbyter Cuvier, 1829 1 MiC - - 5.32 8.6 1.46 2.9 4.86 8.8 19.19 8.8 3.25 3 37.35 77.1Balistidae Balistes capriscus Gmelin, 1788 1 MeC 0.02 11.4 - - - - <0.01 2.9 - - - - 0.11 20Belonidae Belone sp 1 MeC 0.05 2.9 0.06 5.7 - - <0.01 2.9 0.01 2.9 0.01 3 0.01 2.9Blenniidae indetermined 3 - - - - - - - - - - - - - 0.01 2.9
Ophioblennius atlanticus (Valenciennes, 1836) 3 H 0.53 71.4 1.68 91.4 0.30 5.7 0.04 26.5 0.58 88.2 0.34 84.8 2.79 100Bothidae Bothus podas (Delaroche, 1809) 3 MeC <0.01 2.9 0.02 5.7 0.16 20 - - - - - - - -Carangidae Caranx crysos (Mitchill, 1815) 1 MaC - - - - - - - - 0.17 2.9 - - - -
Pseudocaranx dentex (Bloch & Schneider, 1801) 1 MaC 0.24 5.7 0.28 20 0.46 54.3 0.02 5.9 - - 0.01 3 0.08 17.1Seriola sp 1 MaC - - 0.01 2.9 <0.01 5.7 - - 0.05 8.8 <0.01 3 <0.01 2.9Thachinotus ovatus (Linnaeus, 1758) 1 MeC - - - - 0.25 5.7 - - 0.04 8.8 - - 0.36 8.6
Clupeidae indetermineda 1 MiC - - - - - - 1.32 5.9 - - - - - -Dasyatidae Dasyatis pastinaca (Linnaeus, 1758) 3 MeC - - - - - - - - - - - - - -Gobiesocidae Lepadogaster sp 3 MiC - - 0.03 8.6 0.01 2.9 - - 0.01 5.9 - - - -Gobiidae Gnatholepis thompsoni Jordan, 1904 3 O - - - - - - 0.10 53 <0.01 2.9 0.07 33.3 - -
indetermined 3 - - - - - - - - - - - - - - -Haemulidae Pomadasis incisus (Bowdich, 1825) 2 MiC <0.01 2.9 - - - - - - - - - - - -
Parapristipoma octolineatum (Valenciennes, 1833 2 MiC - - - - - - <0.01 2.9 - - - - - -Kyphosidae Kyphosus sectator (Linnaeus, 1766) 1 O <0.01 2.9 - - 0.07 25.7 - - - - - - - -Labridae Bodianus scrofa (Valenciennes, 1839) 2 MeC 0.01 2.9 0.01 2.9 - - 0.01 2.9 0.07 20.6 - - - -
Centrolabrus trutta (Lowe, 1834) 2 MiC - - - - 0,02 8.6 <0.01 2.9 <0.01 2.9 - - - -Coris julis (Linnaeus, 1758) 2 MiC 0.01 8.6 0.02 2.9 0.2 17.1 0.01 5.9 0.01 5.9 - - - -Symphodus mediterraneus (Linnaeus, 1758) 2 MiC - - - - - - - - - - - - - -Thalassoma pavo Linnaeus, 1758 1 MiC 23.24 100 23.46 100 17.97 100 7.97 100 9.99 100 23.76 100 21.81 100
Labrisomidae Labrisomus nuchipinnis (Quoy & Gaimard, 1824) 3 MiC - - - - - - - - - - <0.01 3 - -Myliobatidae Myliobatis aquila (Linnaeus, 1758) 3 MiC <0.01 5.7 - - - - - - - - - - - -Mugilidae Indetermined 1 O - - 0.05 5.7 0.1 2.9 0.03 2.9 - - <0.01 3 0.95 28.6Mullidae Mullus surmuletus Linnaeus, 1758 1 MeC 0.03 20 0.09 25.7 1.25 62.9 0.16 70.6 0.02 14.7 <0.01 6.1 <0.01 2.9Muraenidae Enchelycore anatina (Lowe, 1837) 3 MaC 0.01 5.7 <0.01 2.9 - - - - - - - - - -
Gymnothorax unicolor (Delaroche, 1809) 3 MaC - - - - - - - - - - - - - -Muraena augusti (Kaup, 1856) 3 MaC 0.02 11.4 <0.01 2.9 <0.01 2.9 - - 0.01 2.9 - - - -Muraena helena Linnaeus, 1758 3 MaC - - - - - - - - - - - - - -
Pomacentridae Abudefduf luridus (Cuvier, 1830) 1 O 35.81 100 34.33 100 35.08 100 17.47 100 11.25 100 36.80 100 10.87 100Chromis limbata (Valenciennes, 1830) 1 MiC 26.92 100 6.49 88.6 4.21 34.3 19.57 100 27.02 100 14.59 87.9 0.54 57
Priacanthidae Heteropriacanthus cruentatus (Lacepède, 1801) 3 MeC - - - - - - - - - - - - - -Scaridae Sparisoma cretense (Linnaeus, 1758) 1 O 3.61 94.3 6.15 100 7.25 100 0.46 94.1 1.25 97.1 1.13 96.7 0.7 97.1Scombridae Sarda sarda (Bloch, 1793) 1 MaC - - - - - - - - - - - - -Scorpaenidae Scorpaena maderensis Valenciennes, 1833 3 MeC 0.21 65.7 3.42 100 0.69 91.4 0.10 58.8 0.75 91.2 0.66 94 0.07 17.1
Scorpaena scrofa Linnaeus, 1758 3 MeC - - - - - - - - - - - - -Serranidae Epinephelus marginatus (Lowe, 1834) 2 MaC - - 0.01 5.7 - - - - - - - - -
Mycteroperca fusca (Lowe, 1836) 2 MaC <0.01 2.9 0.01 5.7 <0.01 2.9 0.01 2.9 - - - 0.01 2.9Serranus atricauda Gunther, 1874 3 MeC 0.73 94.3 0.24 40 0.31 54.3 0.03 14.7 0.05 20.6 0.04 15.2 0.17 37.1
Sparidae Boops boops (Linnaeus, 1758) 1 O 1.12 14.3 1.63 20 4.86 25.7 38.89 47.1 15.97 44.1 15.82 30.3 14.06 65.7Dentex gibbosus (Rafinesque, 1810) 1 MeC 0.03 11.4 - - - - 0.01 5.9 - - - - <0.01 2.9Diplodus cervinus (Lowe, 1810) 1 O 0.02 14.3 0.02 5.7 0.29 42.9 0.04 20.6 <0.01 2.9 - - 0.03 11.4Diplodus sargus (Linnaeus, 1758) 1 MiC 0.42 31.4 0.83 48.6 3.29 80 0.93 55.9 1.2 41.2 0.21 21.2 0.96 71.4Diplodus vulgaris (E. Geoffroy St.-Hilaire, 1817) 1 MiC 2.29 85.7 0.1 22.9 1.38 34.3 0.52 61.8 1.41 32.4 0.03 6.1 0.18 31.4Oblada melanura (Linnaeus 1758) 1 O 0.59 40 5.62 62.9 8.18 85.7 3.39 58.8 7.6 47.1 0.98 6.1 6.72 91.4Pagellus acarne (Risso, 1827) 1 MiC - - - - - - - - - - - - 0.32 17.1Pagellus erythrinus (Linnaeus, 1758) 1 MiC - - 0.04 11.4 0.19 22.9 0.01 5.9 <0.01 2.9 - - - -Pagrus pagrus (Linnaeus, 1758) 1 MiC 0.15 42.9 - - 0.02 2.9 - - - - - - - -Spondyliosoma cantharus (Linnaeus, 1758) 1 O - - - - 0.04 2.9 0.18 2.9 0.01 2.9 - - <0.01 2.9Sarpa salpa (Linaneus, 1758) 1 H 0.44 14.3 1.74 80 4.26 82.9 - - - - 0.07 9.1 0.37 5.7
Synodontidae Synodus sp 3 MeC 0.28 65.7 0.5 74.3 0.73 85.7 0.32 88.2 0.39 76.5 0.34 78.8 0.08 25.7Sphyraenidae Sphyraena viridensis (Cuvier, 1829) 1 MaC - - 0.17 20 <0.01 2.9 - - 0.01 5.9 - - 0.06 20Tetraodontidae Canthigaster capistrata (Lowe, 1839) 2 O 1.91 100 3.92 100 5.98 100 1.79 100 1.6 100 1.40 100 0.31 68.6
Sphoeroides marmoratus (Lowe, 1839) 2 O 0.66 88.6 0.44 57.1 1.15 94.3 0.91 94.1 0.64 97.1 0.22 63.6 0.83 82.9Triglidae Chelidonichthys lastoviza (Bonnaterre, 1788) 3 MiC - - - - 0.07 14.3 <0.01 2.9 - - - - - -Trypterygiidae Tripterygion delaisi Cadenat et Blache, 1971 3 MiC 0.53 74.3 1.71 88.6 0.63 71.4 0.83 97 0.56 82.4 0.25 72.7 0.18 51.4Uranoscopidae Uranoscopus scaber Linnaeus, 1758 3 MeC - - - - - - - - - - - - - -
TCRb
GMR UAC ARMAShallow
FAMILIES SPECIES ETRb W Plat Rb W Plat

Comparison of Rocky Reef Fish Communities Using Underwater Visual Techniques
71
Table XI – cont.
RA SF RA SF RA SF RA SF RA SF RA SF RA SFAulostomidae Aulostomus strigosus Wheeler, 1955 2 MiC <0.01 2.9 <0.01 2.9 0.04 37.1 <0.01 3 - - - - <0.01 8.6Apogonidae Apogon imberbis (Linnaeus, 1758) 3 MeC <0.01 2.9 0.08 42.9 0.02 20 0.06 42.4 0.34 73.5 0.05 35.3 <0.01 8.6Atherinidae Atherina presbyter Cuvier, 1829 1 MiC - - 8.36 11.4 7.25 14.3 14.91 6.1 - - 0.88 8.8 10.55 8.9Balistidae Balistes capriscus Gmelin, 1788 1 MeC 0.04 20 0.03 14.3 0.02 8.6 0.01 12.1 0.01 2.9 - - 0.10 31.4Belonidae Belone sp 1 MeC - - - - 0.06 11.4 0.04 3 - - 0.31 2.9 0.06 5.7Blenniidae indetermined 3 - - - <0.01 2.9 - - - - - - - - - -
Ophioblennius atlanticus (Valenciennes, 1836) 3 H <0.01 5.7 - - - - <0.01 3 0.02 11.7 - - 0.10 65.7Bothidae Bothus podas (Delaroche, 1809) 3 MeC - - - - - - - - 0.02 11.7 - - - -Carangidae Caranx crysos (Mitchill, 1815) 1 MaC - - - - - - - - - - - - - -
Pseudocaranx dentex (Bloch & Schneider, 1801) 1 MaC <0.01 2.9 0.63 28.6 1.32 17.1 0.48 15.2 0.15 17.6 0.76 26.5 0.01 11.4Seriola sp 1 MaC <0.01 2.9 <0.01 2.9 0.02 5.7 - - - - <0.01 2.9 <0.01 8.6Thachinotus ovatus (Linnaeus, 1758) 1 MeC <0.01 2.9 0.08 17.1 0.14 14.3 0.39 15.2 - - 0.03 2.9 0.11 17.1
Clupeidae indetermineda 1 MiC - - - - - - - - - - - - - -Dasyatidae Dasyatis pastinaca (Linnaeus, 1758) 3 MeC - - - - - - - - <0.01 2.9 - - - -Gobiesocidae Lepadogaster sp 3 MiC - - - - - - - - - - - - - -Gobiidae Gnatholepis thompsoni Jordan, 1904 3 O 0.02 20 <0.01 2.9 0.03 17.1 0.05 36.4 0.08 35.3 <0.01 8.8 - -
indetermined 3 - - - - - - - <0.01 3 - - <0.01 2.9 - -Haemulidae Pomadasis incisus (Bowdich, 1825) 2 MiC 0.16 45.7 - - - - 0.01 12.1 - - 11.91 88.2 0.23 37.1
Parapristipoma octolineatum (Valenciennes, 1833 2 MiC - - - - - - - - <0.01 2.9 0.67 35.3 <0.01 2.9Kyphosidae Kyphosus sectator (Linnaeus, 1766) 1 O - - - - - - - - - - - - - -Labridae Bodianus scrofa (Valenciennes, 1839) 2 MeC 0.1 40 0.08 34.3 0.12 45.7 0.05 30.3 0.09 32.4 0.09 58.8 - -
Centrolabrus trutta (Lowe, 1834) 2 MiC - - - - <0.01 2.9 - - 0.01 5.9 - - - -Coris julis (Linnaeus, 1758) 2 MiC 0.07 42.9 <0.01 5.7 - - 0.03 15.2 0.25 35.3 0.1 52.9 - -Symphodus mediterraneus (Linnaeus, 1758) 2 MiC - - - - - - - - 0.01 2.9 - - - -Thalassoma pavo Linnaeus, 1758 1 MiC 7.24 100 9.04 100 1.68 100 3.22 100 5,32 100 3.22 100 10.3 100
Labrisomidae Labrisomus nuchipinnis (Quoy & Gaimard, 1824) 3 MiC - - - - - - - - - - - - - -Myliobatidae Myliobatis aquila (Linnaeus, 1758) 3 MiC - - - - - - <0.01 3 <0.01 2.9 <0.01 5.9 - -Mugilidae Indetermined 1 O <0.01 2.9 - - - - - - - - - - 0.05 11.4Mullidae Mullus surmuletus Linnaeus, 1758 1 MeC 0.86 45.7 <0.01 2.9 0.19 31.4 1,00 81.8 0.11 26.5 0.37 64.7 1.63 97.1Muraenidae Enchelycore anatina (Lowe, 1837) 3 MaC <0.01 2.9 - - - - - - - - - - - -
Gymnothorax unicolor (Delaroche, 1809) 3 MaC <0.01 2.9 0.01 5.7 <0.01 8.9 - - <0.01 2.9 - - - -Muraena augusti (Kaup, 1856) 3 MaC <0.01 5.7 0.02 8.6 - - - - - - - - - -Muraena helena Linnaeus, 1758 3 MaC - - - - - - - - - - - - 0.02 11.4
Pomacentridae Abudefduf luridus (Cuvier, 1830) 1 O 12.58 100 19.71 100 8.55 100 8.65 100 10.79 100 10.11 100 7.87 100Chromis limbata (Valenciennes, 1830) 1 MiC 56.39 100 23.04 100 15.98 100 33.5 100 48.15 100 26.77 100 5.01 94.3
Priacanthidae Heteropriacanthus cruentatus (Lacepède, 1801) 3 MeC 0.04 25.7 - - <0.01 2.9 - - - - - - 0.01 11.4Scaridae Sparisoma cretense (Linnaeus, 1758) 1 O 0.72 100 1.46 97.1 0.93 100 0.84 100 0.42 73.5 0.6 97.1 0.32 74.3Scombridae Sarda sarda (Bloch, 1793) 1 MaC 0.02 2.9 <0.01 5.7 <0.01 2.9 0.01 3 - - 0.03 5.9 - -Scorpaenidae Scorpaena maderensis Valenciennes, 1833 3 MeC 0.19 74.3 1.64 100 0.38 94.3 0.19 72.7 0.89 97.1 0.18 82.4 0.08 51.4
Scorpaena scrofa Linnaeus, 1758 3 MeC - - - - - - <0.01 3 - - <0.01 2.9 - -Serranidae Epinephelus marginatus (Lowe, 1834) 2 MaC <0.01 2.9 <0.01 5.7 <0.01 8.6 - - - - - - - -
Mycteroperca fusca (Lowe, 1836) 2 MaC 0.06 31.4 0.56 80 0.72 100 0.16 57.6 0.11 50 0.05 38.2 <0.01 2.9Serranus atricauda Gunther, 1874 3 MeC 0.92 91.4 0.19 54.3 0.07 45.7 0.13 39.4 0.37 82.4 0.15 61.8 0.25 71.4
Sparidae Boops boops (Linnaeus, 1758) 1 O 12.30 37.1 28.48 45.7 53.33 45.7 18.25 78.8 25.51 88.2 17.14 76.5 41.26 88.6Dentex gibbosus (Rafinesque, 1810) 1 MeC 0.14 48.6 <0.01 2.9 0.01 11.4 0.09 30.3 0.34 52.9 0.20 52.9 0.35 62.9Diplodus cervinus (Lowe, 1810) 1 O 0.16 45.7 0.07 34.3 0.19 68.6 0.08 21.1 0.05 5.9 0.16 50 0.01 8.6Diplodus sargus (Linnaeus, 1758) 1 MiC 0.15 40 0.59 57.1 2.36 94.3 0.89 48.5 0.16 2.4 3.65 76.5 0.50 65.7Diplodus vulgaris (E. Geoffroy St.-Hilaire, 1817) 1 MiC 3.31 88.6 - - 0.05 8.6 7.86 100 2.01 88.2 3.10 100 1.73 100Oblada melanura (Linnaeus 1758) 1 O 1.7 37.1 0.48 42.9 2.92 68.6 6.42 54.5 2.37 17.6 17.01 85.3 16.35 88.6Pagellus acarne (Risso, 1827) 1 MiC - - - - - - - - - - - - - -Pagellus erythrinus (Linnaeus, 1758) 1 MiC 0.02 17.1 - - <0.01 2.9 0.03 21.1 0.1 41.2 0.02 14.7 0.03 22.9Pagrus pagrus (Linnaeus, 1758) 1 MiC 0.29 71.4 0.03 2.9 - - 0.02 12.1 0.04 29.4 0.03 23.5 0.02 14.3Spondyliosoma cantharus (Linnaeus, 1758) 1 O 0.19 5.7 <0.01 2.9 - - 0.11 18.2 0.09 23.5 0.48 67.6 0.05 8.6Sarpa salpa (Linaneus, 1758) 1 H 0.13 11.4 0.52 17.1 0.21 17.1 - - - - 0.59 24.1 <0.01 2.9
Synodontidae Synodus sp 3 MeC 0.12 77.1 0.33 88.6 0.28 94.3 0.26 87.9 0.14 55.6 0.14 82.4 0.24 88.6Sphyraenidae Sphyraena viridensis (Cuvier, 1829) 1 MaC 0.05 14.3 0.13 22.9 0.12 28.6 0.01 6.1 <0.01 2.9 <0.01 2.9 0.02 8.6Tetraodontidae Canthigaster capistrata (Lowe, 1839) 2 O 1.63 100 3.85 100 2.28 100 1.63 100 1.47 100 0.99 97.1 0.95 97.1
Sphoeroides marmoratus (Lowe, 1839) 2 O 0.2 74.3 0.39 82.9 0.69 100 0.35 84.8 0.26 85.3 0.11 37.7 1.66 97.1Triglidae Chelidonichthys lastoviza (Bonnaterre, 1788) 3 MiC - - - - - - <0.01 6.1 - - - - - -Trypterygiidae Tripterygion delaisi Cadenat et Blache, 1971 3 MiC 0.17 65.7 0.15 60 0.02 31.4 0.26 87.9 0.29 97.1 0.07 52.9 <0.01 48.6Uranoscopidae Uranoscopus scaber Linnaeus, 1758 3 MeC - - - - - - - - 0.01 2.9 - - - -
FAMILIES SPECIES
DeepGMR UAC ARMA
Rb W Plat Rb W Plat RbET TC

Cláudia Ribeiro
72
Table XII – Ranking of the ten most numerically abundant species at each study site based on pooled data from the 3UVCTs . Rare species, even very abundant, were excluded from this analysis. * - species present but not included in the ten most abundant, - species absent
S D S D S DFAMILIES SPECIES Rb W Plat Rb W Plat Rb W Plat Rb W Plat Rb RbApogonidae Apogon imberbis - * * * * * * * - * 10 * - *Atherinidae Atherina presbyter - * * - * * * * * * - * 1 *Blenniidae Ophioblennius atlanticus 10 10 * * - - * * 9 * * - 6 -Carangidae Pseudocaranx dentex * * * * 8 8 * - * * * * * *Haemulidae Pomadasis incisus * - - * - - - - - * - 4 - *Labridae Thalassoma pavo 3 2 2 4 4 7 4 4 2 6 4 7 2 3Mullidae Mullus surmuletus * * 9 9 * * * * * 8 * * * 8Mugilidae indetermined - * * * - - * - * - - - 7 *Pomacentridae Abudefduf luridus 1 1 1 2 3 3 3 3 1 3 3 5 4 4
Chromis limbata 2 3 6 1 2 2 2 1 4 1 1 1 * 5Scaridae Sparisoma cretense 4 4 4 10 7 9 * 8 6 10 8 10 10 *Scorpaenidae Scorpaena maderensis * 7 * * 6 * * 10 * 7 7 * * *Serranidae Mycteroperca fusca * * * * 10 10 * - - * * * * *
Serranus atricauda 7 * * 8 * * * * * * 9 * * *Sparidae Boops boops * * * 3 1 1 1 2 3 2 2 2 3 1
Diplodus sargus * * 7 9 5 7 9 * 9 * 6 8 10D. vulgaris 5 * 8 5 - * 10 7 * 4 5 8 * 6Oblada melanura 9 5 3 6 * 4 5 5 * 5 * 3 5 2Sarpa salpa * 8 5 * * * - - * - - * * *
Synodontidae Synodus sp. * * * * * * * * * * 8 * * *Tetraodontidae Canthigaster capistrata 6 6 * 7 5 6 6 6 5 7 6 9 * 9
Sphoeroides marmoratus 8 * 10 * * * 8 * * * * - 9 7Trypterigiidae Tripterygion delaisi * 9 * * * * 9 * 10 * * * * *
GMR UAC ARMA
6.3 - Abundance
The overall number of individuals recorded by census pooling the three types of
bottoms was significantly higher inside the unprotected natural location (137 967
individuals) than in reserve (116 215 individuals). Comparing the three locations, i.e.
the rocky boulders reefs, the number of fish individuals censused in the artificial
unprotected location (ARMA) was higher than the number of fishes observed in the
other two locations (UAC and GMR) on this type of bottom. That was manly due the
presence of big shoals of the small pelagic and gregarious specie Atherina presbyter
coupled with the presence of the pelagic sparids Boops boops and O. melanura. Indeed,
when considering just nectobenthic fish abundance, the abundance was greater over the
natural locations, namely greater inside GMR (mean abundance in transect surveys
179.9 + 75.7 individuals 150 m-2 and 143.1 + 88.1 individuals 200m-2 in PC surveys)
than in UAC (132 + 60.2 individuals 150 m-2 and 106 + 60.5 individuals 200m-2 in
transect and point count surveys respectively) and than artificial unprotected location,
ARMA (90 + 35.7 individuals 150 m-2 for transect estimates and 75.81 + 33.36
individuals 200m-2 for PC estimates). However, these pelagic species were frequent in

Comparison of Rocky Reef Fish Communities Using Underwater Visual Techniques
73
the artificial riprap of Madeira airport and thereby residents fishes (see Table XI) and thus
should be considered in the analysis of the fish assemblage. This case, contrasts with
those situations where pelagic fishes occurring in huge schools were sighted
sporadically and consequently distort the final statistical analysis. In fact, that was what
happened in natural locations (protected and unprotected) where A. presbyter occurred,
but with very low sighting frequency - rare specie, and although presenting a
considerable relative abundance it can be excluded from the analysis in order to not
distort interpretation of results.
Fish abundance by species in the different types of rocky bottoms did not
showed great differences. The ten numerically most abundant species in the three
locations, basing on the pooled UVCTs data (see Table XII), showed that the group of
the ten most abundant fishes among locations, types of bottoms and depth were
basically the same. Furthermore, at each place the first five ranked species corresponded
to more than 80% of all fishes censused during this study in the site.
Generated from estimates of mean abundance per season for each UVCTs, the
multivariate approach indicated a clear separation of the fish assemblages among
locations (natural protected, natural unprotected and artificial unprotected) when the
same type of bottom (rocky boulders) was under comparison (Figure 15). An evident
separation was seen between artificial and natural locations (protected and unprotected),
highest abundance of fish over the artificial unprotected riprap of Madeira airport,
followed by the natural unprotected location and fewer fishes recorded in the rocky
boulders bottoms inside GMR. Besides factor “location”, abundance of fishes was also
influenced by factor “depth”. The number of fishes censused by each method increased
from shallow to deep depth strata in all locations and bottoms types sampled (also walls
and platforms see Figure 16 and 17). A two-way crossed ANOSIM (Table XIII)
generated from the data gathered by the 3 UVCs methods sustain the graphical
separation presented in the nMDS plots, thereby indicating overall differences in mean
abundances of the fish assemblages among locations and between shallow and deep
strata.
Seasonal changes in species composition did not present a clear pattern in what
concerns total mean abundance in the different types of rocky reefs in the locations
studied. In some reefs, fish abundance tends to be higher in summer and autumn
seasons, however apparently those fluctuations were not rhythmic and were confined.
The greatest variations in mean abundance occurred mostly in platform bottoms and in
the artificial rubble mound of Madeira airport (see Figure 19). In those cases, the

Cláudia Ribeiro
74
standard deviation associated to the mean was high and that happened most likely due
the presence of shoals of pelagic species as B. boops or O. melanura. Figure 20 show
mean abundance estimates obtained from the pooled UVCTs for the most frequent and
abundant species in the rocky reefs. The seasonal variation of those species did not
show similar pattern in the reefs. For example, the most common species censused in
this study, the blue damselfish A. luridus tend to be recorded more numerously in spring
and summer seasons in the two years of surveys, nevertheless that was not clearly
observed in all rocky reefs sampled. The other species belonging to the same family, C.
limbata, tend to had higher mean abundance in the autumn in the deep strata for most of
the reefs and the labrid T. pavo a very common species in all reefs studied did not
exibited great changes in mean abundance per season.
Table XIII – Results of a two- way crossed ANOSIM testing for differences in fish assemblages among Rocky boulders (Rb) bottoms in the three locations studied (P- natural protected; NP – natural not-protected and Art- artificial not-protected) over the intervals of depth considered (S = shallow and D= deep) for each UVCTs used (PC – point count, T – transect; VFC – visual fast count).
Concerning individual species abundance, the damselfish C. limbata, a fishery
targeted in Madeira Island, differ from the other damselfish observed, A. luridus that
has no commercial value in the Island, was generally very abundant in all areas studied
(maximum relative abundance 56% - see Table XI). Exception was made for the
artificial riprap of Madeira airport (ARMA) where it was present, but in much inferior
numbers (0.5 to 5% of relative abundance Table XI) and also for the shallow wall and
platform bottoms inside the reserve. This species was in general the most abundant
(rank 1 – Table XII) in all bottoms sampled in the unprotected area of Caniçal (UAC),
where it is a frequently consumed fish. The results of multifactor ANOVA testing for
effects of the several factors concerned on the fish species abundance were summarized
in Table XIV. The species abundance in the rocky boulders bottoms studied differed
significantly among locations, depth and methods. Post-hoc Tukey multicomparisons
indicated significantly higher abundance in the natural locations (unprotected and
PC
Between depth 0.528 ** 0.605 **
T VFCR value P R value P R value P
0.576 ** Among locations 0.636 ** 0.654 ** 0.742 ** Pairwise tests NP-P 0.374 ** 0.404 ** 0.587 ** P-Art 0.886 ** 0.836 ** 0.901 ** NP-Art 0.662 ** 0.779 ** 0.786 **

Comparison of Rocky Reef Fish Communities Using Underwater Visual Techniques
75
protected) than in the artificial location (ARMA) and in the deeper interval of depth.
The three methods gave the same pattern of abundance, though some differences
between VFC and the other two visual techniques (Table XIV). In wall and platform
bottoms, significantly higher abundance was registered in the natural unprotected
location and in deep than shallow strata (Figure 20a).
Figure 15 – Plots of the non-metric multidimensional scaling ordinations (nMDS) basing on Bray-Curtis similarity measure using the estimates of fish mean abundances per season in rocky boulders bottoms in the three locations studied: PC (a), T (b) and VFC (c); S - shallow, D – deep. P- protected natural location (GMR), NP - Nonprotected natural location (UAC) and Art- artificial riprap of Madeira Airport (ARMA)
The other “member” belonging to the Pomacentridae family, A. luridus was the
most abundant species in the shallow waters of the reserve, registering high abundance
in this location. This species was significantly abundant in all locations, bottom types
and depth strata (range 7.9 to 36.6% of the fish abundance), though it differed
significantly among locations in the rocky boulders bottoms and depth strata (Table
XIV). Statistical differences were registered in the abundance values between methods
used (F= 73.875; p<0.001), but generally the same pattern was observed: higher
abundances in rocky boulders bottoms inside the reserve followed by the natural
unprotected location. In the remaining two types of bottoms a significant difference
occurred among platform bottoms, especially in the shallow strata, with greatest
S
DP
P
PP
PPP P
P
P
PP
P
P
P
P
NP
NP
NPNP
NPNP
NPNP
NP
NP
NPNP
NPNPNP
NP
ArtArt
Art
Art
Art
Art
Art
ArtArt
Art
ArtArtArt
ArtArt
ArtStress: 0,15a)
S
DPPP
P
P
PP P
P
P
P
P
P
P
P
P
NP
NPNP
NP
NP
NP
NP
NPNP
NP
NPNPNPNP
NP
NP
Art
Art
ArtArtArt
Art ArtArt
Art
ArtArt
Art
ArtArt
ArtArt
Stress: 0,18b)
S
D
P
P
PP
PP
P P
PP
PP
PP
P
P
NP
NP
NP
NPNP
NP
NP
NP
NP
NP
NPNP
NPNP
NP
NPArt
Art
Art ArtArt
ArtArt
Art
Art
ArtArt
ArtArt
ArtArt
Art
Stress: 0,17c)

Cláudia Ribeiro
76
abundances at the unprotected location and conversely for wall substratum inside the
reserve (Figure 20b)
S
D
P
P
P
P
PP
P
P
P
P P
PP
P
PP
NP
NPNP
NP
NP
NPNP
NP
NP NPNP
NP
NPNP
NP
NP
Stress: 0,17a)
PP
P
P
P
P P
P
P P
P
P
P
P
P
P
NP
NPNP NP
NP
NP
NPNPNP
NPNPNP
NPNPNP
NP Stress: 0,18b)
S
D
P
P
P
P
P
P
P
P
P
P
P
PPP
PP
NPNPNP
NP
NP
NP
NP
NP
NP
NP
NP
NP
NP
NP NP
NP
Stress: 0,15c)
Figure 16 - Plots of non-metric multidimensional scaling ordinations (nMDS) basing on Bray-Curtis similarity measure using the estimates of fish mean abundances per season in the platform bottoms studied: PC (a), T (b) and VFC (c); S - shallow, D – deep. P - protected natural location (GMR), NP - Notprotected natural location (UAC)

Comparison of Rocky Reef Fish Communities Using Underwater Visual Techniques
77
S
D
P
P
P
PP
P
P
P
PP
PP
P P
PP NP
NP
NP
NP
NP
NP
NP
NP
NPNPNP
NP
NP
NP
NP
NP
Stress: 0,19a)
S
D
P
P
P
PP
PP
P
PP
PP
P
P
P
P
NP
NP
NPNPNP
NP
NP
NP
NP
NPNPNP
NP
NP
NP
NP
Stress: 0,18b)
S
D
PP
P
PP
P
P
P
PP PP
P
P
P
P
NP
NP
NPNP
NPNP
NP
NP
NPNP
NP
NPNP
NP
NPNP
Stress: 0,17c)
Figure 17 - Plots of non-metric multidimensional scaling ordinations (nMDS) basing on Bray-Curtis similarity measure using the estimates of fish mean abundances per season in wall bottoms in the locations studied: PC (a), T (b) and VFC (c); S - shallow, D - deep P- protected natural location (GMR) NP . Nonprotected natural location (UAC)
Included in the list of the ten more abundant species was the small labrid T.
pavo, which was always sighted in all places (100% sighting frequency). It ranged from
a minimal of 1.7 to 23.8% of the total fish community abundance in the studied sites.
Although, considerably abundant in all sites, it differed significantly among locations in
the rocky boulders and platforms bottoms and differed between depth and methods
(Table XIV). In effect, on rocky boulders reefs, this colourful fish was more abundant in
the artificial fished location, whilst in walls bottoms had higher abundance inside
reserve. Conversely higher number of individuals was observed in the platform bottoms
of the natural fished location (Figure 20c).

Cláudia Ribeiro
78
0
50
100
150
200
250
300
350
400
450
500
550
600
650
700
750
800
850
900
950
1000
1050
1100
1150
1200
1250
1300
1350
1400
1450
1500
Sp02
Sm02
Au0
2W
02Sp
03Sm
03A
u03
W03
Sp02
Sm02
Au0
2W
02Sp
03Sm
03A
u03
W03
Sp02
Sm02
Au0
2W
02Sp
03Sm
03A
u03
W03
Sp02
Sm02
Au0
2W
02Sp
03Sm
03A
u03
W03
Sp02
Sm02
Au0
2W
02Sp
03Sm
03A
u03
W03
Sp02
Sm02
Au0
2W
02Sp
03Sm
03A
u03
W03
Sp02
Sm02
Au0
2W
02Sp
03Sm
03A
u03
W03
Rb Wall Plat RB Wall Plat Rb
GMR UAC ARMA
Mea
n nu
mbe
r of i
ndiv
idua
ls re
cord
ed b
y th
e 3
UV
CTShallow
Deep
Figure 18 - mean total abundances for seasonal cycling (Sp – spring, Sm – summer, Au – autumn, W – winter) over the 2-year census series in the three locations: GMR – garajau marine reserve, UAC – unprotected area of Caniçal and ARMA – artificial riprap of Madeira airport
The only species belonging to Scaridae family that is referred to Madeira shore
is S. cretense, a very appreciated fish in local cuisine as also in other Macaronesian
Islands as the Azores and Canaries where is commonly known as ‘veja’ and ‘vieja’
whilst in Madeira is called ‘bodião’. This species had a much smaller contribute in total
fish abundance (0.3 to 7% out of total fish assemblages abundance), than the previously
mentioned species, but was also included in the rank of the ten most abundant species. It
is a frequent (“resident fish”) and valuable fishery targeted species and the highest
abundance levels occurred inside the reserve in the three types of bottoms surveyed.
Contrasting with mostly of the species recorded in this study, the significantly higher
numbers of individuals of this species occurred in the shallow depth range as can been
seen in Figure 20d and table XIV.
The abundance of the three species of genus Diplodus was added up and plotted
in Figure 20e. The mean number of breams was statisticaly different among locations,
though some interactions occurred between factors. The trend was that significantly
higher number of individuals was observed in the deep interval of the three locations

Comparison of Rocky Reef Fish Communities Using Underwater Visual Techniques
79
and bottoms types. Significantly higher abundance was verified over the natural fished
location of Caniçal (see Table XIV).
The only two litoral species of the family Tetraodontidae (pufferfishes) known
to Madeira waters were included in the rank of the ten most abundant species of the fish
communities studied. Besides being considered reef permanent species in the sites
studied, C. capistrata presented higher abundance than S. marmoratus and showed a
different variation among the factors considered (see Table XIV). The first species was
significantly more abundant inside the reserve in all bottoms and as many other species
recorded in this study was recorded with higher numbers at the deep depth strata than
shallow (Figure 20f and 20g).
The presence of the large grouper M. fusca, in the rank ten of abundance (see
Table XII), though representing less than 1% of the fish total abundance in wall and
platform bottoms inside reserve is noteworthy. This is a very high priced species in the
fisheries markets coupled with excellent eating qualities as many others species
belonging to the Serranidae family. The mean number of individuals and occurrence
recorded by the three UVCTs were clearly influenced by factor “protection” and
“depth”, being almost absent in the unprotected locations and in the shallow interval of
depth on the sites surveyed (Figure 20).
The abundance values of the grunt P. incisus were very irregular among the
locations studied as relating to the remaining factors considered in the sampling design.
Indeed, the abundance of this species comprised up to 12% of the fish abundance in the
deep platform bottoms of Caniçal (see Table XII), whilst in the remaining places was
almost absent (Figure 21).
The abundance of pelagic species relating the total abundance of the fish
communities in the study sites was significant. The water column living species such as
B. boops and O. melanura contributed significantly for total fish abundance namely
with 15 to 49% and 0.9 to 17% of the total fish abundance. They were especially, more
abundant and frequent in the fished locations (UAC and ARMA - see Figure 22 and
ANOVA results in Table XV). Globally, the trend was that both species were abundant
in the three bottoms types. Differences between ‘methods’were observed, PC and T
values significantly different from VFC values. Differences in abundance also occurred
within levels of the factor depth, particularly higher abundance at the deep strata and in
the fished locations (see exception in Table XV). Some interactions between factors
occurred which usually added problem in the interpretation process.

Cláudia Ribeiro
80
Figure 19 – Mean abundance (+SD) per season (Sp – spring, Sm – summer, Au – autumn, W - winter for the most “relevant” necto-benthic fish taxa recorded from pooled UVCTs in the locations (GMR – Garajau marine reserve, UAC – unprotected area of Caniçal and ARMA – artificial riprap of Madeira airport), depth strata and types of bottoms surveyed (Rb – rocky boulders, Wall and Plat – platform)
a) Chromis limbata
0255075
100125150175200225250275300325350375
Sp02
Sm02
Au0
2W
02Sp
03Sm
03A
u03
W03
Sp02
Sm02
Au0
2W
02Sp
03Sm
03A
u03
W03
Sp02
Sm02
Au0
2W
02Sp
03Sm
03A
u03
W03
Sp02
Sm02
Au0
2W
02Sp
03Sm
03A
u03
W03
Sp02
Sm02
Au0
2W
02Sp
03Sm
03A
u03
W03
Sp02
Sm02
Au0
2W
02Sp
03Sm
03A
u03
W03
Sp02
Sm02
Au0
2W
02Sp
03Sm
03A
u03
W03
Rb Wall Plat Rb Wall Plat Rb
GMR UAC ARMA
Mea
n n~
of in
divi
dual
s rec
orde
d by
the
3 U
VCT
s Shallow
Deepb) Abudefduf luridus
05
101520253035404550556065707580859095
100
Sp02
Sm02
Au0
2W
02Sp
03Sm
03A
u03
W03
Sp02
Sm02
Au0
2W
02Sp
03Sm
03A
u03
W03
Sp02
Sm02
Au0
2W
02Sp
03Sm
03A
u03
W03
Sp02
Sm02
Au0
2W
02Sp
03Sm
03A
u03
W03
Sp02
Sm02
Au0
2W
02Sp
03Sm
03A
u03
W03
Sp02
Sm02
Au0
2W
02Sp
03Sm
03A
u03
W03
Sp02
Sm02
Au0
2W
02Sp
03Sm
03A
u03
W03
Rb Wall Plat Rb Wall Plat Rb
GMR UAC ARMA
c) Mycteroperca fusca
0
1
2
3
4
5
6
7
8
Sp02
Sm02
Au0
2W
02Sp
03Sm
03A
u03
W03
Sp02
Sm02
Au0
2W
02Sp
03Sm
03A
u03
W03
Sp02
Sm02
Au0
2W
02Sp
03Sm
03A
u03
W03
Sp02
Sm02
Au0
2W
02Sp
03Sm
03A
u03
W03
Sp02
Sm02
Au0
2W
02Sp
03Sm
03A
u03
W03
Sp02
Sm02
Au0
2W
02Sp
03Sm
03A
u03
W03
Sp02
Sm02
Au0
2W
02Sp
03Sm
03A
u03
W03
Rb Wall Plat Rb Wall Plat Rb
GMR UAC ARMA
Mea
n nº
of i
ndiv
idua
ls re
cord
ed b
y th
e 3
UV
CTs d) Canthigaster capistrata
0
2
4
6
8
10
12
14
16
18
20
22
Sp02
Sm02
Au0
2W
02Sp
03Sm
03A
u03
W03
Sp02
Sm02
Au0
2W
02Sp
03Sm
03A
u03
W03
Sp02
Sm02
Au0
2W
02Sp
03Sm
03A
u03
W03
Sp02
Sm02
Au0
2W
02Sp
03Sm
03A
u03
W03
Sp02
Sm02
Au0
2W
02Sp
03Sm
03A
u03
W03
Sp02
Sm02
Au0
2W
02Sp
03Sm
03A
u03
W03
Sp02
Sm02
Au0
2W
02Sp
03Sm
03A
u03
W03
Rb Wall Plat Rb Wall Plat Rb
GMR UAC ARMA
t

Comparison of Rocky Reef Fish Communities Using Underwater Visual Techniques
81
Fig 19 (cont.) – Mean abundance (+SD) per season (Sp – spring, Sm – summer, Au – autumn, W - winter for the most “relevant” necto-benthic fish taxa recorded from pooled UVCTs in the locations (GMR – Garajau marine reserve, UAC – unprotected area of Caniçal and ARMA – artificial riprap of Madeira airport), depth strata and types of bottoms surveyed (Rb – rocky boulders, Wall and Plat – platform)
e) Thalassoma pavo
0
2 5
50
75
10 0
12 5
150
175
20 0
22 5
250
Sp02
Sm02
Au0
2W
02Sp
03Sm
03A
u03
W03
Sp02
Sm02
Au0
2W
02Sp
03Sm
03A
u03
W03
Sp02
Sm02
Au0
2W
02Sp
03Sm
03A
u03
W03
Sp02
Sm02
Au0
2W
02Sp
03Sm
03A
u03
W03
Sp02
Sm02
Au0
2W
02Sp
03Sm
03A
u03
W03
Sp02
Sm02
Au0
2W
02Sp
03Sm
03A
u03
W03
Sp02
Sm02
Au0
2W
02Sp
03Sm
03A
u03
W03
Rb Wall Plat Rb Wall Plat Rb
GMR UAC ARMA
Mea
n nº
of i
ndiv
idua
ls re
cord
ed b
y th
e 3
UV
CTs f) Sparisoma cretense
0
2
4
6
8
10
12
14
16
18
20
Sp02
Sm02
Au0
2W
02Sp
03Sm
03A
u03
W03
Sp02
Sm02
Au0
2W
02Sp
03Sm
03A
u03
W03
Sp02
Sm02
Au0
2W
02Sp
03Sm
03A
u03
W03
Sp02
Sm02
Au0
2W
02Sp
03Sm
03A
u03
W03
Sp02
Sm02
Au0
2W
02Sp
03Sm
03A
u03
W03
Sp02
Sm02
Au0
2W
02Sp
03Sm
03A
u03
W03
Sp02
Sm02
Au0
2W
02Sp
03Sm
03A
u03
W03
Rb Wall Plat Rb Wall Plat Rb
GMR UAC ARMA
g) Diplodus sp
0
10
20
30
40
50
60
70
80
90
100
110
120
Sp02
Sm02
Au0
2W
02Sp
03Sm
03A
u03
W03
Sp02
Sm02
Au0
2W
02Sp
03Sm
03A
u03
W03
Sp02
Sm02
Au0
2W
02Sp
03Sm
03A
u03
W03
Sp02
Sm02
Au0
2W
02Sp
03Sm
03A
u03
W03
Sp02
Sm02
Au0
2W
02Sp
03Sm
03A
u03
W03
Sp02
Sm02
Au0
2W
02Sp
03Sm
03A
u03
W03
Sp02
Sm02
Au0
2W
02Sp
03Sm
03A
u03
W03
Rb Wall Plat Rb Wall Plat Rb
GMR UAC ARMA
Mea
n nº
of i
ndiv
idua
ls re
cord
ed b
y th
e 3
UV
CTs
h) Sphoeroides marmoratus
02468
1012141618202224262830323436
Sp02
Sm02
Au0
2W
02Sp
03Sm
03A
u03
W03
Sp02
Sm02
Au0
2W
02Sp
03Sm
03A
u03
W03
Sp02
Sm02
Au0
2W
02Sp
03Sm
03A
u03
W03
Sp02
Sm02
Au0
2W
02Sp
03Sm
03A
u03
W03
Sp02
Sm02
Au0
2W
02Sp
03Sm
03A
u03
W03
Sp02
Sm02
Au0
2W
02Sp
03Sm
03A
u03
W03
Sp02
Sm02
Au0
2W
02Sp
03Sm
03A
u03
W03
Rb Wall Plat Rb Wall Plat Rb
GMR UAC ARMA

Cláudia Ribeiro
82
Mea
n nº
of i
ndiv
idua
ls re
cord
ed p
er c
ensu
s
a) Chromis limbata
0102030405060708090
100110120130140150160170180190200210220230240250260270
PC
T
VFC
b)Abudefduf luridus
05
101520253035404550556065707580859095
100105110 c)Thalassoma pavo
05
101520253035404550556065707580859095
100105110115
h) Mycteroperca fusca
00,40,81,21,6
22,42,83,23,6
44,44,85,25,6
66,4
GM
R
UA
C
ARM
A
GM
R
UA
C
GM
R
UA
C
GM
R
UA
C
ARM
A
GM
R
UA
C
GM
R
UA
C
Rb W Plat Rb W Plat
Shallow Deep
d)Sparisoma cretense
0123456789
1011121314151617181920
e)Diplodus sp
05
10152025303540455055606570758085
GM
R
UA
C
ARM
A
GM
R
UA
C
GM
R
UA
C
GM
R
UA
C
ARM
A
GM
R
UA
C
GM
R
UA
C
Rb W Plat Rb W Plat
Shallow Deep
f) Canthigaster capistrata
0123456789
1011121314
GM
R
UA
C
ARM
A
GM
R
UA
C
GM
R
UA
C
GM
R
UA
C
ARM
A
GM
R
UA
C
GM
R
UA
C
Rb W Plat Rb W Plat
Shallow Deep
g) Sphoeroides marmoratus
0
12
3
4
56
7
8
910
11
12
GM
R
UA
C
ARM
A
GM
R
UA
C
GM
R
UA
C
GM
R
UA
C
ARM
A
GM
R
UA
C
GM
R
UA
C
Rb W Plat Rb W Plat
Shallow Deep
Figure 20 - Mean total abundance (+SD) for the most common species surveyed in the different locations (GMR – Garajau marine reserve, UAC – unprotected area of Caniçal and ARMA – artificial riprap of Madeira airport) , depth strata and bottom types (Rb – rocky boulders, Wall and Plat – Platform) by each visual method PC- point count; T – transect, VFC- visual fast count

Comparison of Rocky Reef Fish Communities Using Underwater Visual Techniques
83
The small pelagic species A. presbyter was particularly frequent and abundant in
the artificial rubble mound, mainly over the shallow depth interval, whilst was sighted less
times and with smaller numbers or even absent in the remaining locations (see Table XI).
The opposite situation occurred with the damselfish C. limbata, a species that was
abundant in almost all locations, but much less abundant in ARMA, where it contributed
only to 0.5 to 5% of the total fish abundance in shallow and deep strata
Pomadasis incisus mean abundance
05
101520253035404550556065707580859095
100105110115120125130135
GM
R
UA
C
ARM
A
GM
R
UA
C
GM
R
UA
C
GM
R
UA
C
ARM
A
GM
R
UA
C
GM
R
UA
C
Rb W Plat Rb W Plat
Shallow Deep
Mea
n nu
mbe
r of i
ndiv
idua
ls re
cord
ed p
er c
ensu
PC
T
VFC
Figure 21 - Average number of Pomadasis incisus individuals (+SD) recorded per each of the three UVCTs used in the study in the three locations (GMR – Garajau marine reserve, UAC – unprotected area of Caniçal and ARMA – artificial riprap of Madeira airport) over the rocky bottoms sampled (Rb- rocky boulder, wall, Plat – platform)
Boops boops mean abundance
0255075
100125150175200225250275300325350375400425450475500525550575600625650675
GM
R
UA
C
ARM
A
GM
R
UA
C
GM
R
UA
C
GM
R
UA
C
ARM
A
GM
R
UA
C
GM
R
UA
C
Rb W Plat Rb W Plat
Shallow Deep
Mea
n nº
of i
ndiv
idua
ls re
cord
ed p
er c
ensu
PC
T
VFC
Oblada melanura mean abundance
0102030405060708090
100110120130140150160170180190200210
GM
R
UA
C
ARM
A
GM
R
UA
C
GM
R
UA
C
GM
R
UA
C
ARM
A
GM
R
UA
C
GM
R
UA
C
Rb W Plat Rb W Plat
Shallow Deep
Figure 22 - Average number of Boops boops and Oblada melanura individuals (+ SD) recorded per each of the three UVCTs used in the study in the three locations (GMR – Garajau marine reserve, UAC – unprotected area of Caniçal and ARMA – artificial riprap of Madeira airport) over the rocky bottoms sampled (Rb- rocky boulder, wall, Plat – platform)

Cláudia Ribeiro
84
6.4 – Assemblages structure
FISH GUILDS
a) Trophic structure
The qualitative trophic structure of the whole assemblage was dominated by
carnivores, which comprised up to 75% of the overall species list. The present results
showed equal percentages attributed to micro and mesocarnivores (28%), whilst
macrocarnivores were considerable less represented in terms of number of species (19%).
The omnivores category had a significant contribution, reaching up to 21% of the species
censused. Contrarily, the herbivores were misrepresented in the whole fish communities
with just 4% of the species.
The qualitative pattern of trophic structure among locations was similar, the
majority of species belonged to the carnivore’s category. Slightly differences occurred
between locations in terms of the percentage of microcarnivores species, which was a little
bit superior in all types of bottoms of the natural unprotected location (UAC). Conversely
macrocarnivores had considerable higher number of species in all types of bottoms inside
reserve (Figure 23), whilst omnivores were equally represented in all bottoms in the three
locations.
Factor depth did not revealed significant influence in the qualitative trophic
structure of the fish assemblages. The percentages of each trophic category were very
similar in shallow and deep depth intervals. Therefore, the results were presented in terms
of the entire depth interval considered in the study (0-20 meters depth, Figure 23).
0
5
10
15
20
25
30
35
40
GMR UAC ARMA GMR UAC GMR UAC
Rb W Plat
% o
f nº o
f spe
cies
herbivoresomnivoresmicrocarnivoresmesocarnivoresmacrocarnivores
Figure 23– Distribution pattern of species in the trophic categories within locations (UAC – unprotected area of Caniçal, GMR – Garajau Marine reserve: ARMA – artificial riprap of Madeira airport) according to the different types of bottoms (RB - rocky boulders; W – wall; Plat – platform)

Comparison of Rocky Reef Fish Communities Using Underwater Visual Techniques
85
Table XIV – Multifactor ANOVA comparing abundances of most important necto-benthic fish taxa in the different bottom types for the several factors included in the sampling design (Method: PC – point count, T- transect, VFC- visual fast count; Depth: S – shallow, D- deep; Location: GMR- Garajau marine reserve, UAC – unprotected area of Caniçal, ARMA – artificial riprap of Madeira airport)
Bottom types fish taxa Abudefduf luridus Chromis limbata Sparisoma cretense Thalassoma pavo Diplodus sp Canthigaster capistrata Sphoeroides marmoratus Mycteroperca fusca
Rocky boulders bottomMethod 73.88*** (pc<t<vfc) 35.44***(pc=t≠vfc) 52.52***(pc=t≠vfc) 28.05***(pc<t<vfc) 30.94***(pc=t≠vfc) 60.86***(pc=t≠vfc) 58.89***(pc=t≠vfc) n.sDepth 149.49***(S>D) 290.72***(S<D) 9.57*** (S>D) 71.12***(S<D) 110.53***(S<D) 79.97***(S<D) n.s 46.69*** (S<D)Location 88.01***(gmr>uac>arma) 431.94***(arma<gmr,uac) 38.38*** (gmr>uac>arma) 122.58***(arma>gmr>uac) 10.11***(gmr,arma<uac) 123.33***(gmr,uac>arma) 72.34*** (arma>gmr,uac) 17.81***(arma<gmr>uac)Location X Depth 11.03*** 10.66*** 31.29*** 10.15*** 8.93*** 18.33*** 56.64 17.69***Method X Location 2.68* n.s n.s 8.55*** n.s n.s n.s n.sMethod X Depth n.s 4.96*** n.s 27.32*** n.s n.s n.s n.sMethod X Depth X Location n.s n.s n.s 10.31*** n.s n.s n.s n.sWallMethod 138.92***(pc<t,vfc) 28.66***(pc<t<vfc) 44.39***(pc=t<vfc) 17.64*** 13.61***(pc=t<vfc) 31.89***(pc<t<vfc) 98.69***(pc=t<vfc) 10.08***(t<pc<vfc)Depth 30.51***(S<D) 194.67***(S<D) 60.44***(S>D) n.s 12.12***(S<D) 31.71***(S<D) 55.34***(S<D) 87.13***(S<D)Location 197.33***(gmr>uac) 286.2***(gmr<uac) 77.46***(gmr>uac) n.s 23.55***(gmr<uac) 57.41***(gmr>uac) 114.85*** 20.75***(gmr>uac)Location X Depth n.s 43.06*** n.s 5.5* n.s 21.82*** 56.56*** 18.01***Method X Location n.s 10.21*** n.s 3.42* n.s n.s n.s 3.42*Method X Depth n.s n.s n.s 7.06*** n.s 3.52* 3.2* 16.52***Method X Depth X Location n.s n.s n.s 11.63*** n.s n.s n.s n.sPlatformMethod 112.96***(pc<t,vfc) 13.41***(pc,t<vfc) 43.57***(pc,t<vfc) 40.4***(pc,t<vfc) 16.06***(pc,t<vfc) 33.91***(pc,t<vfc) 23.45***(pc,t<vfc) 8.35***(t<pc,vfc)Depth 160.18***(S>D) 337.68***(S<D) 23.90***(S>D) 302.89***(S>D) 134.28***(S<D) 7.28**(S<D) 24.85***(S>D) 277.64***(S<D)Location 121.36***(gmr<uac) 67.14***(gmr<uac) 81.04***(gmr>uac) 209.76***(gmr<uac) n.s 232.85***(gmr>uac) 129.65(gmr>uac) 90.44***(gmr>uac)Location X Depth 23.64 11.17*** 27.43*** ns 56.61*** 9.43*** 21.41*** 173.52***Method X Location n.s n.s 4.21* n.s n.s 8.87*** n.s n.sMethod X Depth 5.76** n.s 3.19* 7.87*** n.s n.s 7.1 7.86***Method X Depth X Location n.s n.s n.s 8.19*** n.s n.s n.s n.s

Cláudia Ribeiro
86
Table XV – Multifactor ANOVA comparing abundances of the pelagic species Boops boops and Oblada melanura in the different bottom types for the several factors included in the sampling design (Method: PC – point count, T- transect, VFC- visual fast count; Depth: S – shallow, D- deep; Location: GMR- Garajau marine reserve, UAC – unprotected area of Caniçal, ARMA – artificial riprap of Madeira airport)
Bottom types fish taxa Boops boops Oblada melanura
Rocky boulders bottomMethod 10.74***(pc,t<vfc) 9.17***(pc,t<vfc)Depth 45.91***(S<D) 9.98**(S<D)Location 32.99***(gmr<uac,arma) 75.41***(gmr<uac<arma)Location X Depth 6.87** n.sMethod X Location n.s n.sMethod X Depth 2.68* n.sMethod X Depth X Location n.s n.sWallMethod 25.21***pc,t<vfc) 17.53***(pc,t<vfc)Depth 41.15***(S<D) 22.31***(S>D)Location 31.33 n.sLocation X Depth n.s n.sMethod X Location 4.62* n.sMethod X Depth 8.52** 3.53*Method X Depth X Location n.s n.sPlatformMethod 143.85***pc,t<vfc) 18.07***(pc,t<vfc)Depth 4.41*(S<D) 69.53***(S<D)Location 38.35***(gmr>uac) n.sLocation X Depth n.s 59.18***Method X Location n.s n.sMethod X Depth 5.02* n.sMethod X Depth X Location n.s n.s
Proportional abundances of the five trophic categories were listed in Table XVI
according to each location, type of bottom and depth interval. In all locations, omnivores
and microcarnivores categories accounted almost the totality of the fish individuals
recorded during surveys (always more than 80%). Herbivores were present, but in very low
numbers in all sites and almost absent in the deep interval. Meso and macrocarnivores
were scarce in terms of number of individuals recorded by any of the three methods used.
In terms of the quantitative trophic structure of the fish assemblages, the percentage
of omnivores tend to decrease from shallow to deep strata in all types of bottoms in the
three locations as happened with herbivores. Conversely, the microcarnivores registered an
increase in number of individuals from shallow to deep depth interval. Considerable
differences occurred within locations between types of bottoms when considering
herbivores and omnivores categories. They tend to have higher abundance both in wall and
platform bottoms than in rocky boulders, exception made in UAC where omnivores were
even greater at rocky boulders bottom. Comparison between locations, considering the
rocky boulders bottoms did not revelead great differences in terms of percentages of each

Comparison of Rocky Reef Fish Communities Using Underwater Visual Techniques
87
trophic category, but comparison between the two natural locations for wall and platform
bottoms showed that the omnivores tend to be more abundant in GMR than in UAC, whilst
the microcarnivores had higher proportional abundance over wall and platform bottoms in
UAC than in GMR.
Table XVI – Trophic structure of GMR, UAC and ARMA based on the proportional abundances (%) from point count and transect data expressed per m2 ;Types of bottoms: Rb – rocky boulders, W – wall: Plat - platform
ARMATrophic category Rb W Plat Rb W Plat RbHerbivores 0.5 4.2 2.4 0 0.7 0.3 2.7Omnivores 46.6 76.4 84.6 71 40.5 61.8 30.9Microcarnivores 51.6 12.8 9.8 28.6 56.4 37.3 65.9Mesocarnivores 0.9 6.3 2.9 0.4 1.8 0.6 0.4Macrocarnivores 0.4 0.4 0.3 0 0.6 0 0.1Herbivores 0 0.7 0.2 0 0 0 0.1Omnivores 29 62.4 70.3 32.4 31.2 51.6 65.2Microcarnivores 68.5 32 25.4 65.4 66.5 46.2 31.2Mesocarnivores 2.4 3.4 1.3 1.5 2.2 1.1 3.4Macrocarnivores 0.1 1.5 2.8 0.7 0.1 1.1 0.1
UAC
SHA
LLO
WD
EEP
GMR
b) Mobility and spatial organization
Fish species were grouped into guilds based on the amplitude of fish spatial use and
their mobility (see data analysis fish guilds). The majority of species recorded during this
study belonged to category 1 (45.9%) and category 3 (36.1%), whilst category 2 was much
less represented (18%). In terms of abundance, species included in category 1 achieved
significantly highest relative abundance in all sampled sites.
c) Demographic structure
The frequency distribution of the four size classes relating to the factors concerned
in the sampling design are presented in Figure 24. Data gathered with the three visual
methods were pooled since they gave similar pattern of fish sizes distribution among the
sites surveyed.
Differences in frequency distribution of juveniles and small fishes occurred in
rocky boulders bottoms. The artificial unprotected location had higher abundance of fishes
in these two categories than the natural locations (protected and unprotected), whilst the
natural locations had greatest abundance of medium and large fishes, especially highest
proportion observed inside the reserve. In wall and platform bottoms the abundance of
juveniles did not differed greatly between locations. In the case of small fishes the
unprotected location had higher abundance in shallow strata than reserve whilst the

Cláudia Ribeiro
88
opposite happened in the deep strata. Medium and large fishes tend to be less abundant in
the shallow strata. Factor depth, clearly influenced the distributions of fishes and their
demographic structure, with higher abundance of juveniles and ‘small’ fishes in all
locations and types of bottoms in the shallow interval of depth, whilst proportion of
medium and large fishes tends to be higher in the deep strata.
A discriminant analysis of fish sizes distribution of the most common and abundant
species revealed a different pattern in the demographic structure of several species. The
small damselfish, C. limbata a much consumed species in the island, mainly in Caniçal –
one of the locations studied, was frequently and abundantly recorded, with more than 50%
of the specimen’s belonguing to medium size category. Although in less extent than other
of the censused species, (e.g. seabreams and parrotfish) the size distribution of this
damselfish also reflects some protection effect. Thereby higher percentage of medium and
large individuals were usually recorded inside the reserve (Figure 25a).
0
5
10
15
20
25
30
35
40
45
50
55
60
65
70
75
ARM
A
UA
C
GM
R
ARM
A
UA
C
GM
R
ARM
A
UA
C
GM
R
ARM
A
UA
C
GM
R
UA
C
GM
R
UA
C
GM
R
UA
C
GM
R
UA
C
GM
R
UA
C
GM
R
UA
C
GM
R
UA
C
GM
R
UA
C
GM
R
J S M L J S M L J S M L
Rb Wall Plat
%re
lativ
e ab
unda
nce
SD
Figure 24 - Relative abundance of fish recorded using three UVCTs in rocky boulders reefs (Rb) wall and platform bottoms in shallow (S) and deep (D) depth strata relating the size of fishes (J - juvenile, S - small, M - medium, L - large)
The pattern of size distribution of the parrot fish, a fishery targeted species,
evidenciated the protection effect of reserve creation. Indeed and besides the total
abundance being higher inside GMR (see table XII and Figure 25d), the species had higher
proportion of medium-large size individuals inside reserve in all types of bottoms sampled.
In the reserve rocky boulders reefs the biomass of this Scaridae was more than the double

Comparison of Rocky Reef Fish Communities Using Underwater Visual Techniques
89
of UAC and ARMA. Hence, this was the species that more clearly evidenciated the effect
of ‘protection’ factor either, in terms of total abundance and size distribution.
c) Thalassoma pavo
05
101520253035404550556065707580859095
100
% R
elat
ive
abun
danc
e
a) Chromis limbata
05
101520253035404550556065707580859095
100
% R
elat
ive
abun
danc
e
b) Abudefuf luridus
05
101520253035404550556065707580859095
100
d)Sparisoma cretense
05
101520253035404550556065707580859095
100
e) Canthigaster capistrata
05
101520253035404550556065707580859095
100
ARM
AU
AC
GM
RA
RMA
UA
CG
MR
ARM
AU
AC
GM
RA
RMA
UA
CG
MR
UA
CG
MR
UA
CG
MR
UA
CG
MR
UA
CG
MR
UA
CG
MR
UA
CG
MR
UA
CG
MR
UA
CG
MR
J S M L J S M L J S M L
Rb Wall Plat
% R
elat
ive
abun
danc
e
f) Sphoeroides marmoratus
05
101520253035404550556065707580859095
100
ARM
AU
AC
GM
RA
RMA
UA
CG
MR
ARM
AU
AC
GM
RA
RMA
UA
CG
MR
UA
CG
MR
UA
CG
MR
UA
CG
MR
UA
CG
MR
UA
CG
MR
UA
CG
MR
UA
CG
MR
UA
CG
MR
J S M L J S M L J S M L
Rb Wall Plat
Figure 25 - Relative abundance of the most common abundant species at different bottoms sampled (Rb-rocky boulders, Wall and Platform) in the three locations surveyed (GMR – Garajau marine reserve, UAC – unprotected area of caniçal; ARMA – artificial riprap of Madeira airport) in relation to size (J – juveniles, S – small; M – medium; L – large); Black bars = shallow strata; white bars = deep depth strata

Cláudia Ribeiro
90
g) Diplodus sp
05
101520253035404550556065707580859095
100
ARM
AU
AC
GM
RA
RMA
UA
CG
MR
ARM
AU
AC
GM
RA
RMA
UA
CG
MR
UA
CG
MR
UA
CG
MR
UA
CG
MR
UA
CG
MR
UA
CG
MR
UA
CG
MR
UA
CG
MR
UA
CG
MR
J S M L J S M L J S M L
Rb Wall Plat
% R
elat
ive
abun
danc
e
Figure 25 (cont) – Relative abundance of the most common abundant species at different bottoms sampled (Rb-rocky boulders, Wall and Platform) in the three locations surveyed (GMR – Garajau marine reserve, UAC – unprotected area of caniçal; ARMA – artificial riprap of Madeira airport) in relation to size (J – juveniles, S – small; M – medium; L – large); Black bars = shallow strata; white bars = deep depth strata
The demographic structure of the non-targeted fish species A. luridus, T. pavo and
C. capistrata recorded common and abundantly in the locations studied along the south
coast of Madeira Island did not show significant differences in any of the size categories
within locations in all types of bottoms (Figure 25 b, c and d).
Regarding the abundance of the fishery targeted sea-breams, Diplodus sp., the
individuals recorded in this study were mostly composed by small-sized fishes, namely D.
vulgaris individuals and the values did not differed much in the locations studied. Higher
percentage of small-fishes was observed in the shallow interval of depth. In wall and
platform bottoms the size distribution of the seabreams differed among reefs, indeed higher
density of medium and large-sized fishes was observed inside the reserve than in the fished
location (see Figure 25g).
DEPTH EFFECT
As presently considered, and as mentioned in the methodology chapter (see
methodology section), factor “depth” refers to two depth intervals or strata: ‘shallow’
equivalent to 0-10 meters and ‘deep’ equivalent to 10-20 meters. Depth clearly influenced
the structure of the fish assemblages studied; the ensemble properties of the communities
showed significant differences among depth strata, either in terms of number of species
seen and total abundance. The deepest strata had highest values of both parameters in all
locations (natural protected/natural unprotected and artificial unprotected) and types of

Comparison of Rocky Reef Fish Communities Using Underwater Visual Techniques
91
bottoms. The two-dimensional nMDS plots (Figure 15, 16 and 17) indicated that fish
assemblages variation was strongly associated with depth and was consistent among
locations and bottoms types. Indeed, in the nMDS plots samples were particularly more
distinguishable by depth than by any other factor concerned in the sampling design. The
analysis of similarity (ANOSIM) (Table XIII) revealed differences among depths for all
locations. Depth exerted influence in fish size distribution, more abundance of juveniles
and small fishes was observed in the shallow strata for most of the species and also
influenciated the distribution of some particular species in the sites surveyed as the M.
fusca, that mainly occurred in the deep strata. Depth, had also an important effect over the
fish assemblages trophic structure as reffered previously in the trophic structure results.
Relevant to highlight that a large proportion of the overall list of species (75%)
occurred in the entire interval sampled (0-20 m). Just six taxa: C. crysos, Clupeidae
undetermined, K. sectator, L. nuchipinis, Lepadogaster sp. and P. acarne were exclusively
observed at the shallow interval (0-10m) and nine (Gobiidae undetermined, D. pastinaca,
Gymnothorax unicolor, H. cruentratus, M. helena, Sarda sarda, S. scrofa, S.
mediterraneus, U. scaber) at the deep interval. Nonetheless, in both strata they had low
sighting frequency (see Table XI) and thus classified as rare species. Excluding the erratic
schooling species, such as the blue runner C. crysos, the atlantic bonito, S. sarda and
herrings, which could often confound the results when appear in a place few times but in
big shoals, the remaining species observed in those two groups were not abundant and
were mainly cryptic. Moreover, samples from each depth-range, contained similar number
of species: 52 were observed in shallow water for the total of the three locations studied
and 55 were visually identified in the deep interval of depth.
From the overall species censused in this study, and although recorded in both
depth strata, the redlip blenny O. atlanticus generally had higher frequency of occurrence
(>70%) in the bottoms sampled at shallow strata, whilst in deeper strata the sighting
frequency was much less (rare species). The opposite situation happened with the big
grouper M. fusca, which was almost absent from shallow strata in all locations as seen in
Table XI and Figure 19c and 20h whilst, in deep strata occurred with much higher sighting
frequency.

Cláudia Ribeiro
92
6.5 – Physical and Environmental parameters
The physical properties of sea water: temperature and visibility (average, minimum
and maximum values) measured during the survey period (Spring 2002 to Spring 2004) are
depicted in Figure 26 accordingly locations and seasons. Water temperature ranged
between 17ºC and 24ºC and underwater horizontal visibility fluctuated from 3 to 30
meters. The minimal value of visibility was recorded in the natural unprotected location
(UAC) during winter 2003, due a huge land dumping caused by a pathway construction on
Caniçal shore. These constructions caused us some problems to accomplish the visual
surveys on this area in that particular season.
A pattern of variation was observed in visibility parameter, greater visibilities
registered in summer seasons and less in winter. The underwater visibility was a little bit
superior in GMR and ARMA but, in general was always considerably high (global mean=
18.5 m), exception made for the situation previously mentioned in UAC.
The surface chlorophyll a values obtained in all sites were very low (Figure 27),
ranging between a minimal value of 0.005 and a maximal of 0.6 mgl-1. Unprotected
locations (natural and artificial) showed similar variation of chlorophyll a among seasons,
whilst sites inside reserve differed and presented in general higher values of chlorophyll a.
Nevertheless the range of values (0.04 – 0.6 mgl-1) was so small that differences within
locations cannot be considered significant (see Figure 27).
0123456789
101112131415161718192021222324
Sp02 Sm02 Au02 W02 Sp03 Sm03 Au03 W03
Mea
n te
mpe
ratu
re (º
C)
0
2
4
6
8
10
12
14
16
18
20
22
24
26
28
Mea
n V
isib
ility
(m)
Visibility (m) Temperature (ºC)
Figure 26 Seasonal variation of sea water temperature and underwater visibility in the three locations studied (□ – UAC, ◊ - ARMA, X – GMR)
Temperature range: 17-24ºC Uderwater visibility: 3-30 meters

Comparison of Rocky Reef Fish Communities Using Underwater Visual Techniques
93
The seasonal variations of the surface nutrient concentrations in each dive site are
given in Figure 28. Nitrate+nitrite values of inshore surface waters were very low and
similar among locations, exception made to 2003 winter and spring seasons at Galo station
inside reserve, which presented higher values. The phosphate concentration measured
ranged between a minimal value of 0.04 and a maximum of 1.5 µmol l-1. The
concentrations values were generally constant, increasing from spring to summer 2002 and
stabilized around 0.9 µmol l-1. The exception was in Winter 2002 at Pináculo (on of the
dive sites inside reserve - figure 1), that reached the highest value. Silicate concentrations
tend to present higher values in winter and spring seasons, probably relating with the
runoff from streams.
SPM concentrations ranged between 0.8 and 4.2 mgl-1, the values tend to decrease
in summer and increase in autumn and winter, nevertheless no trend was evidently
observed along the two years of survey. Garajau rocky boulders reefs, ARMA and UAC
had in general similar variation, whilst the other diving site in Garajau (Galo) the values of
SPM differed. The percentage of organic matter included in the SPM is presented in Figure
29 and showed slightly higher values in summer and autumn, contrarly to the SPM values.
0
0,1
0,2
0,3
0,4
0,5
0,6
0,7
Sprin
g-20
02
Sum
mer
-200
2
Aut
unm
- 20
02
Win
ter-
2002
Sprin
g200
3
Sum
mer
2003
Aut
unm
- 20
03
win
ter-
2003
Clor
ophy
ll a
( µgl
- 1)
UAC
GMRa)
GMRb)
ARMA
Figure 27 – Seasonal variation of surface chlorophyll a in the monitoring stations, where water samples were taken during the survey period. GMRa) – samples taken in Galo near sampling sites with platform and wall bottoms; GMRb) – samples taken in calhau do Pináculo – near rocky boulders bottoms

Cláudia Ribeiro
94
00,10,20,30,40,50,60,70,80,9
11,11,21,31,41,51,61,7
Sprin
g200
2
Sum
mer
2002
Aut
unm
2002
Win
ter2
002
Sprin
g200
3
Aut
unm
2003
Win
ter2
003
Po4
conc
entra
tion
( µm
oll-1
)
UAC
ARMA
GMRa)
GMRb)
02,5
57,510
12,515
17,520
22,525
27,530
32,535
37,540
Sprin
g200
2
Sum
mer
2002
Aut
unm
2002
Win
ter2
002
Sprin
g200
3
Aut
unm
2003
Win
ter2
003
Si(O
H)4
con
cent
ratio
n µm
ol/l
00,10,20,30,40,50,60,70,80,9
11,11,21,31,41,51,61,71,81,9
Sprin
g200
2
Sum
mer
2002
Aut
unm
2002
Win
ter2
002
Sprin
g200
3
Aut
unm
2003
Win
ter2
003
NO
3 +
NO
2 co
ncen
tratio
n µm
ol/l
Figure 28 – Seasonal variation of surface phosphate, silicate and nitrate concentration at dive locations

Comparison of Rocky Reef Fish Communities Using Underwater Visual Techniques
95
00,20,40,60,8
11,21,41,61,8
22,22,42,62,8
33,23,43,63,8
44,24,44,6
Sprin
g200
2
sum
mer
2002
autu
nm20
02
win
ter2
002
sprin
g200
3
sum
mer
2003
autu
nm20
03
win
ter2
003
mgl
-1
UAC
GMRa)
GMRb
ARMA
010
2030
405060
7080
90100
Sprin
g200
2
sum
mer
2002
autu
nm20
02
win
ter2
002
sprin
g200
3
sum
mer
2003
autu
nm20
03
win
ter2
003
% o
rgan
ic m
atte
r in
the
SPM
UAC
GMRa)
GMRb
ARMA
Figure 29 – Seasonal variation of SPM (suspended particulate matter) and organic matter in diving sites along the survey period

Cláudia Ribeiro
96
Chapter 7: DISCUSSION AND FINAL CONSIDERATIONS
7.1 - Fish Census Methodology: discussion and considerations This section presents the considerations on underwater visual census obtained in the
present study, discussion about the choice of UVCTs and further points gained through
literature review. Basing on these results, future recommendations for fish communities
monitoring in Madeira Island are provided.
There’s numerous complexities and assumptions in comparisons of fish species
richness and densities recorded with different sampling techniques (Watson et al., 2005).
Furthermore, it is consensual among investigators using any type of sampling
methodology, that all methods to estimate fish density involve biases of some kind (Edgar
et al., 2004). None are perfect, there’s advantages and disadvantages, but all have one
point in common, which is being based on the study of a section or subgroup of the
population in question (Labrosse et al., 2002). Thus, and keeping that point in minde, the
selection of a census methodology for a monitoring program requires repeatability,
effective use of time and resulting in valid data comparable to other studies performed
(Pattengill, 1998). Clearly, no single method is suitable for all species, neither for all
habitats and thereby, the choice of the monitoring strategy and best sampling procedure
will depend on the characteristics/attributes of the monitored species, features of the
area/habitat to be surveyed, on the human and logistic resources available and obviously on
the question being asked.
The census methods employed till date variate accordingly investigators and were
modified to accommodate special circumstances, including environmental conditions,
study objectives, researcher’s ability and resources availability. The optimal UVC method
vary with situation, depending on the aims of the study, logistic constraints, characteristics
of target species, level of training of the observers, water clarity, depth, habitat type,
current speed and wave exposure (Edgar et al., 2004). In that sense, it is of researcher
responsibility ensuring that sampling methodology is chosen maximising accuracy and
simultaneously promoting the efficient use of resources. To accomplish that, a preliminary
investment of field time in small pilot studies is required in order to avoid the adoption of
inadequate sampling procedures that would not answer to the question posed. Thus, the
initial investment is related to the aims of the survey program and with the applications of
cost-benefits procedures to determine how survey effort would be best distributed, helping
accuracy, precision and confidence improvement of the estimates generated (Fowler,
1987). Furthermore, the degree of effort made by an individual worker to estimate

Comparison of Rocky Reef Fish Communities Using Underwater Visual Techniques
97
correctly the number of a particular species and/or size is important and will be directly
related to the time spent surveying reefs (John et al., 1990).
The sampling design chosen for this project included three UVCTs described in the
methodology chapter and so that was avoided the use of destructive methods. The methods
produced results that complement each other in the characterization of the fish assemblages
of rocky reefs in Madeira Island. In effect, the present results indicated that multiple census
techniques and multiple surveys in each location were desirable in order to provide a more
complete species list, as been referred by other authors (Schmitt & Sullivan, 1996).
The UVCTs have been used for long to estimate reef fish communities (Brock,
1954), especially valuable since they minimize the impact of sampling in the environment,
minimally disruptive to the organisms mainly when compared to substrate-disrupting
effects of traditional surface tended collecting devices such as angling, trawling, fish traps
and other standard fishing gear (Sale, 1980b). Because of this, most of the attempts to
enumerate fish assemblages in marine reserves have used UVCTs (e.g. Russ & Alcala,
1998; Edgar & Barret, 1999) and for that reasons they were chosen to be used in the
present study. Additionally, they are less selective when compared to most other sampling
methods (Brock, 1954) and since they do not remove organisms from the environment can
be repeated in the same place with brief intervals between samplings, providing a quick
non-destructive assessment suited to studies where successive samples are required as the
presently. They allow high levels of replication with few logistical requirements (apart
from SCUBA gear) (Bortone et al., 2000), are flexible, can be adapted to a variety of
different sites and habitats, such as benthic and midwater situations (Rountree, 1989) and
accurately record other types of in situ data (Denny & Babcock, 2004).
UVCTs provide qualitative data on the condition of natural and artificial reefs
(Bortone & Kimmel, 1991), on the presence of organisms and community structure
(García-Charton & Pérez-Ruzafa, 1998), data that served to evaluate community responses
to natural and artificial changes in the biotopes (Bortone et al., 1986) and quantitative data
on density and relative abundance of species or from the entire community (Kimmel, 1985;
Dennis & Bright, 1988). These techniques are cost-efficient methods for estimating size
and they have become an important method to determine distribution and abundance of
both, coral and temperate rocky reef fishes (Bell & Harmelin-Vivien, 1983) and just more
recently, population density and biomass has been recognized (McCormick & Choat,
1987). The use of UVCTs as management tool imply accurate estimates of length
frequency distributions and although the underwater estimates of length is not an easy task,
much of the studies use relative few size classes (Harmelin-Vivien & Harmelin, 1975;

Cláudia Ribeiro
98
Talbot et al., 1978; Bell, 1983; Burchmore et al., 1985) as the present study. Despite
difficulties, Bell et al. (1985) suggested that divers can be rapidly trained to estimate length
frequency distributions of fish populations, achieving consistent and an accurate
performance after five or six trials. However, they also easily loose the ability if they do
not practiced in six months, which would imply retrain before attempting further censuses.
According to Edgar et al. (2004) little drift in diver perceptions of fish size apparently
occurred in a one-year time scale. Therefore, basing on that and since the present survey
program conducted the censuses continuously from spring 2002 to spring 2004 that retrain
processes was not needed.
Despite the advantages of UVCTs, little attempt has been made to standardize
methodologies and that lack constitutes a major problem (Sale & Sharp, 1983). Most of the
UVCT used to assess reef fish assemblages have been tested or verified for suitability and
accuracy for different habitats (Sale & Douglas, 1981; Brock, 1982; Sale & Sharp, 1983)
but many, often merely reflect the researcher personal preference (Bortone et al., 1989). In
fact, and although its general application, the biases associated with the different UVC
methods have rarely been critically examined and remain poorly known (Edgar et al.,
2004). They display high repeatability and flexibility, but seldom (if ever) completely
sample the fish present at a site (Sale & Douglas, 1981). Because of that, different
techniques applied to the same fish community can generate quite different results (Davis
& Anderson, 1989; Kulbicki, 1998; Willis et al., 2000) and even when using the same
method, as a strip transect, factors such as transect dimension or observer speed can greatly
affect counts (Sale & Sharp, 1983; Lincoln Smith, 1988). Nevertheless, if adequate time is
devoted to the census, the method yield reasonably reliable results (Spyker & Van Den
Berghe, 1995), which was one of the present goals.
A plethora of problems make reef fish assemblage assessment difficult by any
method, each has its own inherent positive and negative biases, i.e. systematic deviations
of the estimates from the true value caused by artefacts of the method (Andrew &
Mapstone, 1987). Thus, it suggest that methodological attributes alone may be responsible
for much of the problem in the establishment of a reliable database regarding community
assessment, population dynamics and standing biomass (Lundälv, 1971; Goldman &
Talbot, 1976). Indeed, there are a number of methodological errors in almost all
applications of visual surveys, most of which resulting in underestimation of population
densities (Andrew & Mapstone, 1987; Greene & Alevizon, 1989). The estimation errors
fall into two categories: those related to the visibility of the organisms, which mean that a
proportion of the population is not available to be observed; and those errors attributable to

Comparison of Rocky Reef Fish Communities Using Underwater Visual Techniques
99
the observer, either in terms of wrong identification of species and of count of the
organisms’ available. In practice they are rarely measurable, due to the difficulty to
measure UVCT bias and precision in the field and to observe how they improve with
additional samples or resources. That type of information would be useful for design
studies using UVCT, stimulating a more efficient use of resources such as diver time.
Moreover, nowadays controls on daily dive time and number of diver ascents have been
introduced on scientific diving in several parts of the world in response to health concerns,
showing that these features are more precious than ever (Watson & Quinn, 1997).
It is desirable that the visual abundances estimates are unbiased and accurate but,
for comparative purposes it is sufficient that biases remain constant (Thompson &
Mapstone, 1997). When considering sampling errors, the systematic bias needed to be
distinguished from random bias. The first ones remain consistent with respect to density
for different sites, times and divers and rarely affect interpretation of results and the
general consensus appears to be that, consistent biases are acceptable for comparative
studies (Ackerman & Bellwood, 2000). In other hand, random errors add noise to data and
affect precision of estimates, but should not greatly confound the studies, other than
reducing the power of analyses. Biases that are inconsistent in time or place can generate
misleading interpretations and should be avoided (Edgar et al., 2004). It is problematic and
of difficult assessment the unknown variations in the bias of a method with its use in
different circumstances (e.g. habitats), for example artefacts of fishes visual census may
change with changes in the complexity of the habitat surveyed (Andrew & Mapstone,
1987) and given the dependence of all visual surveys data on the skill and technique of the
observer, a potential important source of inconsistency in bias is variation among observers
and/or within an observer, resulting of a changing experience and training. Bias can almost
never be completely eliminated and the amount of replication and spatial scale of sampling
units are frequently less than would be desirable (Williams et al., 2006) so that, the
challenge is to recognize and minimize its extent.
The variability between divers have been referred has a confounding factor in UVC
data analysis (Thompson & Mapstone, 1997). The divers related problems produces
additional bias associated with observer behaviour, experience, difficulties in manually
recording data, accuracy of species identification, and diver fatigue. Thereby, the reduction
of differences and bias between observers might be achieved by the improved taxonomic
skills and general competency gained by experience as the training period that I and my
buddy had before starting this survey program. Specific rules were established in the fish
counting process, which was an important mechanism for standardizing bias and also the

Cláudia Ribeiro
100
increased familiarity with the sites to be surveyed. To remove bias from different level of
experience it is sufficient that survey programs broadly balance observers’ experience level
among surveys (Williams et al., 2006). Hence, we choose to use the two same divers in all
counts, involving the same combination of divers at different sites as referred in
methodology section, both very experienced and trained and so that inter-observer
variability seemed irrelevant and negligible when compared to variability caused by others
factors as method and depth for most of the parameters studied. Indeed, more important
than identical data obtained by two observers, which is clearly unlikely, is whether such
variation is large enough when compared to other factors and thereby affect the
interpretation of the primary factors of interest. In any case, for survey programs which
aim is to detect differences among sites or time periods, it is only necessary that surveys
give good relative measures of density and diversity. Moreover, Edgar et al. (2004)
suggested that given the large amount of spatial variability encountered during visual
censuses, time spent in the field with experienced divers is generally better spent collecting
usable data, rather than undertaking prolonged diver retraining. The same author pointed
that diver recalibration will be of more interest in temporal studies rather than in spatio-
temporal comparisons such as this. Nevertheless, it worthwhile to refer, that would be wise
that resource managers and scientists in charge of survey programs seek to avoid gross
differences in the level of experience among teams of observers involved in surveys at
different sites or times (Williams et al., 2006).
The problem of bias in UVCTs stem from the “complexity and numerous” inherent
attributes of reef fish life histories, involving their mobility and their quick adjustment to
both biotic and abiotic factors; diving limitations due to currents and difficulties of
implementing methods under less than ideal conditions such as irregular substrates and
poor visibility and the fact of being limited to non-cryptic and diurnally active fishes (Sale
& Douglas, 1981; Brock, 1982; Harmelin-Vivien et al., 1985), behavioural factors such as
schooling (mixed-species schooling), territoriality or preference for certain substrates with
utilization of spatially irregular reef substrates, migration, cryptic habits and from the
uneven distributions of fish populations (Kimmel, 1985; Bortone et al., 1986).
Additionally, there are the logistical and analytical constraints inherent to each of the in
situ UVCTs developed to date and those biases could be regarding to the type of
individuals, species and families present as well biases caused by many varying physical
parameters. Furthermore, difficulties associated with multi-species fish counts using
UVCTs have been recognized (Lincoln Smith, 1989) and highlighted the fact that some
species were easier to count accurately than others. Indeed, a species-by-species approach

Comparison of Rocky Reef Fish Communities Using Underwater Visual Techniques
101
increase the amount of time and workers in the field and therefore, increase the study costs,
but is also likely to reduce the frequency of inconclusive results often blamed on lack of
statistical power which may really be primarily due to inappropriate survey methods
(Andrew & Mapstone, 1987). Specific challenges of UVCTs included constraints of depth
(<30m) and restriction upon underwater time due to safe diving considerations (Denny &
Babcock, 2004). These problems, coupled with the previously mentioned behavioural
aspects of the fauna such as secretive habits, schooling, and competitive interactions,
illustrate the need to develop or adopt to each particular situation UVCTs which permit
accurate and efficient assessment of reef fish assemblages (Bortone et al., 1989).
Despite the mentioned flaws, most researchers acknowledged the UVCTs as the
best method for non-destructive surveys for a broad spectrum of fish species (Denny &
Babcock, 2004) and because of that it were selected and used as survey methodology in
this study program, even knowing that they can not necessarily provide a complete species
list of the fishes present in the area studied. Clearly, the methods used were extremely
important in the evaluation of the fish communities, affecting the results of the in situ reef
fish surveys in what concerns the number of species and species diversity. Subsequently
the question was, which specific attribute inherent to each method (as a variable) was
responsible for affecting the results of survey. Hence, the evaluation of quantifiable
features of the methods such as the amount of area and time of survey was important.
The amount of area surveyed has been referred as an important aspect of any
methodology to explain the variation in results obtained by different methods (Bortone et
al., 1986). More information it would be expected from larger sampling areas and from
more time of observation, but the size of the sample area should be small enough to avoid
incomplete detection and thus fish density underestimation (Watson et al., 2005). The
present results showed that the VFC was the method better able to synoptically record
more species present in a certain area, through free swimming in larger and not in a
predefined area as PC and T and also due its “searching” nature. That fact allowed the
observer to find a greater number of species, including all the species he see, in shorter
amount of time and thus clearly allowed to regist more information in terms of number of
species and number of individuals, providing a more comprehensive species list than any
of the other two visual methods used. In fact, it have been reported that more complete
species lists are often obtained with roving-diver counts than with other methods because
the counter can freely search an area (Baron et al., 2004). Due the free ranging nature of
the VFC, determination of the area covered by the diver during the random swim was not
easy, generating relative abundance estimates and not number of fish individuals per area

Cláudia Ribeiro
102
(densities). Although the area surveyed using VFC was not really measured, was for sure
bigger than the area surveyed by the other two methods. Because of this drawback, the
question about the influence of the amount of area sampled by each method in the variation
of the reef census results can not be solved completely. For further comparisons with other
studies, density data was needed and because of that the other two methods (T and PC)
were used in this study. Besides, transect and point count methods have been used
extensively elsewhere (e.g. Bohnsack, 1982; Bortone et al., 1989; Rosa & Moura, 1997;
Watson & Quinn, 1997), but till date in Madeira Island just transect was used for visual
fish assessment (Andrade & Albuquerque, 1995, Delgado, 1998, Ribeiro et al., 2005).
Thus, and also due the fact that circular sampling areas may reduced the edge effect
(Bohnsack & Bannerot, 1986), PC was also chosen to be used in this study. From the
results obtained here with PC and T, it is possible to predict that the influence of the
amount of area surveyed by each method in the variation of reef census results is not great
when the magnitude of difference of area sampled is of the same order of the verified
presently.
The amount of observation time was also variable among the methods used. This
factor has been reported by Bortone et al. (1986) as exerting significant influence in the
variation of census results regarding the number of species and H’. In fact, many authors
have shown that the number of species detected is directly related with observations
duration and consequently the amount of time per survey is an important aspect to have in
consideration in any method (Harmelin-Vivien et al., 1985; Bortone et al., 1986; 1989;
2000). The VFC was the most time consuming method per survey and the one that
produced highest information on the fish assemblages in the locations studied.
Comparisons between methods show that VFC per survey took in average the double of
the time spent by PC and T but, in terms of cumulative number of species recorded it took
less time than the other two, recording species at a speeder rate than PC and T. Indeed, the
cumulative number of species recorded by the VFC was almost the cumulative number
obtained using the three methods. Thus, and given the fact that conventional scientific
diving besides expensive, is constrained by depth-duration relationships and because time
and area affect the similarity of the assemblages assessments (Bortone et al., 1989), from
the methods used here, the VFC turned out to be the more effective to determine the total
number of species in the locations studied. Therefore, the amount of area and time
surveyed were important attributes of the methods influencing the dependent census
variables such as number of species, species diversity and number of individuals.

Comparison of Rocky Reef Fish Communities Using Underwater Visual Techniques
103
To avoid biases and achieve maximum precision, the techniques were adapted to
the particular species and area sampled: 1) reduction of total time of observation in VFC,
2) reduction of PC radius of observation in wall bottoms. According to Bortone et al.
(1986) visual census produce estimates of relative quantification of the proportional
abundance of species. In that way, methods producing the greatest amount of data or
information regarding the number of species and abundance tended to produce less error in
the recognition of assemblages of ecological significance, i.e., their discriminatory ability
to recognize the importance of ecological differences is greater. Thus, the methods that
recorded the highest number of species may be the most useful in establishing the reef fish
faunas. Present results revelead that in this study the VFC was the method accumulating
larger number of species under all circumstances, which in someway represents a
challenge for the observer recording many species as possible. In fact, this is a positive
reward of the method and could serve as a work stimulus under some difficult conditions.
As the study of Bortone et al. (1986) that compared six different UVCT under a
variety of reef conditions and the study of Bortone et al. (1989) of reef fish assessment in
Puerto Rico, we find that PC and T, two of the methods presently used were roughly
equivalent in their ability to qualitatively and quantitative describe the fish assemblages.
Additionally, Watson and Quinn (1997) studying the performance of T and PC methods
found out that neither method had appreciable bias in the estimator of density, whilst
Guidetti et al. (2005) using these two same methods in a shallow artificial rocky habitat in
the Adriatic sea, verified they produced significantly different fish assemblages and
Bortone et al. (1989) reported that adjusting the survey time and/or sampling area, the T
recorded more individuals per survey than PC. These two methods, contrary to VFC,
allowed divers to record number of species and individuals values relatively to area and
thus, are very useful for evaluation of reefs communities. Whether this extra effort using
more than one technique is worthwhile, depend of course on the reasons for which the
survey was designed.
Some species may be present in a site and seen by the observer, but could never
enter in the predefined area of the PC (circle) and T (corridor) methods and cannot be
included in the survey. Therefore, it results in misrepresentation of some species. They
were generally of three types: 1) solitary species that avoid diver’s presence, staying way
from the predefined area of PC or T (e.g.: A. strigosus, E. marginatus); 2) species less
abundant, less likely to be detected (Myliobatis aquila, S. scrofa); 3) schooling species that
may be abundant but never enter in the predefined area of the PC or T (Mugillidae, P.
dentex, S. salpa). Aditionally, cryptic and small inconspicuous fishes tend to be under-

Cláudia Ribeiro
104
represented in T and PC surveys, since diver ability to see small fishes is reduced beyond
the first few meters from the centre of transect corridor or cylinder centre. In fact, and
although in our surveys the stationary counts were made with the diver staying in the
centre of the cylinder and rotating 360º to record species, according to the field experience
in this study, and also as suggested by Baron et al. (2004) the diver should be allowed to
move around the cylinder because many small and juveniles fishes stay in depression close
to the substrate and therefore hidden from the counter.
Other factors besides area and time of observation have been referred as influencing
the results of in situ reef fish assemblages assessment, which is the case of underwater
visibility. DeMartini et al., (1989) recognized as a source of error differences in water
clarity and referred that visibility below 3 m drastically compromise results. Fortunately,
that situation never occurred in our sampling period. The visibility was on average superior
to 10 m (see environmental parameters section). So that did not represent a problem, since
it was high and consistent in all locations.
The number of species recorded in visual censuses is obviously related to sampling
effort and to the probability of species being recorded, which is not equal. Naturally, the
probability of rare species to be observed will increase with the increase of survey effort.
Consequently the number of surveys is very important, though there’s no linear
relationship between the two (Frontier & Pichod-Viale, 1991). The species that were
commonly and abundantly observed (such as A. luridus, C. limbata, T. pavo, etc.) were
generally sampled with similar sighting frequency and total relative abundance by the three
methods, whilst there were some differences among methods for the not so common and
the rare species. Other studies using different sampling techniques also showed this same
pattern to the common and abundant species. For instance, Schmitt et al. (2002) using
transect and roving diver surveys assessing coral reef fish assemblages of South-eastern
Hispaniola referred that the common and abundant species within the sampling area were
sampled equally by both methods. Presently, as would be expected, species recorded least
commonly by one of the methods used, were not recorded at all by the two other methods
(e.g. C. crysos, D. pastinaca Parapristipoma octolineatum, K. sectator, L. nuchipinnis, S.
scrofa). In few cases, those species recorded as least common by one method or even not
recorded at all were more common according to other method. Among them were the cases
of: S. salpa, Synodus sp., S. marmoratus, Tripterygion delaisi. The trend was that species
had greater occurrence with VFC method, even if they were not so common or not
observed either by T and PC.

Comparison of Rocky Reef Fish Communities Using Underwater Visual Techniques
105
Basing in the present results, it is suggested that the coastal fish communities in
Madeira Island continue to be monitored with visual census techniques as we used here.
However, some changes and adaptions should be taken having into account the places
under study. Altghough the use of multiple methods to make accurate and precise
determination of reef fish density estimates may seem redundant, it is important to be
performed since it offers a way to compare and refine the assessment methods (Bortone &
Kimmel, 1991). Thus, several sampling methods could be used jointly to obtain a better
understanding of fish communities. Watson and Quinn (1997) suggested the use of point
count and transect methods combination when the conditions of fish movement and
visibility vary. In the current study, the VFC method was the more accurate technique to
determine species richness, nevertheless, the use of standard techniques such as T and PC
were valuable in order to obtain densities estimates in a regular monitoring program and
mainly for key species (permanent, abundant and targeted by fisheries). Thus, for future
programmes it is recommended the simultaneous use of VFC and one of the other two
density methods used here to continue a survey program in coastal fish reefs communities
in Madeira Island. Important to note that the best “combination” of methodology will
depend on the relative costs per area surveyed and other logistical considerationsthat were
mentioned and the final decision can only be made after field testing under a variety of
different conditions, which should be more intensly studied.
7.2 – Madeiran inshore rocky reefs communities In Madeira Island and remaining islands of the archipelago the coastal-reef
environment is dominated by a fish fauna with different origins and wide geographical
ranges. Some species have warmer-water affinities (e.g. A. luridus, Aluterus monoceros A.
scriptus, A. strigosus, C. limbata C. capistrata, G. thompsoni, E. anatina, H. cruentatus,
M. fusca, O. atlanticus, S. marmoratus, Synodus synodus, etc.), whilst other have more
temperate-water affinities (e.g. A. presbyter, B. boops, B. capriscus, Coris julis, Diplodus
sp, Seriola spp., Spondyliosoma cantharus, etc.). Lloris et al. (1991) and Briggs (1995)
referred that in the Macaronesia region there’s a crossroads where fish species from
different origins meet. Additionally, and as a consequence of isolation, islands populations
may diverge from their parental mainland populations and raise up to distinct endemic
species or complexes of species which are found nowherelse (Báez, 1993). In fact, and
though in small number when compared with other oceanic islands like St. Helena or
Ascension Island where the level of endemism is high (Floeter & Gasparini, 2000) or even
when compared with the marine fauna of others Macaronesia Islands as Cape Verde (Brito

Cláudia Ribeiro
106
& Miller, 2001), the coastal fish fauna of Madeira presents some endemic species to the
Macaronesia region namely: A. luridus, B. scrofa, C. trutta, M. augusti and M. fusca.
These five species were all recorded in the present study with the particularity that A.
luridus was one of the most frequent and abundant species observed in all localities,
bottom types and depths.
From the above cited species, A. monoceros, A. scriptus (amphi-atlantic
widespread) and G. thompsoni (western and central atlantic range - Edwards & Glass,
1987) were more recently cited as new records to Madeira archipelago (Araújo & Freitas,
2002; Freitas & Biscoito, 2002) and is under preparation a paper of new assignment for
Abudefduf saxatilis (Freitas and Araujo in prep). However, of these news fish assignments,
just the small goldspot goby, G. thompsoni was sighted several times along the rocky reefs
in the present study at GMR and UAC locations.
The complete list of Madeira coastal reef fishes is greater than the list obtained
here, shown in Table VI and XI. No recent checklist of marine fishes from Madeira have
been published, contrary to Canaries (Brito et al., 2002) and Azores (Patzner et al., 1992;
Arruda, 1997). However, Wirtz (1994) reported 104 littoral species to Madeira Island in its
underwater fish guide. The list of fish species provided here, obtained using the three
UCVTs during the two years survey program is more complete than previous lists recorded
in Madeira Island also using UVCTs and it represents a substantial portion of the coastal
fish communities. Andrade and Albuquerque (1995) referred 31 species fish species in
assemblages associated with bottoms habitats of South coast of Madeira Island, Delgado
(1998) in a study of faunistique, bathymetric and geomorphologique characterization of
GMR cited 44 fish species and Mello (2000) also in the same marine reserve but, studying
the ichtiofauna of Garajau bay referred 44 species, whilst Ribeiro et al. (2005) assessing
fish assemblages of Cais do Carvão Bay (South coast) reported 44 fish species. Therefore,
the number of species recorded in this study (61 spp) was significantly higher than the
number reported in those studies. Besides that, this study was the first accounting for
species composition of three coastal locations with subtidal rocky reefs in Madeira Island
shore over successive seasons during 2 years.
The comparison of the total list of fish species recorded in this survey program with
the fish list reported by Wirtz (1994) in its guide showed a 58.7% overlap and from the
overall list only the small G. thompsoni was not referred by Wirtz (1994) as neither by any
other works previously performed in Madeira Island. The species was in fact firstly
assigned by Araújo and Freitas (2002) and the present results sustain the implementation of

Comparison of Rocky Reef Fish Communities Using Underwater Visual Techniques
107
the specie in the rocky reefs of Madeira Island, displaying higher frequency of occurrence
in the eastern-most reefs surveyed (UAC).
The Comparisons of the ichthyofauna list described in this study with other
available inventories that visually assessed coastal fish communities in Madeira Island
(Andrade & Albuquerque, 1995; Delgado, 1998; Mello, 2000, Ribeiro et al, 2005) revealed
a great similarity between communities. Additional comparisons to others studies
performed in other islands of Macaronesia region (Selvagens – Falcón et al., 2001, Canary
Islands - Fálcon et al, 1996, Azores – Azevedo, 1997 and Harmelin-Vivien et al., 2001)
still revealed high similarity (see Table XVII), whilst further comparisons to more distant
regions showed that the number of species in common to our study, represented smaller
proportions in those local assemblages, as the case of the Mediterranean, Adriatic and
Brazil per decreasing order (see Table XVII). Thus, these results sustain and highlight the
bio-geographic specificity and affinities of the fish fauna of Macaronesia Islands as
previous works stated (Lloris et al., 1991; Harmelin-Vivien et al., 2001).
Pooling the fish species lists obtained in prior studies of coastal communities in
Madeira Island using UVCTs with the list obtained presently it was added up a total of 78
species, which are now referred to be associatiated to the subtidal inshore habitats of
Madeira Island. Thereby, the total of 61 fish species recorded presently represent 78% of
the number of fish species visually recorded till date in Madeira Island.
Considering the total number of species and families recorded in this study ( S= 61
and F=33 ), the pattern of fish species diversity in Madeira Island is relatively low, mostly
when compared to littoral areas of tropical and subtropical islands of the atlantic
(Gladfelter et al., 1980) or when compared with tropical rocky shores (91 spp. belonging to
37 families found on tropical rocky shores in Brazil Ferreira et al. (2001) or to fish
communities in coral reefs (215 species belonging to 40 families were visually recorded in
Okinawan coral reef - Nanimi and Nishihira (2002)); 146 species of 25 families in Pionner
Bay, Great Barrier Reef (Ackerman & Bellwood, 2000). Indeed, fish diversity
characteristically decrease from tropical to temperate latitudes (Hobson, 1994) and in the
Atlantic ocean is the Caribbean that have been referred as the most speciose area (Briggs,
1995).

Cláudia Ribeiro
108
Table XVII – number of fish species (N) recorded by UVCT in different islands of Macaronesia region, western Atlantic (Brazil), Mediterranean sea and Adriatic, indicating the number of species in common with the present study (N common) and expressed the percentage (%) of those species in the locals assemblages
Site N N common % ReferenceMadeira 31 26 84 Andrade and Albuquerque, 1995
44 35 80 Delgado, 199844 37 84 Mello, 200244 36 82 Ribeiro et al., 200561 - 100 Present study
Selvagens 60 40 67 Falcón et al., 2000S. Miguel, Azores 54 35 65 Azevedo, 1997Azores (several Islands) 57 38 67 Harmelin et al. , 2001Canary Islands 76 45 59 Falcón et al., 1996
55 38 69 Tuya et al. , 2004bCeuta 32 13 41 Valle et al., 2003Western Mediterranean 56 23 41 García-Charton et al ., 2004North Adriatic 49 11 22 Guidetti et al. , 2005Brasil coast 91 4 4 Ferreira et al ., 2001
Madeira Island, as the Canary Islands (Falcón et al., 1996; 2001) has oceanic and
oligotrophic surrounding waters which can explain the reduced species diversity. In fact,
high productivity is necessary to develop extensive guilds and complex ecological
assemblage of diverse species.The present study revealed that surface nutrient
concentrations and surface chlorophyll a in the dive sites were low and INIP (1982; 1984)
studying the adjacent area to Madeira Island also referred low concentration values for
nutrients in the surface layer and till the first 100 meters. The nitrates and phosphate values
did not reached in most of the cases the level of detection by the method used and thus,
they referred that nitrate maybe the most limiting nutrient for primary production in the
euphotic layer, since they do not detected significant values of nitrates at depths less than
120 meters. Additionall comparisons referred low surface values of chlorophyll a, almost
nulls, they recorded a highest value of 0.13 mg/m3 and mostly were around 0.05 and 0.10
mg/m3. Despite that, some careful must be taken regarding this results since the
spectrophotometric method used presently, is not a much appropriated method in the cases
of low concentrations (Grasshoff et al., 1999). For instance, Clode (2005) using this
method in field experiment in the south coast of Madeira Island was not able to determine
the chlorophyll a concentrations, since the natural concentrations were lower than the
detection limit for this method. Therefore, further studies on this matter should use a more
accurate and precise method as fluorometric determination or HPLC.
Besides the referred reasons and as already suggested by Falcón et al. (1996) for
the Canaries archipelago, the nearshore environment alterations arisen from increased
tourism development and over-exploitation of fishery resources through the use of very

Comparison of Rocky Reef Fish Communities Using Underwater Visual Techniques
109
destructive fishing practices (e.g. explosives) could also be responsible for this low
diversity and richness of the littoral fish communities surveyed in the South coast of
Madeira Island. No before-after comparisons were possible to be done, since there’s no
data on nearshore fish communities prior to the strong “development boom”. Additionally,
the low number of species observed in Madeira Island when compared to other ‘richer’
regions can also probably be explained by the scarce environmental heterogeneity due the
narrow continental shelf, which turns out in small area of shallow water surrounding the
island and thereby limiting the number, the diversity and area of available habitats and
niches (Falcón et al., 2001). The relative geographic isolation of the island is also a reason
that can be pointed as a cause for the low coastal fish diversity, due to the implications of
distance from source populations for planktonic dispersal which turns the temporal patterns
of remote islands especially dynamic (Myers & Pepin, 1994). In fact, the isolated nature of
island populations, including likely low recruitment due to larval loss, makes many species
vulnerable to over-exploitation, which coupled with the special Latin taste for seafood (and
few alternatives on rocky islands) even increase this risk (Hawkins et al., 2000). Moreover,
Briggs (1995) considered that the trend of fish diversity decreasing from tropical to
temperate latitudes could be related with differential extinction rates suffered in peripheral
areas due to sea-level and temperature changes over geological time and differences in
recent speciation rates, decreasing from tropical to temperate sites.
Comparisons of the list of ichthyoufauna obtained here using UVCTs with other
available inventories within Macaronesia Islands as the Canaries or Azores Islands showed
that total number of species recorded in Madeira during this study (S=61) did not differ
much from the number of fish species reported in those regions. For instance, Falcón et al.
(1996) recorded 76 species in rocky-substratum of four islands of the Canaries archipelago
and Tuya et al. (2004b), studying the relationships between rocky-reef fish assemblages,
the sea-urchin D. antillarum and macroalgae through the Canarian archipelago observed
55 fish species along 36 sampling locations. Azevedo (1995), using census surveys added
up a total of 66 species which considered as the more common fish species in Azorean
shallow waters. The same author (2000), combining rotenone with census surveys
registered a total of 46 fish species in Azorean shallow waters. Additional comparisons
with other studies that used UVCTs in temperate rocky reefs such as the Mediterranean
and Adriatic, showed that the number of species recorded currently in rocky reefs of
Madeira Island was in fact higher than the recorded in those regions: 61 species presently
to Madeira coastal rocky reefs versus 57 species recorded in Spain using transect surveys
(Macpherson et al., 2002); 56 species found by García-Charton et al. (2004) in

Cláudia Ribeiro
110
Mediterranean rocky reefs, 54 species in a study of Carry-le-Rouet marine reserve
efficiency (French Mediterranean Coast) (Harmelin et al., 1995), 51 species observed in
Medes Islands, Spain by García-Rubies and Zabala (1990), 49 species observed in a study
of comparison of protection effects on fish assemblages in the northern Adriatic sea
(Guidetti et al., 2005), 47 species recorded by Harmelin (1987) in Port-Cros marine reserve
and 45 species recorded in rocky reefs in the Mediterranean by Garcia-Charton and Pérez-
Ruzafa (2001).
Concerning familial composition, the number of families recorded presently (33
families) is high comparatively with some of the previously cited works, which recorded
much higher number of species than the recorded here (Ackerman & Bellwood, 2000;
Ferreira et al., 2001; Nanimi & Nishihira, 2002), but the reason nº of families/nº of species
was higher in our study than in those works and thereby the fish communities in Madeira
Island supported higher diversity at higher taxonomic level.
Comparing to other many regions, particularly with coral reefs (e.g. Sale, 1977;
Sale, 1980b; Bohnsack & Bannerot, 1986; Bortone et al., 1986; Frienderlander & Parrish,
1998) or with the Mediterranean rocky reefs (e.g. Harmelin, 1987; Francour & Harmelin,
1988; Guidetti et al., 2002b; García-Charton et al., 2004) the icthiological communities of
the inshore rocky reefs of Madeira Island have been poorly studied. Furthermore, the
knowledge of the icthiological populations of Madeira Island is still poor when compared
with fish communities in others islands of the Macaronesia region, mostly to the Canary
Islands, (Brito et al., 2002). Indeed, 217 species were referred for the inshore fish-fauna of
the subtropical Canary Islands (Dooley et al., 1985) and Brito (1991) referrered 553 fish
species in its icthiological catalogue. More recently, resulting from the increased effort and
investigation in more deeper waters Brito et al. (2002) referred 691 fish species in the
Canarian archipelago fish catalogue. This last number represents a significant increase in
terms of new species assignments particularly from deeper waters as also trough new
records of littoral species with more tropical distribution relating to the environmental
changes occurred in the end of the last decade (Brito et al., 2001). That fact, have also been
happening in Madeira Island, with more tropical affinities fish species being recorded for
the first time to Madeira archipelago: A. monoceros and A. scriptus by Freitas and Biscoito
(2002) and A. saxatillis by Aráujo and Freitas in prep.
The fish assemblages of the locations studied in the south coast of Madeira Island
presented a notable unity and some peculiarities. There’s a spatial-temporal dominance of
a small group of species, which compose the plafond of common species. Hence, there´s
an important group of species whatever the location or remaining factors considered in the

Comparison of Rocky Reef Fish Communities Using Underwater Visual Techniques
111
sampling design. This fact had been reported by other studies in rocky reefs of
Macaronesia Islands, indeed, in the Azores Azevedo (1997) suggested that ictiological
communities were composed by a stable group of benthic and demersal species and a
variable group of pelagic species, whilst Harmelin-Vivien et al. (2001) also in Azores
reported fish assemblages quite homogeneous and numerically dominated by small number
of species. Thus, whatever the relation of fish species with the structuring variables, those
species tended to form a persistent and stable community indicating a structural order. The
species diversity indices and total density indicated a relatively stable fish community
structure in all locations, presenting substantially comparable values. Just some differences
occurred in total fish abundance, with artificial location sustaining higher total abundance
than the rocky boulders reefs of the other two natural locations. Relative abundance of
some fish species and their demographic structure also differed among the factors
concerned in the study. The similar species richness undoubtedly reflects the similar
sampling efforts applied in the areas studied.
The similarity in species composition among localities was also reflected in the
occurrence of the rare species, since it not differed much among locations. Just 12 species
out of 61 (20%) occurred in just one of the locations studied: 3 in GMR (E. anatina, E.
marginatus and K. sectator), 7 in natural nonprotected location, UAC (C. crysos,
Clupeidae, D. pastinaca, S. mediterraneus, L. nuchipinnis, S. scrofa and U. scaber) and 2
in artificial nonprotected location, ARMA (M. helena and P. acarne). However, a
considerable high number of species (45%) were classified as rare in the reefs surveyed
and the causes for that may be multiple. For instance, some species may be observed at the
limit of their niche space as could be the sighting of D. pastinaca and U. scaber in wall
bottoms in UAC, where extensions of sand bottom occur around the walls and therefore
the species could be recorded swimming over walls, a type of bottom were usually they do
not occur. Other possible cause for rarity of species could be the selected range of depth
(0-20m), which may be the upper limit of their distribution. Actually, some species are
exclusively or largely confined to waters ranging to deeper depths, for instance the
occasional observation of scorpionfish S. scrofa in the deep Rb and platform bottoms of
UAC, a species that distributes between 20 and 200 m depth (Quéro et al., 2003) or the
occurrence of P. acarne in ARMA, a demersal species occurring usually between 40 to
100 m depth (Quéro et al., 2003) , whose juveniles can swim to shallower depths, or even
the sighting of the dusky grouper E. marginatus in the deep bottoms of the reserve, since it
is a specie that commonly refuges in deeper waters to escape sperafishing. Additionally,
species could also be considered as rare due to its cryptic and gregarious nature, avoiding

Cláudia Ribeiro
112
divers and thereby rarely seen, which could be the cases of species such as A. strigosus, M.
helena, E. anatina.
The “unity” of the fish communities was not surprising, since the three locations
studied and described here were chosen basing on habitat similarities and were all located
in the southeast coast of Madeira Island. In that sense, they are influenced by the same
local conditions. The water bottom temperature showed the expected seasonal patterns,
displayed maximum water temperatures in summer and autumn and lowest values in spring
and winter during the two years of study. The interval of values registered in this survey
period fits on the temperature interval referred to Madeira Island (Caldeira et al., 2002) and
the water temperature values did not showed pronounced differences between locations,
being nearly equal in all locations. Indeed, environmentally they presented similar patterns
in terms of temperature, visibility, nutrients and chlorophyll a concentration values. These
last ones were in general very low in the locations studied and in all the island (INIP, 1982;
1984).
In general the rocky reefs fish assemblages in Madeira Island were dominated by
the speciose families Sparidae and Labridae whilst in terms of abundance the
Pomacentridae family, represented only by two species (A. luridus and C. limbata)
dominated all the studied sites, usually reaching more than one-fourth of the total fish
abundance of each site. Sparidae, although comprising higher number of species, did not
show great abundance, unless the pelagic species B. boops and O. melanura, which when
occurred was in big shoals tend to dominate the total fish abundance. Those species were
more frequent and dominant in the rocky artificial riprap of Madeira airport (ARMA).
Concerning Labridae, only ornate wrasse, T. pavo was significantly abundant in all sites
with higher abundance in the shallow rocky reefs, than in the deeper ones.
The information provided in this study showed that in general some of the features
of the fish assemblages studied in the rocky reefs of Madeira have been observed also in
other rocky reefs from nearby regions. For instance, from the bulk of species referred as
the most abundant by Harmelin-Vivien et al. (2001) in Azorean coastal rocky reefs: B.
boops, D. sargus, T. pavo and C. limbata were also observed commonly and abundantly in
the fish assemblages presently studied. However, the same author and Azevedo (1997)
again in Azores Islands referred the species C. julis, C. trutta, Chelon labrosus, T.
picturatus, T. ovatus, Pagellus bogaravaeo P. acarne and S. salpa as very abundant, whilst
in our survey some of those were not recorded at all, namely T. picturatus; P. bogaraveo
and C. labrosus and the remaining although recorded, were not frequent neither abundant.
Comparing the present results with the findings obtained by Tuya et al. (2004b) in the

Comparison of Rocky Reef Fish Communities Using Underwater Visual Techniques
113
Canarian archipelago they also referred T. pavo, A. luridus and S. cretense as the most
abundant species of the demersal nearshore fish assemblages in the islands and observed
that C. limbata and B. boops were the most abundant pelagic schooling species as we
verified presently in Madeira inshore rocky fish assemblages. Moreover, Falcón et al.
(1996) also in the Canarian archipelago referred as the most abundant species A. luridus,
C. limbata, T. pavo, A. imberbis, C. capistrata, O. melanura, and Sardinella maderensis
and from all species they recorded, the highest number of individuals observed per survey
were the schooling pelagic species A. presbyter, B. boops, Sardina pilchardus and
Sardinella aurita.
The present results showed consistency and agreement for some of the communities
descriptors relating literature data on rocky coastal reefs areas, as the case of the
Mediterranean. Several authors emphasised the qualitative dominance of sparids and
labrids and the quantitative dominance of schooling species in shallow rocky
Mediterranean habitats (Harmelin, 1987; Guidetti, 2000). In Madeira, however the
presence of labridae family was not significant. The only abundant labrid species present
was T. pavo and that may be due the fact that labrids had preference for substrates
colonized by macroalgae (Guidetti & Bussotti, 2000), which is a common feature in
temperate waters, but in Madeira rocky reefs algae have been decreasing in these last years
(pers. obser.). The algae decrease may be due the demographic explosion of the echinoid,
the long-spined sea urchin, D. antillarum as have been observed throught the neighbour
Canarian archipelago (Tuya et al., 2004c).
7.3 . Structure of fish communities and structuring factors
The reef fishes studied showed a distinct assemblage structure according to depth
and type of bottom. Both, multivariate and univariate results indicated that fish community
was structured according to depth. Respecting some of the fish guilds analysed here, they
presented a consistent pattern with an increase of species ricnhness and abundance from
shallow to depth strata. Additionally, the ensemble properties of the fish populations in the
locations studied exhibited statistical differences among bottoms types.
Several studies of ecology of reef fishes refer the factor “depth” as an important
habitat variable affecting abundance and distribution of species in a variety of ways
(Frienderlander & Parrish, 1998). Indeed, the collected data highlighted the strong effect of
depth in the community parameters, which were strongly influenced by depth, rather than
by protection level, bottom type or any other factor considered in the sampling design.

Cláudia Ribeiro
114
Comparatively, those other factors played a minor role in the fish community structure.
Hence, the most obvious differences occurred between shallow and deep sites, no matter
location or bottom type considered, with shallow and deep rocky bottoms supporting a
typical fish community that differed in terms of species richness, fish abundance,
composition and functional groups.
It is important to note that the present results demonstrate that individual species
showed a considerably and often an inconsistent variation among depth, location and type
of bottom. However, the whole assemblage tends to vary consistently among depth.
Contrarly to the observed by Harmelin- Vivien et al. (2001) in the Azores coastal rocky
shores, where the number of fish species decreased slightly with depth and the highest
number of species were recorded within surface and 10 m depth, presently the number of
species and the number of individuals observed increased with depth from shallow to deep
interval (10 to 20m). In all locations and bottoms types the highest species richness and
number of individuals were observed in the deep strata (10-20m). The same was referred
by Tuya et al. (2004a) in the Canaries Islands, with both, species richness and total
abundance of individuals increasing linearly with depth. Some of the observed species in
the fish assemblages studied showed particularly affinity to one of the depth strata
sampled. For instance, the species M. fusca occurred consistently at greater numbers in
deep strata, mostly in GMR. Conversely the scarid S. cretense occurred more abundantly at
shallow strata inside reserve. Although, the strong effect of depth structuring the fish
communities, presently most of the species censused (n=48) were observed in the entire
depth interval sampled (0-20m) and thus showing great homogeneity (>78% of the species
recorded from surface to 20 meters depth) as have been verified by Harmelin-Vivien et al.
(2001) in the Azores islands.
Other studies in other parts of the world have shown that the composition of the
fish fauna in many reefs is influenced by water depth (Bell, 1983; McGehee, 1994; Lara &
Gonzalez, 1998; Hyndes et al., 1999). There are some reported cases were fitted models
include depth as a factor, showing its strong influence in the structure of littoral fish
(García-Charton & Pérez-Ruzafa, 1998). Besides well known, the influence of the factor
“depth” in the stratification of the fish assemblages is often considered as the most
important factor structuring coastal fish communities (Francour, 1997). Among the studies
highlighting depth-related variation in fish assemblages were: Bell (1983), studying the
effects of depth and reserve fishing restrictions in the structure of a rocky reef fish
assemblage in the North-western Mediterranean Sea, who verified that relative densities of
most species showed marked differences between shallow and deep sites indicating that

Comparison of Rocky Reef Fish Communities Using Underwater Visual Techniques
115
depth was largely responsible for structuring the assemblage; La Mesa and Vacchi (1999)
analyzing the coastal fish assemblage of the Ustica Island Marine Reserve (Mediterranean
sea) found out that community parameters provided highly significant model when depth
was tested as dependent variable, which contrasted with factors zone, site and season;
Relini et al. (1994) carrying studies on algae, invertebrates and fish in northern
Mediterranean and Southern Chile have found assemblage variation according to depth and
Connell and Lincoln-Smith (1999) in a temperate coast showed that depth-related variation
can occur even between small interval differences (10-20m - which was the interval
considered presently) as well with larger differences (30-40m). Therefore, small
differences in depth have the potential to confound comparisons at a larger spatial scales,
for example, locations sampled at slightly different depths (e.g. a difference of 10m) to test
differences among locations, any difference in structure of the assemblage could be due
differences in depth/habitat rather than location. Additionally, Sherman et al. (1999) on the
southeast Florida (USA) referred that depth has a potential importance in artificial reef
function and therefore the fisheries managers need to take this into account when
determining a deployment site for an artificial reef. Hence, at biogeographic scales, depth
related variation is likely to be important even though the identity of the constituent species
change considerably (Connell & Lincoln-Smith, 1999). Besides, depth-correlated
characteristics such as substratum type, light intensity, temperature, and turbidity in
various combinations affect fish assemblages in several ways.
There were no studies or surveys performed prior to the jetty construction of
Madeira airport, nevertheless, the general nature of the original fish fauna in the existing
bay can be described basing on the sand communities that exist in the coastal sand bottoms
of Madeira, with species as Xyrichithys novacula, D. vulgaris, B. podas, H. longissimus
and S. marmoratus (pers. obser.). The abundance of pelagic species was higher in the
artificial riprap of Madeira airport than in the rocky boulders bottoms of the fished and of
the protected natural location (UAC and GMR respectively). This has also been observed
by others authors studying artificial structures in other regions (Hindell et al., 2001). The
present results showed that the composition and structure of the fish assemblages from
rocky reefs in Madeira Island were significantly affected by the nature of the reefs
considered namely natural vs. artificial. The total number of species, total nectobenthic fish
abundance (i.e. excluding schooling species), frequency and size of some target species
were greater at natural (protected and unprotected) than in the artificial reef of the Madeira
airport riprap. The rubble mound of the airport riprap is made of natural rock, having
numerous shelter and holes (pers.obser.) which may explain the greater proportion of

Cláudia Ribeiro
116
juveniles fishes in ARMA. That fact, have also been referred in other artificial structures
(Anderson et al., 1989) and Burchmore et al. (1985) referred that pre-adult fishes are the
major colonist of artificial reefs in temperate oceans. The artificial rubble mound of
Madeira airport was deployed in order to increase Madeira Island airport. The airport
constructions were completed in 2000 and observations were made from 2002 to 2004,
thus in a relatively initial phase. Seasonal changes were clearly observed in the fish fauna
of ARMA, declining both the number of species and fish individuals in winter. In this case
the seasonal variation in number of species and individuals followed very closely the
seasonal changes in temperature.
Structures such as rock jetties “act” as an artificial reef and so that, the engineers
involved in design and construction of such structures should give some consideration to
designs that would maximize the benefits and minimize the adverse effects that such
projects may have in the biota and in the landscape of an area (Guidetti et al., 2002). Many
times, depths among jetties are too shallow to support large quantitaties of fishes, having
only limited amount of subtidal rocky substrate available. Thereby, a design that maximize
greater depth along the jetties, would allow greater quantities of fishes (Hastings, 1979).
As far as the trophic composition is concerned the reef fish assemblages had similar
structure in the different bottoms types. The dominant trophic guilds were carnivores and
omnivores at a lesser extent, whilst herbivores were misrepresented (both in species and
numerically). Generally, the omnivores and microcarnivores occurred with relative high
proportion, whilst herbivores, meso and macrocarnivores had very low number.
Differences among fish assemblages occurred in microcarnivores proportions between
locations, bottoms types and depth strata. This same pattern had also been referred to the
Macaronesia region, more specifically in Azores islands where Patzner and Santos (1993)
and Azevedo (1995, 2000) recognised the benthic microcarnivores as the dominant trophic
category in terms of species richness of its littoral fish fauna. In other regions with rocky
coastal reefs the dominance of carnivores in the fish communities was also demonstrated.
For instance, Valle et al. (2003), studying the icthyoufauna of the rocky littoral of Ceuta
(Spain: North African coast) find out that the dominating fish species were the mesophag
carnivores, and Guidetti and Bussotti (2000) studying nearshore fish assemblages
associated to shallow rocky habitats of the southern Croatian coast verified dominance of
carnivores in the whole assemblage, mainly microcarnivores.
The omnivore category was best represented in shallow depth strata and more
abundantly in GMR. Accordingly Floeter et al. (2004) in colder peripheral areas, such as
the Brazilian coast, Canaries or Mediterranean, the fishes feeding on intermediate-quality

Comparison of Rocky Reef Fish Communities Using Underwater Visual Techniques
117
food as the sparids omnivores have higher abundance and diversity than in warmer sites.
Thereby, suggesting that those fishes can exploit low-nutritional resources when they are
associated with substantial portions of highly digestible animal protein, fulfilling their
metabolic needs to live in harsh colder environments. Indeed, Bowen et al. (1995) referred
omnyvory as compromise strategy in which protein from scarce animal prey is
complemented by energy from abundant primary foods.
The herbivores were under-represented in the entire area of study, both in number
of species and abundance. The scarce algal cover in the Madeiran rocky reefs could be
considered as a factor for explaining the low abundance of herbivores in the area of study.
In effect, algal cover provide a structural habitat (Sala, 1997) or food source (Babcock et
al., 1999) for invertebrates, which are in turn preyed by fish (Hobson, 1974). The
herbivores (O. atlanticus and S. salpa) and mostly omnivores species (A. luridus, S.
cretense, O. melanura) presently recorded, had higher abundance in the shallow rocky
reefs, where in fact the main food item (algae and associated invertebrates) was more
abundant (pers. obser.). Hence, herbivorous fishes are generally restricted to shallow
environments (Lewis & Wainwright, 1985), closely linked with the distribution of algae,
wich are in turn highly dependent on incident light. Roving herbivores fishes were more
abundant in wall and platform bottoms, were usually was observed higher algal growth,
mostly in the vertical walls. Our results are in agreement with the results obtained by
Azevedo (1997), who referred the herbivores as the trophic category with lower number of
species and abundance. Moreover, Floeter et al. (2004) pointed that and although, some
fishes occupying cold water habitats are herbivores, the great majority of fishes belonging
to this category have tropical affinities since they found their optimal environmental
factors in the tropics. Meekan and Choat (1997) demonstrated that herbivorous fishes are
less abundant in shallow reefs of temperate region than in equivalent habitats of some coral
reefs and more recently findings suggested that the trend of herbivorous fish abundance
declining with the increase of latitude may be representative of a pattern that occurs in all
trophic groups of reef fish (Meekan & Choat, 1997). Accordingly Harmelin-Vivien et al.
(2001) the herbivorous fish species increase their richness towards the Equator and Floeter
et al. (2004), studying latitudinal gradients in atlantic reef fish communities referred that
relative abundance of fishes feeding on algae, organic detritus and sessile invertebrates
decreased from tropical to temperate latitudes, suggesting that differences were not due to
differences in abundance of food between latitudes, because algae and seagrasses are also
abundant and available for feeding in temperate zones, but probably could be driven by
algae productivity and rate of detritus decomposition higher in tropical reefs. Despite the

Cláudia Ribeiro
118
aforementioned, the misrepresentation of herbivores in the assemblages studied when
compared with other coastal assemblages from Macaronesia region as the Azorean
archipelago is still comparatively low. For instance Harmelin-Vivien et al. (2001) studying
the structure of fish assemblages on Azorean coastal rocky shores find out that herbivores
represented 9 to 15% of the fish abundance, specially dominated by S. salpa.
Although, some authors referred that there is no relationships between abundance
of herbivorous fishes and algal cover (Wellington & Victor, 1985; Chabanet et al., 1997),
the scarce algal cover of the inshore rocky reefs of Madeira Island seem to contribute for
the low number and abundance of herbivores species in the community. The huge amount
of soil that have been dumped directly to sea along Madeira shore or firstly to small
streams that crosses the island (see Madeira Island map water courses in Figure 4),
influence negatively the benthic communities in the rocky coastal reefs and also the
nearshore sandbottoms (e.g. seagrass meadows see Wirtz, 2005). Land dumping in the sea
causes a significant decrease of water visibility and clarity, consequently interfering in
algal growth and mortality and thereby in all food-chain. Besides, all sites studied had high
abundance of the sea-urchin D. antillarum (pers. obser.) with big areas of denuded bottom
caused by the intense grazing activity of the sea-urchin. This sea-urchin in Madeira Island
showed voracity in feeding on malcroalgae (Augier, 1985; Bianchi et al., 1998; Alves et
al., 2001; Alves et al., 2003) and the rocky reefs were modified to barrens which are
commonly observed in Madeira and Canarian archipelagos (Alves et al., 2001). Indeed,
sea-urchins have an important impact on the marine benthic communities, by leaving less
food available for the other herbivores and also reducing the dissolved organic matter
available for detritivores (Valentine et al., 1997). Depending on the composition and
abundance of the grazing invertebrates, it would be expected that areas dominated by rocky
substratum, as the presently studied, would present encrusting and turfing red algal
associations, which in turns would exert major influence on the associated fish fauna
(Choat & Ayling, 1987). According to Alves et al. (2003) the grazing pressure of D.
antillarum control the algal abundance in rocky substrates of islands such as Madeira,
Canaries and Cape Verde. Thus, the increase of this species density would not allow the
recovery of the benthic assemblages due its unselective grazing.
Future investigations need to include algal cover and sea urchins densities and other
possible variables that may influence the structure of the fish assemblages in Madeira
shores, as the case of number and size of refuges in rocky bottoms, current velocity, water
quality, fishing pressure (number of boats operating, types of gears used, etc.) and benthic
cover. Therefore, there’s a possibility that some of the observed differences in fish

Comparison of Rocky Reef Fish Communities Using Underwater Visual Techniques
119
assemblages among locations were a consequence of factors other than fishing pressure
(protection versus unprotected) such as the influence of benthic cover or habitat
topographic complexity.
The organization of fish species into mobility guilds allowed some interpretation in
terms of site fidelity, depths and types of bottoms. Indeed, the characterization of fish
spatial structure is very important since the benefits obtained from marine reserves depend
on fish mobility and on its interaction with fishing (Apostolaki et al., 2002). The short and
long terms benefits that emerge from marine reserves establishment depends on the type of
effort redistribution and fish mobility and the literature referred that mobility is generally
as an important criterion for determining species sensitivity to reserve status. The present
results showed that the spatial use and fish mobility of the fish assemblages were
dominated by species with schooling behaviour mainly in terms of abundance (category 1)
and also by cryptic and sedentary species (category 3). In the the neighbour archipelago of
the Canaries islands, Floeter et al. (2004) referred that category 1 was also proportionally
more diverse and achieved significantly higher relative abundance, whilst in the Azores,
Azevedo (1997) recognised the domain of benthic and sedentary species in a littoral fish
community of S. Miguel. Attending to the methodology used herein (visual censuses) it is
not surprising that category 1 was more frequent and abundant in the fish communities
sampled. For instance, Azevedo (2000) stated that visual counts clearly biased towards the
pelagic and/or more mobile species and so that the bias would be reflected in the perceived
spatial structure of the community when species are grouped into spatial categories.
Moreover, Willis (2001) referred that many fishes in category 3 are small and cryptic and
because of that are often underestimated by UVC. Nevertheless, in the present study the
category 3 represented a high proportion of the fish communities.
7.4 – Marine Protected area: GMR 7.4.1 - GMR species updating results No robust data or evaluation of protection effect of any component of GMR
resources has so far been done, neither studies to assess protection benefits on fishes and
remaining marine resources of the other three MPAs existing in Madeira Archipelago. The
results obtained presently for GMR complement the obtained by two other studies carried
in the same area (Delgado, 1998 and Mello, 2000). The ichthyofauna data obtained by both
studies was limited and both carried out in a short survey period. The list of fish species
from those two fish surveys is summarized in annex I.

Cláudia Ribeiro
120
Comparing the results obtained presently in GMR with the results obtained by
Delgado (1998) and Mello (2000) using visual transects there’s a qualitative similarity of
67% between the species list composition. Both authors reported 44 species belonging to
26 families with a similarity in species composition of 71% between the two works. Three
species were only sighted by Delgado (1998) namely Capros aper, Diodon hystrix and S.
mediterraneus and four by Mello (2000) (Mobula mobular, Remora remora, Phycis phycis
and Taeniura grabata). Other three: D. pastinaca, Heteroconger longissimus and M.
helena were recorded inside the reserve by both authors but not presently. All those
species, exception made for H. longissimus, had low values of sighting frequency and
abundance. The absence of the garden eel, H. longissimus from the present list was in fact
expected, because it is a sand-burrowed living species and the current work focused over
the coastal rocky reefs of the South coast of Madeira Island. The species D. histrix was
sighted several times, but in small numbers, during the visual survey performed by
Delgado (1998), whilst never seen by Mello (2000) and was never sighted in any of the
three locations surveyed in this study neither by Ribeiro et al. (1995) in Cais do Carvão
(see figure 1 in Ribeiro et al., 2005) nor in the remaining studies using visual surveys that
were performed in Madeira till date (Andrade and Albuquerque, 1995, Bianchi et al.,
1998). Moreover, Brito et al. (2002) in the catalogue of the Canary fish species referred the
species as rare to the Canaries archipelago, with only 5 records reported.
Pooling the fish species list obtained in this study with the obtained by the above-
mentioned authors, a total of 61 fish species are now reported to GMR. The overall species
list recorded inside reserve after this 2-year survey program added up 9 new species to the
previously lists. Some of them as D. gibbosus and Pagellus erythrinus are common species
in the Island coastal reefs (as can be seen in results), while others are more cryptic and
gregarious and obviously more difficult to be recorded (e.g. A. imberbis, B. podas, E.
anatina). Additionally, it was firstly recorded in GMR the gold spot goby, G. thompsoni a
species that was newly recorded to Madeira Island (Araújo & Freitas, 2002).
Accordingly Delgado (1998), the ictiological abundance inside GMR either in
terms of number of individuals as frequency of occurrence was mainly dominated by C.
limbata, B. boops, A. luridus, T. pavo, O. melanura and D. vulgaris. Moreover, Mello
(2000) also referred C. limbata, B. boops has the most abundant in the sites studied inside
the reserve, referring that both species generally reached up to 75% of the total individuals
observed and also referred as abundant the species: A. luridus, O. melanura, S. cretense.
Therefore the current abundance results obtained for GMR sustain the prior findings of
both authors, referring C. limbata, B. boops, A. luridus, T. pavo, S. cretense and D.

Comparison of Rocky Reef Fish Communities Using Underwater Visual Techniques
121
vulgarius as the five most abundant species inside reserve. However, it contrasted with
Delgado (1998) and Melo (2000) in what concerns the abundance of the pelagic sparids B.
boops and O. melanura since currently they did not show such abundance in the shallow
assemblages of GMR. In fact here, in terms of abundance in the shallow strata they were
“replaced” by A. luridus, T. pavo, C. limbata and S. cretense (see table XI).
Comparisons of fish densities between the present work and Delgado (1998) were
not possible since that survey did not presented density results. In the case of Mello (2000),
he pointed an increase of species density with the increase of distance to shore, which also
reflects an increase of depth. The same happened in this study, in fact depth was one of the
main factors structuring the fish communities in the three locations studied, either in terms
of abundance and number of species.
Despite the protection status of GMR, which was established twenty years ago, this
area of Madeira Island coast is still subject to many types of disturbances as remaining
island coast, exception made to fishing. Pressures includes: passing boats on the reserve
boundaries, occasional discharges of non-treated sewage, non-controlled discharge of land
and rubble in the shoreline and streams, illicit discharges from boats, diving, litter and
sediment disposal in the raining season that causes environmental degradation (Mendes et
al., 2000). The lack of resources to contend the marine pollution and inefficient
enforcement contribute to this situation that still happens. Although, there is no available
data allowing us to estimate the liquid effluent, the atmospheric pollutants, solids and oil
used that came out from boats, it have been assumed that values did not reach levels to
worry about, due to the features of our fishing fleet. Nevertheless, the lack of knowledge
and control of the situation can underestimate the quantitative, pointing to the fact that
some attention should be taken over boats that crosses Madeira waters that many times
escape to surveillance and enforcement by the scarce resources of the Portuguese navy
(Mendes et al., 2000).
The sewage outfall of Funchal city is located inside GMR, discharging nearshore
inside reserve boundary at 50 m depth around 600 meters offshore. This is obviously
contrary to the goals of tourism and environmental conservation purposes of a protected
area. The outfall serves the population of Funchal having a discharge mean volume of
22.000 m3 per day (Mendes et al., 2000).

Cláudia Ribeiro
122
7.4.2 - Reserve effect Biodiversity enhancement has been touted as one of the many functions of full
reserves. However, there’s still only few scattered examples (Wantiez et al., 1997; Russ &
Alcala, 1998) and some authors have argued that species diversity or species richness is
only weakly correlated with reserve protection (Jouvenel & Pollard, 2001). Comparisons
of the three locations studied, i.e. of rocky boulders fish assemblages, did not evidently
demonstrated the reserve effect in GMR as for other MPAs elsewhere in the world (Bell,
1983; García-Rubies & Zabala, 1990; Francour, 1991; Harmelin et al., 1995), since neither
total number of species, species richness or total density of the fish communities inside
reserve was significantly higher than in the unprotected (natural and artificial) locations
studied.
The reserve effect manifestates in both quantitative (increase of abundance and of
average and maximum individual size) and behavioural aspects (changes in spatial
distribution) (Harmelin et al., 1995). Thereby, an increase of abundance and/or biomass of
target and total species abundance is expected within MPAs due the protection of critical
spawning stock biomass from fishery harvesting (Bohnsack, 1996). In MPAs, the chief
benefits of protection are most striking for commercial species subject to heavy fishing and
therefore the most substantial evidence from protection effects can be achieved if sampling
effort is focused on target species (Harmelin et al., 1995). Indeed, Dugan and Davis
(1993), studying marine parks and reserves concluded that higher abundance of target
species within protected areas was the most detectable effect when assessing protection
effect and Mosquera et al. (2000) referred that patterns of greater fish density inside MPAs
is much clearer when analysis fall upon target fish. Westera et al. (2003) referred that
recreational line fishing alone may, in some cases, be sufficient to alter the composition of
targeted species and Jouvenel and Pollard (2001) have referred that species which are
particularly targeted by spearfishers may tend to avoid the more heavily fished areas,
which commonly lie at shallower depths. Furthermore, and although the responses to
protection are highly variable among fish taxa, the fishery targeted species respond
significantly better than non-targeted species (Côté et al., 2001). Numberous studies have
explored the effect of fishing prohibition within marine reserves, as a human factor most
likely to influence fish communities and found that generally the abundance, biomass and
mean size of exploited fish populations were higher within protected areas than in nearby
non-reserve areas (Bell, 1983; García-Rubies & Zabala, 1990; Francour, 1994; Russ &
Alcala, 1998). However, some studies have found little, if any differences between fished
and protected areas (e.g. Roberts & Polunin, 1992; Samoilys, 1998). Moreover, non-

Comparison of Rocky Reef Fish Communities Using Underwater Visual Techniques
123
targeted species appear either not to respond to protection (Jennings et al., 1995) or
respond negatively showing reduced abundances, perhaps in response to greater predator
pressure within reserves (Letourneur, 1996).
The present results showed that some of the benthic and nectobenthic species,
mostly the fishery targeted species had higher abundance inside reserve that at the fished
sites, although some of them did not contribute greatly for total fish assemblages
abundance. Fishery targeted species in Madeira Island are generally large carnivores as M.
fusca and E. marginatus, species that belong to the Serranidae family, very captured by
spear-fishers and thus most sensitive to protection and usually presents global indices
significantly higher inside reserves. Other species targeted by recreational angling fishery
and spearfishing are the scarid, S. cretense, breams (Diplodus spp.) and red porgy, (Pagrus
pagrus) nectobenthic species that present moderate to large home range (Harmelin, 1987),
which are frequent habitants on the rocky coastal reefs of Madeira Island. They were in
general well priced species, highly valued for taste or texture. According to Bayle-Sempere
and Ramos-Espla (1993) and Harmelin & Bachet, (1992) sargo breams can have particular
value as bio-indicators of fishing pressure, however in the present case, there contribution
for the total fish abundance was not significant.
Particularly the parrotfish, S. cretense and the big grouper, M. fusca, clearly showed
higher mean abundance inside the reserve in all bottom types sampled. Both species had
higher abundance, frequency of occurrence and size distribution inside the reserve than in
the unprotected locations. In the case of the parrotfish, bigger differences occurred between
locations within the shallow depth range and its contribution for total fish assemblage
abundance was greater inside the reserve than in the fished locations. The big grouper, M.
fusca, a very important species in terms of commercial value, presented higher mean
abundance inside GMR and higher sighting frequency, being almost absent from the reefs
sampled in the two unprotected locations. A discriminant analysis suggested a positive
response to protection from species such as S. cretense, C. limbata, M. fusca and Diplodus
spp. Additionally, the sighting of the dusky grouper, E. marginatus inside GMR is
noteworthy due to its rarity along the sampled sites. The species was only recorded inside
GMR, though recorded few times and in small number (always one single individual). It
has been referred by other authors that dusky groupers were usually more abundant at
protected sites (García-Carton et al., 2004). The third member of the Serranidae family,
observed in the present study, S. atricauda occurred with higher percentage values and
more abundantly inside the reserve than in the other two locations, although never reached
significant values on the total fish assemblage (always a relative abundance less than 1%).

Cláudia Ribeiro
124
In other regions higher abundances of targeted fish species were
documented inside protected areas. For instance in the neighbour Canarian archipelago,
Tuya et al. (2006) referred that S. cretense was the only species that clearly benefited from
protection measures, showing a clear gradient of abundance and total biomass increasing
as the level of protection increases.
The protection effects over the total fish density inside GMR could be considered
negligible. The increase of fish species density inside reserves is more controversial
(Samoilys, 1998). For instance some authors (Russ, 1985; Alcala, 1988) have shown that
density of the main explored families were significantly higher inside reserves. Bohnsack
(1982) observed an increase of density in a reserve in Florida after 21 years of protection,
but Guidetti et al. (2005), surveying shallow rocky habitats in the northern Adriatic Sea
verified that total fish density did not differed significantly between protected and fished
areas. Samoilys (1998) in Kenyan coast did not showed significant differences of densities
between reserve zones and fished zones for some families of commercialized fishes
(Serranidae, Lethrinidae, Lutjanidae); the same happened with Roberts and Polunin (1992)
in the Red sea, for the same previous families and for the Acanthuridae and Scaridae. In
New Caledon, Sarramégna (2000) showed significant differences in density of certain
commercialized Serranidae and Acanthuridae and Chateau and Wantiez (2005) verified the
same effects for the main explored families, showing that mean species richness per station
was significantly more important inside reserve for the main commercialized species,
namely Serranidae, Labridae and Siganidae. Additional information from recent study,
using meta-analytical techniques that compared data from 19 marine reserves through the
world (Côté et al., 2001) referred that the effect on fish abundance is highly variable
relating to factors such as intensity of exploitation outside protected areas, variation in
enforcement efficiency and habitat characteristics. Moreover, time of recovery for
populations that have been impacted by harvesting or other human perturbations in regions
where the productivity of the waters is less, markedly oligotrophic as the case of Madeira
Island, will be longer than in a region with higher productivity (Francour et al., 2001). In
the present study just the total demersal fish abundance of rocky boulders reefs showed
higher average values inside the reserve, whilst remaining rocky reefs (wall and platform)
both, overall and demersal fish abundance was in average higher at the fished location.
A general benefit of protection in fish assemblage is the restoration of an
equilibrated assemblage structure with “normal” proportions of large adults and of high-
level of predators inside marine reserves (Harmelin et al., 1995). It is actually well known,
that protection effect may affect size distributions of fish populations, with larger

Comparison of Rocky Reef Fish Communities Using Underwater Visual Techniques
125
individuals of targeted species more abundant inside reserves than in fished areas. GMR
was established for stock maintenance and conservation reasons and for some of the fish
species observed in this study it appeared to develop the reserve effect. Although the
present results showed that the temporal trend in species richness was not affected by
reserve effect; some of the sites examined inside GMR have to some extent met the
objectives of reserve creation, sustaining higher number of matured-sized fish with higher
frequency and abundance of medium and large fish individuals and thus showing potential
spawning stock. In general, the rocky reefs inside reserve were composed by a general
dominance of medium-large sized specimens. The reserve creation increase time-living of
fishes cancelling fish mortality due fishing as spear-fishing (Buxton, 1993), which is a
common practice on coastal reefs and in Madeira shores, focusing mainly big individuals.
This general trend can be attributed to the lack of fishing impact inside MPAs (García-
Rubies & Zabala, 1990; Harmelin et al., 1995), but the processes regulating biomass and
more particularly relating size in fish communities are very complex and may vary with
habitat type, local productivity and by indirect impacts caused by changes in trophic
interactions (Macpherson et al., 2000). The difference on size distribution of fish
populations between protected and unprotected marine areas have been commonly reported
in other regions such as the Mediterranean (García-Rubies and Zabala, 1990, Harmelin et
al., 1995; Macpherson et al., 2000; Macpherson et al., 2002), however it is not universal
and there’s also comparisons of communities inhabiting disturbed and undisturbed rocky
sites that not displayed differences respecting global size spectra (Macpherson et al.,
2002).
MPAs, regardless their size and with few exceptions, are known to increase density,
biomass, individual size and diversity in all functional groups (Halpern, 2003). However,
these expected protection effects not always are evident, mostly in temperate regions
where many fish species range over considerable distances and use a variety of habitats.
Indeed, Bohnsack (1993) referred that marine reserves are best suited to protect species
characterized by a certain restriction of movements, which is the case of reef fishes and is
largely recognized that migrating species such as tunas or more ‘regional’ migrating
species such as sardines are more unlikely to be effectively protected by marine reserves
than reef fishes. Furthermore, there is a debate over whether MPAs can outperform
adequate control of fishing effort as a management measure. A study performed by Dufour
et al.(1995) within a MPA in Cérbère-Banyuls (Meediterranean) revealed an unclear
response after 10 years of protection regime, registering a decrease of total abundance in
the reserve whereas it was maintained outside. Roberts and Polunin (1992) in a marine

Cláudia Ribeiro
126
park in the Red Sea verified that several common target species did not differ in term of
abundance among fishing levels and in the same way regarding species richness. Roberts
(1994) found out that index per count did not differ between fished and unfished zones in
Saba marine reserve (Netherland, Antilles). Moreover, some literature data suggest that
species richness is generally greater in MPAs than in fished areas, while the outcomes
concerning total abundance are often unclear and displaying a wide variability among
MPAs (Mosquera et al., 2000).
Clearly community analyses based only on the fish mean abundance may be
misleading in terms of the biological importance of the various species (Bohnsack &
Bannerot, 1986) and thus, comparisons among protected and unfished areas must be based
on statistical tests able to distinguish from ”normal” variability the influence of
management (Allison et al., 1998). That variability may be caused by non-exclusive causes
as large-scale climatic differences, changes in habitat availability, food, spatial variability
of larval dynamics and recruitment among others. Furthermore, one of the major goals in
ecology is to understand the ecological nature of the natural and/or anthropogenic
processes involved in this variability (Tuya et al., 2006a).
The above issues suggest that MPAs have potential to enhance fish abundance,
even within a small MPA as GMR. Nevertheless, when evaluating the effect of fishing and
other human factors such as marine pollution the temporal variability have to be
considered in order to avoid confounding (García-Carton & Perez-Ruzafa, 1999). In that
sense, sampling and monitoring design must involve considerable replication in space and
time, increasing the number of samples and/or the spatial replication with nested factors
that facilitate interpretation of possibly spatial heterogeneity of fish populations at different
spatial scales. Thereby, one of the goals of this study was to characterize the rocky reefs
fish communities of GMR after many years of protection, identifying the trends and
changes and thus select communities parameters and techniques for future monitoring
program ofthese fish communities. The fish assessment using the visual census techniques
proved to be useful to obtain data on the structure of fish communities. Additionally,
further studies on the effect of GMR can be helped using the data set obtained presently in
order to optimise sampling designs through simulation and improving the capability of
sampling design to detect impacts of specified magnitude.
Marine reserves provide broader benefits than the features mentioned above and the
success of MPA creation depends not only on the analysis of its ecological and economic
resources, but also on the management of the existing human activities and those that could
potentially be developed in the future (Francour et al., 2001). Indeed, there is a recognition

Comparison of Rocky Reef Fish Communities Using Underwater Visual Techniques
127
that marine reserves can provide a range of nonmarket values, but research quantifying
those values is limited (Rudd et al., 2003) and in the case of MPAs in Madeira Archipelago
is totally null.
In a region where tourism is a main ‘product’ and where marine tourism potential
exist, which is the case of Madeira Island, the nonextractive economic value provided by a
rapid build up of icon species within marine reserves may provide important short-run
economic benefits for local communities as in other parts of the world (Halpern, 2003). It
is known that divers and snorklers often prefer viewing “big stuff” and iconic species
(Williams & Polunin, 2000) as the big groupers (e.g. E. marginatus), labrids (e.g. B.
scrofa) that are more often observed inside reserve and in that way helping to bridge any
possible gap until-term benefits become apparent. Thus, scuba diving is an activity that can
benefit a lot on the creation of GMR. In fact there´s one diving center in the GMR, that
attract numerous divers, which is the first and unique diving center in the atlantic with a 5-
star DIN-EN certification (see www.mantadiving.com).
It is known that biological and ecological consequences of protection measures
attract numerous divers that come to a MPA looking for an underwater spectacle, which
they are rarely able to observe elsewhere, in the case of GMR the dusky grouper is one of
the “main attractions”. Many economic studies carried out indicated that MPAs have
generated a very active underwater tourism industry, demonstrating the importance in
terms of returns to a region, either directly (e.g. diving activities, accommodation, meals)
or indirectly (transportation, materials, etc.) (Ribeira Siguan, 1992). Pleasure boating can
also benefit from the image offered by a MPA, since they can use their boats to come and
practice specific activities in the protected areas as the case of snorkelling, sea watching,
scuba diving or even simply enjoy the setting. Furthermore in recent years there has been
an increase in the number of pleasure boats operating in the island (see
www.venturadomar.com). However, in Madeira Island no studies assessing possible
economics benefits from reserves creation were till date performed.
The placement of a MPA close to a large urban area as GMR which is next to
Madeira main town it is not necessarily a handicap. Francour et al. (2001) argue that
pressure of human uses on areas adjacent to MPAs are generally higher and less seasonal
than in MPAs located far from urbanized areas where more intense and constant
surveillance efforts are required. Additionally, benefits in terms of societal returns,
particularly through education (e.g. classes of schoolchildren routinely organized at the
MPA seaside) can be more evident in this type of MPA, which is reflected by the
numerous visits of schoolsto GMR.

Cláudia Ribeiro
128
Many of the marine species are presently endangered and some, actually prone to
extinction. Little or no attention is given to the need of protecting all species equally if
biodiversity as a whole is to be maintained (Bianchi & Norri, 2000). Every species
contribute to biodiversity but, it’s no possible to protect all of them individually. Laws
have been designed to protect threatened and endangered species, but experience has
shown that species are effectively preserved if attention is paid to habitats (Vanderklift et
al., 1998). However, the link between habitats protection and species is difficult and not
always is evident that protecting species and habitats are the two sides of the same coin.
Thus, in order to preserve biodiversity, MPAs should be large enough to assure the
occurrence of the largest number of species possible, whilst single and isolated reserves
should result inadequate. Protected areas must be seen as selected sites where natural
change can freely play its role, not as sites where nature is “conserved” as it stands.
Results from this study support the idea that the design of even the smallest reserve
should incorporate various habitat types to enhance reserve function. Maximize a variety
of habitats within a MPA will add value to any management plan by increasing the overall
diversity of species protected. Efficient monitoring of Madeira Island coastal reef fishes
should be performed routinely by a team of diving scientists and further with staff of
“Parque Natural da Madeira” inside the marine reserves (GMR, Desertas, Selvagens,
Rocha do Navio - Figure 1 and Figure 3 ), using censuses methods. Besides enabling the
evaluation of fishing on near-shore fauna and the efficiency of conservation policies the
MPAS are argued to be most relevant for long-term visual observations of natural changes
among fish assemblages (Harmelin, 1999). Despite the fact that rather simple and crude
measures, the total field effort involved in this study was intense, and the cost of collecting
more data to generate a more fully basis was prohibitive and impossible for us. The data
obtained here provide a basis that firstly assess the effect of GMR creation and can be
considered as a first point after the implementation of the protection regime. Further
monitoring of the ichthyofauna and of remaining marine benthic resources as algae and
molluscs to be compared with nearby locations is therefore needed to elucidate the real
conservation value of such an area. Indeed, the MPAS in Madeira has much interest, since
can act as models of small MPAS in a small island as Madeira, surrounded by zones with
strong human pressures. In future, adding other measurements of reef complexity as
number of holes, rugosity would probably provide estimates that could give extra
information to this approach. Additionally, monitoring fish assemblages together with
benthic fauna could prove a useful refinement to a management programme.

Comparison of Rocky Reef Fish Communities Using Underwater Visual Techniques
129
7.4.3 – GMR Management Implications Management of natural areas includes the establishment of regulations and
interventions into the environment in order to obtain a desired outcome, e.g. the increase of
abundance of vulnerable species. Managerial and regulatory decisions are a form of
experiment, although they are usually made and executed without appropriate measures
and controls, so it is difficult to determine whether they cause the expected effects.
Therefore, treating managerial decisions as experiments would provide reliable
information on their effects and therefore serve to improve management (Underwood,
1994).
Results obtained presently raise several points related to the current debate on
efficiency of application of MPAs in Madeira Island. GMR was established with the aim of
stopping the progressive desertification of coastal sea floors in Madeira Island and
therefore to have a function of fish nursery and thus contributing to the resettlement of the
fauna on bordering areas.
The control of different human activities which are either allowed or prohibited
within a protected area constitutes a major source of problems for managers of MPAs. For
each activity, the repercussions on the environment, the conflicts generated and the
solutions adopted to regulate these problems depend upon the past and current context of
the MPA and on the regulatory tools managers’ disposal. Obviously, the level of
community capacity and state capacity in a region will substantially influence marine
reserves effectiveness and efficiency, i.e., the ability to use social capital for mutually
beneficial collective action and the ability of government to provide public goods, assuring
that property rights are honoured. Both are necessary to derive full benefits from marine
reserves and according to Rudd et al. (2003) when one or both components of the equation
is missing, other policy tools than marine reserves will be more efficient.
Unfortunately, the presence of staff in field, which is essential for the credibility of
a protected area is rarely easy to assure (Francour et al., 2001) and Madeira Island is no
exception. This task, demands a regular availability and string motivation of the staff, but
many times numbers are limited. Management plans should take into account these
imperatives with distribution and choice of personnel and training needs. However, MPAs
are rarely directed by a scientist person with extensive ecological and/or biological training
(Francour et al., 2001) and again GMR is no exception, since the person in charge has no
ecological/biological formation. Actually, managers of most MPAs are often primarily
administrators. Moreover, the functioning of a protected area involves the input of
scientific information and ongoing evaluations on the state of the environment. However,

Cláudia Ribeiro
130
the studies performed in GMR till date were only punctual, both developed by graduate
students and not by a team or staff of GMR. The work should be programmed and
supervised by a scientific steering committee with an active cooperation between this
committee and the MPA staff in order to ensure the efficient science-based management of
the MPA. Even when the work has to be undertaken by scientifically qualified teams from
outside, it seems important that the MPA should include amongst its personnel a scientist
of high standing who takes charge of that part of the work that involves monitoring of the
environment and its biological evaluation, and that all of the field personnel are involved in
this aspect of adaptative management (Francour et al., 2001). Indeed, Agardy (1997)
highlighted that “rather than administrative commitments to MPAs and strong capacities
for managing marine areas, the most important factor whether or not a MPA will be
successful and beneficial is the presence of a dedicated individual or group of individuals
to carry it forward”.
Tourist activities inside protected areas are more difficult to control when involve a
full spectrum of mass tourism and mainly if the development of these uses has not been
previously predicted by a managing plan (Francour et al., 2001). Nonetheless, tourism in
Madeira Island is not of that type, but still GMR managers have to be aware of the adverse
repercussions of diving, as have been happening in other parts of the world (e.g. Medes
Islands - Spain). Thereby, is important to develop a reserve management plan sought to
regulate diver’s visits and rules or lines to diver’s behaviour, as well distribute divers
throughout reserve spots. It is reasonably possible to limit negative aspects of underwater
tourism through diver’s education, controlling diver’s access to the most vulnerable sites in
the protected area. Actually, the concept of a code of user behaviour is an important
element for reducing the possible risks of degradation of certain fragile species, revealing
that “users” education is a primary factor in the successful management of diving in MPAs
(Davis & Tisdell, 1995). This has been achieve in several marine reserves has the case of
Port-Cros National park (France, Mediterranean) by means of courses, booklets and with
free movie distributed to every club and group of users (Francour et al., 2001).
The precautionary principle in relation to the eventual degradation of the habitats
due diving has induced MPA managers to propose quotas on divers. That can be a source
of conflict but are reasonably easily enforced when they apply to dives organized by clubs
and where the search by divers is still relatively small as in Madeira Island. The quota can
limit either the number of clubs with access to the zone and or the number of divers. In the
case of individuals divers that control is more difficult to implement and can involve a
procedure of individual authorization that must obtain before diving. This permit can be

Comparison of Rocky Reef Fish Communities Using Underwater Visual Techniques
131
attached to divers buoy and the numbers of divers can thus be theoretically regulated over
any specific period of time (Francour et al., 2001). So considering the precautionary
principle, managers of GMR could establish the following regulations: 1) a number limit of
dives per day; 2) control dives; 3) identifying dives spots with moored buoys where dives
are possible to do. The buoys should be placed basing on spatial distribution of diving
activity and consequently GMR managers should communicate frequently with SCUBA
diving operators in the reserve. Simultaneously an amount of effort should be invested in
improving visitor information with the production of well ilustred coulered notices and
various brochures outlining the natural heritage values of the area and the damage that can
be caused by over-use as been done in other reserves (Francour et al., 2001).
Evident form of degradation observed in MPAs are those resulting from the
anchoring boats, which coupled with the difficulty in controlling tourist influx are
problems recognized by many MPA managers. In that sense limitation of itinerant
anchoring is a current priority and so that prevent that type of damage, the installation of
surface buoys is recommended due the fact that considerably diminish harm to sea floor. In
other hand the limitation of solid or liquid wastes coming from boats is a much more
difficult problem to manage and often neglected (Francour et al., 2001) and should also be
taken in consideration in GMR.
Analysis of management problems show that surveillance proves very frequently to
be of major concern because of the small number of permanent staff involved in
surveillance activities. Furthermore, these problems can be reinforced by factors such as
the mixture of usages (allowed and prohibited activities), which is the case of GMR, that
implies closer surveillance to distinguish for example between a snorkeller (allowed) and
spear-fisherman (prohibited). Generally, the success of a MPA can in fact generate an
increase in the level of tourist use and thus problems of surveillance and management can
thereby increase proportionally. Conversely in situations of heavy usage, poaching may be
less likely. Besides that, the occupations of surveillance staff with other tasks, often
administrative or terrestrial, can reduce the time dedicated to be in the sea (Francour et al.,
2001).
Investigation of further aspects in MPAs establishment (e.g. location, shape)
require a true spatial model, which in turns includes data on habitat richness, ocean
currents and other factors affecting species distribution and interactions. In the mean while,
our study can be used to establish the first data-set on GMR fish and to investigate the
effects of this MPA comparing with the other two locations studied.

Cláudia Ribeiro
132
7.5 – Madeira coastal fish communities:Implications for management
Fish diversity and distribution in the rocky reefs of Madeira coast seemed to be
very similar and predictable, which is valuable information in order to optimally manage
local resources. In the case of the Canary archipelago, Falcón et al. (1996) referred that the
a significant portion of the fish community associated to hard-bottom littoral areas of the
Canary Islands could be classified as generalists and thus evaluations of their abundance
are not likely sensitive to small or gradual changes in the local environmental conditions.
In some extent, the most abundant species observed in this study were in some degree
generalists, tolerating some habitat variations. Nevertheless, as suggested by Bortone et al.
(1991) and Falcón et al. (1996) for the Canary Islands a future research should evaluate
ecological limits and tolerances of individual’s species as well as their responses to
specific habitat alterations in order to fully assess the potential impact that changes in the
nearshore ecosystem may have.
Although, our observations provide a baseline for ecological management purposes,
it is essential that further quantitative studies be conducted on densities and size structure
of species, as well in settlement and recruitment processes to fully identify the resources of
this marine reserve and the others existing in the archipelago as in other unprotected
locations along the shore. The apparent temporal persistence of several guilds as the case
of trophic guilds structure, suggest that this parameter provide a useful tool for monitoring
ecossystem change. Species richness and abundance differed among depth strata, always
higher in the deep interval, indicating that these community measures are useful features to
discriminate depth strata. Few sites and locations with rocky reef communities in Madeira
Island were investigated in this study, thus, conclusions must be limited to them with no
relevance for the conservation value of the coastal sand bottoms, were extraction activity
occur along the southwest coast of the Island, neither for more deep-water communities.
However, the findings emerging from the present study are almost certainly broadly
applicable to the remaining coastal rocky reefs in Madeira Island, which are common
coastal marine habitats in the island and consequently very affected by anthropogenic
activities and for that reason were the subject of this study.
The paucity of information on reef fish communities of Madeira Island can be
highlighted as a failure in the establishment of the effects of human activities on coastal
reef resources. Therefore, the combination of this results with previous works made in the
Island (Augier, 1985, Andrade & Albuquerque, 1995; Bianchi et al., 1998; Delgado, 1998;

Comparison of Rocky Reef Fish Communities Using Underwater Visual Techniques
133
Mello, 2000; Ribeiro et al., 2005) contribute to broaden our understanding of the coastal
reefs communities of Madeira Island.

Cláudia Ribeiro
134
ACKNOWLEDGMENTS This work was funded by the Portuguese Science Foundation (FCT) PhD grant
SFRH/BD/5307/2001. I’m gratefully acknowledge the logistical support provided by
Estação de Biologia Marinha do Funchal – Museu Municipal do Funchal, namely the
director Manuel Biscoito and all the people that directly or indirectly collaborated in the
present study. Special thanks to Luís Costa my dive buddy and to Leone. Thanks to
Manfred Kaufman from Madeira University in providing the equipment for nutrients and
chlorophyll a analysis and all the suggestions along the work. In fieldwork special thanks
for the assistance provided by the staff of Garajau Marine Reserve – Parque Natural da
Madeira, Galo Resorts and Aeroportos e navegação aérea da Madeira, S.A. (ANAM) .
Thanks to José Azevedo, Rodney Rountree for exchanging ideas. Thanks for providing
literature references to: Bayle-Sempere, David Mouillot, Fernando Tuya, Ignacio Lonzano
and Laurent Wantiez. A special thanks to my both Advisors Armando Almeida and George
Sedberry, for all support and help to achieve this step. Thanks to my friends: Raquel,
Luisa, Rosa, Telma, Micaela. Finally a special thanks to my sister and brothers and to
Arlindo and my parents that supported my choices.

Comparison of Rocky Reef Fish Communities Using Underwater Visual Techniques
135
REFERENCES Ackerman, J.L. & D.R. Bellwood, 2000. Reef fish assemblages: a re-evaluating using
enclosed rotenone stations. Marine Ecology Progress Series, 206: 227-237. Agardy, T., 2000. Information needs for marine protected areas: scientific and societal.
Bulletin of Marine Science, 66: 875-888. Agardy, T.S., 1997. Marine Protected Areas and Ocean Conservation. R.G. Landes
Company, Texas, 244 pp. Alcala, A.C., 1988. Effects of protective management of marine reserves on fish
abundances and fish yields in the Philippines. Ambio, 17: 194-199. Alevizon, W., R. Richardson, P. Pitts & G. Serviss, 1985. Coral Zonation and patterns of
community structure in Bahamian reef fishes. Bulletin of Marine Science, 36: 304-318.
Allison, G.W., J. Lubchenco & M.H. Carr, 1998. Marine reserves are necessary but not sufficient for marine conservation. Ecology Applied, 8: 79-92.
Alves, F.M., L.M. Chícharo, E. Serrão & A. D'Abreu, 2003. Grazing by Diadema antillarum (Philippi) upon algal communities on rocky substrates. Scientia Marina, 67: 307-311.
Alves, F.M.A. & C.M.A. Alves, 2002. Two new records of seabreams (PISCES: SPARIDAE) from the Madeira archipelago. Arquipélago. Life and Marine Science, 19A: 107-111.
Alves, F.M.A., L.M. Chícharo, E. Serrão & A.D. Abreu, 2001. Algal cover and sea urchin spatial distribution at Madeira Island (NE atlantic). Scientia Marina, 65: 383-392.
Anderson, T.W., E.E. DeMartini & D.A. Roberts, 1989. The relationship between habitat structure, body size and distibution of fishes at temperate artificial reef. Bulletin of Marine Science, 44: 681-697.
Andrade, C.A.P. & F.M.M. Albuquerque, 1995. Fish assemblages associated with bottom habitats on the South coast of Madeira. Boletim do Museu Municipal do Funchal, Sup. nº 4: 9-20.
Andrade, C.A.P., M.E. Pereira de Gouveia & G.R. Sedberry, 1998. Phenotypic variations in single stock wreckfish, Polyprion americanus (Teleostei: Polyprionidae) from the Northeast atlantic. Boletim do Museu Municipal do Funchal, Sup. nº 5: 27-34.
Andrew, N.L. & B.D. Mapstone, 1987. Sampling and the description of spatial pattern in marine ecology. Oceanography Marine Biology Annual Revue, 25: 39-90.
Angel, A. & F.P. Ojeda, 2001. Structure and trophic organization of subtidal fish assemblages on the northern Chilean coast: the effect of habitat complexity. Marine Ecology Progress Series, 217: 81-91.
Apostolaki, P., E.J. Milner-Gulland, M.K. McAllister & G.P. Kirkwood, 2002. Modelling the effects of establishing a marine reserve for mobile fish species. Canadian Journal of Fisheries and Aquatic Sciences, 59: 405-415.
Araújo, R., A.J. Almeida & M. Freitas, 2005. The impact of the oil spill of the tanker "Aragon" on the littoral fish fauna of Porto Santo (NE Atlantic ocean) in 1991 and ten years later. Bocagiana, 217: 1-8.
Araújo, R. & R. Calado, 2003. Crustáceos decápodes do Arquipélago da Madeira - Biodiversidade Madeirense: Avaliação e Conservação. Funchal, 236 pp.
Araújo, R. & M. Freitas, 2002. First record of the Goldspot goby Gnatholepis thompsoni Jordan, 1904 (PISCES: Gobiidae) in Madeira Island (NE Atlantic Ocean). Bocagiana, 209: 1-4.
Arruda, L.M., 1997. Checklist of the marine fishes of the Azores. Arquivos do Museu Bocage, Nova Série, 3: 13-164.

Cláudia Ribeiro
136
Augier, H., 1985. Premiere contribution a l'étude et a la cartographie des biocenoses marines benthiques de l'ile de Madère. Boletim do Museu Municipal do Funchal, 37: 86-129.
Azevedo, J.M.N., 1995. Food web of the Azorean shallow water marine ichthyological communities: a guild approach. Boletim do Museu Municipal do Funchal, Sup. nº 4: 29-53.
Azevedo, J.M.V.O.N., 1997. Estrutura de uma comunidade ictiológica do litoral da Ilha de São Miguel (Açores): Caracterização e variações espaço-temporais. Tese de Doutoramento, Universidade dos Açores, 178 pp.
Babcock, C., S. Kelly, N.T. Shears, J.W. Walker & T.J. Willis, 1999. Changes in community structure in temperate marine reserves. Marine Ecology Progress Series, 189: 125-134.
Bacallado, J.J., T. Cruz, A. Brito, J. Barquin & M. Carrillo, 1989. Reservas Marinas de Canarias. Consejeria de Agricultura y Pesca, Gobierno de Canarias, Tenerife, Canary Islands, 200 pp.
Báez, M., 1993. Origins and affinities of the fauna of Madeira. Boletim do Museu Municipal do Funchal, Sup. nº2: 9-40.
Báez, M. & L. Sánchez-Pinto, 1983. Islas de fuego y agua. Canarias, Azores, Madeira, Salvajes, Cabo Verde. Macaronesia. Las Palmas de Gran Canaria, 184 pp.
Ballantine, W.J., 1999. Marine reserves in New Zealand: the development of the concept and the principles. Pp 3-38. In: International Workshop on Marine conservation Korean Ocean Research and development Institute, Cheju Island, Korea.
Barans, C.A. & S. Bortone, 1983 The visual assessment of fish populations in the Southeastern United States. Pp 51. South Carolina Wildlife and Marine Resources Department Marine Resources Division and American Fisheries Society, Southern Division Marine and Estuarine Resources Comittee.
Bardach, J.E., 1959. The summer standing crop of fish on a shallow Bermuda reef. Limnology Oceanography, 4: 77-85.
Baron, R.M., L.K.B. Jordan & R.E. Spieler, 2004. Characterization of the marine fish assemblage associated with the nearshore hardbottom of Broward County, Florida, USA. Estuarine, Coastal and Shelf Science, 60: 431-443.
Bell, J.D., 1983. Effects of depth and marine reserve fishing restrictions on the structure of a rocky reef fish assemblage in the North-Western Mediterranean sea. Journal of Applied Ecology, 20: 357-369.
Bell, J.D., G.J.S. Craik, D.A. Pollard & B.C. Russel, 1985. Estimating length frequency distributions of a large reef fish underwater. Coral Reefs, 4: 41-44.
Bell, J.D. & M.L. Harmelin-Vivien, 1983. Fish fauna of French Mediterranean Posidonia oceanica seagrass meadows. 2. Feeding habits. Tethys, 11: 1-14.
Bellwood, D.R., T.P. Hughes, C. Folke & M. Nystrom, 2004. Confronting the coral reef crisis. Nature, 429: 827-833.
Bennett, W.A. & P.B. Moyle, 1996. Where have all the fishes gone? Interactive factors producing fish declines in the Sacramento-San Joaquin estuary In San Francisco Bay: the ecosystem. Pp 519-542. In: Hollibaugh, J.T. (eds), American Association for the Advancement of Science, Pacific Division, San Francisco.
Bevilacqua, S., A. Terlizzi, S. Fraschetti, G. Fulvio Russo & F. Boero, 2006. Mitigating human disturbance: can protection influence trajectories of recovery in benthic assemblages. Journal of Animal Ecology, 75: 908-920.
Beyhl, F.E., B. Mies & P. Ohm, 1995. Macaronesia - A biogeographical puzzle. Boletim do Museu Municipal do Funchal, Sup. nº 4: 107-113.
Bianchi, C.N., R.J. Haroun, C. Morri & P. Wirtz, 2000. The subtidal epibenthic communities off Puerto del Carmen (Lanzarote, Canary Islands). Arquipélago, Sup. nº 2 (Part A): 145-155.

Comparison of Rocky Reef Fish Communities Using Underwater Visual Techniques
137
Bianchi, C.N. & C. Morri, 2000. Marine biodiversity of the mediterranean sea: situation, problems and prospects for future research. Marine Pollution Bulletin, 40: 367-376.
Bianchi, C.N., C. Morri, G. Sartoni & P. Wirtz, 1998. Sublittoral epibenthic communities around Funchal (Ilha da Madeira, NE Atlantic). Boletim do Museu Municipal do Funchal, Sup. nº 5: 59-80.
Biscoito, M.J. & P. Wirtz, 1994. Two new records of stingrays (Pisces: Dasyatidae) from the archipelago of Madeira (NE Atlantic). Bocagiana, 12: 1-4.
Blondel, J., 2003. Guilds or functional groups: does it matter? Oikos, 100: 223-231. Bohnsack, J., 1990. The Potential of Marine fishery reserves for reef fish management in
the U.S. Southern Atlantic. NOAA Technical Memorandum, NMFS-SEFC-261, Miami. pp.
Bohnsack, J., 1996. Marine reserves, zoning, and the future of fishery management. Fisheries, 21: 14-16.
Bohnsack, J. & S.P. Bannerot, 1986. A Stationary visual census technique for quantitatively assessing community structure of coral reef fishes. NOAA Technical Report NMFS, 41: 1-15.
Bohnsack, J.A., 1982 The effects of piscivorous predator removal on coral reef fish community structure. Pp 258-267. In: Caillet, G.M., Simenstad, C.A. Guthshop '81: Fish Food Habits studies. Washington Sea Grant, University of Washington, Seatle.
Bohnsack, J.A., 1993. Marine reserves: they enhance fisheries, reduce conflicts, and protect resources. Oceanus, 36: 63-71.
Bond, A.B., J.S. Stephens, J.D.J. Pondella, M.J. Allen & M. Helvey, 1999. A method for estimating marine habitat values based on fish guilds, with comparisons between sites in the Southern California Bight. Bulletin of Marine Science, 64: 219-242.
Bortone, S., R. Hastings & J. Oglesby, 1986. Quantification of reef fish assemblages: a comparison of several in situ Methods. Northeast Gulf Science, 8: 1-22.
Bortone, S. & J. Kimmel, 1991. Environmental assessment and monitoring of artificial habitats. Pp 117-235. In: Artificial Habitats for Marine and Freshwater Fisheries. Seaman Jr., W., Sprague, L.M. (eds), Academic Press, San Diego.
Bortone, S., J. Kimmel & C. Bundrick, 1989. A comparison of three methods for visually assessing reef fish comunities: Time and area compensated. Northeast Gulf Science, 10: 85-96.
Bortone, S., J. VAn Tassel, A. Brito, J.M. Falcon, J. Mena & C. Bundrick, 1994. Enhancement of the nearshore fish assemblage in the Canary islands with artificial habitats. Bulletin of Marine Science, 55: 602-608.
Bortone, S.A., M.A. Samoilys & P. Francour, 2000. Fish and macroinvertebrate evaluation. Pp 127-164. In: Artificial reef evaluation with application to natural marine habitats. Seaman Jr., W. (eds), CRC Press, Boca Raton.
Bortone, S.A., J. Van Tassel, A. Brito, J.M. Falcón & C.M. Bundrick, 1991. A Visual assessment of the inshore fishes and fishery resources off El Hierro, Canary Islands: a baseline survey. Scientia Marina, 55: 529-541.
Bowen, S.H., E.V. Lutz & M.O. Ahlgren, 1995. Dietary protein as determinants of food quality: trophic strategies compared. Ecology, 76: 899-907.
Briggs, J.C., 1995. Global Biogeography. Developments in Paleontology and Stratigraphy. Elsevier Press, Amsterdam, Netherlandds, 452 pp.
Brito, A., 1991. Cátalogo de los peces de las Islas Canarias. Francisco Lemus, La Laguna, 230 pp.
Brito, A., J.M. Falcón, N. Aguilar & P. Pascual, 2001. Fauna vertebrada marina. Pp 219-229. In: Naturaleza de las islas Canarias. Ecologia y conservacion. Esquivel, J.M.F. (eds), Turquesa, Santa Cruz de Tenerife.

Cláudia Ribeiro
138
Brito, A., R. Herrera, J.M. Falcon, J.A. Garcia-Charton, J. Barquín & A. Pérez-Ruzafa, 1999. Contribucion al conocimiento de la ictiofauna de las islas de Cabo Verde. Revista de la Academia Canaria de Ciencias, 11: 27-41.
Brito, A. & P.J. Miller, 2001. Gobiid fishes from the Cape Verde Islands, including two new species of Gobius (Teleostei: Gobioidei). Journal of Natural History, 35: 253-277.
Brito, A., P.J. Pascual, J.M. Falcon, A. Sancho & G. González, 2002. Peces de las Islas Canarias. Catálogo documentado e ilustrado. Fancisco Lemus Editor, Tenerife, 419 pp.
Brock, R., 1982. A critique of the visual census method for assessing coral reef fish populations. Bulletin of Marine Science, 32: 269-276.
Brock, V.E., 1954. A preliminary report on a method of estimating reef fish populations. Journal of Wildlife Management, 18: 297-308.
Brunckhorst, D.J. & P.B. Bridgewater, 1994. A novel approach to identify and select core reserve areas, and to aply UNESCO Biosphere reserve principles to the coastal marine realm. Pp 12-17. In: 1st international workshop on marine and coastal protected areas Marine Protected areas Australian Nature Conservation Agency, Canberra, Australia.
Burchmore, J.J., D.A. Pollard, J.D. Bell, M.J. Middleton, B.C. Pease & J. Matthews, 1985. An ecological comparison of artificial and natural rocky reef fish communities in Botany bay, New South Wales, Autralia. Bulletin of Marine Science, 37: 70-85.
Buxton, C.D., 1993. Life-history changes in exploited reef fish on the east coast of South Africa. Environmental Biology of Fishes, 36: 47-63.
Caldeira, R.M.A., S. Groom, P. Miller, D. Pilgrim & N.P. Nezlin, 2002. Sea-surface signatures of the island mass effect phenomena around Madeira Island, Northeast atlantic. Remote sensing of environment, 80: 336-360.
Caley, M.J., 1995. Reef-fish community structure and dynamics: an interaction between local and larger-scale processes? Marine Ecology Progress Series, 129: 19-29.
Carlisle, J.G., C.H.J. Turner & E.E. Ebert, 1964. Artificial habitat in the marine environment. California Departement Fish Game Fish Bulletin, 124: 1-93.
Castro, J., R. Gonçalves, D. Carvalho, M. Biscoito & I. Correia, 1985. Projecto para a criação de uma reserva natural parcial na Ponta do Garajau Madeirapp.
Chabanet, P., V. Dufour & R. Galzin, 1995. Disturbance impact on reef fish communities in Reunion Island (Indian Ocean). Journal of Experimental Marine Biology and Ecology, 188: 29-48.
Chabanet, P., H. Ralambondrainy, M. Amanieu, G. Faure & R. Galzin, 1997. Relationships between coral reef substrata and fish. Coral Reefs, 16: 93-102.
Charbonnel, E., P. Francour, J.G. Harmelin & D. Ody, 1995. Les problèmes déchantillonage et de recensement du peuplement ichtyologique dans les recifes artificiels. Biology Marine Mediterranée, 1: 85-90.
Charbonnel, E., D. Ody & L. Le Direac'h, 2001. Effet de la complexification de l'architecture des recifs artificiels du Parc national de Port-Cros (Méditerranée, France) sur les peuplements ichtyologiques. Scientific Report Port-Cros National Park, France, 18: 163-217.
Chateau, O. & L. Wantiez, 2005. Comparaison de la structure des communautés de poissons coralliens d'intérêt commercial entre une reserve marine et deux zones non protegées dans le Parc du lagon sud de Nouvelle-Calédonie. Cybium, 29: 159-174.
Chave, E.H. & D.B. Eckert, 1974. Ecological aspects of the distribution of fishes at Fanning Island. Pacific Science, 28: 297-317.
Choat, J.H. & A.M. Ayling, 1987. The relationship between habitat structure and fish faunas on New Zealand reefs. Journal of Experimental Marine Biolology and Ecology, 110: 257-284.

Comparison of Rocky Reef Fish Communities Using Underwater Visual Techniques
139
Clarke, K.R. & M. Ainsworth, 1993. A method of linking multivariate community structure to environmental variables. Marine Ecology Progress Series, 92: 205-219.
Clarke, K.R. & R.H. Green, 1988. Statistical design and analysis for 'biological effects' study. Marine Ecology Progress Series, 46: 213-226.
Clarke, K.R. & R.M. Warwick, 2001. Change in Marine Communities: An Approach to statistical analysis and interpretation. Plymouth Marine Laboratory, Plymouth, UK.
Clode, J.C., 2005. Interactive effects of productivity and disturbance on the diversity of hard-bottom communities in the South cost of Madeira Island. Relatório de estágio de Licenciatura, Universidade da Madeira, 47 pp.
Cole-King, A., 1995. Marine protected areas in Britain: a conceptual problem? Ocean & Coastal Management, 27: 109-127.
Connell, S.D. & M. Lincoln Smith, 1999. Depth and the structure of assemblages of demersal fish: experimental trawling along a temperate coast. Estuarine Coastal and Shelf Science, 48: 483-495.
Constanza, R., R. D'Arge & M. Van Den Belt, 1997. The value of the world's ecosystems services and natural capital. Nature, 387: 253-260.
Costa, G., J. Lom, C.A.P. Andrade & R. Barradas, 1998. First report of Ceratomyxa sparusaurati (Protozoa: Myxosporea) and the occurrence of Epitheliocystis in cultured sea-bream, Sparus aurata from Madeira. Bulletin of European Fish Pathology, 18: 165-167.
Côté, I.M., I. Mosqueira & J.D. Reynolds, 2001. Effects of marine reserve characteristics on the protection of fish populations: a meta-analysis. Journal of Fish Biology, 59 (Sup. A): 178-189.
Craig, M.T., F.J. Fodrie & P.A. Hastings, 2004. The nearshore fish assemblage of the Scripps coastal reserve, San Diego, California. Coastal Management, 32: 341-351.
Davis, D. & C. Tisdell, 1995. Recreational scuba-diving and carrying capacity in marine protected areas. Ocean and Coastal Management, 26: 19-40.
Davis, G.E. & G.R.V. Anderson, 1989. Population estimates of four kelp forest fishes and an evaluation of three in situ assessment techniques. Bulletin of Marine Science, 44: 1138-1151.
Davis, J.L.D., L.A. Levin & S.M. Walther, 2002. Artificial armored shorelines: sites for open-coast species in a southern California bay. Marine Biology, 140: 1249-1262.
Dayton, P.K., E. Sala, M.J. Tegner & S. Thrush, 2000. Marine reserves: parks, baselines, and fishery enhancement. Bulletin of Marine Science, 66: 617-634.
Dayton, P.K., S.F. Thrush, T.M. Agardy & R.J. Hofman, 1995. Environmental effects of fishing. Aquatic Conservation: Marine and Freshwater Ecology, 5: 205-232.
Delgado, C., 1998. Caracterização faunística, batimétrica e geomorfológica da reserva natural do Garajau Parque Natural da Madeira. Relatório de estágio de Licenciatura, Universidade do Porto, 116 pp.
DeMartini, E.E., F.A. Parrish & J.D. Parrish, 1996. Interdecadal change in reef fish populations at French frigate shoals and Midway Atoll, Northwestern hawaiian islands: statistical power retrospect. Bulletin of Marine Science, 58: 804-825.
DeMartini, E.E. & D. Roberts, 1982. An Empirical test of biases in the rapid visual technique for species-time censuses of reef fish assemblages. Marine Biology, 70: 129-134.
DeMartini, E.E., D.A. Roberts & T.W. Anderson, 1989. Contrasting patterns of fish density and abundance at an artificial rock reef and a cobble-bottom kelp forest. Bulletin of Marine Science, 44: 881-892.
Dennis, G.D. & T.J. Bright, 1988. Reef fish assemblages on hard banks in the northwestern Gulf of Mexico. Bulletin of Marine Science, 43: 280-307.
Denny, C.M. & R.C. Babcock, 2004. Do partial marine reserves protect reef fish assemblages? Biological Conservation, 116: 119-129.

Cláudia Ribeiro
140
Doherty, P.J. & D. Williams, 1988. The Replenishment of Coral Reef Fish Populations. Oceanography Marine Biology Annual Review, 26: 487-551.
Dooley, J.K., J. Van Tassel & A. Brito, 1985. An annotated checklist of the shorefishes of the Canary Islands. American Museum Novitates, 2824: 1-49.
Dufour, V., J.Y. Jouvenel & R. Galzin, 1995. Study of a Mediterranean reef fish assemblage: comparisons of population distributions between depths in protected and unprotected areas over one decade. Aquatic Living Resources, 8: 17-25.
Dugan, J.E. & G.E. Davis, 1993. Applications of marine refugia to coastal fisheries management. Canadian Journal of Fisheries and Aquatic Sciences, 50: 2029-2042.
Ebeling, A.W., R.J. Larson, W.S. Alevizon & R.N. Bray, 1980. Annual variability of reef-fish assemblages in Kelp forests off Santa Barbara, California. Fisheries Bulletin, 78: 361-377.
Edgar, G.J. & N.S. Barret, 1997. Short term monitoring of biotic change in Tasmanian marine reserves. Journal of Experimental Marine Biology and Ecology, 213: 261-279.
Edgar, G.J. & N.S. Barret, 1999. Effects of the declaration of marine reserves on Tasmanian reef fishes, invertebrates and plants. Journal of Experimental Marine Biolology and Ecology, 242: 107-144.
Edgar, G.J., N.S. Barret & A.J. Morton, 2004. Biases associated with the use of underwater visual census techniques to quantify the density and size-structure of fish populations. Journal of Experimental Marine Biolology and Ecology, 308: 269-290.
Edgar, G.J., J. Moverley, N.S. Barret, D. Peters & C. Reed, 1997. The conservation-related benefits of a systematic marine biological sampling programme: the Tasmanian reef bioregionalisation as a case study. Biological Conservation, 79: 227-240.
Edwards, A.J. & C.W. Glass, 1987. The fishes of Saint Helena Island, South Atlantic Ocean. I. The shore fishes. Journal of Natural History, 21: 617-686.
Falcón, J.M., S.A. Bortone, A. Brito & C.M. Bundrick, 1996. Structure of and relationships within and between the littoral, rock-substrate fish communities off four islands in the Canarian archipelago. Marine Biology, 125: 215-231.
Falcón, J.M., J.A. Garcia-Charton, A. Brito & J.J. Bacallado, 2001. Peces litorales das Islas Salvajes. Revista de la Academia Canaria de Ciencias, 12: 137-142.
FAO, 1995. Review of the state of the world fisheries and aquaculture. FAO Fisheries Department, Rome. 127 pp.
Ferreira, C.E.L., S.R. Floeter, J.L. Gasparini, B.P. Ferreira & J.C. Joyeux, 2004. Trophic structure patterns of Brazilian reef fishes: a latitudinal comparison. Journal Biogeography, 31: 1093-1106.
Ferreira, C.E.L., J.E.A. Gonçalves & R. Coutinho, 2001. Community structure of fishes and habitat complexity on tropical rocky shore. Environmental Biology of Fishes, 61: 353-369.
Ferreira, S.J.F., 2002. Contribuição para o estudo da biologia de Lepadogaster zebrina Lowe, 1839 (PISCES, GOBIESOCIDAE). Relatório de estágio de Licenciatura, Universidade da Madeira, 39 pp.
Field, J.G., K.R. Clarke & R.M. Warwick, 1982. A Pratical strategy for analysing multispecies distribution patterns. Marine Ecology Progress Series, 8: 37-52.
Floeter, S.R., C.E.L. Ferreira, A. Dominic-Arosemena & I.R. Zalmon, 2004. Latitudinal gradients in atlantic reef fish communities: trophic structure and spatial use patterns. Journal of Fish Biology, 64: 1680-1699.
Floeter, S.R. & J.L. Gasparini, 2000. The southwestern Atlantic reef fish fauna: composition and zoogeographic patterns. Journal of Fish Biology, 56: 1099-1114.

Comparison of Rocky Reef Fish Communities Using Underwater Visual Techniques
141
Floeter, S.R., R.Z.P. Guimarães, L.A. Rocha, C.E.L. Ferreira, C.A. Rangel & J.L. Gasparini, 2001. Geographic variation in reef-fish assemblages along the Brazilian coast. Global Ecology & Biogeography, 10: 423-431.
Fowler, A.J., 1987. The development of sampling strategies for population studies of coral reef fishes. A case study. Coral Reefs, 6: 49-58.
Francour, P., 1991. The effect of protection level on a coastal fish comunnity at Scandola, Corsica. Revue Ecologie (Terre Vie), 46: 65-81.
Francour, P., 1994. Pluriannual analysis of the reserve effect on ichthyofauna in the Scandola natural reserve (Corsica, Northwestern Mediterranean). Oceanologica Acta, 17: 309-317.
Francour, P., 1997. Fish assemblages of Posodonia oceanica beds at Port-Cros (France, NW Mediterranean): Assessment of composition and long-term fluctuations by visual census. Marine Ecology, 18: 157-173.
Francour, P. & J.-G. Harmelin, 1988. Inventaire de la faune ichtyologique marine de Port-Cros (Mediterranée Occidentale). Scientific Report Port-Cros National Park, France, 14: 65-79.
Francour, P., J.G. Harmelin, D.A. Pollard & S. Sartoretto, 2001. A review of marine protected areas in the Northwestern Mediterranean region: siting, usage, zonation and management. Aquatic Conservation: Marine and Freshwater Ecosystems, 11: 155-188.
Freitas, C.M.T.F., L.M. Gouveia, P.J.S.G. Oliveira, R.M.C. Pires & S.M.G.S.V. Fontinha, 2004. As Reservas Marinhas da Ilha da Madeira. Secretaria Regional do Ambiente e dos Recursos Naturais - Serviço do Parque Natural da Madeira, 88 pp.
Freitas, M. & M.J. Biscoito, 2002. First record of Aluterus scriptus and Aluterus monoceros (PISCES, Tetraodontiformes, Monocanthidae) from the archipelagos of Madeira and Selvagens. Bocagiana, 206: 1-5.
Frienderlander, A.M. & J.D. Parrish, 1998. Habitat characteristics affecting fish assemblages on a hawaiian coral reef. Journal of Experimental Marine Biolology and Ecology, 224: 1-30.
Frontier, S. & D. Pichod-Viale, 1991. Écosystèmes: Structure- Fonctionnement-Evolution. Masson, Paris, 392 pp.
Galal, N., R.F.G. Ormond & O. Hassan, 2002. Effect of a network of no-take reserves in increasing catch per unit effort and stocks of exploited reef fish at Nabq, South Sinai, Egypt. Marine Freshwater Research, 53: 199-205.
García-Charton, J. & A. Pérez-Ruzafa, 1998. Correlation between habitat structure and a rocky reef fish assemblage in SW Mediterranean. Marine Ecology, 19: 111-128.
García-Charton, J. & A. Pérez-Ruzafa, 1999a. Ecological heterogeneity and the evaluation of the effects of marine reserves. Fisheries Research, 42: 1-20.
García-Charton, J.A. & A. Pérez-Ruzafa, 1999b. Ecological heterogeneity and the evaluations of the effects of marine reserves. Fisheries Research, 42: 1-20.
García-Charton, J.A., A. Pérez-Ruzafa, P. Sanchez-Jerez, J.T. Bayle-Sempere, O. Reñones & D. Moreno, 2004. Multi-scale spatial heterogeneity, habitat structure, and the effect of marine reserves on Western Mediterranean rocky reef fish assemblages. Marine Biology, 144: 161-182.
García-Rubies, A. & E. Macpherson, 1995. Substrate use and temporal pattern of recruitment in juvenile fishes of the Mediterranean littoral. Marine Biology, 124: 35-42.
García-Rubies, A. & M. Zabala, 1990. Effects of total fishing prohibition on the rocky fish assemblages of Medes Islands marine reserve (NW Mediterranean). Scientia Marina, 54: 317-328.
Gardener, T.A., I.M. Cote, J.A. Gill, A. Grant & A.R. Watkinson, 2003. Long-term region-wide declines in Caribbean corals. Science, 301: 958-960.

Cláudia Ribeiro
142
Garrabou, J., E. Sala, A. Arcas & M. Zabala, 1998. The impact of diving on rocky sublittoral communities: A case study of a bryozoan populations. Conservation Biology, 12: 302-312.
Garrido, M.J., R. Haroun & H.A. Lessios, 2000. Annual reproductive periodicity of the sea urchin Diadema antillarum Philippi in the Canary Islands. Bulletin of Marine Science, 67: 919-996.
Garrison, L.P. & J.S. Link, 2000. Dietary guild structure of the fish community in the Northeast United States continental shelf ecosystem. Marine Ecology Progress Series, 202: 231-240.
Gell, F.R. & C.M. Roberts, 2003. Benefits beyond boundaries: the fishery effects of marine reserves and fishery closures. Trends in Ecology and Evolution, 18: 448-455.
Gessner, M.O., P. Inchausti, L. Persson, D.G. Raffaelli & P.S. Giller, 2004. Biodiversity effects on ecosystem functioning: insights from aquatic systems. Oikos, 104: 419-422.
Gladfelter, W.B., J.C. Ogden & E.H. Gladfelter, 1980. Similarity and diversity among coral reef fish communities: a comparison between tropical western Atlantic (Virgin Islands) and tropical central Pacific (Marshall islands) patch reefs. Ecology, 61: 1156-1168.
Goldman, B. & F.H. Talbot, 1976. Aspects of the ecology of coral reef fishes. Pp 125-154. In: Biology and Ecology of coral reefs. Jones, O.H., Endean, R. (eds), Academic Press, New York.
Gomes, T.M., 1999. Trophic relationships and feeding habits of demersal fishes from the Azores: importance to multispecies assessment. Pp 159-198. In: XVIII e XIX Semana das Pescas dos Açores Direcção Regional de Pescas dos Açores, Horta, Faial.
González, J.J., C.G. Hernández, P.G. Marrero & E.P. Rapp, 1998. Peces de Canarias. Guia Submarina. 223 pp.
Gosline, W.A., 1965. Vertical zonation of inshore fishes in the upper water layers of the Hawaiian islands. Ecology, 46: 823-831.
Grant, J.J., K.C. Wilson, A. Grover & H.A. Togstad, 1982. Early development of Pendleton artificial reef. Marine Fisheries Revue, 44: 53-60.
Grasshoff, K., k. Kremling & M. Ehrhardt, 1999. Methods of seawater analysis. Wiley-VCH, Weinheim, Germany, 599 pp.
Gratwicke, B. & M.R. Speight, 2005. The relationship between fish species richness, abundance and habitat complexity in a range of shallow tropical marine habitats. Journal of Fish Biology, 66: 650-667.
Green, A.L., C.E. Birkeland & R.H. Randall, 1999. Twenty years of disturbance and change in Fagatele Bay national Marine Sanctuary, American Samoa. Pacific Science, 53: 376-400.
Green, R.H., 1979. Sampling design and statistical methods for environmental biologists. Journal of Paleontology, 55: 907-908.
Greene, L.E. & W.S. Alevizon, 1989. Comparative accuracies of visual assessment methods for coral reef fishes. Bulletin of Marine Science, 44: 899-912.
Griffiths, M. & C.G. Wilke, 2002. Long-term movement patterns of five temperate-reef fishes (Pisces: Sparidae): implications for marine reserves. Marine Freshwater Research, 53: 233-244.
Grigg, R.W., 1994. Effects of sewage discharge, fishing pressure and habitat complexity on coral ecosystems and reef fishes in Hawaii. Marine Ecology Progress Series, 103: 23-54.
Grove, R.S., 1982. Artificial reefs as a resource management option for siting coastal power stations in Southern California. Marine Fisheries Revue, 44: 24-27.

Comparison of Rocky Reef Fish Communities Using Underwater Visual Techniques
143
Gubbay, S., 1995. Marine protected areas: past, present and future.Marine Protected Areas. Principles and Techniques for Management. Gubbay, S.S., London, UK, Chapman and Hall. 232 pp.
Guidetti, P., 2000. Differences among fish assemblages associated with nearshore Posidonia oceanica seagrass beds, rocky-algal reefs and unvegetatde sand habitats in the Adriatic sea. Estuarine, Coastal and Shelf Science, 50: 515-529.
Guidetti, P., C.N. Bianchi, G. La Mesa, M. Modena, C. Morri, G. Sara & M. Vachi, 2002a. Abundance and size structure of Thalassoma pavo (Pisces: Labridae) in the western Mediterranean sea: variability at different spatial scales. Journal of Marine Biological Association of United Kingdom, 82: 495-500.
Guidetti, P. & S. Bussotti, 2000. Nearshore fish assemblages associated with shallow rocky habitats along the southern croatian coast (Eastern Adriatica Sea). Vie et Milieu, 50: 171-176.
Guidetti, P., G. Fanelli, S. Fraschetti, A. Terlizzi & F. Boero, 2002b. Coastal fish indicate human-induced changes in the Mediterranean littoral. Marine Environmental Research, 53: 77-94.
Guidetti, P., L. Verginella, C. Viva, R. Odorico & F. Boero, 2005. Prottection effects on fish assemblages, and comparison of two visual-census techniques in shallow artificial rocky habitats in the northern Adriatic sea. Journal of Marine Biological Association of United Kingdom, 85: 247-255.
Hajagos, J.G. & J. Van Tassel, 2001. A visual survey of the inshore fish communities of Gran Canaria (Canary islands). Arquipélago. Life and Marine Sciences, Sup. nº 2: (Part B): 95-99.
Halpern, B.S., 2003. The impact of marine reserve: do reserves work and does reserve size matter? Ecological Applications, 13: S117-S137.
Harmelin-Vivien, M.L. & P. Francour, 1992. Trawling or visual censuses? Methodological bias in the assessment of fish populations in seagrass beds. Marine Ecology, 13: 41-51.
Harmelin-Vivien, M.L. & J.-G. Harmelin, 1975. Présentation d'une méthode d'evaluation "in situ" de la faune ichthyologique. Travaux Scientifiques du Parc National de Port Cros, Tome I: 47-52.
Harmelin-Vivien, M.L., J.-G. Harmelin & A.J. Almeida, 2001. Structure of fish assemblages on coastal rocky shores of the Azores. Boletim do Museu Municipal do Funchal, Sup. nº 6: 127-138.
Harmelin-Vivien, M.L., J.-G. Harmelin, C. Chauvet, C. Duval, R. Galzin, P. Lejeune, G. Barnabé, F. Blanc, R. Chevalier, J. Duclerc & G. Lasserre, 1985. Evaluation Visuelle des peuplements et populations de poissons: Methods et problemes. Revue Ecologie (Terre Vie), 40: 467-539.
Harmelin, J.-G., 1987. Structure and variability of the ichthyofauna in a mediterranean protected rocky area (National Park of Port-Cros, France). Marine Ecology, 8: 263-284.
Harmelin, J.-G., 1999. Visual assessment of indicator fish species in Mediterranean marine protected areas. Naturalista Siciliano, 23 (sup.): 83-104.
Harmelin, J.-G., F. Bachet & F. Garcia, 1995. Mediterranean marine reserves: fish indices as tests of prottection efficiency. Marine Ecology, 16: 233-250.
Harmelin, J.G. & F. Bachet, 1992. Impact de la protection sur l’ichtyofaune de la réserve de Carry-le-Rouet (France). MEDPAN News, 3: 21-25.
Hastings, R., 1979. The origin and seasonality of the fish fauna on a new jetty in the northeastern gulf of Mexico. Bulletin of the Florida State Museum Biological Sciences, 24: 1-123.

Cláudia Ribeiro
144
Hatcher, B.G., R.E. Johannes & A.I. Robertson, 1989. Review of research relevant to the conservation of shallow tropical marine ecosystems. Oceanography Marine Biology Annual Revue, 27: 337-414.
Hawkins, S., H.B.S.M. Corte-Real, F.G. Pannacciulli, L.C. Weber & J.D.D. Bishop, 2000. Thoughts on the ecology and evolution of the intertidal biota of the Azores and other atlantic islands. Hydrobiologia, 440: 3-17.
Heemstra, P.C., 1991. A Taxonomic revision of the eastern atlantic groupers (Pisces: Serranidae). Boletim do Museu Municipal do Funchal, 43: 5-71.
Hernández, J.C., A. Brito, E. Cubero, N. García, D. Girard, G. González-Lorenzo & J.M. Falcón, 2006. Temporal patterns of larval settlement of Diadema antillarum (Echinodermata: Echinoidea) in the Canary Islands using an experimental larval collector. Bulletin of Marine Science, 78: 271-279.
Hernández, J.C., S. Clemente, A. Rodríguez, K. Toledo, C. Sangill, I. González & A. Brito, 2007. Effects of protection from fishing in the key herbivore Diadema aff. antillarum at the Canary Islands. Pp 315. In: Abstracts of the European Symposium on MPAs as a tool for fisheries management & ecosystem conservation Murcia, Spain 25th-28th September 2007.
Hindell, J.S., G.P. Jenkins & M.J. Keough, 2001. Spatial and temporal variability in the effects of fish predation on macrofauna in relation to habitat complexity and cage effects. Marine Ecology Progress Series, 224: 231-250.
Hobson, E.S., 1974. Feeding Relationships of Teleostean fishes on coral reefs in Kona, Hawaii. Fishery Bulletin, 72: 915-1031.
Hobson, E.S., 1994. Ecological relations in the evolution of acanthopterygian fishes in warm-temperate communities of the northern pacific. Environmental Biology of Fishes, 17: 201-226.
Hughes, T., 1996. Demographic approaches to comunity dynamics: a coral reef example. Ecology, 77: 2256-2260.
Hyndes, G.A., M.E. Platell, I.C. Potter & C.J. Lenanton, 1999. Does the composition of the demersal fish assemblages in temperate coastal waters change with depth and undergo consistent seasonal changes? Marine Biology, 134: 335-352.
INIP, 1982. Programa de apoio às pescas na Madeira - II. Cruzeiro de reconhecimento de pesca e oceanografia 020170680. Cruzeiro de reconhecimento de pesca e oceanografia 020241180. Relatório INIP nº11, Lisboa. 220 pp.
INIP, 1984. Programa de apoio às pescas na madeira - III cruzeiro de reconhecimento de pesca e oceanografia 020330981. Relatório INIP nº 22, Lisboa. 132 pp.
Jackson, J.B.C., M.X. Kirby, W.H. Berger, K.A. Bjorndal, L.W. Botsford, B.J. Bourque, R.H. Bradbury, R.J.E. Cooke, J.A. Estes, T.P. Hughes, S. Kidwell, C.B. Lange, H.S. Lenihan, J.M. Pandolfi, C.H. Peterson, R.S. Steneck, M.J. Tegner & R.R. Warner, 2001. Historical Overfishing and the Recent Collapse of Coastal Ecosystems. Science, 293: 629-637.
Jackson, J.B.C. & E. Sala, 2001. Unnatural Oceans. Scientia Marina, 65: 273-281. Jennings, S., E.M. Grandcourt & N.V.C. Polunin, 1995. The effects of fishing on the
diversity, biomass and trophic structure of Seychelles reef fish communities. Coral Reefs, 14: 225-235.
Jennings, S. & M.J. Kaiser, 1998. The effects of fishing on marine ecosystems. Advances in Marine Biology, 34: 202-352.
Jennings, S., S.S. Marshall & N.V.C. Polunin, 1996. Seychelles' marine protected areas: comparative structure and status of reef fish communities. Biological Conservation, 75: 201-209.
John, J.S., G.R. Russ & W. Gladstone, 1990. Accuracy and bias of visual estimates of numbers, size structure and biomass of a coral reef fish. Marine Ecology Progress Series, 64: 253-262.

Comparison of Rocky Reef Fish Communities Using Underwater Visual Techniques
145
Johnson, G.F. & L.A.d. Wit, 1978 Ecological effects of an artificial island, Rincon Island, Punta Gorda, California. Pp 1-108. In: Misc.Rep, U.S.A.C.E.C.
Jones, G.P., 1992. Interactions between herbivorous fishes and macro-algae on a temperate rocky reef. Journal of Experimental Marine Biology and Ecology, 159: 217-235.
Jones, P.J.S., 1994. A Review and analysis of the objectives of marine nature reserves. Ocean & Coastal Management, 24: 149-178.
Jones, P.J.S., 2002. Marine protected areas strategies: issues, divergences and the search for middle ground. Reviews in Fish Biology and Fisheries, 11: 197-216.
Jones, R.S. & M.J. Thompson, 1978. Comparison of Florida reef fish assemblages using a rapid visual technique. Bulletin of Marine Science, 28: 159-172.
Jouvenel, J.-Y. & D.A. Pollard, 2001. Some effects of marine protection on the population structure of two spearfishing target-fish, Dicentrarchus labrax (Moronidae) and Sparus aurata (Sparidae), in shallow inshore waters, along a rocky coast in the northwestern Mediterranean sea. Aquatic Conservation: Marine and Freshwater Ecology, 11: 1-9.
Juanes, F., 2001. Mediterranean marine protected areas. Trends in Ecology & Evolution, 16: 169-170.
Kelleher, G. & R.A. Kenchington, 1992. Guidelines for Establishing Marine Protected Areas. A Marine Conservation and Development Report. IUCN, Gland, Switzerland, vii + 79 pp.
Kenchington, R.A., 1990. Managing Marine Environments. Taylor and Francis, New york, 248 pp.
Kenchington, R.A. & T.M. Agardy, 1990. Achieving marine conservation through biosphere reserve planning and management. Environment Conservation, 17: 39-44.
Kimmel, J., 1985. A New species-time method for visual assessment of fishes and its comparison with established methods. Environmental Biology of Fishes, 12: 23-32.
Kirsch, K.D., J.F. Valentine & K.L.J. Heck, 2002. Parrotfish grazing on turtlegrass Thalassia testudinum: evidence for the importance of seagrass consumption in food web dynamics of the Florida Keys National Marine Sanctuary. Marine Ecology Progress Series, 227: 71-85.
Knowlton, N., 2004. Multiple 'stable' states and the conservation of marine ecosystems. Progress in Oceanograpgy, 60: 387-396.
Kruskal, J.B., 1964. Multidimensional scaling by optimising goodness of fit to a non-metric hypothesis. Psychometrika, 29: 1-27.
Kulbicki, M., 1998. How the acquired behaviour of commercial reef fishes may influence the results obtained from visual censuses. Journal of Experimental Marine Biolology and Ecology, 222: 11-30.
La Mesa, G. & M. Vachi, 1999. An analysis of the coastal fish assemblage of the Ustica island marine reserve (Mediterranean sea). Marine Ecology, 20: 147-165.
Labrosse, P., M. Kulbicki & J. Ferraris, 2002. Underwater visual fish census surveys. Proper use and implementation. Secretariat of the Pacific Community, Noumea, New Caledonia. 54 pp.
Lara, E.N. & E.A. Gonzalez, 1998. The relationship between reef fish community structure and environmental variables in the southern Mexican Caribbean. Journal of Fish Biology, 53: 209-221.
Legendre, P. & L. Legendre, 1998. Numerical Ecology. Elsevier Science BV, Amsterdam, 853 pp.
Lessios, H.A., B.D. Kessing & J.S. Pearse, 2001. Population structure and speciation in tropical seas: global phylogeography of the sea urchin Diadema. Evolution, 55: 955-975.
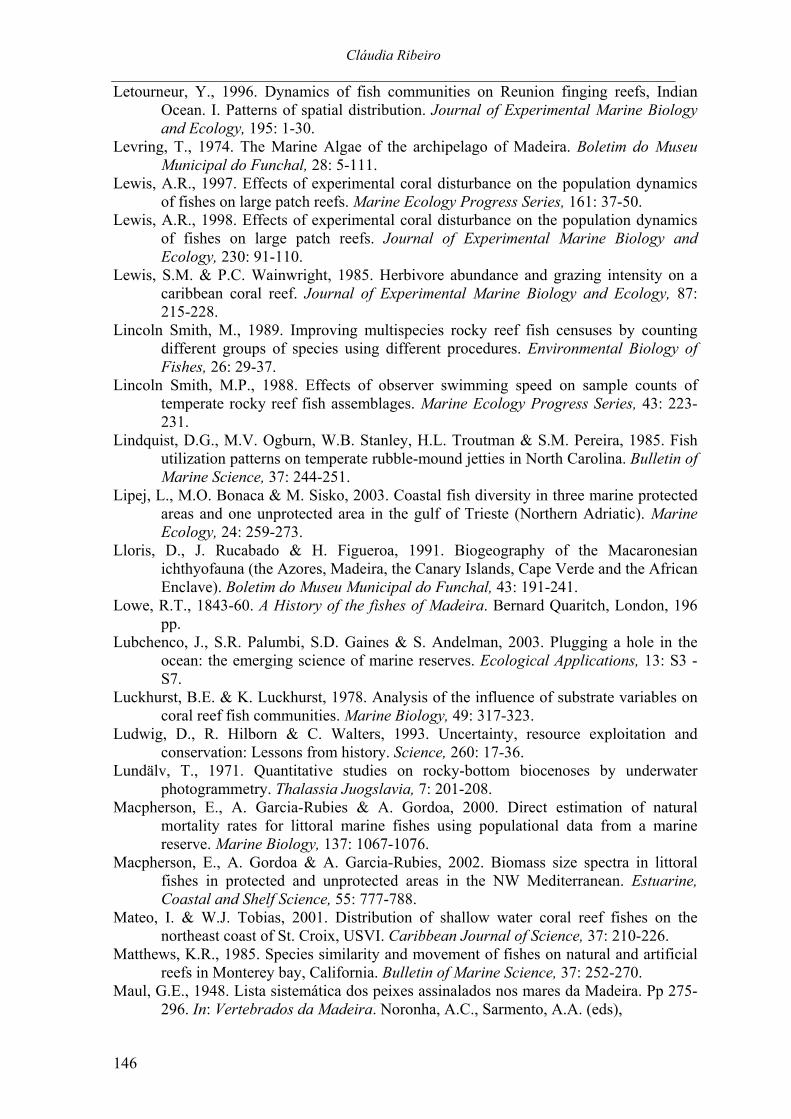
Cláudia Ribeiro
146
Letourneur, Y., 1996. Dynamics of fish communities on Reunion finging reefs, Indian Ocean. I. Patterns of spatial distribution. Journal of Experimental Marine Biology and Ecology, 195: 1-30.
Levring, T., 1974. The Marine Algae of the archipelago of Madeira. Boletim do Museu Municipal do Funchal, 28: 5-111.
Lewis, A.R., 1997. Effects of experimental coral disturbance on the population dynamics of fishes on large patch reefs. Marine Ecology Progress Series, 161: 37-50.
Lewis, A.R., 1998. Effects of experimental coral disturbance on the population dynamics of fishes on large patch reefs. Journal of Experimental Marine Biology and Ecology, 230: 91-110.
Lewis, S.M. & P.C. Wainwright, 1985. Herbivore abundance and grazing intensity on a caribbean coral reef. Journal of Experimental Marine Biology and Ecology, 87: 215-228.
Lincoln Smith, M., 1989. Improving multispecies rocky reef fish censuses by counting different groups of species using different procedures. Environmental Biology of Fishes, 26: 29-37.
Lincoln Smith, M.P., 1988. Effects of observer swimming speed on sample counts of temperate rocky reef fish assemblages. Marine Ecology Progress Series, 43: 223-231.
Lindquist, D.G., M.V. Ogburn, W.B. Stanley, H.L. Troutman & S.M. Pereira, 1985. Fish utilization patterns on temperate rubble-mound jetties in North Carolina. Bulletin of Marine Science, 37: 244-251.
Lipej, L., M.O. Bonaca & M. Sisko, 2003. Coastal fish diversity in three marine protected areas and one unprotected area in the gulf of Trieste (Northern Adriatic). Marine Ecology, 24: 259-273.
Lloris, D., J. Rucabado & H. Figueroa, 1991. Biogeography of the Macaronesian ichthyofauna (the Azores, Madeira, the Canary Islands, Cape Verde and the African Enclave). Boletim do Museu Municipal do Funchal, 43: 191-241.
Lowe, R.T., 1843-60. A History of the fishes of Madeira. Bernard Quaritch, London, 196 pp.
Lubchenco, J., S.R. Palumbi, S.D. Gaines & S. Andelman, 2003. Plugging a hole in the ocean: the emerging science of marine reserves. Ecological Applications, 13: S3 - S7.
Luckhurst, B.E. & K. Luckhurst, 1978. Analysis of the influence of substrate variables on coral reef fish communities. Marine Biology, 49: 317-323.
Ludwig, D., R. Hilborn & C. Walters, 1993. Uncertainty, resource exploitation and conservation: Lessons from history. Science, 260: 17-36.
Lundälv, T., 1971. Quantitative studies on rocky-bottom biocenoses by underwater photogrammetry. Thalassia Juogslavia, 7: 201-208.
Macpherson, E., A. Garcia-Rubies & A. Gordoa, 2000. Direct estimation of natural mortality rates for littoral marine fishes using populational data from a marine reserve. Marine Biology, 137: 1067-1076.
Macpherson, E., A. Gordoa & A. Garcia-Rubies, 2002. Biomass size spectra in littoral fishes in protected and unprotected areas in the NW Mediterranean. Estuarine, Coastal and Shelf Science, 55: 777-788.
Mateo, I. & W.J. Tobias, 2001. Distribution of shallow water coral reef fishes on the northeast coast of St. Croix, USVI. Caribbean Journal of Science, 37: 210-226.
Matthews, K.R., 1985. Species similarity and movement of fishes on natural and artificial reefs in Monterey bay, California. Bulletin of Marine Science, 37: 252-270.
Maul, G.E., 1948. Lista sistemática dos peixes assinalados nos mares da Madeira. Pp 275-296. In: Vertebrados da Madeira. Noronha, A.C., Sarmento, A.A. (eds),

Comparison of Rocky Reef Fish Communities Using Underwater Visual Techniques
147
Maul, G.E., 1962. Report on the fishes taken in Madeiran and Canarian waters during the summer-autumn cruises of the "Discovery II" 1959 and 1961. I The Ceratioid fishes (Melnocetidae, Himantolophidae, Oneirodidae, Gigantactinidae, Linophrynidae). Boletim do Museu Municipal do Funchal, 16: 33-46.
Maul, G.E., 1969. On the genus Cetominus (CETOMIDAE) with the description of a new species. Bocagiana, 18: 1-12.
Maul, G.E., 1976. The fishes taken in bottom trawls by R.V. "Meteor" during the 1967 seamounts cruises in the Northeast Atlantic. "Meteor" Forsch.-Engerbnisse, 1-69.
McCormick, M.I. & J.H. Choat, 1987. Estimating total abundance of a large temperate-reef fish using visual strip-transects. Marine Biology, 96: 469-478.
McGehee, M.A., 1994. Correspondence between assemblages of coral reef fishes and gradients of water motion, depth, and substrate size off Puerto Rico. Marine Ecology Progress Series, 105: 243-255.
Mead, G.W., 1964. Report on the fishes taken in Madeiran and Canarian waters durring the summer-autumn cruises of the "Discovery II" 1959 and 1961. II The identity of the north atlantic fanfish, Pteraclis. Boletim do Museu Municipal do Funchal, 18: 114-120.
Meekan, M.G. & J.H. Choat, 1997. Latitudinal variation in abundance of herbivorous fishes: a comparison of temperate and tropical reefs. Marine Biology, 128: 373-383.
Mello, P.R., 2000. Identificação e quantificação da ictiofauna da Baía do Garajau - Madeira. Relatório de estágio de Licenciatura, Universidade do Porto, 172 pp.
Mendes, J.M.M., D. Freitas, E. Olival, F. Oliveira, I. Correia & P. Silva, 2000 Plano Regional da Política de Ambiente. Pp 176. Direcção Regional do Ambiente.
Molles, M.C.J., 1978. Fish species diversity on model and natural reef patches: experimental insular biogeograpgy. Ecological Monographs, 48: 289-305.
Morales-Nin, B. & D. Sena-Carvalho, 1996. Age and Growth of the black scabbard fish (Aphanopus carbo) off Madeira. Fisheries Research, 25: 239-251.
Morato, T., P. Afonso, P. Lourinho, R.D.M. Nash & R.S. Santos, 2003. Reproductive biology and recruitment of the white sea bream in the Azores. Journal of Fish Biology, 63: 59-72.
Mosquera, I., I.M. Côté, S. Jennings & J.D. Reynolds, 2000. Conservation benefits of marine reserves for fish popultations. Animal Conservation, 4: 321-332.
Mouillot, D., J.-M. Culioli, A. Lepretre & J.-A. Tomaisini, 1999. Dispersion statistics and sample size estimates for three fish species (Symphodus ocellatus, Serranus scriba and Diplodus annularis) in the Lavezzi islands Marine Reserve (South Corsica, Mediterranean Sea). Marine Ecology, 20: 19-34.
Murawski, S.A., R. Brown, H.-L. Lai, P.j. Rago & L. Hendrickson, 2000. Large-scale closed areas as a fishery-management tool in temperate marine systems: the Georges Bank experience. Bulletin of Marine Science, 66: 775-798.
Myers, R.A. & P. Pepin, 1994. Recruitment variability and oceanographic stability. Fisheries Oceanography, 3: 246-255.
Neto, A.I., D.C. Cravo & R.T. Haroun, 2001. Checklist of the benthic marine plants of the Madeira archipelago. Botanica Marina, 44: 391-414.
Nowlis, J.S. & C.M. Roberts, 1999. Fisheries benefits and optimal design of marine reserves. Fishery Bulletin, 97: 604-616.
NRC (National Research Council), 2001. Marine protected areas: tools for sustaining ocean ecosystems D.C. National Academy Press, Washington, DC. pp.
Otway, N.M., 1995. Assessing impacts of deepwater sewage disposal: a case study from New South Wales, Australia. Marine Pollution Bulletin, 31: 347-354.
Parrish, J.D., 1989. Fish communities of interacting shallow-water habitats in tropical oceanic regions. Marine Ecology Progress Series, 58: 143-160.

Cláudia Ribeiro
148
Parsons, T.R., Y. Maita & C.M. Lalli, 1994. A manual of chemical and biological methods for seawater analysis. Pergamon Press, Oxford, 173 pp.
Pattengill, C.V., 1998. The structure and persistence of reef fish assemblages of the Flower Garden banks National Marine Sanctuary. Ph.D. dissertation, Texas A & M Universtity, 176 pp.
Patzner, R.A., R.S. Santos, P. Ré & R.D.M. Nash, 1992. Littoral fishes of the Azores: an annotated checklist of fishes observed during the "Expedition Azores 1989". Arquipélago, 10: 101-111.
Pauly, D., V. Christensen, S. Guénette, T.J. Pitcher, R. Sumaila & C. Walters, 2002. Towards sustainability in world fisheries. Nature, 418: 689-695.
Pauly, D. & R. Watson, 2003. Counting the last fish. Scientific America, 42-47. Pestana, R.M.G., 2002. Sistemática e ecologia de esponjas de substratos rochosos
marinhos verticais e inclinados da costa Sul da Madeira. Relatório de estágio de Licenciatura, Universidade de Madeira, 40 pp.
Peterson, C.H. & J. Lubchenco, 1997. Marine Ecosystem services. Pp 177-194. In: Nature's Services: Societal Dependence on Natural Ecosystems. Daily, G. (eds), Island Press, Washington, D.C.
Pielou, E.C., 1966. The measurement of diversity in different types of biological collections. Journal of Theoretical Biology, 13: 131-144.
Pitcher, T.J., 2001. Fisheries managed to rebuild ecosystems? Reconstructing the past to salvage the future. Ecology Applied, 11: 601-617.
Polunin, N.V.C. & C.M. Roberts, 1993. Greater biomass and value of argeted coral-reef fishes into small Caribbean Marine reserves. Marine Ecology Progress Series, 100: 167-176.
Quéro, J.-C., P. Porché & J.-J. Vayne, 2003. Guides des poissons de l'Atlantique européen. Delachaux et Niestlé, Paris, 465 pp.
Raymond, W.F., 1975. Sand and coral monitoring at two artificial reefs in Florida. Sand and Beach, 43: 3-10.
Ré, P., 1978. Contribution to the Knowledge of littoral fish fauna of ilhas Desertas (Madeira). Boletim da Sociedade Portuguesa de Ciências Naturais, 18: 47-49.
Relini, M., G. Torchia & G. Relini, 1994. Seasonal variation of fish assemblages in the Loano artificial reef (Ligurian sea northwestern Mediterranean). Bulletin of Marine Science, 55: 401–417.
Ribeira Siguan, M.A., 1992. Reserve des îles Medes et frequentation touristique regionale. MEDPAN Secretariat Publ. Fr., 51-57.
Ribeiro, C., 1998. Caracterização da ictiofauna da Baía do Cais do Carvão (Funchal - ilha da Madeira) e aspectos da biologia de Abudefduf luridus. Relatório de estágio de Licenciatura, Faculdade de Ciências da Universidade de Lisboa, 50 pp.
Ribeiro, C., A.A. Almeida, R. Araújo, M. Biscoito & M. Freitas, 2005. Fish assemblages of Cais do Carvão Bay (Madeira Island) determined by the visual census technique. Journal of Fish Biology, 67: 1568-1584.
Rice, J.C., 2005. Understanding fish habitat ecology to achieve conservation. Journal of Fish Biology, 67 (Sup. B): 1-22.
Richards, W.J. & K.C. Lindeman, 1987. Recruitment dynamics of reef fishes: planktonic processes, setlement and demersal ecologies, and fishery analysis. Bulletin of Marine Biology, 41: 392-410.
Rilov, G. & Y. Benayahu, 2000. Fish assemblage on natural versus vertical artificial reefs: the rehabilitation perspective. Marine Biology, 136: 931-942.
Risk, M.J., 1972. Fish diversity on a coral reef in the Virgin Islands. Atoll Research Bulletin, 153: 1-6.
Roberts, C.M., 1994. Rapid build-up of fish biomass in a Caribbean marine reserve. Conservation Biology, 9: 815-826.

Comparison of Rocky Reef Fish Communities Using Underwater Visual Techniques
149
Roberts, C.M., 1997. Ecological advice for the global fisheries crisis. Trends in Ecology and Evolution, 12: 35-38.
Roberts, C.M. & J.P. Hawkins, 1999. Extinction risk in the sea. Trends in Ecology and Evolution, 14: 241-246.
Roberts, C.M. & N.V.C. Polunin, 1991. Are marine reserves effective management of reef fisheries? Pp 65-91. In: Reviews in Fish Biology and Fisheries. Pitcher, T.J. (eds), Chapman & Hall, London, New York.
Roberts, C.M. & N.V.C. Polunin, 1992. Effects of protection on northern red sea fish populations. Pp 969-977. In: 7th International Coral Reef Symposium
Rosa, R.S. & R.L. Moura, 1997. Visual assessment of reef fish community structure in the atol das Rocas Biological Reserve, off Northeastern Brazil. Pp 983-986. In: 8th International Coral Reef Symposium Panama.
Rountree, R.A., 1989. Association of fishes with fish aggregation devices: effects of structure size on fish abundance. Bulletin of Marine Science, 44: 960-972.
Rudd, M.A., M. Tupper, H. Folmer & G.C.V. Kooten, 2003. Policy analysis for tropical marine reserves: challenges and directions. Fish and Fisheries, 4: 65-85.
Russ, G.R., 1985. The distribution and abundance of herbivorous grazing fishes in the central Great Barrier Reef. I. levels of variability across the entire continental shelf. Marine Ecology Progress Series, 20: 23-34.
Russ, G.R. & A.C. Alcala, 1998. Natural fishing experiments in marine reserves 1983-1993: community and trophic responses. Coral Reefs, 17: 383-397.
Russel, B.C., F.H. Talbot, G.R.V. Anderson & B. Goldman, 1978. Collection and sampling of reef fishes. Pp 329-343. In: Monographs on Oceanographic Methodology 5. Coral Reefs: research methods. Stodart, D.R., Johannes, R.E. (eds), UNESCO, Norwich.
Sala, E., 1997. The role of fishes in the organization of a Mediterranean sublittoral community: II. Epifaunal communities. Journal of Experimental Marine Biology and Ecology, 212: 45-60.
Saldanha, L., E.M. Günther, M. Biscoito & F. Andrade, 1986. On the identity of Heteroconger longissimus GÜNTHER 1870 and Heteroconger halis (BÖHLKE 1957) (PISCES CONGRIDAE). Bocagiana, 104: 1-17.
Sale, P.F., 1977. Maintenance of high diversity in coral reef fish communities. The American Naturalist, 111: 337-359.
Sale, P.F., 1980a. Assemblages of fish on patch reefs - predictable or unpredictable? Environmental Biology of Fishes, 5: 243-249.
Sale, P.F., 1980b. The ecology of fishes on coral reefs. Oceanography Marine Biology Annual Revue, 18: 367-421.
Sale, P.F. & W.A. Douglas, 1981. Precision and accuracy of visual census technique for fish assemblages on coral patch reefs. Environmental Biology of Fishes, 6: 333-339.
Sale, P.F. & W.A. Douglas, 1984. Temporal variability in the community structure of fish on coral patch reefs and the relation of community structure to reef structure. Ecology, 65: 409-422.
Sale, P.F. & R. Dybdahl, 1975. Determinants of community structure for coral reef fishes in an experimental habitat. Ecology, 56: 1343-1355.
Sale, P.F. & D.J. Ferrel, 1988. Early survivorship of juvenile coral reef fishes. Coral Reefs, 7: 117-124.
Sale, P.F., J.A. Guy & W.J. Steel, 1994. Ecological structure of assemblages of coral reef fishes on isolated patch reefs. Oecologia, 198: 83-99.
Sale, P.F. & B.J. Sharp, 1983. Correction for bias in visual transect censuses of coral reef fishes. Coral Reefs, 2: 37-42.

Cláudia Ribeiro
150
Samoilys, M.A., 1998. Abundance and species richness of coral reef fish on the Kenyan coast: the effects of protective management and fishing. Pp 261-266. In: 6th International coral reef symposium Townsville Australia.
Samoilys, M.A. & G. Carlos, 2000. Determining methods of underwater census for estimating the abundance of coral reef fishes. Environmental Journal of Fishes, 57: 289-304.
Schmitt, E.F., R.D. Sluka & K.M. Sullivan, 2002. Evaluating the use of roving diver and transect surveys to assess the coral reef fish assemblages off southeastern hispaniola. Coral Reefs, 21: 216-223.
Schmitt, E.F. & K.M. Sullivan, 1996. Analysis of a volunteer method for collecting fish presence and abundance data in the Florida Keys. Bulletin of Marine Science, 59: 404-416.
Scott, J.M. & F.L. Ramsey, 1981. Length of count period as a source of bias in estimating bird numbers. Pp 409-413. In: Estimating the number of terrestrial birds. Studies in Avian Biology. Ralf, C.J., Scott, J.M. (eds), Cooper Ornith. Society, Lawrence, KS.
Seaman, W.J., 2000. Artificial Reef Evaluation with application to natural marine habitats.Kennish, M.J., Lutz, P.L., London, CRC Press. 246 pp.
Sedberry, G.R. & J. Carter, 1993. The fish community of a shallow tropical lagoon in Belize, Central America. Estuaries, 16: 198-215.
Shears, N.T. & R.C. Babcock, 2002. Marine reserves demonstrate top-down control of community structure on temperate reefs. Oecologia, 132: 131-142.
Shepard, R.N., 1962. The analysis of proximities: multidimensional scaling with an unknown distance funtion. Psychometrika, 27: 125-140.
Shepherd, A.R., R.M. Warwick, K.R. Clarke & B.e. Brown, 1992. An analysis of fish community response to coral mining in the Maldives. Environmental Journal of Fishes, 33: 367-380.
Sherman, R.L., D.S. Gilliam & R.E. Spieler, 1999. A preliminary examination of depth associated spatial variation in fish assemblages on small artificial reefs. Journal of Applied Ichthyology, 15: 116-121.
Shirai, Y. & Y. Harada, 2003. Evaluation of the advantage of marine protected areas over the reduction of the fishing mortality coefficient. Fiheries Science, 69: 465-472.
Short, E.T. & S. Wyllie-Echeverria, 1996. Natural and human-induced disturbances of seagrasses. Environment Conservation, 23: 17-27.
Silva, S.F.C., 1999. Estudo de alguns endoparasitas de Serranus atricauda (Günther, 1874) (Percomorphi; Serranidae). Relatório de Estágio de Licenciatura, Universidade da Madeira, 40 pp.
Simpson, R.A., 1977 The biology of two offshore platforms. Pp 14. Institute Marine Research University of California. Institute Marine Research University of California.
Slobodkin, L.B. & L. Fishelson, 1974. The effect of cleaner-fish Labroides dimidiatus on the point diversity of fishes on the reef front at Eilat. American Naturalist, 108: 369-376.
Smith, C.L. & J.C. Tyler, 1973. Population ecology of a bahamian suprabenthic shore fish assemblage. American Museum Novitates, 1-38.
Smith, P.G.R. & J.B. Theberge, 1986. A review of criteria for evaluating natural areas. Environmental Mannuals, 10: 715-734.
Soto, C.G., 2002. The potential impacts of global climate change on marine protected areas. Reviews in Fish Biology and Fisheries, 11: 181-195.
Spyker, K.A. & P. Van Den Berghe, 1995. Diurnal abundance patterns of Mediterranean fishes assessed on fixed transects by scuba divers. Transactions of the American Fisheries Society, 124: 216-224.

Comparison of Rocky Reef Fish Communities Using Underwater Visual Techniques
151
Stewart-Oaten, A., W.M. Murdoch & K.R. Parker, 1986. Environmental imapct assessment: "pseudorepliction" in time? Ecology, 67: 929-940.
Talbot, F.H., B.C. Russel & G.R.V. Anderson, 1978. Coral reef fish communities: unstable high-diversity systems? Ecological Monographs, 425-440.
Thompson, A.A. & B.D. Mapstone, 1997. Observer effects and training in underwater visual surveys of reef fishes. Marine Ecology Progress Series, 154: 53-63.
Thresher, R.E. & J.S. Gunn, 1986. Comparative Analysis of visual censuses techniques for higly mobile, reef-associated piscivores (Carangidae). Environmental Biology of Fishes, 17: 93-116.
Tilman, D., R.M. May, C.L. Lehman & M.A. Nowak, 1994. Habitat destruction and the extinction debt. Nature, 371: 65-66.
Trenkel, V.M., J.K. Pinnegar, M.-J. Rochet & B.D. Rackham, 2004. Different surveys provide similar pictures of trends in a marine fish community but not of individual fish populations. Journal of Marine Science, 61: 351-362.
Tunesi, L., A. Molinari & E. Salvati, 2006. Fish assemblage of the marine protected area of Cinque Terre (NW Mediterranean Sea): first characterization and assessment by visual census. Chemistry and Ecology, 22 (Sup. nº 1): S245-S253.
Tupper, M. & W. Hunte, 1998. Predicability of fish assemblages on artificial and natural reefs in Barbados. Bulletin of Marine Science, 62: 919-935.
Turner, S.J., S.F. Thrush, J.E. Hewitt, V.J. Cummings & G. Funnell, 1999. Fishing impacts and the degradation or loss of habitat structure. Fisheries Management and Ecology, 4: 401-420.
Tuya, F., A. Boyra, P. Sanchez-Jeres, C. Barbera & R. Haroun, 2004a. Can one species determine the structure of the benthic community on a temperate rocky reef? The case of the long-spined sea-urchin Diadema antillarum (Echinodermata: Echinoidea) in the eastern Atlantic. Hydrobiologia, 519: 211-214.
Tuya, F., A. Boyra, P. Sanchez-Jeres, C. Barbera & R. Haroun, 2004b. Relationships between rocky-reef fish assemblages, the sea urchin Diadema antillarum and macroalgae throught the Canarian Archipelago. Marine Ecology Progress Series, 278: 157-169.
Tuya, F., A. Boyra, P. Sánchez-Jerez, C. Barbera & R.J. Haround, 2004c. Can one species determine the structure of the benthic community on a temperate rocky reef? The case of the long-spined sea-urchin Diadema antillarum (Echinodermata: Echinoidea) in the eastern Atlantic. Hydrobiologia, 519: 211-214.
Tuya, F., L. Ortega-Borges, P. Sanchez-Jeres & R.J. Haroun, 2006. Effect of fishing pressure on the spatial-temporal variability of the parrotfish, Sparisoma cretense (Pisces: Scaridae), across the Canarian Archipelago (eastern Atlantic). Fisheries Research, 77: 24-33.
Tuya, F., M.L. Soboil & J. Kido, 2000. An assessment of the effectiveness of Marine Protected areas in the San Juan Islands, Washington, USA. ICES Journal of Marine Science, 57: 1218-1226.
Underwood, A.J., 1991. Beyond BACI: experimental designs for detecting human environmental impacts on temporal variations in natural populations. Australian Journal of Marine and Freshwater Research, 42: 569-587.
Underwood, A.J., 1997. Experiments in Ecology. Their logical design and interpretation using analysis of variance. Cambridge University Press, Cambridge, 504 pp.
Valentine, J., K.L.J. Heck, J. Busby & D. Webb, 1997. Experimental evidence that herbivory increases shoot density and productivity in a subtropical turtlegrass Thalassia testudinum meadow. Oecologia, 112: 193-200.
Valle, C., J.T. Bayle-Sempere & A. Ramos-Espla, 2003. Aproximación multiescalar al estudio de la ictiofauna del litoral rocoso de Ceuta (España). Boletín Instituto Español de Oceanografia, 19: 419-431.

Cláudia Ribeiro
152
Vanderklift, M.A., T.J. Ward & J.C. Phillips, 1998. Use of assemblages derived from different taxonomic levels to select areas for conserving marine biodiversity. Biological Conservation, 86: 307-315.
Victor, B.C., 1983. Recruitment and population dynamics of a coral reef fish. Science, 219: 419-420.
Walker, B., 1995. Conserving biological diversity through ecosystem resilience. Conservation Biology, 9: 747-752.
Wang, Y.H., 1978 Artificial reef and beach erosion control. Pp 38-40. Florida Sea grant College Report 24.
Wantiez, L.P., P. Thollot & M. Kulbicki, 1997. Effects of marine reserves on coral reef fish communities from five islands in New Caledonia. Coral Reefs, 16: 215-224.
Ward, F., 1990. Florida's coral reefs are imperiled. National Geographic, July: 115-132. Warwick, R.M., 1993. Environmental impact on marine communities: pragmatical
considerations. Australian Journal of Ecology, 18: 63-80. Watkins, N.D. & A. Abdel-Monem, 1971. Detection of the Gilsa geomagnetic polarity
event on the island of madeira. Bulletin of Geology Society American, 82: 191-198. Watson, D.L., E.S. Harvey, M.J. Anderson & G.A. Kendrick, 2005. A comparison of
temperate reef fish assemblages recorded by three underwater stereo-video techniques. Marine Biology, 148: 415-425.
Watson, R., J. Alder & C. Walters, 2000. A dynamic mass-balance for marine protected areas. Fish and Fisheries, 1: 94-98.
Watson, R.A. & T.J. Quinn, 1997. Performance of transect and point count underwater visual census methods. Ecological Modelling, 104: 103-112.
Wellington, G.M. & B.C. Victor, 1985. El Niño mass coral mortality: a test of resource limitation in a coral reef damselfish population. Oecologia, 68: 15-19.
Westera, M., P. Lavery & G. Hyndes, 2003. Differences in recreationally targeted fishes bewteen protected and fished areas of coral reef marine park. Journal of Experimental Marine Biolology and Ecology, 294: 145-168.
Whitehead, P.J.P., M.L. Bauchot, J.C. Hureau, J. Nielsen & E. Tortonese, 1986. Fishes of the North-eastern Atlantic and Mediterranean.Paris, UNESCO. 1473 pp.
Williams, I.D. & N.V.C. Polunin, 2000. Differences between protected and unprotected reefs of the western carribean in atributes preferred by dive tourists. Environmental Conservation, 27: 382-391.
Williams, I.D., W.J. Walsh, B.N. Tissot & L.E. Hallacher, 2006. Impact of observers' experience level on counts of fishes in underwater visual surveys. Marine Ecology Progress Series, 310: 185-191.
Willis, T.J., 2001. Visual census methods underestimate density and diversity of cryptic reef fishes. Journal of Fish Biology, 59: 1408-1411.
Willis, T.J., R.B. Millar & C. Babcock, 2000. Detection of spatial variability in relative density of fishes: comparison of visual census, angling, and baited underwater video. Marine Ecology Progress Series, 198: 249-260.
Wirtz, P., 1994. Underwater Guide Fish. Madeira, Canary Islands, Azores. Verlag Stephanie Naglschmid, Stuttgart, 159 pp.
Wirtz, P., 1995a. One vascular plant and ten invertebrate species new to the marine flora and fauna of Madeira. Arquipélago. Life and Marine Science, 13A: 119-123.
Wirtz, P., 1995b. Underwater guide Madeira, Canary Islands, Azores: Invertebrates. Verlag Stephanie Naglschmid, Stuttgart, 247 pp.
Wirtz, P., 2001. Madeira Marine Life. Funchal, 192 pp. Wirtz, P., 2005. Eight gastropods new for the marine fauna of Madeira. Arquipélago. Life
and Marine Sciences, 22A: 81-84.

Comparison of Rocky Reef Fish Communities Using Underwater Visual Techniques
153
Witman, J.D. & P.K. Dayton, 2001. Rocky subtidal communities. Pp 339-366. In: Marine Community Ecology. Bertness, M.D., Gaines, S.D., Hay, M.E. (eds), Sinauer, Sunderland, M.A.
Worm, B., M. Sandow, A. Oschlies, H.K. Lotze & R.A. Myers, 2005. Global Patterns of Predator Diversity in the Open Oceans. Science, 309.: 1365 - 1369.
Zar, J., 1999. Biostatistical Analysis. Prentice Hall, New Jersey, 633 pp.

Cláudia Ribeiro
154

Comparison of Rocky Reef Fish Communities Using Underwater Visual Techniques
155
ANNEXE

Cláudia Ribeiro
156

Comparison of Rocky Reef Fish Communities Using Underwater Visual Techniques
157
Annexe Table - List of species recorded in Garajau Marine reserve by Delgado (1998) and Mello (2000) using visual transect counts
Aulostumidae Aulostomus strigosus Wheeler, 1955 Atherinidae Atherina presbyter Cuvier, 1829 Atherina presbyter Cuvier, 1829Balistidae Balistes capriscus Gmelin, 1788 Ballistes capriscus Gmelin, 1788Belonidae Belone sp.Blenniidae indetermined
Ophioblennius atlanticus (Valenciennes, 1836) Ophioblennius atlanticus (Valenciennes, 1836)Carangidae Pseudocaranx dentex (Bloch & Schneider, 1801) Pseudocaranx dentex (Bloch & Schneider, 1801)
Seriola sp. Seriola sp.Thachinotus ovatus (Linnaeus, 1758)
Caproidae Capros aper (Linnaeus, 1758)Congridae Hetroconger longissimus Günther, 1870 Heteroconger longissimus Günther, 1870Dasyatidae Dasyatis pastinaca (Linnaeus, 1758) Dasyatis pastinaca (Linnaeus, 1758)
Taeniura grabata (Geoffroy St. Hillaire, 1871)Diodontidae Diodon hystrix (Linnaeus, 1758)Echeneidae Remora remora (Linnaeus, 1758)
Haemulidae Pomadasis incisus (Bowdich, 1825) Pomadasis incisus (Bowdich, 1825)Kyphosidae Kyphosus sectator (Linnaeus, 1766) Kyphosus sectator (Linnaeus, 1766)Labridae Bodianus scrofa (Valenciennes, 1839) Bodianus scrofa (Valenciennes, 1839)
Centrolabrus trutta (Lowe, 1834)Coris julis (Linnaeus, 1758) Coris julis (Linnaeus, 1758)Symphodus mediterraneus (Linnaeus, 1758)Thalassoma pavo Linnaeus, 1758 Thalassoma pavo Linnaeus 1758indetermined
Myliobatidae Myliobatis aquila (Linnaeus, 1758)Mobula mobular (Bonnaterre, 1788)
MugilidaeMullidae Mullus surmuletus Linnaeus, 1758 Mullus surmuletus Linnaeus, 1758Muraenidae Muraena augusti (Kaup, 1856) Muraena augusti (Kaup, 1856)
Muraena helena Linnaeus, 1758 Muraena helena Linnaeus, 1758Pomacentridae Abudefduf luridus (Cuvier, 1830) Abudefduf luridus (Cuvier, 1830)
Chromis limbata (Valenciennes, 1830) Chromis limbata (Valenciennes, 1830)Priacanthidae Heteropriacanthus cruentatus (Lacepède, 1801) Heteropriacantus cruentatus (Lacepède, 1801)Phycidae Phycis phycis (Linnaeus, 1766)Scaridae Sparisoma cretense (Linnaeus, 1758) Sparisoma cretense (Linnaeus, 1758)Scombridae Sarda sarda (Bloch, 1793)Scorpaenidae Scorpaena sp.
Scorpaena maderensis Valenciennes, 1833Serranidae Epinephelus marginatus (Lowe, 1834) Epinephelus marginatus (Lowe, 1834)
Mycteroperca fusca (Lowe, 1836) Mycteroperca fusca (Lowe, 1836)Serranus atricauda Günther, 1874 Serranus atricauda Günther, 1874
Sparidae Boops boops (Linnaeus, 1758) Boops boops (Linnaeus, 1758)Diplodus cervinus (Lowe, 1810) Diplodus cervinus (Lowe, 1810)Diplodus sargus (Linnaeus, 1758) Diplodus sargus (Linnaeus, 1758)Diplodus vulgaris (E. Geoffroy St.-Hilaire, 1817) Diplodus vulgaris (E. Geoffroy St.-Hilaire, 1817)Oblada melanura (Linnaeus, 1758) Oblada melanura (Linnaeus, 1758)
Pagrus pagrus (Linnaeus, 1758)Pagrus pagrus (Linnaeus, 1758)
Sarpa salpa (Linaneus, 1758)Spondyliosoma cantharus (Linnaeus, 1758) Spondyliosoma cantharus (Linnaeus, 1758)
Synodontidae Synodus saurus (Linnaeus, 1758) Synodus saurus (Linnaeus, 1758)Synodus synodus (Linnaeus, 1758) Synodus synodus (Linnaeus, 1758)
Sphyraenidae Sphyraena viridensis (Cuvier, 1829) Sphyraena viridensis (Cuvier, 1829)Tetraodontidae Canthigaster capistrata (Lowe, 1839) Canthigaster capistrata (Lowe, 1839)
Sphoeroides marmoratus (Lowe, 1839) Sphoroides marmoratus (Lowe, 1839)Trypterygiidae Tripterygion delaisi Cadenat et Blache, 1971 Tripterigion delaisi Cadenat et Blache, 1971
FAMILIES SPECIES
Delgado (1998) Mello (2000)