
Universidad Complutense de Madrid - CORE · UNIVERSIDAD COMPLUTENSE DE MADRID . ... RESUMEN 15...
163
UNIVERSIDAD COMPLUTENSE DE MADRID FACULTAD DE PSICOLOGÍA DEPARTAMENTO DE PSICOLOGÍA BÁSICA II TESIS DOCTORAL Profiles of brain magnetic activity in normal aging and mild cognitive impairment during resting state and the performance of the paradigm "IDICS" Perfiles de actividad magnética cerebral en el envejecimiento normal y el deterioro cognitivo leve durante el estado de resposo y la realización del paradigma "IDICS" MEMORIA PARA OPTAR AL GRADO DE DOCTORA PRESENTADA POR María Eugenia López García Director Fernando Maestú Unturbe Madrid, 2014 ©María Eugenia López García, 2014
Transcript of Universidad Complutense de Madrid - CORE · UNIVERSIDAD COMPLUTENSE DE MADRID . ... RESUMEN 15...

UNIVERSIDAD COMPLUTENSE DE MADRID FACULTAD DE PSICOLOGÍA
DEPARTAMENTO DE PSICOLOGÍA BÁSICA II
TESIS DOCTORAL
Profiles of brain magnetic activity in normal aging and mild cognitive impairment during resting state and the performance of the paradigm "IDICS" Perfiles de actividad magnética cerebral en el envejecimiento normal y el deterioro cognitivo
leve durante el estado de resposo y la realización del paradigma "IDICS"
MEMORIA PARA OPTAR AL GRADO DE DOCTORA
PRESENTADA POR
María Eugenia López García
Director
Fernando Maestú Unturbe
Madrid, 2014
©María Eugenia López García, 2014

Universidad Complutense de Madrid Facultad de Psicología
Departamento de Psicología Básica II
Profiles of brain magnetic activity in normal aging and mild cognitive
impairment during resting state and the performance of the paradigm
"IDICS"
Perfiles de la actividad magnética cerebral en el envejecimiento normal y
el deterioro cognitivo leve durante el estado de reposo y la realización
del paradigma “IDICS”
Director
Fernando Maestú Unturbe Psicología Básica II (Procesos Cognitivos). Universidad Complutense de Madrid
Ph. D. Thesis María Eugenia López Madrid, Abril 2014

CONTENTS

LIST OF TABLES 1
LIST OF FIGURES 3
ACKNOWLEDGEMENTS 6
ORIGINAL PUBLICATIONS 9
GLOSSARY OF ABBREVIATIONS OF THE MAIN TERMS 12
RESUMEN 15
SUMMARY 20
GENERAL INTRODUCTION 25
1. Alzheimer´s Disease 26
2. Mild Cognitive Impairment 30
3. Magnetoencephalography 34
4. The brain as an oscillatory system 38
5. Resting state in AD and MCI patients 42
6. Internally directed cognitive state (IDICS) 45
7. Progression from MCI to AD 49
STUDY I. MEG spectral analysis in subtypes of Mild Cognitive Impairment 52
1. AIMS AND HYPOTHESES 53
2. METHODS 54
2.1 Subjects 54
2.2 Diagnostic criteria 55
2.3 MEG Recordings 56
2.4 MRI and hippocampal volumes 57
2.5 Power spectra and statistical Analysis 58
2.5.1 Power, Hippocampal volumes and Neuropsychology Correlation 59

3. RESULTS 60
3.1 Description of power spectra 60
3.2 Differences in relative power among groups 61
3.2.1 Differences within the delta band range 61
3.2.2 Differences within the theta band range 62
3.2.3 Differences within the alpha band range 63
3.2.4 Differences within the beta band range 64
3.3 Power, Hippocampal Volumes and Neuropsychology Correlations 65
4. DISCUSSION 69
STUDY II. Synchronization during an Internally Directed Cognitive State in healthy aging and
Mild Cognitive Impairment. A MEG study 74
1. AIMS AND HYPOTHESES 75
2. MATERIALS AND METHODS 76
2.1 Subjects 76
2.2 Diagnostic criteria 76
2.3 Experimental design 78
2.4 MEG Recordings and preprocessing 79
2.5 Functional connectivity analysis 80
2.6 Hippocampal volume 82
2.7Statistical Analysis 82
3. RESULTS 84
3.1 Behavioral performance 84
3.2 MEG connectivity results 85
3.2.1 Delta band 88
3.2.2 Theta band 88
3.2.3 Alpha band 89
3.2.4 Beta band 90

3.2.5 Gamma band 90
3.3 1-and 3-subtraction tasks 91
4. DISCUSSION 92
4.1 Resting versus IDICS task 92
4.2 Control group vs MCI group 94
4.3 Task load 95
4.4 Limitations of the study 97
STUDY III. Hypersynchronization in alpha band differs progressive from stable mild cognitive
impairment. A MEG study 98
1. AIMS AND HYPOTHESES 99
2. METHODS 100
2.1 Subjects 100
2.2 Diagnostic criteria 100
2.3 Hippocampal volumes 101
2.4 MEG recordings 102
2.5 Source reconstruction 103
2.6 Connectivity Analysis 103
2.7 Statistical Analysis 104
3. RESULTS 106
4. DISCUSSION 111
GENERAL DISCUSSION 114
CONCLUSIONS 125
FUTURE DIRECTIONS 127
REFERENCES 130
ANNEXES 157

1
LIST OF TABLES

2
STUDY I
Table 1. Mean values ( standard deviation) of the demographic and clinical characteristics of
a-sd-MCI, a-md-MCI and Controls 54
Table 2. Pearson correlation analyses of averaged power values in the significant clusters with
neuropsychological test scores and hippocampal volumes in the whole sample 67
STUDY II
Table 1. Subject´s information 78
Table 2. IDICS performance in Controls and MCIs 84
STUDY III
Table 1. Demographic, anatomical and neuropsychological information 106
Table 2. The five significant links in the alpha band between sMCI patients and pMCI 109
Table 3. Spearman correlation analyses of the five significant links obtained in the alpha band
with neuropsychological test scores and hippocampal volumes in the whole sample 110

3
LIST OF FIGURES

4
GENERAL INTRODUCTION
Figure 1. Alois Alzheimer (1864- 1915) and Auguste Deter (1849- 1906) 27
Figure 2. Model of the clinical trajectory of Alzheimer’s disease (AD) 29
Figure 3. Petersen´s MCI Diagnosis criteria 30
Figure 4. Outline of the syndrome of mild cognitive impairment 32
Figure 5. Hypothetical model of dynamic biomarkers of the AD expanded to explicate the
preclinical phase 33
Figure 6. Elekta MEG system 34
Figure 7. Process of acquisition of the MEG signal 35
Figure 8. Graphic showing the relative spatial and temporal resolutions of common
neuroimaging techniques 36
Figure 9. The isolated and magnetically shielded room where the MEG is located 37
Figure 10. The brain understood as segregation or integration system 38
Figure 11. Graphical representation of an analogic signal in time and frequency domains 39
Figure 12. Depiction of the five frequency bands most studied with EEG/MEG 40
Figure 13. The default mode network 46
STUDY I
Figure 1. Workflow 57
Figure 2. Average relative power spectra 60
Figure 3. Significant F values corresponding to the exploratory ANOVA tests for each sensor
and frequency step. MEG helmet layout showing the distribution of sensors 61
Figure 4. Differences within the delta band range 62
Figure 5. Differences within the theta band range 63
Figure 6. Differences within the alpha band range 64
Figure 7. Differences within the beta band range 65

5
STUDY II
Figure 1. MEG sensor layout 81
Figure 2. Statistical differences in connectivity between resting and 3-substraction task for
controls and MCIs 85
Figure 3. Number of significantly altered links when comparing resting and task for different
groups and frequency bands 86
Figure 4. Statistical differences in connectivity between controls and MCIs in resting state and
3-substraction task 87
STUDY III
Figure 1. Cortical areas implied in the five connectivity links that showed significant differences
between groups 108
GENERAL DISCUSSION
Figure 1. A modified model of the continuum of the AD proposed by Sperling (2011) 115
Figure 2. A model of synchronization during the execution of cognitive tasks in the continuum
of dementia 120

6
ACKNOWLEDGEMENTS

7
A nuestros mayores
En primer lugar, quiero dedicar esta tesis a nuestros mayores, y en especial, a todas aquellas
personas que han participado en este estudio. Sin ellos, nada de esto habría sido posible. No
debemos olvidar nunca que el fin último de nuestro trabajo son las personas, sus recuerdos,
sus “ahoras”.
A mi familia
Gracias por haberme inculcado los valores del esfuerzo, la tenacidad y la lucha por alcanzar lo
que uno quiere, por haberme dado una educación magnífica, por vuestro apoyo y respeto en
todos y cada uno de los pasos que he ido dando a lo largo de estos treinta años.
A mis amigos de siempre y a los nuevos fichajes
He tenido la gran suerte de conocer a magníficas personas con las que he vivido y sigo
compartiendo momentos inolvidables. A algunos os llevo conmigo desde prescolar y a otros
hace poco que os conocí, pero a todos vosotros os quiero dar las gracias por haberos cruzado
en mi camino.
A mi director de tesis
Aún recuerdo aquella llamada que me animó a elegir la FPU… Gracias por el apoyo y la
confianza que mostraste en mí desde un principio, por alentarme en un mundo que era
completamente nuevo para mí, y por contagiarme el entusiasmo que muestras sobre lo que
hacemos.
A mis compañeros y amigos del Laboratorio
A los que estáis, a los que se fueron, a todos los que he tenido el placer de conocer en la
“magneto”. Esta tesis es fruto del trabajo de muchas personas, y sin vuestra ayuda y en
muchas ocasiones, paciencia, habría sido imposible llevarla a cabo. Os quiero dar las gracias a
TODOS y cada uno de vosotros por haber compartido conmigo estos cuatro añazos en los me
habéis enseñado muchísimas cosas que van más allá de lo académico, y que me han hecho
crecer como persona. Lo extraordinario de este trabajo lo hacéis vosotros, gracias.

8
Al resto de profesionales del Proyecto
Del Hospital Clínico, del Hospital Ramón y Cajal, del Centro Prevención del Deterioro Cognitivo
del Ayuntamiento de Madrid, y del Centro de Día de Chamartín. Por haber hecho posible que
todo el trabajo saliera adelante.
To Amsterdam
I´d like to thank all the people I met in Amsterdam for their hospitality, for all the things they
taught me and for making me feel at home during my stay there. I´ll be back!
A tí
Por creer en mí, por enseñarme lo que es levantarse después de caer y por formar parte de mi
vida. Gracias.
Esta tesis doctoral ha sido posible gracias al Programa de Formación del Personal Universitario
(FPU) del Ministerio de Educación de España.

9
ORIGINAL PUBLICATIONS

10
This Thesis is based on the three following articles:
Study I
López ME*, Cuesta P*, Garcés P, Castellanos PN, Aurtenetxe S, Bajo R, Marcos A, Delgado ML, Montejo P, López- Pantoja JL, Maestú F, Fernandez A. 2013. MEG spectral analysis in subtypes of Mild Cognitive Impairment. AGE. DOI 10.1007/s11357-014-9624-5. Study II López M.E.*, Garcés P.*, Cuesta P, Castellanos P.N., Aurtenetxe S., Bajo R., Marcos A., Montenegro M., Yubero R., del-Pozo F., Sancho M., Maestú F. Synchronization during an Internally Directed Cognitive State in healthy aging and Mild Cognitive Impairment. A MEG study. AGE. DOI 10.1007/s11357-014-9643-2. Study III Hypersynchronization in alpha band differs progressive from stable mild cognitive
impairment. A MEG study. López ME*, Bruña R*, Aurtenetxe S, Pineda JA, Marcos A, Arrazola
J, Reinoso AI, Pedro Montejo, Bajo R, Maestú F. Journal of Neuroscience (Under Review).
Other publications: Pablo Cuesta; Ana Barabash; Sara Aurtenetxe; Pilar Garcés; María Eugenia López; Ricardo Bajo; Marcos Llanero-Luque; Inés Ancín; José Antonio Cabranes; Alberto Marcos; Miguel Sancho; Akinori Nakamura; Alberto Fernández. Source Analysis of Spontaneous Magnetoencephalograpic Activity in Healthy Aging and Mild Cognitive Impairment: Influence of Apolipoprotein E. Journal of Alzheimer´s Disease (Under Review).
Ricardo Bajo; Sandra Pusil; María Eugenia López; Leonides Canuet; Ernesto Pereda; Fernando Maestú; Daria Osipova; Eero Pekkonen. Scopolamine effects on brain functional connectivity in elderly subjects: a pharmacological model of Alzheimer’s disease. Alzheimer's & Dementia (Under
Review). Pablo Cuesta; Pilar Garcés; Nazareth P. Castellanos; María Eugenia López; Sara Aurtenetxe; Ricardo Bajo; José Ángel Pineda-Pardo; Ricardo Bruña; Antonio García Marín; Alberto Marcos; María Luisa Delgado; Ana Barabash; Inés Ancín; José Antonio Cabranes; Akinori Nakamura; Miguel Sancho; Fernando Maestú. Resting state network disruption in healthy and pathological aging. Role of APOE genotype. Brain (Under Review). María Eugenia López*; Leonides Canuet*; Sandra Pusil*; Sara Aurtenetxe; Ricardo Bruña; Guillermo García Ribas; José María Gaztelu; Pablo Cuesta; Ricardo Bajo; Fernando Maestú. Network disruption associated with elevated cerebrospinal fluid p-tau in mild cognitive impairment patients. Brain (Submitted). Fernando Maestú, Jose María Peña; Pilar Garcés; Santiago Gonzalez; Ricardo Bajo; Anto Bagic; Pablo Cuesta; Michael Funke; Jyrki Makela; Ernestina Menasalvas; Akinori Nakamura; Lauri Parkkonen; Maria Eugenia López; Francisco del Pozo; Gustavo Sudre; Edward Zamrini; Eero Pekkonen; Richard Henson; James Becker. A Multicenter Study of the Early Detection of

11
Synaptic Dysfunction in Mild Cognitive Impairment using Magnetoencephalography-derived Functional Connectivity. NeuroImage: Clinical (Under Review). Sara Aurtenetxe, Javier García-Pacios, David del Río, Maria Eugenia López, Alberto Marcos, Maria Luisa Delgado, Garikoitz Beitia, Fernando Maestú. Interference modulates working memory in mild cognitive impairment. Journal of the International Neuropsychological Society (Under Review). Garcés P., Vicente R., Wibral M., Pineda J.A., López M.E., Aurtenetxe S., Marcos A., de Andres, M.E., Yus M., Sancho M., Maestú F., Fernández A. Brain-wide slowing of spontaneous alpha rhythms in mild cognitive impairment. Frontiers in Aging Neuroscience 5: 1- 7. Pineda J, Garcés P, López ME, Aurtenetxe S, Cuesta P, Marcos A, Montejo P, Yus M, Tamames JA, del- Pozo F, Becker JT, Maestú F. White matter damage disorganizes brain functional networks in amnestic Mild Cognitive Impairment. Brain Connectivity. “In press”. López ME*, Aurtenetxe S*, Pereda E, Cuesta P, Castellanos PN, Bruña R, Niso G, Maestú F, Bajo R. 2013. Cognitive reserve is associated with the functional organization of brain networks in healthy aging: A MEG Study. Frontiers in Aging Neuroscience. “Under Review”.
González-Moreno A, Aurtenetxe S, López-Garcia ME, Maestú F, Nevado A. Signal-to-noise ratio of the MEG signal after preprocessing. Journal of Neuroscience Methods 222: 56- 61. Coullaut R, Arbaiza I, Bajo R, Arrúe R, López ME, Coullaut-Valera J, Correas A, Lopez-Sanz D, Maestu F, Papo D. 2013. Drug polyconsumption is associated with hypersynchronized brain activity at rest and in a counting task. International Journal of Neural Systems 24 (1): 1-13. Bajo R, Castellanos NP, López ME, Ruiz JM, Montejo P, Montenegro M, Llanero M, Gil P, Yubero R, Baykova E, Paul N, Aurtenetxe S, Del Pozo F, Maestu F. 2012. Early dysfunction of functional connectivity in healthy elderly with subjective memory complaints. Age 34(2):497-506. María Eugenia López, Pablo Campo, Irene García- Morales, Antonio Gil-Nagel, Francisco del Pozo, Fernando Maestú. Role of medial temporal lobe in working and episodic memory during enconding. In Temporal Lobe: Anatomy, Functions and Pathology (2012). Chapter 6, pp. 119- 140. Nova Science Publishers, Inc.
* These authors have contributed equally to this work.
http://www.ncbi.nlm.nih.gov/pubmed?term=Montenegro%20M%5BAuthor%5D&cauthor=true&cauthor_uid=21468670
http://www.ncbi.nlm.nih.gov/pubmed?term=Aurtenetxe%20S%5BAuthor%5D&cauthor=true&cauthor_uid=21468670

12
GLOSSARY OF ABBREVIATIONS OF THE MAIN
TERMS

13
Aβ: Amyloid β-peptide
AC: Accuracy
AD: Alzheimer’s disease
ADL: Activities of daily living
a-md-MCI: amnestic multidomain MCI
a-sd-MCI: Amnestic single domain MCI
APOE: Apolipoprotein E
APs: Amyloid plaques
ANOVA: Analysis of variance
BADS: Behavioural Assessment of the Dysexecutive Syndrome
BNT: Boston Naming Test
CDR: Clinical Dementia Rate
COWAT: Controlled Oral Word Association Test
CRUNCH: Compensation-Related Utilization of Neural Circuits Hypothesis
CSF: Cerebrospinal fluid
DMN: Default mode network
EEG: Electroencephalography
EOG: Electrooculogram
FAQ: Functional assessment questionnaire
FAST: Functional Assessment Staging
fMRI: Functional magnetic resonance imaging
FOV: Field of view
GDS: Global Deterioration Scale
GDS: Geriatric Depression Scale
HIS: Hachinski Ischemic Score
HZ: Hertz
ICA: Independent component analysis
ICV: Intracraneal volume
IADL: Instrumental Activities of Daily Living
IDICS: Internally Directed Cognitive State
LH: Left hippocampus
MCI: Mild cognitive impairment
MEG: Magnetoencephalography
MMSE: Mini mental state examination
MRI: Magnetic resonance imaging

14
MTL: Medial temporal lobe
na-md-MCI: nonamnestic multidomain MCI
na-sd-MCI: nonamnestic single domain MCI
NFTs: Neurofibrillary tangles
NINCDS – ADRA: National Institute of Neurological and Communicative Disorders and Stroke
and the Alzheimer’s disease and Related Disorders Association
pMCI: progressive MCI
PET: Positron Emission Tomography
PFC: Prefrontal cortex
PLV: Phase Locking Value
RH: Right hippocampus
SEN: Sensibility
SL: Synchronization likelihood
SPE: Specificity
sMCI: stable MCI
SMC: subjective memory complaints
SQUID: Superconducting Quantum Interference Device
SPECT: Single-photon emission computed tomography
STD: Standard deviation
TMT: Trail Making Test
tSSS: Temporal extension of Signal-Space Separation
UCM: Universidad Complutense de Madrid
UPM: Universidad Politécnica de Madrid
VOSP: Visual Object and Space Perception Test
WM: Working memory

15
RESUMEN
16
La demencia es una de las enfermedades neurodegenerativas que mayor discapacidad
y dependencia genera en la población anciana de todo el mundo. Se estima que el 60-70% de
los casos de demencia se deben a la Enfermedad de Alzheimer (EA), para la cual todavía no
existe un tratamiento curativo. El impacto a nivel cognitivo, físico, psicológico, social y
económico que este trastorno genera sobre el paciente, sus cuidadores y la sociedad en
general, lo convierten en una de las prioridades de la comunidad científica a nivel mundial. Por
ello, existen numerosas investigaciones centradas en el estudio de los estadios iniciales de esta
enfermedad que tratan de arrojar luz sobre cuáles son los factores que predisponen a
padecerla, y sobre aquéllos que pueden ayudar a ralentizar o a revertir sus efectos, siendo el
fin último conseguir mejorar la calidad de vida de las personas que la sufren.
El deterioro cognitivo leve (DCL) se considera un estado intermedio entre el envejecimiento
normal y la demencia, principalmente de tipo Alzheimer. Su investigación resulta esencial para
caracterizar las primeras manifestaciones de la enfermedad, que suelen afectar a la memoria
episódica, y para poder explorar y pronosticar su evolución. Actualmente, son variadas y muy
numerosas las aproximaciones desde las que se está abordando el estudio del DCL, lo que está
ayudando a tener una comprensión cada vez más profunda de esta condición patológica y por
ende, de la EA. Pese a ello, son muchos los interrogantes que a día de hoy quedan todavía por
responder.
Con el objetivo de aportar un granito de arena en el estudio de esta patología, en esta
Tesis se han realizado tres experimentos de Magnetoencefalografía (MEG) en los que han
participado sujetos mayores sanos y con DCL de tipo amnésico. En todos ellos se ha combinado
información neurofisiológica, anatómica y cognitiva, con el propósito de abordar de la forma
más global posible los distintos planteamientos realizados.
Todo ello ha sido posible gracias a la colaboración voluntaria de un gran número de personas
que han participado en un gran proyecto de envejecimiento (PSI2009-14415-C03-01), del cual
hemos formado parte.
A continuación se presenta un resumen de cada uno de los tres experimentos que conforman
la presente Tesis.

17
Estudio I.
Estudio del espectro de la actividad oscilatoria cerebral en los subtipos de deterioro
cognitivo leve
Con el fin de estudiar los patrones de actividad magnética oscilatoria en los subtipos
de DCL amnésico, un total de 105 sujetos se sometieron a un registro de MEG con ojos
cerrados: 36 controles sanos, 33 DCLs de tipo amnésico de dominio único y 36 DCLs de tipo
amnésico de dominio múltiple. Los valores de potencia relativa fueron calculados y
comparados entre los distintos grupos. A continuación, esos valores de potencia relativa se
correlacionaron con las puntuaciones obtenidas en los test neuropsicológicos y con los
volúmenes de hipocampo.
No se encontraron diferencias significativas entre los tres grupos en edad, género y nivel
educativo, pero sí en el volumen de hipocampo y en el estado cognitivo global medido a través
del mini examen cognoscitivo (MMSE). A nivel de actividad cerebral, los dos subtipos de DCL
mostraron un incremento de la potencia relativa en las bandas de baja frecuencia (en los
rangos de frecuencia de delta y theta) y un decremento de los valores de potencia en las
bandas de alta frecuencia (en los rangos de frecuencia de alfa y beta), en comparación con el
grupo control. Cabe destacar que se encontraron claras diferencias en los valores de potencia
entre los dos tipos de DCL amnésico, pero no en la atrofia hipocampal. Los DCL multidominio
mostraron un incremento significativo en los rangos de frecuencia de delta y theta, y un
decremento también significativo en los rangos de alfa y beta. Además este patrón estaba
correlacionado con la ejecución en los test neuropsicológicos, lo que indica que el subtipo
multidominio está asociado no sólo con un mayor enlentecimiento de actividad cerebral, sino
también con un estado cognitivo más deteriorado que los DCL de dominio único y los controles
sanos. Estos resultados sugieren que los DCL multidominio se caracterizan por tener un perfil
de actividad cerebral que está más próximo al observado en la EA. Por tanto, se podría
considerar que la probabilidad de conversión a demencia será más alta dentro de este subtipo
de DCL.

18
Estudio II.
Sincronización durante un estado cognitivo internamente dirigido en ancianos sanos y
pacientes con Deterioro cognitivo leve. Un estudio mediante magnetoencefalografía
En este estudio se trataron de determinar los patrones de conectividad funcional que
son necesarios durante un estado cognitivo internamente dirigido (“Internally Directed
Cognitive State” –IDICS) frente a un estado de reposo, en sujetos normales y con DCL. Esta
tarea se diferencia de las que son más comúnmente utilizadas con MEG/electroencefalograma
(EEG) porque es necesaria la inhibición de los estímulos externos para poder realizarla,
permitiendo el estudio de este mecanismo de control tanto en envejecimiento normal como
en el patológico. Para alcanzar este objetivo, se adquirieron las señales MEG de 32 sujetos
sanos y 38 sujetos con DCL tanto en estado de reposo con ojos cerrados, como durante la
realización de una tarea de substracción mental con dos niveles de dificultad.
No se encontraron diferencias en edad, género o nivel educativo, aunque ambos grupos
diferían en las puntuaciones del MMSE y el volumen de hipocampo. En el estado de reposo, los
DCLs mostraron una mayor conectividad en bandas de baja frecuencia (delta y theta) y una
menor conectividad en bandas de alta frecuencia (alfa, beta y gama), que los controles. Estos
patrones de conectividad también estaban relacionados con un peor estado cognitivo, lo que
lo que sugiere que el DCL podría ser el inicio de un síndrome de alteración de la conectividad
funcional con el cual se caracteriza a la enfermedad de Alzheimer en sus fases iniciales. Por
otro lado, ambos grupos realizaron la tarea con éxito, aunque a nivel neurofisiológico, los
pacientes con DCL mostraron mayores cambios de conectividad entre el estado de reposo y la
tarea, que los sujetos controles, lo cual correlacionaba con un peor estado cognitivo. En
concreto, en los DCLs se encontró una hipersincronización en las bandas delta, theta, beta y
gamma, lo que revela un funcionamiento anómalo en este grupo. Por el contrario, los DCLs
mostraron una falta de sincronización en la banda alfa, lo que podría sugerir que sufren un
déficit en el control inhibitorio. Además, la magnitud de los cambios de conectividad con el
incremento de la dificultad de la tarea en las bandas delta, beta y gamma en el grupo control, y
la ausencia de este efecto en el grupo de pacientes, estaría en la línea del modelo CRUNCH
(Compensation-Related Utilization of Neural Circuits Hypothesis).

19
Estudio III.
La hipersincronización en la banda alfa diferencia el Deterioro progresivo del estable. Un
estudio de magnetoencefalografía
Con el objetivo de estudiar si existían diferencias de conectividad funcional entre los
pacientes con DCL que convertían a Alzheimer frente a los que permanecían estables, se
compararon los registros MEG con ojos cerrados de 30 DCLs estables (DCLe) y 19 DCLs
progresivos (DCLp). El tiempo medio de conversión de los DCLp se situaba en el año, por lo que
fueron considerados conversores rápidos. Ambos grupos no diferían en edad, en género ni en
nivel educativo. Se estudió la conectividad funcional en el espacio de las fuentes en ambos
grupos.
Posteriormente, las diferencias significativas encontradas en la comparación de los dos tipos
de DCL, fueron correlacionados con distintas medidas neuropsicológicas y con el volumen del
hipocampo. Los DCLp en comparación con los DCLs, obtuvieron peores puntuaciones en test
de memoria episódica y semántica, y también de función ejecutiva. A nivel estructural no se
encontraron diferencias en el volumen de hipocampo entre ambos grupos. Sin embargo, a
nivel de conectividad funcional, se encontraron diferencias significativas en 5 links en la banda
alfa, entre el cingulado anterior derecho y el córtex temporo- occipital, principalmente
derecho. Los DCLp mostraron un incremento de sincronización entre esas áreas, que además
estaba inversamente relacionado con la ejecución en varias tareas cognitivas y con el volumen
de ambos hipocampos. Estos resultados sugieren que la pérdida de conexiones gabaérgicas
que están normalmente asociadas con la deposición de amiloide, podrían explicar las
alteraciones encontradas en esta red.

20
SUMMARY

21
Dementia is one of the neurodegenerative diseases that produce the greater disability
and dependency in the elderly population worldwide. It is estimated that 60-70% of cases of
dementia are due to Alzheimer's disease (AD), for which there is still no cure. The impact of
cognitive, physical, psychological, social and economic level that this upset has on the patient,
their caregivers and the general society make it a priority for the scientific community
worldwide. Therefore, there are many research focused on the study of the initial stages of
this disease that try to shed light on the factors that predispose to undergo it, and those which
can help to slow or reverse its effects, being their ultimate goal to improve the quality of life of
those people who suffer it.
Mild cognitive impairment (MCI) is considered an intermediate state between normal aging
and dementia, mainly Alzheimer´s type. Its research is essential to characterize the first
manifestations of the disease, which usually affect the episodic memory, and to explore and
predict its evolution. Currently, there are varied and numerous approaches from being
addressed the study of MCI, which is helping to have an increasingly deep understanding of
this pathological condition and therefore the EA. Nevertheless, many questions that today
there are still unanswered.
In order to provide a bit in the study of this disease, in this Thesis have been conducted three
experiments magnetoencephalography (MEG) in which amnestic MCI and healthy elderly
subjects have participated. All of them combined neurophysiological, anatomical and cognitive
information, in order to address the more global as possible the different approaches made.
This has been made possible by the voluntary cooperation of a large number of people
involved in a great project of aging (PSI2009 -14415 -C03- 01), which we have been a part.
A summary of each of the three experiments that make up this thesis is presented below.

22
Study I.
MEG spectral analysis in subtypes of Mild Cognitive Impairment
In order to study the patterns of oscillatory magnetic activity in amnestic MCI
subtypes, a total of 105 subjects underwent an eyes-closed resting-state
Magnetoencephalographic (MEG) recording: 36 healthy controls, 33 amnestic single domain
MCIs (a-sd-MCI), and 36 amnestic multidomain MCIs (a-md-MCI). Relative power values were
calculated and compared among groups. Subsequently, relative power values were correlated
with neuropsychological tests scores and hippocampal volumes.
No significant differences in age, gender and educational level were found among groups, but
in hippocampal volume and global cognitive state measured by MMSE. At activity brain level,
both MCI subgroups showed an increase of relative power in lower frequency bands (delta and
theta frequency ranges) and a decreased of power values in higher frequency bands (alpha and
beta frequency ranges), as compared with the control group.
More importantly, clear differences emerged from the comparison between the two amnestic
MCI subtypes in power values, but not in hippocampal volumes. The a-md-MCI group showed
a significant power increase within delta and theta ranges, and reduced relative power within
alpha and beta ranges. Such pattern correlated with the neuropsychological performance
indicating that the a-md-MCI subtype is associated not only with a “slowing” of the spectrum
but also with a poorer cognitive status than a-sd-MCI patients and controls. These results
suggest that a-md-MCI patients are characterized by a brain activity profile that is closer to
that observed in Alzheimer´s disease. Therefore, it might be hypothesized that the likelihood
of conversion to dementia would be higher within this subtype.

23
Study II
Synchronization during an Internally Directed Cognitive State in healthy aging and Mild
Cognitive Impairment. A MEG study.
We aimed to determine the functional connectivity pattern required to deal with an
Internally Directed Cognitive State (IDICS) in comparison to a resting state, in healthy aging and
MCI. This task differs from the most commonly employed in MEG/electroencephalography
(EEG) since inhibition from external stimuli is needed to perform it, and it allows the study of
this control mechanism in healthy and pathological aging. To this end, MEG signals were
acquired from 32 healthy individuals and 38 MCI patients, both in resting state and while
performing a subtraction task of two levels of difficulty.
No statistical differences were found between controls and MCIs in age, sex or educational
level, but both groups did differ in MMSE and hippocampal volume. In the resting state, the
DCLs showed increased connectivity in low frequency bands (delta and theta) and decreased
connectivity in high frequency bands (alpha, beta and gamma), than controls. These patterns
of connectivity were also associated with worse cognitive status, which suggest that MCI could
be the start of disconnection syndrome which characterizes Alzheimer's disease. Furthermore,
both groups performed the task successfully, although at a neurophysiological level, MCI
patients presented higher connectivity changes between resting and task than those in the
control group, and this was related to a lower cognitive performance. In particular, in MCIs a
hypersynchronization in delta, theta, beta and gamma bands was found, which reveals an
abnormal functioning in this group. Contrary to controls, MCIs presented a lack of
synchronization in the alpha band, which may denote an inhibition deficit. Additionally, the
magnitude of connectivity changes rose with the task difficulty in delta, beta and gamma
bands in controls but not in MCIs, would be in line with the CRUNCH model (Compensation-
Related Utilization of Neural Circuits Hypothesis).

24
Study III.
Hypersynchronization in alpha band differs progressive from stable mild cognitive
impairment. A MEG study
In order to examine whether there were differences in functional connectivity
between patients with MCI who converted to AD versus those who remained stable, MEG
eyes- closed recordings from 30 stable MCIs (sMCI) and 19 progressive MCIs (pMCI) were
compared. The average conversion time of pMCI was of one year, so they were considered fast
converters. Both groups did not differ in age, gender or education level. Functional
connectivity was studied in source space in both groups.
Then the significant differences between both groups were correlated with neuropsychological
scores and hippocampal volume measures. pMCIs obtained poorer scores in episodic and
semantic memory and also in cognitive functioning. At structural level, there were not
differences in hippocampal volume between both groups. However, at functional connectivity
level, 5 significant links in the alpha band between the right anterior cingulate and temporo-
occipital cortex, mainly of the right hemisphere, were found. pMCI patients showed an
increase in synchronization in these brain areas, which was inversely correlated with the
performance in several cognitive tasks and with both hippocampal volumes. These results
suggest that the loss of gabaergic synapses usually associated with amyloid deposition could
explain the network alterations reported in the present work.

25
GENERAL INTRODUCTION

26
1. ALZHEIMER´S DISEASE
Dementia is one of the most important pathologies among the elderly population,
being Alzheimer´s Disease (AD) the most frequency subtype. It affects about 26 million people
worldwide, and its prevalence will quadruple by 2050 (Selkoe, 1991). Life expectancy is
increasing in most parts of the word, especially in western countries (Blennow, de Leon, &
Zetterberg, 2006). This fact increments the risk of its appearance, since the incidence and
prevalence of AD start to rise around 65 years and at age of 80 and 90 it is nearly 50% (Zamrini
et al., 2011).
AD is a progressive, incurable and neurodegenerative disease whose first cognitive
deficit is memory (Corey-Bloom, 2002), and finally produces a devastating global cognitive
impairment that results in aphasia, apraxia, agnosia, and impaired in judgment, decision-
making, behavior and attention (Hodges, 2006). The first neuropathological case of a patient
affected by AD, Auguste Deter, was described in 1906 by Alois Alzheimer. This patient
presented a combination of cognitive deficits, psychiatric symptoms, and macroscopic and
microscopic brain lesions: amyloid or senile plaques (APs), neurofibrillary tangles (NFTs) and
brain atrophy (Alzheimer, 1907). APs are extracellular aggregates of amyloid β-peptide (Aβ) in
the form of β-plated which accumulate principally in the cortex, and NFTs are mainly
composed by a cytoskeletal microtubule-associated protein, called tau, that becomes
hyperphosphorylated, dissociates from microtubules, and self-aggregates in the cytosol to
form paired helical filaments (Catricala, Torti, & Ricevuti, 2012). Tangles are usually found in
limbic structures, such as hippocampal and parahippocampal regions (Price et al., 2001).
Related to these two major hallmarks of AD, there is a diffuse neuronal and synaptic loss which
produces a reduced brain weight, cortical atrophy and ventricular enlargement. Besides
cortical alterations, which occur mainly in temporal and parietal areas, subcortical neuronal
loss in the Nucleus basalis of Meynert and in the Locus Coeruleus have been also described.
The damage in these nuclei produces a reduction of cholinergic and noradrenergic levels,
respectively (Nestor, Scheltens, & Hodges, 2004).

27
Figure 1. On the left, Alois Alzheimer (1864- 1915). On the right, Auguste Deter, the first person diagnosed with Alzheimer´s Disease (1849- 1906)
In 1984 the National Institute of Neurological and Communicative Disorders and
Stroke- Alzheimer´s Disease and Related Disorders Association (NINCDS-ADRDA)
conceptualized the AD as a “dual clinicopathological entity”: On one hand patients should
present a progressive dementia that included as the primary feature the impairment in
episodic memory, and then the deficit in other cognitive functions, being this affectation so
severe to interfere with daily living; and on the other hand, patients should present
neuropathological alterations, as described above. As neurophysiological changes cannot be
measured during life, AD diagnostic was predominantly made based on clinical entity and
could only be made in terms of probability as “probable AD” (when there were not comorbid
conditions such as depression), “possible AD” (if comorbid conditions were present) while
patients were alive. The “definitive AD” diagnosis was made after post-mortem
histopathological confirmation (G. McKhann et al., 1984).
In order to solve this diagnostic uncertainty, in 2007 the International Working Group for New
Research Criteria for the Diagnosis of AD proposed a new diagnostic framework (Dubois et al.,
2007), based both clinical evidence and in- vivo biomarkers. These biological markers can be
measured using magnetic resonance imaging (MRI), cerebrospinal fluid (CSF) and positron
emission tomography (PET), and can be divided in pathophysiological markers (reduced
concentrations of amyloid β and increased in total tau and phosphorylated tau) and
topographical markers (an atrophy of the medial temporal lobe and a reduced glucose
metabolism in temporo-parietal regions). The specificity and sensitivity of these biomarkers for
Alzheimer´s pathology varies, and also their combination.
According to these new criteria, “probable AD” should be replaced with “typical AD” (clinical
features are further supported by one or more in vivo positive biomarkers of AD), “possible

28
AD” by “atypical AD” (the clinical syndromes are non-amnestic, such as primary progressive
non- fluent aphasia, logopenic aphasia, posterior cortical atrophy and frontal variant of AD;
and a positive biomarker of AD is needed) and “definitive AD” by “neuropathologically verified
AD”.
Although this new approach based on the biomarkers has a great potential in the
diagnosis of AD, is hardly implemented in the clinical context due to its high cost and also
because it is still not enough evidence of its real diagnostic power (Hampel et al., 2010;
Fletcher et al., 2013).
Despite all the efforts in the early detection and accurate diagnosis of AD, numerous crucial
questions remain unanswered. For example, there is an imperfect relation between biological
measures of brain´s pathology, measured cognitive function and real life performance as it has
been found that up to 30% of subjects without clinical pathology at autopsy have a
pathological profile consistent with AD diagnosis (Riley, Snowdon, & Markesbery, 2002;
Knopman et al., 2003; G. M. McKhann et al., 2011). These findings are in line with those that
suggest that AD begins up to 20 years before disease manifests clinically (Grady et al., 1988;
Gray 1994) and hence, it is essential to focus on previous stages of the pathology in order to
initiate a treatment aimed on one hand, to improve or prolong patient´s functions and provide
independence and quality of life and on the other hand, to increase the effectiveness of
current drugs as their effects are more powerful in the initial stages of the disease (Cummings,
2004). Since the prevention is crucial in this neurodegenerative disorder, it is essential to
advance in the understanding of the “presymptomatic” or “preclinical” stages of AD. For this
reason, Sperling et al. (2011) proposed a model of dementia as continuum, which includes
those individuals who present early AD pathological changes but do not meet clinical criteria
for MCI or dementia. Within this preclinical phase, we would find subjects who carry one or
more apolipoprotein E (APOE) ε4 alleles, since it is known that they have an increased risk of
developing AD; those who are carriers of autosomal dominant mutations or subjects with
subjective memory complaints (SMC), who report memory-related complaints that are
otherwise undetectable with standardized objective tests of cognitive performance.
Subsequently, we would find individuals with Mild cognitive impairment (MCI), which is the
main topic of the present Thesis, and finally those who suffer dementia.

29
Figure 2. Model of the clinical trajectory of Alzheimer’s disease (AD). The stage of preclinical AD precedes mild cognitive impairment (MCI) and encompasses the spectrum of presymptomatic autosomal dominant mutation carriers, asymptomatic biomarker-positive older individuals at risk for progression to MCI due to AD and AD dementia, as well as biomarker-positive individuals who have demonstrated subtle decline from their own baseline that exceeds that expected in typical aging, but would not yet meet criteria for MCI. Note that this diagram represents a hypothetical model for the pathological-clinical continuum of AD but does not imply that all individuals with biomarker evidence of AD-pathophysiological process will progress to the clinical phases of the illness. Source: Sperling et al (2011).

30
2. MILD COGNITIVE IMPAIRMENT
Mild cognitive impairment (MCI) has been described as a transitional stage between
normal aging and dementia (R C Petersen, 2004). It is characterized by objective evidence of
cognitive decline that is greater than expected for age and educational level but is still not
severe enough to be considered a full-blown dementia as does not interfere with activities of
daily living (Petersen et al. 2001; Jelic et al. 1996). Prevalence of MCI ranges from 3 to 19% in
the elderly population, showing an incidence from 8 to 58 per 1000 each year (Gauthier et al.,
2006).
Figure 3. Petersen´s MCI Diagnosis criteria. Source: Nelson & Connor (2008).
According to numerous studies, this syndrome is regarded to present a high risk of
progression to dementia compared with the healthy aged population, and particularly of the
Alzheimer type (Shah, Tangalos, & Petersen, 2000; Farias, Mungas, & Jagust, 2005; Ronald C
Petersen & Bennett, 2005). For example, following Petersen’s criteria, the conversion rate
from MCI to dementia is of about 12% per year and up to 80% during approximately 6 years,
while healthy controls convert at a 1–2% rate (R C Petersen, 2001; 2004). Nevertheless, some
MCI patients remain clinically stable or even revert to a “normal” clinical situation over time
(Larrieu et al., 2002; Ganguli, Dodge, Shen, & DeKosky, 2004; Ritchie, 2004). It is important to
point out that conversion rates from MCI to dementia will be differ depending on whether
studies are based in population or clinical samples, which is not surprising according to the
heterogeneous nature of the MCI. Therefore, it is indispensable to make a global and rigorous
assessment of the subjects in order to establish a clear diagnosis, as there are comorbid
conditions, apart from neurodegenerative disorders, that could affect to the cognitive
functioning, such as psychiatric status, education or hormonal changes (Gauthier et al., 2006).

31
There are different scales which are useful to characterize subjects along a continuum
from normal aging to dementia that continue to be used nowadays by clinicians. For example,
the Clinical Dementia Rating (CDR) (Morris, 1993) distinguishes from normal (CDR 0) though
questionable dementia (CDR 0.5) to mild (CDR 1), moderate (CDR 2) and severe dementia (CDR
3). Individuals with CDR 0.5 would be classified as MCI. Another scale is the Global
Deterioration Scale (GDS) (Reisberg, Ferris, de Leon, & Crook, 1982) which identifies seven
clinical stages, from normal (GDS 1), to normal with SMC (GDS 2), mild dementia (GDS 3) and
more severe stages of dementia (from GDS 4 to GDS 7). An MCI patient would have GDS 3.
Finally, one of the most commonly used tests in the clinical context is the MMSE (Folstein,
Folstein, & McHugh, 1975; Lobo, Ezquerra, Gómez Burgada, Sala, & Seva Díaz, 1979) which is a
widely screening used method to detect cognitive impairment. It includes 30 questions to
examine orientation, retention, attention, calculation abilities, language, memory and
visuospatial skills. The cutoff for dementia is usually set at 24 points.
These tools are screening or severity rating scales, no diagnostic instruments. Therefore,
clinical judgment and neuropsychological measures are always required to identify the
presence of behavior and psychological disorders and also to explore the impairment in
different cognitive domains. A neuropsychological assessment should include a variety of
episodic memory test to check both immediate and delayed recall of verbal and nonverbal
material, such as the Logical Memory I and II of the Wechsler Memory Scale, the Boston
Naming Test and the Clock Drawing- order. Beyond memory, other cognitive domains should
be examined, such as: executive functions (i.e. Trail Making Test B, Phonemic Fluency, Rule
shift Cards and Indirect digit Span Test), language (i.e. Semantic Fluency and Boston Naming
Test), visuospatial skills (i.e. Visual Object and Space Perception Test, Clock Drawing Test-
copy), praxis (i.e. Ideomotor Praxis of Barcelona Test) and attention (i.e. Trail Making Test A
and Direct digit Span Test). It is considered that MCI patient´s scores on cognitive test are at
least 1 standard deviation (SD) below average for their age and education matched group (Jelic
et al., 1996), being the memory impairment the most common domain affected among MCI
patients who afterwards progress to AD dementia ( R C Petersen et al., 2001; Nelson &
O’Connor, 2008; Albert et al., 2011).
Clinical and neuropsychological information would be relevant to establish a clinical diagnosis
and to delineate specific MCI subtypes. Although the initial conception of MCI was exclusively
focused on deficits in episodic memory (i.e. the ability to learn new information); it is now
understood that MCI may entail symptoms in other cognitive domains such as executive
functions, visuospatial skills, language and attention. This new perspective classified patients

32
according to two orthogonal axes. In the first one, patients whose main deficit is memory are
defined as “amnestic MCI” (a-MCI), while those with deficits in other cognitive functions but
not in memory are classified as “non-amnestic MCI” (na- MCI). In the second axis, patients are
categorized according to the number of affected cognitive domains. So, patients with only one
cognitive domain affected (e.g. memory or executive function) are named “single domain”
MCIs (sd- MCI), while those with at least two altered domains (e.g. memory plus executive
function) are categorized as “multidomain” MCIs (md-MCI). The combination of these axes
gives rise to the nowadays more broadly utilized classification of MCI subtypes: amnestic single
domain MCI (a-sd-MCI), amnestic multidomain MCI (a-md-MCI), non- amnestic single domain
MCI (na-sd-MCI), and non- amnestic multidomain MCI (na-md-MCI). This classification is
important as MCI subtypes predict specific dementia syndromes. For example, according to
Petersen’s group, the amnestic subtypes (including single and multidomain) represent a
prodromal form of AD and vascular dementia (R C Petersen, 2004), whereas non-amnestic
subtypes (including single and multidomain) might be at higher risk of conversion to Lewy-
Body, Vascular or Fronto-temporal dementias (R C Petersen, 2004; Winblad et al., 2004). The
study of the clinical subtypes of MCI is essential since they are not only associated with
different etiologies but also with a more or less rapid conversion to dementia (Brodaty et al.,
2012; Tabert et al., 2006).
Figure 4. Outline of the syndrome of mild cognitive impairment. Figure shows mild cognitive impairment with predominantly amnestic versus non-amnestic neuropsychological features, potential prodrome to neurodegenerative disorders such as Alzheimer’s disease, frontotemporal dementia, Lewy body disease, or caused by vascular cognitive impairment, psychiatric disorders such as depression or as a prodrome to other medical disorders, including metabolic and nutritional defi ciencies, upper airway obstruction, and head trauma. Source: Figure adapted from Petersen & Morris (2005) by Gauthier (2006).

33
Besides these characteristics of the clinical syndrome (Core clinical criteria), recent
proposals of MCI diagnostic (M. S. Albert et al., 2011) consider the incorporation of clinical
research criteria (i.e. the use of biomarkers). They claim the utilization of a very strict
terminology as the concept “MCI due to AD”, which refers to the symptomatic predementia
phase of AD. As in the case of AD, biomarkers in MCI should reflect Aβ deposition (i.e. CSF and
PET), total tau or phosphorylated- tau deposition (i.e. CSF) or signs of neural injury, such as
brain atrophy, loss of hippocampal volume and hypometabolism or hypoperfusion measured
with MRI, PET and single-photon emission computed tomography (SPECT) imaging. It is
important to emphasize that the application and validation of these biomarkers is currently
limited, and further studies are needed to provide an accurate diagnosis based on these
criteria.
Figure 5. Hypothetical model of dynamic biomarkers of the AD expanded to explicate the preclinical phase: Ab as identified by cerebrospinal fluid Ab42 assay or PET amyloid imaging. Synaptic dysfunction evidenced by fluorodeoxyglucose (F18) positron emission tomography (FDG-PET) or functional magnetic resonance imaging (fMRI), with a dashed line to indicate that synaptic dysfunction may be detectable in carriers of the 34 allele of the apolipoprotein E gene before detectable Ab deposition. Neuronal injury is evidenced by cerebrospinal fluid tau or phospho-tau, brain structure is evidenced by structural magnetic resonance imaging. Biomarkers change from normal to maximally abnormal (y-axis) as a function of disease stage (x-axis). The temporal trajectory of two key indicators used to stage the disease clinically, cognitive and behavioral measures, and clinical function are also illustrated. Figure adapted from Jack et al (2010) by Sperling et al (2011).
The early detection and the prediction of cognitive decline or progression to dementia
among MCI patients are still a critical issue regarding the development of interventions to
prevent or delay the process of neurodegeneration (Jelic, Kivipelto, & Winblad, 2006). For
this purpose, new direct assessments of neuronal damage are needed, such as the
Magnetoencephalography.

34
3. MAGNETOENCEPHALOGRAPHY
Magnetoencephalography (MEG) is a technique which emerged in the late 1960s and
during the last decades its development has allowed shifting from the study of basic cognitive
processes to higher cognitive activity, providing a better understanding of the brain
functioning.
Figure 6. Elekta MEG system. Brain activity can be recorded when the subject is lying down (left) or
sitting (right)
It is a noninvasive procedure which captures the weak magnetic fields of postsynaptic
(intracellular) currents from a large number of the pyramidal neurons (105) of the brain (Hari,
1990). These cells are mainly situated in the V layer of the cortex and postsynaptic potentials
come from their apical dendrites being both inhibitory and excitatory. As electric signals
generate perpendicular magnetic fields, MEG is more sensitive to capture the magnetic activity
from those neurons whose dendrites are oriented tangentially to the scalp, that is, from the
sulci´s brain.

35
Figure 7. Process of acquisition of the MEG signal
One of the main advantages that this technique offers compared with others neuroimaging
tools it is its higher temporal resolution, since allows the recording of cortical dynamics on a
millisecond scale. Besides it also provides a good spatial resolution, although present more
difficulties to measure deeper brain activity, as the magnetic field degrades as the square of
the distance. Both features are essential in the study of brain functioning since allow not only
to specify the brain structures that are involved in cognitive processes but also detail the time
course of their activation.

36
Figure 8. Graphic showing the relative spatial and temporal resolutions of common neuroimaging techniques (EEG: Electroencephalography, IEEG: Invasive Electroencephalography, MEG: Magnetoencephalography, MRS: Magnetic Resonance Spectroscopy, fMRI: functional MRI, SPECT: Single Photon Emission Cranial Tomography, and PET: Positron Emission Tomography). Source: Zamrini et al (2011).
Electroencephalogram (EEG) is the other noninvasive tool that provides information
about brain oscillations with millisecond precision. In contrast to PET and fMRI, EEG and MEG
measure the neural activation directly instead of provide indirect measures such as blood flow
or metabolism, and allow repeated measurements without any risk for the subjects. However,
MEG presents some advantages over the EEG as for example: 1) a better disposition for source
estimation, since magnetic signals are not disturbed for the skull and other tissues (blood
vessels, meninges…); 2) a better signal/noise for higher frequency bands (> 45Hz) and 3) a
better calculus of connectivity measures, as reference electrode is not needed.
The brain magnetic activity is within the order of magnitude of 10 fT-1 pT, equivalent
to one billionth of the strength Earth's magnetic field, and the capture of this tiny signal is
possible by the development Superconducting Quantum Interference Device or SQUID
(Zimmerman, Thiene, & Harding, 1970), which allows the detection of the brain's magnetic
activity without an electric reference (Cohen, 1972). To maintain its superconductivity
capacity, the SQUID´s system needs to be immersed in a Dewar filled which contains liquid
helium at -269 of temperature, being the mainly reason for the high cost of this technique.
The MEG system also needs devices to bring the magnetic signal to the SQUID. These flux
transformers could be magnetometers, which are more sensitive to measure deep magnetic
fields but also external noise, and gradiometers which are more sensitive to measure
superficial activity and to avoid ambient magnetic interference. Within gradiometers, planar

37
gradiometers presents a higher spatial resolution at the surface whereas axial gradiometers
show a better depth resolution. Apart from the great sensitivity of the magnetic
measurements, the external noise must be attenuated. For that purpose, the MEG system is
usually located in an isolated and magnetically shielded room which is composed of layers of
aluminum and µ-metal.
Figure 9. The isolated and magnetically shielded room where the MEG is located
For the MEG studies described in this Thesis a 306-channel Vectorview system
(ElektaNeuromag) localized at the Center for Biomedical Technology (Madrid, Spain) was used.
This MEG system comprised 102 magnetometers and 204 planar gradiometers. Only
magnetometers were used for all the analysis in order to compare our results with previous
ones since most of the AD and MCI studies employed the information provided by this kind of
sensors.

38
4. THE BRAIN AS AN OSCILLATORY SYSTEM
Brain function should be understood and addressed from two main perspectives:
functional segregation and integration. Functional segregation refers to the specialization of
local groups of neurons or brain areas (e.g. specific neurons of primary visual area are
specialized to respond to vertical orientation of the stimulus), whereas the functional
integration alludes to the dynamic interaction among different systems to generate brain
complex brain functions (e.g. describe that stimulus). The equilibrium between segregation
and integration is the responsible of an optimal brain functioning (Tononi, Sporns, & Edelman,
1994; Varela, Lachaux, Rodriguez, & Martinerie, 2001; Buzsáki, 2006; Stam & Straaten, 2012).
The comprehension of the brain as a complex and dynamic entity has been possible thanks to
the development of neuroimaging techniques and the analysis of the data, and the
interdisciplinary approach of the Neuroscience research.
Figure 10. The brain understood as segregation (left) or integration (right) system. Source: Nehatiwari and Lim et al (2013)
Traditionally, human brain was described according to its anatomical structures which
are highly specialized in particular cognitive functions (e.g. hippocampus and episodic
memory). However, the incorporation of the idea of neuronal networks supporting cognitive
functions lead to the concept of functional integration. Thus different brain regions collaborate
to each other in order to support specific or multiple cognitive functions. One way to test
these ideas of functional integration was by taking the advantage of an additional dimension,
time, allowing a better understanding of the interdependencies that occur in the brain at the
functional level. The temporal structure of the brain is organized in oscillations, which are
rhythmic or repetitive small or large-scale fluctuations of the neuronal activity. The
synchronous activity of oscillating neural networks allows the communication among the
different brain areas and is considered to be responsible for the behavior and the cognition
(e.g. perception, memory, and attention).

39
Time allows characterizing the behavior of a wave in three parameters: 1) frequency, which is
the number of occurrences of a repeating event per unit of time (it is the reciprocal of the
period); 2) amplitude, that is the maximum change of the wave over a period; 3) and phase,
which is the relative position of the wave at a time instant. It has been described that large
networks are recruited during slow activity, with oscillation periods of several seconds,
whereas higher frequency oscillations are restricted to a small neuronal space, where one
cycle lasts a few milliseconds (Csicsvari, Jamieson, Wise, & Buzsáki, 2003; Steriade, 2001).
These findings point out the importance of studying the brain activity in temporal and spatial
terms, since the frequency of neural oscillations depends on both.
Figure 11. Graphical representation of an analogic signal in time and frequency domains
Hans Berger described the first human electroencephalography pattern that was
around 8 to 12Hz and mainly localized in occipital areas (Berger, 1929). It was called “alpha
band” and is considered the dominant rhythm in the human brain. After that discovery,
different rhythms were identified, being both EEG and MEG the techniques employed to
measure the macroscopic oscillatory electric fields of the brain. These rhythms were arbitrarily
divided in five classical frequency bands, which in ascending order are: delta (0.5-4 Hz), theta
(4-8 Hz), alpha (8-12 Hz), beta (12-30 Hz) and gamma (>30 Hz). Thus, delta band is most
prevalent in the first 2 years of life and in adults, it is normally seen during drowsiness and
early slow-wave sleep (NO-REM) but if it is observed during wakefulness, it is usually a marker
of brain pathology although it could increase its power in task such as in mental calculation;
theta band appears in the early stages of NO-REM sleep, and in situations of hypnosis or deep
meditation. It is also associated with activities that require attention and with memory
processes, such as working memory, and it is present in a high proportion of children from 1 to
6 years; alpha oscillations are observable during periods of relaxation, with eyes closed but still
awake and are blocked with opened eyes and is related to inhibitory process. Beta band
appears with moderate levels of activation, during motor responses and increases with

40
cognitive effort or emotional implications of tasks, or stimuli. Finally gamma waves are
associated with perception, attention and cognitive tasks. It has been described that within the
same neuronal network, nearby frequency bands may coexist or compete with each other,
reflecting different brain states; whereas in the same or different brain regions, oscillations of
different frequencies may coincide and interact with each other (W Klimesch, 1999; Steriade,
2001).
Figure 12. Depiction of the five frequency bands most studied with EEG/MEG: Delta (0.5-4 Hz), Theta (4-
8 Hz), Alpha (8-12 Hz), Beta (12-30 Hz) and Gamma (>30 Hz)
The assumption of non-stationary of the oscillations involved in brain functioning is
crucial to select the methodology to analyze them, and therefore the spectral characterization
can be done taking in to account the time domain. Fourier transform is a mathematical
transformation which provides the spectral power through the decomposition of a stationary
function that exists throughout the entire duration of the signal, in a sum of sinusoidal
components of different frequencies. As this classical analysis does not inform about the point
of time of appearance of these spectral components, the time-frequency analysis is suitable
for obtaining such information at a well-defined time (Le Van Quyen & Bragin, 2007). Both
types of analysis are useful to characterize the activity of neurons or local brain regions, but to
explore how brain networks communicate with each other, the study of synchronization is
required. To evaluate the synchronization between brain regions, the concept of functional
connectivity has emerged. It refers to linear or nonlinear statistical interdependencies
between time series of physiological signals recorded from different brain areas, providing

41
information about functional interactions between the underlying brain regions (Friston,
2001).
Spectral power and functional analysis supply essential information about how brain works in
healthy and pathological states. However, it should be noted that band power and its
interpretation in terms of (local) levels of neuronal synchronization is not as direct and
straightforward as we could think about (Daffertshofer & van Wijk, 2011).
In order to explore the data from different methodological perspectives, this Thesis begins
with a more classical approach (power in sensor space) to end with the newest analysis in MEG
research (functional connectivity in source space).

42
5. RESTING STATE IN AD AND MCI PATIENTS
Slowing of background activity
Hans Berger first observed the correlation between the cognitive decline in AD
patients and the changes detected in EEG recordings (Berger, 1931; 1932). Most EEG (Babiloni
et al., 2004; Dauwels et al., 2011; Huang et al., 2000; Jeong, 2004) and MEG studies (Berendse,
Verbunt, Scheltens, van Dijk, & Jonkman, 2000; Fernández et al., 2002, 2003; Osipova,
Ahveninen, Jensen, Ylikoski, & Pekkonen, 2005) have found the so- called global “slowing” in
AD. It is characterized by an increase in power in low-frequency range that includes delta and
theta bands, and by a power decrease in higher frequency range which includes alpha and
beta bands. Additionally, topographical changes occurs in the distribution of the alpha and
beta rhythms, which relocate towards anterior areas as the disease progresses (Babiloni et al.,
2004; Claus et al., 1998; Dierks, Ihl, Frölich, & Maurer, 1993); and also in low frequency bands,
which are more prominent in the left temporal area (Rice et al., 1990; Buchan et al., 1997;
Rodriguez, Copello, Vitali, Perego, & Nobili, 1999; Fernandez et al., 2002). The degree of the
brain abnormality measured by EEG/MEG has been associated with APOE genotype, cognitive
impairment, hippocampal atrophy and frontal white matter loss (Lehtovirta et al., 2000;
Fernández et al., 2003; Kwak, 2006; Babiloni et al., 2006c; Gianotti et al., 2007). It is well
establish that in the early stages of the disease there is an increase in theta band accompanied
by a decrease in beta activity, followed by a decreased in the alpha power. As delta activity
increases as the disease progress, patients with mild dementia show an increase in theta and a
decrease in beta bands whereas patients with moderate severe dementia present a decrease
in alpha and a rise in delta power (Coben, Danziger, & Storandt, 1985; Hier et al., 1991).
Many EEG/MEG studies show that MCI patients tend to present intermediate values
between healthy controls and AD patients in their power spectrum. The most stable pattern of
EEG activity in MCI patients is defined by an increase of theta and to a lesser extent of delta,
accompanied by a decrease of alpha and beta power (Prichep et al., 1994, 2006; Babiloni et al.,
2010; Dauwels et al., 2011; Fernández, Hornero, et al., 2006b; D. V Moretti et al., 2007;). In
addition, some studies have also correlated these changes with APOE genotype, frontal white
matter and hippocampal volumes (Babiloni, Benussi, et al., 2006a; Babiloni, Binetti, et al.,
2006a; Babiloni, Frisoni, et al., 2006c; Babiloni et al., 2009, 2010). Of note, the investigation of
differential neurophysiological patterns in MCI subtypes is scarce. This issue was indirectly
addressed by Babiloni et al. (2009) within the background of a research on the relationship
between hippocampal volumes and alpha rhythms. The authors assessed a potential influence

43
of the clinical subtype (i.e. a-MCI vs. na-MCI) and found no significant differences. In a
subsequent study (Babiloni et al., 2010), the issue was explicitly investigated by comparing EEG
rhythms in a-MCIs, na-MCIs, and aged subjects with SMC. Results showed increased occipital
theta and reduced alpha activity in a-MCI, as compared to na-MCI. No distinctions were made
in terms a single or multidomain affectation.
It should be noted that there are also EEG/MEG changes during healthy elderly. The
main modification occurs in alpha band. For example, Chiang, et al. (2011) found that
frequency increases from childhood to young adulthood and slowly begins to decrease with
age; Dustman, et al. (1993) exhibited that apart from this a slowing of alpha frequency, there
was an increase in slow wave activity (delta and theta) and a trend to an increase in beta
activity; and finally Fernández et al. (2006a) described a frequency decrement of 0.17Hz per
year in this group. All this findings suggest that a slowing-down in brain activity is a normal
feature of healthy aging, however it is important to point out that the EEG/MEG pattern
observed in MCI patients is quantitatively different from that observed in the control subjects.
Changes in functional connectivity
It has been suggested that AD can be considered as a “disconnection syndrome”
(Delbeuck, Van der Linden, & Collette, 2003). From a structural point of view, anatomical links
in AD patients are disrupted and this has been associated with a neurofibrillary pathology,
hypometabolism and brain atrophy (Braak & Braak, 1991; Frisch et al., 2013; C L Grady, Furey,
Pietrini, Horwitz, & Rapoport, 2001; Salmon, Lekeu, Bastin, Garraux, & Collette, 2008). And at a
functional level, a decrease in cortico-cortical interactions has been shown in many EEG/MEG
studies. Berendse et al. (2000) described a general decrease of coherence in all frequency
bands; although most functional connectivity studies have found a lower synchronization
mainly in alpha and beta bands in AD patients compared to healthy controls (Locatelli, Cursi,
Liberati, Franceschi, & Comi, 1998; C.J. Stam & van Dijk, 2002; C J Stam, van der Made,
Pijnenburg, & Scheltens, 2003; Babiloni et al., 2004; see Jeong, 2004 for a review; Koenig et al.,
2005). Additionally, the specific changes of long and short distance interactions found in this
population has been correlated with disease severity as expressed by a lower MMSE score (C J
Stam et al., 2003; 2006), suggesting that the disruption of the anatomical/ functional
connections is potentially responsible of the cognitive alterations that characterized this
pathology. Finally, as the disease progresses, some studies have found an increase in
connectivity in slow frequency bands (delta and theta), possibly as a result of the cholinergic
44
cortical deafferentation from subcortical structures (Locatelli et al., 1998; Pijnenburg et al.,
2004; C J Stam et al., 2006).
Since MCI patients present neuropathologically features that could be considered
intermediate between normal aging and early AD (He et al., 2009; Ronald C Petersen et al.,
2006; Zhang et al., 2012), the concept of “disconnection syndrome” might also be applied in
this group. Many studies in MCI have found a decrease in synchronization, which would
support this idea. Moretti et al. (2008) reported a decline in intrahemispheric coherence in
fronto-parietal regions and an increase in interhemispheric coherence on frontal and temporal
areas in the MCI group. Gómez, et al. (2009) and Koenig et al. (2005) found a decreased
synchronization essentially in the beta band in MCI subjects when compared to elderly
controls. Meanwhile Babiloni, Ferri, et al. (2006d) found significant differences in
synchronization between MCI subjects and normal elderly subjects in delta and alpha bands at
fronto- parietal regions and it was related to MMSE scores. However, other resting state
studies have failed to find functional connectivity differences between MCI and healthy
controls (Stam et al. 2003; Tao and Tian 2005; Jiang 2005; Zheng et al. 2007). By contrast, most
cognitive studies have described clear differences between MCI patients and healthy people in
functional connectivity during the execution of a cognitive task (Pijnenburg et al. 2004; Jiang
2005; Zheng et al. 2007; Bajo et al. 2010). All these results suggest that is essential studying
both resting and cognitive states in order to distinguish them from controls, since the
heterogeneity that characterizes the MCI patients makes that often the results are not as
consistent one might have expected.

45
6. INTERNALLY DIRECTED COGNITIVE STATE (IDICS)
The investigation of resting state activity has become an extremely prominent topic in
neurocognitive research. But, are our minds really do nothing during resting state? Actually,
our brains are usually engaged in spontaneous cognition or “mind-wandering” during these
periods of rest or even during undirected passive tasks. Both concepts are referred to thoughts
commonly related to autobiographical memories, future planning, social interactions and
personal problem solving. All these thoughts are essential for humans since they provide us an
adaptive value and a continuous feeling of “self” (Andrews-Hanna, Reidler, Huang, & Buckner,
2010; 2011). In fact, spontaneous thinking is so important for us that the technique of so-
called experience sampling estimate that humans spend between 30% and 50% of daily life
involved in thoughts unrelated to the immediate task at hand (Killingsworth & Gilbert, 2010).
One plausible hypothesis about the differences frequently found in neuroscience studies
during resting state could be due to individual and cultural differences in the frequency and
contents of mind wandering (Callard, Smallwood, & Margulies, 2012; Maillet & Rajah, 2013;
Song & Wang, 2012).
Resting state brain activity has been related with a set of brain areas which are more
activated during passive baseline conditions, and deactivated during external and goal directed
cognitive activity, as a kind of task-negative baseline network. This group of regions has been
named the “Default mode network” (DMN) (Raichle et al., 2001) and mainly includes the
posterior cingulate cortex/ precuneus, dorsal and ventral medial prefrontal cortex, lateral
(principally inferior) parietal cortices and medial temporal lobes (Buckner, Andrews-Hanna, &
Schacter, 2008; Fox et al., 2005; Mevel, Chételat, Eustache, & Desgranges, 2011). These
regions seem to be the most sensitive to the neurodegenerative disorders, such as AD (Mevel
et al., 2011).
The DMN activity measured by fMRI is characterized by coherent low frequency synchronized
oscillations of BOLD signal time series (<0.1 Hz) in large- scale functional brain networks (Broyd
et al., 2009) that persists during simple sensory tasks, such as visual fixation (Raichle et al.,
2001), during the early stages of sleep (Horovitz et al., 2008) and to a lesser extent, under
conscious sedation (Greicius et al., 2008). It is considered that this network may be involved in
exploratory monitoring of the external environment when focused attention is relaxed or
diffused (e.g. in passive conditions), and other times its activity is related to mind wandering
(Andrews-Hanna, 2012; Buckner et al., 2008; Sonuga-Barke & Castellanos, 2007).

46
The DMN plays an opposite role than the task- positive network, whose regions routinely
exhibiting task-positive responses (Fox et al., 2005). Both networks maintain an anti-correlated
relationship that allows the adaptation of the brain´s resources to the external or internal
demands. For this reason, the intensity of the deactivations of the DMN depends on the load
or the cognitive demands of the external task (Persson, Lustig, Nelson, & Reuter-Lorenz, 2007;
Sambataro et al., 2010).
Although the group of brain regions of the DMN is consistent across the lifespan, the
magnitude of its activation as well as the functional correlations among its areas seem to be
reduced in aging (Andrews-hanna et al., 2009; Cheryl L Grady, Springer, Hongwanishkul,
McIntosh, & Winocur, 2006; Koch et al., 2010). These changes suggest that old people show a
reduction in the ability to suppress the DMN activity when higher processes are needed,
implying an obstacle in switching from a “default mode” to task- related mode of brain
function, and consequently their performance on cognitive tasks is worse. Moreover it should
be note that these disturbances are greater in MCI and AD since DMN structures are
vulnerable to atrophy, deposition of amyloid-plaques and present a decrease glucose
metabolism (Minoshima et al., 1997; Scahill, Schott, Stevens, Rossor, & Fox, 2002; Buckner et
al., 2005). Therefore the study of the DMN is particularly relevant in aging and dementia (for a
review see Hafkemeijer et al. 2012).
Figure 13. The default mode network. The left side shows cerebral regions with coherent default network activity under resting conditions in young adults. These resemble areas of both increased amyloid plaque deposition assessed by molecular imaging modalities such as PET (middle) and of cortical atrophy measured by morphological MR-imaging (right). The similarity might be explained by steady increased baseline activity in default networks leading to an increased pathology with subsequent neurodegeneration. Figure adapted from Buckner et al (2005) by Wermke (2008).
Based on the previous ideas I wondered, what would it happen in the DMN if we
employed and experimental paradigm which combine the resting state and a cognitive task?

47
Most studies in cognitive functioning, and particularly in dementia, have been based on
external stimuli; whereas those that have explored spontaneous or goal-directed internal
mentation have focused on mind wandering (Andrews-Hanna et al. 2010; 2012). However,
little is known about brain activity and more specifically about the DMN during internally guide
cognition, despite knowing that people also spend their time engaged in solving mathematical
problems, hypothesizing or checking their knowledge. For this reason the concept of
“Internally Directed Cognitive State” (IDICS) was proposed. But, what kind of cognitive task
could be the most appropriate to apply, in an internal way, in healthy and pathological aging?
One in which patients show difficulties in its execution and in which internal processing and
self-monitoring would be required to perform it, in order to explore how brain activity changes
with the presence of a pathology. For this reason, we proposed an internal mental calculation
task in Study II.
Among other cognitive deficits, mental calculation abilities are commonly impaired
early in the course of AD (Parlato et al., 1992; Rémy et al., 2004). This impairment correlates to
the degree of dementia (Marterer, Danielczyk, Simanyi, & Fischer, 1996; R. C. Martin et al.,
2003) and with glucose hypometabolism in the left inferior parietal lobule, left inferior
temporal gyrus and prefrontal regions (Hirono et al., 1998; Rémy et al., 2004). Simpler
arithmetic tasks-such as addition or subtraction are related to language and long-term
semantic memory (Dehaene, Molko, Cohen, & Wilson, 2004) and require executive processes
such as working memory (WM) (Hitch, 1978). Brain structures such as prefrontal and superior
parietal areas are involved in calculation tasks and are affected in MCI (Singh et al., 2006),
apart from the well-known atrophy of the hippocampus and other medial temporal lobe
regions (C R Jack et al., 2000). However, few studies have focused on calculation in MCI, and
they indicate that this group had difficulties in simple calculation tasks. Zamarian et al., 2007a;
2007b) demonstrated that simple calculation in MCI was well preserved, but they presented
problems when inhibition processes were required. Otherwise, Li et al. (2010) found that MCI
patients performed worse than healthy controls, during the execution of a simple mental
calculation task, and showed abnormalities on N170 and P2 ERP components.
It should be pointed that IDICS is a cognitive state that simulate resting state but in
which a cognitive task is carried out. Therefore, it characterizes for not depending on the
external environment and having a purely cognitive content (formal content), not self-
referential. The main objective of IDICS is focused on the study of the internal processing

48
involved during the execution of cognitive activities, and therefore, any cognitive task whose
execution requires the creation of cognitive internal representations and is internally directed
could be addressed from this new approach, such as mental calculation.
Thus, IDICS apart from allowing the exploration of the human mind´s nature when performing
cognitive tasks in the absence of external stimuli, offers a high flexibility since it can be applied
to different populations and be based on diverse cognitive tasks (executive function,
memory…); it also may provide information about the differences between internal and
external processing and also about the ability to concentrate and vulnerability to distraction,
may contribute to generate a new homogenous scenario to make inter-and intra-individual
comparisons, and finally it may supply essential information about the behavior of the DMN in
comparison with introspective mentation (Andrews-Hanna, 2012) in a large number of
neurological and psychiatric disorders in which it is altered (Broyd et al., 2009; Buckner et al.,
2008).
49
6. PROGRESSION FROM MCI TO AD
There is a broad consensus in considering the MCI as a precursor of AD, since many
longitudinal studies have found a high rate of progression from this state to AD. In general, the
conversion rate of MCI to dementia is around 10-15% per year (R C Petersen et al., 2001a),
although this value may vary due to the MCI criteria applied, the type of sample used
(community or clinic-based), as well as to the length of the follow-up period considered (Jelic
et al., 2000). The early identification of those MCI patients who will convert to AD is essential
to initiate an adequate administration of pharmacologic or non-pharmacologic interventions
to slow down the devastating effects of this neurodegenerative disorder.
From a neuropsychological point of view, the performance in episodic memory tests,
such as new learning, has been proposed as a predictor of conversion from MCI to AD (Albert
M, Blacker D, Moss MB, Tanzi R, 2007; Perri, Serra, Carlesimo, & Caltagirone, 2007; Lekeu,
2010). Besides, some studies have suggested that also the alteration in other cognitive
domains, especially in executive functions, may have a predictive power of progression (Chen
P, Ratcliff G, Belle SH, Cauley JA, DeKosky ST, 2000; Rozzini L, Vicini Chilovi B, Bertoletti E, Conti
M, Delrio I, Trabucchi M, 2008; Brandt et al., 2010; Lekeu et al., 2010; Chapman et al., 2012).
These results could be explained on one hand, due to the MCI criteria selected, as some
studies differentiate among MCI subtypes while others not; and on the other hand, because
the cognitive exploration is not enough detailed as it should be. Thereby, there are studies
that have found that a-md-MCI sample constituted the high- risk group to progress to AD,
compared to a-sd-MCI and non-amnestic subtypes (Ronald C Petersen & Bennett, 2005; Tabert
et al., 2006; Brodaty et al., 2012), and others have described that even pure amnestic MCI
patients presented impairments in executive function (Griffith et al., 2003; Johns et al., 2012;
Kramer et al., 2006). These findings highlight the importance of making a rigorous
neuropsychological assessment with the aim to establish an appropriate diagnosis and
prognosis in this population (Tatsuoka et al., 2013).
Apart from this clinical approach, current studies are focusing on both structural and molecular
biomarkers in order to prospectively identify those patients who will subsequently manifest
AD. MRI studies of conversion from MCI to AD have already been associated with hippocampal
and entorhinal volume loss (deToledo-Morrell et al., 2004; Devanand et al., 2007), although
atrophy in other brain regions; such as parietal cortex, ventricles or even the whole brain; have
also been described (C. Jack, Shiung, & Weigand, 2005; Karas et al., 2008). Besides, it has been
found that assessment of cerebral glucose metabolism with FDG- PET may also contribute in

50
predicting the evolution of MCI patients, since most them showed that MCI converters present
regional hypometabolism in the temporal, parietal and/or precuneus cortices compared with
non-converters (Drzezga et al., 2003; Hatashita & Yamasaki, 2013). Moreover, recent
investigations about B-amyloid (AB) and tau proteins consider these two parameters essential
in predicting the progression to dementia, since they are respectively the reflection of the
amyloid plaques deposition and neurofibrillary tangles that occurs in the AD patient´s brain.
Most of the PIB-PET studies, show that PIB-positive MCI patients are significantly more likely to
convert to Alzheimer’s dementia than PIB-negative (Forsberg et al., 2008; Grimmer et al.,
2013). These results are in agreement with those that have found decreased levels of AB in CSF
in MCI converters compared with MCI- stable, as both measured are inversely correlated
(Riemenschneider et al., 2002; Hampel et al., 2004). For its part, an increase in tau protein
levels in CSF in progressive MCIs have been reported in several studies (Riemenschneider et
al., 2002; Lanari & Parnetti, 2009), being its predictive power even higher than in the case of
AB (H Hampel et al., 2004)
Nowadays, the research in dementia is focusing on the combination of different biomarkers
and clinical information with the purpose of achieving higher sensitivity and specificity values
for predicting progression to AD in patients with MCI (Hansson et al., 2006; Ewers et al., 2012;
Richard, Schmand, Eikelenboom, & Van Gool, 2013). It should be pointed that the predictive
power of some these methods is very heterogeneous and those with high values of specificity
and sensibility are often limited by their high degree of invasiveness, reducing the likelihood of
a daily clinical usage. Additionally, these measures do not provide a direct assessment of the
neuronal functioning and as a consequence to the neuronal network impairment. Thus, it
seems necessary a non-invasive biomarker able to evaluate brain functioning at the neuronal
level, such as EEG and MEG, which are two non-invasive techniques able to measure the
neuronal activity and its representative functional networks in the time-frequency domain.
There is a growing body of evidence showing that the analysis of EEG patterns may
provide additional information to characterized brain activity of MCI patients who become AD.
Resting state EEG longitudinal studies have found that the main markers of progression to AD
were a decrease in alpha activity and an increased theta power (Jelic et al., 2000). Meanwhile,
Huang et al. (2000) evidenced that the best predictor of future conversion to AD within a MCI
sample was the shift of alpha activity towards anterior brain. Afterwards, Rossini et al. (2006)
found that MCI converters exhibit higher power values in delta, theta and alpha1 bands,
mainly over temporal and parietal areas, and also changes in fronto- parietal midline

51
coherence values. More recently Moretti et al. (2011) observed that those MCI who convert to
AD presented an increase of alpha3/alpha2 relative power ratio, being this ratio further
related to hippocampal atrophy (Moretti et al., 2007), and Poil et al. (2013) found that multiple
EEG biomarkers were mainly related to activity in the beta-frequency range which was higher
in the MCI converters than in the MCI non-converters. Otherwise, there are only few studies
which have employed cognitive tasks to explore the differences between progressive MCI and
stable MCI subjects, such as those carried out by Missonnier et al. (2006; 2007) who described
that those MCIs who converted to AD showed a distinct EEG patterns during n- back WM tasks
than those MCIs who remained stable over time.
The necessary use of a reference channel in EEG studies may introduce spurious
synchronicity between signals, and therefore the MEG seems to be an optimal alternative.
Surprisingly there are very few MEG studies about the MCI progression to AD. For example, a
resting state MEG study from Fernández et al. (2006c) found that an increase in delta activity
in left parietal areas was a good marker of conversion from MCI to AD within 2 years. In 2011
Maestú et al. observed that during the performance of a short- term memory task, progressive
MCI patients showed higher activity in ventral and dorsal pathways than stable MCI subjects.
Afterwards, and under the same memory paradigm, Bajo et al. (2012) described that MCI
converters exhibited higher values of synchronization over parieto- occipital regions in alpha
and beta bands than MCI non- converters. Prospective MEG studies, such as the evolution of
MCI to AD, are needed to start considering this technique as a new non-invasive biomarker as
those used nowadays.

52
STUDY I
MEG spectral analysis in subtypes of Mild Cognitive
Impairment

53
1. AIMS AND HYPOTHESIS
The main goal of this first study was to explore the brain magnetic patterns of the normal
aging and the MCI, and more specifically, of its two amnestic clinical subtypes. To this end, we
conducted a MEG study where an exhaustive spectral analysis was carried out in a-sd-MCIs, a-
md-MCIs, and healthy aged controls. In addition, we further explored the cognitive status of
the participants and their hippocampal volumes in order to assess the relationship among
spectral activity, neuropsychological performance and structural atrophy information.
We hypothesize that a-md-MCI patients will exhibit a spectral pattern more proximate to the
typical AD-profile; including increased power within the delta and theta frequency ranges, and
reduced activity in the high-frequency range as compared with a-sd-MCIs and healthy controls.
Meanwhile, a-sd-MCIs will exhibit a spectral activity in between a-md-MCIs and controls.
Besides, these neurophysiological findings will be related to changes at structural and cognitive
level, which will allow us to characterize the two amnesic clinical subtypes of MCI.

54
2. METHODS
2.1 Subjects
MEG signals were obtained from 105 subjects older than 65 years of age, classified in three
groups: 36 healthy controls, 33 a-sd-MCI patients, and 36 a-md-MCI patients. All of them were
right handed (Oldfield, 1971), and native Spanish speakers. No significant differences were
found in education, gender, or age among groups (see Table 1). MCI patients were recruited
from the Geriatrics and Neurology Units of the “Hospital Universitario San Carlos” and the
“Memory Decline Prevention Center”, both in Madrid, Spain. Healthy volunteers were
recruited from the “Seniors Center of Chamartín District”, Madrid.
Table 1. Mean values ( standard deviation) of the demographic and clinical characteristics of a-sd-MCI, a-md-MCI and Controls. M = males, F= females, MMSE = Mini mental state examination score. An ANOVA test was used for the comparisons.
Control
(n=36)
a-sd-MCI (n=33)
a-md-MCI (n=36)
P value
Age (years)
72.36 ± 4.75
74.15 ± 6.07
73.94 ± 3.70
p= 0.22
Gender (M/F)
11/25
13/20
13/23
p= 0.12
MMSE score
29.14 ± 0.96
27.63 ± 2.47
25.65 ± 2.66
p < 0.01
Education (years)
4.39 ± 1.23
4.27 ± 1.31
3.78 ± 1.24
p= 0.48
LH_ICV
0.002610 ± 0.0003583
0.002148 ± 0.0004235
0.002062 ± 0.0005280
p < 0.0001
RH_ICV
0.002608 ± 0.0002964
0.002133 ±0.0005079
0.002082 ± 0.0003512
p < 0.0001

55
2.2 Diagnostic criteria
All participants were screened by means of a variety of standardized diagnostic instruments
that included: the Spanish version of the MMSE (Lobo, Ezquerra, Gómez Burgada, Sala, & Seva
Díaz, 1979), the Global Deterioration Scale (GDS; Reisberg, Ferris, de Leon, & Crook, 1982), the
Functional assessment questionnaire (FAQ; Pfeffer, Kurosaki, Harrah, Chance, & Filos, 1982),
the Geriatric Depression Scale (GDS; Yesavage et al., 1982), the Hachinski Ischemic Score (HIS;
Rosen, Terry, Fuld, Katzman, & Peck, 1980), the questionnaire for Instrumental Activities of
Daily Living (IADL; Lawton & Brody, 1969), and the Functional Assessment Staging (GDS/FAST;
Auer & Reisberg, 1997).
MCI diagnosis was established according to the Petersen (2004) and Grundman et al.´s (2004)
criteria. Thus, MCI patients should fulfill the following requirements: (1) memory complaint,
corroborated by an informant; (2) abnormal memory function, documented by delayed recall
of one paragraph from the Logical Memory II subtest of the Wechsler Memory Scale–Revised
(cutoff scores ≤ 16 for ≥16 years of education; ≤ 8 for ≥8–15 years of education); (3) normal
general cognitive function, as determined by a Mini-Mental State Examination (MMSE) score
greater than or equal to 24; (4) total absence or minimal impairment in activities of daily living
(ADLs) revealed by the Lawton scale, as determined by a clinical interview with the patient and
informant; and (5) not demented according to the National Institute of Neurological and
Communicative Disorders and Stroke/Alzheimer’s Disease and Related Disorders Association
(NINCDS-ADRDA) criteria as judged by an experienced clinician (G. McKhann et al., 1984). MCIs
did not fulfill the diagnostic criteria for dementia (i.e. all were classified at the stage 3 of the
GDS) and performed at least 1 SD below average for their age and education on
neuropsychological tests representing one or more areas of cognition (Jelic et al., 1996).
Patients and controls were free of significant medical, neurologic and/or psychiatric diseases
(other than MCI). These inclusion criteria included the absence of significant cerebral-vascular
disease (i.e. modified Hachinski score ≤ 4) or depressive symptomatology (i.e. Yesavage’s
Depression Scale scores > 9). Participants were not using drugs which could affect MEG activity
(including cholinesterase inhibitors).
Patients and controls received an exhaustive neuropsychological assessment in order to
establish their performance level in multiple cognitive domains. The assessment included:
Clock Drawing Test (Agrell & Dehlin, 1998), Direct and Inverse Digit Span Tests (Wechsler
Memory Scale Revised, WMS-III; Wechsler, 1987), Immediate and Delayed Recall (WMS-III;
Wechsler 1987), Phonemic and Semantic Fluency (Controlled Oral Word Association Test,

56
COWAT, Benton & Hamsher, 1989), Ideomotor Praxis of Barcelona Test (Peña-Casanova,
1990), Rule shift Cards (Behavioural Assessment of the Dysexecutive Syndrome, BADS; Norris &
Tate, 2000), Visual Object and Space Perception Test (VOSP; Warrington & James, 1991),
Boston Naming Test (BNT; Kaplan, Goodglass, & Weintraub, 1983) and Trail Making Test A and
B (TMTA and TMTB; Reitan, 1958). The TMT subtest A and B offer two different scores. The
first one (i.e. TMT “accuracy”) denotes the number of correct responses. The second score (i.e.
TMT “time”) denotes the time subjects need to complete the task, with a limit of 200 seconds
in TMTA and 400 seconds in TMTB.
According to their clinical and neuropsychological profile, patients were further divided in two
groups: (1) the a-md-MCI group where patients showed a memory deficit accompanied by
various degrees of impairment in cognitive domains such as language, executive function
and/or visuospatial skills; and (2) the a-sd-MCI group where patients exhibited isolated
memory impairment (Petersen 2004).
Prior to the MEG recording, all subjects signed an informed consent that explained the
technical and ethical considerations of the investigation. The study was approved by the local
Ethics Comitee.
2.3 MEG recordings
MEGs were acquired (Figure1, step 1) with a 306-channel Vectorview system
(ElektaNeuromag) which combines two orthogonal, planar gradiometers, and one
magnetometer. Only MEG signals derived from magnetometers (i.e. 102 channels) were
submitted for further analyses. The MEG system was placed in a magnetically shielded room
(VacuumSchmelze GmbH, Hanua, Germany) at the “Laboratorio UPM-UCM de Neurociencia
Cognitiva y Computacional” (Madrid, Spain). Subjects were in an awake but resting state with
their eyes closed and under vigilance control during the recording. They were asked to avoid
making movements. For each subject, three minutes of MEG signal were acquired at a
sampling frequency of 1000 Hz (online bandpass filtering at 0.1-330Hz).
The head movement was controlled by means of a head-position indicator (HPI) with coils
attached to the scalp. HPI coils position and subject headshape were defined using a 3D
digitizer (FastrakPolhemus) referenced to three anatomical (fiducial) locations: the nasion and
the left and right preauricular points. Blinks were monitored by two bipolar electrodes
attached above and below the left eye and one electro attached to the lower cheek (ground).

57
Recordings were offline filtered (Figure1, step 2) and corrected for head movements with a
temporal signal space separation with movement compensation (tSSS-mc) (Taulu & Kajola,
2005; Maxfilter 2.2 software); correlation threshold = 0.9, time window= 10 seconds, and
notch filtered (Butterworth filter order 4 at 50 Hz and 100Hz). Continuously recorded resting
state data were segmented in 4-seconds length trials. Trials with EOG, muscle and jump
artifacts were rejected by means of Fieldtrip package (Oostenveld, Fries, Maris, & Schoffelen,
2011) (Figure1, step 3).
Figure 1. Workflow: resting state MEG recordings (1), Elekta software spatial filtering (2), signal segmentation (3), Fieldtrip artifact processing (4), visual trial selection through power spectra (5), power spectra averaging and normalization (6), statistics (7) and results (8).
2.4 MRI and hippocampal volumes
For each subject, a high resolution T1 weighted magnetic resonance was acquired at “Hospital
Universitario San Carlos” (Madrid) by using a General Electric 1.5 Tesla magnetic resonance
(MR) scanner, with a high-resolution antenna and a homogenization PURE filter (Fast Spoiled
Gradient Echo sequence, TR/TE/TI = 11.2/4.2/450 ms; flip angle 12º; 1 mm slice thickness,
256x256 matrix and FOV 25 cm). To segment the subject’s T1-weighted volume into different
regions, Freesurfer software (version 5.1.0) and its specialized tool for automated subcortical
segmentation (Fischl et al., 2002) were used. Afterwards, hippocampal volumes were
normalized with the overall intracranial volume (ICV) to account for differences in head

58
volume over subjects. Two variables were submitted for statistical analysis: the normalized left
hippocampal volumes (LH_ICV), and the normalized right hippocampal volumes (RH_ICV).
2.5 Power spectra and statistical Analysis
MEG power spectra were computed through Fieldtrip package for all trials which successfully
passed the automatic artifact rejection. A frequency-of-interest range of 0.5 Hz steps from 1 to
30 Hz was employed. In order to obtain the average frequency-content of each trial we applied
a multitaper method (mtmfft) with discrete prolate spheroidal sequences (dpss) as windowing
function and 1 Hz smoothing. Each trial was visually inspected by an experienced technician
blinded to the subjects´ diagnosis by collapsing the power spectrum of all channels (Figure 1,
step 4). Those channels with an aberrant power spectra profile were dismissed. Finally, only
MEG recordings with at least 15 survival trials (one minute of brain activity) were submitted
for further analyses. The number of survival trials did not differ significantly among groups.
Survival trials were averaged across subjects obtaining for each group a 102 channels x 52
frequency steps x “n” subjects matrix (Figure1, step 6). For each channel relative power was
calculated as a ratio between power in each 0.5 Hz frequency step and the total power across
the 1-30Hz spectrum, and was expressed as a percentage (Jelic et al., 2000).
Similarly to previous works (see Fernandez & Hornero, 2006b) we did not use pre-established
and conventional frequency bands to analyse power differences among groups. This approach
might overcome one of the key problems that emerge when different studies are to be
compared: the variability in terms of classification criteria for classical EEG bands. This
variability affects low-frequencies to a lesser extent; however the limits between conventional
bands in the high-frequencies range are difficult to define. Thereby, in order to accomplish a
data-driven comparison among groups, we followed a method adapted from Maris &
Oostenveld (2007). First, a series of exploratory ANOVA tests were calculated (Figure 1, step 7)
for relative power values in each 0.5 Hz frequency step and sensor. Those comparisons which
were found to show significant differences (p<0.05) were further inspected by means of
pairwise t-tests. In order to perform such analyses, a series of clusters were built according to
a criteria of spatial and frequency adjacency. Thus, each cluster must contain at least 5
contiguous and significant sensors, and the difference between pairs of groups must remain
significant during at least a 2Hz-interval.
Relative power on each cluster of sensors was averaged and submitted to the t-test analyses.
To control the family-wise error due to multiple comparisons, the test distribution was derived

59
from a permutation test (Ernst, 2004). This was accomplished by randomly dividing the
participants into two sets, matching the numbers in the original groups. The two-sample t-test
was then carried out in these two new groups. This procedure was repeated 5000 times and
the p-value from each test was retained in order to obtain a p-value distribution. We then
identified the 5th percentile of each distribution, and only p-values below that threshold were
accepted. This strategy was performed for the contrasts a-sd-MCI vs. control, a-md-MCI vs.
control, and a-sd-MCI vs. a-md-MCI. Importantly, the criteria utilized to build each cluster (see
above) determines the way in which spectral differences between groups will be described in
the results section. As above mentioned, results will not be described in terms of conventional
frequency bands, but rather in terms of the frequency ranges of those significant clusters that
matched the adopted criteria of spatial and frequency adjacency.
2.5.1 Power, Hippocampal volumes and Neuropsychology Correlation
First, a series of one-way ANOVA tests were performed in order to investigate the distribution
of the neuropsychological scores and the hippocampal volumes among groups. In these
analyses the variable “Diagnosis” (a-md-MCI, a-sd-MCI, Control) was considered the between
groups factor. Then, the relationship between power values, hippocampal volumes and
neuropsychological performance was assessed through Pearson correlation tests. The analyses
were performed by correlating the averaged power on each resulting significant cluster of
sensors in the t-test analyses (see below), and the neuropsychological scores on each test. In
order to avoid the multiple comparisons problem, a permutation testing procedure was used
(Nichols & Holmes, 2002). Five thousand surrogate correlation maps were calculated by
randomly-distributing the combination of each power value and test score across subjects. The
highest absolute value of the Pearson correlation coefficient obtained from each surrogate
was retained in order to obtain an empirical null distribution of the statistic. Statistically
significant thresholds were obtained from the quantiles of the distribution of these values. For
example, the 95th quantile corresponded to a p-value of 0.05. This ensures there is only a 5%
probability that one or more correlation values from the original statistical map would present
differences above threshold due to spurious statistical fluctuations.

60
3. RESULTS
3.1 Description of power spectra
First, only for descriptive purposes, we calculated the averaged relative power in the 1-30 Hz
frequency range for each group (see Figure 2). It can be noticed that a power shift to lower
frequencies was observed in MCIs, especially in a-md-MCI patients. Thus, the averaged relative
power in a-md-MCI patients showed a frequency peak of about 8.5 Hz, while in a-sd-MCI
subjects the peak appeared at about 9.5 Hz. Healthy controls showed their maximum value at
about 10Hz. Moreover, the profile of the spectral distribution was quite different among
groups. Both MCI groups (especially the a-md-MCI group) showed a broader spectral
distribution in the 5-12 Hz frequency range, indicating a higher variability and a tendency to
lower frequency peaks across subjects. On the contrary, the control group exhibited a
narrower spectral distribution, indicating a lower variability and a tendency to frequency peaks
that converge within the range of alpha band.
Figure 2. Average relative power spectra for all channels in the Control group (green line), the a-sd-MCI group (blue dashed line) and the a-md-MCI group (red dotted line). Spectra are represented in the “x” axis from 1 to 30Hz frequency band and relative power values in the “y” axis. It is very important to point out for the reader that in all figures the red color represents the a-md-MCI group, the blue color represents the a-sd-MCI group and the green color represents the control group.

61
3.2 Differences in relative power among groups
As previously mentioned, a series of exploratory ANOVA tests were calculated for each 0.5 Hz
frequency step and sensor. The results of those ANOVAs are displayed in Figure 3. Overall,
significant differences seem to converge within three frequency ranges: (1) a low-frequency
range that includes frequencies between 2 and 8 Hz, (2) a range that includes frequencies
between 9 and 12 Hz, and (3) a high-frequency range that includes frequencies between 16
and 23 Hz. These preliminary results might give us a hint about the frequency distribution of
the significant clusters in the pairwise comparison.
In order to compare our results with previous MEG and EEG literature, significant clusters were
referred in the range of the classical frequency bands (delta, theta…).
Figure 3. Significant F values corresponding to the exploratory ANOVA tests for each sensor and frequency step (left side). MEG helmet layout showing the distribution of sensors (right side).
3.2.1 Differences within the delta band range
The a-md-MCI group showed a significant increase of activity within the delta range as
compared with a-sd-MCIs and healthy controls (see Figure 4). Differences between a-md-MCIs
and a-sd-MCIs (t= -3.331; p< 0.001) appeared within a frequency range of 2-4Hz in a cluster of
sensors located in left centro-parietal regions (henceforth called cluster δ1). The significant
differences between a-sd-MCIs and controls (t= -2.280; p< 0.05) emerged from cluster of

62
sensors also within the 2-4 Hz frequency range (cluster δ2) located in occipital regions. Finally,
significant differences between a-md-MCIs and controls (t= -3.123; p< 0.001) emerged within
the same 2-4 Hz frequency range in a cluster (δ3) with a broader occipito-temporal distribution
as compared with cluster δ2. Importantly (see below), cluster δ3 contains all sensors included
in cluster δ2.
Figure 4. Differences within the delta band range. Red color indicates that the a-md-MCI group had more relative power than a-sd-MCI in left centro-parietal regions (cluster δ1), and in occipito- temporal areas in comparison with the control group (cluster δ3). Blue color indicates that the a-sd-MCI had more relative power in posterior regions than the control group (cluster δ2).
3.2.2 Differences within the theta band range
Very similar to previous results, power within the theta range was significantly higher in the a-
md-MCI group. The a-md-MCI group showed increased relative power (t= -2.007; p< 0.05) as
compared with a-sd-MCIs within a 5-7 Hz frequency range in a cluster of sensors (cluster θ1)
located in left centro-parietal regions (see Figure 5). The a-sd-MCI group showed increased
power within the typical 4-8 Hz range of theta band in two clusters of sensors (clusters θ2 and
θ3) when compared with the control group. Cluster θ2 (t= -2.939; p< 0.005) extended over most
of the right lateral fronto-temporo-parieto-occipital region, while cluster θ3 (t= -2.231; p< 0.05)
had a left fronto-central location. When a-md-MCIs and controls were compared, the a-md-
MCIs exhibited the same pattern of increased relative power within the 4-8 Hz range (t= -
4.107; p< 0.0001), but in this case such differences emerged from a cluster that basically

63
included all sensors excepting those located around the vertex (cluster θ4). Consequently,
cluster θ4 encompassed sensors and frequency ranges in clusters θ1, θ2, and θ3 (see below).
Figure 5. Differences within the theta band range. Red color indicates that the a-md-MCI group exhibited more relative power in left centro-parietal regions than a-sd-MCI group (cluster θ1) and in practically the whole head when compared with control group (cluster θ4). The a-sd-MCI exhibited a significant power increase compared with the control group in two clusters of sensors, represented in
blue color, that involved the right lateral fronto- temporo- parieto- occipital region (cluster θ2) and the left fronto- central location (cluster θ3).
3.2.3 Differences within the alpha band range
The a-md-MCI group (see Figure 6) showed reduced relative power values as compared to a-
sd-MCIs in a small occipital cluster of sensors (cluster α1) within a frequency range of 9 to 11
Hz (t= 2.457; p< 0.01). The a-sd-MCI group exhibited reduced relative power as compared to
controls (t= 2.279; p< 0.05) within a 10-12 Hz frequency range in a small right fronto-temporal
cluster of sensors (cluster α2). Finally, a-md-MCIs showed significantly lower relative power
values within a 8-12 Hz frequency range in two different clusters of sensors. Cluster α3 (t=
2.752; p< 0.001) extended bilaterally over the occipital region and contained all sensors in
cluster α1 (see below). Cluster α4 (t= 2.703; p< 0.001) extended over the right lateral fronto-
temporal region and contained all sensors in cluster α2.

64
Figure 6. Differences within the alpha band range. The cluster in blue represents an increase in relative power within the a-sd-MCI group in occipital regions (cluster α1), as compared with the a-md-MCI group. The control group showed more relative power in right fronto-temporal areas (cluster α2), in bilateral occipital regions (cluster α3), and in right lateral fronto- temporal regions (cluster α4) than both MCI groups. These clusters are represented in green color.
3.2.4 Differences within the beta band range
As previously described for the alpha range, relative power within the beta range was
significantly decreased in the MCI groups (see Figure 7). Of note, a-md-MCIs showed reduced
relative power as compared with a-sd-MCIs (t= 2.262; p< 0.05) in a fronto-central cluster with
left predominance (cluster β1) within a frequency range of 20 to 22 Hz. The a-sd-MCI group
exhibited lower power values than controls within a broader frequency range of 16 to 23 Hz
(t= 2.654; p< 0.001) in a small cluster of occipital sensors (cluster β2). Similarly, a-md-MCIs
showed reduced power values as compared with controls (t= 2.126; p< 0.05) in the same 16-
23 frequency range of 16 to 23 Hz and basically within the same occipital cluster of sensors
observed in the controls vs. a-sd-MCI comparison (cluster β3).
.

65
Figure 7. Differences within the beta band range. Blue color indicates that the a-sd-MCI group exhibited increased relative power in a fronto- central cluster (cluster β1) as compared with a-md-MCI. In the control group there is an increased of relative power, indicated in green color, in occipital areas (clusters β2 and β3) when compared with a-sd and a-md-MCI groups.
3.3 Power, Hippocampal Volumes and Neuropsychology Correlations
As previously described, a series of exploratory one-way ANOVAs were performed to assess
the differences in terms of neuropsychological tests performance and hippocampal volumes
among groups. Firstly, the ANOVA revealed a significant effect of “Diagnosis” on LH_ICV and
RH_ICV (p<0.0001) (see table 1). Post-hoc comparisons with Bonferroni correction showed
significant differences for LH_ICV and RH_ICV between controls and MCIs (p< 0.001), with
larger hippocampal volumes within the healthy group. On the other hand, a-md-MCIs
exhibited smaller volumes than a-sd-MCIs but the comparison failed to reach the level of
statistical significance (p> 0.05). A significant effect of “Diagnosis” was also found for all
neuropsychological tests, with the exception of Clock Drawing Test, VOSP, and TMTA accuracy.
This initial finding was further explored by means of post-hoc pair-wise comparison with
Bonferroni correction. MMSE scores were significantly higher in control subjects as compared
with both clinical groups (p< 0.001), but in addition a-sd-MCI’s MMSE scores were significantly
higher as compared to those of a-md-MCIs (p<0.01) (see table 1). Direct digit Span scores were
significantly higher in controls, as compared with both clinical groups (p< 0.05), but no
significant differences emerged from the comparison of MCI subtypes. Identical results were
obtained in the analysis of Inverse Digit Span, and Immediate and Delayed Recall. Phonemic
Fluency scores were also significantly higher in controls when compared with both clinical
groups (p< 0.05), and a-sd-MCIs showed significantly increased fluency values than a-md-MCIs

66
(p< 0.05). Controls also exhibited increased semantic fluency values (p< 0.05), but no
significant differences were found between MCI subtypes. An identical pattern was found in
the comparison of TMTA time, and TMTB accuracy and time scores. In both cases a-sd-MCI
showed higher scores as compared to a-md-MCIs but the effect did not reach the significance
level. Ideomotor Praxis values were also significantly higher in controls (p< 0.05). Finally, BNT
scores presented a slightly different behavior. First, no significant differences emerged from
the comparison of controls and a-sd-MCI patients. However, controls showed higher scores
than a-md-MCIs (p< 0.01), and a-md-MCIs exhibited significantly higher scores than a-sd-MCIs
(p< 0.05). According to these results, it seems that both MCI groups are similarly impaired in
memory tasks but a-md-MCIs tend to show a poorer performance in language tasks, especially
in the BNT. Additionally, a-md-MCIs presented the lowest MMSE scores, indicating a
significantly more impaired general cognitive status.
Once this exploratory analysis was carried out, and with the aim of investigating the
relationship between neurophysiological activity, hippocampal atrophy and cognitive
performance, averaged power values in the significant clusters were correlated with
hippocampal volumes and neuropsychological test scores in the whole sample (a-md-MCIs + a-
sd-MCIs + Controls). In order to avoid redundant information, and considering the high degree
of ovelapping among clusters, we decided to submit for correlation analyses only those
clusters that matched the following criteria: (1) clusters without spatial or spectral coincidence
with other clusters (i.e. clusters δ1 and β1), and (2) broader clusters that encompassed the
sensors and spectral ranges of smaller clusters (i.e. δ3, θ4, α3, α4, and β3). Pearson’s “r” and
“p” values of all significant correlations are displayed in Table 2.

67
Table 2. Pearson correlation analyses of averaged power values in the significant clusters with neuropsychological test scores and hippocampal volumes in the whole sample. The table shows the “p” and “r” (correlation index) values that were significant (p< 0.05).
Within the delta band range, cluster δ1 was inversely correlated with MMSE, Inverse Digit
Span, and TMTA accuracy, indicating that higher scores in this cluster are associated with a
lower cognitive status. Cluster δ1 was positively correlated with TMTA time. Cluster δ3 was
inversely correlated with MMSE, Inverse Digit Span, Immediate and Delayed Recall, Phonemic
Fluency, and TMTB accuracy. Mirroring cluster δ1, cluster δ3 was also directly correlated with
TMTA time.
Cluster δ1 δ3 θ4 α3 α4 β1 β3
MMSE
p= 0,01115
r= -0,2528
p= 0,01201
r= -0,25033
p= 0,00032
r= -0,35269
n.s. p= 0,00125
r= 0,31824
p= 0,03455
r= 0,21162
n.s.
Inverse Digit
Span
p= 0,03296
r= -0,2114
p= 0,00078
r= -0,32741
p= 0,00700
r= -0,26550
p= 0,02979
r= 0,21526
p= 0,02038
r= 0,22940
n.s. n.s.
Immediate Recall n.s.
p= 0,00003
r= -0,39799
p= 0,000001
r= -0,45913
p= 0,00992
r= 0,25424
p= 0,00041
r= 0,34337
n.s. p= 0,00331
r= 0,28818
Delayed Recall n.s.
p= 0,00118
r= -0,32295
p= 0,000001
r= -0,49822
p= 0,01768
r= 0,23922
p= 0,00037
r= 0,35267
n.s. p= 0,00083
r= 0,33234
TMT A (acc.)
p= 0,00417
r= -0,2827
n.s. p= 0,03475
r= -0,21034
n.s. n.s. n.s. n.s.
TMT A (time)
p= 0,03870
r= 0,2061
p= 0,01142
r= 0,25080
n.s. n.s. n.s. n.s. n.s.
TMT B (acc.) n.s.
p= 0,02988
r= -0,22656
p= 0,00125
r= -0,33153
n.s. n.s. p= 0,01580
r= 0,25102
n.s.
TMT B (time) n.s. n.s. n.s.
p= 0,01086
r= -0,26303
n.s. n.s. n.s.
BNT n.s. n.s.
p= 0,01214
r= -0,24996
n.s. n.s. p= 0,04702
r= 0,19912
n.s.
Phonemic
Fluency n.s.
p= 0,00078
r= -0,32889
p= 0,02630
r= -0,22109
p= 0,02740
r= 0,21953
n.s. n.s. n.s.
LH_ICV n.s. n.s.
p= 0,0032
r= -0,3196
n.s. p= 0,0022
r= 0,2501
n.s. p= 0,0235
r= 0,2485
RH_ICV n.s. n.s.
p= 0,0022
r= -0,3309
n.s. p= 0.0533
r= 0.2129
n.s. p= 0,0003
r= 0,3882

68
Cluster θ4 was inversely correlated with both hippocampus and several tests: MMSE, Inverse
Digit Span, Immediate Recall, Delayed Recall, Rule Shift Cards, Phonemic Fluency, TMTA and
TMTB accuracy, and BNT. On the other hand, cluster θ4 was directly correlated with TMTA and
TMTB time. The pattern of correlations within the low-frequency domain clearly suggests that
the higher activity within delta and theta ranges, the poorer cognitive performance in several
domains.
Cluster α3 was directly correlated with Immediate and Delayed Recall, Inverse Digit Span, and
Phonemic Fluency, indicating that higher posterior activity within the alpha range is associated
with a better cognitive performance. Cluster α3 was inversely correlated with TMTB time.
Supporting this idea, cluster α4 was also positively correlated with both hippocampus, MMSE,
Inverse Digit Span, and Immediate and Delayed Recall.
Finally, within the beta range, cluster β1 was directly correlated with MMSE, BNT and TMTB
accuracy. Cluster β3 was positively correlated with both hippocampal volumes, Immediate and
Delayed Recall. This correlation pattern suggests that an enhanced activity within the high-
frequencies range is associated with a lesser hippocampal atrophy and a better cognitive
performance.
Lastly, in order to explore the relationship between hippocampal volumes and
neuropsychological scores, both measures were correlated. LH_ICV was positively correlated
with MMSE (p= 0,0040; r= 0,3832), Immediate Recall (p=1.8x10⁻⁶; r= 0,4992), Delayed Recall
(p= 6,2x10⁻¹⁰; r= 0,5941), VOSP (p= 0,0212; r= 0,2558), TMT B (accuracy) (p= 0,0430; r= 0,2328)
and negatively with TMT B (time) (p= 0,032; r= -0,2446). Similarly, RH_ICV was directly
correlated with MMSE (p= 0,0018; r= 0,3413), Immediate Recall (p=0.8x10⁻⁵ r= 0,4709);
Delayed Recall (p= 3,93x10⁻⁷; r= 0,5314), Rule shift Cards (p= 0,0422; r= 0,2292), TMT B
(accuracy) (p= 0,0164; r= 0,2745) and inversely correlated with TMT B (time) (p= 0,0064; r= -
0,3081). These findings confirm the relationship among the hippocampal atrophy, the
neurophysiological changes and the global deficit observed in different cognitive domains,
such as memory, perception or executive functioning.

69
4. DISCUSSION
We are aware that the clusterization of the frequency bands done in this study rendered
difficult the comparison of our findings with the previously published literature. For this
reason, we decided to compare the current findings with the classical frequency band closer to
the frequency-cluster found in this study.
The results of the present study basically support previous reports about EEG/MEG spectral
analysis in MCI, and add new information on the spectral profiles of MCI subtypes that was not
previously addressed. As it might be expected, MCI patients (especially the a-md-MCI group)
showed a generalized power increase within the theta range accompanied by a power
decrease within the alpha and beta ranges in the posterior regions of the brain. More
importantly, a-md-MCIs exhibited increased power within the delta and theta ranges as
compared with a-sd-MCIs. This tendency (see Figure 2) is a new example of the “shift to the
left” in the spectral profile observed in AD and MCI patients that correlates with the degree of
cognitive impairment (Rodriguez et al. 1999; Fernández et al., 2006a).
From the last years, there is evidence of hyperactivation (Dickerson et al., 2005; F Maestú et
al., 2008) or hypersynchronization (Bajo et al., 2010) of different regions of the brain in
patients with amnestic MCI in comparison to healthy controls but as well to AD patients. This
increase is an indication of compensatory activity due to the loss of efficiency of the memory
networks that leads to the idea of a non-clear linear neurophysiological process between
healthy aging and dementia. In addition, there are some biochemical (Lavenex & Amaral, 2000)
or resting state functional studies (Osipova et al., 2006) that suggest that the differences
between controls and MCI patients seem not to be so linear as our present results.
Nonetheless, overall our findings seem to confirm the hypothesis of a spectral pattern more
proximate to the typical AD-profile, mainly in a-md-MCIs. Previous EEG (Babiloni et al., 2004;
Dauwels et al., 2011; Huang et al., 2000; Jeong, 2004) and MEG studies (Berendse, Verbunt,
Scheltens, van Dijk, & Jonkman, 2000; Fernandez et al., 2002; Fernández et al., 2003, 2006a) of
AD found an increased power in the low frequency bands (delta and theta), accompanied by a
decreased power in the high-frequencies range (alpha, beta and gamma). Such pattern of
spectral changes is a consistent finding that correlates with cognitive performance and
functional status (Fernandez et al., 2002; Prichep et al., 1994; van Deursen, Vuurman, Verhey,
van Kranen-Mastenbroek, & Riedel, 2008). More specifically, in a previous study of our group
(Fernandez & Hornero, 2006b) Fernandez et al. 2006a) AD patients were characterized by a
power increase within the 2-4Hz frequency range, accompanied by a power decrease within

70
the 16-28Hz frequency range that basically parallels the spectral changes observed in the
present investigation of MCI patients.
The sequence of spectral changes in AD is assumed to start with an increase of theta and a
decrease of beta activity, which are followed by a decrease in alpha activity. Delta power is
usually believed to increase only in more severe stages of the disease (Jeong 2004). However,
several studies also reported an increase of delta power in MCI patients when compared with
healthy aged controls (see for example Babiloni, Benussi, et al., 2006a; Babiloni, Binetti, et al.,
2006b; Rossini et al., 2008; Babiloni et al., 2010). Moreover, Fernandez and coworkers
(Fernández, Turrero, et al., 2006c; Fernandez et al. 2006c) demonstrated than MCI patients
with elevated delta activity in posterior parietal regions had a significantly elevated risk of
conversion to AD. This line of evidence indicates that very similar patterns of
neurophysiological activity can be found in MCI patients and AD patients, supporting the idea
of some degree of overlapping (Fernandez et al. 2006a). An increase of low-frequency activity
is not the only shared characteristic. MCI and AD share neuropathological and functional
features, including: tau and ApoE abnormal proteins (Mufson et al., 1999); reduced
hippocampal and temporal lobe volumes (Clifford R Jack, Petersen, Xu, & Al, 1999; S. B. Martin,
Smith, Collins, Schmitt, & Gold, 2010); temporo-parieto-occipital hypometabolism-
hypoperfusion in PET or SPECT scans (Nestor et al., 2004) and cholinergic dysfunction (Haense
et al., 2012).
The “proximity” of a-md-MCIs’ spectral profiles to the typical AD pattern, together with the
significantly lower MMSE, phonemic fluency and language scores within this group (see Table
1), may be interpreted as a sign of greater deterioration in these patients. This affirmation is
supported by the correlations between neurophysiological, structural, and neuropsychological
data. The a-md-MCI group showed the highest levels of activity within delta and theta ranges,
and such activity was inversely correlated with MMSE scores and hippocampal volumes (in this
case only theta range power). In addition, activity within delta and theta ranges was inversely
correlated with the performance on tests of memory, language, attention and executive
functions such as Immediate and Delayed Recall, Inverse Digit Span, TMTA and TMTB, BNT,
etc. The correlation pattern of clusters within alpha and beta ranges was also illustrative. The
a-md-MCI group exhibited the lowest power within the alpha and beta ranges, especially in
posterior sites, compared with the control group. Relative power values within the alpha range
were directly correlated with hippocampal volumes and scores of Immediate and Delayed
Recall, Inverse Digit Span, etc. Similarly, an increased activity within the beta range was
positively correlated with hippocampal volumes and global cognitive status (i.e. MMSE) but

71
also with the performance on tests of memory, language, and executive functioning. Overall,
a-md-MCIs exhibited the highest power values in the low-frequency range, the lowest power
values in the high-frequency range, the poorer cognitive performance, and the smaller
hippocampal volumes.
The correlation between spectral profiles and cognitive performance was previously assessed
in several studies. For example, in their classic study Jelic et al. (1996) reported negative
correlations between relative theta power, visuospatial function, memory and attention. More
recent investigations, showed very similar tendencies. Van der Hiele et al. (2007) found
negative correlations between theta power and tests of global domain. Also, negative
correlations with tests such as the TMTB or Semantic Fluency were described by the authors.
Babiloni et al. (2010) described negative correlations between delta power, Stroop and Digit-
Symbol tests; while alpha 1 power was directly correlated with these neuropsychological
measures. Although these investigations assessed the correlation between spectral and
neuropsychological data, the importance of the regional distribution was not explicitly
explored. It is noteworthy that the most significant difference between a-md-MCIs (i.e.
patients with the poorest cognitive performance and lowest mental status) and a-sd-MCI
patients appeared in fronto-central region (cluster δ1). The implication of more anterior sites is
associated with a posterior-to-anterior tendency of neurophysiological abnormalities, such as
focal delta activity, observed with the progress of the disease (Fouquet et al., 2009; Osipova et
al., 2005).
As in some previous studies (He et al., 2009; Whitwell et al., 2007; Zhang et al., 2012), where a-
MCI subtypes were compared, we failed to find significant statistical differences in
hippocampal volumes. However, in a follow-up study, Tabert et al. (2006) found that 38 out of
39 patients that converted to AD had a base-line diagnosis of a-md-MCI, while none of them
had a base-line diagnosis of a-sd-MCI. Diniz, Nunes, Yassuda, & Forlenza (2009) found that
those MCI who progress to dementia showed a worse global cognitive performance and
multiple cognitive deficits at baseline than those MCI who remained stable. Similarly, Han et al.
(2012) reported that the rate of progression to dementia in a-sd-MCI patients was very similar
to the rate of reversion to the normal cognition, while in the a-md-MCI group the rate of
conversion to dementia was significantly higher when compared to the rate of reversion.
Interestingly, the authors interpreted these findings as a sign of broader cerebral
“degeneration” in the a-md-MCI group. Brodaty et al.’s (2012) findings mirrored those
reported by Han and coworkers.

72
The relationship between elevated risk of conversion and presence of neuropathological signs
has been established in a-md-MCI patients. For instance, Caffarra, Ghetti, Concari, & Venneri
(2008) accomplished a follow-up study where a-sd-MCI, a-md-MCIs and “dysexecutive MCI”
patients underwent SPECT evaluation at base-line. Both amnestic groups showed significant
hypoperfusion in the left hippocampus and parahippocampal gyrus, but a-md-MCIs showed an
additional hypoperfusion in left posterior cingulated gyrus. Notably, the 55% of a-md-MCIs
progressed to AD in a maximum follow-up period of 24 months, while none of the a-sd-MCI
patients progressed to dementia. These results might suggest that, contrary to the classical
understanding of a-MCI as a risk factor for dementia, the a-sd-MCI subtype is in fact a “benign”
form of MCI. This challenging idea was posed by Nordlund et al. (2010) in an excellent
investigation. The authors evaluated the two-year outcome in a sample composed of a-sd-
MCIs, a-md-MCIs, na-sd-MCIs, and na-md-MCIs. In addition, CSF samples were collected to
estimate tau levels at baseline. Paralleling previous studies, only multidomain cases progressed
to dementia, but more specifically 18 out of 21 patients that progressed to dementia had a
baseline diagnosis of a-md-MCI. In fact, elevated tau levels in CSF and a diagnosis of a-md-MCI
were the best predictors of progression to dementia. Norlund et al.’s results further confirm
Wolk et al.’s (2009) findings of elevated levels of AD-pathology in a-md-MCIs, in this case
represented by a significantly higher number of PIB positive cases that exhibited an increased
risk of conversion to AD.
At this point, three lines of evidence converge: (1) a-md-MCI and AD biological markers seem
to overlap in a significant percentage of cases; (2) several studies support the notion of a more
severe brain deterioration with a more frequent presence of AD-pathology and an elevated
risk of conversion to AD in a-md-MCI subtype; and (3) our results indicate that a-md-MCIs
exhibit a spectral profile very similar to that observed in AD which is associated with a more
severe cognitive deterioration. Taken together, these lines of evidence lead us to discuss the
notion of a-md-MCI as an independent clinical condition. Recently, in a key position article
Dubois et al. (2010) revised the definition of AD and some related disorders. According to the
new perspective proposed by the authors, some patients previously described as having MCI
should be actually considered as suffering from “prodromal” AD. This is to say they already
have AD. The category of prodromal AD encompasses all patients previously considered as
having MCI who show positive biomarker evidence of AD-pathology in their brains. The
concept of MCI only remains to define those patients that do not show biomarker evidence of
AD-pathology.

73
According to previous literature and our own results, a-md-MCIs might be more likely to fulfill
the criteria of prodromal AD proposed by Dubois et al. (2010). Nevertheless, the more
important question addressed by our investigation is the potential role of neurophysiological
techniques (EEG or MEG) as markers for AD-pathology. In a very recent study of our group
(Fernández et al., 2013) it was demonstrated that delta current densities in posterior parietal,
occipital, prerolandic and precuneus cortices distinguished between MCI patients, AD patients
with different severity scores, and controls. More importantly, an increase of delta activity in
posterior regions such as the right posterior parietal cortex and the precuneus indexed the
transition from MCI to mild and from mild to more severe dementia. Considering the close
relationship between cholinergic inputs and neurophysiological activity, we proposed that
MEG spectral mapping might be a serious candidate for a “neural degeneration” marker of AD
reflecting dysfunctional synaptic transmission. The new results presented here might support
the role of MEG spectral analysis in the investigation within the healthy aging-AD continuum,
particularly as an objective marker of disease progression associated with cognitive
deterioration. Notwithstanding, the confirmation of such role should be attained by correlating
MEG spectral data with CSF or imaging markers of AD. Also, the spectral information should be
evaluated in individuals with elevated risk of developing AD such as the APOE4 carriers.
According to our results, we hypothesize that patients with a diagnosis of a-md-MCI showing
an exaggerated activity within the delta and theta ranges are cases of prodromal AD (according
to Dubois et al.’s definition) with an elevated risk of rapid progression to a fully declared
dementia. If this strong hypothesis is confirmed, MEG spectral analysis might serve as a
quantitative measure to define the neurophysiological characteristics of prodromal AD.

74
STUDY II
Synchronization during an Internally Directed Cognitive State in healthy
aging and Mild Cognitive Impairment. A MEG study

75
1. AIMS AND HYPOTHESIS
The present study evaluates functional connectivity patterns in MCIs and their age-matched
controls during resting state and an internally-governed memory task with two levels of
difficulty. The novelty of this study lies in its task design, which is a combination between
resting state and a cognitive state with no external stimuli, being the self-monitoring required
to performing it. This condition could be named “Internally Directed Cognitive State” (IDICS),
and would allow us to explore how the brain works during a pure cognitive state. For this
purpose we have chosen a calculation task, since it can be used in an internal way and it is
usually impaired in AD (Parlato et al., 1992; Rémy et al., 2004) and MCI patients (Li et al., 2010;
L Zamarian et al., 2007; Laura Zamarian et al., 2007). The performance of this task requires the
knowledge of numbers and arithmetic (long term memory), the ability to manipulate and
update the information mentally (working memory), a high level of self-monitoring and the
capacity to inhibit distracting stimuli (executive functioning). Therefore, the principal aim of
this study was to compare the connectivity patterns across groups and conditions.
The exploration of the neural networks involved during a pure resting state and IDICS in MCI
and controls was proposed under the following hypotheses: 1) During resting state, the MCI
group will show a decreased synchronization in higher frequency bands compared to the
control group 2) Our results will differ from those studies which have employed external
stimuli since IDICS requires higher levels of internal information processing and therefore of
top-down control 3) MCI patients will show a higher inter and intra hemispheric
synchronization than the control group during the execution of the task 4) In both groups, the
overall connectivity will increase along with the difficulty of the task.

76
2. MATERIALS AND METHODS
2.1 Subjects
89 subjects older than 65 years enrolled voluntarily in the study. They were all right handed
(Oldfield, 1971), and native Spanish speakers. The whole sample comprised 34 healthy elders
and 55 MCI patients. For the subsequent analysis, only 38 MCIs (18 males) and 32 controls (10
males) were used: 17 MCIs and 2 controls were excluded based on task execution (see
Experimental design). Healthy individuals were recruited from the “Seniors Center of the
district of Chamartín, Madrid”, and MCI patients from the Geriatric and Neurological Units of
the ‘‘Hospital Universitario San Carlos, Madrid” and the ‘‘Memory Decline Prevention Center,
Madrid”.
Subject´s characteristics are shown in Table 1. No statistical differences (p<0.10) were found
between Controls and MCIs in age, sex or educational level, but both groups did differ in
MMSE scores and normalized hippocampal volume (p<0.00001). Normalized hippocampal
volume in MCI was significantly smaller than in controls, which is a biomarker that reflects
neuronal injury (M. S. Albert et al., 2011).
2.2 Diagnostic criteria
All participants were rated with a variety of standardized diagnostic instruments that included:
the Spanish version of the MMSE (Lobo et al., 1979), the Geriatric Depression Scale (GDS;
Yesavage et al., 1982), the Global Deterioration Scale (GDS; Reisberg et al., 1982), the
Hachinski Ischemic Score (HIS; Rosen et al., 1980), the Functional assessment questionnaire
(FAQ; Pfeffer et al., 1982), the questionnaire for Instrumental Activities of Daily Living (IADL;
Lawton & Brody, 1969), and the Functional Assessment Staging (FAST; Auer & Reisberg, 1997).
MCI diagnosis was established according to Petersen’s criteria (Petersen 2004; Grundman et al.
2004): (1) memory complaint, corroborated by an informant; (2) abnormal memory function,
documented by delayed recall of one paragraph from the Logical Memory II subtest of the
Wechsler Memory Scale–Revised (cutoff scores ≤ 16 for ≥16 years of education; ≤ 8 for ≥8–15
years of education); (3) normal general cognitive function, determined by a MMSE score
greater than or equal to 24; (4) no or minimal impairment in activities of daily living (ADLs)
revealed by the Lawton scale, as determined by a clinical interview with the patient and
informant; and (5) not being sufficiently impaired, cognitively and functionally, to meet
National Institute of Neurological and Communicative Disorders and Stroke/Alzheimer’s

77
Disease and Related Disorders Association criteria (NINCDS-ADRDA) (G. McKhann et al., 1984)
for AD as judged by a clinician experienced in AD research. MCIs were classified as amnestic
MCI, at the stage 3 of the GDS and they did not meet the diagnostic criteria for dementia.
The age of the participants ranged from 65 to 85, since the incidence and prevalence of AD
starts to rise around 65 years and at age of 80 and 90 it is nearly 50% (Zamrini et al., 2011). All
of them were in good health, with no significant cerebral vascular disease, and no history of
psychiatric or neurological disorders. Other inclusion criteria included a modified Hachinski
score less than or equal to 4, a Geriatric Depression Scale score lower than 9 and a computed
tomographic or magnetic resonance imaging (MRI) brain scan within 12 months before MEG
screening without indication of infection, infarction, or focal lesions. We performed on every
participant complementary explorations (Class II evidence level) to rule out possible causes of
cognitive decline such as B12 vitamin deficit, diabetes, thyroid problems, syphilis, or human
immunodeficiency virus. Besides, those subjects with alcoholism (>3 alcoholic beverages per
day) or chronic use of medication such as anxiolytics, were not included in the study. Finally,
MCI patients were required to suspend the ingestion of drugs which could affect MEG activity
(e.g. cholinesterase inhibitors) 48 hours before the MEG recordings.
Patients and controls also received a neuropsychological assessment, in order to explore their
cognitive status in multiple cognitive functions such as memory, language and executive
functions. This included: Clock Drawing Test (Agrell & Dehlin, 1998), Direct and Inverse digit
Spam Test (Wechsler Memory Scale Revised, WMS-III; Wechsler, 1987), Immediate and
Delayed Recall (WMS-III; Wechsler, 1987), Phonemic and Semantic Fluency (Controlled Oral
Word Association Test, COWAT, Benton & Hamsher, 1989), Ideomotor Praxis of Barcelona Test
(Peña-Casanova, 1990), Rule shift Cards (Behavioural Assessment of the Dysexecutive
Syndrome, BADS; Norris & Tate, 2000), Visual Object and Space Perception Test (VOSP;
Warrington & James, 1991), Boston Naming Test (BNT; Kaplan et al., 1983) and Trail Making
Test A and B (TMTA and TMTB; Reitan, 1958)
Before the MEG recording, all participants gave a written informed consent to participate in
the investigation. The study was approved by the local ethics committee.

78
Table 1. Subject´s information. Characteristics given as mean ± standard deviation. M = males, F = females, MMSE =Mini Mental State Examination score. Educational level was grouped into five levels: 1: illiterate, 2: primary studies, 3: Elemental studies, 4: High school studies, 5: University studies. P-values for between-groups differences were introduced. Wilcoxon-Mann-Whitney test was used for continuous variables (age, educational level, MMSE, volume ratios) and Fisher’s exact test for sex differences.
Control group
(n=32)
MCI group
(n= 38) p-values
age (years) 71.8 ± 3.8 72.5 ± 4.5 0.50
sex (M/F) 10 / 22 18 / 20 0.22
educational level 3.8 ± 1.1 3.3 ± 1.3 0.12
MMSE score (points) 29.3 ± 0.9 27.1 ± 2.2 3.9·10-5
volume ratio:
hippocampus /
intracraneal
(5.09 ± 0.62)·10-3 (4.17 ± 0.89)·10-3 9.8·10-5
Number
of clean
4-second
segments
resting (27.6 ± 6.5) (27.9 ± 5.6) 0.83
1-subraction (22.5 ± 6.8) (21.7 ± 8.2) 0.55
3-subtraction (21.2 ± 5.6) (21.9 ± 8.2) 0.94
2.3 Experimental design
IDICS was based on a calculation mental task, which consisted of subtracting numbers
mentally. Participants were told an initial number, and instructed to repeatedly subtract a
given amount from that number over the course of one minute. After that minute, they were
asked what number they had reached, and the researchers made a note of their answers.
Participants were allowed to perform the subtraction at their own pace and were instructed to
keep their eyes closed while performing the task. Counting aloud and finger counting was
prohibited, and participants were instructed to continue the task regardless of any doubts of
error.
The IDICS task had two levels of difficulty:
○ 1-subtraction: Participants had to subtract 1 by 1 from a given fixed number.
○ 3-subtraction: Participants had to subtract 3 by 3 from a given fixed number.

79
In each subtraction condition, four numbers were given: two two-digit and two three-digit. The
same numbers were used for all the participants but their order was changed in order to
counterbalance experimental conditions. So, for each subject we registered 8 minutes of brain
activity and 8 behavioral responses, one for each given number. If a subject performed badly
more than one subtraction exercise in any condition (1-subtraction of 3-subtraction), he/she
was excluded from the present functional connectivity analysis. Following this criterion, 17
MCIs and 2 controls were excluded and only data from 70 subjects out of 89 recorded subjects
were used. A subtraction exercise was classified as badly performed if (1) participants
informed that they got lost or stopped performing the task correctly (2) they summed instead
of subtracting or (3) the final number they reached seemed out of a normal range (either too
big meaning they had subtracted very slowly or stopped doing so at some point or too small
meaning they had probably skipped some number intervals). As the task is not externally
controlled except for the number they give after one minute, the external assessment of the
performance is rather qualitative, and the validity of the data relied to a great extent on the
participants’ assessment of their own performance.
2.4 MEG Recordings and preprocessing
Brain magnetic fields were measured while each subject sat in a magnetically shielded room
(VacuumSchmelze GmbH, Hanau, Germany), using a 306 channel Vectorview system (Elekta
Neuromag) at the Center for Biomedical Technology (Madrid, Spain). Fields were measured
during a task-free, 3 min eyes-closed condition, and during the execution of the IDICs task.
Subjects were instructed to close their eyes in both conditions and move as little as possible.
The MEG system comprised 102 magnetometers and 204 planar gradiometers. Sampling
frequency was 1000Hz and an online filtering of 0.1-330Hz was applied. A head position
indicator (HPI) system and a three-dimensional digitizer (Fastrak Polhemus) were used to
determine the position of the head with respect to the sensor array. Four HPI coils were
attached to the subject (one on each mastoid, two on the forehead), and their position with
respect to the 3 fiducials (nasion, left and right pre auricular points) was determined. To record
vertical electrooculogram (EOG), two electrodes were attached above and below the left eye,
and a third one to the left earlobe for electrical grounding.
External noise was removed from the MEG data using the temporal extension of Signal-Space
Separation (tSSS) (Samu Taulu & Kajola, 2005) as implemented with the MaxFilter software
(version 2.2, Elekta-Neuromag) with a 10s raw data buffer and a subspace correlation limit of

80
0.9. Data was subsequently adjusted for head movement every 200 ms and transformed into a
common space.
Data was then preprocessed with Fieldtrip (Oostenveld et al., 2011). The continuous time
series (resting state and mental calculation task) were first separated into segments of 4
seconds. Then, jump, muscle and ocular artifacts were located using all 306 sensors and the
additional EOG channels. All segments containing artifacts were eliminated from the analysis.
As a result, all subjects had at least N=15 clean segments per condition. The amount of clean
trials was similar across groups (Table 1).
2.5 Functional connectivity analysis
In order to provide additional information to the measures widely used in the study of
functional connectivity in dementia (coherence and synchronization likelihood), Phase Locking
Value (PLV) (Mormann, Lehnertz, David, & E. Elger, 2000) between pairs of sensors was
computed. To avoid mixing signals of different nature and noise profiles we used only
magnetometers for this functional connectivity analysis (we note however that gradiometers
were used in the temporal signal space separation step, so the resulting magnetometer data
contain indirectly gradiometer information). We discarded 8 inferior temporal sensors from
the analysis for being noisy, keeping 94 magnetometers for the analysis. Fig. 1 shows the
distribution of these 94 channels in the MEG helmet in two and three dimensions, and
separates channels into different head regions for better understanding of the geometry.

81
Figure 1. MEG sensor layout. Magnetometer positions in 2D and 3D, separated into frontal, parietal, occipital and left and right temporal regions
First, time series were filtered with a Finite Impulse Response filter of order 600 (which
introduced a zero-phase distortion) into different frequency bands: delta (2-4Hz), theta (4-
8Hz), alpha (8-12Hz), beta (12-30Hz), and gamma (30-45Hz), yielding a narrow band signal
jx t for each sensor j=1…102 Its phase j t was extracted via a Hilbert Transform.
ji t
j j j jz t x t i hilbert x t A t e
(1)
Then, the synchronization between a pair of phases j t and k t was assessed by
computing the PLV.
1
1 j m k m
Mi t t
m
PLV eM
(2)
where M=4000 is the number of samples in the time series (4 seconds sampled at 1000 Hz).
This calculation was repeated for all pairs of sensors and averaged over segments belonging to
the same condition, ending up with a symmetrical 94x94 connectivity matrix for each subject,
condition (resting, 1- and 3-subtraction task) and frequency band.

82
2.6 Hippocampal volume
Hippocampal volumes were measured in order to provide an anatomical measure that
quantifies the degree of brain atrophy. Indeed a decrease in hippocampal volume has been
related to MCI and Alzheimer’s disease (Dubois et al., 2007; D. V Moretti et al., 2007). For each
subject, a high resolution T1 weighted magnetic resonance was acquired with a General
Electric 1.5 Tesla magnetic resonance (MR) scanner, using a high-resolution antenna and a
homogenization PURE filter (Fast Spoiled Gradient Echo sequence, TR/TE/TI = 11.2/4.2/450 ms;
flip angle 12º; 1 mm slice thickness, 256x256 matrix and FOV 25 cm). Freesurfer software
(version 5.1.0) and its specialized tool for automated subcortical segmentation (Fischl et al.,
2002) were used to segment the subject’s T1-weighted volume into different regions. Then,
hippocampal volume was normalized with the overall intracranial volume to account for
differences in head volume over subjects.
2.7 Statistical Analysis
To compare connectivity values between conditions and groups (controls vs MCIs) we
employed non-parametric statistical tests: Wilcoxon signed rank tests for differences between
conditions and independent samples Wilcoxon-Mann-Whitney tests for differences between
diagnoses. The results were corrected for multiple comparisons with a permutation technique
that was introduced by (Maris & Oostenveld, 2007). Following this approach, elements from
the two compared groups (e.g. condition 1 vs. condition 2 or diagnosis 1 vs. diagnosis 2) were
shuffled randomly. Then, two subsets with the same size as the originals groups were created,
that contained the shuffled elements. A new statistical test (signed rank Wilcoxon or Wilcoxon-
Mann-Whitney) was performed for these two randomly chosen groups. This procedure was
repeated 5000 times, yielding a set of surrogate p-values. The final and corrected p-value was
then defined as the proportion of permutations with a p-value lower than the one in the
original test.
To assess the relationship between neurophysiological activity and cognitive performance, the
average connectivity in significant links in the between-conditions analysis was correlated with
several neuropsychological test scores in the whole sample (controls and MCIs). Additionally,
hippocampal volumes were also included for correlations, in order to have an anatomical
measure of the pathology. Tests were described in the diagnostic criteria section of this paper.
Spearman’s r was calculated, along with the p-value testing for the hypothesis of no

83
correlation. This p-value was corrected for multiple comparisons with a permutation approach,
as explained in the previous paragraph.

84
3. RESULTS
3.1 Behavioral performance
In order to check whether subjects were actually performing the task after every 1-minute
subtraction exercise, subjects announced the final number they had reached. Since all
participants used the same original numbers in their countdown, the final number provides
insight into the individuals' performance. The final numbers were compared between groups
with a Wilcoxon-Mann-Whitney test. Significant differences in this final number would indicate
a different execution level across groups. This comparison was done separately for all
subtraction exercises (4 exercises for each subtraction task).
There were no significant differences between controls and MCI in any of the eight answers,
although the MCI group’s responses had higher standard deviation values than the Control´s
ones. This indicates that both groups were actively engaged in the task and had a similar
performance (see table 2).
Table 2. IDICS performance in Controls and MCIs. Mean values ± standard deviation of the responses given by the participants after 1 minute of subtraction. Numbers of the 1-subtraction condition: 75, 99, 158 and 246. Numbers of the 3- subtraction condition: 89, 97, 174 and 237. The p values were obtained with a Mann-Whitney U test.
Numbers
Mean values ± standard deviation
P values
Controls
MCIs
75 14,67 ±17,20 23,00 ± 20,06 P= 0.192
99 39,50 ± 21,48 55,14 ± 34,81 P= 0.226
158 102,12 ± 30,04 102,36 ± 37,96 P= 0.594
246 184,92 ± 37,34 169,73 ± 51,33 P= 0.639
89 24,65 ± 24,24 30,50 ± 24,69 P= 0.349
97 27,58 ± 17,78 51,36 ± 26,37 P= 0.051
174 121,00 ± 43,89 114,77 ± 36,54 P= 0.983
237 183,28 ± 34,85 166,18 ± 45,46 P= 0.186

85
3.2 MEG connectivity results
The result of the between-conditions analysis is summarized in Fig. 2 and Fig. 3.
Fig. 2 compares resting state and 3-subtraction task and shows the topography of the modified
links. The topography of the connectivity change produced by the 1-subtraction task was not
represented for the sake of simplicity. However, in general terms it was similar than the one
for the 3-subtraction task.
Figure 2. Statistical differences in connectivity between resting and 3-substraction task for controls and MCIs. Significantly altered links (p<0.005) are shown for every frequency band. A line between two nodes represents a link that has been significantly altered, and is either decreased (resting > task) or increased (task > testing) in the 3-substraction task. For clarity in visualization, only a selection of links was displayed: firstly, in order to reduce loose links, nodes participating with a single significant link were discarded, and secondly, a maximum of 150 links was plotted (if more links were statistically significant, 150 links with the lowest p-value were chosen).

86
Figure 3 contrasts resting with 1- and 3-subtraction task, displaying the overall amount of
altered links and enabling a comparison of the network change produced by both tasks.
Figure 3. Number of significantly altered links when comparing resting and task for different groups and frequency bands. The first row shows differences between 1-substraction task (grey) and resting state (white), the second row considers 3-substraction (black) and resting. The two groups (controls and MCIs) are represented in different columns. Only links with p<0.005 were considered.

87
Finally, Figure 4 represents differences between Controls and MCI for resting state and for a
resting-normalized 3-subtraction task separately, allowing a direct contrast between both
groups.
Figure 4. Statistical differences in connectivity between controls and MCIs in resting state and 3-substraction task. Significantly altered links (p<0.02) are shown for every frequency band. A line between two nodes represents a link that has been significantly altered, and is either increased (MCI > Control) or decreased (Control > MCI) in the MCI group. As in Figure 2, for clarity in visualization, loose links were removed a maximum of 150 links was displayed.
Results will be now described separately for every frequency band, focusing on connectivity
differences and neuropsychology correlations.

88
3.2.1 Delta band
During resting state, MCI patients exhibited higher values of connectivity fundamentally over
frontal regions than controls (see Fig. 4). This increment was inversely correlated with MMSE
(r= -0.28, p= 0,026); Immediate (r= -0.46, p˂0.0001) and Delayed Recall (r= -0.37, p= 0.002);
Rule shift Cards (r= -0.3, p= 0.016); Phonemic (r= -0.26, p= 0.035) and Semantic Fluency (r= -
0.35, p= 0.003); Boston Naming Test (r= -0.41, p= 0.001) and directly correlated with TMTA
time (r= 0.30, p= 0.016) and TMTB time (r= 0.30, p= 0.019)
Delta band connectivity pattern was greatly altered by the counting task compared to resting
state, showing a big increase of PLV interhemispheric connections in all groups, which were of
higher magnitude in MCIs (see Fig. 2 and 4).
The inter-hemispheric increment of synchronization observed in the control group while
performing the task was negatively correlated with the Inverse Digit Spam Test (r= -0.32, p=
0.010). Besides, a greater inter- hemispheric synchronization, as MCIs showed, was negatively
correlated with hippocampal volume (r=-0.27, p=0.049); Inverse digit Spam Test (r= -0.27, p=
0.031); Semantic Fluency (r= -0.25, p= 0.043) and Immediate (r= -0.26, p= 0.037) and Delayed
Recall (r= -0.27, p= 0.030), evidencing that a lower behavioral performance is associated with a
higher connectivity value. Additionally, a decrease in short range delta connectivity between
frontal sensors when performing the task, was positively correlated with TMTA time (r=0.26,
p= 0.042) and inversely correlated with Semantic Fluency (r= -0.25, p= 0.043); Immediate (r= -
0.36, p=0.003) and Delayed Recall (r= -0.35, p= 0.005) and Boston Naming Test (r= -0.31, p=
0.014).
3.2.2 Theta band
MCIs showed an increase in synchronization over right parieto-temporal areas and between
fronto-occipital regions during resting state compared to the control group (see Fig 4). This
hyper connectivity was negatively related to the hippocampal volume (r= -0.35, p= 0.01) and to
the scores in MMSE (r= -0.30, p= 0.015); Clock Drawing test (order subtest) (r= -0.39, p= 0.001);
Immediate (r= -0.56; p ˂0.0001) and Delayed Recall (r= -0.55, p ˂0.0001); Rule shift Cards (r= -
0.35, p= 0.004); Phonemic (r= -0.27, p= 0.028) and Semantic Fluency (r= -0.37, p= 0.002); and
Boston Naming Test (r= -0.34, p=0.002).
Theta band PLV distribution differed greatly in Controls and MCIs during the performance of
the task (see Fig 2). In the Control group few differences were found between resting and the
mental calculation state, and were not correlated with neuropsychological or hippocampal

89
measures. However, the MCI group showed both increases and decreases of synchronization
during the IDICS execution. The inter-hemispheric desynchronization from central to lateral
sensors was inversely correlated with Immediate (r= -0.246, p= 0.048) and Delayed Recall (r= -
0.281, p= 0.025); and the excess of interhemispheric PLV was directly correlated with TMTA
time (r= 0.277, p= 0.027).
3.2.3 Alpha band
There were clear differences in synchronization in resting state between both groups, since the
controls showed higher connectivity values, mainly over central and posterior
interhemispheric regions, than the MCI patients (see Fig 4). In addition this increment was
positively correlated with several test such as MMSE (r= 0.42, p= 0.001); Immediate (r= 0.40,
p=0.001) and Delayed Recall (r= 0.44, p< 0.0001); Phonemic (r=0.29, p= 0.021) and Semantic
Fluency (r= 0.35, p= 0.003); and Boston Naming Test (r=0.30, p= 0.016).
In addition, alpha connectivity behaved very differently from the previous bands, and the
changes in controls were bigger than in MCIs for this band during the IDICS task (see Fig 2).
Controls showed an important increase of interhemispheric PLV and a decrease in short-range
coupling in middle frontal sensors during the task, while in the MCI group far fewer links were
altered in the transition from the resting to the cognitive state.
The interhemispheric increase in synchronization during the performance of the mental task
was directly related to MMSE (r=0.285 p=0.021); Immediate (r=0.372, p=0.002) and Delayed
Recall (r= 0.309, p= 0.013); Phonemic (r=0.294, p=0.018) and Semantic Fluency (r= 0.267, p=
0.029); Boston Naming Test (r= 0.285, p=0.024); TMTA time (r=-0.428 p=0.0003) and TMTB
time (r=-0.369, p=0.003). While the decrease in synchronization in middle frontal regions was
positively correlated with hippocampal volume (r=0.35, p=0.011); MMSE (r=0.253, p=0.042);
Immediate (r=0.270, p=0.03) and Delayed Recall (r= 0.330, p= 0.008); Semantic Fluency (r=
0.388, p= 0.001) and Boston Naming Test (r=0.377, p=0.002) and negatively correlated with
TMTA time (r= -0.268, p=0.032) and TMTB time (r= -0.399, p=0.001). These results points out
the important relationship between this frequency band, and the hippocampal volume and the
cognitive status.

90
3.2.4 Beta band
Controls showed higher synchronization values over interhemispheric frontal areas and
parieto-occipital regions during resting state than the MCI subjects, who exhibited an increase
in connectivity between parietal and left temporal areas (see Fig 4). The rise of synchronization
over interhemispheric frontal areas and parieto-occipital regions was directly correlated with
hippocampal volume (r= 0.5, p< 0.0001); Immediate (r= 0.35, p= 0.004) and Delayed Recall (r=
0.37, p= 0.003) and inversely correlated to TMTA time (r= -0.26, p= 0.04), while the
hypersynchronization between parietal and left temporal areas was negatively related to Clock
Drawing test (order subtest) (r= -0.37, p= 0.002); Immediate (r= -0.4, p= 0.002) and Delayed
Recall (r= -0.42, p= 0.001); Semantic Fluency (r= -0.4, p= 0.001); Boston Naming Test (r= -0.42,
p= 0.01); and positively to TMTB time (r= 0.31, p= 0.015).
During the execution of the task, both groups exhibited an inter-hemispheric and anterior-
posterior desynchronization, being higher in the case of the controls, and different patterns of
increase of synchronization (see Fig 2). The increase of connectivity observed in the control
group between left anterior areas and right posterior regions was not correlated with
anatomical and neuropsychological information, while the interhemispheric synchronization
found in the MCI group was inversely correlated with Inverse Digit Spam (r= -0.249, p= 0.047)
and Immediate Recall (r= -0.253, p= 0.042).
Although an increase in desynchronization was observed in both groups while performing the
task, the pattern of the controls was positively correlated with Clock Drawing Test (order
subtest) (r= 0.414, p=0.001) and inversely correlated with TMTB time (r= -0.280, p=0.029);
while the pattern observed in the MCI group was negatively correlated with Inverse Digit Spam
(r= -0.332, p= 0.007); and Immediate (r= -0.344, p= 0.005) and Delayed Recall (r= -0.266, p=
0.033). Connectivity differences between both groups were mainly located in frontal regions
where connectivity was higher in Controls in resting state and higher in MCI during the task,
indicating a difficulty for MCIs to desynchronize during the task (see Fig 4).
3.2.5 Gamma band
In resting state, controls presented higher connectivity in parieto-occipital sensors than MCIs,
while these last showed higher PLV values between right fronto- temporo-parietal areas (see
Fig 4). The increase observed in the control group was positively correlated with MMSE (r= 0.3,
p= 0.015); Immediate (r= 0.5, p ˂0.0001) and Delayed Recall (r= 0.44, p ˂0.0001); Semantic
Fluency (r= 0.4, p= 0.001) and hippocampal volume (r= 0.5, p˂0.0001), whereas the

91
hypersynchronization between right fronto- temporo-parietal areas was inversely correlated
with Clock Drawing Test (order subtest) (r= - 0.28, p= 0.021); Direct Digit Spam (r= -0.32, p=
0.009); Immediate (r= -0.41, p= 0.001) and Delayed Recall (r= -0.34, p= 0.006); Semantic
Fluency (r= -0.33, p= 0.006) and shift Cards (r= -0.3, p= 0.018).
During the IDICS´s execution, both groups presented a central to lateral desynchronization
within the gamma band. The desynchronization pattern observed in the control group was
directly correlated with the Boston Naming Test (r= 0.279, p= 0.027); Ideomotor Praxis (r=
0.26, p= 0.04); and Immediate (r=0.312, p=0.011) and Delayed Recall (r= 0.352, p= 0.004);
while the desynchronization pattern found in the MCI group did not correlate with
hippocampal atrophy and cognitive performance.
Only the MCI group showed an increase of inter-hemispheric synchronization that was
inversely correlated with Direct (r= -0.302, p= 0.014) and Inverse Digits Spam (r= -0.396, p=
0.001) and Immediate (r= -0.267, p= 0.032); and Delayed Recall (r= -0.341, p= 0.006). This
suggests that hypersynchronization at higher frequencies could be associated with worse
cognitive performance in memory tasks.
3.3 1-and 3-subtraction tasks
In general the connectivity patterns in 1- and 3- subtraction tasks were alike. Since topography
in both conditions was similar, the overall amount of altered links between resting and 1- and
3- subtraction tasks are shown in Fig. 3, which allows the comparison between the network
changes induced by both tasks. In particular, if the transition from resting to 1- and then to 3-
subtraction task was linear, one would expect that the differences between resting and task
would be much bigger for the 3- than for the 1-subtraction task. And this could be seen
through a higher amount of altered links in the 3- than in the 1-subtraction task. For controls,
such a tendency was found in delta and beta, and to a lesser extent in the gamma band. On
the contrary for MCIs, there was rather a small decrease in the number of links in the 3-
subtraction task when compared to the 1-subtraction task.

92
4. DISCUSSION
The aim of this study was twofold: to investigate how functional connectivity changes between
resting state and IDICS with increasing processing demands, and to consider how the presence
of cognitive impairments in aging modifies these synchronization patterns. To this end we
measured MEG signals in healthy elderly adults and in patients diagnosed with MCI, and we
employed an internal mental calculation task with two levels of difficulty, 1- subtraction and 3-
subtration. As expected, task load modulated connectivity patterns, which differed between
both groups, and MCI displayed hypersynchronization in most frequency bands and a lack of
synchronization in the alpha band.
4.1 Resting versus IDICS task
Delta results are in line with most calculation task studies, which have mainly used EEG and
analyzed power distributions (Harmony et al., 1996, 2004; Dimitriadis et al., 2010;
Giannitrapani, 1971). Delta band activity is considered to increase during cognitive tasks
requiring attention to internal processing and to decrease under conditions which demand
attention to the external environment. Additionally, the magnitude of the increment rises with
the difficulty of the task (Dimitriadis et al., 2010; Harmony et al., 1996). Here we showed that
in both groups delta connectivity was greater during mental calculation than in resting state; a
finding in line with the previous literature. This increased connectivity between the left and
right anterior regions indicates the necessity of the interaction between both hemispheres for
the performance of mental calculation and could be engaged in updating of arithmetic
operations and manipulation of information (Krueger, Landgraf, van der Meer, Deshpande, &
Hu, 2011).
No important differences in the theta band could be ascertained in the control group. Some
studies using EEG to investigate cognition during arithmetic and mental tasks have described
an increase in theta-band activity in the frontal midline areas of the brain, although in these
cases spectral power was being considered instead of connectivity (Sasaki et al., 1996; Ishii et
al., 1999; Onton, Delorme, & Makeig, 2005; Yener et al. 2013). For MCIs, bigger connectivity
changes between task and resting were needed to deal with the subtraction task. These results
could be explained for two possible reasons: First, individuals in the MCI group found the task
more difficult to complete and thus displayed more theta-band activity (theta-band activity
being attributed to memory load, complex tasks and attention (Gevins, Smith, McEvoy, & Yu,
1997), and second because the MCI group usually shows an increase in both theta power and

93
connectivity during the execution of cognitive tasks (Jiang et al, 2005, 2008; Aurtenetxe et al.,
2013).
In the alpha band the control group showed an increase in connectivity during the subtraction
task. These results are consistent with recent studies which consider that the alpha band is
associated with internal tasks (Benedek, Bergner, Könen, Fink, & Neubauer, 2011; Cooper,
Croft, Dominey, Burgess, & Gruzelier, 2003; Jensen, Gelfand, Kounios, & Lisman, 2002; S. Palva
& Palva, 2007; Sauseng et al., 2005), such as mental calculation, and that may reflect an
internal information processing which involves top-down control and may be related to an
inhibition of external interfering input (Jensen & Mazaheri, 2010). Controls also displayed a
desynchronization over frontal brain areas, which could be related to the processing of
semantic information such as mathematical knowledge (Wolfgang Klimesch, Sauseng, &
Hanslmayr, 2007). For MCIs, few connectivity changes were found in this band, suggesting that
this group had less cognitive control. It could be speculated that the excess synchronization in
delta, theta, beta and gamma bands compensated for the lack of connectivity changes in the
alpha band.
In the beta band, long distance connections between left anterior region and right posterior
areas increased in the control group. Conversely, there was a broad desynchronization in both
groups in the IDICS task compared to resting state. This may reflect the activation of areas
needed for calculation-such as the fronto-parietal network (Krueger et al., 2011) or the
deactivation of others that are able to adapt to the cognitive difficulty. Each factor could play a
role in the successful execution of cognitive tasks. These results could be related to the Default
Mode Network (DMN) (Raichle et al., 2001), which is an antero-posterior network that
deactivates when performing a task. So the DMN might behave in the same way in internal
and external cognitive tasks, although further studies would be needed to test this hypothesis.
Finally, our results suggest that the main differences from group to group were found in the
anterior regions of the DMN. These regions were found to be more desynchronized in the
control group when compared to MCIs, indicating that MCIs were not able to sufficiently
deactivate this network to perform the task.
Similar to the beta-band findings, a desynchronization of the resting state networks of both
groups was noted during task performance when looking at results in the gamma band. In this
line, Park et al. (2012) found higher gamma event related desynchronization in elderly controls
when compared to a group of MCI patients, which was related to cognitive performance.

94
4.2 Control group vs MCI group
As expected, differences in resting state connectivity between Control and MCI were found.
The MCI group presented a higher synchronization than the control group in low frequency
bands (e.g. frontal delta and antero-posterior right theta) and this increase related to
hippocampal atrophy (i.e. theta band) and to a lower global cognitive status (i.e. MMSE) and
worse performance in attention, memory, language and executive functioning. On the
contrary, they exhibited lower connectivity values in the alpha band, especially inter-
hemispheric and in central and posterior regions, as well as the beta band in frontal areas. The
desynchronization observed in the MCI group was related to poorer performance in multiple
cognitive domains, such as memory or executive function, and also with a smaller hippocampal
volume. Finally, MCIs showed a higher synchronization in the gamma band between right
anterior and central areas, which was related to a poorer performance in attention, memory
and executive function, while in the control group this increase was localized in more posterior
regions and was directly correlated with a greater hippocampal volume and higher scores in
MMSE, Immediate and Delayed Recall and Semantic Fluency. Most of these findings, and
especially the decrease in synchronization in alpha and beta bands, are in agreement with
those found in MCI and AD studies (Berendse et al. 2000; Jelic et al. 2000; Koenig et al. 2005;
Stam, van der Made, Pijnenburg, & Scheltens, 2003; Moretti et al., 2008; Gómez 2009),
suggesting that MCI could be considered as the beginning of the “disconnection syndrome”
(Delbeuck et al., 2003).
For the subtraction task MCIs showed an increase of synchronization in most frequency bands
during the execution of the task when compared to the resting state. This points out that the
MCI were calculating in a rather inefficient way, since they needed more brain connections
than the control group to perform the same task. These findings are in agreement with many
studies which employed cognitive tasks in MCI population (Bajo et al., 2010; Jiang & Zheng,
2006; Jiang, 2005; Pijnenburg et al., 2004). In the alpha band however, MCIs were
desynchronized during the task. This could mean that MCI showed an impairment in the
mechanisms related to top-down control and inhibition of external inputs and (Wolfgang
Klimesch et al., 2007), which would indicate that MCIs struggled with centering on the task. On
the whole, these synchronization/desynchronization profiles could be a used as a potential
biomarker of the MCI disease.

95
To further investigate the meaning of the hyper/hyposynchronization found during the
execution of the IDICS task and their relation to brain atrophy and cognitive behavior,
connectivity changes were correlated with hippocampal volumes and neuropsychological tests.
In the MCI group, the increases and decreases found in synchronization in delta, theta, beta
and gamma bands during the execution of the task correlated with a lower performance in
most of the neuropsychological measures employed, including semantic and episodic memory,
attention and executive functioning. Additionally, higher PLV values in delta band during IDICS
were related to lower hippocampal volume, indicating that delta hypersynchronization during
the execution of the task relates to anatomical and functional deterioration. It is noteworthy
that in the control group, an interhemispheric increase in the alpha band was directly
correlated with global cognitive status (i.e. MMSE), semantic and episodic memory, and
executive functioning, while a frontal decrease in connectivity was also related to the
hippocampal volume. These results indicate that the ability to modulate the alpha band is
essential for a good cognitive functioning.
4.3 Task load
In delta, beta and to a lesser extent in gamma frequency bands, the number of altered links
was higher in the 3- than the 1-subtraction task when compared against the resting state,
indicating that task load modulates connectivity changes. Other studies have described how
brain activity increases with task difficulty or cognitive load in ageing (Morcom, Li, & Rugg,
2007; Rypma, Eldreth, & Rebbechi, 2007; Zarahn, Rakitin, Abela, Flynn, & Stern, 2007). Palva et
al. (2010) found that an increase working memory load resulted in a strengthened brain
synchrony. Micheloyannis et al. (2005) suggested that increasing the complexity of arithmetic
tasks by increasing the demand for additional operations is associated with a more widespread
synchronization pattern. However, this increase of altered connections with task difficulty was
not present in MCI. This effect could be interpreted under the framework of the CRUNCH
model (Compensation-Related Utilization of Neural Circuits Hypothesis (Reuter-Lorenz &
Cappell, 2008), which was introduced to explain how cortical circuits adapt to increasing task
load. When the old and young subjects are compared, the older cohort recruit more neural
resources to acquire a similar performance at low levels of task demand, leading to higher
levels of neural activity. Regardless, they have fewer resources available to meet the
processing requirements of more demanding task (as a resource ceiling is reached) and their
performance then declines. A similar effect seems to occur in this study, when elders with and
without cognitive impairment were compared. In the control group, the synchronization

96
changes rose with the difficulty of the task (i.e. Delta band), while in the MCI group more
resources were needed to achieve the same level of performance in the 1-subraction task, but
a decline in synchronization changes was noted in the 3-subtraction condition. However,
further studies with increasing load are needed to verify this effect in both normal and
pathological aging.
In summary, controls exhibited connectivity changes in all frequency bands to deal with the
IDICS. These changes were related to the task difficulty, especially in delta and beta frequency
bands, according to the CRUNCH model. MCIs showed different connectivity profiles than
controls, pointing out that the MEG could contribute to the assessment of the MCI diagnosis,
in addition to that of the biomarkers commonly used in clinical practice (Molinuevo & Rami,
2013). MCIs showed a higher synchronization increase to perform the task, except from the
alpha band. This increment did not correlate positively with the task load, and was associated
with a lower behavioral cognitive function. In fact, this hyperconnectivity in MCI has been
found previously in working memory tasks with external stimuli (Bajo et al, 2010), and was
used as a marker for prediction of conversion to dementia (Bajo et al. 2012). It can be
speculated that the profile of hypersynchronization found here in the MCI patients may be
related to the pathological process of AD. This view of synchronization as pathological, not as
compensatory, would be in agreement with the hypothesis proposed by de Haan et al. 2012).
They postulated that the increase in connectivity reported in MCIs might be due to higher
amyloid accumulation over the most connected regions (hubs), which are especially vulnerable
to AD.. In this line, hyperactivity has been associated with the release of beta amyloid protein
into interstitial fluid and neuronal hyperexcitability (Cirrito et al., 2008). In fact, recent findings
indicate that in the vicinity of the beta amyloid plaque there is a decrease in the number of
gabergic neurons (Garcia-Marin et al., 2009) which could increase the hyperexcitability. Thus,
the greater the excitability, the greater the likelihood of neuronal synchronization and as a
consequence a profile of widespread connectivity as is the case of the MCI patients.
The internal cognitive task introduced here differs from the most commonly employed
cognitive paradigms, because of the absence of external stimuli, which requires inhibition from
both the environment and internal thoughts. This would suggest that the MCIs had difficulties
with top-down control processes during the calculation task, since they failed to synchronize in
alpha band. Impairment in inhibitory control mechanisms may affect the performance of daily
living activities, contributing to the patient’s progressive inability to adapt to the environment
and to control for internal emotional stimuli (Fujie et al., 2008). Thus, the IDICS allows a better
comparison with the resting state condition than usual external tasks, as it resembles the

97
resting condition more, and provides relevant information regarding the brain network
impairment in MCI.
4.4 Limitations of the study
It is important to note that this study present some limitations. First of all, the IDICS task
employed here is advantageous and novel in that it enables the study of brain alterations in
MCI independently from the effect of external stimuli. However, it has a clear drawback: as an
internally-driven task, its performance is difficult to assess externally. The consideration of the
final number that was reached from the subjects after a subtraction exercise provides some
insight into the task execution, but it is not a direct metric of performance. Second, we
analyzed functional connectivity in classically defined frequency bands, with fixed frequency
limits: delta (2-4 Hz), theta (4-8 Hz), alpha (8-12 Hz), beta (12-30 Hz), gamma (30-45 Hz).
However, we did not examine power spectra. A future spectral analysis could provide insight
on how brain rhythms change with the IDICs task and with the MCI disease. Third, the analysis
was performed in sensor-space and therefore lacks spatial accuracy. Future studies in source
space could locate the brain areas and the networks, as the DMN, involved in the functional
connectivity changes in MCI. Fourth, as the calculation task used requires different cognitive
processes, factors such as attention could be affecting the task execution. Fifth, to propose the
MEG as a new potential biomarker it should be compared with the established biomarkers in
dementia research such as cerebrospinal fluid (CSF) and Positron emission tomography with
Pittsburgh compound B (PET-PIB) (Dubois et al., 2010).

98
STUDY III
Hypersynchronization in alpha band differs progressive
from stable mild cognitive impairment. A MEG study

99
1. AIMS AND HYPOTHESIS
As there is a lack of studies based on a non-invasive technique which: 1) explore the brain
regions which are affected in pMCI from a synchronization framework (previous functional
connectivity studies with EEG/MEG were done in the sensor space); and 2) combine
information of brain damage (i.e. MR-volumetry), functional network organization and
cognitive status, the present predictive resting state MEG study in source space would
integrate neuropsychological, neurophysiological and structural information in order to
compare sMCI and pMCI patients. According to previous neurophysiological studies, we
predict that pMCI patients will show a higher synchronization in high frequency bands
primarily over posterior brain areas compared to sMCI participants.

100
2. METHODS
2.1 Subjects
For the present study 49 MCI patients were recruited from the Neurology and Geriatric and
departments of the ‘‘Hospital Universitario San Carlos, Madrid” and the ‘‘Memory Decline
Prevention Centre, Madrid”. All of them were right handed (Oldfield, 1971) and native Spanish
speakers. All participants were monitored yearly over 2 year follow- up period, with a clinical
examination every six months. According to their clinical follow-up, they were divided in two
subgroups: stable MCI patients (n=30) and progressive MCI patients (n=19). The pMCI subjects
used in this study can be considered faster converters (13.16 ± 5.87 (mean ± SD) months)
(Okello et al., 2009).
Both groups were homogenized in age (mean age sMCI: 74.03 years; pMCI: 76.68 years; p =
0.104), gender (males/females sMCI: 14/16; pMCI: 8/11; p = 0.777) and educational level
(sMCI: 2.79; pMCI: 2.68; p = 0.934).
2.2 Diagnostic criteria
The Mini Mental State Examination (MMSE; Lobo et al., 1979), the Geriatric Depression Scale
(Yesavage et al., 1982) the Global Deterioration Scale (GDS; Reisberg et al., 1982), the
Hachinski Ischemic Score (HIS; Rosen et al., 1980), the Functional assessment questionnaire
(FAQ; Pfeffer et al., 1982), the questionnaire for Instrumental Activities of Daily Living (IADL;
Lawton & Brody, 1969), and the Functional Assessment Staging (GDS/FAST; Auer & Reisberg,
1997) where used to establish the global cognitive and functional status of the patients.
MCI diagnosis was established according to Petersen´s criteria (R C Petersen, 2004): (1)
memory complaint confirmed by an informant; (2) abnormal memory function; (3) normal
general cognitive function; (4) total absence or minimal impairment in activities of daily living
(ADLs); and (5) not sufficiently impaired to fulfil the dementia´s criteria by the clinical
guidelines of the National Institute of Neurological and Communicative Disorders and Stroke
and the AD and Related Disorders Association (NINCDS-ADRDA) (G. McKhann et al., 1984). In
addition, all subjects underwent an extensive neuropsychological assessment to evaluate their
cognitive deficits in multiple areas with the following tests: Clock Drawing Test (Agrell &
Dehlin, 1998), Direct and Inverse digit Spam Test (Wechsler Memory Scale Revised, WMS-III;
Wechsler, 1987), Immediate and Delayed Recall (WMS-III; Wechsler, 1987), Phonemic and
Semantic Fluency (Controlled Oral Word Association Test, COWAT, Benton & Hamsher, 1989),

101
Ideomotor Praxis of Barcelona Test (Peña-Casanova, 1990), Rule shift Cards (Behavioural
Assessment of the Dysexecutive Syndrome, BADS; Norris & Tate, 2000), Visual Object and
Space Perception Test (VOSP; Warrington & James, 1991), Boston Naming Test (BNT; Kaplan et
al., 1983) and Trail Making Test A and B (TMTA and TMTB; Reitan, 1958).
All of them were classified as amnestic MCI patients. All subjects were re-evaluated every 6
months in order to assess their evolution. Therefore, those patients who finally fulfilled the
criteria for probable AD according to the guidelines of the NINCDS- ADRDA (G. McKhann et al.,
1984) were classified as pMCI.
The whole sample of MCI patients was free of significant neurological or psychiatric diseases
(other than AD or MCI) and medical treatment which could affect MEG activity (e.g.
cholinesterase inhibitors). General inclusion criteria considered an age between 65 and 85
years, a modified Hachinski score less than or equal to 4, a Hamilton Depression Rating Scale
score less than or equal to 9 and a magnetic resonance imaging (MRI) within 12 months before
MEG screening without indication of infection, infarction, or focal lesions.
The study was approved by the local ethics committee and, before the MEG recordings; a
written informed consent was signed from all subjects or their legal representatives.
2.3 Hippocampal volumes
Hippocampal volumes were measured as anatomical evidences of brain atrophy characteristic
for MCI and AD (Dubois et al., 2007). In addition, this measure has previously shown its
predictive power in AD progression (Clifford R Jack et al., 1999). For most of the subjects
included in this paper (23 sMCI and 14 pMCI) a T1- weighted MRI was available, acquired in a
General Electric 1.5 Tesla magnetic resonance scanner, using a high-resolution antenna and a
homogenization PURE filter (Fast Spoiled Gradient Echo sequence, TR/TE/TI = 11.2/4.2/450 ms;
flip angle 12°; 1 mm slice thickness, 256x256 matrix and FOV 25 cm). These MRI images were
processed with Freesurfer software (version 5.1.0) and its specialized tool for automated
cortical and subcortical segmentation (Fischl et al., 2002) in order to obtain the volume of
several brain areas. Finally, hippocampal volume was normalized with respect to the overall
intracranial volume (ICV) to account for differences in head volume over subjects.

102
2.4 MEG recordings
Neurophysiological data was acquired by using a 306 channel (102 magnetometers, 204 planar
gradiometers) Vectorview MEG system (Elekta AB, Stockholm, Sweden), placed in a
magnetically shielded room (VacuumSchmelze GmbH, Hanua, Germany) at the “Laboratory of
Cognitive and Computational Neuroscience” (Madrid, Spain). All recordings were obtained in
the morning, while subjects were comfortably resting with eyes closed, but awake. Three
minutes of MEG signal was acquired for each subject.
Head shape was obtained by using a three-dimensional Fastrak digitizer (Polhemus,
Colchester, Vermont) by acquiring three fiducial points (nasion and left and right preauricular
points) and at least 300 points of the surface of the scalp. In addition, four head position
indication (HPI) coils were placed in the subjects head, two in the mastoids and two in the
forehead. HPI coils’ position was also acquired using the Fastrak device, in order to provide
continuous head position estimation during the recording. Finally, a vertical electrooculogram
was placed near the left eye of the subjects to capture the blinks and eye movements.
MEG data was acquired using a sampling rate of 1000 Hz and an online anti-alias filter between
0.1 and 330 Hz. Recordings were offline filtered using a tempo-spatial filtering algorithm (tSSS,
correlation window 0.9, time window 10 seconds) (S Taulu & Simola, 2006; Samu Taulu &
Kajola, 2005) to subtract the sources of noise placed outside the head, and the head
movements were corrected using the same algorithm.
The signal coming from the planar gradiometers was discarded, and only magnetometers were
used in the subsequent analysis. Ocular, muscular and jump artefacts were identified using an
automatic procedure from the Fieldtrip package (Oostenveld et al., 2011), and confirmed by a
MEG expert. The remaining data was segmented in four seconds epochs of artefact-free
activity. Only subjects with at least 15 segments were selected for further analysis (27.23 ±
5.99 epochs in the sMCI group, 26.11 ± 6.73 epochs in the pMCI group, mean ± standard
deviation). In addition, an ICA-based procedure was employed to remove the
electrocardiographic artefact when it was easily identified.
Artefact-free epochs were filtered in six bands: delta (2 to 4 Hz), theta (4 to 8 Hz), alpha (8 to
12 Hz), beta1 (12 to 20 Hz), beta2 (20 to 30 Hz) and gamma (30 to 45 Hz), using a 1500 order
FIR filter with Hamming window. The segments were padded with 1.75 seconds of real signal
from both sides (1750 samples) to prevent edge effects inside the data.

103
2.5 Source reconstruction
A source reconstruction analysis was performed independently for each band, using Linearly
Constrained Minimum Variance (LCMV) beamformer (Van Veen, van Drongelen, Yuchtman, &
Suzuki, 1997). As we did not have a T1 MRI for all subjects a 1mm resolution template of
healthy adults (52 subjects, ages 69.9±4.4, mean ± standard deviation) normalized to the
Montreal Neurological Institute (MNI) 1mm voxel size template was used to place the sources
inside the brain. T1-weighted images were co-registered to the MNI T1 template (available in
SPM5 http://www.fil.ion.ucl.ac.uk/spm/software/spm5/) using linear affine registration with
normalized mutual information as fitness function (Collignon & Maes, 1995). The registered
images were normalized to the MNI template using a non-linear registration algorithm
(Ashburner, 2007) and then smoothed with a Gaussian kernel with full width half maximum
(FWHM) of 4 mm. The resulting normalized images were averaged across subjects to obtain
the T1-weighted template. This template was used to define a homogeneous grid of 1cm, and
then both template and grid were linearly transformed to fit the head shape of each subject.
The leadfields were defined using a local spheres approach to fit the head shape of each
subject in the vicinity of each sensor. Spatial filter coefficients were estimated for each subject
using the computed leadfield and an average of the covariance matrix for all the segments.
Thereafter, this filter was used to compute the source time series separately for each segment
and source location.
Sources were grouped according to the 96 areas Harvard-Oxford cortical map, assigning each
source location to the most probable area given its position. Only 1681 source locations
labelled as belonging to an area defined in the atlas were considered in the following steps.
2.6 Connectivity analysis
The analysis of the connectivity was performed using the hypothesis of phase synchronization
(Rosenblum, Pikovsky, & Kurths, 2001) evaluated by means of the Phase Locking Value (PLV)
(Lachaux, Rodriguez, Martinerie, & Varela, 1999). Phase synchronization measures found in the
hypothesis that the difference of phases between two phase-locked systems must be non-
uniform, and so the degree of non-uniformity must be a good estimator of the coupling level.
In PLV the degree of non-uniformity is calculated by defining as many vectors as temporal
points, each one with unity norm and phase equal to the difference of phases of both systems
for this temporal point. The norm of the mean vector is the PLV value, ranging from 0, when
the differences of phases are uniformly distributed, to values near to 1, when the phases are

104
concentrated in a small portion of the available range. The formal definition for the PLV value
between two systems, i and j, with instantaneous phases and , is (Lachaux et al.,
1999):
To reduce the dimensionality of the information, we estimated the synchronization between
each pair of areas of the Harvard-Oxford cortical atlas. We can consider each area as a system,
and each source position inside the area as a noise-contaminated realization of the system. For
each pair of areas, area with sources and area with sources, we can create by
combinations of sources for each segment, leading to by repetitions of the experiment.
All this repetitions are time locked, thus the total synchronization can be obtained as the norm
of the mean vector for all the repetitions.
On the other hand, different segments are not time-locked, as in resting state there is no
triggering event that resets the phases (Lachaux et al., 1999). We can then average the
synchronization value of all the segments for each pair of areas, obtaining a consistent
indicator of the level of coupling between the areas. Formally, this PLV index between the
areas and is calculated by:
where represents the instantaneous phase the time series of the area for the
instant of the segment .
2.7 Statistical Analysis
To assess the significant differences in functional connectivity measures we performed a
Mann-Whitney U non-parametrical test using the PLV values estimated for each pair of areas.
To correct the multiple comparisons problem we performed firstly a non-parametric
permutation tests, keeping the size of the groups but randomly permuting their members
(10,000 permutations). The p-value obtained in this step represents the portion of
permutations in which the U statistic was greater than that in the original data set.

105
Then a False Discovery Rate (Benjamini & Hochberg, 1995) with q=0.1 (a 10% false positive
probability) was used to reduce the portion of false positives in the obtained p-value
distribution. Only the links that survived the FDR are reported in Results section. In addition, a
Spearman correlated test was performed between connectivity values in these links and
neuropsychological and structural data, in order to better understand its significance.
Finally, a classification analysis was performed using the variables that showed significant
differences between both groups by using a linear discriminant analysis with leave-one-out
cross validation procedure. Results are described in terms of accuracy, sensibility and
specificity. These three parameters represented the total fraction of subjects, the fraction of
pMCI patients and the fraction of sMCI patients correctly classified, respectively.

106
3. RESULTS
As the diagnosis criteria for AD according to the NINCDS-ADRDA is based on
neuropsychological performance, our first approach was to evaluate the predictive capacity of
these tests to discriminate between sMCI and pMCI. Table 1 shows the statistical values
associated with each cognitive measurement. MMSE scores showed no differences between
groups. In contrast, both groups of patients did differ in Immediate (p < 10-5) and Delayed
Recall (p < 10-4), Rule shift Cards (p < 0.05) and Semantic Fluency (p < 0.05). A classification
analysis was performed for each one of the two most significant, achieving classification rates
of 77.6% for Immediate Recall (70.0% sensibility, 89.5% specificity) and 66.7% for Delayed
Recall (50.0% sensibility, 94.4% specificity). On the other hand, hippocampal volumes, a
common indicator of progression in previous studies, showed no differences between groups.
Table 1. Demographic, anatomical and neuropsychological information. Mean values ± standard deviation of the demographic and clinical characteristics of the Stable MCI patients (SMCI) and Progressive MCI patients (PMCI). M = males; F = females; MMSE = Mini Mental State Examination; GDS= Global Deterioration Scale; FAQ= Functional Activity Questionnaire; GDS- 15= Geriatric Depression Scale; BNT= Boston Naming Test; VOSP= Visual Object and Space Perception Battery; TMTA (acc.) = Trail Making Test part A (accuracy); TMT B (acc.) = Trail Making Test part B (accuracy). Educational level was grouped into five levels: 1: illiterate, 2: primary studies, 3: Elemental studies, 4: High school studies, 5: University studies. P-values for between-groups differences were introduced and significant values (p˂0.05) were marked with an asterisk (*). Wilcoxon-Mann-Whitney test was used for continuous variables (age, educational level, MMSE, Immediate and Delayed recall, Rule Shift Cards, Semantic Fluency, and left and right normalized hippocampus volumes) and Fisher’s exact test for gender differences.
Stable MCI patients
(SMCI) (n=30)
Progressive MCI
patients (PMCI) (n=19)
P- values
Age (years) 74.03 ± 5.34 76.68 ± 5.282 0.104
Gender (M/F) 14/16 8/11 0.777
Educational level 2.79 ± 1.26 2.68 ± 1.00 0.934
MMSE score 27.9 ± 1.86 27.40 ± 1.96 0.455
GDS 3±0 3±0 1
FAQ 1.91 ± 1.78 1.82 ± 2.75 0.501

107
GDS-15 3.83 ± 3.08 3.5 ± 3.82 0.647
Immediate Recall 20.7 ± 8.17 10 ± 4.98 3.26 x 10⁻⁶*
Delayed Recall 8.63±7.39 1.78 ± 2.21 7.18 x 10⁻⁵*
Rule shift Cards 2.41±1.26 1.56 ± 1.19 0.028*
Semantic Fluency 13±2.81 11.579 ± 4.36 0.041*
BNT 50.41 ± 10.69 46.32 ± 9.36 0.510
Clock Drawing Test
(copy)
7.64 ± 2.64 8 ± 4.17 0.60
Clock Drawing Test
(order)
6.41 ± 2.62 7.39 ± 3.85 0.615
Direct digit Spam 6.73 ± 1.63 6.37 ± 1.46 0.413
Inverse digit Spam 4.67 ± 1.26 4 ± 1.37 0.103
VOSP 6.68 ± 3.45 7.16 ± 3.06 0.593
Phonemic Fluency 10.837 ± 4.22 8.789 ± 4.08 0.119
TMT A (time) 78.7 ± 36.03 82.83 ± 33.64 0.58
TMT A (acc.) 24 ± 0.58 23.83 ± 1.79 0.401
TMT B (time) 223.17 ± 107.75 258.38 ± 121.71 0.329
TMT B (acc.) 20.1±4.84 15.21 ± 8.60 0.50
Ideomotor Praxis 7.25 ± 1.73 7.21 ± 1.13 0.374
Left hippocampus 0.002217 ± 0.0005075 0.001992 ± 0.0002537 0.056
Right hippocampus 0.002197 ± 0.0004656 0.001965 ± 0.0003882 0.063

108
The functional connectivity analysis exhibited no significant differences between groups after
the FDR in delta, theta, beta1, beta2 or gamma bands. In contrast, FDR analysis in Alpha band
showed five significant links between the Right Anterior Cingulate Gyrus and Right Middle
Temporal Gyrus and Occipital regions in both hemispheres. In all these links pMCI patients
showed significantly greater connectivity values than sMCI patients (p < 10-3). Figure 1 depicts
the position and size of all six regions implied in these links, and Table 2 shows the p-value of
each one. Afterwards, a classification analysis was performed individually for each link,
achieving a maximal classification rate in Link 4 (Right Lateral Occipital Cortex, inferior division
with Right Cingulate Gyrus, anterior division) with an accuracy of 81.6% (83.3% sensibility,
78.9% specificity). All classification statistics are showed in Table 2.
Figure 1. Cortical areas implied in the five connectivity links that showed significant differences between groups. A: Different views of the brain based in MNI template and Harvard-Oxford cortical areas involved in those links. B: Relation of areas, numbers and colours. C: Significant connectivity links established between those areas.

109
Table 2. The five significant links in the alpha band between sMCI patients and pMCI were obtained with a Mann-Whitney U test after the FDR. Link 1: Right Cingulate Gyrus, anterior division with Right Occipital Pole. Link 2: Right Cingulate Gyrus, anterior division with Right Middle Temporal Gyrus, temporo-occipital part. Link 3: Right Cingulate Gyrus, anterior division with Left Lateral Occipital Cortex, inferior division. Link 4: Right Cingulate Gyrus, anterior division with Right Lateral Occipital Cortex, inferior division. Link 5: Right Cingulate Gyrus, anterior division with Left Supracalcarine Cortex. ACC: Accuracy. SEN: Sensibility. SPE: Specificity.
In order to better describe our functional connectivity findings we performed a Spearman
correlation test between connectivity values in those links, neuropsychological punctuations
and volumetric data. We found an inverse significant correlation (p < 0.05) between some of
this links and MMSE, Immediate Recall and Semantic Fluency scores. Moreover, we observed
inverse significant correlations (p < 0.05) between several links and both hippocampus
volumes. Table 3 details all these findings along with their significance level.
Stable MCI
patients (sMCI)
(n=30)
Progressive MCI
patients (pMCI)
(n=19)
p- values Classification
statistics
ACC (SEN, SPE)
Link 1 0.095 ± 0.02 0.132 ± 0.03 1.73 x 10⁻⁴ 77.6% (83.3%, 68.4%)
Link 2 0.105 ± 0.03 0.140 ± 0.02 2.04 x 10⁻⁴ 77.6% (76.7%, 78.9%)
Link 3 0.101 ± 0.031 0.141 ± 0.03 2.81 x 10⁻⁴ 69.4% (70.0%, 68.4%)
Link 4 0.100 ± 0.03 0.142 ± 0.03 3.40 x 10⁻⁵ 81.6% (83.3%, 78.9%)
Link 5 0.141 ± 0.03 0.182 ± 0.03 1.35 x 10⁻⁴ 77.6% (76.7%, 78.9%)
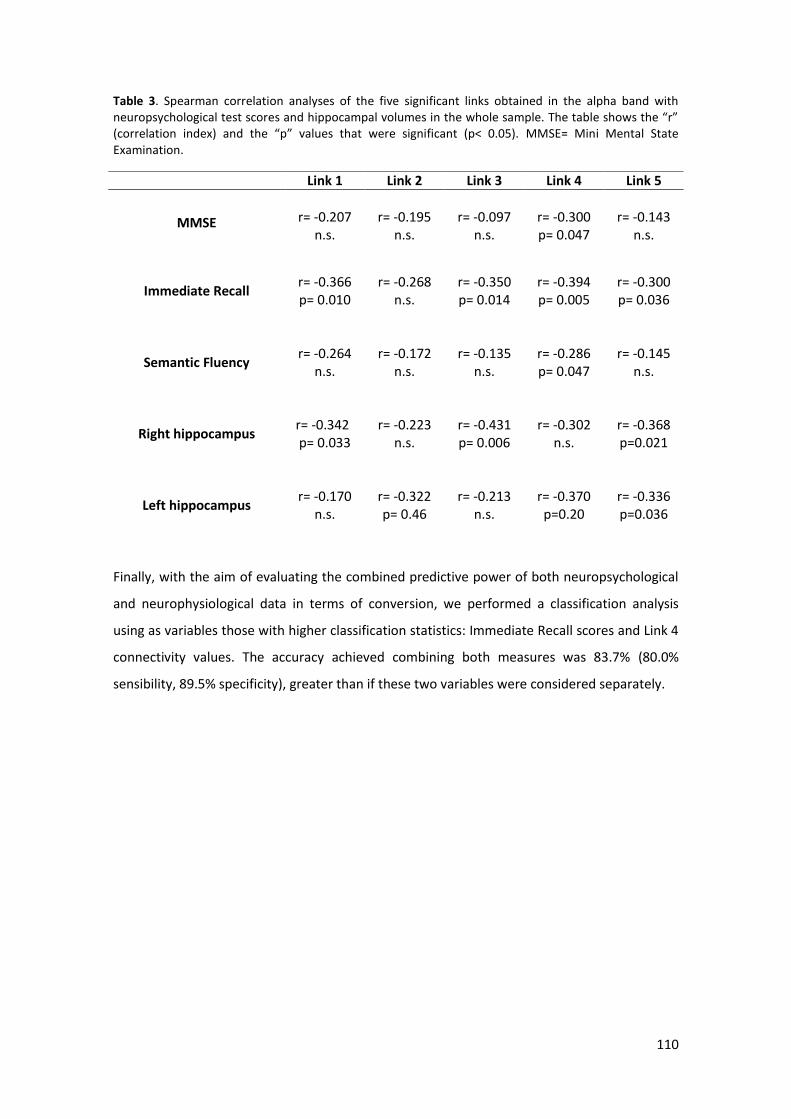
110
Table 3. Spearman correlation analyses of the five significant links obtained in the alpha band with neuropsychological test scores and hippocampal volumes in the whole sample. The table shows the “r” (correlation index) and the “p” values that were significant (p< 0.05). MMSE= Mini Mental State Examination.
Finally, with the aim of evaluating the combined predictive power of both neuropsychological
and neurophysiological data in terms of conversion, we performed a classification analysis
using as variables those with higher classification statistics: Immediate Recall scores and Link 4
connectivity values. The accuracy achieved combining both measures was 83.7% (80.0%
sensibility, 89.5% specificity), greater than if these two variables were considered separately.
Link 1 Link 2 Link 3 Link 4 Link 5
MMSE
r= -0.207
n.s.
r= -0.195
n.s.
r= -0.097
n.s.
r= -0.300 p= 0.047
r= -0.143
n.s.
Immediate Recall
r= -0.366 p= 0.010
r= -0.268
n.s.
r= -0.350 p= 0.014
r= -0.394 p= 0.005
r= -0.300 p= 0.036
Semantic Fluency
r= -0.264
n.s.
r= -0.172
n.s.
r= -0.135
n.s.
r= -0.286 p= 0.047
r= -0.145
n.s.
Right hippocampus
r= -0.342
p= 0.033
r= -0.223
n.s.
r= -0.431 p= 0.006
r= -0.302
n.s.
r= -0.368 p=0.021
Left hippocampus
r= -0.170
n.s.
r= -0.322 p= 0.46
r= -0.213
n.s.
r= -0.370 p=0.20
r= -0.336 p=0.036

111
DISCUSSION
This study provides a specific pattern of functional network organization in resting state in
those MCI patients who developed dementia. pMCIs showed an increase in functional
connectivity values in the Alpha band between anterior and posterior brain areas, and more
specifically between right anterior cingulate and temporo-occipital areas, mainly of the right
hemisphere.
These results are in agreement on one hand with those obtained by Rossini et al. (2006), since
pMCI patients exhibited an increase in fronto-parietal coherence of the right hemisphere in
several frequency bands when comparing to sMCIs. And on the other hand, with those
described by Bajo et al. (2012), as they found an increased synchronization over temporo-
posterior sensors in alpha and beta 1 bands in pMCI subjects compared to sMCIs. Although
the increase in synchronization observed in MCIs has been usually interpreted as a
compensatory mechanism, the negative correlations found in this study with
neuropsychological performance and brain volume could led us to consider two possible
hypothesis about this hypersynchronization: 1) it could be an unsuccessful compensation: the
right anterior cingulate along with temporal and occipital regions try to assume the functions
of other brain circuits which are more impaired (i.e. involving the posterior cingulate), but in
an inefficient way, or 2) it could be the result of an inhibitory deficit: the loss of gabaergic
synapses caused by the accumulation of AB plaques (Garcia-Marin et al., 2009) leads it to
establish aberrant relationships between areas which start to be affected as the disease
progresses.
Anterior cingulate is a region of the medial-frontal circuit that has been related to conflict
monitoring, decision making and affective behaviour, among other functions (Devinsky,
Morrell, & Vogt, 1995). It has been found a relationship between its alteration in AD patients
and inhibition disabilities, unawareness of deficits and apathy (Amanzio et al., 2011; Mori et
al., 2013). The executive and inhibitory deficits found even in pure amnestic MCI patients may
be also due to the damage of this brain structure (Johns et al., 2012; Kramer et al., 2009). In
addition some MRI, SPECT and PIB-PET studies pointed out that this densely connected region
might be a key during the evolution of AD. Peters et al. (2014) found that one of the best
predictors of conversion from MCI to AD after 2 years was the cortical thinning in the right
anterior cingulated. Johnson et al. (2007) reported an increased perfusion in pMCIs than sMCIs
within 5 years follow up period in rostral anterior cingulated. Recently Okello et al. (Okello et
al., 2009) found that faster converters (average of 1 year, as our patients) showed a higher

112
amyloid deposition in anterior cingulate than slow converters. These findings would be in
agreement with the idea that the hyperactivation observed in this brain region is due to the
loss of inhibitory control, caused by the accumulation of AB (Garcia-Marin et al., 2009).
One of the main finding in AD´s studies is the decrease in synchronization in high frequency
bands, especially in alpha (Berendse et al., 2000; Locatelli et al., 1998), so the
hypersynchronization usually observed in pMCI patients seems to be paradoxical. However,
the synaptic disruption produced in the cholinergic system (Requena, Maestú, Campo,
Fernández, & Ortiz, 2006; Schliebs & Arendt, 2006), and the loss of inhibitory neurons caused
by the accumulation of neuritic plaques (Garcia-Marin et al., 2009) may produce the increase
in synchronization in high oscillations in these patients. The synchronization found in the alpha
band and in the occipital cortex is consistent with eyes closed resting state condition. Occipital
lobe has usually been considered less impaired or not prominently involved until the last
stages of the AD, but there is evidence of amyloid pathology in MCI patients and even in
healthy subjects (McKee et al., 2006; Uhlhaas et al., 2008). Thus our results denote that
occipital lobe appears to be part of a disrupted network which reflects that pMCI patients
present a higher amyloid pathology than sMCI subjects.
In line with previous studies, pMCI patients showed a worse performance in episodic memory,
achieving this ability the higher classification rates (M. Albert, Moss, & Blacker, 2007), but also
in semantic memory and executive functioning. These findings suggest that extra-memory
cognitive impairments may also have a role in the prediction of progression from MCI to AD
(Chapman et al., 2012). In addition, the hypersynchronization exhibited by pMCI patients was
inversely correlated with MMSE scores, Immediate Recall and Semantic Fluency, indicating
that it has a negative effect on memory and general cognitive status of patients.
At structural level, there were no differences in both hippocampal volumes between sMCI and
pMCI patients (Peters et al., 2014), although left hippocampus was slightly smaller in the
pMCIs. These results could explain the differences obtained in verbal memory between both
groups. Although the hippocampal atrophy is one of the anatomical changes that predict the
subsequent conversion to AD (Clifford R Jack et al., 1999) it should be pointed that in AD
patients, functional alterations usually precede structural changes (Small, 2005). In fact, the
increase in synchronization showed by pMCI subjects was negatively related to both
hippocampal volumes, pointing out that this increment reflect higher brain atrophy in one of
the more vulnerable structures of AD. Finally, the higher classification scores obtained in the
hypersynchronized links separately or combined with neuropsychological information suggest

113
that MEG functional network organization is able to detect the functional changes caused by
synaptic disruption that precede the structural ones. This result points out the MEG as a
promising biomarker of synaptic disruption in the prediction of the AD.

114
GENERAL DISCUSSION

115
MAIN FINDINGS
The principal aim of this thesis was to explore the biomagnetic patterns of brain
activity in the intermediate stage between normal aging and the diagnosis of clinically
probable AD, described as Mild cognitive impairment (MCI). For this purpose, a non- invasive
neurophysiological technique was used (MEG) during two cognitive conditions: resting state
and Internally Directed Cognitive State (IDICS). In order to achieve a comprehensive and
complete picture of this clinical entity, MCI patient’s brain activity/connectivity was related to
structural damage (i.e. hippocampal atrophy) and cognitive status in two cross-sectional and
one longitudinal study.
The main findings of this thesis may be summarized in six main points:
1. Healthy controls and MCI patients (a-sd-MCI and a-md-MCI) during resting state
Based on the model proposed by Sperling et al. (2011), our findings would support the
concept of dementia as a continuum and could fit as follows:
Figure 1. A modified model of the continuum of the AD proposed by Sperling (2011). In the preclinical stage (purple), we would find Subjective memory complaints (SMC), among other cases (e.g. asymptomatic individuals with biomarker evidence). In the clinical state (red), cognitive function would decrease progressively until the appearance of the dementia. During this continuum it would be expected that a-sd-MCI (blue) would precede a-md-MCI (orange) to end with AD (red). It should be pointed that not all the cases of the preclinical and clinical stages would develop AD, since there are
subjects who revert to normal state, and others that remain stable.

116
Considering the preclinical stage as a completely asymptomatic period in which there are not
objective deficits by standardized measures, but subjective decline from previous level of
memory functioning could be referred (Vestberg, Passant, & Elfgren, 2009), SMC could
perfectly fit in this phase. It is estimated that between 17% and 57% of elderly people report
them (Ganguli et al. 2004; Jessen et al. 2007; Mitchell 2008a), and that its percentage
increases with age, rising to 43% for those aged 65–74, 51% for those aged 75– 84, and 88%
for those aged 85 and older (Bassett and Folstein, 1993). Although SMC have been related to
depression, anxiety and personality traits (Jonker, Geerlings, & Schmand, 2000; Jorm et al.,
2004), there is a growing evidence which relate them to an increase risk of develop dementia
and also with the presence of biological correlates of early Alzheimer's disease (Rodda,
Dannhauser, Cutinha, Shergill, & Walker, 2009).
SMC are usually present in the following stage, amnestic MCI (Petersen 2004; Mitchell 2008b).
But in this case, there is an objective decline in cognitive functioning that primarily affects
episodic memory (Petersen 2004; Gauthier et al., 2006). According to our results from the
Study I, a-sd-MCI and a-md-MCI could not been considered as two independent entities but
rather as two progressive states, being a-md-MCI a more deteriorate state than the a-sd-MCI
and therefore, closer to AD. Although they did not differed in hippocampal volumes, the a-md-
MCI presented more cognitive areas affected and a “slower” spectra pattern than a-sd-MCI,
being these changes more evident when compared to healthy controls. These findings suggest
that both amnestic subtypes of MCI firstly exhibit memory problems, and then as the disease
progresses, the deterioration become increasingly global, such as in AD.
Regardless the subtype of aMCI, the connectivity results from the Study II would also support
the proposal of dementia as a continuum. Brain is composed by localized but interrelated
specialized areas, whose collaboration is essential to achieve an appropriate cognitive
functioning. When a disruption occurs in these connections, dysfunction appears, producing
the so-called “disconnection syndrome” (Catani & Ffytche, 2005). Therefore, connectivity
measures allow exploring the functional relationships between different brain regions, and
would be suitable to check if MCI could be also considered as a “disconnection syndrome". In
our results, MCI patients exhibited a decrease in high frequency bands (alpha and beta), an
increase in low frequency bands (delta and theta) and a different pattern of synchronization in
gamma band than controls. All these hyper and hypo synchronizations observed in the MCIs,
which affected both interhemispheric and anterior-posterior connections, were associated
with: 1) hippocampal atrophy; 2) a worse performance in memory, attention, language or
executive functioning and 3) a more impaired global cognitive status (i.e. MMSE). These

117
findings suggest that in MCI would be taking place a malfunctioning along with a beginning of
disconnection of the brain networks. Both phenomena would precede the “disconnection
syndrome", concept proposed to explain the AD (Delbeuck et al., 2003), in which a total
disconnection occurs as the disease progresses.
A possible hypothesis to explain the slowing of background activity, along with the loss of
functional connectivity and cognitive alteration in MCI subjects is the cholinergic deficit (Ebert
& Kirch, 1998; Haense et al., 2012). The loss of neurons in the nucleus basalis of Meynert is
related to the decrease of the neurotransmitter acetylcholine (Mufson et al., 2000), which is a
cortical excitatory modulator (Francis, Palmer, Snape, & Wilcock, 1999). This approach relies
on the increment of delta and theta activity and on the decrement of alpha and beta power
(Kikuchi et al., 1999; Osipova et al., 2003; Sannita, Maggi, & Rosadini, 1987); along with a
decrease in coherence in all frequency bands (Sloan, Fenton, & Standage, 1992; Kikuchi, Wada,
Koshino, Nanbu, & Hashimoto, 2000; Osipova et al., 2003) after the administration of
scopolamine (a cholinergic antagonist) in healthy subjects. A recent study conducted by our
group with PLV found similar connectivity results and also architecture of the network in the
alpha band comparable to that of AD under scopolamine´s condition (Stam et al. 2009; Bajo et
al., 2014).
In addition, animal studies described an increase in low frequency coupling and a reduction in
high frequency non- linear coupling as a result of the loss of acetylcholine (Villa et al. 2000).
Moreover, it should also be noted that exists a bidirectional relationship between cholinergic
neurotransmission and amyloid deposition during the disease (see Schliebs & Arendt, 2006 for
a review). All these findings would help to understand, at least partially, the
neuropsychological changes observed in MCI patients.

118
2. Differences in brain connectivity during the performance of a cognitive task between
controls and MCI patients. What does it mean?
Different EEG and MEG studies which used a memory paradigm to investigate how MCI´s
brains works, found an increase in synchronization in all frequency bands analyzed and also a
distinct topography of connectivity between patients and controls (Pijnenburg et al. 2004;
Jiang et al. 2008; Maestú et al. 2008; Bajo et al. 2010; 2011). Results from Study II are in line
with these findings, despite of being a different cognitive task, since the MCI group exhibited a
higher interhemispheric connectivity in delta, theta, beta and gamma bands. However, the
internal nature of the paradigm used in this thesis could be the reason for the discrepancies
obtained in the alpha band.
These rises of interhemispheric connectivity have been usually interpreted as a compensatory
mechanism in order to overcome the inefficiency of the networks which are needed to
performance a specific task. Namely, the recruitment of additional networks is required to
achieve the same performance level than a control group. This explanation could be plausible
for our results, since MCIs and controls executed the task at the same level, but with higher
levels of brain synchronization in MCIs. However, if this compensatory mechanism would be
enough to achieve results as good as control´s, why MCI patients showed worse scores in
neuropsychological tests? And also, why these increases in synchronization were inversely
correlated with all these cognitive measures?
It seems that the increment in connectivity in delta, theta, beta and gamma bands is the way
that MCI patients have to supply the lack of alpha synchronization during the task. And thanks
to this increase, MCI subjects were able to perform the 1-subtraction task as well as controls.
This way of compensation would be focused on the interrelation of the different frequency
bands and would allow the execution of very simple tasks. Nevertheless with the increase of
the difficulty of the task (3-subtraction), this connectivity starts to fall in all these frequency
tasks, without affecting the execution yet. Although more levels of difficulty of the task would
be needed to check if synchronization levels would continue to fall and the execution would
finally be affected, the hypersynchronization observed in the MCI group, could be interpreted
as a failed attempt of compensation (which only allows to execute the simplest tasks, and for
this reason MCIs patients do not achieve the same level of execution in neuropsychological
tests than the controls) or as a characteristic pattern of neuronal hyperexcitability that takes
place during the pathological process of AD (since this excess in connectivity is related to a

119
worse performance in many neuropsychological tests and also to more deteriorated cognitive
state).
3. The increase of task demand in controls and MCI patients
Contrary to our results, previous studies have described higher values of inter and
intrahemispheric coherence in MCIs than in controls with the increase of task difficulty (Jiang
and Zheng 2006; Zheng et al. 2007; Jiang et al. 2008). However, the failure to find differences
in the resting state between both groups in those studies could be an important reason to
explain these discrepancies.
Therefore, we considered that the results obtained in the Study II could be explained with the
model proposed by Reuter-Lorenz & Cappell (2008), the compensation-related utilization of
neural circuits hypothesis (CRUNCH). This theory considers that at the same level of task
demand, old subjects show higher levels of activation than youngers, in order to achieve the
same accuracy. However, when the task load increases, old subjects reach a resource ceiling
before youngers, causing a decrease in their activation levels and subsequently in their
performance.
In our case, controls exhibited mainly higher levels of synchronization under the 3- subtraction
condition in delta band, and higher levels of desynchronization in beta and to a lesser extend
in the gamma band. While other frequency bands remained more or less stable. MCI patients
showed higher levels of synchronization in all frequency bands during the 1- subtraction
condition, except in alpha. Nonetheless, their connectivity values were dismissed during the 3-
subtraction task, although their performance was not significantly different from the controls.
These results point out that not only the activation or synchronization of specific brain areas is
needed to perform a cognitive task. But also the deactivation or hypo synchronization of
others is equally important to perform a task properly, since the suppression of irrelevant
regions allows inhibiting unimportant information or redirect those resources that are really
needed (Wermke, Sorg, Wohlschläger, & Drzezga, 2008).
According to the CRUNCH model, the previous studies and our results, a model of
synchronization during the execution of cognitive tasks could serve to hypothesize what would
happen in the continuum of dementia. In order to explain this model, two schemes focused on
the increase of synchronization have been proposed (for desynchronization the relation would
be opposite): The patterns of synchronization would be represented in the top and the
performance level, at the bottom.

120
Figure 2. A model of synchronization during the execution of cognitive tasks in the continuum of dementia
Under this approach, an increase in synchronization according to the task demand would be
expected in the control group, until reaching their ceiling and their performance would start to
drop. So, the healthy old subjects (in green colour) would be the “ideal” model of
synchronization for dementia. Nevertheless, the MCI group (in blue colour) would start
showing a hypersynchronization with low task demand and when the difficulty slightly
increase, their levels of connectivity would begin to decrease, causing a lower level of
execution. Finally, AD patients (in red colour) would start with lower levels of synchronization
than the other groups, showing at low demand task evident execution problems. Inasmuch as
the difficulty of the task enlarges, AD subjects would show a decrement in connectivity until
they consequentially would not able to perform the task.
121
4. ICICS and the role of alpha band
In Study II, a new conception of cognitive paradigm was applied. Normally, neuroscience
experiments use external stimuli in their experiments to evaluate the cognitive status of the
participants. Besides in normal and pathological aging, cognitive studies are usually focused in
external tasks (Caravaglios, Muscoso, Di Maria, & Costanzo, 2013; Clément & Belleville, 2012; F
Maestú et al., 2008). The concept of “Internally Directed Cognitive State” (IDICS) surged out of
a curiosity to explore how brain works during a purely internal task. Therefore, a cognitive
function which is usually impaired in AD, calculation, was used in an internal way. This task
needs the knowledge about numbers and arithmetic (long term memory), the ability to
manipulate and update the information mentally (working memory), self-monitoring and the
capacity to inhibit the distracting stimuli (executive functioning). Its easy adaptability and
application, along with the interesting information that provides, makes this paradigm a good
candidate to study internal processes in different populations.
Which role plays alpha during IDICS´s execution? It is well known that alpha is suppressed
(desynchronized) during eyes open (Berger, 1929), and during the execution of a variety
cognitive tasks (see Klimesch 2007 for a review). However, in our study, the control group
showed an opposite pattern, that is, an interhemispheric increase in synchronization while
performing the task.
In the early research about the alpha band, its synchronization was considered as a reduction
in information processing (Pfurtscheller, 2001), or even as a “cortical idling” (Pfurtscheller,
Stancák, & Neuper, 1996). However, latest empirical evidence also leads to interpret the alpha
synchronization as an inhibition process (see Klimesch et al. 2007 for a review), since several
studies have found this increment under internally directed attention, working memory and
top-down processing (Benedek et al., 2011; Cooper et al., 2003; Jensen et al., 2002; Sauseng et
al., 2005). This last hypothesis about alpha synchronization may explain the results obtained in
the control group because it seems that an interhemispheric synchronization was necessary to
execute it correctly. In addition, this increase in synchronization could reflect the inhibition of
those brain areas which were not required for the task (Klimesch 2007), allowing the
involvement of the relevant ones, such as the prefrontal areas.
However, in the MCI group the alpha band remained more or less stable during both resting
and task, while other frequency bands exhibited a remarkable change between the two
conditions. These results may suggest that in MCIs the inhibition system is being altered as
consequence of the disease, and other frequency bands try to balance this impairment to deal
with IDICS. The accumulation of amyloid plaques in the brain causes a decrease in GABAergic

122
neurons (Garcia-Marin et al., 2009) producing a hyperactivity of the pyramidal neurons and
therefore, an overall system-wide hiperexcitation. This approach could explain the
hypersynchronization observed in most of the frequency bands in MCI patients and the lack of
synchronization in alpha, which may reflects the process of inhibitory control that is needed to
performance an internal cognitive task such as IDICS.
5. Conversion from MCI to AD
Study III is the first longitudinal investigation of synchronization brain patterns in source space
in MCI patients. It should be pointed that the average of progression of our sample is
approximately of one year, so pMCIs may be considered as “faster” converters. The exhaustive
cognitive examination that our MCI patients underwent in the three studies, has provide
evidences about the importance of the impairment in other cognitive domains beyond
episodic memory to predict which MCI patients will finally develop AD. On the other hand, as
in Study I, there were no differences in hippocampal atrophy between subtypes of MCI (in this
case between pMCI and sMCI patients), but in neurophysiological patterns. These findings
demonstrate that neurophysiological information is very useful to detect functional changes
that often precede structural changes making it an essential tool in the study of
neurodegenerative diseases, such as AD.
Previous connectivity EEG/MEG studies in the sensor space found and increase of connectivity
in pMCIs mainly in high frequency bands (Rossini et al., 2008; Bajo et al., 2012), which is
consistent with our results. As in most resting state studies there is a decrease in
synchronization in alpha and beta bands in AD and also in MCI patients (see Study II),
compared to controls, these results seem to be contradictory. However, if we consider the AD
as a dynamic process and the hypothesis about the loss of inhibitory synapses due to the
presence of amyloid plaques (García- Marin et al., 2009), the hypersynchronization observed in
our pMCIs may be explained by an increment of accumulation of AB plaques in anterior
cingulate and temporo-occipital cortex. If we would compare our sMCI patients with slow
converters (i.e. 5 years), we surely would get a different pattern of synchronization depending
on the areas that would be most pathologically affected in those patients. Therefore, as the
disease progresses, the hyperexcitability of the pyramidal neurons would lead to neuronal
death causing the desynchronization observed in more advance stages of the AD.
Besides, the increase in synchronization observed in pMCI was inversely correlated to
hippocampal volumes and neuropsychological performance, suggesting that it is a

123
manifestation of a pathological status. In Study II also the changes observed in synchronization
in the MCI group would fit with this interpretation instead of with the compensatory
hypothesis. It would be interesting to explore the connectivity patterns of the pMCI patients
while performing the IDICS task to get a better understanding about how the disease disrupt
the brain integrity of those that finally convert to AD.
6. The role of MEG in AD research
The early detection of AD is one of the biggest concerns of clinical practice and research field
because provides clarity to patients and caregivers, allowing a planning of their future; and
allows the immediate beginning of pharmacological and cognitive therapies that may help to
slow down the progression of the disease.
The new diagnosis criteria proposed by Dubois is based on clinical and biological evidence
(MRI, PET or CSF). However, the neurophysiological information supplied by EEG or MEG have
not been already considered as a biomarker. It should be pointed that existing biomarkers
reflects the pathological but not necessarily the clinical state of the patients (Shaw et al.,
2009), since organic alterations usually start some years before the onset of symptoms
(Aizenstein et al., 2009).
MEG is a non-invasive technique that measures the neuronal activity directly, whose easy and
relative fast application helps to be a “patient friendly” technique. Besides it can be repeated
as often as necessary, making it an appropriate tool for monitoring the progress of the
patients.
The use of this technique in the AD research have reported additional data for both diagnosis
and prognosis of MCI and AD patients, since it provides information about synaptic disruption,
which is a key feature in this disease (Zamrini et al., 2011). Our results would support this
proposal, as it has provided relevant knowledge about the differences in brain
activity/connectivity patterns that exist between MCI patients and healthy controls in both
resting and cognitive states, and also about those MCI subjects who finally developed AD.
Furthermore, its relationship with neuropsychological and anatomical evidence along with its
ability to detect functional changes that precedes the structural ones (Small, 2005) indicates
that MEG seems to have a clinical potential. Lastly, the chance to choice different types of
analysis of the MEG data and the evidence that MCI-related studies show similar results
indicate the necessity and utility of using complementary information to improve the
understanding of the problem. The methodological approach would depend on the hypothesis

124
and the main issues that the researchers try to answer, and nowadays its fast development
indicates the versatility that MEG data may provide.
Future research should focus on combining the MEG signal with the information obtained from
different techniques in order to check and validate its diagnostic and predictive capacity, to be
considered as a biomarker in the EA criteria.

125
CONCLUSIONS

126
Study I
- Both aMCI subtypes showed a slowing of the background activity in comparison to
healthy controls, which was related to a lower hippocampal volume and a worse
cognitive status.
- The spectral pattern of a-md-MCI patients, compared to the a-sd-MCI´s one, seemed
to be closer to the typical AD profile, and was also associated with a more severe
cognitive deterioration.
Study II
- In resting state, the MCI group exhibited a desynchronization in high frequency bands
and a hypersynchronization in low frequency bands compared with the control group.
Besides, this pattern was correlated with higher hippocampal atrophy and cognitive
deficits.
- During the execution of the IDICS task, MCI patients showed higher synchronization
values in all frequency bands except on alpha band, which were associated with lower
scores in neuropsychological test and hippocampal volume. These results suggested
MCI subjects may present an inhibition problem.
- The CRUNCH model could explain the changes in synchronization caused by the
difficulty of the task.
Study III
- pMCIs showed higher synchronization in alpha band between right anterior cingulate
and occipital and temporal areas, especially from the right hemisphere, than sMCIs.
- This increase was inversely correlated with the performance in several cognitive
domains, suggesting that is the result of an aberrant effect caused by the pathology.

127
FUTURE DIRECTIONS

128
From a clinical point of view, it would be interesting studying amnestic subtypes
performing the IDCIS task, in order to verify if there would be differences between them and
also to examine if a-md-MCI patients would show lower levels of synchronization than a-sd-
MCI group, as AD patients. Besides, the comparison of IDICS with a young group would help to
understand how brain works without external stimuli and how the disease disrupts its
functioning. The exploration of the DMN, which is one of the brain networks damaged in AD,
during the execution of IDICS would bring us a better understanding of the nature of this
network while performing an internal task. More MEG studies with different task load in
normal and pathological aging would be needed to verify the synchronization´s model
proposed in the continuum of dementia. New approaches based on neuropsychological
profiles instead of the diagnosis would be relevant to explore how the cognitive status changes
the brain neurophysiological patterns. Furthermore, the study of the resting state as a dynamic
process would allow us to characterize the brain activity over time and probably to make more
accurate comparisons between patients and healthy elderly subjects. In addition, the
combination of MEG and MRI, PET and CSF data may provide relevant evidence about the
changes produced by the disease, and therefore MEG could be considered as a
neurophysiological biomarker in a near future. To look into the evolution of the disease over
time, different MEG recording of the same subjects should be compared and different
variables such as genetics, cognitive reserve or gender should be explored. Moreover, the
study of the effects of pharmaceutical and cognitive therapies would help to plan the future of
the patients and their caregivers. Finally, healthy subjects with relatives with AD, biological risk
or with SMC should be the next population to examine since their study would provide
relevant clues about dementia.
From a methodological perspective, it would be interesting to analyze the MEG signal
from the sensor space (Studies I and II) to the source location (Study III) with the aim to obtain
more accurate information about the brain areas which would be involved. New approaches as
graph theory may be applied both to resting and IDICS to explore the architecture of the
functional networks and therefore, to better understanding of the MCI as a disconnection
syndrome. Moreover, it would be necessary to examine the interaction among the different
frequency bands to figure out how the disease alter this communication and cross frequency
coupling could be a good tool to achieve it. Further studies should compare the different
methodologies which are appearing in the literature in order to validate their reliability and
thus, their robustness.

129
From a conceptual viewpoint, diagnosis criteria and etiological origin of the disease has
been changing depending on the development of the neuroimaging and medical techniques.
We are living a technological revolution which is modifying our way to understand AD. New
hypothesis are emerging and demonstrating the complexity of this disorder, and therefore it is
essential to integrate information which comes from different levels of analysis to propose an
increasingly appropriate model of AD. For all these reasons, to advance it is necessary to be
abreast of recent research and be able to adapt to the new proposals which are coming out in
the study of AD.

130
REFERENCES

131
Agrell, B., & Dehlin, O. (1998). The clock-drawing test. Age and Ageing, 27(3), 399–403. doi:10.1093/ageing/27.3.399
Aizenstein, H. J., Nebes, R. D., Saxton, J. A., Price, J. C., Mathis, C. A., Tsopelas, N. D., … Klunk, W. E. (2009). Frecuent amiloyd deposition without significant cognitive Impairment Among the Elderly, 65(11), 1509–1517. doi:10.1001/archneur.65.11.1509.Frequent
Albert M, Blacker D, Moss MB, Tanzi R, M. J. (2007). Longitudinal change in cognitive performance among individuals with mild cognitive impairment. Neuropsychology, 21(2), 158–69. Retrieved from http://www.ncbi.nlm.nih.gov/pubmed/17402816
Albert, M. S., DeKosky, S. T., Dickson, D., Dubois, B., Feldman, H. H., Fox, N. C., … Phelps, C. H. (2011). The diagnosis of mild cognitive impairment due to Alzheimer’s disease: recommendations from the National Institute on Aging-Alzheimer's Association workgroups on diagnostic guidelines for Alzheimer's disease. Alzheimer’s & Dementia : The Journal of the Alzheimer's Association, 7(3), 270–9. doi:10.1016/j.jalz.2011.03.008
Alzheimer, A. (1907). Uber eine eigenartige Erkrankung der Hirnrinde. Allg Zeitschr Psychiatr, 64, 146–148.
Amanzio, M., Torta, D. M. E., Sacco, K., Cauda, F., D’Agata, F., Duca, S., … Geminiani, G. C. (2011). Unawareness of deficits in Alzheimer’s disease: role of the cingulate cortex. Brain : A Journal of Neurology, 134(Pt 4), 1061–76. doi:10.1093/brain/awr020
Andrews-Hanna, J. R., Reidler, J. S., Huang, C., & Buckner, R. L. (2010). Evidence for the default network’s role in spontaneous cognition. Journal of Neurophysiology, 104(1), 322–35. doi:10.1152/jn.00830.2009
Andrews-Hanna, J. R. (2012). The brain’s default network and its adaptive role in internal mentation. The Neuroscientist : A Review Journal Bringing Neurobiology, Neurology and Psychiatry, 18(3), 251–70. doi:10.1177/1073858411403316
Andrews-hanna, J. R., Snyder, A. Z., Vincent, J. L., Lustig, C., Head, D., Raichle, M. E., & Buckner, R. L. (2009). Disruption of large-scale brain systems in advanced aging. Neuron, 56(5), 924–935. doi:10.1016/j.neuron.2007.10.038.Disruption
Ashburner, J. (2007). A fast diffeomorphic image registration algorithm. NeuroImage, 38(1), 95–113. doi:10.1016/j.neuroimage.2007.07.007
Auer, S., & Reisberg, B. (1997). The GDS/FAST staging system. International Psychogeriatrics / IPA, 9 Suppl 1, 167–71. Retrieved from http://www.ncbi.nlm.nih.gov/pubmed/9447440
Aurtenetxe, S., Castellanos, N. P., Moratti, S., Bajo, R., Gil, P., Beitia, G., … Maestú, F. (2013). Dysfunctional and compensatory duality in mild cognitive impairment during a continuous recognition memory task. International Journal of Psychophysiology : Official Journal of the International Organization of Psychophysiology, 87(1), 95–102. doi:10.1016/j.ijpsycho.2012.11.008
Babiloni, C., Binetti, G., Cassetta, E., Cerboneschi, D., Dal Forno, G., Del Percio, C., … Rossini, P. M. (2004). Mapping distributed sources of cortical rhythms in mild Alzheimer’s disease. A

132
multicentric EEG study. NeuroImage, 22(1), 57–67. doi:10.1016/j.neuroimage.2003.09.028
Babiloni, C., Benussi, L., Binetti, G., Cassetta, E., Dal Forno, G., Del Percio, C., … Rossini, P. M. (2006a). Apolipoprotein E and alpha brain rhythms in mild cognitive impairment: a multicentric electroencephalogram study. Annals of Neurology, 59(2), 323–34. doi:10.1002/ana.20724
Babiloni, C., Binetti, G., Cassarino, A., Dal Forno, G., Del Percio, C., Ferreri, F., … Rossini, P. M. (2006b). Sources of cortical rhythms in adults during physiological aging: a multicentric EEG study. Human Brain Mapping, 27(2), 162–72. doi:10.1002/hbm.20175
Babiloni, C., Frisoni, G., Steriade, M., Bresciani, L., Binetti, G., Del Percio, C., … Rossini, P. M. (2006c). Frontal white matter volume and delta EEG sources negatively correlate in awake subjects with mild cognitive impairment and Alzheimer’s disease. Clinical Neurophysiology : Official Journal of the International Federation of Clinical Neurophysiology, 117(5), 1113–29. doi:10.1016/j.clinph.2006.01.020
Babiloni, C., Ferri, R., Binetti, G., Cassarino, A., Dal Forno, G., Ercolani, M., … Rossini, P. M. (2006d). Fronto-parietal coupling of brain rhythms in mild cognitive impairment: a multicentric EEG study. Brain Research Bulletin, 69(1), 63–73. doi:10.1016/j.brainresbull.2005.10.013
Babiloni, C., Frisoni, G. B., Pievani, M., Vecchio, F., Lizio, R., Buttiglione, M., … Rossini, P. M. (2009). Hippocampal volume and cortical sources of EEG alpha rhythms in mild cognitive impairment and Alzheimer disease. NeuroImage, 44(1), 123–35. doi:10.1016/j.neuroimage.2008.08.005
Babiloni, C., Visser, P. J., Frisoni, G., De Deyn, P. P., Bresciani, L., Jelic, V., … Nobili, F. (2010). Cortical sources of resting EEG rhythms in mild cognitive impairment and subjective memory complaint. Neurobiology of Aging, 31(10), 1787–98. doi:10.1016/j.neurobiolaging.2008.09.020
Bajo, R., Maestú, F., Nevado, A., Sancho, M., Gutiérrez, R., Campo, P., … Del-Pozo, F. (2010). Functional connectivity in mild cognitive impairment during a memory task: implications for the disconnection hypothesis. Journal of Alzheimer’s Disease : JAD, 22(1), 183–93. doi:10.3233/JAD-2010-100177
Bajo, R., Castellanos, N. P., López, M. E., Ruiz, J. M., Montejo, P., Montenegro, M., … Maestu, F. (2011). Early dysfunction of functional connectivity in healthy elderly with subjective memory complaints. Age (Dordrecht, Netherlands), 34(2), 497–506. doi:10.1007/s11357-011-9241-5
Bajo, R., Castellanos, N. P., Cuesta, P., Aurtenetxe, S., Garcia-Prieto, J., Gil-Gregorio, P., … Maestu, F. (2012). Differential patterns of connectivity in progressive mild cognitive impairment. Brain Connectivity, 2(1), 21–4. doi:10.1089/brain.2011.0069
Bassett, S. S., & Folstein, M. F. (n.d.). Memory complaint, memory performance, and psychiatric diagnosis: a community study. Journal of Geriatric Psychiatry and Neurology, 6(2), 105–11. Retrieved from http://www.ncbi.nlm.nih.gov/pubmed/8512626

133
Benedek, M., Bergner, S., Könen, T., Fink, A., & Neubauer, A. C. (2011). EEG alpha synchronization is related to top-down processing in convergent and divergent thinking. Neuropsychologia, 49(12), 3505–11. doi:10.1016/j.neuropsychologia.2011.09.004
Benjamini, Y., & Hochberg, Y. (1995). Controlling the False Discovery Rate: A Practical and Powerful Approach to Multiple Testing. Journal of the Royal Statistical Society. Series B (Methodological), 57, 289 – 300. doi:10.2307/2346101
Benton, A., & Hamsher, K. (1989). Multilingual Aplasia Examination. (T. U. of I. Department of Neurology and Psychology, Ed.) (2nd ed.).
Berendse, H. ., Verbunt, J. P. ., Scheltens, P., van Dijk, B. ., & Jonkman, E. . (2000). Magnetoencephalographic analysis of cortical activity in Alzheimer’s disease: a pilot study. Clinical Neurophysiology, 111(4), 604–612. doi:10.1016/S1388-2457(99)00309-0
Blennow, K., de Leon, M. J., & Zetterberg, H. (2006). Alzheimer’s disease. Lancet, 368(9533), 387–403. doi:10.1016/S0140-6736(06)69113-7
Braak, H., & Braak, E. (1991). Neuropathological stageing of Alzheimer-related changes. Acta Neuropathologica, 82(4), 239–59. Retrieved from http://www.ncbi.nlm.nih.gov/pubmed/1759558
Brodaty, H., Heffernan, M., Kochan, N. a, Draper, B., Trollor, J. N., Reppermund, S., … Sachdev, P. S. (2012). Mild cognitive impairment in a community sample: the Sydney Memory and Ageing Study. Alzheimer’s & Dementia : The Journal of the Alzheimer's Association, 9(3), 310–317.e1. doi:10.1016/j.jalz.2011.11.010
Broyd, S. J., Demanuele, C., Debener, S., Helps, S. K., James, C. J., & Sonuga-Barke, E. J. S. (2009). Default-mode brain dysfunction in mental disorders: a systematic review. Neuroscience and Biobehavioral Reviews, 33(3), 279–96. doi:10.1016/j.neubiorev.2008.09.002
Buchan, R. J., Nagata, K., Yokoyama, E., Langman, P., Yuya, H., Hirata, Y., … Kanno, I. (1997). Regional correlations between the EEG and oxygen metabolism in dementia of Alzheimer’s type. Electroencephalography and Clinical Neurophysiology, 103(3), 409–17. Retrieved from http://www.ncbi.nlm.nih.gov/pubmed/9305290
Buckner, R. L., Snyder, A. Z., Shannon, B. J., LaRossa, G., Sachs, R., Fotenos, A. F., … Mintun, M. a. (2005). Molecular, structural, and functional characterization of Alzheimer’s disease: evidence for a relationship between default activity, amyloid, and memory. The Journal of Neuroscience : The Official Journal of the Society for Neuroscience, 25(34), 7709–17. doi:10.1523/JNEUROSCI.2177-05.2005
Buckner, R. L., Andrews-Hanna, J. R., & Schacter, D. L. (2008). The brain’s default network: anatomy, function, and relevance to disease. Annals of the New York Academy of Sciences, 1124, 1–38. doi:10.1196/annals.1440.011
Buzsáki, G. (2006). Rhythms of the Brain. Oxford University Press. doi:10.1093/acprof:oso/9780195301069.001.0001

134
Caffarra, P., Ghetti, C., Concari, L., & Venneri, A. (2008). Differential patterns of hypoperfusion in subtypes of mild cognitive impairment. The Open Neuroimaging Journal, 2, 20–8. doi:10.2174/1874440000802010020
Callard, F., Smallwood, J., & Margulies, D. S. (2012). Default Positions: How Neuroscience’s Historical Legacy has Hampered Investigation of the Resting Mind. Frontiers in Psychology, 3(September), 321. doi:10.3389/fpsyg.2012.00321
Caravaglios, G., Muscoso, E. G., Di Maria, G., & Costanzo, E. (2013). Theta responses are abnormal in mild cognitive impairment: evidence from analysis of theta event-related synchronization during a temporal expectancy task. Journal of Neural Transmission (Vienna, Austria : 1996), 120(7), 1093–107. doi:10.1007/s00702-012-0921-9
Catani, M., & Ffytche, D. H. (2005). The rises and falls of disconnection syndromes. Brain : A Journal of Neurology, 128(Pt 10), 2224–39. doi:10.1093/brain/awh622
Catricala, S., Torti, M., & Ricevuti, G. (2012). Alzheimer disease and platelets: how’s that relevant. Immunity & Ageing : I & A, 9(1), 20. doi:10.1186/1742-4933-9-20
Chapman, R. M., Mapstone, M., Mccrary, J. W., Gardner, M. N., Porsteinsson, A., Sandoval, T. C., & Reilly, L. A. (2012). Predicting conversion from Mild cognitive impairment to Alzheimer´s Disease using neuropsychological test and multivariate methods. J Clin Exp Neuropsychology, 33(2), 187–199. doi:10.1080/13803395.2010.499356.Predicting
Chen P, Ratcliff G, Belle SH, Cauley JA, DeKosky ST, G. M. (2000). Cognitive tests that best discriminate between presymptomatic AD and those who remain nondemented. Neurology, 55(12), 1847–53. Retrieved from http://www.ncbi.nlm.nih.gov/pubmed/?term=Chen+P,+Ratcliff+G,+Belle+SH,+Cauley+JA,+DeKosky+ST,+Ganguli+M.+Cognitive+tests+that+best+discriminate+between+presymptomatic+AD+and+those+who+remain+nondemented.+Neurology+2000;+55:+1847–53
Chiang, A. K. I., Rennie, C. J., Robinson, P. A., van Albada, S. J., & Kerr, C. C. (2011). Age trends and sex differences of alpha rhythms including split alpha peaks. Clinical Neurophysiology : Official Journal of the International Federation of Clinical Neurophysiology, 122(8), 1505–17. doi:10.1016/j.clinph.2011.01.040
Cirrito, J. R., Kang, J.-E., Lee, J., Stewart, F. R., Verges, D. K., Silverio, L. M., … Holtzman, D. M. (2008). Endocytosis is required for synaptic activity-dependent release of amyloid-beta in vivo. Neuron, 58(1), 42–51. doi:10.1016/j.neuron.2008.02.003
Claus, J. J., Kwa, V. I., Teunisse, S., Walstra, G. J., van Gool, W. A., Koelman, J. H., … Ongerboer de Visser, B. W. (1998). Slowing on quantitative spectral EEG is a marker for rate of subsequent cognitive and functional decline in early Alzheimer disease. Alzheimer Disease and Associated Disorders, 12(3), 167–74. Retrieved from http://www.ncbi.nlm.nih.gov/pubmed/9772019
Clément, F., & Belleville, S. (2012). Effect of disease severity on neural compensation of item and associative recognition in mild cognitive impairment. Journal of Alzheimer’s Disease : JAD, 29(1), 109–23. doi:10.3233/JAD-2012-110426

135
Coben, L. A., Danziger, W., & Storandt, M. (1985). A longitudinal EEG study of mild senile dementia of Alzheimer type: changes at 1 year and at 2.5 years. Electroencephalography and Clinical Neurophysiology, 61(2), 101–12. Retrieved from http://www.ncbi.nlm.nih.gov/pubmed/2410219
Cohen, D. (1972). Magnetoencephalography: detection of the brain’s electrical activity with a superconducting magnetometer. Science (New York, N.Y.), 175(4022), 664–6. Retrieved from http://www.ncbi.nlm.nih.gov/pubmed/5009769
Collignon, A., & Maes, F. (1995). Automated multi-modality image registration based on information theory. Proc. Information Processing in Medical Imaging, 263–274.
Cooper, N. R., Croft, R. J., Dominey, S. J. J., Burgess, A. P., & Gruzelier, J. H. (2003). Paradox lost? Exploring the role of alpha oscillations during externally vs. internally directed attention and the implications for idling and inhibition hypotheses. International Journal of Psychophysiology : Official Journal of the International Organization of Psychophysiology, 47(1), 65–74. Retrieved from http://www.ncbi.nlm.nih.gov/pubmed/12543447
Corey-Bloom, J. (2002). The ABC of Alzheimer’s disease: cognitive changes and their management in Alzheimer's disease and related dementias. International Psychogeriatrics / IPA, 14 Suppl 1, 51–75. Retrieved from http://www.ncbi.nlm.nih.gov/pubmed/12636180
Csicsvari, J., Jamieson, B., Wise, K. D., & Buzsáki, G. (2003). Mechanisms of gamma oscillations in the hippocampus of the behaving rat. Neuron, 37(2), 311–22. Retrieved from http://www.ncbi.nlm.nih.gov/pubmed/12546825
Cummings, J. L. (2004). Alzheimer’s Disease, 56–67.
Daffertshofer, A., & van Wijk, B. C. M. (2011). On the Influence of Amplitude on the Connectivity between Phases. Frontiers in Neuroinformatics, 5(July), 6. doi:10.3389/fninf.2011.00006
Dauwels, J., Srinivasan, K., Ramasubba Reddy, M., Musha, T., Vialatte, F.-B., Latchoumane, C., … Cichocki, A. (2011). Slowing and Loss of Complexity in Alzheimer’s EEG: Two Sides of the Same Coin? International Journal of Alzheimer’s Disease, 2011, 539621. doi:10.4061/2011/539621
De Haan, W., Mott, K., van Straaten, E. C. W., Scheltens, P., & Stam, C. J. (2012). Activity dependent degeneration explains hub vulnerability in Alzheimer’s disease. PLoS Computational Biology, 8(8), e1002582. doi:10.1371/journal.pcbi.1002582
Dehaene, S., Molko, N., Cohen, L., & Wilson, A. J. (2004). Arithmetic and the brain. Current Opinion in Neurobiology, 14(2), 218–24. doi:10.1016/j.conb.2004.03.008
Delbeuck, X., Van der Linden, M., & Collette, F. (2003). Alzheimer’s disease as a disconnection syndrome? Neuropsychology Review, 13(2), 79–92. Retrieved from http://www.ncbi.nlm.nih.gov/pubmed/12887040

136
deToledo-Morrell, L., Stoub, T. R., Bulgakova, M., Wilson, R. S., Bennett, D. A., Leurgans, S., … Turner, D. A. (2004). MRI-derived entorhinal volume is a good predictor of conversion from MCI to AD. Neurobiology of Aging, 25(9), 1197–203. doi:10.1016/j.neurobiolaging.2003.12.007
Devanand, D. P., Pradhaban, G., Liu, X., Khandji, A., De Santi, S., Segal, S., … de Leon, M. J. (2007). Hippocampal and entorhinal atrophy in mild cognitive impairment: prediction of Alzheimer disease. Neurology, 68(11), 828–36. doi:10.1212/01.wnl.0000256697.20968.d7
Devinsky, O., Morrell, M. J., & Vogt, B. A. (1995). Contributions of anterior cingulate cortex to behaviour. Brain : A Journal of Neurology, 118 ( Pt 1, 279–306. Retrieved from http://www.ncbi.nlm.nih.gov/pubmed/7895011
Dickerson, B. C., Salat, D. H., Greve, D. N., Chua, E. F., Rand-Giovannetti, E., Rentz, D. M., … Sperling, R. A. (2005). Increased hippocampal activation in mild cognitive impairment compared to normal aging and AD. Neurology, 65(3), 404–11. doi:10.1212/01.wnl.0000171450.97464.49
Dierks, T., Ihl, R., Frölich, L., & Maurer, K. (1993). Dementia of the Alzheimer type: effects on the spontaneous EEG described by dipole sources. Psychiatry Research, 50(3), 151–62. Retrieved from http://www.ncbi.nlm.nih.gov/pubmed/8272451
Dimitriadis, S. I., Laskaris, N. a, Tsirka, V., Vourkas, M., & Micheloyannis, S. (2010). What does delta band tell us about cognitive processes: a mental calculation study. Neuroscience Letters, 483(1), 11–5. doi:10.1016/j.neulet.2010.07.034
Diniz, B. S., Nunes, P. V., Yassuda, M. S., & Forlenza, O. V. (2009). Diagnosis of mild cognitive impairment revisited after one year. Preliminary results of a prospective study. Dementia and Geriatric Cognitive Disorders, 27(3), 224–31. doi:10.1159/000203346
Drzezga, A., Lautenschlager, N., Siebner, H., Riemenschneider, M., Willoch, F., Minoshima, S., … Kurz, A. (2003). Cerebral metabolic changes accompanying conversion of mild cognitive impairment into Alzheimer’s disease: a PET follow-up study. European Journal of Nuclear Medicine and Molecular Imaging, 30(8), 1104–13. doi:10.1007/s00259-003-1194-1
Dubois, B., Feldman, H. H., Jacova, C., Dekosky, S. T., Barberger-Gateau, P., Cummings, J., … Scheltens, P. (2007). Research criteria for the diagnosis of Alzheimer’s disease: revising the NINCDS-ADRDA criteria. Lancet Neurology, 6(8), 734–46. doi:10.1016/S1474-4422(07)70178-3
Dubois, B., Feldman, H. H., Jacova, C., Cummings, J. L., Dekosky, S. T., Barberger-Gateau, P., … Scheltens, P. (2010). Revising the definition of Alzheimer’s disease: a new lexicon. Lancet Neurology, 9(11), 1118–27. doi:10.1016/S1474-4422(10)70223-4
Dustman, R. E., Shearer, D. E., & Emmerson, R. Y. (1993). EEG and event-related potentials in normal aging. Progress in Neurobiology, 41(3), 369–401. Retrieved from http://www.ncbi.nlm.nih.gov/pubmed/8210412
Ebert, U., & Kirch, W. (1998). Scopolamine model of dementia: electroencephalogram findings and cognitive performance. European Journal of Clinical Investigation, 28(11), 944–9. Retrieved from http://www.ncbi.nlm.nih.gov/pubmed/9824440

137
Ernst, M. D. (2004). Permutation Methods: A Basis for Exact Inference. Statistical Science, 19(4), 676–685. doi:10.1214/088342304000000396
Ewers, M., Walsh, C., Trojanowski, J. Q., Shaw, L. M., Petersen, R. C., Jack, C. R., … Hampel, H. (2012). Prediction of conversion from mild cognitive impairment to Alzheimer’s disease dementia based upon biomarkers and neuropsychological test performance. Neurobiol Aging, 33(7), 1203–1214. doi:10.1016/j.neurobiolaging.2010.10.019.Ewers
Farias, S., Mungas, D., & Jagust, W. (2005). Degree of discrepancy between self and other-reported everyday functioning by cognitive status: dementia, mild cognitive impairment, and healthy elders. Journal of Alzheimer’s Disease : JAD, 9(20), 827–834. doi:10.3233/JAD-2010-1255.Use
Fernandez, A., Maestu, F., Amo, C., Gil, P., Fehr, T., Wienbruch, C., … Elbert, T. (2002). Focal Temporoparietal Slow Activity in Alzheimer ’ s Disease Revealed by Magnetoencephalography. Biol Psychiatry, 764– 770.
Fernández, A., Arrazola, J., Maestú, F., Amo, C., Gil-Gregorio, P., Wienbruch, C., & Ortiz, T. (2003). Correlations of hippocampal atrophy and focal low-frequency magnetic activity in Alzheimer disease: volumetric MR imaging-magnetoencephalographic study. AJNR. American Journal of Neuroradiology, 24(3), 481–7. Retrieved from http://www.ncbi.nlm.nih.gov/pubmed/12637301
Fernández, A., Hornero, R., Mayo, A., Poza, J., Gil-Gregorio, P., & Ortiz, T. (2006a). MEG spectral profile in Alzheimer’s disease and mild cognitive impairment. Clinical Neurophysiology : Official Journal of the International Federation of Clinical Neurophysiology, 117(2), 306–14. doi:10.1016/j.clinph.2005.10.017
Fernandez, A., & Hornero, R. (2006b). Quantitative Magnetoencephalography of Spontaneous Brain Activity in Alzheimer Disease. Alzheimer Disease and Associated Disorders, 20(3), 153–159.
Fernández, A., Turrero, A., Zuluaga, P., Gil, P., Maestú, F., Campo, P., & Ortiz, T. (2006c). Magnetoencephalographic Parietal delta Dipole Density in Mild Cognitive Impairment. Archives of Neurology, 63.
Fernández, A., Turrero, A., Zuluaga, P., Gil-Gregorio, P., del Pozo, F., Maestu, F., & Moratti, S. (2013). MEG delta mapping along the healthy aging-Alzheimer’s disease continuum: diagnostic implications. Journal of Alzheimer’s Disease : JAD, 35(3), 495–507. doi:10.3233/JAD-121912
Fischl, B., Salat, D. H., Busa, E., Albert, M., Dieterich, M., Haselgrove, C., … Dale, A. M. (2002). Whole brain segmentation: automated labeling of neuroanatomical structures in the human brain. Neuron, 33(3), 341–55. Retrieved from http://www.ncbi.nlm.nih.gov/pubmed/11832223
Fletcher, L. C., Burke, K. E., Caine, P. L., Rinne, N. L., Braniff, C. A., Davis, H. R., … Packer, C. (2013). Diagnosing Alzheimer ’ s disease : are we any nearer to useful biomarker-based , non-invasive tests ? GMS Health Technology Assessment, 9, 1–7.

138
Folstein, M. F., Folstein, S. E., & McHugh, P. R. (1975). “Mini-mental state”. A practical method for grading the cognitive state of patients for the clinician. Journal of Psychiatric Research, 12(3), 189–98. Retrieved from http://www.ncbi.nlm.nih.gov/pubmed/1202204
Forsberg, A., Engler, H., Almkvist, O., Blomquist, G., Hagman, G., Wall, A., … Nordberg, A. (2008). PET imaging of amyloid deposition in patients with mild cognitive impairment. Neurobiology of Aging, 29(10), 1456–65. doi:10.1016/j.neurobiolaging.2007.03.029
Fouquet, M., Desgranges, B., Landeau, B., Duchesnay, E., Mézenge, F., de la Sayette, V., … Chételat, G. (2009). Longitudinal brain metabolic changes from amnestic mild cognitive impairment to Alzheimer’s disease. Brain : A Journal of Neurology, 132(Pt 8), 2058–67. doi:10.1093/brain/awp132
Fox, M. D., Snyder, A. Z., Vincent, J. L., Corbetta, M., Van Essen, D. C., & Raichle, M. E. (2005). The human brain is intrinsically organized into dynamic, anticorrelated functional networks. Proceedings of the National Academy of Sciences of the United States of America, 102(27), 9673–8. doi:10.1073/pnas.0504136102
Francis, P. T., Palmer, a. M., Snape, M., & Wilcock, G. K. (1999). The cholinergic hypothesis of Alzheimer’s disease: a review of progress. Journal of Neurology, Neurosurgery & Psychiatry, 66(2), 137–147. doi:10.1136/jnnp.66.2.137
Frisch, S., Dukart, J., Vogt, B., Horstmann, A., Becker, G., Villringer, A., … Schroeter, M. L. (2013). Dissociating memory networks in early Alzheimer’s disease and frontotemporal lobar degeneration - a combined study of hypometabolism and atrophy. PloS One, 8(2), e55251. doi:10.1371/journal.pone.0055251
Friston, K. J. (2001). Brain function, nonlinear coupling, and neuronal transients. The Neuroscientist : A Review Journal Bringing Neurobiology, Neurology and Psychiatry, 7(5), 406–18. Retrieved from http://www.ncbi.nlm.nih.gov/pubmed/11597100
Fujie, S., Namiki, C., Nishi, H., Yamada, M., Miyata, J., Sakata, D., … Murai, T. (2008). The role of the uncinate fasciculus in memory and emotional recognition in amnestic mild cognitive impairment. Dementia and Geriatric Cognitive Disorders, 26(5), 432–9. doi:10.1159/000165381
Ganguli, M., Dodge, H. H., Shen, C., & DeKosky, S. T. (2004). Mild cognitive impairment, amnestic type: an epidemiologic study. Neurology, 63(1), 115–21. Retrieved from http://www.ncbi.nlm.nih.gov/pubmed/15249620
Garcia-Marin, V., Blazquez-Llorca, L., Rodriguez, J.-R., Boluda, S., Muntane, G., Ferrer, I., & Defelipe, J. (2009). Diminished perisomatic GABAergic terminals on cortical neurons adjacent to amyloid plaques. Frontiers in Neuroanatomy, 3(November), 28. doi:10.3389/neuro.05.028.2009
Gauthier, S., Reisberg, B., Zaudig, M., Petersen, R. C., Ritchie, K., Broich, K., … Winblad, B. (2006). Mild cognitive impairment. Lancet, (367), 1262–1270.
Gevins, a, Smith, M. E., McEvoy, L., & Yu, D. (1997). High-resolution EEG mapping of cortical activation related to working memory: effects of task difficulty, type of processing, and

139
practice. Cerebral Cortex, 7(4), 374–85. Retrieved from http://www.ncbi.nlm.nih.gov/pubmed/9177767
Giannitrapani, D. (1971). Scanning mechanisms and the EEG. Electroencephalography and Clinical Neurophysiology, 30(2), 139–46. Retrieved from http://www.ncbi.nlm.nih.gov/pubmed/4100249
Gianotti, L. R. R., Künig, G., Lehmann, D., Faber, P. L., Pascual-Marqui, R. D., Kochi, K., & Schreiter-Gasser, U. (2007). Correlation between disease severity and brain electric LORETA tomography in Alzheimer’s disease. Clinical Neurophysiology : Official Journal of the International Federation of Clinical Neurophysiology, 118(1), 186–96. doi:10.1016/j.clinph.2006.09.007
Gómez, C., Stam, C. J., Hornero, R., Fernández, A., & Maestú, F. (2009). Disturbed beta band functional connectivity in patients with mild cognitive impairment: an MEG study. IEEE Transactions on Bio-Medical Engineering, 56(6), 1683–90. doi:10.1109/TBME.2009.2018454
Grady, C. L., Haxby, J. V, Horwitz, B., Sundaram, M., Berg, G., Schapiro, M., … Rapoport, S. I. (1988). Longitudinal study of the early neuropsychological and cerebral metabolic changes in dementia of the Alzheimer type. Journal of Clinical and Experimental Neuropsychology, 10(5), 576–96. doi:10.1080/01688638808402796
Grady, C. L., Furey, M. L., Pietrini, P., Horwitz, B., & Rapoport, S. I. (2001). Altered brain functional connectivity and impaired short-term memory in Alzheimer’s disease. Brain : A Journal of Neurology, 124(Pt 4), 739–56. Retrieved from http://www.ncbi.nlm.nih.gov/pubmed/11287374
Grady, C. L., Springer, M. V, Hongwanishkul, D., McIntosh, A. R., & Winocur, G. (2006). Age-related changes in brain activity across the adult lifespan. Journal of Cognitive Neuroscience, 18(2), 227–41. doi:10.1162/089892906775783705
Gray, J. (1994). Studying the rate of decline in Alzheimer’s disease: implications for therapeutic trials. In Racagni G, Brunello N, Langer SZ, editors. Recent advances in the treatment of neurodegenerative disorders and cognitive dysfunction (pp. 187– 90).
Greicius, M. D., Kiviniemi, V., Tervonen, O., Vainionpää, V., Reiss, A. L., & Menon, V. (2008). Persistent Default-Mode Network Connectivity During Light Sedation. Human Brain Mapping, 29(7), 839–847. doi:10.1002/hbm.20537.Persistent
Griffith, H. R., Belue, K., Sicola, A., Krzywanski, S., Zamrini, E., Harrell, L., & Marson, D. C. (2003). Impaired financial abilities in mild cognitive impairment: a direct assessment approach. Neurology, 60(3), 449–57. Retrieved from http://www.ncbi.nlm.nih.gov/pubmed/12578926
Grimmer, T., Wutz, C., Drzezga, A., Förster, S., Förstl, H., Ortner, M., … Kurz, A. (2013). The usefulness of amyloid imaging in predicting the clinical outcome after two years in subjects with mild cognitive impairment. Current Alzheimer Research, 10(1), 82–5. Retrieved from http://www.ncbi.nlm.nih.gov/pubmed/23036071
140
Grundman, M., Petersen, R. C., Ferris, S. H., Thomas, R. G., Aisen, P. S., Bennett, D. a, … Thal, L. J. (2004). Mild cognitive impairment can be distinguished from Alzheimer disease and normal aging for clinical trials. Archives of Neurology, 61(1), 59–66. doi:10.1001/archneur.61.1.59
Haense, C., Kalbe, E., Herholz, K., Hohmann, C., Neumaier, B., Krais, R., & Heiss, W.-D. (2012). Cholinergic system function and cognition in mild cognitive impairment. Neurobiology of Aging, 33(5), 867–77. doi:10.1016/j.neurobiolaging.2010.08.015
Hafkemeijer, A., van der Grond, J., & Rombouts, S. a R. B. (2012). Imaging the default mode network in aging and dementia. Biochimica et Biophysica Acta, 1822(3), 431–41. doi:10.1016/j.bbadis.2011.07.008
Hampel, H., Teipel, S. J., Fuchsberger, T., Andreasen, N., Wiltfang, J., Otto, M., … Buerger, K. (2004). Value of CSF beta-amyloid1-42 and tau as predictors of Alzheimer’s disease in patients with mild cognitive impairment. Molecular Psychiatry, 9(7), 705–10. doi:10.1038/sj.mp.4001473
Hampel, H., Frank, R., Broich, K., Teipel, S. J., Katz, R. G., Hardy, J., … Blennow, K. (2010). Biomarkers for Alzheimer’s disease: academic, industry and regulatory perspectives. Nature Reviews. Drug Discovery, 9(7), 560–74. doi:10.1038/nrd3115
Han, J. W., Kim, T. H., Lee, S. B., Park, J. H., Lee, J. J., Huh, Y., … Kim, K. W. (2012). Predictive validity and diagnostic stability of mild cognitive impairment subtypes. Alzheimer’s & Dementia : The Journal of the Alzheimer's Association, 8(6), 553–9. doi:10.1016/j.jalz.2011.08.007
Hansson, O., Zetterberg, H., Buchhave, P., Londos, E., Blennow, K., & Minthon, L. (2006). Association between CSF biomarkers and incipient Alzheimer’s disease in patients with mild cognitive impairment: a follow-up study. Lancet Neurology, 5(3), 228–34. doi:10.1016/S1474-4422(06)70355-6
Hari, R. (1990). The neuromagnetic method in the study of the human auditory cortex. In Grandori, F., Hoke, M., Romani, G. (Eds.), Auditory Evoked Magnetic Fields and Potentials. Advances in Audiology (pp. 222–282).
Harmony, T., Fernández, T., Silva, J., Bernal, J., Díaz-Comas, L., Reyes, a, … Rodríguez, M. (1996). EEG delta activity: an indicator of attention to internal processing during performance of mental tasks. International Journal of Psychophysiology : Official Journal of the International Organization of Psychophysiology, 24(1-2), 161–71. Retrieved from http://www.ncbi.nlm.nih.gov/pubmed/8978441
Hatashita, S., & Yamasaki, H. (2013). Diagnosed Mild Cognitive Impairment Due to Alzheimer’s Disease with PET Biomarkers of Beta Amyloid and Neuronal Dysfunction. PloS One, 8(6), e66877. doi:10.1371/journal.pone.0066877
He, J., Farias, S., Martinez, O., Reed, B., Mungas, D., & Decarli, C. (2009). Differences in brain volume, hippocampal volume, cerebrovascular risk factors, and apolipoprotein E4 among mild cognitive impairment subtypes. Archives of Neurology, 66(11), 1393–9. doi:10.1001/archneurol.2009.252

141
Hier, D. B., Mangone, C. A., Ganellen, R., Warach, J. D., Van Egeren, R., Perlik, S. J., & Gorelick, P. B. (1991). Quantitative measurement of delta activity in Alzheimer’s disease. Clinical EEG (electroencephalography), 22(3), 178–82. Retrieved from http://www.ncbi.nlm.nih.gov/pubmed/1879056
Hirono, N., Mori, E., Ishii, K., Imamura, T., Shimomura, T., Tanimukai, S., … Sasaki, M. (1998). Regional metabolism: associations with dyscalculia in Alzheimer’s disease. Journal of Neurology, Neurosurgery & Psychiatry, 65(6), 913–916. doi:10.1136/jnnp.65.6.913
Hitch, G. J. (1978). The role of short-term working memory in mental arithmetic. Cognitive Psychology, 10(3), 302–323. doi:10.1016/0010-0285(78)90002-6
Hodges, J. R. (2006). Alzheimer’s centennial legacy: origins, landmarks and the current status of knowledge concerning cognitive aspects. Brain : A Journal of Neurology, 129(Pt 11), 2811–22. doi:10.1093/brain/awl275
Horovitz, S. G., Fukunaga, M., de Zwart, J. A., van Gelderen, P., Fulton, S. C., Balkin, T. J., & Duyn, J. H. (2008). Low frequency BOLD fluctuations during resting wakefulness and light sleep: a simultaneous EEG-fMRI study. Human Brain Mapping, 29(6), 671–82. doi:10.1002/hbm.20428
Huang, C., Wahlund, L.-O., Dierks, T., Julin, P., Winblad, B., & Jelic, V. (2000). Discrimination of Alzheimer’s disease and mild cognitive impairment by equivalent EEG sources: a cross-sectional and longitudinal study. Clinical Neurophysiology, 111(11), 1961–1967. doi:10.1016/S1388-2457(00)00454-5
Ishii, R., Shinosaki, K., Ukai, S., Inouye, T., Ishihara, T., Yoshimine, T., … Takeda, M. (1999). Medial prefrontal cortex generates frontal midline theta rhythm. Neuroreport, 10(4), 675–9. Retrieved from http://www.ncbi.nlm.nih.gov/pubmed/10208529
Jack, C. R., Petersen, R. C., Xu, Y. C., & Al, E. (1999). Prediction of AD with MRI-Based Hippocampal Volume in Mild Cognitive Impairment. Neurology, 52(7), 1397–1403.
Jack, C. R., Petersen, R. C., Xu, Y., O’Brien, P. C., Smith, G. E., Ivnik, R. J., … Kokmen, E. (2000). Rates of hippocampal atrophy correlate with change in clinical status in aging and AD. Neurology, 55(4), 484–89. Retrieved from http://www.pubmedcentral.nih.gov/articlerender.fcgi?artid=2724764&tool=pmcentrez&rendertype=abstract
Jack, C., Shiung, M., & Weigand, S. et al. (2005). Brain Atrophy Rates Predict Subsequent Clinical Conversion in Normal Elderly and Amnestic MCI. Neurology, 65(8), 1227–1231. doi:10.1212/01.wnl.0000180958.22678.91.Brain
Jelic, V., Shigeta, M., Julin, P., Almkvist, O., Winblad, B., & Wahlund, L. O. (1996). Quantitative electroencephalography power and coherence in Alzheimer’s disease and mild cognitive impairment. Dementia (Basel, Switzerland), 7(6), 314–23. Retrieved from http://www.ncbi.nlm.nih.gov/pubmed/8915037
Jelic, V., Johansson, S.-E., Almkvist, O., Shigeta, M., Julin, P., Nordberg, a., … Wahlund, L.-O. (2000). Quantitative electroencephalography in mild cognitive impairment: longitudinal

142
changes and possible prediction of Alzheimer’s disease. Neurobiology of Aging, 21(4), 533–540. doi:10.1016/S0197-4580(00)00153-6
Jelic, V., Kivipelto, M., & Winblad, B. (2006). Clinical trials in mild cognitive impairment: lessons for the future. Journal of Neurology, Neurosurgery, and Psychiatry, 77(4), 429–38. doi:10.1136/jnnp.2005.072926
Jensen, O., Gelfand, J., Kounios, J., & Lisman, J. E. (2002). Oscillations in the alpha band (9-12 Hz) increase with memory load during retention in a short-term memory task. Cerebral Cortex (New York, N.Y. : 1991), 12(8), 877–82. Retrieved from http://www.ncbi.nlm.nih.gov/pubmed/12122036
Jensen, O., & Mazaheri, A. (2010). Shaping functional architecture by oscillatory alpha activity: gating by inhibition. Frontiers in Human Neuroscience, 4(November), 186. doi:10.3389/fnhum.2010.00186
Jeong, J. (2004). EEG dynamics in patients with Alzheimer’s disease. Clinical Neurophysiology, 115(7), 1490–505. doi:10.1016/j.clinph.2004.01.001
Jessen, F., Wiese, B., Cvetanovska, G., Fuchs, A., Kaduszkiewicz, H., Kölsch, H., … Bickel, H. (2007). Patterns of subjective memory impairment in the elderly: association with memory performance. Psychological Medicine, 37(12), 1753–62. doi:10.1017/S0033291707001122
Jiang, Z. (2005). Study on EEG power and coherence in patients with mild cognitive impairment during working memory task. Journal of Zhejiang University. Science. B, 6(12), 1213–9. doi:10.1631/jzus.2005.B1213
Jiang, Z., & Zheng, L. (2006). Inter- and intra-hemispheric EEG coherence in patients with mild cognitive impairment at rest and during working memory task. Journal of Zhejiang University. Science. B, 7(5), 357–64. doi:10.1631/jzus.2006.B0357
Jiang, Z., Zheng, L., & Yu, E.-Y. (2008). EEG coherence characteristics at rest and during a three-level working memory task in normal aging and mild cognitive impairment. Med Sci Monit, 14(10), 515–524.
Johns, E. K., Phillips, N. A., Belleville, S., Goupil, D., Babins, L., Kelner, N., … Chertkow, H. (2012). The profile of executive functioning in amnestic mild cognitive impairment: disproportionate deficits in inhibitory control. Journal of the International Neuropsychological Society : JINS, 18(3), 541–55. doi:10.1017/S1355617712000069
Johnson, K. a, Moran, E. K., Becker, J. a, Blacker, D., Fischman, a J., & Albert, M. S. (2007). Single photon emission computed tomography perfusion differences in mild cognitive impairment. Journal of Neurology, Neurosurgery, and Psychiatry, 78(3), 240–7. doi:10.1136/jnnp.2006.096800
Jonker, C., Geerlings, M. I., & Schmand, B. (2000). Are memory complaints predictive for dementia? A review of clinical and population-based studies. International Journal of Geriatric Psychiatry, 15(11), 983–91. Retrieved from http://www.ncbi.nlm.nih.gov/pubmed/11113976

143
Jorm, A. F., Butterworth, P., Anstey, K. J., Christensen, H., Easteal, S., Maller, J., … Sachdev, P. (2004). Memory complaints in a community sample aged 60-64 years: associations with cognitive functioning, psychiatric symptoms, medical conditions, APOE genotype, hippocampus and amygdala volumes, and white-matter hyperintensities. Psychological Medicine, 34(8), 1495–506. Retrieved from http://www.ncbi.nlm.nih.gov/pubmed/15724880
Kaplan, E., Goodglass, H., & Weintraub, S. (1983). The Boston Naming Test. Philadelphia: Lea and Febiger.
Karas, G., Sluimer, J., Goekoop, R., van der Flier, W., Rombouts, S. a R. B., Vrenken, H., … Barkhof, F. (2008). Amnestic mild cognitive impairment: structural MR imaging findings predictive of conversion to Alzheimer disease. AJNR. American Journal of Neuroradiology, 29(5), 944–9. doi:10.3174/ajnr.A0949
Kikuchi, M., Wada, Y., Nanbu, Y., Nakajima, A., Tachibana, H., Takeda, T., & Hashimoto, T. (1999). EEG Changes following Scopolamine Administration in Healthy Subjects. Pharmacoelectroencephalography, (39), 219–226.
Kikuchi, M., Wada, Y., Koshino, Y., Nanbu, Y., & Hashimoto, T. (2000). Effects of scopolamine on interhemispheric EEG coherence in healthy subjects: analysis during rest and photic stimulation. Clinical EEG (electroencephalography), 31(2), 109–15. Retrieved from http://www.ncbi.nlm.nih.gov/pubmed/10840634
Killingsworth, M. A., & Gilbert, D. T. (2010). A wandering mind is an unhappy mind. Science (New York, N.Y.), 330(6006), 932. doi:10.1126/science.1192439
Klimesch, W. (1999). EEG alpha and theta oscillations reflect cognitive and memory performance: a review and analysis. Brain Research. Brain Research Reviews, 29(2-3), 169–95. Retrieved from http://www.ncbi.nlm.nih.gov/pubmed/10209231
Klimesch, W., Sauseng, P., & Hanslmayr, S. (2007). EEG alpha oscillations: the inhibition-timing hypothesis. Brain Research Reviews, 53(1), 63–88. doi:10.1016/j.brainresrev.2006.06.003
Knopman, D. S., Parisi, J. E., Salviati, A., Floriach-Robert, M., Boeve, B. F., Ivnik, R. J., … Petersen, R. C. (2003). Neuropathology of cognitively normal elderly. Journal of Neuropathology and Experimental Neurology, 62(11), 1087–95. Retrieved from http://www.ncbi.nlm.nih.gov/pubmed/14656067
Koch, W., Teipel, S., Mueller, S., Buerger, K., Bokde, a L. W., Hampel, H., … Meindl, T. (2010). Effects of aging on default mode network activity in resting state fMRI: does the method of analysis matter? NeuroImage, 51(1), 280–7. doi:10.1016/j.neuroimage.2009.12.008
Koenig, T., Prichep, L., Dierks, T., Hubl, D., Wahlund, L. O., John, E. R., & Jelic, V. (2005). Decreased EEG synchronization in Alzheimer’s disease and mild cognitive impairment. Neurobiology of Aging, 26(2), 165–71. doi:10.1016/j.neurobiolaging.2004.03.008
Kramer, J. H., Nelson, A., Johnson, J. K., Yaffe, K., Glenn, S., Rosen, H. J., & Miller, B. L. (2006). Multiple Cognitive Deficits in Amnestic Mild Cognitive Impairment. Dement Geriatr Cogn, 22(4), 306–311. doi:10.1159/000095303.Multiple

144
Kramer, J. H., Nelson, A., Johnson, J. K., Yaffe, K., Glenn, S., Rosen, H. J., & Miller, B. L. (2009). Multiple Cognitive Deficits in Amnestic Mild Cognitive Impairment. Dementia and Geriatric Cognitive Disorders, 22(4), 306–311. doi:10.1159/000095303.Multiple
Krueger, F., Landgraf, S., van der Meer, E., Deshpande, G., & Hu, X. (2011). Effective connectivity of the multiplication network: a functional MRI and multivariate Granger Causality Mapping study. Human Brain Mapping, 32(9), 1419–31. doi:10.1002/hbm.21119
Kwak, Y. T. (2006). Quantitative EEG findings in different stages of Alzheimer’s disease. Journal of Clinical Neurophysiology : Official Publication of the American Electroencephalographic Society, 23(5), 456–61. doi:10.1097/01.wnp.0000223453.47663.63
Lachaux, J. P., Rodriguez, E., Martinerie, J., & Varela, F. J. (1999). Measuring phase synchrony in brain signals. Human Brain Mapping, 8(4), 194–208. Retrieved from http://www.ncbi.nlm.nih.gov/pubmed/10619414
Lanari, A., & Parnetti, L. (2009). Cerebrospinal fluid biomarkers and prediction of conversion in patients with mild cognitive impairment: 4-year follow-up in a routine clinical setting. TheScientificWorldJournal, 9, 961–6. doi:10.1100/tsw.2009.106
Larrieu, S., Letenneur, L., Orgogozo, J. M., Fabrigoule, C., Amieva, H., Le Carret, N., … Dartigues, J. F. (2002). Incidence and outcome of mild cognitive impairment in a population-based prospective cohort. Neurology, 59(10), 1594–9. Retrieved from http://www.ncbi.nlm.nih.gov/pubmed/12451203
Lavenex, P., & Amaral, D. G. (2000). Hippocampal-neocortical interaction: a hierarchy of associativity. Hippocampus, 10(4), 420–30. doi:10.1002/1098-1063(2000)10:4<420::AID-HIPO8>3.0.CO;2-5
Lawton, M. P., & Brody, E. M. (1969). Assessment of older people: self-maintaining and instrumental activities of daily living. The Gerontologist, 9(3), 179–86. Retrieved from http://www.ncbi.nlm.nih.gov/pubmed/5349366
Le Van Quyen, M., & Bragin, A. (2007). Analysis of dynamic brain oscillations: methodological advances. Trends in Neurosciences, 30(7), 365–73. doi:10.1016/j.tins.2007.05.006
Lehtovirta, M., Partanen, J., Könönen, M., Hiltunen, J., Helisalmi, S., Hartikainen, P., … Soininen, H. (2000). A longitudinal quantitative EEG study of Alzheimer’s disease: relation to apolipoprotein E polymorphism. Dementia and Geriatric Cognitive Disorders, 11(1), 29–35. doi:17210
Lekeu, F., Magis, D., Marique, P., Delbeuck, X., Bechet, S., Guillaume, B., … Salmon, E. (2010). The California Verbal Learning Test and other standard clinical neuropsychological tests to predict conversion from mild memory impairment to dementia. Journal of Clinical and Experimental Neuropsychology, 32(2), 164–73. doi:10.1080/13803390902889606
Li, X., Zhang, Y., Feng, L., & Meng, Q. (2010). Early event-related potentials changes during simple mental calculation in Chinese older adults with mild cognitive impairment: A case-control study. Neuroscience Letters, 475(1), 29–32. doi:10.1016/j.neulet.2010.03.038

145
Lim, S., Han, C. E., Uhlhaas, P. J., & Kaiser, M. (2013). Preferential Detachment During Human Brain Development: Age- and Sex-Specific Structural Connectivity in Diffusion Tensor Imaging (DTI) Data. Cerebral Cortex (New York, N.Y. : 1991). doi:10.1093/cercor/bht333
Lobo, A., Ezquerra, J., Gómez Burgada, F., Sala, J. M., & Seva Díaz, A. (1979). [Cognocitive mini-test (a simple practical test to detect intellectual changes in medical patients)]. Actas Luso-Españolas de Neurología, Psiquiatría Y Ciencias Afines, 7(3), 189–202. Retrieved from http://www.ncbi.nlm.nih.gov/pubmed/474231
Locatelli, T., Cursi, M., Liberati, D., Franceschi, M., & Comi, G. (1998). EEG coherence in Alzheimer’s disease. Electroencephalography and Clinical Neurophysiology, 106(3), 229–37. Retrieved from http://www.ncbi.nlm.nih.gov/pubmed/9743281
Maestú, F., Campo, P., Del Río, D., Moratti, S., Gil-Gregorio, P., Fernández, a, … Ortiz, T. (2008). Increased biomagnetic activity in the ventral pathway in mild cognitive impairment. Clinical Neurophysiology : Official Journal of the International Federation of Clinical Neurophysiology, 119(6), 1320–7. doi:10.1016/j.clinph.2008.01.105
Maestú, F., Yubero, R., Moratti, S., Campo, P., Gil-Gregorio, P., Paul, N., … Nevado, A. (2011). Brain activity patterns in stable and progressive mild cognitive impairment during working memory as evidenced by magnetoencephalography. Journal of Clinical Neurophysiology : Official Publication of the American Electroencephalographic Society, 28(2), 202–9. doi:10.1097/WNP.0b013e3182121743
Maillet, D., & Rajah, M. N. (2013). Age-related changes in frequency of mind-wandering and task-related interferences during memory encoding and their impact on retrieval. Memory (Hove, England). doi:10.1080/09658211.2012.761714
Maris, E., & Oostenveld, R. (2007). Nonparametric statistical testing of EEG- and MEG-data. Journal of Neuroscience Methods, 164(1), 177–90. doi:10.1016/j.jneumeth.2007.03.024
Marterer, A., Danielczyk, W., Simanyi, M., & Fischer, P. (1996). Calculation abilities in dementia of Alzheimer’s type and in vascular dementia. Archives of Gerontology and Geriatrics, 23(2), 189–197. doi:10.1016/0167-4943(96)00720-0
Martin, R. C., Annis, S. M., Darling, L. Z., Wadley, V., Harrell, L., & Marson, D. C. (2003). Loss of calculation abilities in patients with mild and moderate Alzheimer disease. Archives of Neurology, 60(11), 1585–9. doi:10.1001/archneur.60.11.1585
Martin, S. B., Smith, C. D., Collins, H. R., Schmitt, F. a, & Gold, B. T. (2010). Evidence that volume of anterior medial temporal lobe is reduced in seniors destined for mild cognitive impairment. Neurobiology of Aging, 31(7), 1099–106. doi:10.1016/j.neurobiolaging.2008.08.010
McKee, A. C., Au, R., Cabral, H. J., Kowall, N. W., Seshadri, S., Kubilus, C. a, … Wolf, P. a. (2006). Visual association pathology in preclinical Alzheimer disease. Journal of Neuropathology and Experimental Neurology, 65(6), 621–30. Retrieved from http://www.ncbi.nlm.nih.gov/pubmed/16783172
McKhann, G., Drachman, D., Folstein, M., Katzman, R., Price, D., & Stadlan, E. M. (1984). Clinical diagnosis of Alzheimer’s disease: report of the NINCDS-ADRDA Work Group under

146
the auspices of Department of Health and Human Services Task Force on Alzheimer's Disease. Neurology, 34(7), 939–44. Retrieved from http://www.ncbi.nlm.nih.gov/pubmed/6610841
McKhann, G. M., Knopman, D. S., Chertkow, H., Hyman, B. T., Jack, C. R., Kawas, C. H., … Phelps, C. H. (2011). The diagnosis of dementia due to Alzheimer’s disease: recommendations from the National Institute on Aging-Alzheimer's Association workgroups on diagnostic guidelines for Alzheimer's disease. Alzheimer’s & Dementia : The Journal of the Alzheimer's Association, 7(3), 263–9. doi:10.1016/j.jalz.2011.03.005
Mevel, K., Chételat, G., Eustache, F., & Desgranges, B. (2011). The default mode network in healthy aging and Alzheimer’s disease. International Journal of Alzheimer’s Disease, 2011, 535816. doi:10.4061/2011/535816
Micheloyannis, S., Sakkalis, V., Vourkas, M., Stam, C. J., & Simos, P. G. (2005). Neural networks involved in mathematical thinking: evidence from linear and non-linear analysis of electroencephalographic activity. Neuroscience Letters, 373(3), 212–7. doi:10.1016/j.neulet.2004.10.005
Minoshima, S., Giordani, B., Berent, S., Frey, K. A., Foster, N. L., & Kuhl, D. E. (1997). Metabolic reduction in the posterior cingulate cortex in very early Alzheimer’s disease. Annals of Neurology, 42(1), 85–94. doi:10.1002/ana.410420114
Missonnier, P., Deiber, M.-P., Gold, G., Millet, P., Gex-Fabry Pun, M., Fazio-Costa, L., … Ibáñez, V. (2006). Frontal theta event-related synchronization: comparison of directed attention and working memory load effects. Journal of Neural Transmission (Vienna, Austria : 1996), 113(10), 1477–86. doi:10.1007/s00702-005-0443-9
Missonnier, P., Deiber, M.-P., Gold, G., Herrmann, F. R., Millet, P., Michon, a, … Giannakopoulos, P. (2007). Working memory load-related electroencephalographic parameters can differentiate progressive from stable mild cognitive impairment. Neuroscience, 150(2), 346–56. doi:10.1016/j.neuroscience.2007.09.009
Mitchell, A. J. (2008a). Is it time to separate subjective cognitive complaints from the diagnosis of mild cognitive impairment? Age and Ageing, 37(5), 497–9. doi:10.1093/ageing/afn147
Mitchell, A. J. (2008b). The clinical significance of subjective memory complaints in the diagnosis of mild cognitive impairment and dementia: a meta-analysis. International Journal of Geriatric Psychiatry, 23(11), 1191–202. doi:10.1002/gps.2053
Molinuevo, J. L., & Rami, L. (2013). Applying the IWG research criteria in clinical practice: feasibility and ethical issues. The Medical Clinics of North America, 97(3), 477–84. doi:10.1016/j.mcna.2012.12.018
Morcom, A. M., Li, J., & Rugg, M. D. (2007). Age effects on the neural correlates of episodic retrieval: increased cortical recruitment with matched performance. Cerebral Cortex, 17(11), 2491–506. doi:10.1093/cercor/bhl155
Moretti, D. V, Miniussi, C., Frisoni, G. B., Geroldi, C., Zanetti, O., Binetti, G., & Rossini, P. M. (2007). Hippocampal atrophy and EEG markers in subjects with mild cognitive

147
impairment. Clinical Neurophysiology : Official Journal of the International Federation of Clinical Neurophysiology, 118(12), 2716–29. doi:10.1016/j.clinph.2007.09.059
Moretti, D. V., Frisoni, G. B., Pievani, M., Rosini, S., Geroldi, C., Binetti, G., & Rossini, P. M. (2008). Cerebrovascular disease and hippocampal atrophy are differently linked to functional coupling of brain areas: an EEG coherence study in MCI subjects. Journal of Alzheimer’s Disease : JAD, 14(3), 285–99. Retrieved from http://www.ncbi.nlm.nih.gov/pubmed/18599955
Moretti, D. V, Frisoni, G. B., Fracassi, C., Pievani, M., Geroldi, C., Binetti, G., … Zanetti, O. (2011). MCI patients’ EEGs show group differences between those who progress and those who do not progress to AD. Neurobiology of Aging, 32(4), 563–71. doi:10.1016/j.neurobiolaging.2009.04.003
Mori, T., Shimada, H., Shinotoh, H., Hirano, S., Eguchi, Y., Yamada, M., … Suhara, T. (2013). Apathy correlates with prefrontal amyloid β deposition in Alzheimer’s disease. Journal of Neurology, Neurosurgery, and Psychiatry. doi:10.1136/jnnp-2013-306110
Mormann, F., Lehnertz, K., David, P., & E. Elger, C. (2000). Mean phase coherence as a measure for phase synchronization and its application to the EEG of epilepsy patients. Physica D: Nonlinear Phenomena, 144(3-4), 358–369. doi:10.1016/S0167-2789(00)00087-7
Morris, J. C. (1993). The Clinical Dementia Rating (CDR): current version and scoring rules. Neurology, 43(11), 2412–4. Retrieved from http://www.ncbi.nlm.nih.gov/pubmed/8232972
Mufson, E. J., Chen, E. Y., Cochran, E. J., Beckett, L. a, Bennett, D. a, & Kordower, J. H. (1999). Entorhinal cortex beta-amyloid load in individuals with mild cognitive impairment. Experimental Neurology, 158(2), 469–90. doi:10.1006/exnr.1999.7086
Mufson, E. J., Ma, S. Y., Cochran, E. J., Bennett, D. A., Beckett, L. A., Jaffar, S., … Kordower, J. H. (2000). Loss of nucleus basalis neurons containing trkA immunoreactivity in individuals with mild cognitive impairment and early Alzheimer’s disease. The Journal of Comparative Neurology, 427(1), 19–30. Retrieved from http://www.ncbi.nlm.nih.gov/pubmed/11042589
Nelson, A. P., & O’Connor, M. G. (2008). Mild cognitive impairment: a neuropsychological perspective. CNS Spectrums, 13(1), 56–64. Retrieved from http://www.ncbi.nlm.nih.gov/pubmed/18204415
Nestor, P. J., Scheltens, P., & Hodges, J. R. (2004). Advances in the early detection of Alzheimer’s disease. Nature Medicine, 10 Suppl, 34–41. doi:10.1038/nm1433
Nichols, T. E., & Holmes, A. P. (2002). Nonparametric permutation tests for functional neuroimaging: a primer with examples. Human Brain Mapping, 15(1), 1–25. Retrieved from http://www.ncbi.nlm.nih.gov/pubmed/11747097
Nordlund, A., Rolstad, S., Klang, O., Edman, A., Hansen, S., & Wallin, A. (2010). Two-year outcome of MCI subtypes and aetiologies in the Göteborg MCI study. Journal of Neurology, Neurosurgery, and Psychiatry, 81(5), 541–6. doi:10.1136/jnnp.2008.171066
148
Norris, G., & Tate, R. L. (2000). The Behavioural Assessment of the Dysexecutive Syndrome (BADS): Ecological, Concurrent and Construct Validity. Neuropsychological Rehabilitation, 10(1), 33–45. doi:10.1080/096020100389282
Okello, A., Koivunen, J., Edison, P., Archer, H., Turkheimer, F., & Al, E. (2009). Conversion of amyloid positive and negative MCI to AD over 3 years. Neurology, 73(10), 754–760.
Oldfield, R. C. (1971). The assessment and analysis of handedness: the Edinburgh inventory. Neuropsychologia, 9(1), 97–113. Retrieved from http://www.ncbi.nlm.nih.gov/pubmed/5146491
Onton, J., Delorme, A., & Makeig, S. (2005). Frontal midline EEG dynamics during working memory. NeuroImage, 27(2), 341–56. doi:10.1016/j.neuroimage.2005.04.014
Oostenveld, R., Fries, P., Maris, E., & Schoffelen, J.-M. (2011). FieldTrip: Open source software for advanced analysis of MEG, EEG, and invasive electrophysiological data. Computational Intelligence and Neuroscience, 2011, 156869. doi:10.1155/2011/156869
Osipova, D., Ahveninen, J., Kaakkola, S., Jääskeläinen, I. P., Huttunen, J., & Pekkonen, E. (2003). Effects of scopolamine on MEG spectral power and coherence in elderly subjects. Clinical Neurophysiology : Official Journal of the International Federation of Clinical Neurophysiology, 114(10), 1902–7. Retrieved from http://www.ncbi.nlm.nih.gov/pubmed/14499752
Osipova, D., Ahveninen, J., Jensen, O., Ylikoski, A., & Pekkonen, E. (2005). Altered generation of spontaneous oscillations in Alzheimer’s disease. NeuroImage, 27(4), 835–41. doi:10.1016/j.neuroimage.2005.05.011
Osipova, D., Rantanen, K., Ahveninen, J., Ylikoski, R., Häppölä, O., Strandberg, T., & Pekkonen, E. (2006). Source estimation of spontaneous MEG oscillations in mild cognitive impairment. Neuroscience Letters, 405(1-2), 57–61. doi:10.1016/j.neulet.2006.06.045
Palva, S., & Palva, J. M. (2007). New vistas for alpha-frequency band oscillations. Trends in Neurosciences, 30(4), 150–8. doi:10.1016/j.tins.2007.02.001
Palva, J. M., Monto, S., Kulashekhar, S., & Palva, S. (2010). Neuronal synchrony reveals working memory networks and predicts individual memory capacity. Proceedings of the National Academy of Sciences of the United States of America, 107(16), 7580–5. doi:10.1073/pnas.0913113107
Park, J. Y., Lee, K. S., An, S. K., Lee, J., Kim, J.-J., Kim, K. H., & Namkoong, K. (2012). Gamma oscillatory activity in relation to memory ability in older adults. International Journal of Psychophysiology : Official Journal of the International Organization of Psychophysiology, 86(1), 58–65. doi:10.1016/j.ijpsycho.2012.08.002
Parlato, V., Lopez, O. L., Panisset, M., Iavarone, A., Grafman, J., & Boller, F. (1992). Mental calculation in mild Alzheimer’s disease: A pilot study. International Journal of Geriatric Psychiatry, 7(8), 599–602. doi:10.1002/gps.930070810
Peña-Casanova, J. (1990). Programa Integrado de Exploración Neuropsicológica- Test Barcelona. Protocolo. Barcelona: Masson SA.

149
Perri, R., Serra, L., Carlesimo, G. A., & Caltagirone, C. (2007). Amnestic mild cognitive impairment: difference of memory profile in subjects who converted or did not convert to Alzheimer’s disease. Neuropsychology, 21(5), 549–58. doi:10.1037/0894-4105.21.5.549
Persson, J., Lustig, C., Nelson, J. K., & Reuter-Lorenz, P. a. (2007). Age differences in deactivation: a link to cognitive control? Journal of Cognitive Neuroscience, 19(6), 1021–32. doi:10.1162/jocn.2007.19.6.1021
Peters, F., Villeneuve, S., & Belleville, S. (2014). Predicting progression to dementia in elderly subjects with mild cognitive impairment using both cognitive and neuroimaging predictors. Journal of Alzheimer’s Disease : JAD, 38(2), 307–18. doi:10.3233/JAD-130842
Petersen, R. C., Doody, R., Kurz, a, Mohs, R. C., Morris, J. C., Rabins, P. V, … Winblad, B. (2001a). Current concepts in mild cognitive impairment. Archives of Neurology, 58(12), 1985–92. Retrieved from http://www.pubmedcentral.nih.gov/articlerender.fcgi?artid=3713320&tool=pmcentrez&rendertype=abstract
Petersen, R. C., Doody, R., Kurz, A., Mohs, R. C., Morris, J. C., Rabins, P. V, … Winblad, B. (2001b). Current concepts in mild cognitive impairment. Archives of Neurology, 58(12), 1985–92. Retrieved from http://www.ncbi.nlm.nih.gov/pubmed/11735772
Petersen, R. C. (2004). Mild cognitive impairment as a diagnostic entity. Journal of Internal Medicine, 256(3), 183–94. doi:10.1111/j.1365-2796.2004.01388.x
Petersen, R. C., & Bennett, D. (2005). Mild cognitive impairment: is it Alzheimer’s disease or not? Journal of Alzheimer’s Disease : JAD, 7(3), 241–5; discussion 255–62. Retrieved from http://www.ncbi.nlm.nih.gov/pubmed/16006668
Petersen, R. C., Parisi, J. E., Dickson, D. W., Johnson, K. a, Knopman, D. S., Boeve, B. F., … Kokmen, E. (2006). Neuropathologic features of amnestic mild cognitive impairment. Archives of Neurology, 63(5), 665–72. doi:10.1001/archneur.63.5.665
Pfeffer, R. I., Kurosaki, T. T., Harrah, C. H., Chance, J. M., & Filos, S. (1982). Measurement of functional activities in older adults in the community. Journal of Gerontology, 37(3), 323–9. Retrieved from http://www.ncbi.nlm.nih.gov/pubmed/7069156
Pfurtscheller, G., Stancák, A., & Neuper, C. (1996). Event-related synchronization (ERS) in the alpha band--an electrophysiological correlate of cortical idling: a review. International Journal of Psychophysiology : Official Journal of the International Organization of Psychophysiology, 24(1-2), 39–46. Retrieved from http://www.ncbi.nlm.nih.gov/pubmed/8978434
Pfurtscheller, G. (2001). Functional brain imaging based on ERD/ERS. Vision Research, 41(10-11), 1257–60. Retrieved from http://www.ncbi.nlm.nih.gov/pubmed/11322970
Pijnenburg, Y. a L., v d Made, Y., van Cappellen van Walsum, a M., Knol, D. L., Scheltens, P., & Stam, C. J. (2004). EEG synchronization likelihood in mild cognitive impairment and Alzheimer’s disease during a working memory task. Clinical Neurophysiology : Official
150
Journal of the International Federation of Clinical Neurophysiology, 115(6), 1332–9. doi:10.1016/j.clinph.2003.12.029
Poil, S.-S., De Haan, W., van der Flier, W. M., Mansvelder, H. D., Scheltens, P., & Linkenkaer-Hansen, K. (2013). Integrative EEG biomarkers predict progression to Alzheimer’s disease at the MCI stage. Frontiers in Aging Neuroscience, 5. doi:10.3389/fnagi.2013.00058
Price, J. L., Ko, a I., Wade, M. J., Tsou, S. K., McKeel, D. W., & Morris, J. C. (2001). Neuron number in the entorhinal cortex and CA1 in preclinical Alzheimer disease. Archives of Neurology, 58(9), 1395–402. Retrieved from http://www.ncbi.nlm.nih.gov/pubmed/11559310
Prichep, L. S., John, E. R., Ferris, S. H., Reisberg, B., Almas, M., Alper, K., & Cancro, R. (1994). Quantitative EEG correlates of cognitive deterioration in the elderly. Neurobiology of Aging, 15(1), 85–90. Retrieved from http://www.ncbi.nlm.nih.gov/pubmed/8159266
Prichep, L. S., John, E. R., Ferris, S. H., Rausch, L., Fang, Z., Cancro, R., … Reisberg, B. (2006). Prediction of longitudinal cognitive decline in normal elderly with subjective complaints using electrophysiological imaging. Neurobiology of Aging, 27(3), 471–81. doi:10.1016/j.neurobiolaging.2005.07.021
Raichle, M. E., MacLeod, a M., Snyder, a Z., Powers, W. J., Gusnard, D. a, & Shulman, G. L. (2001). A default mode of brain function. Proceedings of the National Academy of Sciences of the United States of America, 98(2), 676–82. doi:10.1073/pnas.98.2.676
Reisberg, B., Ferris, S. H., de Leon, M. J., & Crook, T. (1982). The Global Deterioration Scale for assessment of primary degenerative dementia. The American Journal of Psychiatry, 139(9), 1136–9. Retrieved from http://www.ncbi.nlm.nih.gov/pubmed/7114305
Reitan, R. (1958). Validity of the Trail Making test as an indicator of organic brain damage. Perception Motor Skills, 8, 271–276.
Rémy, F., Mirrashed, F., Campbell, B., & Richter, W. (2004). Mental calculation impairment in Alzheimer ’ s disease : a functional magnetic resonance imaging study. Neuroscience Letters, 358, 25–28. doi:10.1016/j.neulet.2003.12.122
Requena, C., Maestú, F., Campo, P., Fernández, A., & Ortiz, T. (2006). Effects of cholinergic drugs and cognitive training on dementia: 2-year follow-up. Dementia and Geriatric Cognitive Disorders, 22(4), 339–45. doi:10.1159/000095600
Reuter-Lorenz, P. a., & Cappell, K. a. (2008). Neurocognitive Aging and the Compensation Hypothesis. Current Directions in Psychological Science, 17(3), 177–182. doi:10.1111/j.1467-8721.2008.00570.x
Rice, D. M., Buchsbaum, M. S., Starr, A., Auslander, L., Hagman, J., & Evans, W. J. (1990). Abnormal EEG slow activity in left temporal areas in senile dementia of the Alzheimer type. Journal of Gerontology, 45(4), M145–51. Retrieved from http://www.ncbi.nlm.nih.gov/pubmed/2365966
Richard, E., Schmand, B. a, Eikelenboom, P., & Van Gool, W. a. (2013). MRI and cerebrospinal fluid biomarkers for predicting progression to Alzheimer’s disease in patients with mild

151
cognitive impairment: a diagnostic accuracy study. BMJ Open, 3(6). doi:10.1136/bmjopen-2012-002541
Riemenschneider, M., Lautenschlager, N., Wagenpfeil, S., Diehl, J., Drzezga, a, & Kurz, a. (2002). Cerebrospinal fluid tau and beta-amyloid 42 proteins identify Alzheimer disease in subjects with mild cognitive impairment. Archives of Neurology, 59(11), 1729–34. Retrieved from http://www.ncbi.nlm.nih.gov/pubmed/12433260
Riley, K. P., Snowdon, D. a, & Markesbery, W. R. (2002). Alzheimer’s neurofibrillary pathology and the spectrum of cognitive function: findings from the Nun Study. Annals of Neurology, 51(5), 567–77. doi:10.1002/ana.10161
Ritchie, K. (2004). Mild cognitive impairment: an epidemiological perspective. Dialogues in Clinical Neuroscience, 6(4), 401–8. Retrieved from http://www.pubmedcentral.nih.gov/articlerender.fcgi?artid=3181815&tool=pmcentrez&rendertype=abstract
Rodda, J. E., Dannhauser, T. M., Cutinha, D. J., Shergill, S. S., & Walker, Z. (2009). Subjective cognitive impairment : increased prefrontal cortex activation compared to controls during an encoding task. International Journal of Geriatric Psychiatry, 24, 865–874. doi:10.1002/gps
Rodriguez, G., Copello, F., Vitali, P., Perego, G., & Nobili, F. (1999). EEG spectral pro ® le to stage Alzheimer ’ s disease. Frontiers in Human Neuroscience, 110.
Rosen, W. G., Terry, R. D., Fuld, P. A., Katzman, R., & Peck, A. (1980). Pathological verification of ischemic score in differentiation of dementias. Annals of Neurology, 7(5), 486–8. doi:10.1002/ana.410070516
Rosenblum, M., Pikovsky, A., & Kurths, J. (2001). Phase synchronization: from theory to data analysis. Handbook of Biological Physics, 4, 279–321.
Rossini, P. M., Del Percio, C., Pasqualetti, P., Cassetta, E., Binetti, G., Dal Forno, G., … Babiloni, C. (2006). Conversion from mild cognitive impairment to Alzheimer’s disease is predicted by sources and coherence of brain electroencephalography rhythms. Neuroscience, 143(3), 793–803. doi:10.1016/j.neuroscience.2006.08.049
Rossini, P. M., Buscema, M., Capriotti, M., Grossi, E., Rodriguez, G., Del Percio, C., & Babiloni, C. (2008). Is it possible to automatically distinguish resting EEG data of normal elderly vs. mild cognitive impairment subjects with high degree of accuracy? Clinical Neurophysiology : Official Journal of the International Federation of Clinical Neurophysiology, 119(7), 1534–45. doi:10.1016/j.clinph.2008.03.026
Rozzini L, Vicini Chilovi B, Bertoletti E, Conti M, Delrio I, Trabucchi M, P. A. (2008). The importance of Alzheimer disease assessment scale-cognitive part in predicting progress for amnestic mild cognitive impairment to Alzheimer disease. J Geriatr Psychiatry Neurol., 21(4), 261–7. Retrieved from http://www.ncbi.nlm.nih.gov/pubmed/?term=Rozzini+L,+Chilovi+Vicini+B,+Bertoletti+E,+Conti+M,+Delrio+I,+Trabucchi+M,+et+al.+The+importance+of+Alzheimer+Disease+Assessment+Scale-Cognitive+Part+in+predicting+progress+for+amnestic+mild+cognitive+impairment+to+Al

152
zheimer+disease.+Journal+of+Geriatric+Psychiatry+and+Neurology+2008;21(4):261–267.+[PubMed:+19017783]
Rypma, B., Eldreth, D. A., & Rebbechi, D. (2007). Age-related differences in activation-performance relations in delayed-response tasks: a multiple component analysis. Cortex; a Journal Devoted to the Study of the Nervous System and Behavior, 43(1), 65–76. Retrieved from http://www.ncbi.nlm.nih.gov/pubmed/17334208
Salmon, E., Lekeu, F., Bastin, C., Garraux, G., & Collette, F. (2008). Functional imaging of cognition in Alzheimer’s disease using positron emission tomography. Neuropsychologia, 46(6), 1613–23. doi:10.1016/j.neuropsychologia.2007.11.022
Sambataro, F., Murty, V. P., Callicott, J. H., Tan, H.-Y., Das, S., Weinberger, D. R., & Mattay, V. S. (2010). Age-related alterations in default mode network: impact on working memory performance. Neurobiology of Aging, 31(5), 839–52. doi:10.1016/j.neurobiolaging.2008.05.022
Sannita, W. G., Maggi, L., & Rosadini, G. (1987). Effects of scopolamine (0.25-0.75 mg i.m.) on the quantitative EEG and the Neuropsychological status of healthy volunteers. Pharmacoelectroencephalography, (17), 199– 205.
Sasaki, K., Tsujimoto, T., Nishikawa, S., Nishitani, N., & Ishihara, T. (1996). Frontal mental theta wave recorded simultaneously with magnetoencephalography and electroencephalography. Neuroscience Research, 26, 79–81.
Sauseng, P., Klimesch, W., Doppelmayr, M., Pecherstorfer, T., Freunberger, R., & Hanslmayr, S. (2005). EEG alpha synchronization and functional coupling during top-down processing in a working memory task. Human Brain Mapping, 26(2), 148–55. doi:10.1002/hbm.20150
Scahill, R. I., Schott, J. M., Stevens, J. M., Rossor, M. N., & Fox, N. C. (2002). Mapping the evolution of regional atrophy in Alzheimer ’ s disease : Unbiased analysis of fluid-registered serial MRI. Proc Natl Acad Sci U S A, 99(7), 1–5.
Schliebs, R., & Arendt, T. (2006). The significance of the cholinergic system in the brain during aging and in Alzheimer’s disease. Journal of Neural Transmission (Vienna, Austria : 1996), 113(11), 1625–44. doi:10.1007/s00702-006-0579-2
Selkoe, D. J. (1991). The Molecular of Alzheimer ’ s Pathology Disease Review. Neuron, 6, 487–498.
Shah, Y., Tangalos, E. G., & Petersen, R. C. (2000). Mild cognitive impairment. When is it a precursor to Alzheimer’s disease? Geriatrics, 55(9), 62, 65–8. Retrieved from http://www.ncbi.nlm.nih.gov/pubmed/10997127
Shaw, L. M., Vanderstichele, H., Knapik-Czajka, M., Clark, C. M., Aisen, P. S., Petersen, R. C., … Trojanowski, J. Q. (2009). Cerebrospinal fluid biomarker signature in Alzheimer’s disease neuroimaging initiative subjects. Annals of Neurology, 65(4), 403–13. doi:10.1002/ana.21610

153
Singh, V., Chertkow, H., Lerch, J. P., Evans, A. C., Dorr, A. E., & Kabani, N. J. (2006). Spatial patterns of cortical thinning in mild cognitive impairment and Alzheimer’s disease. Brain : A Journal of Neurology, 129(Pt 11), 2885–93. doi:10.1093/brain/awl256
Sloan, E. P., Fenton, G. W., & Standage, K. P. (1992). Anticholinergic drug effects on quantitative electroencephalogram, visual evoked potential, and verbal memory. Biological Psychiatry, 31(6), 600–6. Retrieved from http://www.ncbi.nlm.nih.gov/pubmed/1581439
Small, S. a. (2005). Alzheimer disease, in living color. Nature Neuroscience, 8(4), 404–5. doi:10.1038/nn0405-404
Song, X., & Wang, X. (2012). Mind wandering in Chinese daily lives--an experience sampling study. PloS One, 7(9), e44423. doi:10.1371/journal.pone.0044423
Sonuga-Barke, E. J. S., & Castellanos, F. X. (2007). Spontaneous attentional fluctuations in impaired states and pathological conditions: a neurobiological hypothesis. Neuroscience and Biobehavioral Reviews, 31(7), 977–86. doi:10.1016/j.neubiorev.2007.02.005
Sperling, R. a, Aisen, P. S., Beckett, L. a, Bennett, D. a, Craft, S., Fagan, A. M., … Phelps, C. H. (2011). Toward defining the preclinical stages of Alzheimer’s disease: recommendations from the National Institute on Aging-Alzheimer's Association workgroups on diagnostic guidelines for Alzheimer's disease. Alzheimer’s & Dementia : The Journal of the Alzheimer's Association, 7(3), 280–92. doi:10.1016/j.jalz.2011.03.003
Stam, C. J., & van Dijk, B. W. (2002). Synchronization likelihood: an unbiased measure of generalized synchronization in multivariate data sets. Physica D: Nonlinear Phenomena, 163(3-4), 236–251. doi:10.1016/S0167-2789(01)00386-4
Stam, C. J., van der Made, Y., Pijnenburg, Y. A. L., & Scheltens, P. (2003). EEG synchronization in mild cognitive impairment and Alzheimer’s disease. Acta Neurologica Scandinavica, 108(2), 90–6. Retrieved from http://www.ncbi.nlm.nih.gov/pubmed/12859284
Stam, C. J., Jones, B. F., Manshanden, I., van Cappellen van Walsum, a M., Montez, T., Verbunt, J. P. a, … Scheltens, P. (2006). Magnetoencephalographic evaluation of resting-state functional connectivity in Alzheimer’s disease. NeuroImage, 32(3), 1335–44. doi:10.1016/j.neuroimage.2006.05.033
Stam, C. J., de Haan, W., Daffertshofer, a, Jones, B. F., Manshanden, I., van Cappellen van Walsum, a M., … Scheltens, P. (2009). Graph theoretical analysis of magnetoencephalographic functional connectivity in Alzheimer’s disease. Brain : A Journal of Neurology, 132(Pt 1), 213–24. doi:10.1093/brain/awn262
Stam, C. J., & Straaten, E. C. W. Van. (2012). Clinical Neurophysiology The organization of physiological brain networks. CLINICAL NEUROPHYSIOLOGY. doi:10.1016/j.clinph.2012.01.011
Steriade, M. (2001). Impact of network activities on neuronal properties in corticothalamic systems. Journal of Neurophysiology, 86(1), 1–39. Retrieved from http://www.ncbi.nlm.nih.gov/pubmed/11431485

154
Tabert, M. H., Manly, J. J., Liu, X., Pelton, G. H., Rosenblum, S., Jacobs, M., … Devanand, D. P. (2006). Neuropsychological prediction of conversion to Alzheimer disease in patients with mild cognitive impairment. Archives of General Psychiatry, 63(8), 916–24. doi:10.1001/archpsyc.63.8.916
Tao, H.-Y., & Tian, X. (2005). Coherence Characteristics of Gamma-band EEG during rest and cognitive task in MCI and AD. Conference Proceedings : ... Annual International Conference of the IEEE Engineering in Medicine and Biology Society. IEEE Engineering in Medicine and Biology Society. Conference, 3, 2747–50. doi:10.1109/IEMBS.2005.1617040
Tatsuoka, C., Tseng, H., Jaeger, J., Varadi, F., Smith, M. a, Yamada, T., … Lerner, A. J. (2013). Modeling the heterogeneity in risk of progression to Alzheimer’s disease across cognitive profiles in mild cognitive impairment. Alzheimer’s Research & Therapy, 5(2), 14. doi:10.1186/alzrt168
Taulu, S., & Kajola, M. (2005). Presentation of electromagnetic multichannel data: The signal space separation method. Journal of Applied Physics, 97(12), 124905. doi:10.1063/1.1935742
Taulu, S., & Simola, J. (2006). Spatiotemporal signal space separation method for rejecting nearby interference in MEG measurements. Physics in Medicine and Biology, 51, 1759–1768. doi:10.1088/0031-9155/51/7/008
Tononi, G., Sporns, O., & Edelman, G. M. (1994). A measure for brain complexity: relating functional segregation and integration in the nervous system. Proceedings of the National Academy of Sciences of the United States of America, 91(11), 5033–7. Retrieved from http://www.pubmedcentral.nih.gov/articlerender.fcgi?artid=43925&tool=pmcentrez&rendertype=abstract
Uhlhaas, P. J., Pantel, J., Lanfermann, H., Prvulovic, D., Haenschel, C., Maurer, K., & Linden, D. E. J. (2008). Visual perceptual organization deficits in Alzheimer’s dementia. Dementia and Geriatric Cognitive Disorders, 25(5), 465–75. doi:10.1159/000125671
Van der Hiele, K., Vein, a a, Reijntjes, R. H. a M., Westendorp, R. G. J., Bollen, E. L. E. M., van Buchem, M. a, … Middelkoop, H. a M. (2007). EEG correlates in the spectrum of cognitive decline. Clinical Neurophysiology : Official Journal of the International Federation of Clinical Neurophysiology, 118(9), 1931–9. doi:10.1016/j.clinph.2007.05.070
Van Deursen, J. a, Vuurman, E. F. P. M., Verhey, F. R. J., van Kranen-Mastenbroek, V. H. J. M., & Riedel, W. J. (2008). Increased EEG gamma band activity in Alzheimer’s disease and mild cognitive impairment. Journal of Neural Transmission (Vienna, Austria : 1996), 115(9), 1301–11. doi:10.1007/s00702-008-0083-y
Van Veen, B. D., van Drongelen, W., Yuchtman, M., & Suzuki, A. (1997). Localization of brain electrical activity via linearly constrained minimum variance spatial filtering. IEEE Transactions on Bio-Medical Engineering, 44, 867–880. doi:10.1109/10.623056
Varela, F., Lachaux, J., Rodriguez, E., & Martinerie, J. (2001). The brainwave_ Phase synchronization and large-scale integration. Nature Reviews. Neuroscience, 2.
155
Vestberg, S., Passant, U., & Elfgren, C. (2009). Stability in the clinical characteristics of patients with memory complaints. Archives of Gerontology and Geriatrics, 50(3), e26–30. doi:10.1016/j.archger.2009.04.018
Villa, A. E., Tetko, I. V, Dutoit, P., & Vantini, G. (n.d.). Non-linear cortico-cortical interactions modulated by cholinergic afferences from the rat basal forebrain. Bio Systems, 58(1-3), 219–28. Retrieved from http://www.ncbi.nlm.nih.gov/pubmed/11164650
Warrington, E., & James, M. (1991). The Visual Object and Space Perception Battery. Bury St. Edmunds, UK: Thames Valley Test Company.
Wechsler, D. (1987). Wechsler Memory Scale-Revised (Manual) (The Psycho.). San Antonio.
Wermke, M., Sorg, C., Wohlschläger, A. M., & Drzezga, A. (2008). A new integrative model of cerebral activation, deactivation and default mode function in Alzheimer’s disease. European Journal of Nuclear Medicine and Molecular Imaging, 35 Suppl 1, S12–24. doi:10.1007/s00259-007-0698-5
Whitwell, J. L., Petersen, R. C., Negash, S., Stephen, D., Kantarci, K., Ivnik, R. J., … Jr, C. R. J. (2007). Patterns of Atrophy differ among Specific Subtypes of Mild Cognitive Impairment. Archives of Neurology, 64(8), 1130–1138. doi:10.1001/archneur.64.8.1130.Patterns
Winblad, B., Palmer, K., Kivipelto, M., Jelic, V., Fratiglioni, L., Wahlund, L.-O., … Petersen, R. C. (2004). Mild cognitive impairment--beyond controversies, towards a consensus: report of the International Working Group on Mild Cognitive Impairment. Journal of Internal Medicine, 256(3), 240–6. doi:10.1111/j.1365-2796.2004.01380.x
Wolk, D. A., Price, J. C., Saxton, J. A., Snitz, B. E., James, J. A., Lopez, O. L., … Dekosky, S. T. (2009). Amyloid imaging in mild cognitive impairment subtypes. Annals of Neurology, 65(5), 557–568. doi:10.1002/ana.21598.Amyloid
Yener, G. G., Kurt, P., Emek-Savaş, D. D., Güntekin, B., & Başar, E. (2013). Reduced visual event-related delta oscillatory responses in amnestic mild cognitive impairment. Journal of Alzheimer’s Disease : JAD, 37(4), 759–67. doi:10.3233/JAD-130569
Yesavage, J. A., Brink, T. L., Rose, T. L., Lum, O., Huang, V., Adey, M., & Leirer, V. O. (1982). Development and validation of a geriatric depression screening scale: a preliminary report. Journal of Psychiatric Research, 17(1), 37–49. Retrieved from http://www.ncbi.nlm.nih.gov/pubmed/7183759
Zamarian, L., Semenza, C., Domahs, F., Benke, T., & Delazer, M. (2007a). Alzheimer’s disease and mild cognitive impairment: effects of shifting and interference in simple arithmetic. Journal of the Neurological Sciences, 263(1-2), 79–88. doi:10.1016/j.jns.2007.06.005
Zamarian, L., Stadelmann, E., Nürk, H.-C., Gamboz, N., Marksteiner, J., & Delazer, M. (2007b). Effects of age and mild cognitive impairment on direct and indirect access to arithmetic knowledge. Neuropsychologia, 45(7), 1511–21. doi:10.1016/j.neuropsychologia.2006.11.012

156
Zamrini, E., Maestu, F., Pekkonen, E., Funke, M., Makela, J., Riley, M., … Becker, J. T. (2011). Magnetoencephalography as a putative biomarker for Alzheimer’s disease. International Journal of Alzheimer’s Disease, 2011, 280289. doi:10.4061/2011/280289
Zarahn, E., Rakitin, B., Abela, D., Flynn, J., & Stern, Y. (2007). Age-related changes in brain activation during a delayed item recognition task. Neurobiology of Aging, 28(5), 784–98. doi:10.1016/j.neurobiolaging.2006.03.002
Zhang, H., Sachdev, P. S., Wen, W., Kochan, N. a, Crawford, J. D., Brodaty, H., … Trollor, J. N. (2012). Gray matter atrophy patterns of mild cognitive impairment subtypes. Journal of the Neurological Sciences, 315(1-2), 26–32. doi:10.1016/j.jns.2011.12.011
Zheng, L., Jiang, Z., & Yu, E. (2007a). Alpha spectral power and coherence in the patients with mild cognitive impairment during a three-level working memory task. Journal of Zhejiang University. Science. B, 8(8), 584–92. doi:10.1631/jzus.2007.B0584
Zheng, L., Jiang, Z., & Yu, E. (2007b). Alpha spectral power and coherence in the patients with mild cognitive impairment during a three-level working memory task. Journal of Zhejiang University. Science. B, 8(8), 584–92. doi:10.1631/jzus.2007.B0584
Zimmerman, J., Thiene, P., & Harding, J. (1970). Design and operation of stable or biased superconducting point contact, quantum devices and a note on the properties of perfectly clean metal contacts. J Appl Phys, 41, 157280.

157
ANNEXES


