Harley-Davidson SCREAMIN` EAGLE Harley Davidson ... - evedevil
UNITED STATESSECURITIES AND EXCHANGE COMMISSION
WASHINGTON, D. C. 20549
FORM 10-Ký ANNUAL REPORT PURSUANT TO SECTION 13 OR 15(d) OF THE SECURITIES
EXCHANGE ACT OF 1934 For the fiscal year ended: December 31, 2016
¨ TRANSITION REPORT PURSUANT TO SECTION 13 OR 15(d) OF THE SECURITIESEXCHANGE ACT OF 1934
For the transition period from to Commission file number 1-9183
Harley-Davidson, Inc.(Exact name of registrant as specified in its charter)
Wisconsin 39-1382325(State of organization) (I.R.S. Employer Identification No.)
3700 West Juneau AvenueMilwaukee, Wisconsin 53208
(Address of principal executive offices) (Zip code)
Registrants telephone number: (414) 342-4680
Securities registered pursuant to Section 12(b) of the Act:
Title of each class Name of each exchange on which registeredCOMMON STOCK, $.01 PAR VALUE PER SHARE NEW YORK STOCK EXCHANGE
Securities registered pursuant to Section 12(g) of the Act: NONEIndicate by check mark whether the registrant is a well-known seasoned issuer, as defined in Rule 405 of the Securities
Act. Yes ý No ¨Indicate by check mark if the registrant is not required to file reports pursuant to Section 13 or Section 15(d) of the Act.
Yes ¨ No ýIndicate by check mark whether the registrant (1) has filed all reports required to be filed by Section 13 or 15(d) of the Securities
Exchange Act of 1934 during the preceding 12 months and (2) has been subject to such requirements for the past 90 days. Yes ý No ¨Indicate by check mark whether the registrant has submitted electronically and posted on its corporate Web site, if any, every
Interactive Data File required to be submitted and posted pursuant to Rule 405 of Regulation S-T (232.405 of this chapter) during thepreceding 12 months (or for such shorter period that the registrant was required to submit and post such files). Yes ý No ¨
Indicate by check mark if disclosure of delinquent filers pursuant to Item 405 of Regulation S-K is not contained herein, and will notbe contained, to the best of the registrant’s knowledge, in definitive proxy or information statements incorporated by reference in Part III ofthis Form 10-K or any amendment to this Form 10-K. ý
Indicate by check mark whether the registrant is a large accelerated filer, an accelerated filer, a non-accelerated filer, or a smallerreporting company as defined in Rule 12b-2 of the Exchange Act (check one).
Large accelerated filer ý Accelerated filer ¨Non-accelerated filer ¨ Smaller reporting company ¨
Indicate by check mark whether the registrant is a shell company, as defined in Rule 12b-2 of the Exchange Act. Yes ¨ No ýAggregate market value of the voting stock held by non-affiliates of the registrant at June 26, 2016: $7,779,258,895Number of shares of the registrant’s common stock outstanding at January 27, 2017: 176,343,189 shares
Documents Incorporated by ReferencePart III of this report incorporates information by reference from registrant’s Proxy Statement for the annual meeting of its shareholders
to be held on April 29, 2017.
Harley-Davidson, Inc.
Form 10-K
For The Year Ended December 31, 2016
Page
Part I
Item 1. Business 3Item 1A. Risk Factors 10Item 1B. Unresolved Staff Comments 17Item 2. Properties 17Item 3. Legal Proceedings 18Item 4. Mine Safety Disclosures 19
Part II
Item 5.Market for Registrant’s Common Equity, Related Stockholder Matters and Issuer Purchases ofEquity Securities 19
Item 6. Selected Financial Data 21Item 7. Management’s Discussion and Analysis of Financial Condition and Results of Operations 23Item 7A. Quantitative and Qualitative Disclosures about Market Risk 46Item 8. Consolidated Financial Statements and Supplementary Data 47Item 9. Changes in and Disagreements With Accountants on Accounting and Financial Disclosure 110Item 9A. Controls and Procedures 110
Part III
Item 10. Directors, Executive Officers and Corporate Governance 111Item 11. Executive Compensation 111
Item 12.Security Ownership of Certain Beneficial Owners and Management and Related StockholderMatters 111
Item 13. Certain Relationships and Related Transactions, and Director Independence 112Item 14. Principal Accountant Fees and Services 112
Part IV
Item 15. Exhibits and Financial Statements Schedules 113
Signatures 115
2

PART I
Note regarding forward-looking statements(1)
The Company intends that certain matters discussed by the Company are “forward-looking statements” intended toqualify for the safe harbor from liability established by the Private Securities Litigation Reform Act of 1995. These forward-looking statements can generally be identified as such because the context statement will include words such as the Company“believes,” “anticipates,” “expects,” “plans,” “estimates,” or words of similar meaning. Similarly, statements that describefuture plans, objectives, outlooks, targets, guidance or goals are also forward-looking statements. Such forward-lookingstatements are subject to certain risks and uncertainties that could cause actual results to differ materially from those anticipatedas of the date of this report. Certain of such risks and uncertainties are described in close proximity to such statements orelsewhere in this report, including under the caption “Risk Factors” in Item 1A of this report and under “CautionaryStatements” in Item 7 of this report. Shareholders, potential investors, and other readers are urged to consider these factors inevaluating the forward-looking statements and cautioned not to place undue reliance on such forward-looking statements. Theforward-looking statements included in the Overview and Outlook section of Management's Discussion and Analysis ofFinancial Condition and Results of Operations are only made as of January 31, 2017 and the remaining forward-lookingstatements in this report are made as of the date indicated or, if a date is not indicated, as of the date of the filing of this report(February 21, 2017), and the Company disclaims any obligation to publicly update such forward-looking statements to reflectsubsequent events or circumstances.
Item 1. Business
General
Harley-Davidson Motor Company was founded in 1903. Harley-Davidson, Inc. was incorporated in 1981, at which timeit purchased the Harley-Davidson® motorcycle business from AMF Incorporated in a management buyout. In 1986, Harley-Davidson, Inc. became publicly held. Unless the context otherwise requires, all references to the “Company” include Harley-Davidson, Inc. and all of its subsidiaries. Harley-Davidson, Inc. is the parent company for the groups of companies doingbusiness as Harley-Davidson Motor Company (HDMC) and Harley-Davidson Financial Services (HDFS).
Segments
The Company operates in two reportable segments: the Motorcycles & Related Products (Motorcycles) segment and theFinancial Services segment. While the two segments are strategic business units that offer different products and services andare managed separately based on the fundamental differences in their operations, the two segments work closely together asdescribed below.
The Motorcycles segment consists of HDMC which designs, manufactures and sells at wholesale on-road Harley-Davidson motorcycles as well as motorcycle parts, accessories, general merchandise and related services. The Company’sproducts are sold to retail customers through a network of independent dealers. The Company conducts business on a globalbasis, with sales in the United States, Canada, Latin America, Europe/Middle East/Africa (EMEA) and the Asia Pacific region.
The Financial Services segment consists of HDFS which provides wholesale and retail financing and insurance andinsurance-related programs primarily to Harley-Davidson dealers and their retail customers. HDFS conducts businessprincipally in the United States and Canada.
See Note 19 of the Notes to Consolidated Financial Statements for financial information related to the Company’sreportable segments and revenue by geographic area.
Motorcycles and Related Products Segment
The primary business of the Motorcycles segment is to design, manufacture and sell at wholesale on-road Harley-Davidson motorcycles as well as motorcycle parts, accessories, general merchandise and other related products and services.
The following table includes the percent of total revenue by product line for the Motorcycles and Related Productssegment:
3

2016 2015 2014
Motorcycles 78.2% 77.8% 78.8%Parts & Accessories 16.0% 16.2% 15.7%General Merchandise 5.4% 5.5% 5.1%Other 0.4% 0.5% 0.4%
100.0% 100.0% 100.0%
Motorcycles - The Company manufactures and sells at wholesale cruiser and touring motorcycles that feature classicstyling, innovative design, distinctive sound, and superior quality with the ability to customize. Harley-Davidson motorcyclesgenerally have engines with displacements that are greater than 601cc's, up to a maximum displacement of 1868cc's.
The Company's motorcycles compete in the cruiser and touring categories of the market which were pioneered by theCompany. The total on-road motorcycle market is comprised of the following categories:
• Cruiser (emphasizes styling and owner customization);• Touring (emphasizes rider comfort and load capacity and incorporates features such as fairings and luggage
compartments);• Standard (a basic motorcycle which usually features upright seating for one or two passengers);• Sportbike (incorporates racing technology, aerodynamic styling, low handlebars with a “sport” riding position and
high performance tires); and• Dual (designed with the capability for use on public roads as well as for some off-highway recreational use).
Competition in the motorcycle markets in which the Company competes is based upon a number of factors, includingproduct capabilities and features, styling, price, quality, reliability, warranty, availability of financing, and quality of dealernetwork. The Company believes its motorcycles continue to generally command a premium price at retail relative tocompetitors’ motorcycles. The Company emphasizes remarkable styling, customization, innovation, sound, quality, andreliability in its products and generally offers a two-year warranty for its motorcycles. The Company considers the availabilityof a line of motorcycle parts and accessories and general merchandise, the availability of financing through HDFS and itsglobal network of premium dealers to be competitive advantages.
In 2016, the U.S. and European markets accounted for approximately 77% of the total annual independent dealer retailsales of new Harley-Davidson motorcycles. The most significant other markets for the Company, based on the Company's 2016retail sales data, are Australia, Japan and Canada.
Harley-Davidson has been the historical market share leader in the U.S. 601+cc portion of the motorcycle market.According to the Motorcycle Industry Council (MIC), the cruiser and touring categories accounted for approximately 75% oftotal 2016 601+cc retail unit registrations in the U.S. During 2016, the 601+cc portion of the market represented approximately84% of the total U.S. motorcycle market in terms of new units registered.
The following chart includes U.S. retail registration data for 601+cc motorcycles for the years 2014 through 2016:
U.S. Motorcycle Registration Data(a)(b)
601+cc (Units in thousands)
2016 2015 2014
Total new motorcycle registrations 311.7 328.8 313.6Harley-Davidson new registrations 159.5 165.1 167.1
51.2% 50.2% 53.3%
(a) Data includes on-road 601+cc models. On-road 601+cc models include dual purpose models, three-wheeled vehicles andautocycles. Registration data for Harley-Davidson Street® 500 motorcycles is not included in this table.
(b) U.S. industry data is derived from information provided by the Motorcycle Industry Council (MIC). This third party datais subject to revision and update. The retail registration data for Harley-Davidson motorcycles presented in this table willdiffer from the Harley-Davidson retail sales data presented in Item 7 of this report. The Company’s source for retail salesdata in Item 7 of this report is sales and warranty registrations provided by Harley-Davidson dealers as compiled by theCompany. The retail sales data in Item 7 includes sales of Street 500 motorcycles which are excluded from the 601+ccunits included in the retail registration data in this table. In addition, small differences may arise related to the timing ofdata submissions to the independent sources.
4

The European 601+cc motorcycle market is slightly larger than the U.S. market and customer preferences differ fromthose of U.S. customers. The touring and cruiser category represented approximately 53% of the European 601+cc market in2016 compared to approximately 75% of the 601+ cc market in the U.S.
The following chart includes European retail registration data for 601+cc motorcycles for the years 2014 through 2016:
European Motorcycle Registration Data(a)(b)
601+cc (Units in thousands)
2016 2015 2014
Total new motorcycle registrations 391.9 351.8 319.8Harley-Davidson new registrations 42.3 37.0 38.5
10.8% 10.5% 12.0%
(a) On-road 601+cc models include dual purpose models, three-wheeled vehicles and, beginning in 2015, autocycles.Registration data for Harley-Davidson Street® 500 motorcycles is not included in this table.
(b) Europe data includes retail sales in Austria, Belgium, Denmark, Finland, France, Germany, Greece, Italy, Luxembourg,Netherlands, Norway, Portugal, Spain, Sweden, Switzerland, and the United Kingdom. Industry retail motorcycleregistration data is derived from information provided by the Association des Constructeurs Europeens de Motocycles(ACEM), an independent agency. This third party data is subject to revision and update. The retail registration data forHarley-Davidson motorcycles presented in this table will differ from the Harley-Davidson retail sales data presented inItem 7 of this report. The Company’s source for retail sales data in Item 7 of this report is sales and warranty registrationsprovided by Harley-Davidson dealers as compiled by the Company. The retail sales data in Item 7 includes sales of Street500 motorcycles which are excluded from the 601+cc units included in the retail registration data in this table. Inaddition, some differences may arise related to the timing of data submissions to the independent sources.
Parts and Accessories (P&A) and General Merchandise – The Company offers a complete line of Harley-Davidson P&Aand General Merchandise. P&A products are comprised of replacement parts (Genuine Motor Parts) and mechanical andcosmetic accessories (Genuine Motor Accessories). General Merchandise includes MotorClothes® apparel and riding gear.
Licensing – The Company creates an awareness of the Harley-Davidson brand among its customers and the non-ridingpublic through a wide range of products for enthusiasts by licensing the name “Harley-Davidson” and other trademarks ownedby the Company. Royalty revenues from licensing, included in Motorcycles revenue, were $38.1 million, $46.5 million and$47.1 million in 2016, 2015 and 2014, respectively.
Other Products and Services – The Company provides a variety of services to its independent dealers includingmotorcycle service and business management training programs and customized dealer software packages.
Patents and Trademarks – The Company strategically manages its portfolio of patents, trade secrets, copyrights,trademarks and other intellectual property.
The Company and its subsidiaries own, and continue to obtain, patent rights that relate to its motorcycles and relatedproducts and processes for their production. Certain technology-related intellectual property is also protected, whereappropriate, by license agreements, confidentiality agreements or other agreements with suppliers, employees and other thirdparties. The Company diligently protects its intellectual property, including patents and trade secrets, and its rights toinnovative and proprietary technology and designs. This protection, including enforcement, is important as the Company movesforward with investments in new products, designs and technologies. While the Company believes patents are important to itsbusiness operations and in the aggregate constitute a valuable asset, the success of the business is not dependent on any onepatent or group of patents. The Company’s active patent portfolio has an average age for patents of approximately seven and ahalf years. A patent review committee manages the patent strategy and portfolio of the Company.
Trademarks are important to the Company’s motorcycle business and licensing activities. The Company has a vigorousworldwide program of trademark registration and enforcement to maintain and strengthen the value of the trademarks andprevent the unauthorized use of those trademarks. The HARLEY-DAVIDSON trademark and the Bar and Shield trademark areeach highly recognizable to the public and are very valuable assets. Additionally, the Company uses numerous othertrademarks, trade names and logos which are registered worldwide. The following are among the Company’s trademarks:HARLEY-DAVIDSON, H-D, HARLEY, the Bar & Shield Logo, MOTORCLOTHES, the MotorClothes Logo, HARLEYOWNERS GROUP, H.O.G., the H.O.G. Logo, SOFTAIL, SPORTSTER and V-ROD. The HARLEY-DAVIDSON trademarkhas been used since 1903 and the Bar and Shield trademark since at least 1910. Substantially all of the Company’s trademarks
5
are owned by H-D U.S.A., LLC, a subsidiary of the Company, which also manages the Company’s trademark strategy andportfolio.
Customers – Harley-Davidson appeals to a diverse range of customers across multiple demographics both in the U.S. andworldwide.
U.S. retail purchasers of new Harley-Davidson motorcycles include both core and outreach customers. The Companydefines its U.S. core customers as Caucasian men over the age of 35 and its U.S. outreach customers as women (Caucasian, age35+), young adults (ages 18-34), African-American adults (age 35+), and Latino adults (age 35+). In 2015 (which is the mostrecent data available), for the eighth straight year the Company was the market share leader in U.S. new motorcycleregistrations (all cc's) within its core-customer segment and in each outreach customer segment. (Based on the Company'sanalysis of Polk new motorcycle registration data from IHS Automotive.)
Outside the U.S., the Company's definition of core and outreach customers varies depending on the profile of itscustomers in each market. In general, the Company defines it core customers outside the U.S. as men over the age of 35 and itsoutreach customers outside the U.S. as women and young adults.
Marketing and Customer Experiences – The Company’s products are marketed to retail customers worldwide primarilythrough digital and experiential activities as well as through more traditional promotional and advertising activities.Additionally, the Company's independent dealers engage in a wide range of local marketing and experiential activitiessupported by cooperative programs with the Company.
Customer experiences have traditionally been at the center of much of the Company’s marketing. To attract customersand achieve its goals, the Company participates in motorcycle rallies around the world and also in major motorcycle consumershows, racing activities, music festivals, mixed martial arts activities and other special promotional events.
The Company's Harley-Davidson® Riding Academy offers a series of rider education experiences that provide both newand experienced riders with deeper engagement in the sport of motorcycling by teaching basic and advanced motorcyclingskills and knowledge. Since its inception, the program has trained more than 510,000 riders. The courses are conducted by anetwork of participating Harley-Davidson dealerships in the U.S., Canada, China, Mexico and Brazil, enabling students toexperience the Harley-Davidson lifestyle, environment, people and products as they learn.
One of the ways the Company promotes its Harley-Davidson products and the related lifestyle is through the HarleyOwners Group (H.O.G.®), which has approximately 1 million members worldwide and is the industry’s largest company-sponsored motorcycle enthusiast organization. H.O.G.® also sponsors many motorcycle events, including rallies and rides forHarley-Davidson motorcycle enthusiasts throughout the world.
The Harley-Davidson Authorized Tours program allows motorcyclists/enthusiasts to experience riding opportunitiesworldwide. Riders can also rent Harley-Davidson motorcycles worldwide from participating dealers through the Company’sAuthorized Rentals Program.
The Company operates the Harley-Davidson Museum (Museum) in Milwaukee, Wisconsin. The Museum is a uniquedestination that the Company believes builds and strengthens bonds between riders and Harley-Davidson and enhances theHarley-Davidson brand among the public at large.
Distribution – The Company’s products are retailed through a network of independent dealers, of which the majority sellHarley-Davidson motorcycles exclusively. These dealerships stock and sell the Company’s motorcycles, P&A, generalmerchandise and licensed products, and perform service on Harley-Davidson motorcycles. The Company believes the qualityretail experience that its independent dealers provide is a differentiating and strategic advantage for the Company.
P&A, general merchandise and licensed products are also retailed through eCommerce channels in certain markets. In theU.S., the eCommerce model is facilitated by the Company through participating authorized U.S. Harley-Davidson dealers. InChina and India, the eCommerce sites are operated by third-parties.
6
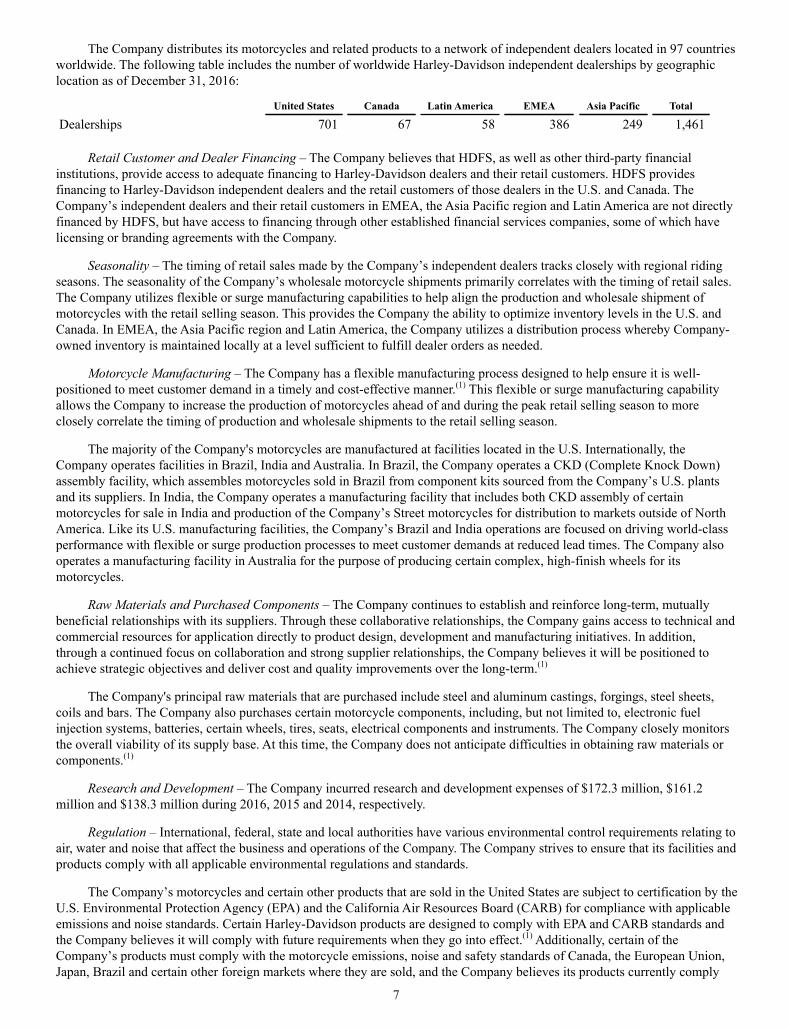
The Company distributes its motorcycles and related products to a network of independent dealers located in 97 countriesworldwide. The following table includes the number of worldwide Harley-Davidson independent dealerships by geographiclocation as of December 31, 2016:
United States Canada Latin America EMEA Asia Pacific Total
Dealerships 701 67 58 386 249 1,461
Retail Customer and Dealer Financing – The Company believes that HDFS, as well as other third-party financialinstitutions, provide access to adequate financing to Harley-Davidson dealers and their retail customers. HDFS providesfinancing to Harley-Davidson independent dealers and the retail customers of those dealers in the U.S. and Canada. TheCompany’s independent dealers and their retail customers in EMEA, the Asia Pacific region and Latin America are not directlyfinanced by HDFS, but have access to financing through other established financial services companies, some of which havelicensing or branding agreements with the Company.
Seasonality – The timing of retail sales made by the Company’s independent dealers tracks closely with regional ridingseasons. The seasonality of the Company’s wholesale motorcycle shipments primarily correlates with the timing of retail sales.The Company utilizes flexible or surge manufacturing capabilities to help align the production and wholesale shipment ofmotorcycles with the retail selling season. This provides the Company the ability to optimize inventory levels in the U.S. andCanada. In EMEA, the Asia Pacific region and Latin America, the Company utilizes a distribution process whereby Company-owned inventory is maintained locally at a level sufficient to fulfill dealer orders as needed.
Motorcycle Manufacturing – The Company has a flexible manufacturing process designed to help ensure it is well-positioned to meet customer demand in a timely and cost-effective manner.(1) This flexible or surge manufacturing capabilityallows the Company to increase the production of motorcycles ahead of and during the peak retail selling season to moreclosely correlate the timing of production and wholesale shipments to the retail selling season.
The majority of the Company's motorcycles are manufactured at facilities located in the U.S. Internationally, theCompany operates facilities in Brazil, India and Australia. In Brazil, the Company operates a CKD (Complete Knock Down)assembly facility, which assembles motorcycles sold in Brazil from component kits sourced from the Company’s U.S. plantsand its suppliers. In India, the Company operates a manufacturing facility that includes both CKD assembly of certainmotorcycles for sale in India and production of the Company’s Street motorcycles for distribution to markets outside of NorthAmerica. Like its U.S. manufacturing facilities, the Company’s Brazil and India operations are focused on driving world-classperformance with flexible or surge production processes to meet customer demands at reduced lead times. The Company alsooperates a manufacturing facility in Australia for the purpose of producing certain complex, high-finish wheels for itsmotorcycles.
Raw Materials and Purchased Components – The Company continues to establish and reinforce long-term, mutuallybeneficial relationships with its suppliers. Through these collaborative relationships, the Company gains access to technical andcommercial resources for application directly to product design, development and manufacturing initiatives. In addition,through a continued focus on collaboration and strong supplier relationships, the Company believes it will be positioned toachieve strategic objectives and deliver cost and quality improvements over the long-term.(1)
The Company's principal raw materials that are purchased include steel and aluminum castings, forgings, steel sheets,coils and bars. The Company also purchases certain motorcycle components, including, but not limited to, electronic fuelinjection systems, batteries, certain wheels, tires, seats, electrical components and instruments. The Company closely monitorsthe overall viability of its supply base. At this time, the Company does not anticipate difficulties in obtaining raw materials orcomponents.(1)
Research and Development – The Company incurred research and development expenses of $172.3 million, $161.2million and $138.3 million during 2016, 2015 and 2014, respectively.
Regulation – International, federal, state and local authorities have various environmental control requirements relating toair, water and noise that affect the business and operations of the Company. The Company strives to ensure that its facilities andproducts comply with all applicable environmental regulations and standards.
The Company’s motorcycles and certain other products that are sold in the United States are subject to certification by theU.S. Environmental Protection Agency (EPA) and the California Air Resources Board (CARB) for compliance with applicableemissions and noise standards. Certain Harley-Davidson products are designed to comply with EPA and CARB standards andthe Company believes it will comply with future requirements when they go into effect.(1) Additionally, certain of theCompany’s products must comply with the motorcycle emissions, noise and safety standards of Canada, the European Union,Japan, Brazil and certain other foreign markets where they are sold, and the Company believes its products currently comply
7

with those standards. Because the Company expects that environmental standards will become more stringent over time, theCompany will continue to incur research, development and production costs in this area for the foreseeable future.(1)
The Company, as a manufacturer of motorcycle products, is subject to the U.S. National Traffic and Motor Vehicle SafetyAct, which is administered by the U.S. National Highway Traffic Safety Administration (NHTSA). The Company has certifiedto NHTSA that certain of its motorcycle products comply fully with all applicable federal motor vehicle safety standards andrelated regulations. The Company has from time to time initiated certain voluntary recalls. During the last three years, theCompany has initiated 24 voluntary recalls related to Harley-Davidson motorcycles at a total cost of $77.3 million. TheCompany reserves for all estimated costs associated with recalls in the period that management approves and commits to therecall.
Employees – As of December 31, 2016, the Motorcycles segment had approximately 5,400 employees.
Approximately 2,300 unionized employees at the U.S. manufacturing facilities are represented as follows:• York, Pennsylvania - represented by International Association of Machinist and Aerospace Workers (IAM), and the
collective bargaining agreement will expire on October 15, 2022 • Kansas City, Missouri - represented by United Steelworkers of America (USW) and IAM, and the respective collective
bargaining agreements will expire on July 31, 2018• Milwaukee, Wisconsin - represented by USW and IAM, and the respective collective bargaining agreements will
expire on March 31, 2019• Tomahawk, Wisconsin - represented by USW, and the collective bargaining agreement will expire on March 31, 2019
Financial Services Segment
HDFS is engaged in the business of financing and servicing wholesale inventory receivables and retail consumer loans,primarily for the purchase of Harley-Davidson motorcycles. HDFS is an agent for certain unaffiliated insurance companiesproviding motorcycle insurance and protection products to motorcycle owners. HDFS conducts business principally in the U.S.and Canada. The Company’s independent dealers and their retail customers in EMEA, Asia Pacific and Latin America are notfinanced by HDFS, but have access to financing through other third-party financial institutions, some of which have licensingor branding agreements with the Company or HDFS.
Wholesale Financial Services – HDFS provides wholesale financial services to Harley-Davidson dealers, includingfloorplan and open account financing of motorcycles and motorcycle parts and accessories. HDFS offers wholesale financialservices to Harley-Davidson dealers in the United States and Canada, and during 2016, 100% of such dealers utilized thoseservices at some point during the year.
Retail Financial Services – HDFS provides retail financing to consumers, consisting primarily of installment lending forthe purchase of new and used Harley-Davidson motorcycles. HDFS’ retail financial services are available through most Harley-Davidson dealerships in the United States and Canada.
Insurance Services – HDFS operates as an agent for certain unaffiliated insurance companies offering point-of-saleprotection products through most Harley-Davidson dealers in both the U.S. and Canada, including motorcycle insurance,extended service contracts, credit protection and motorcycle maintenance protection. HDFS also direct-markets motorcycleinsurance and extended service contracts to owners of Harley-Davidson motorcycles. In addition, HDFS markets acomprehensive package of business insurance coverages and services to owners of Harley-Davidson dealerships.
Licensing – HDFS has licensing arrangements with third-party financial institutions that issue credit cards bearing theHarley-Davidson brand. Internationally, HDFS licenses the Harley-Davidson brand to local third-party financial institutionsthat offer products to the Company’s retail customers such as financing and insurance.
Funding – The Company believes a diversified and cost-effective funding strategy is important to meet HDFS’ goal ofproviding credit while delivering appropriate returns and profitability. Financial Services operations have been funded withunsecured debt, unsecured commercial paper, asset-backed commercial paper conduit facilities, committed unsecured bankfacilities, asset-backed securitizations and intercompany borrowings.
Competition – The Company regards its ability to offer a package of wholesale and retail financial services in the U.S.and Canada as a significant competitive advantage. Additionally, as the predominant lender to sub-prime customers for thepurchase of motorcycles in the U.S. and Canada, HDFS enables retail sales of Harley-Davidson motorcycles with veryattractive financial returns. Competitors in the financial services industry compete for business based largely on price and, to alesser extent, service. HDFS competes on convenience, service, brand association, dealer relations, industry experience, termsand price.
8

In the United States, HDFS financed 61.7% of new Harley-Davidson motorcycles retailed by independent dealers during2016, compared to 62.2% in 2015. In Canada, HDFS financed 45.3% of new Harley-Davidson motorcycles retailed byindependent dealers during 2016, compared to 39.2% in 2015. Competitors for retail motorcycle finance business are primarilybanks, credit unions and other financial institutions. In the motorcycle insurance business, competition primarily comes fromnational insurance companies and from insurance agencies serving local or regional markets. For insurance-related productssuch as extended service contracts, HDFS faces competition from certain regional and national industry participants as well asdealer in-house programs. Competition for the wholesale motorcycle finance business primarily consists of banks and otherfinancial institutions providing wholesale financing to Harley-Davidson dealers in their local markets.
Trademarks – HDFS uses various trademarks and trade names for its financial services and products which are licensedfrom H-D U.S.A., LLC, including HARLEY-DAVIDSON, H-D and the Bar & Shield logo.
Seasonality – HDFS experiences seasonal variations in retail financing activities based on the timing of regional ridingseasons in the U.S. and Canada. In general, from mid-March through August, retail financing volume is greatest. HDFSwholesale financing volume is affected by inventory levels at Harley-Davidson dealers. Although the Company's surgeproduction capabilities help reduce seasonal fluctuations in dealer inventory levels for new motorcycles, dealers generally havehigher inventory levels of new and used motorcycles in the late fall and winter than during the spring and summer ridingseason. As a result, wholesale financing volume is higher during fall and winter as compared to the rest of the year.
Regulation – The operations of HDFS (both U.S. and foreign) are subject, in certain instances, to supervision andregulation by state and federal administrative agencies and various foreign governmental authorities. Many of the requirementsimposed by such entities are in place to provide consumer protection as it pertains to the selling and servicing of financialproducts and services. Therefore, HDFS operations may be subject to limitations imposed by regulations, laws and judicial and/or administrative decisions. In the U.S. for example, applicable laws include the federal Truth-in-Lending Act, ConsumerLeasing Act, Equal Credit Opportunity Act and Fair Credit Reporting Act.
Depending on the specific facts and circumstances involved, non-compliance with these laws may result in consequencessuch as limiting the ability of HDFS to collect all or part of the principal or interest on applicable loans, entitling the borrowerto rescind the loan or to obtain a refund of amounts previously paid, or could subject HDFS to the payment of damages orpenalties and administrative sanctions, including “cease and desist” orders, and could limit the number of loans eligible forHDFS securitization programs.
The Dodd-Frank Wall Street Reform and Consumer Protection Act granted the federal Consumer Financial ProtectionBureau (CFPB) significant supervisory, enforcement, and rule-making authority in the area of consumer financial products andservices. Certain CFPB actions and regulations will directly impact HDFS and its operations. For example, the CFPB hassupervisory authority over non-bank larger participants in the vehicle financing market, which includes a non-bank subsidiaryof HDFS.
Such regulatory requirements and associated supervision also could limit the discretion of HDFS in operating itsbusiness. Noncompliance with applicable statutes or regulations could result in the suspension or revocation of any charter,license or registration at issue, as well as the imposition of civil fines, criminal penalties and administrative sanctions.
A subsidiary of HDFS, Eaglemark Savings Bank (ESB), is a Nevada state thrift chartered as an Industrial Loan Company(ILC). The activities of this subsidiary are governed by federal laws and regulations as well as State of Nevada banking laws,and are subject to examination by the Federal Deposit Insurance Corporation (FDIC) and Nevada state bank examiners. ESBoriginates retail loans and sells the loans to a non-banking subsidiary of HDFS. This process allows HDFS to offer retailproducts with many common characteristics across the United States and to similarly service loans to U.S. retail customers.
Employees – As of December 31, 2016, the Financial Services segment had approximately 600 employees.
Internet Access
The Company’s internet website address for investor relations is http://investor.harley-davidson.com/. The Companymakes available free of charge (other than an investor’s own internet access charges) through its internet website theCompany’s Annual Report on Form 10-K, quarterly reports on Form 10-Q and current reports on Form 8-K, and anyamendments to those reports, as soon as reasonably practicable after it electronically files such material with, or furnishes suchmaterial to, the United States Securities and Exchange Commission (SEC). In addition, the Company makes available, throughits website, the following corporate governance materials: (a) the Company’s Corporate Governance Policy; (b) CommitteeCharters approved by the Company’s Board of Directors for the Audit and Finance Committee, Human Resources Committee,Nominating and Corporate Governance Committee and Sustainability Committee; (c) the Company’s Financial Code of Ethics;(d) the Company’s Code of Business Conduct (the Code of Conduct) in nine languages including English; (e) the Conflict of
9

Interest Process for Directors, Executive Officers and Other Employees (the Conflict Process); (f) a list of the Company’sBoard of Directors; (g) the Company’s Bylaws; (h) the Company’s Environmental and Energy Policy; (i) the Company’s Policyfor Managing Disclosure of Material Information; (j) the Company’s Supplier Code of Conduct in four languages includingEnglish; (k) the Sustainability Strategy Report; (l) the list of compensation survey participants used as market reference pointsfor various components of compensation as reported in the Company’s Notice of Annual Meeting and Proxy Statement filedwith the SEC on March 21, 2016, which compensation relates to the Company’s named executive officers; (m) the CaliforniaTransparency in Supply Chain Act Disclosure; (n) Statement on Conflict Minerals; (o) Political Engagement and Contributions2015-2016; and (p) the Company's Clawback Policy. This information is also available from the Company upon request. TheCompany satisfies the disclosure requirements under the Code of Conduct, the Conflict Process and applicable New York StockExchange listing requirements regarding waivers of the Code of Conduct or the Conflict Process by disclosing the informationin the Company’s proxy statement for its annual meeting of shareholders or on the Company’s website. The Company is notincluding the information contained on or available through its website as a part of, or incorporating such information byreference into, this Annual Report on Form 10-K.
Item 1A. Risk Factors
An investment in Harley-Davidson, Inc. involves risks, including those discussed below. These risk factors should beconsidered carefully before deciding whether to invest in the Company.
• The Company may not be able to successfully execute its long-term business strategy. There is no assurance thatthe Company will be able to drive growth to the extent desired through its focus of efforts and resources on its long-term business strategy and the Harley-Davidson brand or to enhance productivity and profitability to the extent desiredthrough pricing and continuous improvement.
• Changes in general economic conditions, tightening of credit, political events or other factors may adverselyimpact dealers’ retail sales. The motorcycle industry is impacted by general economic conditions over whichmotorcycle manufacturers have little control. These factors can weaken the retail environment and lead to weakerdemand for discretionary purchases such as motorcycles. Weakened economic conditions in certain business sectorsand geographic areas, such as oil-dependent areas, can also result in reduced demand for the Company's products.Tightening of credit can limit the availability of funds from financial institutions and other lenders and sources ofcapital which could adversely affect the ability of retail consumers to obtain loans for the purchase of motorcyclesfrom lenders, including HDFS. Should general economic conditions or motorcycle industry demand decline, theCompany’s results of operations and financial condition may be substantially adversely affected. The motorcycleindustry can also be affected by political conditions and other factors over which motorcycle manufacturers have littlecontrol.
• The Company’s marketing strategy of appealing to and growing sales to multi-generational and multi-culturalcustomers worldwide may not continue to be successful. The Company has been successful in marketing itsproducts in large part by promoting the experience of Harley-Davidson motorcycling. To sustain and grow thebusiness over the long-term, the Company must grow the sport of motorcycling and continue to be successful sellingproducts and promoting the experience of motorcycling to a diverse set of customers. The Company must also executeits multi-generational and multi-cultural strategy without adversely impacting the strength of the brand with corecustomers. Failure to successfully drive demand for the Company's products may have a material adverse effect on theCompany's business and results of operations.
• The motorcycle industry has become increasingly competitive. Many of the Company’s competitors are morediversified than the Company, and they may compete in all segments of the motorcycle market, other powersportsmarkets and/or the automotive market. Certain competitors appear to be increasing their investment in products thatcompete with the Company's products. Also, the Company’s manufacturer’s suggested retail price for its motorcyclesis generally higher than its competitors, and as price becomes a more important competitive factor for consumers inthe markets in which the Company competes, the Company may be at a competitive disadvantage. Furthermore, manycompetitors headquartered outside the U.S. experience a financial benefit from a strengthening in the U.S. dollarrelative to their home currency that can be used to fund discounted prices to U.S. consumers. In addition, theCompany’s financial services operations face competition from various banks, insurance companies and otherfinancial institutions that may have access to additional sources of capital at more competitive rates and terms,particularly for borrowers in higher credit tiers. The Company's responses to these competitive pressures, or its failureto adequately address and respond to these competitive pressures, may have a material adverse effect on theCompany’s business and results of operations.
10

• Increased supply of and/or declining prices for used motorcycles and excess supply of new motorcycles mayadversely impact retail sales of new motorcycles by the Company’s independent dealers. The Company hasobserved that when the supply of used motorcycles increases or the prices for used Harley-Davidson motorcyclesdecline, there can be reduced demand among retail purchasers for new Harley-Davidson motorcycles (at or nearmanufacturer’s suggested retail prices). Further, the Company and its independent dealers can and do take actions thatinfluence the markets for new and used motorcycles. For example, introduction of new motorcycle models withsignificantly different functionality, technology or other customer satisfiers can result in increased supply of usedmotorcycles, which could result in declining prices for used motorcycles and prior model-year new motorcycles. Also,while the Company has taken steps designed to balance production volumes for its new motorcycles with demand,those steps may not be effective, or the Company’s competitors could choose to supply new motorcycles to the marketin excess of demand at reduced prices which could also have the effect of reducing demand for new Harley-Davidsonmotorcycles (at or near manufacturer’s suggested retail prices). Ultimately, reduced demand among retail purchasersfor new Harley-Davidson motorcycles leads to reduced shipments by the Company.
• The Company’s ability to remain competitive is dependent upon its capability to develop and successfullyintroduce new, innovative and compliant products. The motorcycle market continues to change in terms of stylingpreferences and advances in new technology and, at the same time, be subject to increasing regulations related tosafety and emissions. The Company must continue to distinguish its products from its competitors’ products withunique styling and new technologies. As the Company incorporates new and different features and technology into itsproducts, the Company must protect its intellectual property from imitators and ensure its products do not infringe theintellectual property of other companies. In addition, these new products must comply with applicable regulationsworldwide and satisfy the potential demand for products that produce lower emissions and achieve better fueleconomy. The Company must make product advancements to respond to changing consumer preferences and marketdemands while maintaining the classic look, sound and feel associated with Harley-Davidson products. The Companymust also be able to design and manufacture these products and deliver them to a global marketplace in an efficientand timely manner and at prices that are attractive to customers. There can be no assurances that the Company will besuccessful in these endeavors or that existing and prospective customers will like or want the Company’s newproducts.
• The Company sells its products at wholesale and must rely on a network of independent dealers to manage theretail distribution of its products. The Company depends on the capability of its independent dealers to develop andimplement effective retail sales plans to create demand among retail purchasers for the motorcycles and relatedproducts and services that the dealers purchase from the Company. If the Company’s independent dealers are notsuccessful in these endeavors, then the Company will be unable to maintain or grow its revenues and meet its financialexpectations. Further, independent dealers may experience difficulty in funding their day-to-day cash flow needs andpaying their obligations resulting from adverse business conditions such as weakened retail sales and tightened credit.If dealers are unsuccessful, they may exit or be forced to exit the business or, in some cases, the Company may seek toterminate relationships with certain dealerships. As a result, the Company could face additional adverse consequencesrelated to the termination of dealer relationships. Additionally, liquidating a former dealer’s inventory of new and usedmotorcycles can add downward pressure on new and used motorcycle prices. Further, the unplanned loss of any of theCompany’s independent dealers may lead to inadequate market coverage for retail sales of new motorcycles and forservicing previously sold motorcycles, create negative impressions of the Company with its retail customers, andadversely impact the Company’s ability to collect wholesale receivables that are associated with that dealer.
• A cybersecurity breach may adversely affect the Company’s reputation, revenue and earnings. The Companyand certain of its third-party service providers and vendors receive, store, and transmit digital personal information inconnection with the Company’s human resources operations, financial services operations, e-commerce, the HarleyOwners Group, dealer management, and other aspects of its business. The Company’s information systems, and thoseof its third-party service providers and vendors, are vulnerable to the increasing threat of continually evolvingcybersecurity risks. Unauthorized parties have attempted to and may attempt in the future to gain access to thesesystems or the information the Company and its third-party service providers and vendors maintain and use throughfraud or other means of deceiving our employees and third-party service providers and vendors. Hardware, software orapplications the Company develops or obtains from third-parties may contain defects in design or manufacture or otherproblems that could unexpectedly compromise information security and/or the Company’s operations. The methodsused to obtain unauthorized access, disable or degrade service or sabotage systems are constantly evolving and may bedifficult to anticipate or detect. The Company has implemented and regularly reviews and updates processes andprocedures to protect against unauthorized access to or use of secured data and to prevent data loss. However, the ever-evolving threats mean the Company and third-party service providers and vendors must continually evaluate and adaptsystems and processes, and there is no guarantee that they will be adequate to safeguard against all data security
11

breaches or misuses of data. The Company has experienced information security attacks, but to date they have notcompromised the Company’s computing environment or resulted in a material impact on the Company’s business oroperations or the release of confidential information about employees, customers, dealers, suppliers or other thirdparties. Any future significant compromise or breach of the Company’s data security, whether external or internal, ormisuse of customer, employee, dealer, supplier or Company data could result in disruption to the Company’soperations, significant costs, lost sales, fines and lawsuits, and/or damage to the Company’s reputation. In addition, asthe regulatory environment related to information security, data collection and use, and privacy becomes increasinglyrigorous, with new and evolving requirements, compliance could also result in the Company being required to incuradditional costs.
• The Company is exposed to market risk from changes in foreign exchange rates, commodity prices and interestrates. The Company sells its products internationally and in most markets those sales are made in the foreigncountry’s local currency. As a result, a weakening in those foreign currencies relative to the U.S. dollar can adverselyaffect the Company's revenue and margin, and cause volatility in results of operations. The Company is also subject torisks associated with changes in prices of commodities. Earnings from the Company’s financial services business areaffected by changes in interest rates. Although the Company uses derivative financial instruments to some extent toattempt to manage a portion of its exposure to foreign currency exchange rates and commodity prices, the Companydoes not attempt to manage its entire expected exposure, and these instruments generally do not extend beyond oneyear and may expose the Company to credit risk in the event of counterparty default to the derivative financialinstruments. There can be no assurance that in the future the Company will successfully manage these risks.
• The Financial Services operations are exposed to credit risk on its retail and wholesale receivables. Credit risk isthe risk of loss arising from a failure by a customer, including the Company's independent dealers, to meet the terms ofany contract with the Company’s financial services operations. Credit losses are influenced by general business andeconomic conditions, including unemployment rates, bankruptcy filings and other factors that negatively affecthousehold incomes, as well as contract terms and customer credit profiles. Credit losses are also influenced by themarkets for new and used motorcycles, and the Company and its independent dealers can and do take actions thatimpact those markets. For example, the introduction of new models by the Company that represent significantupgrades on previous models may result in increased supply or decreased demand in the market for used Harley-Davidson branded motorcycles, including those motorcycles that serve as collateral or security for credit that HDFShas extended. This in turn could adversely impact the prices at which those motorcycles may be sold, which may leadto increased credit losses for HDFS. Negative changes in general business, economic or market factors may have anadditional adverse impact on the Company’s financial services credit losses and future earnings. The Companybelieves HDFS' retail credit losses may continue to increase over time due to changing consumer credit behavior andHDFS' efforts to increase prudently structured loan approvals to sub-prime borrowers, as well as actions that theCompany has taken and could take that impact motorcycle values. Increases in the frequency of loss and decreases inthe value of repossessed Harley-Davidson branded motorcycles also adversely impact credit losses. If there areadverse circumstances that involve a material decline in values of Harley-Davidson branded motorcycles, thosecircumstances or any related decline in resale values for Harley-Davidson branded motorcycles could contribute toincreased delinquencies and credit losses.
• The Company must prevent and detect issues with its products, components purchased from suppliers, and itssuppliers’ manufacturing processes to reduce the risk of recall campaigns, increased warranty costs orlitigation, increased product liability claims or litigation, delays in new model launches, and inquiries orinvestigations by regulatory agencies. The Company must also complete any recall campaigns within costexpectations. The Company must continually improve and adhere to product development and manufacturingprocesses, and ensure that its suppliers and their sub-tier suppliers adhere to product development and manufacturingprocesses, to ensure high quality products are sold to retail customers. If product designs or manufacturing processesare defective, the Company could experience delays in new model launches, product recalls, inquiries or investigationsfrom regulatory agencies, warranty claims, and product liability claims, which may involve purported classactions. While the Company uses reasonable methods to estimate the cost of warranty, recall and product liability costsand appropriately reflects those in its financial statements, there is a risk the actual costs could exceed estimates andresult in damages that are not covered by insurance. Further, selling products with poor quality, the announcement ofrecalls, and the filing of product liability claims (whether or not successful), may also adversely affect the Company’sreputation and brand strength.
• Expanding international sales and operations subjects the Company to risks that may have a material adverseeffect on its business. Expanding international sales and operations is a part of the Company’s long-term businessstrategy. To support that strategy, the Company must increase its presence outside the U.S., including additional
12

employees and investment in business infrastructure and operations. International operations and sales are subject tovarious risks, including political and economic instability, local labor market conditions, the imposition of foreigntariffs and other trade barriers, the impact of foreign government laws and regulations and U.S. laws and regulationsthat apply to international operations, and the effects of income and withholding taxes, governmental expropriationand differences in business practices. The Company may incur increased costs and experience delays or disruptions inproduct deliveries and payments in connection with international operations and sales that could cause loss ofrevenues and earnings. Unfavorable changes in the political, regulatory and business climate could have a materialadverse effect on the Company’s net sales, financial condition, profitability or cash flows. Violations of laws that applyto the Company's foreign operations, such as the U.S. Foreign Corrupt Practices Act, could result in severe criminal orcivil sanctions, could disrupt the Company's business and result in an adverse effect on the Company's reputation,business and results of operations.
• Weather may impact retail sales of the Company's independent dealers. The Company has observed thatabnormally cold and/or wet conditions in a region could have the effect of reducing demand or changing the timing forpurchases of new Harley-Davidson motorcycles. Reduced demand for new Harley-Davidson motorcycles ultimatelyleads to reduced shipments by the Company.
• The Company must comply with governmental laws and regulations that are subject to change and involvesignificant costs. The Company’s sales and operations in areas outside the U.S. may be subject to foreign laws,regulations and the legal systems of foreign courts or tribunals. These laws and policies governing operations offoreign-based companies may result in increased costs or restrictions on the ability of the Company to sell its productsin certain countries. U.S. laws and policies affecting foreign trade and taxation may also adversely affect theCompany's international sales operations.
The Company’s domestic sales and operations are subject to governmental policies and regulatory actions of agenciesof the United States Government, including the Environmental Protection Agency (EPA), SEC, National HighwayTraffic Safety Administration, Department of Labor and Federal Trade Commission. In addition, the Company’s salesand operations are also subject to laws and actions of state legislatures and other local regulators, including dealerstatutes and licensing laws. Changes in regulations or the imposition of additional regulations may have a materialadverse effect on the Company’s business and results of operations.
Tax - The Company is subject to income and non-income based taxes in the U.S. and in various foreign jurisdictions.Significant judgment is required in determining the Company's worldwide income tax liabilities and other taxliabilities. The Company believes that it complies with applicable tax law. If the governing tax authorities have adifferent interpretation of the applicable law or if there is a change in tax law, the Company's financial condition and/or results of operations may be adversely affected.
Environmental - The Company’s motorcycle products use internal combustion engines. These motorcycle products aresubject to statutory and regulatory requirements governing emissions and noise, including standards imposed by theEPA, state regulatory agencies, such as California Air Resources Board, and regulatory agencies in certain foreigncountries where the Company’s motorcycle products are sold. The Company is also subject to statutory and regulatoryrequirements governing emissions and noise in the conduct of the Company’s manufacturing operations. Anysignificant change to the regulatory requirements governing emissions and noise may substantially increase the cost ofmanufacturing the Company’s products. If the Company fails to meet existing or new requirements, then the Companymay be unable to sell certain products or may be subject to fines or penalties. Further, in response to concerns aboutglobal climate changes and related changes in consumer preferences, the Company may face greater regulatory orcustomer pressure to develop products that generate less emissions. This may require the Company to spend additionalfunds on research, product development, and implementation costs and subject the Company to the risk that theCompany’s competitors may respond to these pressures in a manner that gives them a competitive advantage.
Financial Services - The Company’s financial services operations are governed by a wide range of foreign, federal andstate laws that regulate financial and lending institutions, and financial services activities. In the U.S. for example,these laws include the federal Truth-in-Lending Act, Consumer Leasing Act, Equal Credit Opportunity Act and FairCredit Reporting Act. The financial services operations originate the majority of its consumer loans through itssubsidiary, Eaglemark Savings Bank, a Nevada state thrift chartered as an industrial loan company. Federal and statebodies may in the future impose additional laws, regulation and supervision over the financial services industry.
Violations of or non-compliance with relevant laws and regulations may limit the ability of HDFS to collect all or partof the principal or interest on applicable loans, may entitle the borrower to rescind the loan or obtain a refund ofamounts previously paid, could subject HDFS to payment of damages, civil fines, or criminal penalties and
13

administrative sanctions and could limit the number of loans eligible for HDFS securitizations programs. Suchregulatory requirements and associated supervision also could limit the discretion of HDFS in operating its business,such as through the suspension or revocation of any charter, license or registration at issue, as well as the imposition ofadministrative sanctions, including "cease and desist" orders. The Company cannot assure that the applicable laws orregulations will not be amended or construed in ways that are adverse to HDFS, that new laws and regulations will notbe adopted in the future, or that laws and regulations will not attempt to limit the interest rates charged by HDFS, anyof which may adversely affect the business of HDFS or its results of operations.
The Dodd-Frank Wall Street Reform and Consumer Protection Act (Dodd-Frank Act) is a sweeping piece oflegislation impacting financial services and the full effect will not be fully known for years, as regulations that areintended to implement the Dodd-Frank Act are adopted, and the text of the Dodd-Frank Act is analyzed bystakeholders and possibly the courts. The Dodd-Frank Act also created the Consumer Financial Protection Bureau(CFPB). The CFPB has significant enforcement and rule-making authority in the area of consumer financial productsand services. The direction that the CFPB will take, the regulations it will adopt, and its interpretation of existing lawsand regulations are all elements that are not yet fully known. Compliance may be costly and could affect operatingresults as the implementation of new forms, processes, procedures and controls and infrastructure may be required.Compliance may create operational constraints and place limits on pricing. Failure to comply, as well as changes tolaws and regulations, or the imposition of additional laws and regulations, could affect HDFS’ earnings, limit itsaccess to capital, limit the number of loans eligible for HDFS securitization programs and have a material adverseeffect on HDFS’ business and results of operations. The CFPB also has supervisory authority over certain non-banklarger participants in the vehicle financing market, which includes a non-bank subsidiary of HDFS, allowing the CFPBto conduct comprehensive and rigorous on-site examinations that could result in enforcement actions, fines, changes toprocesses and procedures, product-related changes or consumer refunds, or other actions.
U.S. Public Company - The Company is also subject to policies and actions of the SEC and New York Stock Exchange(NYSE). Many major competitors of the Company are not subject to the requirements of the SEC or the NYSE rules.As a result, the Company may be required to disclose certain information that may put the Company at a competitivedisadvantage to its principal competitors.
• The Company relies on third party suppliers to obtain raw materials and provide component parts for use inthe manufacture of its motorcycles. The Company may experience supply problems relating to raw materials andcomponents such as unfavorable pricing, poor quality, or untimely delivery. In certain circumstances, the Companyrelies on a single supplier to provide the entire requirement of a specific part, and a change in this established supplyrelationship may cause disruption in the Company’s production schedule. In addition, the price and availability of rawmaterials and component parts from suppliers can be adversely affected by factors outside of the Company’s controlsuch as the supply of a necessary raw material or natural disasters. Further, Company suppliers may experiencedifficulty in funding their day-to-day cash flow needs because of tightening credit caused by financial marketdisruption. In addition, adverse economic conditions and related pressure on select suppliers due to difficulties in theglobal manufacturing arena could adversely affect their ability to supply the Company. Changes in laws and policiesrelating to trade and taxation may also adversely impact the Company's foreign suppliers. These supplier risks mayhave a material adverse effect on the Company’s business and results of operations.
• The Company must invest in and successfully implement new information systems and technology. TheCompany is continually modifying and enhancing its systems and technology to increase productivity and efficiencyand to mitigate failure risks from older/aged technologies currently in its portfolio. The Company has several large,strategic information system projects in process. As new systems and technologies (and related strategies) areimplemented, the Company could experience unanticipated difficulties resulting in unexpected costs and adverseimpacts to its manufacturing and other business processes. When implemented, the systems and technology may notprovide the benefits anticipated and could add costs and complications to ongoing operations and older technologiesmay fail, which may have a material adverse effect on the Company’s business and results of operations.
• The Company relies on third parties to perform certain operating and administrative functions for theCompany. Similar to suppliers of raw materials and components, the Company may experience problems withoutsourced services, such as unfavorable pricing, untimely delivery of services, or poor quality. Also, these suppliersmay experience adverse economic conditions due to difficulties in the global economy that could lead to difficultiessupporting the Company's operations. In light of the amount and types of functions that the Company has outsourced,these service provider risks may have a material adverse effect on the Company's business and results of operations.
14

• The Company is and may in the future become subject to legal proceedings and commercial or contractualdisputes. The uncertainty associated with substantial unresolved claims and lawsuits may harm the Company’sbusiness, financial condition, reputation and brand. The defense of the lawsuits may result in the expenditures ofsignificant financial resources and the diversion of management’s time and attention away from business operations.In addition, although the Company is unable to determine the amount, if any, that it may be required to pay inconnection with the resolution of the lawsuits by settlement or otherwise, any such payment may have a materialadverse effect on the Company’s business and results of operations. Refer to the Company’s disclosures concerninglegal proceedings in this Form 10-K and in the other periodic reports that the Company files with the Securities andExchange Commission (SEC) for additional detail regarding lawsuits and other claims against the Company.
• The Company’s success depends upon the continued strength of the Harley-Davidson brand. The Companybelieves that the Harley-Davidson brand has significantly contributed to the success of its business and thatmaintaining and enhancing the brand is critical to expanding its customer base. Failure to protect the brand frominfringers or to grow the value of the Harley-Davidson brand may have a material adverse effect on the Company’sbusiness and results of operations.
• The Company must maintain stakeholder confidence in its operating ethics and corporate governancepractices. The Company believes it has a history of good corporate governance and operating ethics.The Companyhas a Code of Business Conduct that defines how employees interact with various Company stakeholders andaddresses issues such as confidentiality, conflict of interest and fair dealing. Failure to maintain its reputation for goodcorporate governance and strong operating ethics may have a material adverse effect on the Company’s business andresults of operations.
• The Company’s operations are dependent upon attracting and retaining skilled employees, including skilledlabor, executive officers and other senior leaders. The Company’s future success depends on its continuingability to identify, hire, develop, motivate, retain and promote skilled personnel for all areas of its organization,and to effectively execute reorganization actions within expected costs and realize the expected benefits of thoseactions. The Company’s current and future total compensation arrangements, which include benefits and incentiveawards, may not be successful in attracting new employees and retaining and motivating the Company’s existingemployees. In addition, the Company must cultivate and sustain a work environment where employees are engagedand energized in their jobs to maximize their performance, and the Company must effectively execute reorganizationactions. If the Company does not succeed in attracting new personnel, retaining existing personnel, implementingeffective succession plans and motivating and engaging personnel, including executive officers, the Company may beunable to develop and distribute products and services and effectively execute its plans and strategies.
• The Company may not be able to successfully execute its manufacturing strategy. The Company’s manufacturingstrategy is designed to continuously improve product quality and increase productivity, while reducing costs andincreasing flexibility to respond to ongoing changes in the marketplace. The Company believes flexiblemanufacturing, including flexible supply chains and flexible labor agreements, is the key element to enableimprovements in the Company’s ability to respond to customers in a cost effective manner. To execute this strategy,the Company must be successful in its continuous improvement efforts which are dependent on the involvement ofmanagement, production employees and suppliers. Any inability to achieve these objectives could adversely impactthe profitability of the Company’s products and its ability to deliver the right product at the right time to the customer.
• The Company, its suppliers, and its independent dealers must successfully accommodate a seasonal retailmotorcycle sales pattern. The Company records the wholesale sale of a motorcycle when it is shipped to theCompany’s independent dealers. The Company's flexible production capability allows it to more closely correlatemotorcycle production and wholesale shipments with the retail selling season. Any difficulties in executing flexibleproduction could result in lost production or sales. The Company, its suppliers, and its independent dealers must beable to successfully manage changes in production rates, inventory levels and other business processes associated withflexible production. Failure by the Company, its suppliers, or its independent dealers to make such adjustments mayhave a material adverse effect on the Company’s business and results of operations.
• The Company incurs substantial costs with respect to employee pension and healthcare benefits. The Company’scash funding requirements and its estimates of liabilities and expenses for pensions and healthcare benefits for bothactive and retired employees are based on several factors that are outside the Company’s control. These factors includefunding requirements of the Pension Protection Act of 2006, the rate used to discount the future estimated liability, therate of return on plan assets, current and projected healthcare costs, healthcare reform or legislation, retirement ageand mortality. Changes in these factors can impact the expense, liabilities and cash requirements associated with these
15

benefits which could have a material adverse effect on future results of operations, liquidity or shareholders’ equity. Inaddition, costs associated with these benefits put the Company under significant cost pressure as compared to itscompetitors that may not bear the costs of similar benefit plans. Furthermore, costs associated with complying with thePatient Protection and Affordable Care Act may produce additional cost pressure on the Company and its health careplans.
• The ability of the Company to expand international sales may be impacted by existing or new laws andregulations that impose motorcycle licensing restrictions and limit access to roads and highways. Expandinginternational sales is a part of the Company’s long-term business strategy. A number of countries have tieredmotorcycle licensing requirements that limit the ability of new and younger riders to obtain licenses to operate theCompany’s motorcycles, and many countries are considering the implementation of such requirements. Theserequirements only allow new and/or younger riders to operate smaller motorcycles for certain periods of time. Riderstypically are only permitted to obtain a license to ride larger motorcycles upon reaching certain ages and/or havingbeen licensed to ride smaller motorcycles for a certain period of time, and only after passing additional tests andpaying additional fees. These requirements pose obstacles to large displacement motorcycle ownership. Othercountries have laws and regulations that prohibit motorcycles from being operated on certain roads andhighways. These types of laws and regulations could adversely impact the Company’s plans to expand internationalsales.
• The Financial Services operations rely on external sources to finance a significant portion of its operations.Liquidity is essential to the Company’s Financial Services business. Disruptions in financial markets may causelenders and institutional investors to reduce or cease to loan money to borrowers, including financial institutions. TheCompany’s Financial Services operations may be negatively affected by difficulty in raising capital in the long-termand short-term capital markets. These negative consequences may in turn adversely affect the Company’s business andresults of operations in various ways, including through higher costs of capital, reduced funds available through itsfinancial services operations to provide loans to independent dealers and their retail customers, and dilution to existingshare value through the use of alternative sources of capital.
• The Financial Services operations are highly dependent on accessing capital markets to fund their operations atcompetitive interest rates, the Company’s access to capital and its cost of capital are highly dependent upon itscredit ratings, and any negative credit rating actions will adversely affect its earnings and results of operations.The ability of the Company and its Financial Services operations to access unsecured capital markets is influenced bytheir short-term and long-term credit ratings. If the Company’s credit ratings are downgraded or its ratings outlook isnegatively changed, the Company’s cost of borrowing could increase, resulting in reduced earnings and interestmargins, or the Company’s access to capital may be disrupted or impaired. The Company borrowed $750,000,000 in2015 to fund the repurchase of its Common Stock, which increased the Company's leverage. Having increasedleverage increases the risk of a downgrade in the Company's credit ratings.
• The Company’s Motorcycles segment is dependent upon unionized labor. Substantially all of the hourlyproduction employees working in the Motorcycles segment are represented by unions and covered by collectivebargaining agreements. Harley-Davidson Motor Company is currently a party to five collective bargaining agreementswith local affiliates of the International Association of Machinists and Aerospace Workers and the United Steelworkersof America. Current collective bargaining agreements with hourly employees in Missouri, Wisconsin andPennsylvania will expire in 2018, 2019 and 2022, respectively. There is no certainty that the Company will besuccessful in negotiating new agreements with these unions that extend beyond the current expiration dates or thatthese new agreements will be on terms that will allow the Company to be competitive. Failure to renew theseagreements when they expire or to establish new collective bargaining agreements on terms acceptable to theCompany and the unions could result in the relocation of production facilities, work stoppages or other labordisruptions which may have a material adverse effect on the Company’s business and results of operations.
• The Company’s operations may be affected by greenhouse emissions and climate change and relatedregulations. Climate change is receiving increasing attention worldwide. Many scientists, legislators and othersattribute climate change to increased levels of greenhouse gases, including carbon dioxide, which has led to significantlegislative and regulatory efforts to limit greenhouse gas emissions. Congress has previously considered and may inthe future implement restrictions on greenhouse gas emissions. In addition, several states, including states where theCompany has manufacturing plants, have previously considered and may in the future implement greenhouse gasregistration and reduction programs. Energy security and availability and its related costs affect all aspects of theCompany’s manufacturing operations in the United States, including the Company’s supply chain. The Company’smanufacturing plants use energy, including electricity and natural gas, and certain of the Company’s plants emit
16

amounts of greenhouse gas that may be affected by these legislative and regulatory efforts. Greenhouse gas regulationcould increase the price of the electricity the Company purchases, increase costs for use of natural gas, potentiallyrestrict access to or the use of natural gas, require the Company to purchase allowances to offset the Company’s ownemissions or result in an overall increase in costs of raw materials, any one of which could increase the Company’scosts, reduce competitiveness in a global economy or otherwise negatively affect the Company’s business, operationsor financial results. Many of the Company’s suppliers face similar circumstances. Physical risks to the Company’sbusiness operations as identified by the Intergovernmental Panel on Climate Change and other expert bodies includescenarios such as sea level rise, extreme weather conditions and resource shortages. Extreme weather may disrupt theproduction and supply of component parts or other items such as natural gas, a fuel necessary for the manufacture ofmotorcycles and their components. Supply disruptions would raise market rates and jeopardize the continuity ofmotorcycle production.
• Regulations related to conflict minerals and other materials that the Company purchases to use in its productswill cause the Company to incur additional expenses and may have other adverse consequences. The SECadopted inquiry, diligence and disclosure requirements related to certain minerals sourced from the DemocraticRepublic of Congo and surrounding countries, or "conflict minerals," that are necessary to the functionality of aproduct manufactured, or contracted to be manufactured, by an SEC reporting company. Compliance with thedisclosure requirements could affect the sourcing and availability of some of the minerals that the Company uses in themanufacturing of its products. The Company's supply chain is complex, and if it is not able to determine the sourceand chain of custody for all conflict minerals used in its products that are sourced from the Democratic Republic ofCongo and surrounding countries or determine that its products are "conflict free," then the Company may facereputational challenges with customers, investors or others. Additionally, as there may be only a limited number ofsuppliers offering "conflict free" minerals, if the Company chooses to use only conflict minerals that are "conflictfree," the Company cannot be sure that it will be able to obtain necessary materials from such suppliers in sufficientquantities or at competitive prices. Accordingly, the Company could incur significant costs related to the complianceprocess, including potential difficulty or added costs in satisfying the disclosure requirements. Other laws orregulations impacting our supply chain, such as the UK Modern Slavery Act, may have similar consequences.
The Company disclaims any obligation to update these Risk Factors or any other forward-looking statements. TheCompany assumes no obligation (and specifically disclaims any such obligation) to update these Risk Factors or any otherforward-looking statements to reflect actual results, changes in assumptions or other factors affecting such forward-lookingstatements.
Item 1B. Unresolved Staff Comments
None.
Item 2. Properties
The following is a summary of the principal operating properties of the Company as of December 31, 2016:
Motorcycles & Related Products Segment
Type of Facility LocationApproximateSquare Feet Status
Corporate Office Milwaukee, WI 515,000 OwnedMuseum Milwaukee, WI 130,000 OwnedManufacturing(1) Menomonee Falls, WI 915,000 OwnedProduct Development Center Wauwatosa, WI 409,000 OwnedManufacturing(2) Tomahawk, WI 226,000 OwnedManufacturing(3) York, PA 571,000 OwnedManufacturing(4) Kansas City, MO 456,000 OwnedManufacturing(5) Manaus, Brazil 108,000 Lease expiring 2019Regional Office Oxford, England 39,000 Lease expiring 2021Manufacturing(6) Bawal, India 68,000 Lease expiring 2019Regional Office Singapore 24,000 Lease expiring 2020Manufacturing(7) Adelaide, Australia 485,000 Lease expiring 2017
17

(1) Motorcycle powertrain production.(2) Plastic parts production and painting.(3) Motorcycle parts fabrication, painting and Softail® and touring model assembly.(4) Motorcycle parts fabrication, painting and Dyna®, Sportster®, Softail® and Street platform assembly.(5) Assembly of select models for the Brazilian market.(6) Assembly of select models for the Indian market and production of the Street platform for non-North American markets.(7) Motorcycle wheel production.
Financial Services Segment
Type of Facility LocationApproximateSquare Feet Status
Office Chicago, IL 26,000 Lease expiring 2022Office Plano, TX 69,321 Lease expiring 2025Office Carson City, NV 100,000 Owned
The Financial Services segment has three office facilities: Chicago, Illinois (corporate headquarters); Plano, Texas(wholesale and retail operations); and Carson City, Nevada (retail and insurance operations).
Item 3. Legal Proceedings
The Company is subject to lawsuits and other claims related to environmental, product and other matters. In determiningrequired reserves related to these items, the Company carefully analyzes cases and considers the likelihood of adversejudgments or outcomes, as well as the potential range of possible loss. The required reserves are monitored on an ongoing basisand are updated based on new developments or new information in each matter.
Environmental Protection Agency Notice:
In December 2009, the Company received formal, written requests for information from the United States EnvironmentalProtection Agency (EPA) regarding: (i) certificates of conformity for motorcycle emissions and related designations and labels,(ii) aftermarket parts, and (iii) warranty claims on emissions related components. The Company promptly submitted writtenresponses to the EPA’s inquiry and has engaged in discussions with the EPA. Since that time, the EPA delivered variousadditional requests for information to which the Company responded. More recently, in August 2016, the Company entered intoa consent decree with the EPA regarding these issues (the Settlement). In the Settlement the Company agreed to, among otherthings, pay a fine, fund a three-year emissions mitigation project, and not sell tuning products unless they are approved by theEPA or California Air Resources Board. The Company anticipates the EPA will move the court to finalize the Settlement in thecoming months. The Company has a reserve associated with this matter which is included in accrued liabilities in theConsolidated Balance Sheet, and as a result, if it is finalized, the Settlement would not have a material adverse effect on theCompany's financial condition or results of operations. The Settlement is not final until it is approved by the court, and if it isnot approved by the court, the Company cannot reasonably estimate the impact of any remedies the EPA might seek beyond theCompany's current reserve for this matter.
York Environmental Matters:
The Company is involved with government agencies and groups of potentially responsible parties related to a matterinvolving the cleanup of soil and groundwater contamination at its York, Pennsylvania facility. The York facility was formerlyused by the U.S. Navy and AMF prior to the purchase of the York facility by the Company from AMF in 1981. Although theCompany is not certain as to the full extent of the environmental contamination at the York facility, it has been working withthe Pennsylvania Department of Environmental Protection (PADEP) since 1986 in undertaking environmental investigation andremediation activities, including a site-wide remedial investigation/feasibility study (RI/FS).
In January 1995, the Company entered into a settlement agreement (the Agreement) with the Navy, and the partiesamended the Agreement in 2013 to address ordnance and explosive waste. The Agreement calls for the Navy and the Companyto contribute amounts into a trust equal to 53% and 47%, respectively, of costs associated with environmental investigation andremediation activities at the York facility (Response Costs). The trust administers the payment of the Response Costs incurredat the York facility as covered by the Agreement.
The Company has a reserve for its estimate of its share of the future Response Costs at the York facility which is includedin accrued liabilities in the Consolidated Balance Sheets. While much of the work on the RI/FS is complete, it is still under
18

agency review and given the uncertainty that exists concerning the nature and scope of additional environmental investigationand remediation that may ultimately be required under the RI/FS that is finally approved or otherwise at the York facility, theCompany is unable to make a reasonable estimate of those additional costs, if any, that may result.
The estimate of the Company's future Response Costs that will be incurred at the York facility is based on reports ofindependent environmental consultants retained by the Company, the actual costs incurred to date and the estimated costs tocomplete the necessary investigation and remediation activities.
Product Liability Matters:
The Company is involved in product liability suits related to the operation of its business. The Company accrues for claimexposures that are probable of occurrence and can be reasonably estimated. The Company also maintains insurance coveragefor product liability exposures. The Company believes that its accruals and insurance coverage are adequate and that productliability suits will not have a material adverse effect on the Company’s consolidated financial statements.
National Highway Traffic Safety Administration Matters:
In July 2016, the National Highway Traffic Safety Administration (NHTSA) began an investigation into certain of theCompany's model-year 2008-2011 motorcycles equipped with anti-lock braking systems (ABS). NHTSA’s investigation is inresponse to rider complaints related to brake failures. NHTSA noted that Harley-Davidson has a two-year brake fluidreplacement interval that owners either are unaware of or ignore. The Company does not believe that a loss related to thismatter is probable and no reserve has been established. However, it is possible that the outcome of NHTSA’s investigationcould result in future costs to the Company. Given the uncertainty that still exists concerning the resolution of this matter, theCompany cannot reasonably estimate these possible future costs, if any.
Item 4. Mine Safety Disclosures
Not Applicable
PART II
Item 5. Market for Registrant's Common Equity, Related Stockholder Matters and Issuer Purchase of EquitySecurities
Harley-Davidson, Inc. common stock is traded on the New York Stock Exchange, Inc. The high and low market prices forthe common stock, reported as New York Stock Exchange, Inc. Composite Transactions, were as follows:
2016 Low High 2015 Low High
First quarter $ 36.36 $ 49.99 First quarter $ 58.24 $ 66.58Second quarter $ 42.99 $ 52.00 Second quarter $ 53.04 $ 62.96Third quarter $ 41.63 $ 57.33 Third quarter $ 50.64 $ 60.67Fourth quarter $ 48.55 $ 62.35 Fourth quarter $ 45.00 $ 57.10
The Company paid the following dividends per share:
2016 2015 2014
First quarter $ 0.350 $ 0.310 $ 0.275Second quarter 0.350 0.310 0.275Third quarter 0.350 0.310 0.275Fourth quarter 0.350 0.310 0.275Total $ 1.400 $ 1.240 $ 1.100
As of January 27, 2017, there were 74,087 shareholders of record of Harley-Davidson, Inc. common stock.
19

The following table contains detail related to the Company's repurchase of its common stock based on the date of tradeduring the quarter ended December 31, 2016:
2016 Fiscal MonthTotal Number of
Shares Purchased (a)Average PricePaid per Share
Total Number of SharesPurchased as Part ofPublicly AnnouncedPlans or Programs
Maximum Number ofShares that May Yet BePurchased Under the
Plans or Programs
September 26 to October 30 922,311 $ 52 922,311 20,016,171October 31 to November 27 660,785 $ 57 660,785 19,355,386November 28 to December 31 84,262 $ 60 84,262 19,272,516Total 1,667,358 $ 55 1,667,358
(a) Includes discretionary share repurchases and shares of common stock that employees surrendered to satisfywithholding taxes in connection with the vesting of restricted stock awards.
In June 2015, the Company's Board of Directors authorized the Company to repurchase up to 15.0 million shares of itscommon stock with no dollar limit or expiration date. The Company repurchased 0.9 million shares on a discretionary basisduring the quarter ended December 31, 2016 under this authorization. As of December 31, 2016, no shares remained under thisauthorization.
Additionally, in February 2016, the Company's Board of Directors authorized the Company to repurchase up to 20.0million shares of its common stock with no dollar limit or expiration date which superseded share repurchase authoritypreviously granted by the Board of Directors other than the June 2015 authorization. The Company repurchased 0.7 millionshares on a discretionary basis during the quarter ended December 31, 2016 under this authorization. As of December 31, 2016,19.3 million shares remained under this authorization.
Under the share repurchase authorizations, the Company’s common stock may be purchased through any one or more of aRule 10b5-1 trading plan and discretionary purchases on the open market, block trades, accelerated share repurchases orprivately negotiated transactions. The number of shares repurchased, if any, and the timing of repurchases will depend on anumber of factors, including share price, trading volume and general market conditions, as well as on working capitalrequirements, general business conditions and other factors. The repurchase authority has no expiration date but may besuspended, modified or discontinued at any time.
The Harley-Davidson, Inc. 2014 Incentive Stock Plan and predecessor stock plans permit participants to satisfy all or aportion of the statutory federal, state and local withholding tax obligations arising in connection with plan awards by electing to(a) have the Company withhold shares otherwise issuable under the award, (b) tender back shares received in connection withsuch award or (c) deliver other previously owned shares, in each case having a value equal to the amount to be withheld.During the fourth quarter of 2016, the Company acquired 1,589 shares of common stock that employees presented to theCompany to satisfy withholding taxes in connection with the vesting of restricted stock awards.
Item 12 of this Annual Report on Form 10-K contains certain information relating to the Company’s equity compensationplans.
The following information in this Item 5 is not deemed to be “soliciting material” or to be “filed” with the SEC or subjectto Regulation 14A or 14C under the Securities Exchange Act of 1934 or to the liabilities of Section 18 of the SecuritiesExchange Act of 1934, and will not be deemed to be incorporated by reference into any filing under the Securities Act of 1933or the Securities Exchange Act of 1934, except to the extent the Company specifically incorporates it by reference into such afiling: the SEC requires the Company to include a line graph presentation comparing cumulative five year Common Stockreturns with a broad-based stock index and either a nationally recognized industry index or an index of peer companies selectedby the Company. The Company has chosen to use the Standard & Poor’s 500 Index as the broad-based index and theStandard & Poor’s MidCap 400 Index as a more specific comparison. The Standard & Poor’s MidCap 400 Index was chosenbecause the Company does not believe that any other published industry or line-of-business index adequately represents thecurrent operations of the Company. The graph assumes a beginning investment of $100 on December 31, 2011 and that alldividends are reinvested.
20

Harley-Davidson, Inc. Standard & Poor's MidCap 400 Index
Standard & Poor's 500 Index
Comparison of Cumulative Five Year Total Return
$250
$200
$150
$100
$50
$0
2011 2012 2013 2014 2015 2016
2011($)
2012($)
2013($)
2014($)
2015($)
2016($)
Harley-Davidson, Inc. 100 127 183 177 125 165Standard & Poor’s MidCap 400 Index 100 118 155 168 162 195Standard & Poor’s 500 Index 100 116 154 175 177 198
21

Item 6. Selected Financial Data
(In thousands, except per share amounts) 2016 2015 2014 2013 2012
Statement of income data:Revenue:
Motorcycles & Related Products $ 5,271,376 $ 5,308,744 $ 5,567,681 $ 5,258,290 $ 4,942,582Financial Services 725,082 686,658 660,827 641,582 637,924
Total revenue $ 5,996,458 $ 5,995,402 $ 6,228,508 $ 5,899,872 $ 5,580,506Net income $ 692,164 $ 752,207 $ 844,611 $ 733,993 $ 623,925Weighted-average common shares:
Basic 179,676 202,681 216,305 222,475 227,119Diluted 180,535 203,686 217,706 224,071 229,229
Earnings per common share:Basic $ 3.85 $ 3.71 $ 3.90 $ 3.30 $ 2.75Diluted $ 3.83 $ 3.69 $ 3.88 $ 3.28 $ 2.72
Dividends paid per common share $ 1.40 $ 1.24 $ 1.10 $ 0.84 $ 0.62Balance sheet data:
Total assets(a) $ 9,890,240 $ 9,972,977 $ 9,515,870 $ 9,394,765 $ 9,156,072Total debt(a) $ 6,807,567 $ 6,872,198 $ 5,492,402 $ 5,248,895 $ 5,087,948Total equity $ 1,920,158 $ 1,839,654 $ 2,909,286 $ 3,009,486 $ 2,557,624
(a) The Company adopted ASU No. 2015-03 and ASU No. 2015-15 on January 1, 2016. Upon adoption, the Company
reclassified debt issuance cost, other than debt issuance costs related to line of credit arrangements (which include itsasset-backed commercial paper and commercial paper programs and its credit facilities), from other assets to debt. Referto Note 1 of the Notes to Consolidated Financial Statements.
22

Item 7. Management's Discussion and Analysis of Financial Condition and Results of Operations
Harley-Davidson, Inc. is the parent company of the groups of companies doing business as Harley-Davidson MotorCompany (HDMC) and Harley-Davidson Financial Services (HDFS). Unless the context otherwise requires, all references tothe "Company" include Harley-Davidson, Inc. and all its subsidiaries. The Company operates in two reportable segments:Motorcycles & Related Products (Motorcycles) and Financial Services. The Company’s reportable segments are strategicbusiness units that offer different products and services and are managed separately based on the fundamental differences intheir operations.
The Motorcycles segment consists of HDMC which designs, manufactures and sells at wholesale on-road Harley-Davidson motorcycles as well as motorcycle parts, accessories, general merchandise and related services. The Company’sproducts are sold to retail customers through a network of independent dealers. The Company conducts business on a globalbasis, with sales in the United States, Canada, Latin America, Europe/Middle East/Africa (EMEA) and the Asia Pacific region.
The Financial Services segment consists of HDFS which primarily provides wholesale and retail financing and insurance-related programs to Harley-Davidson dealers and their retail customers. HDFS conducts business principally in the UnitedStates and Canada.
The “% Change” figures included in the “Results of Operations” section were calculated using unrounded dollar amountsand may differ from calculations using the rounded dollar amounts presented.
Overview
The Company’s net income for 2016 was $692.2 million, or $3.83 per diluted share, compared to $752.2 million, or$3.69 per diluted share, in 2015. Operating income from the Motorcycles segment was down $102.1 million compared to 2015.Motorcycles segment operating income was down primarily due to a 1.6% decrease in motorcycle shipments, unfavorablemanufacturing costs and unfavorable foreign currency exchange rates. Operating income from the Financial Services segmentwas lower than the prior year, decreasing $4.7 million, or 1.7%, due primarily to a higher provision for credit losses.
Worldwide independent dealer retail sales of new Harley-Davidson motorcycles decreased 1.6% in 2016 compared to2015. International retail sales of new Harley-Davidson motorcycles increased 2.3%, offset by a 3.9% decrease in the U.S.Retail sales that were below the Company's expectations in 2016 reflected significant global competitiveness and very soft U.S.industry demand.
Please refer to the “Results of Operations 2016 Compared to 2015” for additional details concerning the results for 2016.
(1) Note Regarding Forward-Looking Statements
The Company intends that certain matters discussed in this report are “forward-looking statements” intended to qualifyfor the safe harbor from liability established by the Private Securities Litigation Reform Act of 1995. These forward-looking statements can generally be identified as such by reference to this footnote or because the context of thestatement will include words such as the Company “believes,” “anticipates,” “expects,” “plans,” or “estimates” or wordsof similar meaning. Similarly, statements that describe future plans, objectives, outlooks, targets, guidance or goals arealso forward-looking statements. Such forward-looking statements are subject to certain risks and uncertainties thatcould cause actual results to differ materially, unfavorably or favorably, from those anticipated as of the date of thisreport. Certain of such risks and uncertainties are described in close proximity to such statements or elsewhere in thisreport, including under the caption “Risk Factors” in Item 1A and under “Cautionary Statements” in Item 7 of thisreport. Shareholders, potential investors, and other readers are urged to consider these factors in evaluating the forward-looking statements and cautioned not to place undue reliance on such forward-looking statements. The forward-lookingstatements included in the Outlook section are only made as of January 31, 2017 and the remaining forward-lookingstatements in this report are only made as of the date of the filing of this report (February 21, 2017), and the Companydisclaims any obligation to publicly update such forward-looking statements to reflect subsequent events orcircumstances.
23

Outlook(1)
On January 31, 2017 the Company announced the following expectations for 2017.
The Company expects its 2017 shipments to be flat to down modestly with lower shipments in the U.S., offset by higherinternational shipments as it grows its dealer network. The Company believes 2017 global retail sales of Harley-Davidsonmotorcycles will continue to face headwinds. The Company believes retail sales of its motorcycles will be negatively impactedby:
• A soft U.S. industry driven by weak oil-dependent region sales and soft used motorcycle prices, • Intense and potentially increasing competitive discounting in the U.S.,• Continuing new product competition, and • Global economic and political uncertainty and volatility
However, the Company anticipates retail sales of its motorcycles will be positively impacted by:
• Increasing global ridership through focused demand driving investments, • Continued success with outreach customers in the U.S.,• New product momentum with its model-year 2017 motorcycles and exciting and innovative model-year 2018
motorcycles, and • Expansion of its international dealer network
The Company expects to ship 66,000 to 71,000 Harley-Davidson motorcycles in the first quarter of 2017, downapproximately 15% to 20% compared to the first quarter of 2016 driven by the Company's commitment to aggressively managesupply in line with demand, including its focus on supporting U.S. dealer efforts to sell through their remaining model-year2016 motorcycles. The Company expects retail inventory in the U.S. at the end of the first quarter of 2017 to be considerablylower than the first quarter of 2016. The Company also expects retail inventory at the end of the first quarter to be comprised ofan improved balance of 2016 and 2017 model-year motorcycles compared to December 31, 2016 to start the Spring sellingseason.
The Company expects gross margin as a percent of revenue for the full-year to be approximately in line with 2016. TheCompany expects that full-year 2017 gross margin percent will benefit from pricing of its model-year 2017 motorcycles andinnovative new products that the Company will launch throughout 2017. The Company expects its pricing actions to be largelyoffset by unfavorable currency exchange rates, higher raw material costs and increased manufacturing expense. Year-over-yearmanufacturing expense will benefit from the absence of the 2016 costs associated with its ERP implementation at its KansasCity facility and the retooling and start-up costs associated with the launch of the Milwaukee-EightTM engine at its PilgrimRoad facility. However, the Company expects this favorability to be offset by higher depreciation expense from its recentcapital investments and significant start-up costs associated with its model-year 2018 motorcycles. To dimensionalize theforeign currency exchange risk, if foreign currency exchange rates experienced in January 2017 remained constant throughout2017, which is a hypothetical expectation in what is a very volatile foreign currency exchange environment, the Companyestimates the adverse impact to its expected Motorcycles segment revenue from currency exchange in 2017 would beapproximately 1.25%. Under this scenario, the Company would also expect an unfavorable impact to 2017 gross margin ofapproximately $20 million to $25 million.
The lower shipments in the first quarter will have a substantial impact on the timing of gross margin in 2017. TheCompany expects gross margin as a percent of revenue in the first quarter to be down approximately 2.5 percentage pointscompared to the first quarter of 2016. The Company expects the timing of gross margin, as compared to 2016, will be impactedby (1) a higher fixed cost per unit in the first quarter offset by a lower fixed cost per unit in the second half of 2017 and (2) mixunfavorability in the first quarter due to shipping a lower percentage of touring motorcycles offset by mix favorability in thesecond quarter of 2017.
The Company expects its full-year selling, administrative and engineering expenses to be approximately in line with its2016 expenses. The Company also expects its selling, administrative and engineering expense as a percent of revenue to beapproximately in line with 2016. The Company believes the 2017 benefits from savings associated with its reorganization inthe fourth quarter of 2016 and the absence of related employee separation expenses will be offset by spending to drive demand.
The Company expects the 2017 operating margin percent for the Motorcycles segment to be approximately in line withthe 2016 operating margin percent.
The Company expects operating income for the Financial Services segment to be down in 2017 as compared to 2016primarily due to the $9.3 million gain on its off-balance sheet asset-backed securitization in 2016 that it does not expect to recur
24

in 2017. The Company expects higher interest costs and higher credit losses in 2017 to be partially offset by the benefits of aslight lending rate increase that the Company implemented in January 2017.
The Company estimates that its capital expenditure for 2017 will be between $200 million and $220 million. TheCompany anticipates it will have the ability to fund all capital expenditures in 2017 with cash flows generated by operations.
The Company also announced on January 31, 2017 that it expects the full-year 2017 effective income tax rate to beapproximately 34.5%. This guidance excludes the effect of any potential future adjustments such as new tax legislation or auditsettlements which are recorded as discrete items in the period in which they are settled.
Long-Term Strategy(1)
The Company believes it made great progress with its demand driving efforts in 2016; however, these efforts onlypartially offset the impact of the down U.S. market. The U.S. is uniquely important to the Company's business and its long-termplans reflect what it believes will continue to be a challenging U.S. market. As the Company looks forward to 2017 andbeyond, it will continue its demand driving focus, but will also focus on doing more, in particular in the U.S., to drive industrygrowth and assure the vitality of the sport of motorcycling long-term. Its long-term strategy will focus on growing ridership inthe U.S. and growing its reach and impact internationally, while growing market share and profitability globally. TheCompany's ten-year objectives are as follows:
• Build two million new Harley-Davidson riders in the U.S.• Launch 100 new, high-impact Harley-Davidson motorcycles• Grow the Harley-Davidson international business to 50 percent of its total annual volume• Deliver superior return on invested capital for HDMC• Grow the business without growing its environmental impact
The Company will continue to invest in its business and return value to its shareholders. Through disciplined investments,it is committed to driving return on invested capital at HDMC that falls within the top quartile of the S&P 500 and continuedstrong return on equity for HDFS. The Company expects to return all excess cash to its shareholders in the form of increasingdividends and continuing share repurchases. The Company will continue to look for opportunities to maximize shareholdervalue by returning excess cash to its shareholders without damaging the long-term value of the Company or its brand.
Results of Operations 2016 Compared to 2015
Consolidated Results
(in thousands, except earnings per share) 2016 2015(Decrease)Increase
%Change
Operating income from Motorcycles & Related Products $ 773,406 $ 875,490 $ (102,084) (11.7)%Operating income from Financial Services 275,530 280,205 (4,675) (1.7)%Operating income 1,048,936 1,155,695 (106,759) (9.2)%Investment income 4,645 6,585 (1,940) (29.5)%Interest expense 29,670 12,117 17,553 144.9 %Income before income taxes 1,023,911 1,150,163 (126,252) (11.0)%Provision for income taxes 331,747 397,956 (66,209) (16.6)%Net income $ 692,164 $ 752,207 $ (60,043) (8.0)%Diluted earnings per share $ 3.83 $ 3.69 $ 0.14 3.8 %
Consolidated operating income was down 9.2% in 2016 driven by a decrease in operating income from the Motorcyclessegment which was down $102.1 million compared to 2015. Operating income for the Financial Services segment decreased by$4.7 million during 2016 as compared to 2015. Please refer to the “Motorcycles and Related Products Segment” and “FinancialServices Segment” discussions following for a more detailed discussion of the factors affecting operating income.
Corporate interest expense was higher in 2016 compared to 2015 due to the issuance of corporate debt in 2015. TheCompany issued $750.0 million of senior unsecured notes in the third quarter of 2015 and utilized the proceeds to fund therepurchase of common stock in the third and fourth quarters of 2015.
The effective income tax rate for 2016 was 32.4% compared to 34.6% for 2015. The lower effective income tax rate wasprimarily driven by the successful closure of various tax audits in 2016.
25
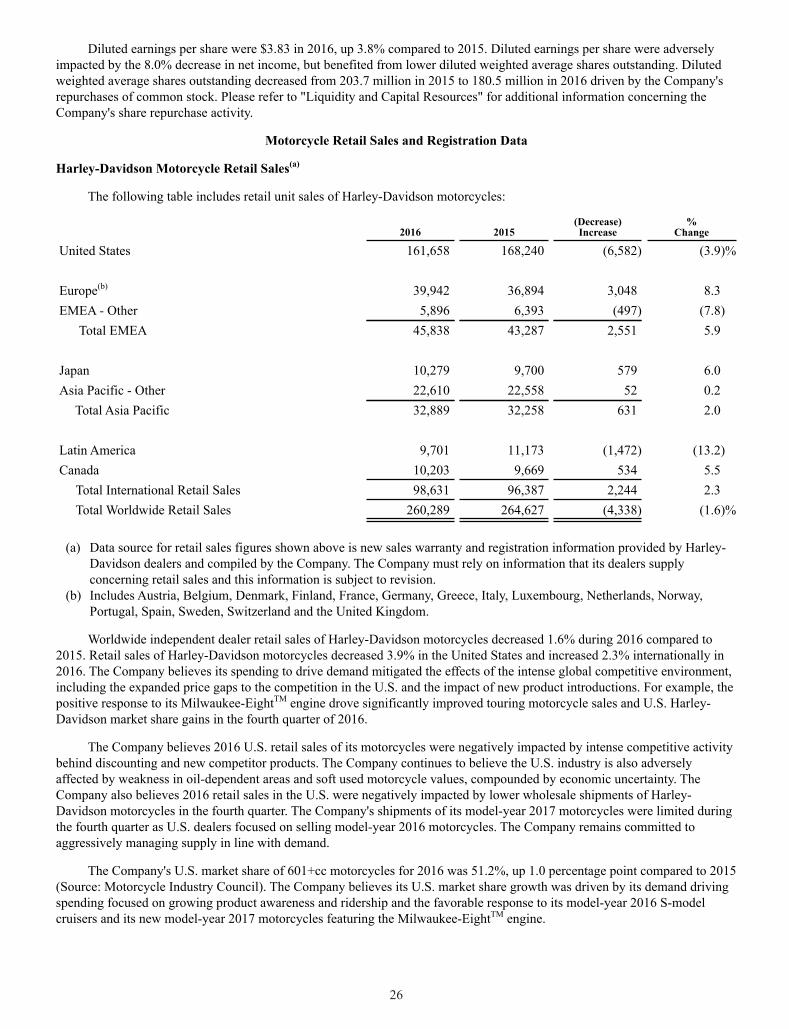
Diluted earnings per share were $3.83 in 2016, up 3.8% compared to 2015. Diluted earnings per share were adverselyimpacted by the 8.0% decrease in net income, but benefited from lower diluted weighted average shares outstanding. Dilutedweighted average shares outstanding decreased from 203.7 million in 2015 to 180.5 million in 2016 driven by the Company'srepurchases of common stock. Please refer to "Liquidity and Capital Resources" for additional information concerning theCompany's share repurchase activity.
Motorcycle Retail Sales and Registration Data
Harley-Davidson Motorcycle Retail Sales(a)
The following table includes retail unit sales of Harley-Davidson motorcycles:
2016 2015(Decrease)Increase
%Change
United States 161,658 168,240 (6,582) (3.9)%
Europe(b) 39,942 36,894 3,048 8.3EMEA - Other 5,896 6,393 (497) (7.8) Total EMEA 45,838 43,287 2,551 5.9
Japan 10,279 9,700 579 6.0Asia Pacific - Other 22,610 22,558 52 0.2
Total Asia Pacific 32,889 32,258 631 2.0
Latin America 9,701 11,173 (1,472) (13.2)Canada 10,203 9,669 534 5.5 Total International Retail Sales 98,631 96,387 2,244 2.3 Total Worldwide Retail Sales 260,289 264,627 (4,338) (1.6)%
(a) Data source for retail sales figures shown above is new sales warranty and registration information provided by Harley-
Davidson dealers and compiled by the Company. The Company must rely on information that its dealers supplyconcerning retail sales and this information is subject to revision.
(b) Includes Austria, Belgium, Denmark, Finland, France, Germany, Greece, Italy, Luxembourg, Netherlands, Norway,Portugal, Spain, Sweden, Switzerland and the United Kingdom.
Worldwide independent dealer retail sales of Harley-Davidson motorcycles decreased 1.6% during 2016 compared to2015. Retail sales of Harley-Davidson motorcycles decreased 3.9% in the United States and increased 2.3% internationally in2016. The Company believes its spending to drive demand mitigated the effects of the intense global competitive environment,including the expanded price gaps to the competition in the U.S. and the impact of new product introductions. For example, thepositive response to its Milwaukee-EightTM engine drove significantly improved touring motorcycle sales and U.S. Harley-Davidson market share gains in the fourth quarter of 2016.
The Company believes 2016 U.S. retail sales of its motorcycles were negatively impacted by intense competitive activitybehind discounting and new competitor products. The Company continues to believe the U.S. industry is also adverselyaffected by weakness in oil-dependent areas and soft used motorcycle values, compounded by economic uncertainty. TheCompany also believes 2016 retail sales in the U.S. were negatively impacted by lower wholesale shipments of Harley-Davidson motorcycles in the fourth quarter. The Company's shipments of its model-year 2017 motorcycles were limited duringthe fourth quarter as U.S. dealers focused on selling model-year 2016 motorcycles. The Company remains committed toaggressively managing supply in line with demand.
The Company's U.S. market share of 601+cc motorcycles for 2016 was 51.2%, up 1.0 percentage point compared to 2015(Source: Motorcycle Industry Council). The Company believes its U.S. market share growth was driven by its demand drivingspending focused on growing product awareness and ridership and the favorable response to its model-year 2016 S-modelcruisers and its new model-year 2017 motorcycles featuring the Milwaukee-EightTM engine.
26

In EMEA, retail sales of Harley-Davidson motorcycles for 2016 increased 5.9% compared to the prior year due in part toa positive reception to its model-year 2016 S-model cruisers and its new model-year 2017 motorcycles featuring theMilwaukee-EightTM engine.
In the Asia Pacific region, retail sales of Harley-Davidson motorcycles for 2016 increased 2.0% compared to the prioryear. Overall growth in the Asia Pacific region was partially offset by lower sales in India and Indonesia. In India, the Companybelieves retail sales of Harley-Davidson motorcycles were negatively impacted by India's currency demonetization in the fourthquarter of 2016. In Indonesia, retail sales of Harley-Davidson motorcycles were lower as the Company is reestablishing itsdealer network in that market. Three independent dealerships were opened in Indonesia in the fourth quarter of 2016 and theCompany expects to be back at previous levels by the end of 2017.(1)
Retail sales of Harley-Davidson motorcycles in Latin America for 2016 decreased 13.2% compared to the prior year. TheCompany believes retail sales in Brazil continued to be negatively impacted by a price increase on its motorcycles initiated inthe first quarter of 2016 and by a slowing economy, consumer uncertainty and aggressive price competition.
Retail sales of Harley-Davidson motorcycles in Canada increased 5.5% in 2016 compared to 2015. The Companybelieves the market responded favorably to the change to a direct distribution model implemented in July 2015 and pricingadjustments that were implemented with the model-year 2016 motorcycles.
International retail sales as a percent of total retail sales in 2016 were 37.9% compared to 36.4% in 2015.
The Company believes it can continue to realize strong international growth opportunities by expanding its dealernetwork and increasing its brand relevance by delivering exceptional products that inspire riders. In 2016, the Company added40 new international dealerships, and it plans to add a total of 150 to 200 from 2016 through 2020.(1)
Motorcycle Registration Data - 601+cc(a)
The following table includes industry retail motorcycle registration data:
2016 2015(Decrease)Increase
%Change
United States(b) 311,710 328,818 (17,108) (5.2)%Europe(c) 391,936 351,773 40,163 11.4 %
(a) Data includes on-road 601+cc models. On-road 601+cc models include dual purpose models, three-wheeled motorcyclesand autocycles. Registration data for Harley-Davidson Street® 500 motorcycles is not included in this table.
(b) United States industry data is derived from information provided by Motorcycle Industry Council (MIC). This third-partydata is subject to revision and update.
(c) Europe data includes Austria, Belgium, Denmark, Finland, France, Germany, Greece, Italy, Luxembourg, Netherlands,Norway, Portugal, Spain, Sweden, Switzerland, and the United Kingdom. Industry retail motorcycle registration dataincludes 601+cc models derived from information provided by Association des Constructeurs Europeens de Motocycles(ACEM), an independent agency. This third-party data is subject to revision and update.
Motorcycles and Related Products Segment
Motorcycle Unit Shipments
The following table includes wholesale motorcycle unit shipments for the Motorcycles segment:
2016 2015 Unit Unit
Units Mix % Units Mix %(Decrease)Increase
%Change
United States 161,839 61.7% 170,688 64.1% (8,849) (5.2)%International 100,382 38.3% 95,694 35.9% 4,688 4.9Harley-Davidson motorcycle units 262,221 100.0% 266,382 100.0% (4,161) (1.6)%Touring motorcycle units 107,410 41.0% 114,768 43.1% (7,358) (6.4)%Cruiser motorcycle units 93,422 35.6% 89,207 33.5% 4,215 4.7Sportster® / Street motorcycle units 61,389 23.4% 62,407 23.4% (1,018) (1.6)Harley-Davidson motorcycle units 262,221 100.0% 266,382 100.0% (4,161) (1.6)%
27

During 2016, wholesale shipments of Harley-Davidson motorcycles were down 1.6% compared to the prior year in linewith the 1.6% decrease in dealer retail sales of new Harley-Davidson motorcycles. International shipments as a percentage ofthe total were up in 2016 as compared to 2015. In addition, shipments of Cruiser motorcycles as a percentage of total shipmentsincreased in 2016 compared to the prior year driven by the strong acceptance of the model-year 2016 S-model motorcycles.Touring motorcycle shipments were down in 2016; however, in the fourth quarter of 2016, the shipment mix of Touringmotorcycles increased reflecting the high demand for the new 2017 Touring motorcycles featuring the Milwaukee-EightTM
engine.
Dealer retail inventory of new Harley-Davidson motorcycles in the U.S. at the end of 2016 was approximately flatcompared to the end of 2015. The Company believes the year-end U.S. 2017 dealer retail inventory level will remain in linewith year-end 2016; however, it believes international dealer inventory will be higher at the end of 2017 as the Companycontinues to grow its international dealer network.(1)
Segment Results
The following table includes the condensed statement of operations for the Motorcycles segment (in thousands):
2016 2015(Decrease)Increase
%Change
Revenue:Motorcycles $ 4,122,113 $ 4,127,739 $ (5,626) (0.1)%Parts & Accessories 842,637 862,645 (20,008) (2.3)General Merchandise 284,583 292,310 (7,727) (2.6)Other 22,043 26,050 (4,007) (15.4)
Total revenue 5,271,376 5,308,744 (37,368) (0.7)Cost of goods sold 3,419,710 3,356,284 63,426 1.9Gross profit 1,851,666 1,952,460 (100,794) (5.2)Selling & administrative expense 907,059 916,669 (9,610) (1.0)Engineering expense 171,201 160,301 10,900 6.8Operating expense 1,078,260 1,076,970 1,290 0.1Operating income from Motorcycles $ 773,406 $ 875,490 $ (102,084) (11.7)%
The following table includes the estimated impact of significant factors affecting the comparability of net revenue, cost ofgoods sold and gross profit from 2015 to 2016 (in millions):
NetRevenue
Cost ofGoodsSold
GrossProfit
2015 $ 5,309 $ 3,357 $ 1,952Volume (109) (62) (47)Price, net of related costs 93 39 54Foreign currency exchange rates and hedging (3) 45 (48)Shipment mix (18) (5) (13)Raw material prices — (18) 18Manufacturing and other costs — 64 (64)Total (37) 63 (100)2016 $ 5,272 $ 3,420 $ 1,852
The following factors affected the comparability of net revenue, cost of goods sold and gross profit from 2015 to 2016:
• Volume decreases were driven by lower wholesale motorcycle shipments, as well as decreases in sales of parts andaccessories and general merchandise.
• On average, wholesale prices on the Company’s 2016 and 2017 model-year motorcycles are higher than the priormodel-years resulting in the favorable impact on revenue during the period. The impact of revenue favorabilityresulting from model-year price increases on gross profit was partially offset by increases in cost related to theadditional content added to the 2016 and 2017 model-year motorcycles.
28

• Gross profit was negatively impacted by foreign currency due to lower hedge gains, given the significant gainsexperienced in the prior year, and lower revenues behind a slightly stronger U.S. dollar relative to its foreign currencyexposures.
• Shipment mix changes negatively impacted gross profit primarily due to changes in motorcycle family mix, driven bystrong customer demand for the Company's model-year 2016 S-model cruiser motorcycles, and model mix within itsmotorcycle families.
• Raw material prices were lower in 2016 compared to 2015.• Manufacturing costs for 2016 were negatively impacted by higher costs related to retooling and start-up costs at its
Pilgrim Road manufacturing facility associated with the Milwaukee-EightTM engine, the implementation of theCompany's ERP system at the Company's Kansas City manufacturing facility and a higher fixed cost per unit due tolower volumes, partially offset by favorable costs related to parts and accessories.
Operating expense which consists of selling, administrative and engineering expenses, was largely flat in 2016 comparedto 2015. In 2016, the Company significantly increased spending on marketing and product development to drive demand.However, these expense increases were mostly offset by decreases related to other items, including lower employee costs onfewer employees and lower reorganization costs. Reorganization costs, included in selling and administrative expenses, in thefourth quarters of 2016 and 2015, were $18.2 million and $23.3 million, respectively.
Financial Services Segment
Segment Results
The following table includes the condensed statement of operations for the Financial Services segment (in thousands):
2016 2015Increase
(Decrease)%
Change
Interest income $ 628,432 $ 605,770 $ 22,662 3.7 %Other income 85,788 80,888 4,900 6.1Securitization and servicing income 10,862 — 10,862 —Financial services revenue 725,082 686,658 38,424 5.6Interest expense 173,756 161,983 11,773 7.3Provision for credit losses 136,617 101,345 35,272 34.8Operating expenses 139,179 143,125 (3,946) (2.8)Financial Services expense 449,552 406,453 43,099 10.6Operating income from Financial Services $ 275,530 $ 280,205 $ (4,675) (1.7)%
Interest income was favorable in 2016 due to higher average receivables in the retail and wholesale portfolios. Otherincome was favorable primarily due to increased revenue from credit card licensing, insurance and protection products andinternational licensing revenue. Securitization and servicing income was higher primarily due to a $9.3 million gain on the saleof finance receivables with a principal balance of $301.8 million through an off-balance sheet asset-backed securitizationduring the second quarter of 2016. There was no comparable transaction in the prior year.
Interest expense increased due to a higher cost of funds and higher average debt outstanding, partially offset by a lowerloss on the extinguishment of a portion of the Company's 6.80% medium-term notes than in 2015.
The provision for credit losses increased $35.3 million compared to 2015. The retail motorcycle provision increased $39.8million during 2016 as a result of higher credit losses and increases in the retail reserve rate. Credit losses were higher as aresult of deteriorating performance across the portfolio, lower used motorcycle values at auction, and continued unfavorableperformance in oil-dependent areas.
Annual losses on the Company's retail motorcycle loans were 1.83% during 2016 compared to 1.42% in 2015. The 30-day delinquency rate for retail motorcycle loans at December 31, 2016 increased to 4.25% from 3.78% at December 31, 2015.
Changes in the allowance for credit losses on finance receivables were as follows (in thousands):
29

2016 2015
Balance, beginning of period $ 147,178 $ 127,364Provision for credit losses 136,617 101,345Charge-offs, net of recoveries (107,161) (81,531)Other (a) (3,291) —Balance, end of period $ 173,343 $ 147,178
(a) Related to the sale of finance receivables during the second quarter of 2016 with a principal balance of $301.8 millionthrough an off-balance sheet asset-backed securitization transaction (see Note 11 of the Notes to Consolidated FinancialStatements for additional information).
At December 31, 2016, the allowance for credit losses on finance receivables was $166.8 million for retail receivablesand $6.6 million for wholesale receivables. At December 31, 2015, the allowance for credit losses on finance receivables was$139.3 million for retail receivables and $7.9 million for wholesale receivables.
The Company's periodic evaluation of the adequacy of the allowance for credit losses on finance receivables is generallybased on the Company's past loan loss experience, known and inherent risks in the portfolio, current economic conditions andthe estimated value of any underlying collateral. Please refer to Note 5 of the Notes to Consolidated Financial Statements forfurther discussion regarding the Company’s allowance for credit losses on finance receivables.
Results of Operations 2015 Compared to 2014
Consolidated Results
(in thousands, except earnings per share) 2015 2014(Decrease)Increase
%Change
Operating income from Motorcycles & Related Products $ 875,490 $ 1,003,147 $ (127,657) (12.7)%Operating income from Financial Services 280,205 277,836 2,369 0.9 %Operating income 1,155,695 1,280,983 (125,288) (9.8)%Investment income 6,585 6,499 86 1.3 %Interest expense 12,117 4,162 7,955 191.1 %Income before income taxes 1,150,163 1,283,320 (133,157) (10.4)%Provision for income taxes 397,956 438,709 (40,753) (9.3)%Net income $ 752,207 $ 844,611 $ (92,404) (10.9)%Diluted earnings per share $ 3.69 $ 3.88 $ (0.19) (4.9)%
Consolidated operating income was down 9.8% in 2015 driven by a decrease in operating income from the Motorcyclessegment which decreased by $127.7 million compared to 2014. Operating income for the Financial Services segment increasedby $2.4 million during 2015 as compared to 2014. Please refer to the “Motorcycles and Related Products Segment” and“Financial Services Segment” discussions following for a more detailed discussion of the factors affecting operating income.
Corporate interest expense was higher in 2015 compared to 2014 due to the issuance of corporate debt in the third quarterof 2015.
The effective income tax rate for 2015 was 34.6% compared to 34.2% for 2014.
Diluted earnings per share were $3.69 in 2015, down 4.9% compared to 2014. Diluted earnings per share were adverselyimpacted by the 10.9% decrease in net income, but benefited from lower diluted weighted average shares outstanding. Dilutedweighted average shares outstanding decreased from 217.7 million in 2014 to 203.7 million in 2015 driven by the Company'srepurchases of common stock. Please refer to "Liquidity and Capital Resources" for additional information concerning theCompany's share repurchase activity.
30

Motorcycles Retail Sales and Registration Data
Harley-Davidson Motorcycle Retail Sales(a)
The following table includes retail unit sales of Harley-Davidson motorcycles:
2015 2014(Decrease)Increase
%Change
United States 168,240 171,079 (2,839) (1.7)%
Europe(b) 36,894 38,491 (1,597) (4.1)EMEA - Other 6,393 6,832 (439) (6.4) Total EMEA 43,287 45,323 (2,036) (4.5)
Japan 9,700 10,775 (1,075) (10.0)Asia Pacific - Other 22,558 19,299 3,259 16.9
Total Asia Pacific 32,258 30,074 2,184 7.3
Latin America 11,173 11,652 (479) (4.1)Canada 9,669 9,871 (202) (2.0) Total International Retail Sales 96,387 96,920 (533) (0.5) Total Worldwide Retail Sales 264,627 267,999 (3,372) (1.3)%
(a) Data source for retail sales figures shown above is new sales warranty and registration information provided by Harley-Davidson dealers and compiled by the Company. The Company must rely on information that its dealers supplyconcerning retail sales and this information is subject to revision.
(b) Includes Austria, Belgium, Denmark, Finland, France, Germany, Greece, Italy, Luxembourg, Netherlands, Norway,Portugal, Spain, Sweden, Switzerland and the United Kingdom.
Worldwide independent dealer retail sales of Harley-Davidson motorcycles decreased 1.3% during 2015 compared to2014. Retail sales of Harley-Davidson motorcycles decreased 1.7% in the United States and 0.5% internationally in 2015.
The Company believes 2015 U.S. retail sales of its motorcycles were negatively impacted by intense competitive activitybehind currency-driven discounting and new competitor products as well as a challenging macro-economic environment.
The Company's U.S. market share of 601+cc motorcycles for 2015 was 50.2%, down 3.1 percentage points compared to2014 (Source: Motorcycle Industry Council). The Company anticipated some level of market share loss following the 13.4percentage point increase in recent years; however, the Company's market share over the first three quarters was more severelyimpacted than expected, which the Company believes was a result of the intense competitive environment and the inclusion ofautocycles in the industry numbers.
International retail sales growth during 2015 in Asia Pacific was more than offset by declines in EMEA, Latin Americaand Canada. Retail sales in Asia Pacific were driven by growth in emerging markets and in Australia, partially offset bydeclines in Japan. The Company believes the retail sales decrease in EMEA was due to the introduction of several performance-oriented models by the competition. International retail sales as a percent of total retail sales in 2015 were 36.4% compared to36.2% in 2014.
Motorcycle Registration Data - 601+cc(a)
The following table includes industry retail motorcycle registration data:
2015 2014 Increase%
Change
United States(b) 328,818 313,627 15,191 4.8%Europe(c) 351,773 319,801 31,972 10.0%
31

(a) Data includes on-road 601+cc models. On-road 601+cc models include dual purpose models, three-wheeled motorcyclesand autocycles. Autocycles were included in the U.S. and Europe data beginning in 2014 and 2015, respectively.Registration data for Harley-Davidson Street® 500 motorcycles is not included in this table.
(b) United States industry data is derived from information provided by Motorcycle Industry Council (MIC). This third partydata is subject to revision and update.
(c) Europe data includes Austria, Belgium, Denmark, Finland, France, Germany, Greece, Italy, Luxembourg, Netherlands,Norway, Portugal, Spain, Sweden, Switzerland, and the United Kingdom. Industry retail motorcycle registration dataincludes 601+cc models derived from information provided by Association des Constructeurs Europeens de Motocycles(ACEM), an independent agency. This third-party data is subject to revision and update.
Motorcycles and Related Products SegmentMotorcycle Unit Shipments
The following table includes wholesale motorcycle unit shipments for the Motorcycles segment:
2015 2014 Unit Unit
Units Mix % Units Mix %(Decrease)Increase
%Change
United States 170,688 64.1% 173,994 64.3% (3,306) (1.9)%International 95,694 35.9% 96,732 35.7% (1,038) (1.1)Harley-Davidson motorcycle units 266,382 100.0% 270,726 100.0% (4,344) (1.6)%Touring motorcycle units 114,768 43.1% 122,481 45.2% (7,713) (6.3)%Cruiser motorcycle units 89,207 33.5% 91,426 33.8% (2,219) (2.4)Sportster® / Street motorcycle units(a) 62,407 23.4% 56,819 21.0% 5,588 9.8Harley-Davidson motorcycle units 266,382 100.0% 270,726 100.0% (4,344) (1.6)%
(a) Initial shipments of Street motorcycle units began during the first quarter of 2014.
During 2015, wholesale shipments of Harley-Davidson motorcycles were down 1.6% compared to the prior year.International shipments as a percentage of the total were up slightly in 2015 as compared to 2014. In addition, shipments ofSportster® / Street motorcycles as a percentage of total shipments increased in 2015 compared to the prior year driven by thestrong acceptance of the Street motorcycles as the Company continued its global rollout of these models in 2015. Touringmotorcycle shipments were down in 2015 following a 14.2% increase in shipments of Touring motorcycles in 2014 driven bydemand for the new Rushmore models. As the Company expected, dealer retail inventory of new Harley-Davidson motorcyclesin the U.S. at the end of 2015 was approximately 2,600 units higher than at the end of 2014, largely due to the initial dealer fillof its new 2016 model-year motorcycles.
32

Segment Results
The following table includes the condensed statement of operations for the Motorcycles segment (in thousands):
2015 2014(Decrease)Increase
%Change
Revenue:Motorcycles $ 4,127,739 $ 4,385,863 $ (258,124) (5.9)%Parts & Accessories 862,645 875,019 (12,374) (1.4)General Merchandise 292,310 284,826 7,484 2.6Other 26,050 21,973 4,077 18.6
Total revenue 5,308,744 5,567,681 (258,937) (4.7)Cost of goods sold 3,356,284 3,542,601 (186,317) (5.3)Gross profit 1,952,460 2,025,080 (72,620) (3.6)Selling & administrative expense 916,669 887,333 29,336 3.3Engineering expense 160,301 134,600 25,701 19.1Operating expense 1,076,970 1,021,933 55,037 5.4Operating income from Motorcycles $ 875,490 $ 1,003,147 $ (127,657) (12.7)%
The following table includes the estimated impact of the significant factors affecting the comparability of net revenue,cost of goods sold and gross profit from 2014 to 2015 (in millions):
NetRevenue
Cost ofGoodsSold
GrossProfit
2014 $ 5,568 $ 3,543 $ 2,025Volume (59) (29) (30)Price, net of related costs 81 9 72Foreign currency exchange rates and hedging (231) (110) (121)Shipment mix (50) (20) (30)Raw material prices — (19) 19Manufacturing and other costs — (17) 17Total (259) (186) (73)2015 $ 5,309 $ 3,357 $ 1,952
The following factors affected the comparability of net revenue, cost of goods sold and gross profit from 2014 to 2015:
• On average, wholesale prices on the Company’s 2015 and 2016 model-year motorcycles were higher than the priormodel-years resulting in the favorable impact on revenue during the period. The impact of revenue favorabilityresulting from model-year price increases on gross profit was partially offset by increases in cost related to theadditional content added to the 2015 and 2016 model-year motorcycles.
• Gross profit was negatively impacted by changes in foreign currency exchange rates during 2015 compared to 2014.Revenue was negatively impacted by a weighted-average devaluation in the Euro, Japanese yen, Brazilian real andAustralian dollar of 17% compared to 2014. The negative impact to revenue was partially offset by a positive impactto cost of goods sold as a result of natural hedges, benefits of foreign exchange contracts and a decrease in losses fromthe remeasurement of foreign-denominated assets on the balance sheet.
• Shipment mix changes negatively impacted gross profit primarily due to changes in motorcycle family mix, driven byhigher shipments of Sportster®/Street motorcycles. The negative motorcycle family mix was partially offset bypositive mix changes within parts and accessories and general merchandise.
• Raw material prices were lower in 2015 compared to 2014.• Manufacturing costs for 2015 benefited from increased manufacturing efficiencies and the absence of Street
motorcycles start-up costs that were incurred in 2014.
The net increase in operating expense was primarily due to reorganization charges, expenses associated with theacquisition and operations of its Canadian distribution and higher recall costs.
33

The Company incurred approximately $30 million of reorganization expenses in the fourth quarter of 2015. This includedapproximately $23 million of operating expense and $5 million of cost of goods sold in the Motorcycles segment. These costsconsisted of employee severance benefits, retirement benefits and other reorganization costs. The Company also incurredapproximately $2 million of reorganization expenses in the Financial Services segment.
On August 4, 2015, the Company completed its purchase of certain assets and liabilities from Fred Deeley Imports, Ltd(Deeley Imports) including, among other things, the acquisition of the exclusive right to distribute the Company's motorcyclesand other products in Canada. As a result of the acquisition, the Company directly distributes its products in Canada as it doesin other countries. The Company incurred approximately $20 million of selling and administrative expense related to itsCanada operations in 2015.
Financial Services Segment
Segment Results
The following table includes the condensed statements of operations for the Financial Services segment (in thousands):
2015 2014Increase
(Decrease)%
Change
Interest income $ 605,770 $ 585,187 $ 20,583 3.5%Other income 80,888 75,640 5,248 6.9Financial services revenue 686,658 660,827 25,831 3.9Interest expense 161,983 164,476 (2,493) (1.5)Provision for credit losses 101,345 80,946 20,399 25.2Operating expenses 143,125 137,569 5,556 4.0Financial Services expense 406,453 382,991 23,462 6.1Operating income from Financial Services $ 280,205 $ 277,836 $ 2,369 0.9%
Interest income was favorable due to higher average receivables in the retail and wholesale portfolios, partially offset by alower retail yield due to low rate promotions during parts of 2015 and increased competition. Other income was favorableprimarily due to increased credit card licensing and insurance revenue. Other income now includes international income whichhad previously been reported in interest income. Prior period amounts, which were not material, have been adjusted forcomparability.
Interest expense benefited from a more favorable cost of funds and a lower loss on the extinguishment of a portion of theCompany's 6.80% medium-term notes than in 2014, partially offset by higher average outstanding debt.
The provision for credit losses increased $20.4 million compared to 2014. The retail motorcycle provision increased $18.2million during 2015 as a result of higher credit losses and portfolio growth. Credit losses were higher as a result of expectedincreased losses in the subprime portfolio, lower recovery values on repossessed motorcycles, and deterioration in performancein oil-dependent areas of the U.S. in late 2015.
Annual losses on the Company's retail motorcycle loans were 1.42% during 2015 compared to 1.22% in 2014. The 30-day delinquency rate for retail motorcycle loans at December 31, 2015 increased to 3.78% from 3.61% at December 31, 2014.
Changes in the allowance for credit losses on finance receivables were as follows (in thousands):
2015 2014
Balance, beginning of period $ 127,364 $ 110,693Provision for credit losses 101,345 80,946Charge-offs, net of recoveries (81,531) (64,275)Balance, end of period $ 147,178 $ 127,364
At December 31, 2015, the allowance for credit losses on finance receivables was $139.3 million for retail receivablesand $7.9 million for wholesale receivables. At December 31, 2014, the allowance for credit losses on finance receivables was$122.0 million for retail receivables and $5.3 million for wholesale receivables.
34

Other Matters
New Accounting Standards Not Yet Adopted
In May 2014, the Financial Accounting Standards Board (FASB) issued Accounting Standards Update (ASU)No. 2014-09 Revenue from Contracts with Customers (ASU 2014-09). ASU 2014-09 is a comprehensive new revenuerecognition model that requires a company to recognize revenue to depict the transfer of goods or services to customers in anamount that reflects the consideration to which the company expects to be entitled in exchange for those goods or services. InAugust 2015, the FASB issued ASU No. 2015-14 Revenue from Contracts with Customers: Deferral of Effective Date (ASU2015-14) to defer the effective date of the new revenue recognition standard by one year to fiscal years beginning afterDecember 15, 2017 and interim periods therein. The guidance may be adopted using either a full retrospective or a modifiedretrospective approach. The Company expects to adopt the new revenue recognition guidance using the modified retrospectivemethod. The Company's efforts to evaluate the impact and to prepare for its adoption on January 1, 2018 are well underway.Based on the work completed to date (which includes the review of significant domestic revenue sources), the Companyexpects that the recognition of revenue for domestic sales of motorcycles, parts and accessories and general merchandiseproducts under the new revenue recognition guidance will occur at a point in time, which is consistent with current practice.The Company is continuing to evaluate its international revenue sources for potential impact, but based on the work completedto date, expects its conclusions will be consistent with those reached for domestic revenue sources. Interest income, whichmakes up the vast majority of revenue in the Financial Services segment, is not within the scope of the new standard.
In July 2015, the FASB issued ASU No. 2015-11 Inventory (Topic 330): Simplifying the Measurement of Inventory(ASU 2015-11). ASU 2015-11 simplifies the subsequent measurement of inventory by using only the lower of cost or netrealizable value. ASU 2015-11 does not apply to inventory measured using the last-in, first-out method. The Company isrequired to adopt ASU 2015-11 for fiscal years, and for interim periods within those fiscal years, beginning after December 15,2016 on a prospective basis. Early adoption will be permitted. The adoption of ASU 2015-11 will not have a material effect onthe Company’s consolidated financial statements.
In January 2016, the FASB issued ASU No. 2016-01 Financial Instruments-Overall (Subtopic 825-10): Recognition andMeasurement of Financial Assets and Financial Liabilities (ASU 2016-01). ASU 2016-01 enhances the existing financialinstruments reporting model by modifying fair value measurement tools, simplifying impairment assessments for certain equityinstruments, and modifying overall presentation and disclosure requirements. The Company is required to adopt ASU 2016-01for fiscal years, and for interim periods within those fiscal years, beginning after December 15, 2017 on a prospective basis.The Company is currently evaluating the impact of adoption of ASU 2016-01.
In February 2016, the FASB issued ASU No. 2016-02 Leases (Topic 842) (ASU 2016-02). ASU 2016-02 amends theexisting lease accounting model by requiring a lessee to recognize the rights and obligations resulting from certain leases asassets and liabilities on the balance sheet. ASU 2016-02 also requires a company to disclose key information about their leasingarrangements. The Company is required to adopt ASU 2016-02 for fiscal years, and for interim periods within those fiscalyears, beginning after December 15, 2018 using a modified retrospective approach. Early adoption is permitted. The Companyis currently evaluating the impact of adoption of ASU 2016-02.
In March 2016, the FASB issued ASU No. 2016-09 Compensation – Stock Compensation (Topic 718): Improvements toEmployee Share-Based Payment Accounting (ASU 2016-09). ASU 2016-09 amends the guidance on several aspects ofaccounting for share-based payment transactions, including income tax consequences, classification of awards as either equityor liabilities, accounting for forfeitures, and classification on the statement of cash flows. The Company is required to adoptASU 2016-09 for fiscal years, and for interim periods within those fiscal years, beginning after December 15, 2016 on both aretrospective and prospective basis dependent upon the nature of the subtopic. Early adoption is permitted, including adoptionin an interim period. The Company does not expect the adoption of ASU 2016-09 to have a material impact on its financialstatements.
In July 2016, the FASB issued ASU No. 2016-13 Financial Instruments-Credit Losses (Topic 326): Measurement ofCredit Losses on Financial Instruments (ASU 2016-13). ASU 2016-13 changes how to recognize expected credit losses onfinancial assets. The standard requires a more timely recognition of credit losses on loans and other financial assets and alsoprovides additional transparency about credit risk. The current credit loss standard generally requires that a loss actually beincurred before it is recognized, while the new standard will require recognition of full lifetime expected losses upon initialrecognition of the financial instrument. The Company is required to adopt ASU 2016-13 for fiscal years, and for interimperiods within those fiscal years, beginning after December 15, 2019 on a modified retrospective basis. Early adoption ispermitted for fiscal years beginning after December 15, 2018. An entity should apply the standard by recording a cumulativeeffect adjustment to retained earnings upon adoption. Adoption of this standard will impact how the Company recognizes creditlosses on its financial instruments. The Company is currently evaluating the impact of adoption of ASU 2016-13 but anticipates
35

the adoption of ASU 2016-13 will result in an increase in the annual provision for credit losses and the related allowance forcredit losses.
In August 2016, the FASB issued ASU No. 2016-15 Statement of Cash Flows (Topic 230): Classification of Certain CashReceipts and Cash Payments (ASU 2016-15). ASU 2016-15 addresses eight specific cash flow issues with the objective ofreducing diversity in practice regarding how certain cash receipts and cash payments are presented in the statement of cashflows. The standard provides guidance on the classification of the following items: (1) debt prepayment or debt extinguishmentcosts, (2) settlement of zero-coupon debt instruments, (3) contingent consideration payments made after a businesscombination, (4) proceeds from the settlement of insurance claims, (5) proceeds from the settlement of corporate-owned lifeinsurance policies, (6) distributions received from equity method investments, (7) beneficial interests in securitizationtransactions, and (8) separately identifiable cash flows. The Company is required to adopt ASU 2016-15 for fiscal years, andfor interim periods within those fiscal years, beginning after December 15, 2017 on a retrospective basis. Early adoption ispermitted, including adoption in an interim period. The Company is currently evaluating the impact of adoption of ASU2016-15.
In October 2016, the FASB issued ASU No. 2016-16 Income Taxes (Topic 740): Intra-Entity Transfers of Assets OtherThan Inventory (ASU 2016-16). ASU 2016-16 states that an entity should recognize the income tax consequences of an intra-entity transfer of an asset other than inventory when the transfer occurs. Two common assets included in the scope of the ASUare intellectual property and property, plant and equipment. The Company is required to adopt ASU 2016-16 for fiscal years,and for interim periods within those fiscal years, beginning after December 15, 2017 using a modified retrospective approachwith a cumulative-effect adjustment to retained earnings. Early adoption is permitted as of the beginning of an annual reportingperiod. The Company does not expect the adoption of ASU 2016-16 to have a material impact on its financial statements.
In November 2016, the FASB issued ASU No. 2016-18 Statement of Cash Flows (Topic 230): Restricted Cash (ASU2016-18). ASU 2016-18 requires that a statement of cash flows explain the change during the period in the total of cash, cashequivalents, and amounts generally described as restricted cash or restricted cash equivalents. As such, restricted cash andrestricted cash equivalents should be included with cash and cash equivalents when reconciling the beginning-of-period andending-of-period total amounts shown on the statement of cash flows. The Company is required to adopt ASU 2016-18 forfiscal years, and for interim periods within those fiscal years, beginning after December 15, 2017 on a retrospective basis. Earlyadoption is permitted, including adoption in an interim period. The Company reported a $43.5 million financing cash inflowrelated to a change in restricted cash for the period ended December 31, 2016. Subsequent to the adoption of ASU 2016-18, thechange in restricted cash would be excluded from the change in cash flows from financing activities and included in the changein total cash, restricted cash and cash equivalents as reported in the statement of cash flows.
Critical Accounting Estimates
The Company’s financial statements are based on the selection and application of significant accounting policies, whichrequire management to make significant estimates and assumptions. Management believes that the following are some of themore critical judgment areas in the application of accounting policies that currently affect the Company’s financial conditionand results of operations. Management has discussed the development and selection of these critical accounting estimates withthe Audit Committee of the Board of Directors.
Allowance for Credit Losses on Finance Receivables – The allowance for uncollectible accounts is maintained at a levelmanagement believes is adequate to cover the losses of principal in the existing finance receivables portfolio.
The retail portfolio consists of a large number of small balance, homogeneous finance receivables. The Companyperforms a periodic and systematic collective evaluation of the adequacy of the retail allowance. The Company utilizes lossforecast models which consider a variety of factors including, but not limited to, historical loss trends, origination or vintageanalysis, known and inherent risks in the portfolio, the value of the underlying collateral, recovery rates and current economicconditions including items such as unemployment rates.
The wholesale portfolio is primarily composed of large balance, non-homogeneous finance receivables. The Company'swholesale allowance evaluation is first based on a loan-by-loan review. A specific allowance is established for wholesalefinance receivables determined to be individually impaired when management concludes that the borrower will not be able tomake full payment of contractual amounts due based on the original terms of the loan agreement. The impairment is determinedbased on the cash that the Company expects to receive discounted at the loan’s original interest rate or the fair value of thecollateral, if the loan is collateral-dependent. Finance receivables in the wholesale portfolio that are not individually evaluatedfor impairment are segregated, based on similar risk characteristics, according to the Company’s internal risk rating system andcollectively evaluated for impairment. The related allowance is based on factors such as the Company’s past loan loss
36

experience, the specific borrower’s financial performance as well as ability to repay, current economic conditions as well as thevalue of the underlying collateral.
Product Warranty – Estimated warranty costs are reserved for motorcycles, motorcycle parts and motorcycle accessoriesat the time of sale. The warranty reserve is based upon historical Company claim data used in combination with other knownfactors that may affect future warranty claims. The Company updates its warranty estimates quarterly to ensure that thewarranty reserves are based on the most current information available.
The Company believes that past claim experience is indicative of future claims; however, the factors affecting actualclaims can be volatile. As a result, actual claims experience may differ from estimated, which could lead to material changes inthe Company’s warranty provision and related reserves. The Company’s warranty liability is discussed further in Note 1 of theNotes to Consolidated Financial Statements.
Pensions and Other Postretirement Healthcare Benefits – The Company has a defined benefit pension plan and severalpostretirement healthcare benefit plans, which cover employees of the Motorcycles segment. The Company also has unfundedsupplemental employee retirement plan agreements (SERPA) with certain employees, which were instituted to replace benefitslost under the Tax Revenue Reconciliation Act of 1993.
U.S. GAAP requires that companies recognize in their statement of financial position a liability for defined benefitpension and postretirement plans that are underfunded or an asset for defined benefit pension and postretirement benefit plansthat are overfunded.
Pension, SERPA and postretirement healthcare obligations and costs are calculated through actuarial valuations. Thevaluation of benefit obligations and net periodic benefit costs relies on key assumptions including discount rates, mortality,long-term expected return on plan assets, future compensation and healthcare cost trend rates.
The Company determines its discount rate assumptions by referencing high-quality long-term bond rates that are matchedto the duration of its own benefit obligations. Based on this analysis, the Company decreased the weighted-average discountrate for pension and SERPA obligations from 4.53% as of December 31, 2015 to 4.30% as of December 31, 2016. TheCompany decreased the weighted-average discount rate for postretirement healthcare obligations from 4.29% to 4.03%. TheCompany determines its healthcare trend assumption for the postretirement healthcare obligation by considering factors such asestimated healthcare inflation, the utilization of healthcare benefits and changes in the health of plan participants. Based on theCompany’s assessment of this data as of December 31, 2016, the Company set its healthcare cost trend rate at 7.25% as ofDecember 31, 2016. The Company expects the healthcare cost trend rate to reach its ultimate rate of 5.00% by 2021.(1) Theseassumption changes were reflected immediately in the benefit obligation and will be amortized into net periodic benefit costsover future periods.
Plan assets are measured at fair value and are subject to market volatility. In estimating the expected return on plan assets,the Company considers the historical returns on plan assets, adjusted to reflect the current view of the long-term investmentmarket.
Changes in the funded status of defined benefit pension and postretirement benefit plans resulting from the differencebetween assumptions and actual results are initially recognized in other comprehensive income and amortized to expense overfuture periods. The following information is provided to illustrate the sensitivity of pension and postretirement healthcareobligations and costs to changes in these major assumptions (in thousands):
Amounts basedon currentassumptions
Impact of a 1%decrease in thediscount rate
Impact of a 1%decrease in the
expectedreturn on assets
Impact of a 1%increase in thehealthcare
cost trend rate
2016 Net periodic benefit costsPension and SERPA $ 27,316 $ 29,850 $ 19,443 n/aPostretirement healthcare $ 10,957 $ 881 $ 1,609 $ 1,564
2016 Benefit obligationsPension and SERPA $ 1,986,435 $ 335,111 n/a n/aPostretirement healthcare $ 346,431 $ 31,837 n/a $ 12,670
This information should not be viewed as predictive of future amounts. The analysis of the impact of a 1% change in thetable above does not take into account the cost related to special termination benefits. The calculation of pension, SERPA andpostretirement healthcare obligations and costs is based on many factors in addition to those discussed here. This information
37

should be considered in combination with the information provided in Note 13 of the Notes to Consolidated FinancialStatements.
Stock Compensation Costs – The total cost of the Company’s share-based equity awards is equal to the grant date fairvalue per award multiplied by the number of awards granted, adjusted for awards that do not ultimately vest. The total cost ofthe Company’s liability-based equity awards is equal to the report date fair value per award multiplied by the number of awardsgranted, adjusted for awards that do not ultimately vest. These costs are recognized as expense on a straight-line basis over theservice or performance periods of the awards. Forfeitures resulting from the failure to satisfy service requirements are initiallyestimated based on historical Company information and subsequently updated over the life of the awards to ultimately reflectactual forfeitures. For performance-based awards, the number of awards expected to vest is also based on the estimatedachievement of performance goals which is updated periodically over the life of the awards and ultimately reflects the actuallevel of achievement. As a result, changes in the level of forfeiture activity and the level of achievement of performance goalscan influence the amount of stock compensation cost recognized from period to period.
The Company did not grant option awards in 2016. In prior years, the Company estimated the fair value of option awardsas of the grant date using a lattice-based option valuation model which utilizes ranges of assumptions over the expected term ofthe options, including stock price volatility, dividend yield and risk-free interest rate.
The valuation model used historical data to estimate option exercise behavior and employee terminations. The expectedterm of options granted was derived from the output of the option valuation model and represents the average period of timethat options granted are expected to be outstanding.
The Company used implied volatility to determine the expected volatility of its stock. The implied volatility is derivedfrom options that are actively traded and the market prices of both the traded options and underlying shares are measured at asimilar point in time to each other and on a date reasonably close to the grant date of the employee stock options. In addition,the traded options have exercise prices that are both (a) near-the-money and (b) close to the exercise price of the employeestock options. Finally, the remaining maturities of the traded options on which the estimate is based are at least one year.
Dividend yield was based on the Company’s expected dividend payments and the risk-free rate was based on the U.S.Treasury yield curve in effect at the time of grant.
Income Taxes – The Company accounts for income taxes in accordance with ASC Topic 740, “Income Taxes.” Deferredtax assets and liabilities are recognized for the future tax consequences attributable to differences between financial statementcarrying amounts of existing assets and liabilities and their respective tax bases and operating loss and other loss carry-forwards. Deferred tax assets and liabilities are measured using enacted tax rates expected to apply to taxable income in theyears in which those temporary differences are expected to be recovered or settled.
The Company is subject to income taxes in the U.S. and numerous foreign jurisdictions. Significant judgment is requiredin determining the Company’s worldwide provision for income taxes and recording the related deferred tax assets andliabilities. In the ordinary course of the Company’s business, there are transactions and calculations where the ultimate taxdetermination is uncertain. Accruals for unrecognized tax benefits are provided for in accordance with the requirements of ASCTopic 740. An unrecognized tax benefit represents the difference between the recognition of benefits related to items forincome tax reporting purposes and financial reporting purposes. The unrecognized tax benefit is included within other long-term liabilities in the Consolidated Balance Sheets. The Company has a reserve for interest and penalties on exposure items, ifapplicable, which is recorded as a component of the overall income tax provision. The Company is regularly audited by taxauthorities as a normal course of business. Although the outcome of tax audits is always uncertain, management believes that ithas appropriate support for the positions taken on its tax returns and that its annual tax provision includes amounts sufficient topay any assessments. Nonetheless, the amounts ultimately paid, if any, upon resolution of the issues raised by the taxingauthorities may differ materially from the amounts accrued for each year.
Contractual Obligations
A summary of the Company’s expected payments for significant contractual obligations as of December 31, 2016 is asfollows (in thousands):
2017 2018-2019 2020-2021 Thereafter Total
Principal payments on debt $ 2,145,781 $ 2,675,694 $ 1,258,814 $ 750,000 $ 6,830,289Interest payments on debt 175,286 208,704 87,675 396,000 867,665Operating lease payments 13,900 24,598 14,151 11,965 64,614
$ 2,334,967 $ 2,908,996 $ 1,360,640 $ 1,157,965 $ 7,762,568
38

Interest for floating rate instruments assumes December 31, 2016 rates remain constant.
As of December 31, 2016, the Company generally had no significant purchase obligations, other than those created in theordinary course of business. Purchase orders issued for inventory and supplies used in product manufacturing generally do notbecome firm commitments until 90 days prior to expected delivery and can be modified to a certain extent until 30 days prior toexpected delivery.
The Company has long-term obligations related to its pension, SERPA and postretirement healthcare plans atDecember 31, 2016. The Company’s retirement plan obligations and expected future contributions and payments related tothese plans are provided in Note 13 of the Notes to Consolidated Financial Statements.
As described in Note 12 of the Notes to Consolidated Financial Statements, the Company has unrecognized tax benefitsof $55.5 million and accrued interest and penalties of $28.1 million as of December 31, 2016. However, the Company cannotmake a reasonably reliable estimate of the period of cash settlement for either the liability for unrecognized tax benefits oraccrued interest and penalties.
Commitments and Contingencies
The Company is subject to lawsuits and other claims related to environmental, product and other matters. In determiningrequired reserves related to these items, the Company carefully analyzes cases and considers the likelihood of adversejudgments or outcomes, as well as the potential range of possible loss. The required reserves are monitored on an ongoing basisand are updated based on new developments or new information in each matter.
Environmental Protection Agency Notice:
In December 2009, the Company received formal, written requests for information from the United States EnvironmentalProtection Agency (EPA) regarding: (i) certificates of conformity for motorcycle emissions and related designations and labels,(ii) aftermarket parts, and (iii) warranty claims on emissions related components. The Company promptly submitted writtenresponses to the EPA’s inquiry and has engaged in discussions with the EPA. Since that time, the EPA delivered variousadditional requests for information to which the Company responded. More recently, in August 2016, the Company entered intoa consent decree with the EPA regarding these issues (the Settlement). In the Settlement the Company agreed to, among otherthings, pay a fine, fund a three-year emissions mitigation project, and not sell tuning products unless they are approved by theEPA or California Air Resources Board. The Company anticipates the EPA will move the court to finalize the Settlement in thecoming months. The Company has a reserve associated with this matter which is included in accrued liabilities in theConsolidated Balance Sheet, and as a result, if it is finalized, the Settlement would not have a material adverse effect on theCompany's financial condition or results of operations. The Settlement is not final until it is approved by the court, and if it isnot approved by the court, the Company cannot reasonably estimate the impact of any remedies the EPA might seek beyond theCompany's current reserve for this matter.
York Environmental Matters:
The Company is involved with government agencies and groups of potentially responsible parties related to a matterinvolving the cleanup of soil and groundwater contamination at its York, Pennsylvania facility. The York facility was formerlyused by the U.S. Navy and AMF prior to the purchase of the York facility by the Company from AMF in 1981. Although theCompany is not certain as to the full extent of the environmental contamination at the York facility, it has been working withthe Pennsylvania Department of Environmental Protection (PADEP) since 1986 in undertaking environmental investigation andremediation activities, including a site-wide remedial investigation/feasibility study (RI/FS).
In January 1995, the Company entered into a settlement agreement (the Agreement) with the Navy, and the partiesamended the Agreement in 2013 to address ordnance and explosive waste. The Agreement calls for the Navy and the Companyto contribute amounts into a trust equal to 53% and 47%, respectively, of costs associated with environmental investigation andremediation activities at the York facility (Response Costs). The trust administers the payment of the Response Costs incurredat the York facility as covered by the Agreement.
The Company has a reserve for its estimate of its share of the future Response Costs at the York facility which is includedin accrued liabilities in the Consolidated Balance Sheets. While much of the work on the RI/FS is complete, it is still underagency review and given the uncertainty that exists concerning the nature and scope of additional environmental investigationand remediation that may ultimately be required under the RI/FS that is finally approved or otherwise at the York facility, theCompany is unable to make a reasonable estimate of those additional costs, if any, that may result.
39
The estimate of the Company's future Response Costs that will be incurred at the York facility is based on reports ofindependent environmental consultants retained by the Company, the actual costs incurred to date and the estimated costs tocomplete the necessary investigation and remediation activities.
Product Liability Matters:
The Company is involved in product liability suits related to the operation of its business. The Company accrues for claimexposures that are probable of occurrence and can be reasonably estimated. The Company also maintains insurance coveragefor product liability exposures. The Company believes that its accruals and insurance coverage are adequate and that productliability suits will not have a material adverse effect on the Company’s consolidated financial statements.(1)
National Highway Traffic Safety Administration Matters:
In July 2016, the National Highway Traffic Safety Administration (NHTSA) began an investigation into certain of theCompany's model-year 2008-2011 motorcycles equipped with anti-lock braking systems (ABS). NHTSA’s investigation is inresponse to rider complaints related to brake failures. NHTSA noted that Harley-Davidson has a two-year brake fluidreplacement interval that owners either are unaware of or ignore. The Company does not believe that a loss related to thismatter is probable and no reserve has been established. However, it is possible that the outcome of NHTSA’s investigationcould result in future costs to the Company. Given the uncertainty that still exists concerning the resolution of this matter, theCompany cannot reasonably estimate these possible future costs, if any.
Off-Balance Sheet Arrangements
The Company participates in asset-backed financing both through asset-backed securitization transactions and throughasset-backed commercial paper conduit facilities. In the Company's asset-backed financing programs, the Company transfersretail motorcycle finance receivables to special purpose entities (SPE), which are considered Variable Interest Entities (VIE)under U.S. GAAP. Each SPE then converts those assets into cash, through the issuance of debt. The Company retains servicingrights for all of the retail motorcycle finance receivables transferred to SPEs as part of an asset-backed financing.
The SPEs are separate legal entities that assume the risks and rewards of ownership of the retail motorcycle financereceivables they hold. The assets of the VIEs are not available to pay other obligations or claims of the Company’s creditors.The Company’s economic exposure related to the VIEs is generally limited to restricted cash reserve accounts, retainedinterests and ordinary representations and warranties and related covenants. The VIEs have a limited life and generallyterminate upon final distribution of amounts owed to investors.
The accounting treatment for asset-backed financings depends on the terms of the related transaction and the Company’scontinuing involvement with the VIE. Most of the Company’s asset-backed financings do not meet the criteria to be treated as asale for accounting purposes because, in addition to retaining servicing rights, the Company retains a financial interest in theVIE in the form of a debt security. These transactions are treated as secured borrowings. As secured borrowings, the retailmotorcycle finance receivables remain on the balance sheet with a corresponding obligation reflected as debt.
During the second quarter of 2016, the Company sold finance receivables with a principal balance of $301.8 million intoa securitization VIE. The transaction met the criteria to be treated as a sale for accounting purposes and resulted in an off-balance sheet arrangement because the Company did not retain any financial interest in the VIE beyond servicing rights andordinary representations and warranties and related covenants. Upon sale, the retail motorcycle finance receivables wereremoved from the Company’s balance sheet and a gain of $9.3 million was recognized in Financial Services Revenue. For moreinformation see Note 11 of the Notes to Consolidated Financial Statements.
Liquidity and Capital Resources as of December 31, 2016
Over the long-term, the Company expects that its business model will continue to generate cash that will allow it to investin the business, fund future growth opportunities and return value to shareholders.(1) The Company believes the Motorcyclesoperations will continue to be primarily funded through cash flows generated by operations.(1) The Company’s FinancialServices operations will continue to be funded with unsecured debt, unsecured commercial paper, asset-backed commercialpaper conduit facilities, committed unsecured bank facilities, asset-backed securitizations and intercompany borrowings.
40

The Company’s strategy is to maintain a minimum of twelve months of its projected liquidity needs through acombination of cash and marketable securities and availability under credit facilities. The following table summarizes theCompany’s cash and marketable securities and availability under credit facilities (in thousands):
December 31, 2016
Cash and cash equivalents $ 759,984Current marketable securities 5,519Total cash and cash equivalents and marketable securities 765,503
Credit facilities 409,292Asset-backed U.S. commercial paper conduit facilities (a) 900,000Asset-backed Canadian commercial paper conduit facility (b) 28,857Total availability under credit facilities 1,338,149Total $ 2,103,652
(a) The U.S. commercial paper conduit facilities expire on December 13, 2017. The Company anticipates that it will renewthese facilities prior to expiration.(1)
(b) The Canadian commercial paper conduit facility expires on June 30, 2017 and is limited to Canadian denominatedborrowings. The Company anticipates that it will renew this facility prior to expiration.(1)
The Company recognizes that it must continue to adjust its business to changes in the lending environment. The Companyintends to continue with a diversified funding profile through a combination of short-term and long-term funding vehicles andto pursue a variety of sources to obtain cost-effective funding.(1) The Financial Services operations could be negatively affectedby higher costs of funding and the increased difficulty of raising, or potential inability to raise, funding in the short-term andlong-term capital markets.(1) These negative consequences could in turn adversely affect the Company’s business and results ofoperations in various ways, including through higher costs of capital, reduced funds available through its Financial Servicesoperations to provide loans to independent dealers and their retail customers, and dilution to existing shareholders through theuse of alternative sources of capital.
Cash Flow Activity
The following table summarizes the cash flow activity of continuing operations for the years ended December 31, 2016,2015 and 2014 (in thousands):
2016 2015 2014
Net cash provided by operating activities $ 1,174,339 $ 1,100,118 $ 1,146,677Net cash used by investing activities (392,731) (915,848) (744,650)Net cash used by financing activities (734,390) (354,064) (536,096)Effect of exchange rate changes on cash and cash equivalents (9,443) (14,677) (25,863)Net increase (decrease) in cash and cash equivalents $ 37,775 $ (184,471) $ (159,932)
Operating Activities
The increase in operating cash flow in 2016 compared to 2015 was due primarily to lower net cash outflows fromwholesale lending, due to lower originations, and favorable changes in working capital driven by a reduction in inventory.These favorable impacts were partially offset by the impact of a qualified pension plan contribution and lower net income. Atthe end of 2016, inventory was $86.0 million lower than 2015 driven by lower finished goods, parts and accessories andgeneral merchandise inventories.
During 2016, the Company voluntarily contributed $25.0 million to its qualified pension plans; there were nocontributions in 2015. In January 2017, the Company voluntarily contributed $25.0 million to further fund its qualified pensionplan; the Company expects that no additional contributions will be required in 2017.(1) The Company also expects it willcontinue to make on-going payments related to benefits due under the SERPA and postretirement healthcare plans. TheCompany’s expected future contributions and benefit payments related to these plans are provided in Note 13 of the Notes toConsolidated Financial Statements.
41

The decrease in operating cash flow in 2015 compared to 2014 was due primarily to lower net income and increased netcash outflow for wholesale lending.
Investing Activities
The Company’s investing activities consist primarily of capital expenditures, net changes in retail finance receivables andshort-term investment activity. Capital expenditures were $256.3 million, $260.0 million and $232.3 million during 2016, 2015and 2014, respectively.
Net cash outflows for finance receivables for 2016, which consisted primarily of retail finance receivables, were $125.5million lower than 2015 as a result of a decrease in retail motorcycle loan originations during 2016. Net cash outflows forfinance receivables for 2015 were $59.8 million higher than 2014 as a result of an increase in retail motorcycle loanoriginations during 2015.
Changes in the Company’s investment in marketable securities resulted in cash inflows of $40.0 million, $11.5 millionand $41.0 million in 2016, 2015 and 2014, respectively.
During 2016, the Company completed a sale of finance receivables through an off-balance sheet asset-backedsecuritization. The proceeds from the sale of finance receivables, which positively impacted cash flow, were $312.6 million.
During 2015, the Company recorded a $59.9 million cash outflow for the purchase of certain assets and liabilities fromFred Deeley Imports, Ltd.
Financing Activities
The Company’s financing activities consist primarily of dividend payments, share repurchases and debt activity.
The Company paid dividends of $1.40 per share totaling $252.3 million during 2016, $1.24 per share totaling $249.3million during 2015 and $1.10 per share totaling $238.3 million during 2014.
Cash outflows from share repurchases were $465.3 million, $1.54 billion and $615.6 million for 2016, 2015 and 2014,respectively. Share repurchases during 2016, 2015 and 2014 included 9.9 million, 28.0 million and 9.3 million shares ofcommon stock, respectively, related to discretionary share repurchases and shares of common stock that employees surrenderedto satisfy withholding taxes in connection with the vesting of restricted stock awards. In February 2016, the Company's Boardof Directors separately authorized the Company to buy back up to an additional 20 million shares of its common stock with nodollar limit or expiration date of which 19.3 million shares remained available at December 31, 2016.
Financing cash flows related to debt activity resulted in net cash outflows of $78.3 million for 2016 and net cash inflowsof $1.40 billion and $245.7 million for 2015 and 2014, respectively. The Company’s total outstanding debt consisted of thefollowing as of December 31, 2016, 2015 and 2014 (in thousands):
2016 2015 2014
Unsecured commercial paper $ 1,055,708 $ 1,201,380 $ 731,786Asset-backed Canadian commercial paper conduit facility 149,338 153,839 166,912Medium-term notes, net 4,064,940 3,316,949 3,325,285Senior unsecured notes, net 741,306 740,653 —Term asset-backed securitization debt, net 796,275 1,459,377 1,268,419Total debt $ 6,807,567 $ 6,872,198 $ 5,492,402
To access the debt capital markets, the Company relies on credit rating agencies to assign short-term and long-term creditratings. Generally, lower credit ratings result in higher borrowing costs and reduced access to debt capital markets. A creditrating agency may change or withdraw the Company’s ratings based on its assessment of the Company’s current and futureability to meet interest and principal repayment obligations. The Company’s short-term debt ratings affect its ability to issueunsecured commercial paper. The Company’s short- and long-term debt ratings as of December 31, 2016 were as follows:
Short-Term Long-Term Outlook
Moody’s P2 A3 StableStandard & Poor’s A2 A- StableFitch F1 A Stable
42

Credit Facilities – On April 7, 2016, the Company entered into a $765.0 million five-year credit facility to refinance andreplace a $675.0 million five-year credit facility that was due to mature in April 2017. The new five-year credit facility maturesin April 2021. The Company also has a $675.0 million five-year credit facility which matures in April 2019. The new five-yearcredit facility and the existing five-year credit facility (together, the Global Credit Facilities) bear interest at variable interestrates, which may be adjusted upward or downward depending on certain criteria, such as credit ratings. The Global CreditFacilities also require the Company to pay a fee based on the average daily unused portion of the aggregate commitments underthe Global Credit Facilities. The Global Credit Facilities are committed facilities primarily used to support the Company'sunsecured commercial paper program. During May 2016, the Company entered into an additional $25.0 million credit facilitywhich expires May 24, 2017. The $25.0 million credit facility bears interest at variable interest rates, and the Company mustpay a fee based on the unused portion of the $25.0 million commitment.
Unsecured Commercial Paper – Subject to limitations, the Company could issue unsecured commercial paper of up to$1.44 billion as of December 31, 2016 supported by the Global Credit Facilities, as discussed above. Outstanding unsecuredcommercial paper may not exceed the unused portion of the Global Credit Facilities. Maturities may range up to 365 days fromthe issuance date. The Company intends to repay unsecured commercial paper as it matures with additional unsecuredcommercial paper or through other means, such as borrowing under the Global Credit Facilities, borrowing under its asset-backed U.S. commercial paper conduit facility or through the use of operating cash flow and cash on hand.(1)
Medium-Term Notes – The Company has the following medium-term notes (collectively, the Notes) issued andoutstanding at December 31, 2016 (in thousands):
Principal Amount Rate Issue Date Maturity Date
$400,000 2.70% January 2012 March 2017$400,000 1.55% November 2014 November 2017$877,488 6.80% May 2008 June 2018$600,000 2.25% January 2016 January 2019$600,000 2.40% September 2014 September 2019$600,000 2.15% February 2015 February 2020$600,000 2.85% January 2016 January 2021
The Notes provide for semi-annual interest payments and principal due at maturity.
Senior Unsecured Notes – In July 2015, the Company issued $750.0 million of senior unsecured notes in an underwrittenoffering. The senior unsecured notes provide for semi-annual interest payments and principal due at maturity. $450.0 million ofthe senior unsecured notes mature in July 2025 and have an interest rate of 3.50%, and $300.0 million of the senior unsecurednotes mature in July 2045 and have an interest rate of 4.625%. The Company used the proceeds from the debt to repurchaseshares of its common stock in 2015.
On-Balance Sheet Asset-Backed Canadian Commercial Paper Conduit Facility – The Company has a revolving facilityagreement (Canadian Conduit) with a Canadian bank-sponsored asset-backed commercial paper conduit. Under the agreement,the Canadian Conduit is contractually committed, at the Company's option, to purchase from the Company eligible Canadianretail motorcycle finance receivables for proceeds up to C$240 million. The transferred assets are restricted as collateral for thepayment of the debt. The terms for this facility provide for interest on the outstanding principal based on prevailing marketinterest rates plus a specified margin. The Canadian Conduit also provides for a program fee and an unused commitment feebased on the unused portion of the total aggregate commitment of C$240 million. There is no amortization schedule; however,the debt is reduced monthly as available collections on the related finance receivables are applied to outstanding principal.Upon expiration of the Canadian Conduit, any outstanding principal will continue to be reduced monthly through availablecollections. Unless earlier terminated or extended by mutual agreement of the Company and the lenders, as of December 31,2016, the Canadian Conduit has an expiration date of June 30, 2017. The contractual maturity of the debt is approximately 5years.
During 2016 and 2015, the Company transferred $71.1 million and $100.0 million, respectively, of Canadian retailmotorcycle finance receivables to the Canadian Conduit for proceeds of $62.4 million and $87.5 million, respectively.
On-Balance Sheet Asset-Backed U.S. Commercial Paper Conduit Facilities VIE – On December 14, 2016, the Companyentered into a new revolving facility agreement with a third party bank-sponsored asset-backed U.S. commercial paper conduit,which provides for a total commitment of up to $300.0 million. Also on that date, the Company renewed its existing $600.0million revolving facility agreement, which had expired on December 14, 2016 with the same third party bank-sponsored asset-backed U.S. commercial paper conduit. Availability under the revolving facilities (together, the U.S. Conduit Facilities) is based
43

on, among other things, the amount of eligible U.S. retail motorcycle finance receivables held by the relevant SPE as collateral.At December 31, 2016, 2015, and 2014, the Company had no outstanding borrowings under the U.S. Conduit Facilities. InJanuary 2017, the Company transferred $333.4 million of U.S. retail motorcycle finance receivables to an SPE which, in turn,issued $300.0 million of debt to the U.S. Conduit Facilities.
Under the U.S. Conduit Facilities, the Company may transfer U.S. retail motorcycle finance receivables to an SPE,which in turn may issue debt to the third party bank-sponsored asset-backed commercial paper conduit. The assets of the SPEare restricted as collateral for the payment of the debt or other obligations arising in the transaction and are not available to payother obligations or claims of the Company’s creditors. The terms for this debt provide for interest on the outstanding principalbased on prevailing commercial paper rates or LIBOR to the extent the advance is not funded by a conduit lender through theissuance of commercial paper plus, in each case, a program fee based on outstanding principal. The U.S. Conduit Facilities alsoprovide for an unused commitment fee based on the unused portion of the total aggregate commitment of $900 million. There isno amortization schedule; however, the debt will be reduced monthly as available collections on the related finance receivablesare applied to outstanding principal. Upon expiration of the U.S. Conduit Facilities, any outstanding principal will continue tobe reduced monthly through available collections. Unless earlier terminated or extended by mutual agreement of the Companyand the lenders, the U.S. Conduit Facilities have an expiration date of December 13, 2017.
Asset-Backed Securitization VIEs – For all of its asset-backed securitization transactions, the Company transfers U.S.retail motorcycle finance receivables to separate VIEs, which in turn issue secured notes with various maturities and interestrates to investors. All of the notes held by the VIEs are secured by future collections of the purchased U.S. retail motorcyclefinance receivables. The U.S. retail motorcycle finance receivables included in the asset-backed securitization transactions arenot available to pay other obligations or claims of the Company's creditors until the associated debt and other obligations aresatisfied. Restricted cash balances held by the VIEs are used only to support the securitizations.
The accounting treatment for asset-backed securitizations depends on the terms of the related transaction and theCompany’s continuing involvement with the VIE. Most of the Company’s asset-backed securitizations do not meet the criteriato be accounted for as a sale because, in addition to retaining servicing rights, the Company retains a financial interest in theVIE in the form of a debt security. These transactions are treated as secured borrowings. As secured borrowings, the retailmotorcycle finance receivables remain on the balance sheet with a corresponding obligation reflected as debt. There is noamortization schedule for the secured notes; however, the debt is reduced monthly as available collections on the related retailmotorcycle finance receivables are applied to outstanding principal. The secured notes’ contractual lives have various maturitiesranging from 2019 to 2022.
There were no on-balance sheet asset-backed securitization transactions during 2016. In 2015, the Company transferred$1.3 billion of U.S. retail motorcycle finance receivables to two separate SPEs. The SPEs in turn issued $1.2 billion of securednotes through on-balance sheet term asset-backed securitization transactions.
During 2016, the Company sold U.S. retail motorcycle finance receivables with a principal balance of $301.8 million intoan asset-backed securitization VIE. The transaction met the criteria to be treated as a sale for accounting purposes because theCompany did not retain any financial interest in the VIE beyond servicing rights and ordinary representations and warrantiesand related covenants. Upon the sale, the retail motorcycle finance receivables were removed from the Company’s balancesheet and a gain of $9.3 million was recognized in Financial Services Revenue. For more information see Note 11 of the Notesto Consolidated Financial Statements.
Intercompany Borrowings – HDFS and the Company have had in effect term loan agreements under which HDFSborrowed from the Company. There were no intercompany borrowings made between HDFS and the Company during 2016 or2015. As such, as of December 31, 2016 and December 31, 2015, there were no intercompany loans outstanding. The termloans provide for monthly interest based on the prevailing commercial paper rates and principal due at maturity or upondemand by the Company. The term loan balances and related interest are eliminated in the Company's consolidated financialstatements.
Support Agreement - The Company has a support agreement with HDFS whereby, if required, the Company agrees toprovide HDFS with financial support to maintain HDFS’ fixed-charge coverage at 1.25 and minimum net worth of $40.0million. Support may be provided at the Company’s option as capital contributions or loans. Accordingly, certain debtcovenants may restrict the Company’s ability to withdraw funds from HDFS outside the normal course of business. No amounthas ever been provided to HDFS under the support agreement.
Operating and Financial Covenants – HDFS and the Company are subject to various operating and financial covenantsrelated to the credit facilities and various operating covenants under the Notes and the U.S. and Canadian asset-backedcommercial paper conduit facilities. The more significant covenants are described below.
44

The operating covenants limit the Company’s and HDFS’ ability to:• assume or incur certain liens;• participate in certain mergers or consolidations; and• purchase or hold margin stock.
Under the current financial covenants of the Global Credit Facilities, the consolidated debt to equity ratio of HDFScannot exceed 10.00 to 1.00 as of the end of any fiscal quarter. In addition, the ratio of the Company's consolidated debt to theCompany's consolidated debt and equity, in each case excluding the debt of HDFS and its subsidiaries, cannot exceed 0.70 to1.00 as of the end of any fiscal quarter. No financial covenants are required under the Notes or the U.S. or Canadian asset-backed commercial paper conduit facilities.
At December 31, 2016, 2015 and 2014, HDFS and the Company remained in compliance with all of the then existingcovenants.
Cautionary Statements
The Company’s ability to meet the targets and expectations noted depends upon, among other factors, the Company’sability to:
(i) execute its business strategy,
(ii) manage through changes in general economic and business conditions, including changing capital, credit andretail markets, and the changing political environment,
(iii) accurately estimate and adjust to fluctuations in foreign currency exchange rates, interest rates andcommodity prices,
(iv) prevent a cybersecurity breach involving consumer, employee, dealer, supplier, or Company data and respondto evolving regulatory requirements regarding data security,
(v) drive demand by executing its marketing strategy of appealing to and growing sales to multi-generational andmulti-cultural customers worldwide in an increasingly competitive marketplace,
(vi) develop and introduce products, services and experiences that are successful in the marketplace,
(vii) manage the credit quality, the loan servicing and collection activities, and the recovery rates of HDFS' loanportfolio,
(viii) balance production volumes for its new motorcycles with consumer demand, including in circumstanceswhere competitors may be supplying new motorcycles to the market in excess of demand at reduced prices,
(ix) manage the impact that prices for and supply of used motorcycles may have on its business, including onretail sales of new motorcycles,
(x) prevent and detect any issues with its motorcycles or any associated manufacturing processes to avoid delaysin new model launches, recall campaigns, regulatory agency investigations, increased warranty costs orlitigation and adverse effects on its reputation and brand strength,
(xi) continue to develop the capabilities of its distributors and dealers and manage the risks that its independentdealers may have difficulty obtaining capital and managing through changing economic conditions andconsumer demand,
(xii) manage risks that arise through expanding international manufacturing, operations and sales,
(xiii) adjust to tax reform, healthcare inflation and reform and pension reform,
(xiv) manage through the effects inconsistent and unpredictable weather patterns may have on retail sales ofmotorcycles,
(xv) manage supply chain issues, including quality issues and any unexpected interruptions or price increasescaused by raw material shortages or natural disasters,
(xvi) implement and manage enterprise-wide information technology systems, including systems at itsmanufacturing facilities,
(xvii) manage changes and prepare for requirements in legislative and regulatory environments for its products,services and operations,
(xviii) manage its exposure to product liability claims and commercial or contractual disputes,
(xix) execute its flexible production strategy,45

(xx) retain and attract talented employees,
(xxi) successfully access the capital and/or credit markets on terms (including interest rates) that are acceptable tothe Company and within its expectations, and
(xxii) continue to manage the relationships and agreements that the Company has with its labor unions to help drivelong-term competitiveness.
In addition, the Company could experience delays or disruptions in its operations as a result of work stoppages, strikes,natural causes, terrorism or other factors. Other factors are described in “Risk Factors” under Item 1A which includes adiscussion of additional risk factors and a more complete discussion of some of the cautionary statements noted above.
The Company’s ability to sell its motorcycles and related products and services and to meet its financial expectations alsodepends on the ability of the Company’s independent dealers to sell its motorcycles and related products and services to retailcustomers. The Company depends on the capability and financial capacity of its independent dealers to develop and implementeffective retail sales plans to create demand for the motorcycles and related products and services they purchase from theCompany.
In addition, the Company’s independent dealers may experience difficulties in operating their businesses and sellingHarley-Davidson motorcycles and related products and services as a result of weather, economic conditions or other factors.
In recent years, HDFS has experienced historically low levels of retail credit losses, but there is no assurance that thiswill continue. The Company believes that HDFS' retail credit losses may increase over time due to changing consumer creditbehavior and HDFS' efforts to increase prudently structured loan approvals to sub-prime borrowers, as well as actions that theCompany has taken and could take that impact motorcycle values.
Item 7A. Quantitative and Qualitative Disclosures About Market Risk
The Company is exposed to market risk from changes in foreign exchange rates and interest rates. To reduce such risks,the Company selectively uses derivative financial instruments. All hedging transactions are authorized and executed pursuant toregularly reviewed policies and procedures, which prohibit the use of financial instruments for speculative trading purposes.Sensitivity analysis is used to manage and monitor foreign exchange and interest rate risk.
The Company sells its products internationally and in most markets those sales are made in the foreign country’s localcurrency. As a result, the Company’s earnings can be affected by fluctuations in the value of the U.S. dollar relative to foreigncurrency. The Company’s most significant foreign currency risk relates to the Euro, the Australian dollar, the Japanese yen, theBrazilian real, the Canadian dollar and the Mexican peso. The Company utilizes foreign currency contracts to mitigate theeffect of certain currencies' fluctuations on earnings. The foreign currency contracts are entered into with banks and allow theCompany to exchange a specified amount of foreign currency for U.S. dollars at a future date, based on a fixed exchange rate.At December 31, 2016, the notional U.S. dollar value of outstanding Euro, Australian dollar, Japanese yen, Brazilian real,Canadian dollar and Mexican peso foreign currency contracts was $554.6 million. The Company estimates that a uniform 10%weakening in the value of the U.S. dollar relative to the currencies underlying these contracts would result in a decrease in thefair value of the contracts of approximately $52.2 million as of December 31, 2016. Further disclosure relating to the fair valueof derivative financial instruments is included in Note 8 of the Notes to Consolidated Financial Statements.
46

Item 8. Consolidated Financial Statements and Supplementary Data
Page
Management’s Report on Internal Control Over Financial Reporting 48
Report of the Audit and Finance Committee 49
Report of Independent Registered Public Accounting Firm on Internal Control over Financial Reporting 50
Report of Independent Registered Public Accounting Firm 51
Consolidated statements of income 52
Consolidated statements of comprehensive income 53
Consolidated balance sheets 54
Consolidated statements of cash flows 56
Consolidated statements of shareholders’ equity 57
Notes to consolidated financial statements 58
Supplementary data
Quarterly financial data (unaudited) 109
47
MANAGEMENT’S REPORT ON INTERNAL CONTROL OVER FINANCIAL REPORTING
The Company’s management is responsible for establishing and maintaining adequate internal control over financialreporting, as such term is defined in Exchange Act Rules 13a-15(f). Under the supervision and with the participation ofmanagement, including the principal executive officer and principal financial officer, management conducted an evaluation ofthe effectiveness of the Company’s internal control over financial reporting based on the criteria established in InternalControl – Integrated Framework (2013 Framework) issued by the Committee of Sponsoring Organizations of the TreadwayCommission. Based on management’s evaluation under the framework in Internal Control – Integrated Framework,management has concluded that the Company’s internal control over financial reporting was effective as of December 31,2016. Ernst & Young LLP, an independent registered public accounting firm, has audited the Consolidated Financial Statementsincluded in this Annual Report on Form 10-K and, as part of its audit, has issued an attestation report, included herein, on theeffectiveness of the Company’s internal control over financial reporting.
Matthew S. Levatich John A. OlinPresident and Chief Executive Officer Senior Vice President and Chief Financial Officer
48

REPORT OF THE AUDIT AND FINANCE COMMITTEE
The Audit and Finance Committee of the Board of Directors reviews the Company’s financial reporting process and theaudit process. All of the Audit and Finance Committee members are independent in accordance with the audit committeerequirements of the New York Stock Exchange, Inc.
The Audit and Finance Committee of the Board of Directors has reviewed and discussed with management its assessmentof the effectiveness of the Company’s internal control system over financial reporting as of December 31, 2016. Managementhas concluded that the internal control system was effective. Additionally, the Company’s internal control over financialreporting as of December 31, 2016 was audited by Ernst & Young LLP, the Company’s independent registered publicaccounting firm for the 2016 fiscal year. The Audit and Finance Committee has reviewed and discussed the audited financialstatements of the Company for the 2016 fiscal year with management as well as with representatives of Ernst & Young LLP.The Audit and Finance Committee has also discussed with Ernst & Young LLP matters required to be discussed under PublicCompany Accounting Oversight Board (PCAOB) No. 16, Communications with Audit Committees. The Audit and FinanceCommittee has received written disclosures from Ernst & Young LLP regarding their independence as required by PCAOBEthics and Independence Rule 3526, Communication with Audit Committees Concerning Independence, and has discussedwith representatives of Ernst & Young LLP the independence of Ernst & Young LLP. Based on the review and discussionsreferred to above, the Audit and Finance Committee has recommended to the Board of Directors that the audited financialstatements for the 2016 fiscal year be included in the Company’s Annual Report on Form 10-K for the 2016 fiscal year.
Audit and Finance Committee of the Board of Directors
James A. Norling, ChairmanN. Thomas LinebargerGeorge L. Miles, Jr.Maryrose Sylvester (beginning September 7, 2016)Jochen Zeitz
49

REPORT OF INDEPENDENT REGISTERED PUBLIC ACCOUNTING FIRM ON INTERNALCONTROL OVER FINANCIAL REPORTING
To the Board of Directors and Shareholders of Harley-Davidson, Inc.:
We have audited Harley-Davidson, Inc.’s internal control over financial reporting as of December 31, 2016, based oncriteria established in Internal Control - Integrated Framework issued by the Committee of Sponsoring Organizations of theTreadway Commission (2013 framework) (the COSO criteria). Harley-Davidson, Inc.’s management is responsible formaintaining effective internal control over financial reporting, and for its assessment of the effectiveness of internal controlover financial reporting included in the accompanying Management’s Report on Internal Control over Financial Reporting. Ourresponsibility is to express an opinion on the Company’s internal control over financial reporting based on our audit.
We conducted our audit in accordance with the standards of the Public Company Accounting Oversight Board (UnitedStates). Those standards require that we plan and perform the audit to obtain reasonable assurance about whether effectiveinternal control over financial reporting was maintained in all material respects. Our audit included obtaining an understandingof internal control over financial reporting, assessing the risk that a material weakness exists, testing and evaluating the designand operating effectiveness of internal control based on the assessed risk, and performing such other procedures as weconsidered necessary in the circumstances. We believe that our audit provides a reasonable basis for our opinion.
A company’s internal control over financial reporting is a process designed to provide reasonable assurance regarding thereliability of financial reporting and the preparation of financial statements for external purposes in accordance with generallyaccepted accounting principles. A company’s internal control over financial reporting includes those policies and proceduresthat (1) pertain to the maintenance of records that, in reasonable detail, accurately and fairly reflect the transactions anddispositions of the assets of the company; (2) provide reasonable assurance that transactions are recorded as necessary to permitpreparation of financial statements in accordance with generally accepted accounting principles, and that receipts andexpenditures of the company are being made only in accordance with authorizations of management and directors of thecompany; and (3) provide reasonable assurance regarding prevention or timely detection of unauthorized acquisition, use, ordisposition of the company’s assets that could have a material effect on the financial statements.
Because of its inherent limitations, internal control over financial reporting may not prevent or detect misstatements.Also, projections of any evaluation of effectiveness to future periods are subject to the risk that controls may becomeinadequate because of changes in conditions, or that the degree of compliance with the policies or procedures may deteriorate.
In our opinion, Harley-Davidson, Inc. maintained, in all material respects, effective internal control over financialreporting as of December 31, 2016, based on the COSO criteria.
We also have audited, in accordance with the standards of the Public Company Accounting Oversight Board (UnitedStates), the consolidated balance sheets of Harley-Davidson, Inc. as of December 31, 2016 and 2015, and the relatedconsolidated statements of income, comprehensive income, shareholders’ equity, and cash flows for each of the three years inthe period ended December 31, 2016 of Harley-Davidson, Inc. and our report dated February 21, 2017 expressed an unqualifiedopinion thereon.
/s/ Ernst & Young LLPMilwaukee, WisconsinFebruary 21, 2017
50

REPORT OF INDEPENDENT REGISTERED PUBLIC ACCOUNTING FIRM
To the Board of Directors and Shareholders of Harley-Davidson, Inc.:
We have audited the accompanying consolidated balance sheets of Harley-Davidson, Inc. as of December 31, 2016 and2015, and the related consolidated statements of income, comprehensive income, shareholders’ equity and cash flows for eachof the three years in the period ended December 31, 2016. Our audits also included the financial statement schedule listed in theindex at item 15(a). These financial statements and schedule are the responsibility of the Company’s management. Ourresponsibility is to express an opinion on these financial statements and schedule based on our audits.
We conducted our audits in accordance with the standards of the Public Company Accounting Oversight Board (UnitedStates). Those standards require that we plan and perform the audit to obtain reasonable assurance about whether the financialstatements are free of material misstatement. An audit includes examining, on a test basis, evidence supporting the amounts anddisclosures in the financial statements. An audit also includes assessing the accounting principles used and significant estimatesmade by management, as well as evaluating the overall financial statement presentation. We believe that our audits provide areasonable basis for our opinion.
In our opinion, the financial statements referred to above present fairly, in all material respects, the consolidated financialposition of Harley-Davidson, Inc. at December 31, 2016 and 2015, and the consolidated results of its operations and its cashflows for each of the three years in the period ended December 31, 2016, in conformity with U.S. generally acceptedaccounting principles. Also in our opinion, the related financial statement schedule, when considered in relation to the basicfinancial statements taken as a whole, presents fairly in all material respects the information set forth therein.
We also have audited, in accordance with the standards of the Public Company Accounting Oversight Board (UnitedStates), Harley-Davidson, Inc.’s internal control over financial reporting as of December 31, 2016, based on criteria establishedin Internal Control - Integrated Framework issued by the Committee of Sponsoring Organizations of the TreadwayCommission (2013 framework), and our report dated February 21, 2017 expressed an unqualified opinion thereon.
/s/ Ernst & Young LLPMilwaukee, WisconsinFebruary 21, 2017
51
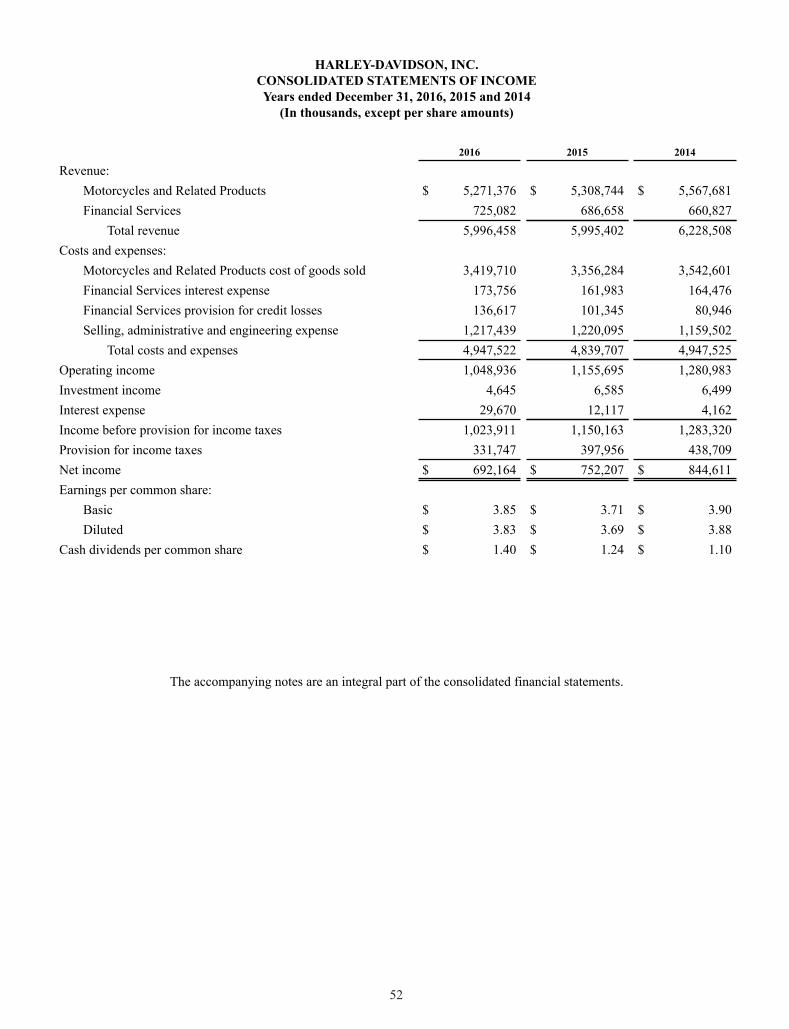
HARLEY-DAVIDSON, INC.CONSOLIDATED STATEMENTS OF INCOMEYears ended December 31, 2016, 2015 and 2014
(In thousands, except per share amounts)
2016 2015 2014
Revenue:Motorcycles and Related Products $ 5,271,376 $ 5,308,744 $ 5,567,681Financial Services 725,082 686,658 660,827
Total revenue 5,996,458 5,995,402 6,228,508Costs and expenses:
Motorcycles and Related Products cost of goods sold 3,419,710 3,356,284 3,542,601Financial Services interest expense 173,756 161,983 164,476Financial Services provision for credit losses 136,617 101,345 80,946Selling, administrative and engineering expense 1,217,439 1,220,095 1,159,502
Total costs and expenses 4,947,522 4,839,707 4,947,525Operating income 1,048,936 1,155,695 1,280,983Investment income 4,645 6,585 6,499Interest expense 29,670 12,117 4,162Income before provision for income taxes 1,023,911 1,150,163 1,283,320Provision for income taxes 331,747 397,956 438,709Net income $ 692,164 $ 752,207 $ 844,611Earnings per common share:
Basic $ 3.85 $ 3.71 $ 3.90Diluted $ 3.83 $ 3.69 $ 3.88
Cash dividends per common share $ 1.40 $ 1.24 $ 1.10
The accompanying notes are an integral part of the consolidated financial statements.
52

HARLEY-DAVIDSON, INC.CONSOLIDATED STATEMENTS OF COMPREHENSIVE INCOME
Years ended December 31, 2016, 2015 and 2014 (In thousands)
2016 2015 2014
Net income $ 692,164 $ 752,207 $ 844,611Other comprehensive income (loss), net of tax: Foreign currency translation adjustments (9,288) (55,362) (36,808) Derivative financial instruments 6,638 (13,156) 20,722 Marketable securities (100) (394) (424) Pension and postretirement benefit plans 52,574 (31,350) (165,757)
Total other comprehensive income (loss), net of tax 49,824 (100,262) (182,267)Comprehensive income $ 741,988 $ 651,945 $ 662,344
The accompanying notes are an integral part of the consolidated financial statements.
53

HARLEY-DAVIDSON, INC.CONSOLIDATED BALANCE SHEETS
December 31, 2016 and 2015 (In thousands, except share amounts)
2016 2015
ASSETSCurrent assets:
Cash and cash equivalents $ 759,984 $ 722,209Marketable securities 5,519 45,192Accounts receivable, net 285,106 247,405Finance receivables, net 2,076,261 2,053,582Inventories 499,917 585,907Restricted cash 52,574 88,267Deferred income taxes — 102,769Other current assets 174,491 132,552
Total current assets 3,853,852 3,977,883Finance receivables, net 4,759,197 4,814,571Property, plant and equipment, net 981,593 942,418Goodwill 53,391 54,182Deferred income taxes 167,729 99,614Other long-term assets 74,478 84,309
$ 9,890,240 $ 9,972,977LIABILITIES AND SHAREHOLDERS’ EQUITYCurrent liabilities:
Accounts payable $ 235,318 $ 235,614Accrued liabilities 486,652 471,964Short-term debt 1,055,708 1,201,380Current portion of long-term debt, net 1,084,884 838,349
Total current liabilities 2,862,562 2,747,307Long-term debt, net 4,666,975 4,832,469Pension liability 84,442 164,888Postretirement healthcare liability 173,267 193,659Other long-term liabilities 182,836 195,000Commitments and contingencies (Note 15)Shareholders’ equity:
Preferred stock, none issued — —Common stock, 180,595,054 and 344,855,704 shares issued, respectively 1,806 3,449Additional paid-in-capital 1,381,862 1,328,561Retained earnings 1,337,673 8,961,985Accumulated other comprehensive loss (565,381) (615,205)Treasury stock (4,647,345 and 160,121,966 shares, respectively), at cost (235,802) (7,839,136)
Total shareholders’ equity 1,920,158 1,839,654$ 9,890,240 $ 9,972,977
54

HARLEY-DAVIDSON, INC.CONSOLIDATED BALANCE SHEETS (continued)
December 31, 2016 and 2015 (In thousands, except share amounts)
2016 2015
Balances held by consolidated variable interest entities (Note 11)Current finance receivables, net $ 225,289 $ 322,768Other assets $ 2,781 $ 4,706Non-current finance receivables, net $ 643,047 $ 1,250,919Restricted cash - current and non-current $ 57,057 $ 100,151Current portion of long-term debt, net $ 241,396 $ 351,123Long-term debt, net $ 554,879 $ 1,108,254
The accompanying notes are an integral part of the consolidated financial statements.
55

HARLEY-DAVIDSON, INC.CONSOLIDATED STATEMENTS OF CASH FLOWS
Years ended December 31, 2016, 2015 and 2014 (In thousands)
2016 2015 2014
Net cash provided by operating activities (Note 2) $ 1,174,339 $ 1,100,118 $ 1,146,677Cash flows from investing activities:
Capital expenditures (256,263) (259,974) (232,319)Origination of finance receivables (3,664,495) (3,751,830) (3,568,423)Collections on finance receivables 3,175,031 3,136,885 3,013,245Proceeds from finance receivables sold 312,571 — —Sales and redemptions of marketable securities 40,014 11,507 41,010Acquisition of business — (59,910) —Other 411 7,474 1,837
Net cash used by investing activities (392,731) (915,848) (744,650)Cash flows from financing activities:
Proceeds from issuance of medium-term notes 1,193,396 595,386 991,835Repayments of medium-term notes (451,336) (610,331) (526,431)Proceeds from issuance of senior unsecured notes — 740,385 —Repayment of senior unsecured notes — — (303,000)Proceeds from securitization debt — 1,195,668 847,126Repayments of securitization debt (665,400) (1,008,135) (834,856)Borrowings of asset-backed commercial paper 62,396 87,442 84,907Repayments of asset-backed commercial paper (71,500) (72,727) (77,800)Net (decrease) increase in credit facilities and unsecured commercial paper (145,812) 469,473 63,945Net change in restricted cash 43,495 11,410 22,755Dividends paid (252,321) (249,262) (238,300)Purchase of common stock for treasury (465,341) (1,537,020) (615,602)Excess tax benefits from share-based payments 2,251 3,468 11,540Issuance of common stock under employee stock option plans 15,782 20,179 37,785
Net cash used by financing activities (734,390) (354,064) (536,096)Effect of exchange rate changes on cash and cash equivalents (9,443) (14,677) (25,863)Net increase (decrease) in cash and cash equivalents $ 37,775 $ (184,471) $ (159,932)
Cash and cash equivalents:Cash and cash equivalents—beginning of period $ 722,209 $ 906,680 $ 1,066,612Net increase (decrease) in cash and cash equivalents 37,775 (184,471) (159,932)Cash and cash equivalents—end of period $ 759,984 $ 722,209 $ 906,680
The accompanying notes are an integral part of the consolidated financial statements.
56

HARLEY-DAVIDSON, INC.CONSOLIDATED STATEMENTS OF SHAREHOLDERS’ EQUITY
Years ended December 31, 2016, 2015 and 2014 (In thousands, except share amounts)
Common StockAdditional
Paid-inCapital
RetainedEarnings
AccumulatedOther
ComprehensiveLoss
TreasuryBalance Total
IssuedShares Balance
Balance December 31, 2013 343,157,231 $ 3,432 $ 1,175,052 $ 7,852,729 $ (332,676) $ (5,689,051) $ 3,009,486
Net income — — — 844,611 — — 844,611Total other comprehensive loss, net of tax(Note 9) — — — — (182,267) — (182,267)
Dividends — — — (238,300) — — (238,300)
Repurchase of common stock — — — — — (615,602) (615,602)Share-based compensation and 401(k) matchmade with Treasury shares — — 40,848 — — 1,143 41,991
Issuance of nonvested stock 15,891 — — — — — —
Exercise of stock options 1,001,531 10 37,775 — — — 37,785
Tax benefit of equity awards — — 11,582 — — — 11,582
Balance December 31, 2014 344,174,653 $ 3,442 $ 1,265,257 $ 8,459,040 $ (514,943) $ (6,303,510) $ 2,909,286
Net income — — — 752,207 — — 752,207Total other comprehensive loss, net of tax(Note 9) — — — — (100,262) — (100,262)
Dividends — — — (249,262) — — (249,262)
Repurchase of common stock — — — — — (1,537,020) (1,537,020)Share-based compensation and 401(k) matchmade with Treasury shares — — 39,457 — — 1,394 40,851
Issuance of nonvested stock 162,193 2 (2) — — — —
Exercise of stock options 518,858 5 20,174 — — — 20,179
Tax benefit of equity awards — — 3,675 — — — 3,675
Balance December 31, 2015 344,855,704 $ 3,449 $ 1,328,561 $ 8,961,985 $ (615,205) $ (7,839,136) $ 1,839,654
Net income — — — 692,164 — — 692,164Total other comprehensive income, net of tax(Note 9) — — — — 49,824 — 49,824
Dividends — — — (252,321) — — (252,321)
Repurchase of common stock — — — — — (465,341) (465,341)Share-based compensation and 401(k) matchmade with Treasury shares — — 36,956 — — 2,870 39,826
Issuance of nonvested stock 272,479 2 (2) — — — —
Exercise of stock options 466,871 5 15,777 — — — 15,782
Tax benefit of equity awards — — 570 — — — 570
Retirement of treasury stock (165,000,000) (1,650) — (8,064,155) — 8,065,805 —
Balance December 31, 2016 180,595,054 $ 1,806 $ 1,381,862 $ 1,337,673 $ (565,381) $ (235,802) $ 1,920,158
The accompanying notes are an integral part of the consolidated financial statements.
57

HARLEY-DAVIDSON, INC.NOTES TO CONSOLIDATED FINANCIAL STATEMENTS
1. Summary of Significant Accounting Policies
Principles of Consolidation and Basis of Presentation – The consolidated financial statements include the accounts ofHarley-Davidson, Inc. and its wholly-owned subsidiaries (the Company), including the accounts of the groups of companiesdoing business as Harley-Davidson Motor Company (HDMC) and Harley-Davidson Financial Services (HDFS). In addition,certain variable interest entities (VIEs) related to secured financing are consolidated as the Company is the primary beneficiary.All intercompany accounts and transactions are eliminated.
All of the Company’s subsidiaries are wholly owned and are included in the consolidated financial statements.Substantially all of the Company’s international subsidiaries use their respective local currency as their functional currency.Assets and liabilities of international subsidiaries have been translated at period-end exchange rates, and revenues and expenseshave been translated using average exchange rates for the period. Monetary assets and liabilities denominated in a currency thatis different from an entity's functional currency are remeasured from the transactional currency to the entity's functionalcurrency on a monthly basis. The effect of this remeasurement is reported in Motorcycle and Related Products cost of goodssold. The pre-tax loss for foreign currency remeasurements was $15.1 million, $21.5 million and $28.4 million, for the yearsended 2016, 2015 and 2014, respectively.
The Company operates in two reportable segments: Motorcycles & Related Products (Motorcycles) and FinancialServices.
Use of Estimates – The preparation of financial statements in conformity with U.S. generally accepted accountingprinciples (U.S. GAAP) requires management to make estimates and assumptions that affect the amounts reported in thefinancial statements and accompanying notes. Actual results could differ from those estimates.
Cash and Cash Equivalents – The Company considers all highly liquid investments with a maturity of three months orless when purchased to be cash equivalents.
Marketable Securities – The Company’s marketable securities consisted of the following at December 31 (in thousands):
2016 2015
Available-for-sale securities: corporate bonds $ 5,519 $ 45,192Trading securities: mutual funds 38,119 36,256
Total marketable securities $ 43,638 $ 81,448
The Company’s available-for-sale securities are carried at fair value with any unrealized gains or losses reported in othercomprehensive income. During 2016 and 2015, the Company recognized gross unrealized losses of $0.2 million and $0.6million, respectively, or losses of $0.1 million and $0.4 million, net of tax, respectively, to adjust amortized cost to fair value.The marketable securities have contractual maturities that come due over the next 4 months.
The Company's trading securities relate to investments held by the Company to fund certain deferred compensationobligations. The trading securities are carried at fair value with gains and losses recorded in net income and investments areincluded in other long-term assets on the consolidated balance sheets.
Accounts Receivable, Net – The Company’s motorcycles and related products are sold to independent dealers outside theU.S. and Canada generally on open account and the resulting receivables are included in accounts receivable in the Company’sconsolidated balance sheets. The allowance for doubtful accounts deducted from total accounts receivable was $2.7 million and$2.9 million as of December 31, 2016 and 2015, respectively. Accounts receivable are written down once managementdetermines that the specific customer does not have the ability to repay the balance in full. The Company’s sales of motorcyclesand related products in the U.S. and Canada are financed by the purchasing dealers through HDFS and the related receivablesare included in finance receivables in the consolidated balance sheets.
Finance Receivables, Net – Finance receivables include both retail and wholesale finance receivables, net, includingamounts held by VIEs. Finance receivables are recorded in the financial statements at amortized cost net of an allowance forcredit losses. The provision for credit losses on finance receivables is charged to earnings in amounts sufficient to maintain theallowance for credit losses at a level that is adequate to cover estimated losses of principal inherent in the existing portfolio.Portions of the allowance for credit losses are specified to cover estimated losses on finance receivables specifically identifiedfor impairment. The unspecified portion of the allowance covers estimated losses on finance receivables which are collectively
58

reviewed for impairment. Finance receivables are considered impaired when management determines it is probable that theCompany will be unable to collect all amounts due according to the terms of the loan agreement.
The retail portfolio primarily consists of a large number of small balance, homogeneous finance receivables. TheCompany performs a periodic and systematic collective evaluation of the adequacy of the retail allowance for credit losses. TheCompany utilizes loss forecast models which consider a variety of factors including, but not limited to, historical loss trends,origination or vintage analysis, known and inherent risks in the portfolio, the value of the underlying collateral, recovery ratesand current economic conditions including items such as unemployment rates. Retail finance receivables are not evaluatedindividually for impairment prior to charge-off and therefore are not reported as impaired loans.
The wholesale portfolio is primarily composed of large balance, non-homogeneous loans. The Company’s wholesaleallowance evaluation is first based on a loan-by-loan review. A specific allowance for credit losses is established for wholesalefinance receivables determined to be individually impaired when management concludes that the borrower will not be able tomake full payment of contractual amounts due based on the original terms of the loan agreement. The impairment is determinedbased on the cash that the Company expects to receive discounted at the loan’s original interest rate or the fair value of thecollateral, if the loan is collateral-dependent. Finance receivables in the wholesale portfolio that are not individually evaluatedfor impairment are segregated, based on similar risk characteristics, according to the Company’s internal risk rating system andcollectively evaluated for impairment. The related allowance is based on factors such as the Company’s past loan lossexperience, the specific borrower’s financial performance as well as ability to repay, current economic conditions as well as thevalue of the underlying collateral.
Impaired finance receivables also include loans that have been modified in troubled debt restructurings as a concession toborrowers experiencing financial difficulty. Generally, it is the Company’s policy not to change the terms and conditions offinance receivables. However, to minimize the economic loss, the Company may modify certain impaired finance receivablesin troubled debt restructurings. Total restructured finance receivables are not significant.
Repossessed inventory representing recovered collateral on impaired finance receivables is recorded at the lower of costor net realizable value. In the period during which the collateral is repossessed, the related finance receivable is adjusted to thefair value of the collateral through a charge to the allowance for credit losses and reclassified to repossessed inventory.Repossessed inventory is included in other current assets and was $19.3 million and $17.7 million at December 31, 2016 and2015, respectively.
Asset-Backed Financing – The Company participates in asset-backed financing both through asset-backed securitizationtransactions and through asset-backed commercial paper conduit facilities. In the Company's asset-backed financing programs,the Company transfers retail motorcycle finance receivables to special purpose entities (SPE), which are considered VIEs underU.S. GAAP. Each SPE then converts those assets into cash, through the issuance of debt. The Company retains servicing rightsfor all of the retail motorcycle finance receivables transferred to SPEs as part of an asset-backed financing. The accountingtreatment for asset-backed financings depends on the terms of the related transaction and the Company’s continuinginvolvement with the VIE.
In transactions where the Company has power over the significant activities of the VIE and has an obligation to absorblosses or the right to receive benefits from the VIE that are potentially significant to the VIE, the Company is the primarybeneficiary of the VIE and consolidates the VIE within its consolidated financial statements. On a consolidated basis, the asset-backed financing is treated as a secured borrowing in this type of transaction and is referred to as an on-balance sheet asset-backed financing.
In transactions where the Company is not the primary beneficiary of the VIE, the Company must determine whether itcan achieve a sale for accounting purposes under ASC Topic 860, "Transfers and Servicing." To achieve a sale for accountingpurposes, the assets being transferred must be legally isolated, not be constrained by restrictions from further transfer, and bedeemed to be beyond the Company’s control. If the Company does not meet all these criteria for sale accounting, then thetransaction is accounted for as a secured borrowing and is referred to as an on-balance sheet asset-backed financing.
If the Company meets all three of the sale criteria above, the transaction is recorded as a sale for accounting purposes andis referred to as an off-balance sheet asset-backed financing. Upon sale, the retail motorcycle finance receivables are removedfrom the Company’s balance sheet and a gain or loss is recognized for the difference between the cash proceeds received, theassets derecognized, and the liabilities recognized as part of the transaction. The gain or loss on sale is included in FinancialServices revenue in the Consolidated Statement of Income.
The Company is not required, and does not currently intend, to provide any additional financial support to the on or off-balance sheet VIEs associated with these transactions. Investors and creditors in these transactions only have recourse to theassets held by the VIEs.
59

Inventories – Inventories are valued at the lower of cost or market. Substantially all inventories located in the UnitedStates are valued using the last-in, first-out (LIFO) method. Other inventories totaling $221.7 million at December 31, 2016and $266.6 million at December 31, 2015 are valued at the lower of cost or market using the first-in, first-out (FIFO) method.
Property, Plant and Equipment – Property, plant and equipment is recorded at cost. Depreciation is determined on thestraight-line basis over the estimated useful lives of the assets. The following useful lives are used to depreciate the variousclasses of property, plant and equipment: buildings – 30 years; building equipment and land improvements – 7 years;machinery and equipment – 3 to 10 years; furniture and fixtures – 5 years; and software – 3 to 7 years. Accelerated methods ofdepreciation are used for income tax purposes.
Goodwill – Goodwill represents the excess of acquisition cost over the fair value of the net assets purchased. Goodwill istested for impairment, based on financial data related to the reporting unit to which it has been assigned, at least annually orwhenever events or changes in circumstances indicate that the carrying value may not be recoverable. The impairment testinvolves comparing the estimated fair value of the reporting unit associated with the goodwill to its carrying amount, includinggoodwill. If the carrying amount of the reporting unit exceeds its fair value, goodwill must be adjusted to its implied fair value.During 2016 and 2015, the Company performed a quantitative test on its goodwill balances for impairment and no adjustmentswere recorded to goodwill as a result of those reviews.
Long-lived Assets – The Company periodically evaluates the carrying value of long-lived assets to be held and used whenevents and circumstances warrant such review. If the carrying value of a long-lived asset is considered impaired, a loss isrecognized based on the amount by which the carrying value exceeds the fair value of the long-lived asset for assets to be heldand used. The Company also reviews the useful life of its long-lived assets when events and circumstances indicate that theactual useful life may be shorter than originally estimated. In the event that the actual useful life is deemed to be shorter thanthe original useful life, depreciation is adjusted prospectively so that the remaining book value is depreciated over the reviseduseful life.
Asset groups classified as held for sale are measured at the lower of carrying amount or fair value less cost to sell, and aloss is recognized for any initial adjustment required to reduce the carrying amount to the fair value less cost to sell in theperiod the held for sale criteria are met. The fair value less cost to sell must be assessed each reporting period the asset groupremains classified as held for sale. Gains or losses not previously recognized resulting from the sale of an asset group will berecognized on the date of sale.
Product Warranty and Recall Campaigns – The Company currently provides a standard two-year limited warranty on allnew motorcycles sold worldwide, except for Japan, where the Company provides a standard three-year limited warranty on allnew motorcycles sold. In addition, the Company offers a one-year warranty for Parts & Accessories (P&A). The warrantycoverage for the retail customer generally begins when the product is sold to a retail customer. The Company maintainsreserves for future warranty claims using an estimated cost, which are based primarily on historical Company claiminformation. Additionally, the Company has from time to time initiated certain voluntary recall campaigns. The Companyreserves for all estimated costs associated with recalls in the period that management approves and commits to the recall.
Changes in the Company’s warranty and recall liability were as follows (in thousands):
2016 2015 2014
Balance, beginning of period $ 74,217 $ 69,250 $ 64,120Warranties issued during the period 60,215 59,259 60,331Settlements made during the period (99,298) (96,529) (74,262)Recalls and changes to pre-existing warranty liabilities 44,348 42,237 19,061Balance, end of period $ 79,482 $ 74,217 $ 69,250
The liability for recall campaigns was $13.6 million, $10.2 million and $9.8 million at December 31, 2016, 2015 and2014, respectively.
Derivative Financial Instruments – The Company is exposed to certain risks such as foreign currency exchange rate risk,interest rate risk and commodity price risk. To reduce its exposure to such risks, the Company selectively uses derivativefinancial instruments. All derivative transactions are authorized and executed pursuant to regularly reviewed policies andprocedures, which prohibit the use of financial instruments for speculative trading purposes.
All derivative instruments are recognized on the balance sheet at fair value (see Note 7). In accordance with ASC Topic815, “Derivatives and Hedging,” the accounting for changes in the fair value of a derivative instrument depends on whether ithas been designated and qualifies as part of a hedging relationship and, further, on the type of hedging relationship. Changes in
60

the fair value of derivatives that are designated as fair value hedges, along with the gain or loss on the hedged item, arerecorded in current period earnings. For derivative instruments that are designated as cash flow hedges, the effective portion ofgains and losses that result from changes in the fair value of derivative instruments is initially recorded in other comprehensiveincome (OCI) and subsequently reclassified into earnings when the hedged item affects income. The Company assesses, at boththe inception of each hedge and on an on-going basis, whether the derivatives that are used in its hedging transactions arehighly effective in offsetting changes in cash flows of the hedged items. Any ineffective portion is immediately recognized inearnings. No component of a hedging derivative instrument’s gain or loss is excluded from the assessment of hedgeeffectiveness. Derivative instruments that do not qualify for hedge accounting are recorded at fair value and any changes in fairvalue are recorded in current period earnings. Refer to Note 8 for a detailed description of the Company’s derivativeinstruments.
Motorcycles and Related Products Revenue Recognition – Sales are recorded when title and ownership is transferred,which is generally when products are shipped to wholesale customers (independent dealers). The Company may offer salesincentive programs to both wholesale and retail customers designed to promote the sale of motorcycles and related products.The total costs of these programs are generally recognized as revenue reductions and are accrued at the later of the date therelated sales are recorded or the date the incentive program is both approved and communicated.
Financial Services Revenue Recognition – Interest income on finance receivables is recorded as earned and is based onthe average outstanding daily balance for wholesale and retail receivables. Accrued and uncollected interest is classified withfinance receivables. Certain loan origination costs related to finance receivables, including payments made to dealers forcertain retail loans, are deferred and recorded within finance receivables, and amortized over the estimated life of the contract.
Retail finance receivables are contractually delinquent if the minimum payment is not received by the specified due date.Retail finance receivables are generally charged-off when the receivable is 120 days or more delinquent, the related asset isrepossessed or the receivable is otherwise deemed uncollectible. All retail finance receivables accrue interest until eithercollected or charged-off. Accordingly, as of December 31, 2016 and 2015, all retail finance receivables are accounted for asinterest-earning receivables.
Wholesale finance receivables are delinquent if the minimum payment is not received by the contractual due date.Wholesale finance receivables are written down once management determines that the specific borrower does not have theability to repay the loan in full. Interest continues to accrue on past due finance receivables until the date the finance receivablebecomes uncollectible and the finance receivable is placed on non-accrual status. The Company will resume accruing intereston these accounts when payments are current according to the terms of the loans and future payments are reasonably assured.While on non-accrual status, all cash received is applied to principal or interest as appropriate.
Insurance and protection product commissions as well as commissions on the sale of extended service contracts arerecognized when contractually earned. Deferred revenue related to extended service contracts was $4.5 million and $4.6million as of December 31, 2016 and 2015, respectively.
Research and Development Expenses – Expenditures for research activities relating to product development andimprovement are charged against income as incurred and included within selling, administrative and engineering expenses inthe consolidated statement of income. Research and development expenses were $172.3 million, $161.2 million and $138.3million for 2016, 2015 and 2014, respectively.
Advertising Costs – The Company expenses the production cost of advertising the first time the advertising takes place.Advertising costs relate to the Company’s efforts to promote its products and brands through the use of media. During 2016,2015 and 2014, the Company incurred $137.4 million, $119.8 million and $107.4 million in advertising costs, respectively.
Shipping and Handling Costs – The Company classifies shipping and handling costs as a component of cost of goodssold.
Share-Based Award Compensation Costs – The Company recognizes the cost of its share-based awards in its statement ofincome. The cost of each share-based equity award is based on the grant date fair value and the cost of each share-based cash-settled award is based on the settlement date fair value. Share-based award expense is recognized on a straight-line basis overthe service or performance periods of the awards. The expense recognized reflects the number of awards that are ultimatelyexpected to vest based on the service and, if applicable, performance requirements of each award. Total share-based awardcompensation expense recognized by the Company during 2016, 2015 and 2014 was $32.3 million, $29.4 million and $37.9million, respectively, or $20.4 million, $18.5 million and $23.9 million net of taxes, respectively.
Income Tax Expense – The Company recognizes interest and penalties related to unrecognized tax benefits in theprovision for income taxes.
61

New Accounting Standards
Accounting Standards Recently Adopted
In February 2015, the Financial Accounting Standards Board (FASB) issued Accounting Standards Update (ASU) No.2015-02 Amendments to the Consolidation Analysis (ASU 2015-02). ASU 2015-02 amends the guidance within AccountingStandards Codification (ASC) Topic 810, "Consolidation,” to change the analysis that a reporting entity must perform todetermine whether it should consolidate certain legal entities. The Company adopted ASU 2015-02 on January 1, 2016. Theadoption of ASU 2015-02 had no impact on the Company's consolidated financial statements.
In April 2015, the FASB issued ASU No. 2015-03 Simplifying the Presentation of Debt Issuance Costs (ASU 2015-03).ASU 2015-03 amends the guidance within ASC Topic 835, "Interest," to require that debt issuance costs related to a recognizeddebt liability be presented on the balance sheet as a direct deduction from the carrying amount of that debt liability, consistentwith debt premiums and discounts. In August 2015, the FASB further issued ASU No. 2015-15 Presentation and SubsequentMeasurement of Debt Issuance Costs Associated with Line-of-Credit Arrangements (ASU 2015-15). ASU 2015-15 amends theguidance within ASC Topic 835, “Interest,” to allow an entity to defer and present debt issuance costs associated with a line ofcredit arrangement as an asset, regardless of whether there are any outstanding borrowings on the line of credit arrangement.
The Company adopted ASU 2015-03 and ASU 2015-15 retrospectively on January 1, 2016. As a result, debt issuancecosts related to its medium-term notes, senior unsecured notes, and term asset-backed securitizations are now classified as areduction to the carrying amount of the related debt on the balance sheet. Debt issuance costs previously recorded in othercurrent assets and other long-term assets totaling $18.2 million as of December 31, 2015 on the balance sheet have beenreclassified to current portion of long-term debt, net and long-term debt, net to reflect the adoption of the new guidance. Therequired new disclosures are also presented in Note 10. The Company will continue to classify debt issuance costs related toline of credit arrangements, which include its asset-backed commercial paper and unsecured commercial paper programs andits credit facilities, as an asset, regardless of whether it has any outstanding borrowings on the line of credit arrangements.
In April 2015, the FASB issued ASU No. 2015-05 Customer's Accounting for Fees Paid in a Cloud ComputingArrangement, which amends ASC 350-40, "Intangibles-Goodwill and Other Internal-Use Software" (ASU 2015-05). ASU2015-05 provides guidance to customers about whether a cloud computing arrangement includes a software license. If anarrangement includes a software license, the accounting for the license will be consistent with the licenses of other intangibleassets. If the arrangement does not include a license, the arrangement will be accounted for as a service contract. The Companyadopted ASU 2015-05 prospectively on January 1, 2016. The adoption of ASU 2015-05 had no material impact on theCompany's consolidated financial statements.
In May 2015, the FASB issued ASU No. 2015-07, Fair Value Measurement (Topic 820): Disclosures for Investments inCertain Entities that Calculate Net Asset Value per Share (or its Equivalent) that eliminates the requirement to classifyinvestments measured using the NAV practical expedient in the fair value hierarchy table. Instead, entities will be required todisclose the fair values of such investments so that the financial statement users can reconcile amounts reported in the fair valuehierarchy table with the amounts reported in the balance sheet. The Company adopted this new guidance on a retrospectivebasis in 2016 which resulted in a change to the presentation of pension and postretirement plan assets in Note 13 of the Notes toConsolidated Financial Statements.
In November 2015, the FASB issued ASU No. 2015-17 Income Taxes (Topic 740): Balance Sheet Classification ofDeferred Taxes (ASU 2015-17). ASU 2015-17 eliminates the requirement for a Company to separate deferred income taxliabilities and assets into current and noncurrent amounts on a classified statement of financial position and requires thatdeferred tax liabilities and assets be classified as noncurrent. The Company adopted ASU 2015-17 on December 31, 2016 on aprospective basis and prior period balances were not adjusted.
Accounting Standards Not Yet Adopted
In May 2014, the Financial Accounting Standards Board (FASB) issued Accounting Standards Update (ASU)No. 2014-09 Revenue from Contracts with Customers (ASU 2014-09). ASU 2014-09 is a comprehensive new revenuerecognition model that requires a company to recognize revenue to depict the transfer of goods or services to customers in anamount that reflects the consideration to which the company expects to be entitled in exchange for those goods or services. InAugust 2015, the FASB issued ASU No. 2015-14 Revenue from Contracts with Customers: Deferral of Effective Date (ASU2015-14) to defer the effective date of the new revenue recognition standard by one year to fiscal years beginning afterDecember 15, 2017 and interim periods therein. The guidance may be adopted using either a full retrospective or modifiedretrospective approach. The Company expects to adopt the new revenue recognition guidance using the modified retrospectivemethod. The Company's efforts to evaluate the impact and to prepare for its adoption on January 1, 2018 are well underway.Based on the work completed to date (which includes the review of significant domestic revenue sources), the Company
62

expects that the recognition of revenue for domestic sales of motorcycles, parts and accessories and general merchandiseproducts under the new revenue recognition guidance will occur at a point in time, which is consistent with current practice.The Company is continuing to evaluate its international revenue sources for potential impact, but based on the work completedto date, expects its conclusions will be consistent with those reached for domestic revenue sources. Interest income, whichmakes up the vast majority of revenue in the Financial Services segment, is not within the scope of the new standard.
In July 2015, the FASB issued ASU No. 2015-11 Inventory (Topic 330): Simplifying the Measurement of Inventory(ASU 2015-11). ASU 2015-11 simplifies the subsequent measurement of inventory by using only the lower of cost or netrealizable value. ASU 2015-11 does not apply to inventory measured using the last-in, first-out method. The Company isrequired to adopt ASU 2015-11 for fiscal years, and for interim periods within those fiscal years, beginning after December 15,2016 on a prospective basis. Early adoption will be permitted. The adoption of ASU 2015-11 will not have a material effect onthe Company’s consolidated financial statements.
In January 2016, the FASB issued ASU No. 2016-01 Financial Instruments-Overall (Subtopic 825-10): Recognition andMeasurement of Financial Assets and Financial Liabilities (ASU 2016-01). ASU 2016-01 enhances the existing financialinstruments reporting model by modifying fair value measurement tools, simplifying impairment assessments for certain equityinstruments, and modifying overall presentation and disclosure requirements. The Company is required to adopt ASU 2016-01for fiscal years, and for interim periods within those fiscal years, beginning after December 15, 2017 on a prospective basis.The Company is currently evaluating the impact of adoption of ASU 2016-01.
In February 2016, the FASB issued ASU No. 2016-02 Leases (Topic 842) (ASU 2016-02). ASU 2016-02 amends theexisting lease accounting model by requiring a lessee to recognize the rights and obligations resulting from certain leases asassets and liabilities on the balance sheet. ASU 2016-02 also requires a company to disclose key information about their leasingarrangements. The Company is required to adopt ASU 2016-02 for fiscal years, and for interim periods within those fiscalyears, beginning after December 15, 2018 using a modified retrospective approach. Early adoption is permitted. The Companyis currently evaluating the impact of adoption of ASU 2016-02.
In March 2016, the FASB issued ASU No. 2016-09 Compensation – Stock Compensation (Topic 718): Improvements toEmployee Share-Based Payment Accounting (ASU 2016-09). ASU 2016-09 amends the guidance on several aspects ofaccounting for share-based payment transactions, including income tax consequences, classification of awards as either equityor liabilities, accounting for forfeitures, and classification on the statement of cash flows. The Company is required to adoptASU 2016-09 for fiscal years, and for interim periods within those fiscal years, beginning after December 15, 2016 on both aretrospective and prospective basis dependent upon the nature of the subtopic. Early adoption is permitted, including adoptionin an interim period. The Company does not expect the adoption of ASU 2016-09 to have a material impact on its financialstatements.
In July 2016, the FASB issued ASU No. 2016-13 Financial Instruments-Credit Losses (Topic 326): Measurement ofCredit Losses on Financial Instruments (ASU 2016-13). ASU 2016-13 changes how to recognize expected credit losses onfinancial assets. The standard requires a more timely recognition of credit losses on loans and other financial assets and alsoprovides additional transparency about credit risk. The current credit loss standard generally requires that a loss actually beincurred before it is recognized, while the new standard will require recognition of full lifetime expected losses upon initialrecognition of the financial instrument. The Company is required to adopt ASU 2016-13 for fiscal years, and for interimperiods within those fiscal years, beginning after December 15, 2019 on a modified retrospective basis. Early adoption ispermitted for fiscal years beginning after December 15, 2018. An entity should apply the standard by recording a cumulativeeffect adjustment to retained earnings upon adoption. Adoption of this standard will impact how the Company recognizes creditlosses on its financial instruments. The Company is currently evaluating the impact of adoption of ASU 2016-13 but anticipatesthe adoption of ASU 2016-13 will result in an increase in the annual provision for credit losses and the related allowance forcredit losses.
In August 2016, the FASB issued ASU No. 2016-15 Statement of Cash Flows (Topic 230): Classification of Certain CashReceipts and Cash Payments (ASU 2016-15). ASU 2016-15 addresses eight specific cash flow issues with the objective ofreducing diversity in practice regarding how certain cash receipts and cash payments are presented in the statement of cashflows. The standard provides guidance on the classification of the following items: (1) debt prepayment or debt extinguishmentcosts, (2) settlement of zero-coupon debt instruments, (3) contingent consideration payments made after a businesscombination, (4) proceeds from the settlement of insurance claims, (5) proceeds from the settlement of corporate-owned lifeinsurance policies, (6) distributions received from equity method investments, (7) beneficial interests in securitizationtransactions, and (8) separately identifiable cash flows. The Company is required to adopt ASU 2016-15 for fiscal years, andfor interim periods within those fiscal years, beginning after December 15, 2017 on a retrospective basis. Early adoption ispermitted, including adoption in an interim period. The Company is currently evaluating the impact of adoption of ASU2016-15.
63
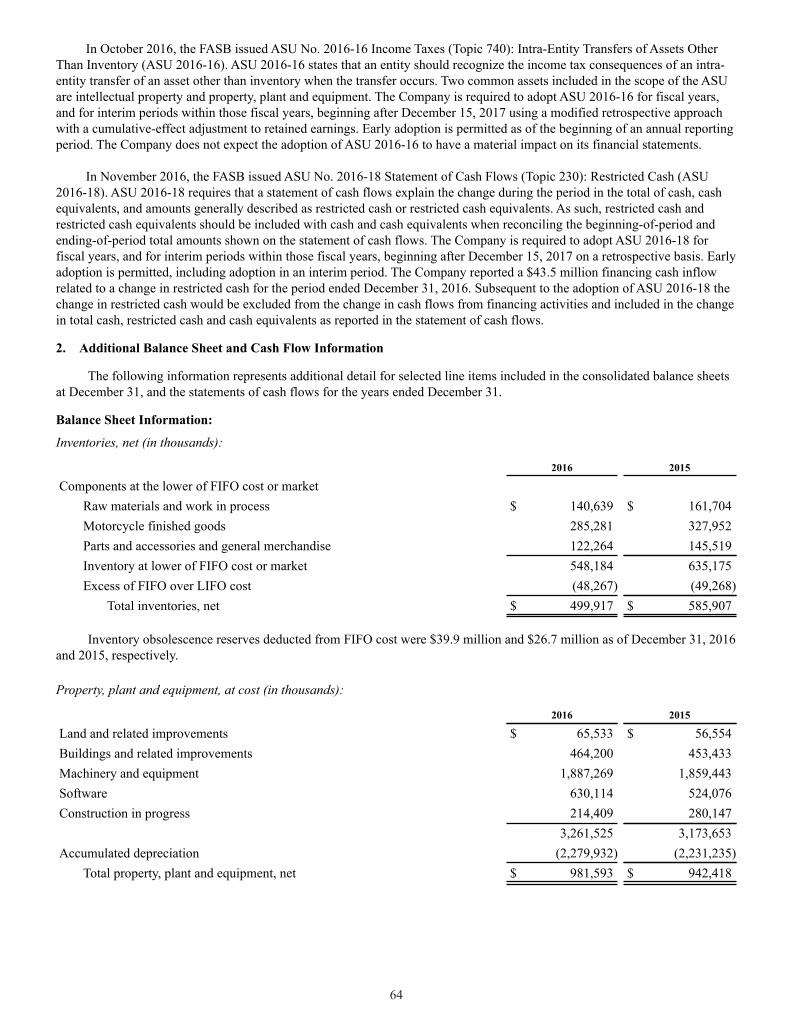
In October 2016, the FASB issued ASU No. 2016-16 Income Taxes (Topic 740): Intra-Entity Transfers of Assets OtherThan Inventory (ASU 2016-16). ASU 2016-16 states that an entity should recognize the income tax consequences of an intra-entity transfer of an asset other than inventory when the transfer occurs. Two common assets included in the scope of the ASUare intellectual property and property, plant and equipment. The Company is required to adopt ASU 2016-16 for fiscal years,and for interim periods within those fiscal years, beginning after December 15, 2017 using a modified retrospective approachwith a cumulative-effect adjustment to retained earnings. Early adoption is permitted as of the beginning of an annual reportingperiod. The Company does not expect the adoption of ASU 2016-16 to have a material impact on its financial statements.
In November 2016, the FASB issued ASU No. 2016-18 Statement of Cash Flows (Topic 230): Restricted Cash (ASU2016-18). ASU 2016-18 requires that a statement of cash flows explain the change during the period in the total of cash, cashequivalents, and amounts generally described as restricted cash or restricted cash equivalents. As such, restricted cash andrestricted cash equivalents should be included with cash and cash equivalents when reconciling the beginning-of-period andending-of-period total amounts shown on the statement of cash flows. The Company is required to adopt ASU 2016-18 forfiscal years, and for interim periods within those fiscal years, beginning after December 15, 2017 on a retrospective basis. Earlyadoption is permitted, including adoption in an interim period. The Company reported a $43.5 million financing cash inflowrelated to a change in restricted cash for the period ended December 31, 2016. Subsequent to the adoption of ASU 2016-18 thechange in restricted cash would be excluded from the change in cash flows from financing activities and included in the changein total cash, restricted cash and cash equivalents as reported in the statement of cash flows.
2. Additional Balance Sheet and Cash Flow Information
The following information represents additional detail for selected line items included in the consolidated balance sheetsat December 31, and the statements of cash flows for the years ended December 31.
Balance Sheet Information:
Inventories, net (in thousands):
2016 2015
Components at the lower of FIFO cost or marketRaw materials and work in process $ 140,639 $ 161,704Motorcycle finished goods 285,281 327,952Parts and accessories and general merchandise 122,264 145,519Inventory at lower of FIFO cost or market 548,184 635,175Excess of FIFO over LIFO cost (48,267) (49,268)
Total inventories, net $ 499,917 $ 585,907
Inventory obsolescence reserves deducted from FIFO cost were $39.9 million and $26.7 million as of December 31, 2016and 2015, respectively.
Property, plant and equipment, at cost (in thousands):
2016 2015
Land and related improvements $ 65,533 $ 56,554Buildings and related improvements 464,200 453,433Machinery and equipment 1,887,269 1,859,443Software 630,114 524,076Construction in progress 214,409 280,147
3,261,525 3,173,653Accumulated depreciation (2,279,932) (2,231,235)
Total property, plant and equipment, net $ 981,593 $ 942,418
64

Accrued liabilities (in thousands):
2016 2015
Payroll, employee benefits and related expenses $ 148,221 $ 160,971Warranty and recalls 57,698 54,894Sales incentive programs 43,218 37,568Tax-related accruals 26,140 18,535Accrued interest 42,788 33,925Other 168,587 166,071
Total accrued liabilities $ 486,652 $ 471,964
Cash Flow Information:
The reconciliation of net income to net cash provided by operating activities of continuing operations is as follows (inthousands):
2016 2015 2014
Cash flows from operating activities:Net income $ 692,164 $ 752,207 $ 844,611Adjustments to reconcile net income to net cash provided byoperating activities:
Depreciation and amortization of intangibles 209,555 198,074 179,300Amortization of deferred loan origination costs 86,681 93,546 94,429Amortization of financing origination fees 9,252 9,975 8,442Provision for long-term employee benefits 38,273 60,824 33,709Employee benefit plan contributions and payments (55,809) (28,490) (29,686)Stock compensation expense 32,336 29,433 37,929Net change in wholesale finance receivables related to sales (3,233) (113,970) (75,210)Provision for credit losses 136,617 101,345 80,946Gain on off-balance sheet asset-backed securitization (9,269) — —Loss on debt extinguishment 118 1,099 3,942Deferred income taxes (165) (16,484) (7,621)Other, net (6,907) 20,913 20,473Changes in current assets and liabilities:
Accounts receivable, net (45,934) (13,665) (9,809)Finance receivables – accrued interest and other (1,489) (3,046) (2,515)Inventories 85,072 (155,222) (50,886)Accounts payable and accrued liabilities 38,237 138,823 21,309Derivative instruments (3,413) (5,615) 703Other (27,747) 30,371 (3,389)
Total adjustments 482,175 347,911 302,066Net cash provided by operating activities $ 1,174,339 $ 1,100,118 $ 1,146,677
Cash paid during the period for interest and income taxes (in thousands):
2016 2015 2014
Interest $ 185,804 $ 148,654 $ 154,310Income taxes $ 356,553 $ 371,547 $ 438,840
Interest paid represents interest payments of HDFS (included in financial services interest expense) and interest paymentsof the Company (included in interest expense).
65

3. Acquisition
On August 4, 2015, the Company completed its purchase of certain assets and liabilities from Fred Deeley Imports, Ltd.(Deeley Imports) including, among other things, the acquisition of the exclusive right to distribute the Company's motorcyclesand other products in Canada (Transaction) for total consideration of $59.9 million. The majority equity owner of DeeleyImports prior to the transaction closing is a member of the Board of Directors of the Company. The acquisition of the Canadiandistribution rights allowed the Company to align its distribution in Canada with its global go-to-market approach.
The financial impact of the acquisition, which was part of the Motorcycles segment, has been included in the Company'sconsolidated financial statements from the date of acquisition. Proforma information reflecting this acquisition has not beendisclosed as the proforma impact on consolidated net income was not material.
The following table summarizes the fair values of the Deeley Imports assets acquired and liabilities assumed at the dateof acquisition (in thousands):
August 4, 2015
Current assets $ 11,088Property, plant and equipment 144Intangible assets 20,842Goodwill 28,567
Total assets 60,641Current liabilities 731Net assets acquired $ 59,910
As noted above, in conjunction with the acquisition of certain assets and assumption of certain liabilities of DeeleyImports, the Company recorded goodwill of $28.6 million, all of which the Company believes is tax deductible, and intangibleassets with an initial fair value of $20.8 million. Of the total intangible assets acquired, $13.3 million was assigned toreacquired distribution rights with a useful life of two years and $7.5 million was assigned to customer relationships with auseful life of twenty years. The Company agreed to reimburse Deeley Imports for certain severance costs associated with theTransaction resulting in $3.3 million of expense included in selling, administrative and engineering expense in the third quarterof 2015. The Company did not acquire any cash as part of the Transaction.
4. Goodwill and Intangible Assets
The following table summarizes changes in the carrying amount of goodwill in the Motorcycles segment for thefollowing years ended December 31 (in thousands):
2016 2015 2014
Balance, beginning of period $ 54,182 $ 27,752 $ 30,452Business acquisitions — 28,567 —Currency translation (791) (2,137) (2,700)Balance, end of period $ 53,391 $ 54,182 $ 27,752
The following table summarizes the Motorcycles segment intangible assets other than goodwill at December 31 (inthousands):
2016Gross
CarryingAmount
AccumulatedAmortization Net
Estimateduseful life(years)
Intangible assets other than goodwill Reacquired distribution rights $ 12,928 $ (9,157) $ 3,771 2 Customer relationships 7,293 (517) 6,776 20
Total other intangible assets $ 20,221 $ (9,674) $ 10,547
66
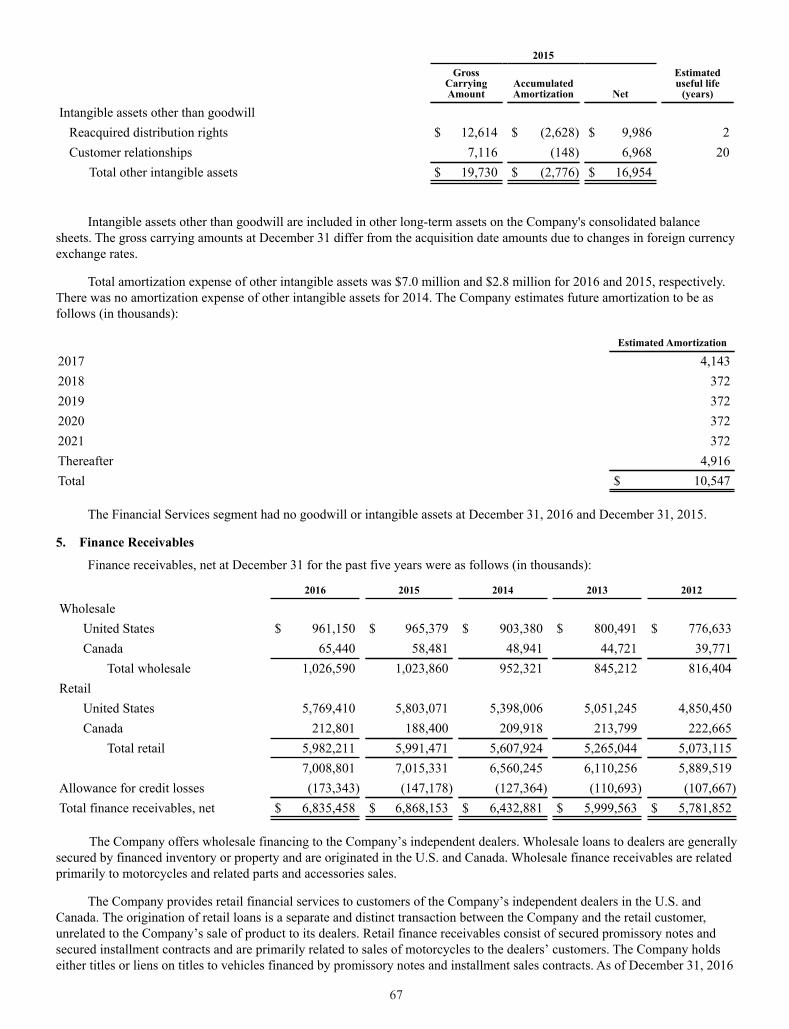
2015Gross
CarryingAmount
AccumulatedAmortization Net
Estimateduseful life
(years)
Intangible assets other than goodwill Reacquired distribution rights $ 12,614 $ (2,628) $ 9,986 2 Customer relationships 7,116 (148) 6,968 20
Total other intangible assets $ 19,730 $ (2,776) $ 16,954
Intangible assets other than goodwill are included in other long-term assets on the Company's consolidated balancesheets. The gross carrying amounts at December 31 differ from the acquisition date amounts due to changes in foreign currencyexchange rates.
Total amortization expense of other intangible assets was $7.0 million and $2.8 million for 2016 and 2015, respectively.There was no amortization expense of other intangible assets for 2014. The Company estimates future amortization to be asfollows (in thousands):
Estimated Amortization
2017 4,1432018 3722019 3722020 3722021 372Thereafter 4,916Total $ 10,547
The Financial Services segment had no goodwill or intangible assets at December 31, 2016 and December 31, 2015.
5. Finance Receivables
Finance receivables, net at December 31 for the past five years were as follows (in thousands):
2016 2015 2014 2013 2012
WholesaleUnited States $ 961,150 $ 965,379 $ 903,380 $ 800,491 $ 776,633Canada 65,440 58,481 48,941 44,721 39,771
Total wholesale 1,026,590 1,023,860 952,321 845,212 816,404Retail
United States 5,769,410 5,803,071 5,398,006 5,051,245 4,850,450Canada 212,801 188,400 209,918 213,799 222,665
Total retail 5,982,211 5,991,471 5,607,924 5,265,044 5,073,1157,008,801 7,015,331 6,560,245 6,110,256 5,889,519
Allowance for credit losses (173,343) (147,178) (127,364) (110,693) (107,667)Total finance receivables, net $ 6,835,458 $ 6,868,153 $ 6,432,881 $ 5,999,563 $ 5,781,852
The Company offers wholesale financing to the Company’s independent dealers. Wholesale loans to dealers are generallysecured by financed inventory or property and are originated in the U.S. and Canada. Wholesale finance receivables are relatedprimarily to motorcycles and related parts and accessories sales.
The Company provides retail financial services to customers of the Company’s independent dealers in the U.S. andCanada. The origination of retail loans is a separate and distinct transaction between the Company and the retail customer,unrelated to the Company’s sale of product to its dealers. Retail finance receivables consist of secured promissory notes andsecured installment contracts and are primarily related to sales of motorcycles to the dealers’ customers. The Company holdseither titles or liens on titles to vehicles financed by promissory notes and installment sales contracts. As of December 31, 2016
67

and 2015, approximately 11% and 12% of gross outstanding retail finance receivables were originated in Texas, respectively;there were no other states that accounted for more than 10% of gross outstanding retail finance receivables.
Unused lines of credit extended to the Company's wholesale finance customers totaled $1.32 billion and $1.27 billion atDecember 31, 2016 and 2015, respectively. Approved but unfunded retail finance loans totaled $177.9 million and $169.6million at December 31, 2016 and 2015, respectively.
Wholesale finance receivables are generally contractually due within one year. On December 31, 2016, contractualmaturities of finance receivables were as follows (in thousands):
United States Canada Total
2017 $ 2,004,454 $ 107,658 $ 2,112,1122018 1,123,428 44,731 1,168,1592019 1,256,972 48,806 1,305,7782020 1,217,711 53,254 1,270,9652021 1,106,241 23,792 1,130,033Thereafter 21,754 — 21,754Total $ 6,730,560 $ 278,241 $ 7,008,801
The allowance for credit losses on finance receivables is comprised of individual components relating to wholesale andretail finance receivables. Changes in the allowance for credit losses on finance receivables by portfolio for the year endedDecember 31 were as follows (in thousands):
2016Retail Wholesale Total
Balance, beginning of period $ 139,320 $ 7,858 $ 147,178Provision for credit losses 137,893 (1,276) 136,617Charge-offs (148,566) — (148,566)Recoveries 41,405 — 41,405Other (a) (3,291) — (3,291)Balance, end of period $ 166,761 $ 6,582 $ 173,343
2015Retail Wholesale Total
Balance, beginning of period $ 122,025 $ 5,339 $ 127,364Provision for credit losses 98,826 2,519 101,345Charge-offs (123,911) — (123,911)Recoveries 42,380 — 42,380Balance, end of period $ 139,320 $ 7,858 $ 147,178
2014Retail Wholesale Total
Balance, beginning of period $ 106,063 $ 4,630 $ 110,693Provision for credit losses 80,237 709 80,946Charge-offs (102,831) — (102,831)Recoveries 38,556 — 38,556Balance, end of period $ 122,025 $ 5,339 $ 127,364
(a) Related to the sale of finance receivables during the second quarter of 2016 with a principal balance of $301.8 millionthrough an off-balance sheet asset-backed securitization transaction (see Note 11 for additional information).
68

There were no finance receivables individually evaluated for impairment on December 31, 2016 or 2015. The allowancefor credit losses and finance receivables by portfolio, collectively evaluated for impairment, at December 31 was as follows (inthousands):
2016Retail Wholesale Total
Allowance for credit losses, ending balance:Individually evaluated for impairment $ — $ — $ —Collectively evaluated for impairment 166,761 6,582 173,343
Total allowance for credit losses $ 166,761 $ 6,582 $ 173,343Finance receivables, ending balance:
Individually evaluated for impairment $ — $ — $ —Collectively evaluated for impairment 5,982,211 1,026,590 7,008,801
Total finance receivables $ 5,982,211 $ 1,026,590 $ 7,008,801
2015Retail Wholesale Total
Allowance for credit losses, ending balance:Individually evaluated for impairment $ — $ — $ —Collectively evaluated for impairment 139,320 7,858 147,178
Total allowance for credit losses $ 139,320 $ 7,858 $ 147,178Finance receivables, ending balance:
Individually evaluated for impairment $ — $ — $ —Collectively evaluated for impairment 5,991,471 1,023,860 7,015,331
Total finance receivables $ 5,991,471 $ 1,023,860 $ 7,015,331
Finance receivables are considered impaired when management determines it is probable that the Company will beunable to collect all amounts due according to the loan agreement. As retail finance receivables are collectively and notindividually reviewed for impairment, this portfolio does not have specifically impaired finance receivables. At December 31,2016 and 2015, there were no wholesale finance receivables that were on non-accrual status or individually deemed to beimpaired under ASC Topic 310, “Receivables.”
An analysis of the aging of past due finance receivables at December 31 was as follows (in thousands):
2016
Current31-60 DaysPast Due
61-90 DaysPast Due
Greater than90 DaysPast Due
TotalPast Due
TotalFinance
Receivables
Retail $ 5,760,818 $ 131,302 $ 49,642 $ 40,449 $ 221,393 $ 5,982,211Wholesale 1,024,995 1,000 319 276 1,595 1,026,590
Total $ 6,785,813 $ 132,302 $ 49,961 $ 40,725 $ 222,988 $ 7,008,801
2015
Current31-60 DaysPast Due
61-90 DaysPast Due
Greater than90 DaysPast Due
TotalPast Due
TotalFinance
Receivables
Retail $ 5,796,003 $ 118,996 $ 43,680 $ 32,792 $ 195,468 $ 5,991,471Wholesale 1,022,365 888 530 77 1,495 1,023,860
Total $ 6,818,368 $ 119,884 $ 44,210 $ 32,869 $ 196,963 $ 7,015,331
69

The recorded investment of retail and wholesale finance receivables, excluding non-accrual status finance receivables,that were contractually past due 90 days or more at December 31 for the past five years was as follows (in thousands):
2016 2015 2014 2013 2012
United States $ 39,399 $ 31,677 $ 27,800 $ 23,770 $ 26,500Canada 1,326 1,192 1,118 1,031 1,533
Total $ 40,725 $ 32,869 $ 28,918 $ 24,801 $ 28,033
A significant part of managing the Company's finance receivable portfolios includes the assessment of credit riskassociated with each borrower. As the credit risk varies between the retail and wholesale portfolios, the Company utilizesdifferent credit risk indicators for each portfolio.
The Company manages retail credit risk through its credit approval policy and ongoing collection efforts. The Companyuses FICO scores, a standard credit rating measurement, to differentiate the expected default rates of retail credit applicants,enabling the Company to better evaluate credit applicants for approval and to tailor pricing according to this assessment. Retailloans with a FICO score of 640 or above at origination are considered prime, and loans with a FICO score below 640 areconsidered sub-prime. These credit quality indicators are determined at the time of loan origination and are not updatedsubsequent to the loan origination date.
The recorded investment of retail finance receivables, by credit quality indicator, at December 31 was as follows (inthousands):
2016 2015
Prime $ 4,768,420 $ 4,777,448Sub-prime 1,213,791 1,214,023
Total $ 5,982,211 $ 5,991,471
The Company's credit risk on the wholesale portfolio is different from that of the retail portfolio. Whereas the retailportfolio represents a relatively homogeneous pool of retail finance receivables that exhibit more consistent loss patterns, thewholesale portfolio exposures are less consistent. The Company utilizes an internal credit risk rating system to manage creditrisk exposure consistently across wholesale borrowers and evaluates credit risk factors for each borrower. The Company usesthe following internal credit quality indicators, based on an internal risk rating system, listed from highest level of risk tolowest level of risk, for the wholesale portfolio: Doubtful, Substandard, Special Mention, Medium Risk and Low Risk. Basedupon management’s review, the dealers classified in the Doubtful category are the dealers with the greatest likelihood of beingcharged-off, while the dealers classified as Low Risk are least likely to be charged-off. The internal rating system considersfactors such as the specific borrower's ability to repay and the estimated value of any collateral. Dealer risk ratingclassifications are reviewed and updated on a quarterly basis.
The recorded investment of wholesale finance receivables, by internal credit quality indicator, at December 31 was asfollows (in thousands):
2016 2015
Doubtful $ 1,333 $ 5,169Substandard 1,773 21,774Special Mention 30,152 6,271Medium Risk 14,620 11,494Low Risk 978,712 979,152
Total $ 1,026,590 $ 1,023,860
6. Fair Value Measurements
Certain assets and liabilities are recorded at fair value in the financial statements; some of these are measured on arecurring basis while others are measured on a non-recurring basis. Assets and liabilities measured on a recurring basis arethose that are adjusted to fair value each time a financial statement is prepared. Assets and liabilities measured on a non-recurring basis are those that are adjusted to fair value when required by particular events or circumstances. In determining thefair value of assets and liabilities, the Company uses various valuation techniques. The availability of inputs observable in themarket varies from instrument to instrument and depends on a variety of factors including the type of instrument, whether theinstrument is actively traded, and other characteristics particular to the transaction. For many financial instruments, pricing
70
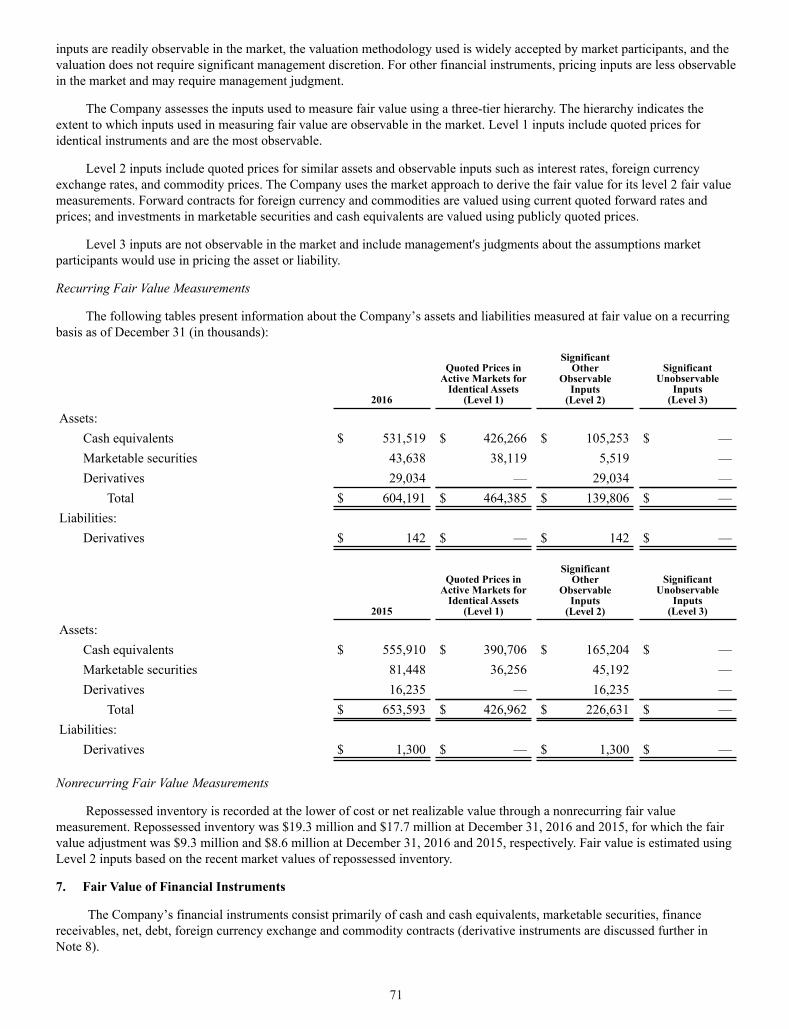
inputs are readily observable in the market, the valuation methodology used is widely accepted by market participants, and thevaluation does not require significant management discretion. For other financial instruments, pricing inputs are less observablein the market and may require management judgment.
The Company assesses the inputs used to measure fair value using a three-tier hierarchy. The hierarchy indicates theextent to which inputs used in measuring fair value are observable in the market. Level 1 inputs include quoted prices foridentical instruments and are the most observable.
Level 2 inputs include quoted prices for similar assets and observable inputs such as interest rates, foreign currencyexchange rates, and commodity prices. The Company uses the market approach to derive the fair value for its level 2 fair valuemeasurements. Forward contracts for foreign currency and commodities are valued using current quoted forward rates andprices; and investments in marketable securities and cash equivalents are valued using publicly quoted prices.
Level 3 inputs are not observable in the market and include management's judgments about the assumptions marketparticipants would use in pricing the asset or liability.
Recurring Fair Value Measurements
The following tables present information about the Company’s assets and liabilities measured at fair value on a recurringbasis as of December 31 (in thousands):
2016
Quoted Prices inActive Markets forIdentical Assets
(Level 1)
SignificantOther
ObservableInputs(Level 2)
SignificantUnobservable
Inputs(Level 3)
Assets:Cash equivalents $ 531,519 $ 426,266 $ 105,253 $ —Marketable securities 43,638 38,119 5,519 —Derivatives 29,034 — 29,034 —
Total $ 604,191 $ 464,385 $ 139,806 $ —Liabilities:
Derivatives $ 142 $ — $ 142 $ —
2015
Quoted Prices inActive Markets forIdentical Assets
(Level 1)
SignificantOther
ObservableInputs(Level 2)
SignificantUnobservable
Inputs(Level 3)
Assets:Cash equivalents $ 555,910 $ 390,706 $ 165,204 $ —Marketable securities 81,448 36,256 45,192 —Derivatives 16,235 — 16,235 —
Total $ 653,593 $ 426,962 $ 226,631 $ —Liabilities:
Derivatives $ 1,300 $ — $ 1,300 $ —
Nonrecurring Fair Value Measurements
Repossessed inventory is recorded at the lower of cost or net realizable value through a nonrecurring fair valuemeasurement. Repossessed inventory was $19.3 million and $17.7 million at December 31, 2016 and 2015, for which the fairvalue adjustment was $9.3 million and $8.6 million at December 31, 2016 and 2015, respectively. Fair value is estimated usingLevel 2 inputs based on the recent market values of repossessed inventory.
7. Fair Value of Financial Instruments
The Company’s financial instruments consist primarily of cash and cash equivalents, marketable securities, financereceivables, net, debt, foreign currency exchange and commodity contracts (derivative instruments are discussed further inNote 8).
71

The following table summarizes the fair value and carrying value of the Company’s financial instruments at December 31(in thousands):
2016 2015Fair Value Carrying Value Fair Value Carrying Value
Assets:Cash and cash equivalents $ 759,984 $ 759,984 $ 722,209 $ 722,209Marketable securities $ 43,638 $ 43,638 $ 81,448 $ 81,448Derivatives $ 29,034 $ 29,034 $ 16,235 $ 16,235Finance receivables, net $ 6,921,037 $ 6,835,458 $ 6,937,053 $ 6,868,153Restricted cash $ 67,147 $ 67,147 $ 110,642 $ 110,642
Liabilities:Derivatives $ 142 $ 142 $ 1,300 $ 1,300Unsecured commercial paper $ 1,055,708 $ 1,055,708 $ 1,201,380 $ 1,201,380Asset-backed Canadian commercialpaper conduit facility $ 149,338 $ 149,338 $ 153,839 $ 153,839Medium-term notes $ 4,139,462 $ 4,064,940 $ 3,410,966 $ 3,316,949Senior unsecured notes $ 744,552 $ 741,306 $ 737,435 $ 740,653Term asset-backed securitization debt $ 797,688 $ 796,275 $ 1,455,776 $ 1,459,377
Cash and Cash Equivalents and Restricted Cash – With the exception of certain cash equivalents, the carrying value ofthese items in the financial statements is based on historical cost. The historical cost basis for these amounts is estimated toapproximate their respective fair values due to the short maturity of these instruments. Fair value is based on Level 1 or Level 2inputs.
Marketable Securities – The carrying value of marketable securities in the financial statements is based on fair value. Thefair value of marketable securities is determined primarily based on quoted prices for identical instruments or on quoted marketprices of similar financial assets. Fair value is based on Level 1 or Level 2 inputs.
Finance Receivables, Net – The carrying value of retail and wholesale finance receivables in the financial statements isamortized cost less an allowance for credit losses. The fair value of retail finance receivables is generally calculated bydiscounting future cash flows using an estimated discount rate that reflects current credit, interest rate and prepayment risksassociated with similar types of instruments. Fair value is determined based on Level 3 inputs. The amortized cost basis ofwholesale finance receivables approximates fair value because they either are short-term or have interest rates that adjust withchanges in market interest rates.
Derivatives – Forward contracts for foreign currency exchange and commodities are derivative financial instruments andare carried at fair value on the balance sheet. The fair value of these contracts is determined using quoted forward rates andprices. Fair value is calculated using Level 2 inputs.
Debt – The carrying value of debt in the financial statements is generally amortized cost. The carrying value of unsecuredcommercial paper approximates fair value due to its short maturity. Fair value is calculated using Level 2 inputs.
The carrying value of debt provided under the Canadian Conduit approximates fair value since the interest rates chargedunder the facility are tied directly to market rates and fluctuate as market rates change. Fair value is calculated using Level 2inputs.
The fair values of the medium-term notes and senior unsecured notes are estimated based upon rates currently availablefor debt with similar terms and remaining maturities. Fair value is calculated using Level 2 inputs.
The fair value of the debt related to term asset-backed securitization transactions is estimated based on pricing currentlyavailable for transactions with similar terms and maturities. Fair value is calculated using Level 2 inputs.
72

8. Derivative Instruments and Hedging Activities
The Company is exposed to certain risks such as foreign currency exchange rate risk, interest rate risk and commodityprice risk. To reduce its exposure to such risks, the Company selectively uses derivative financial instruments. All derivativetransactions are authorized and executed pursuant to regularly reviewed policies and procedures, which prohibit the use offinancial instruments for speculative trading purposes.
All derivative instruments are recognized on the balance sheet at fair value (see Note 7). In accordance with ASC Topic815, "Derivatives and Hedging," the accounting for changes in the fair value of a derivative instrument depends on whether ithas been designated and qualifies as part of a hedging relationship and, further, on the type of hedging relationship. Changes inthe fair value of derivatives that are designated as fair value hedges, along with the gain or loss on the hedged item, arerecorded in current period earnings. For derivative instruments that are designated as cash flow hedges, the effective portion ofgains and losses that result from changes in the fair value of derivative instruments is initially recorded in other comprehensiveincome (OCI) and subsequently reclassified into earnings when the hedged item affects income. The Company assesses, both atthe inception of each hedge and on an on-going basis, whether the derivatives that are used in its hedging transactions arehighly effective in offsetting changes in cash flows of the hedged items. Any ineffective portion is immediately recognized inearnings. No component of a hedging derivative instrument’s gain or loss is excluded from the assessment of hedgeeffectiveness. Derivative instruments that do not qualify for hedge accounting are recorded at fair value and any changes in fairvalue are recorded in current period earnings.
The Company sells its products internationally, and in most markets those sales are made in the foreign country’s localcurrency. As a result, the Company’s earnings can be affected by fluctuations in the value of the U.S. dollar relative to foreigncurrency. The Company utilizes foreign currency exchange contracts to mitigate the effects of the Euro, the Australian dollar,the Japanese yen, the Brazilian real, the Canadian dollar and the Mexican peso. The foreign currency exchange contracts areentered into with banks and allow the Company to exchange a specified amount of foreign currency for U.S. dollars at a futuredate, based on a fixed exchange rate.
The Company utilizes commodity contracts to hedge portions of the cost of certain commodities consumed in theCompany’s motorcycle production and distribution operations.
The Company’s foreign currency exchange contracts and commodity contracts generally have maturities of less than oneyear.
During the second quarter of 2015, the Company entered into treasury rate locks to fix the interest rate on a portion of theprincipal related to its anticipated issuance of senior unsecured debt during the third quarter of 2015. The treasury rate lockcontracts were settled in July 2015. The loss at settlement was recorded in accumulated other comprehensive loss and will bereclassified into earnings over the life of the debt.
The following tables summarize the fair value of the Company’s derivative financial instruments at December 31 (inthousands):
2016 2015
Derivatives Designated As HedgingInstruments Under ASC Topic 815
NotionalValue
AssetFair Value(a)
LiabilityFair Value(b)
NotionalValue
AssetFair Value(a)
LiabilityFair Value(b)
Foreign currency contracts(c) $ 554,551 $ 28,528 $ 142 $ 436,352 $ 16,167 $ 181Commodities contracts(c) 992 177 — 968 — 159
Total $ 555,543 $ 28,705 $ 142 $ 437,320 $ 16,167 $ 340
2016 2015
Derivatives Not Designated As HedgingInstruments Under ASC Topic 815
NotionalValue
AssetFair Value(a)
LiabilityFair Value(b)
NotionalValue
AssetFair Value(a)
LiabilityFair Value(b)
Commodities contracts $ 5,025 $ 329 $ — $ 6,510 $ 68 $ 960Total $ 5,025 $ 329 $ — $ 6,510 $ 68 $ 960
(a) Included in other current assets(b) Included in accrued liabilities(c) Derivative designated as a cash flow hedge
The following tables summarize the amount of gains and losses for the following years ended December 31 related toderivative financial instruments designated as cash flow hedges (in thousands):
73

Amount of Gain/(Loss)Recognized in OCI, before tax
Cash Flow Hedges 2016 2015 2014
Foreign currency contracts $ 28,099 $ 45,810 $ 47,037Commodities contracts 77 (421) (262)Treasury rate locks — (7,381) —
Total $ 28,176 $ 38,008 $ 46,775
Amount of Gain/(Loss)Reclassified from AOCL into Income
Cash Flow Hedges 2016 2015 2014Expected to be Reclassified
Over the Next Twelve Months
Foreign currency contracts(a) $ 18,253 $ 59,730 $ 13,635 $ 26,583Commodities contracts(a) (258) (677) 228 177Treasury rate locks(b) (362) (151) — (362)
Total $ 17,633 $ 58,902 $ 13,863 $ 26,398
(a) Gain/(loss) reclassified from accumulated other comprehensive loss (AOCL) to income is included in cost of goods sold(b) Gain/(loss) reclassified from AOCL to income is included in interest expense
For the years ended December 31, 2016 and 2015, the cash flow hedges were highly effective and, as a result, the amountof hedge ineffectiveness was not material. No amounts were excluded from effectiveness testing.
The following table summarizes the amount of gains and losses for the years ended December 31 related to derivativefinancial instruments not designated as hedging instruments (in thousands):
Amount of Gain/(Loss)Recognized in Income on Derivative
Derivatives not Designated as Hedges 2016 2015 2014
Commodities contracts(a) $ 167 $ (648) $ (1,969)Total $ 167 $ (648) $ (1,969)
(a) Gain/(loss) recognized in income is included in cost of goods sold
74

9. Accumulated Other Comprehensive Loss
The following table sets forth the changes in accumulated other comprehensive loss (AOCL) for the years endedDecember 31 (in thousands):
2016Foreign currency
translationadjustments
Marketablesecurities
Derivativefinancial
instruments
Pension andpostretirementbenefit plans Total
Balance, beginning of period $ (58,844) $ (1,094) $ 5,886 $ (561,153) $ (615,205)Other comprehensive (loss) incomebefore reclassifications (7,591) (159) 28,176 33,937 54,363Income tax (1,697) 59 (10,436) (12,570) (24,644)Net other comprehensive (loss)income before reclassifications (9,288) (100) 17,740 21,367 29,719Reclassifications:
Realized (gains) losses - foreigncurrency contracts(a) — — (18,253) — (18,253)Realized (gains) losses -commodities contracts(a) — — 258 — 258Realized (gains) losses - treasuryrate lock(b) — — 362 — 362Prior service credits(c) — — — (1,784) (1,784)Actuarial losses(c) — — — 49,888 49,888Curtailment and settlement losses(c) — — — 1,463 1,463
Total before tax — — (17,633) 49,567 31,934Income tax expense (benefit) — — 6,531 (18,360) (11,829)Net reclassifications — — (11,102) 31,207 20,105Other comprehensive (loss) income (9,288) (100) 6,638 52,574 49,824Balance, end of period $ (68,132) $ (1,194) $ 12,524 $ (508,579) $ (565,381)
2015Foreign currency
translationadjustments
Marketablesecurities
Derivativefinancial
instruments
Pension andpostretirementbenefit plans Total
Balance, beginning of period $ (3,482) $ (700) $ 19,042 $ (529,803) $ (514,943)Other comprehensive (loss) incomebefore reclassifications (48,309) (626) 38,008 (106,059) (116,986)Income tax (7,053) 232 (14,079) 39,284 18,384Net other comprehensive (loss)income before reclassifications (55,362) (394) 23,929 (66,775) (98,602)Reclassifications:
Realized (gains) losses - foreigncurrency contracts(a) — — (59,730) — (59,730)Realized (gains) losses -commodities contracts(a) — — 677 — 677Realized (gains) losses - treasuryrate lock(b) — — 151 — 151Prior service credits(c) — — — (2,782) (2,782)Actuarial losses(c) — — — 58,680 58,680Curtailment and settlement losses(c) — — — 368 368
Total before tax — — (58,902) 56,266 (2,636)Income tax expense (benefit) — — 21,817 (20,841) 976Net reclassifications — — (37,085) 35,425 (1,660)Other comprehensive loss (55,362) (394) (13,156) (31,350) (100,262)Balance, end of period $ (58,844) $ (1,094) $ 5,886 $ (561,153) $ (615,205)
75

2014Foreign currency
translationadjustments
Marketablesecurities
Derivativefinancial
instruments
Pension andpostretirementbenefit plans Total
Balance, beginning of period $ 33,326 $ (276) $ (1,680) $ (364,046) $ (332,676)Other comprehensive (loss) incomebefore reclassifications (50,310) (673) 46,775 (301,832) (306,040)Income tax 13,502 249 (17,325) 111,799 108,225Net other comprehensive (loss)income before reclassifications (36,808) (424) 29,450 (190,033) (197,815)Reclassifications:
Realized (gains) losses - foreigncurrency contracts(a) — — (13,635) — (13,635)Realized (gains) losses -commodities contracts(a) — — (228) — (228)Prior service credits(c) — — — (2,734) (2,734)Actuarial losses(c) — — — 41,292 41,292
Total before tax — — (13,863) 38,558 24,695Income tax expense (benefit) — — 5,135 (14,282) (9,147)Net reclassifications — — (8,728) 24,276 15,548Other comprehensive (loss) income (36,808) (424) 20,722 (165,757) (182,267)Balance, end of period $ (3,482) $ (700) $ 19,042 $ (529,803) $ (514,943)
(a) Amounts reclassified to net income are included in Motorcycles and Related Products cost of goods sold. (b) Amounts reclassified to net income are presented in interest expense.(c) Amounts reclassified are included in the computation of net periodic cost. See Note 13 for information related to pension
and postretirement benefit plans.
10. Debt
Debt with a contractual term less than one year is generally classified as short-term debt and consisted of the following asof December 31 (in thousands):
2016 2015
Unsecured commercial paper $ 1,055,708 $ 1,201,380Total short-term debt $ 1,055,708 $ 1,201,380
76

Debt with a contractual term greater than one year is generally classified as long-term debt and consisted of the followingas of December 31 (in thousands):
2016 2015
Secured debt (Note 11)Asset-backed Canadian commercial paper conduit facility $ 149,338 $ 153,839Asset-backed securitization debt 797,755 1,463,154Less: unamortized discount and debt issuance costs (1,480) (3,777)
Total secured debt 945,613 1,613,216
Unsecured notes3.88% Medium-term notes due in 2016 par value, issued March 2011 — 450,0002.70% Medium-term notes due in 2017 par value, issued January 2012 400,000 400,0001.55% Medium-term notes due in 2017 par value, issued November 2014 400,000 400,0006.80% Medium-term notes due in 2018 par value, issued May 2008 877,488 878,7082.40% Medium-term notes due in 2019 par value, issued September 2014 600,000 600,0002.25% Medium-term notes due in 2019 par value, issued January 2016 600,000 —2.15% Medium-term notes due in 2020 par value, issued February 2015 600,000 600,0002.85% Medium-term notes due in 2021 par value, issued January 2016 600,000 —3.50% Senior unsecured notes due in 2025 par value, issued July 2015 450,000 450,0004.625% Senior unsecured notes due in 2045 par value, issued July 2015 300,000 300,000Less: unamortized discount and debt issuance costs (21,242) (21,106)
Gross long-term debt 5,751,859 5,670,818Less: current portion of long-term debt, net of unamortized discount and issuancecosts (1,084,884) (838,349)Total long-term debt $ 4,666,975 $ 4,832,469
A summary of the Company’s expected principal payments for debt obligations as of December 31, 2016 is as follows (inthousands):
2017 2018 2019 2020 2021 Thereafter Total
Principal payments on debt $2,145,781 $1,192,458 $1,483,236 $ 658,814 $ 600,000 $ 750,000 $6,830,289
Commercial paper maturities may range up to 365 days from the issuance date. The weighted-average interest rate ofoutstanding commercial paper balances was 0.93% and 0.56% at December 31, 2016 and 2015, respectively.
In April 2016, the Company entered into a new $765.0 million five-year credit facility to refinance and replace a $675.0million five-year credit facility that was due to mature in April 2017. The new five-year credit facility matures in April 2021.The Company also has a $675.0 million five-year credit facility which matures in April 2019. The new five-year credit facilityand the existing five-year credit facility (together, the Global Credit Facilities) bear interest at variable interest rates, which maybe adjusted upward or downward depending on certain criteria, such as credit ratings. The Global Credit Facilities also requirethe Company to pay a fee based on the average daily unused portion of the aggregate commitments under the Global CreditFacilities. The Global Credit Facilities are committed facilities and primarily used to support the Company's unsecuredcommercial paper program. During July 2015, the Company borrowed C$20 million under the Global Credit Facilities, and theCompany repaid the borrowings in August 2015. No borrowings were outstanding at December 31, 2016 and 2015.
In May 2016, the Company entered into an additional $25.0 million credit facility which expires May 24, 2017. The $25.0million credit facility bears interest at variable interest rates, and the Company must pay a fee based on the unused portion ofthe $25.0 million commitment. No borrowings were outstanding as of December 31, 2016.
All of the Company's medium-term notes (collectively, the Notes) provide for semi-annual interest payments andprincipal due at maturity. At December 31, 2016 and 2015, unamortized discounts and debt issuance costs on the Notes reducedthe balance by $12.5 million and $11.8 million, respectively.
During 2016, 2015 and 2014, the Company repurchased an aggregate of $1.2 million, $9.3 million, and $22.6 million,respectively, of its 6.80% medium-term notes which mature in June 2018. As a result, the Company recognized in financial
77

services interest expense $0.1 million, $1.1 million, and $3.9 million of loss on extinguishment of debt, respectively, whichincluded unamortized discounts and fees. During March 2016, $450.0 million of 3.88% medium-term notes matured, and theprincipal and accrued interest were paid in full. During September 2015, $600.0 million of 1.15% medium-term notes matured,and the principal and accrued interest were paid in full.
The Company's senior unsecured notes provide for semi-annual interest payments and principal due at maturity. TheCompany used the proceeds from the issuance to repurchase shares of its common stock in 2015. Unamortized discounts anddebt issuance costs on the senior unsecured notes at December 31, 2016 and 2015 reduced the balance by $8.7 million and $9.3million, respectively.
HDFS and the Company are subject to various operating and financial covenants related to the credit facilities andvarious operating covenants under the Notes and the U.S. and Canadian asset-backed commercial paper conduit facilities. Themore significant covenants are described below.
The operating covenants limit the Company’s and HDFS’ ability to:• assume or incur certain liens;• participate in certain mergers or consolidations; and• purchase or hold margin stock.
Under the current financial covenants of the Global Credit Facilities, the consolidated debt to equity ratio of HDFScannot exceed 10.00 to 1.00 as of the end of any fiscal quarter. In addition, the ratio of the Company's consolidated debt to theCompany's consolidated debt and equity, in each case excluding the debt of HDFS and its subsidiaries, cannot exceed 0.70 to1.00 as of the end of any fiscal quarter. No financial covenants are required under the Notes or the U.S. or Canadian asset-backed commercial paper conduit facilities.
At December 31, 2016 and 2015, HDFS and the Company remained in compliance with all of these covenants.
11. Asset-Backed Financing
The Company participates in asset-backed financing both through asset-backed securitization transactions and throughasset-backed commercial paper conduit facilities. See Note 1 for more information on the Company's accounting for asset-backed financings and VIEs.
78

The following table shows the assets and liabilities related to the on-balance sheet asset-backed financings included in thefinancial statements at December 31 (in thousands):
2016
Financereceivables
Allowancefor credit
lossesRestricted
cashOtherassets
Totalassets
Asset-backeddebt
On-balance sheet assets and liabilitiesConsolidated VIEs
Term asset-backed securitizations $ 893,804 $ (25,468) $ 57,057 $ 2,452 $ 927,845 $ 796,275Asset-backed U.S. commercial paper conduitfacility — — — 329 329 —
Unconsolidated VIEsAsset-backed Canadian commercial paperconduit facility 165,719 (3,573) 10,090 426 172,662 149,338
Total on-balance sheet assets and liabilities $1,059,523 $ (29,041) $ 67,147 $ 3,207 $1,100,836 $ 945,613
2015
Financereceivables
Allowancefor credit
lossesRestricted
cashOtherassets
Totalassets
Asset-backeddebt
On-balance sheet assets and liabilitiesConsolidated VIEs
Term asset-backed securitizations $1,611,624 $ (37,937) $ 100,151 $ 4,383 $1,678,221 $ 1,459,377Asset-backed U.S. commercial paper conduitfacility — — — 323 323 —
Unconsolidated VIEsAsset-backed Canadian commercial paperconduit facility 170,708 (3,061) 10,491 393 178,531 153,839
Total on-balance sheet assets and liabilities $1,782,332 $ (40,998) $ 110,642 $ 5,099 $1,857,075 $ 1,613,216
On-Balance Sheet Asset-Backed Securitization VIEs
The Company transfers U.S. retail motorcycle finance receivables to SPEs which in turn issue secured notes to investors,with various maturities and interest rates, secured by future collections of the purchased U.S. retail motorcycle financereceivables. Each on-balance sheet asset-backed securitization SPE is a separate legal entity and the U.S. retail motorcyclefinance receivables included in the asset-backed securitizations are only available for payment of the secured debt and otherobligations arising from the asset-backed securitization transactions and are not available to pay other obligations or claims ofthe Company’s creditors until the associated secured debt and other obligations are satisfied. Restricted cash balances held bythe SPEs are used only to support the securitizations. There are no amortization schedules for the secured notes; however, thedebt is reduced monthly as available collections on the related U.S. retail motorcycle finance receivables are applied tooutstanding principal. The secured notes’ contractual lives have various maturities ranging from 2019 to 2022.
The Company is the primary beneficiary of its on-balance sheet asset-backed securitization VIEs because it retainsservicing rights and a residual interest in the VIEs in the form of a debt security. As the servicer, the Company is the variableinterest holder with the power to direct the activities of the VIE that most significantly impact the VIE’s economicperformance. As a residual interest holder, the Company has the obligation to absorb losses and the right to receive benefitswhich could potentially be significant to the VIE.
There were no on-balance sheet asset-backed securitization transactions during 2016. In 2015, the Company transferred$1.3 billion of U.S. retail motorcycle finance receivables to SPEs. The SPEs in turn issued $700.0 million and $500.0 million($697.6 million and $498.1 million net of discount and issuance costs), respectively, of secured notes through on-balance sheetasset-backed securitization transactions. At December 31, 2016, the Company's consolidated balance sheet includedoutstanding balances related to the following secured notes with the related maturity dates and interest rates (in thousands):
79

Issue Date
PrincipalAmount at Date of
Issuance
Weighted-AverageRate at Date of
Issuance Contractual Maturity Date
May 2015 $500,000 0.88% May 2016 - December 2022January 2015 $700,000 0.89% February 2016 - August 2022April 2014 $850,000 0.66% April 2015 - October 2021April 2013 $650,000 0.57% May 2014 - December 2020
In addition, outstanding balances related to the following secured notes were included in the Company's consolidatedbalance sheet at December 31, 2015 and the Company completed repayment of those balances during 2016 (in thousands):
Issue Date
PrincipalAmount at Date of
Issuance
Weighted-AverageRate at Date of
Issuance Contractual Maturity Date
July 2012 $675,306 0.59% August 2013 - June 2018
For the years ended December 31, 2016 and 2015, interest expense on the secured notes was $13.1 million and $17.2million, respectively, which is included in financial services interest expense. The weighted average interest rate of theoutstanding on-balance sheet asset-backed securitization transactions was 1.31% and 1.04% at December 31, 2016 and 2015,respectively.
On-Balance Sheet Asset-Backed U.S. Commercial Paper Conduit Facilities VIE
On December 14, 2016, the Company entered into a new revolving facility agreement with a third party bank-sponsoredasset-backed U.S. commercial paper conduit, which provides for a total commitment of up to $300.0 million. Also on that date,the Company renewed its existing $600.0 million revolving facility agreement, which had expired on December 14, 2016, withthe same third party bank-sponsored asset-backed U.S. commercial paper conduit. Availability under the revolving facilities(together, the U.S. Conduit Facilities) is based on, among other things, the amount of eligible U.S. retail motorcycle financereceivables held by the SPE as collateral.
Under the U.S. Conduit Facilities, the Company may transfer U.S. retail motorcycle finance receivables to an SPE, whichin turn may issue debt to the third party bank-sponsored asset-backed commercial paper conduit. The assets of the SPE arerestricted as collateral for the payment of the debt or other obligations arising in the transaction and are not available to payother obligations or claims of the Company’s creditors. The terms for this debt provide for interest on the outstanding principalbased on prevailing commercial paper rates or LIBOR to the extent the advance is not funded by a conduit lender through theissuance of commercial paper plus, in each case, a program fee based on outstanding principal. The U.S. Conduit Facilities alsoprovide for an unused commitment fee based on the unused portion of the total aggregate commitment of $900 million. Thereis no amortization schedule; however, the debt will be reduced monthly as available collections on the related financereceivables are applied to outstanding principal. Upon expiration of the U.S. Conduit Facilities, any outstanding principal willcontinue to be reduced monthly through available collections. Unless earlier terminated or extended by mutual agreement ofthe Company and the lenders, the U.S. Conduit Facilities have an expiration date of December 13, 2017.
The Company is the primary beneficiary of its U.S. Conduit Facilities VIE because it retains servicing rights and aresidual interest in the VIE in the form of a debt security. As the servicer, the Company is the variable interest holder with thepower to direct the activities of the VIE that most significantly impact the VIE’s economic performance. As a residual interestholder, the Company has the obligation to absorb losses and the right to receive benefits which could potentially be significantto the VIE.
The VIE had no borrowings outstanding under the U.S. Conduit Facilities at December 31, 2016 or 2015; therefore,assets that the U.S. Conduit Facilities hold are restricted as collateral for the payment of fees associated with the unused portionof the total aggregate commitment.
For the year ended December 31, 2016 and 2015, the interest expense was $1.3 million and $1.1 million, respectively,related to the unused portion of the total aggregate commitment. Interest expense on the U.S. Conduit Facilities is included infinancial services interest expense. There was no weighted average interest rate at December 31, 2016 or 2015 as the Companyhad no outstanding borrowings under the U.S. Conduit Facilities during 2016 or 2015.
On-Balance Sheet Asset-Backed Canadian Commercial Paper Conduit Facility
80

In June 2016, the Company amended its facility agreement (Canadian Conduit) with a Canadian bank-sponsored asset-backed commercial paper conduit. Under the agreement, the Canadian Conduit is contractually committed, at the Company'soption, to purchase eligible Canadian retail motorcycle finance receivables for proceeds up to C$240 million. The transferredassets are restricted as collateral for the payment of debt. The terms for this debt provide for interest on the outstandingprincipal based on prevailing market interest rates plus a specified margin. The Canadian Conduit also provides for a programfee and an unused commitment fee based on the unused portion of the total aggregate commitment of C$240 million. There isno amortization schedule; however, the debt is reduced monthly as available collections on the related finance receivables areapplied to outstanding principal. Upon expiration of the Canadian Conduit, any outstanding principal will continue to bereduced monthly through available collections. The contractual maturity of the debt is approximately 5 years. Unless earlierterminated or extended by mutual agreement of the Company and the lenders, the Canadian Conduit expires on June 30, 2017.
During 2016 and 2015, the Company transferred $71.1 million and $100.0 million, respectively, of Canadian retailmotorcycle finance receivables to the Canadian Conduit for proceeds of $62.4 million and $87.5 million, respectively.
For the years ended December 31, 2016 and 2015, the Company recorded interest expense of $2.7 million and $3.0million, respectively, on the secured notes. Interest expense on the Canadian Conduit is included in financial services interestexpense. The weighted average interest rate of the outstanding Canadian Conduit was 1.84% and 1.80% at December 31, 2016and 2015.
The Company is not the primary beneficiary of the Canadian bank-sponsored, multi-seller conduit VIE; therefore, theCompany doesn’t consolidate the VIE. However, the Company treats the conduit facility as a secured borrowing as it maintainseffective control over the assets transferred to the VIE and therefore doesn’t meet the requirements for sale accounting.
As the Company participates in and does not consolidate the Canadian bank-sponsored, multi-seller conduit VIE, themaximum exposure to loss associated with this VIE, which would only be incurred in the unlikely event that all the financereceivables and underlying collateral have no residual value, is $23.3 million at December 31, 2016. The maximum exposure isnot an indication of the Company's expected loss exposure.
Off-Balance Sheet Asset-Backed Securitization VIE
During the second quarter of 2016, the Company sold retail motorcycle finance receivables with a principal balance of$301.8 million into a securitization VIE that was not consolidated, recognized a gain of $9.3 million and received cashproceeds of $312.6 million. Similar to an on-balance sheet asset-backed securitization, the Company transferred U.S. retailmotorcycle finance receivables to an SPE which in turn issued secured notes to investors, with various maturities and interestrates, secured by future collections of the purchased U.S. retail motorcycle finance receivables. The off-balance sheet asset-backed securitization SPE is a separate legal entity, and the U.S. retail motorcycle finance receivables included in the termasset-backed securitization are only available for payment of the secured debt and other obligations arising from the asset-backed securitization transaction and are not available to pay other obligations or claims of the Company’s creditors. In an on-balance sheet asset-backed securitization, the Company retains a financial interest in the VIE in the form of a debt security. Aspart of this off-balance sheet securitization, the Company did not retain any financial interest in the VIE beyond servicing rightsand ordinary representations and warranties and related covenants.
The Company is not the primary beneficiary of the off-balance sheet asset-backed securitization VIE because it onlyretained servicing rights and does not have the obligation to absorb losses or the right to receive benefits from the VIE whichcould potentially be significant to the VIE. Accordingly, this transaction met the accounting sale requirements under ASC Topic860 and was recorded as a sale for accounting purposes. Upon the sale, the retail motorcycle finance receivables were removedfrom the Company’s balance sheet and a gain was recognized for the difference between the cash proceeds received, the assetsderecognized and the liabilities recognized as part of the transaction. The gain on sale was included in financial servicesrevenue in the Consolidated Statement of Income.
At December 31, 2016, the assets of this off-balance sheet asset-backed securitization VIE were $236.7 million andrepresented the current unpaid principal balance of the retail motorcycle finance receivables, which was the Company’smaximum exposure to loss in the off-balance sheet VIE at December 31, 2016. This is based on the unlikely event that all thereceivables have underwriting defects or other defects that trigger a violation of certain covenants and that the underlyingcollateral has no residual value. This maximum exposure is not an indication of expected losses.
Servicing Activities
The Company services all retail motorcycle finance receivables that it originates. When the Company transfers retailmotorcycle finance receivables to SPEs through asset-backed financings, the Company retains the right to service the financereceivables and receives servicing fees based on the securitized finance receivables balance and certain ancillary fees. In on-
81

balance sheet asset-backed financing, servicing fees are eliminated in consolidation and therefore are not recorded on aconsolidated basis. In off-balance sheet asset-backed financings, servicing fees and ancillary fees are recorded in FinancialServices revenue in the Consolidated Statement of Income. The fees the Company is paid for servicing represent adequatecompensation, and, consequently, the Company does not recognize a servicing asset or liability. The Company recognizedservicing fee income of $1.6 million during the year ended December 31, 2016.
The unpaid principal balance of serviced retail motorcycle finance receivables at December 31 was as follows (inthousands):
2016 2015
On-balance sheet retail motorcycle finance receivables $ 5,839,467 $ 5,843,352Off-balance sheet retail motorcycle finance receivables 236,706 —Total serviced retail motorcycle finance receivables $ 6,076,173 $ 5,843,352
The balance of serviced finance receivables 30 days or more delinquent at December 31 was as follows (in thousands):
Amount 30 days or more past due:
2016 2015
On-balance sheet retail motorcycle finance receivables $ 221,393 $ 195,468Off-balance sheet retail motorcycle finance receivables 1,858 —Total serviced retail motorcycle finance receivables $ 223,251 $ 195,468
Credit losses, net of recoveries for the serviced finance receivables for the years ended December 31 were as follows (inthousands):
2016 2015
On-balance sheet retail motorcycle finance receivables $ 107,161 $ 81,531Off-balance sheet retail motorcycle finance receivables 820 —Total serviced retail motorcycle finance receivables $ 107,981 $ 81,531
12. Income Taxes
Provision for income taxes for the years ended December 31 consists of the following (in thousands):
2016 2015 2014
Current:Federal $ 284,489 $ 363,803 $ 394,904State 28,406 37,811 30,997Foreign 19,017 12,826 20,429
331,912 414,440 446,330Deferred:
Federal (4,250) (15,474) (5,743)State 7,038 (2,264) (3,155)Foreign (2,953) 1,254 1,277
(165) (16,484) (7,621)Total $ 331,747 $ 397,956 $ 438,709
82
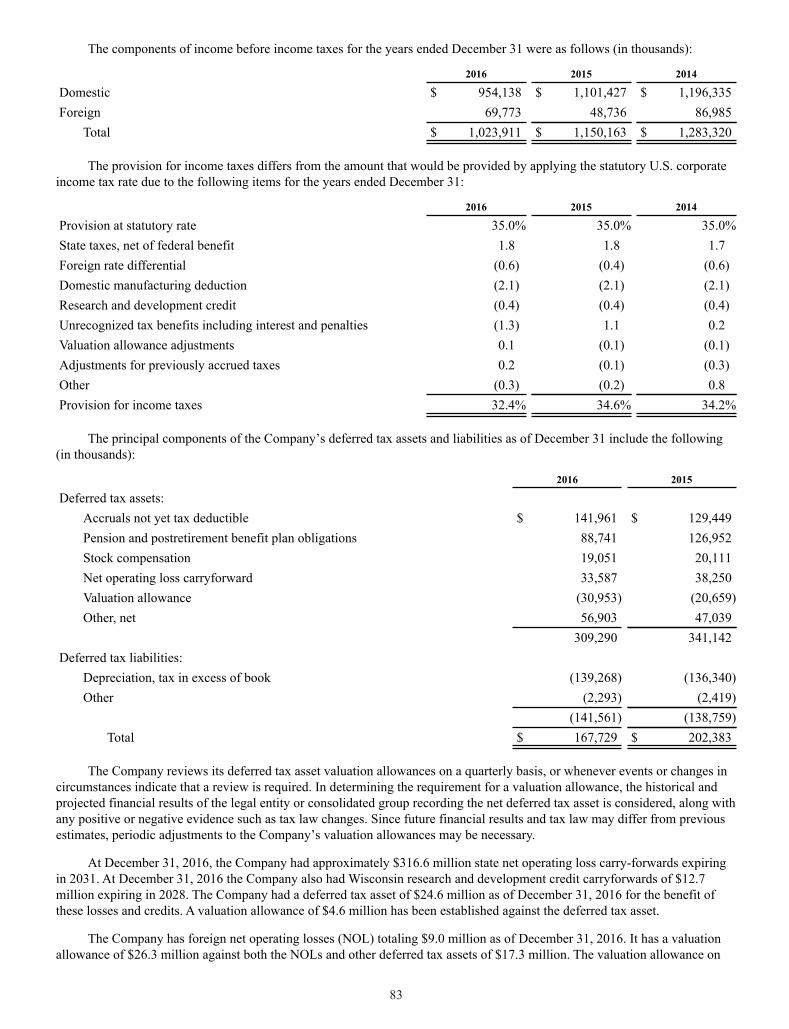
The components of income before income taxes for the years ended December 31 were as follows (in thousands):
2016 2015 2014
Domestic $ 954,138 $ 1,101,427 $ 1,196,335Foreign 69,773 48,736 86,985
Total $ 1,023,911 $ 1,150,163 $ 1,283,320
The provision for income taxes differs from the amount that would be provided by applying the statutory U.S. corporateincome tax rate due to the following items for the years ended December 31:
2016 2015 2014
Provision at statutory rate 35.0% 35.0% 35.0%State taxes, net of federal benefit 1.8 1.8 1.7Foreign rate differential (0.6) (0.4) (0.6)Domestic manufacturing deduction (2.1) (2.1) (2.1)Research and development credit (0.4) (0.4) (0.4)Unrecognized tax benefits including interest and penalties (1.3) 1.1 0.2Valuation allowance adjustments 0.1 (0.1) (0.1)Adjustments for previously accrued taxes 0.2 (0.1) (0.3)Other (0.3) (0.2) 0.8Provision for income taxes 32.4% 34.6% 34.2%
The principal components of the Company’s deferred tax assets and liabilities as of December 31 include the following(in thousands):
2016 2015
Deferred tax assets:Accruals not yet tax deductible $ 141,961 $ 129,449Pension and postretirement benefit plan obligations 88,741 126,952Stock compensation 19,051 20,111Net operating loss carryforward 33,587 38,250Valuation allowance (30,953) (20,659)Other, net 56,903 47,039
309,290 341,142Deferred tax liabilities:
Depreciation, tax in excess of book (139,268) (136,340)Other (2,293) (2,419)
(141,561) (138,759)Total $ 167,729 $ 202,383
The Company reviews its deferred tax asset valuation allowances on a quarterly basis, or whenever events or changes incircumstances indicate that a review is required. In determining the requirement for a valuation allowance, the historical andprojected financial results of the legal entity or consolidated group recording the net deferred tax asset is considered, along withany positive or negative evidence such as tax law changes. Since future financial results and tax law may differ from previousestimates, periodic adjustments to the Company’s valuation allowances may be necessary.
At December 31, 2016, the Company had approximately $316.6 million state net operating loss carry-forwards expiringin 2031. At December 31, 2016 the Company also had Wisconsin research and development credit carryforwards of $12.7million expiring in 2028. The Company had a deferred tax asset of $24.6 million as of December 31, 2016 for the benefit ofthese losses and credits. A valuation allowance of $4.6 million has been established against the deferred tax asset.
The Company has foreign net operating losses (NOL) totaling $9.0 million as of December 31, 2016. It has a valuationallowance of $26.3 million against both the NOLs and other deferred tax assets of $17.3 million. The valuation allowance on
83

foreign net operating losses increased by $5.7 million, reflecting movement related to realizability assessment on additionalearnings and loss, as well as movements related to foreign currency rates.
The Company recognizes interest and penalties related to unrecognized tax benefits in the provision for income taxes.Changes in the Company’s gross liability for unrecognized tax benefits, excluding interest and penalties, were as follows (inthousands):
2016 2015
Unrecognized tax benefits, beginning of period $ 73,100 $ 64,200Increase in unrecognized tax benefits for tax positions taken in a prior period 2,828 9,149Decrease in unrecognized tax benefits for tax positions taken in a prior period (21,061) (1,993)Increase in unrecognized tax benefits for tax positions taken in the current period 7,402 6,302Statute lapses (1,907) (2,465)Settlements with taxing authorities (4,823) (2,093)Unrecognized tax benefits, end of period $ 55,539 $ 73,100
The amount of unrecognized tax benefits as of December 31, 2016 that, if recognized, would affect the effective tax ratewas $39.9 million.
The total gross amount of expense related to interest and penalties associated with unrecognized tax benefits recognizedduring 2016 in the Company’s Consolidated Statements of Income was $0.5 million.
The total gross amount of interest and penalties associated with unrecognized tax benefits recognized at December 31,2016 in the Company’s Consolidated Balance Sheets was $28.1 million.
The Company does not expect a significant increase or decrease to the total amounts of unrecognized tax benefits relatedto continuing operations during the fiscal year ending December 31, 2017. However, the Company is under regular audit by taxauthorities. The Company believes that it has appropriate support for the positions taken on its tax returns and that its annualtax provision includes amounts sufficient to pay any assessments. Nonetheless, the amounts ultimately paid, if any, uponresolution of the issues raised by the taxing authorities may differ materially from the amounts accrued for each year.
The Company or one of its subsidiaries files income tax returns in the United States federal and Wisconsin statejurisdictions and various other state and foreign jurisdictions. The Company is no longer subject to income tax examinations forWisconsin state income taxes before 2012 or for United States federal income taxes before 2014.
13. Employee Benefit Plans and Other Postretirement Benefits
The Company has a qualified defined benefit pension plan and several postretirement healthcare benefit plans, whichcover employees of the Motorcycles segment. The Company also has unfunded supplemental employee retirement planagreements (SERPA) with certain employees which were instituted to replace benefits lost under the Tax RevenueReconciliation Act of 1993.
Pension benefits are based primarily on years of service and, for certain plans, levels of compensation. Employees areeligible to receive postretirement healthcare benefits upon attaining age 55 after rendering at least 10 years of service to theCompany. Some of the plans require employee contributions to partially offset benefit costs.
84

Obligations and Funded Status:
The following table provides the changes in the benefit obligations, fair value of plan assets and funded status of theCompany’s pension, SERPA and postretirement healthcare plans as of the Company’s December 31, 2016 and 2015measurement dates (in thousands):
Pension and SERPA BenefitsPostretirement
Healthcare Benefits2016 2015 2016 2015
Change in benefit obligation:Benefit obligation, beginning of period $ 2,009,000 $ 2,069,980 $ 354,739 $ 361,006Service cost 33,437 40,039 7,478 8,259Interest cost 90,827 87,345 14,814 14,166Actuarial losses (gains) 13,481 (128,082) (4,647) (6,757)Plan participant contributions — — 2,669 2,587Plan amendments — 6,407 — —Special early retirement benefits — 10,563 — 622Benefits paid, net of Medicare Part D subsidy (160,310) (77,252) (28,622) (25,144)Benefit obligation, end of period 1,986,435 2,009,000 346,431 354,739
Change in plan assets:Fair value of plan assets, beginning of period 1,841,967 1,992,646 156,765 156,840Actual return on plan assets 188,376 (77,980) 13,327 (75)Company contributions 25,000 — — —Plan participant contributions — — 2,669 2,587Benefits paid (155,454) (72,699) (2,669) (2,587)Fair value of plan assets, end of period 1,899,889 1,841,967 170,092 156,765
Funded status of the plans, December 31 $ (86,546) $ (167,033) $ (176,339) $ (197,974)Amounts recognized in the Consolidated BalanceSheets, December 31:Accrued benefit liability (current liabilities) $ (2,104) $ (2,145) $ (3,072) $ (4,315)Accrued benefit liability (long-term liabilities) (84,442) (164,888) (173,267) (193,659)Net amount recognized $ (86,546) $ (167,033) $ (176,339) $ (197,974)
Plan asset contributions and payments for 2015 have been adjusted to exclude benefits paid from general Companyassets.
Benefit Costs:
Components of net periodic benefit costs for the years ended December 31 (in thousands):
Pension andSERPA Benefits
PostretirementHealthcare Benefits
2016 2015 2014 2016 2015 2014
Service cost $ 33,437 $ 40,039 $ 31,498 $ 7,478 $ 8,259 $ 7,015Interest cost 90,827 87,345 86,923 14,814 14,166 16,878Special early retirement benefits — 10,563 — — 622 —Expected return on plan assets (145,781) (144,929) (136,734) (12,069) (11,506) (10,429)Amortization of unrecognized:
Prior service cost (credit) 1,019 435 1,119 (2,803) (3,217) (3,853)Net loss 46,351 54,709 36,563 3,537 3,971 4,729
Settlement loss 1,463 368 — — — —Net periodic benefit cost $ 27,316 $ 48,530 $ 19,369 $ 10,957 $ 12,295 $ 14,340
85

Net periodic benefit costs are allocated among selling, administrative and engineering expense, cost of goods sold andinventory.
The expected return on plan assets is calculated based on the market-related value of plan assets. The market-relatedvalue of plan assets is different from the fair value in that asset gains/losses are smoothed over a five year period.
Unrecognized gains and losses related to plan obligations and assets are initially recorded in other comprehensive incomeand result from actual experience that differs from assumed or expected results, and the impacts of changes in assumptions.Unrecognized plan asset gains and losses not yet reflected in the market-related value of plan assets are not subject toamortization. Remaining unrecognized gains and losses that exceed 10% of the greater of the projected benefit obligation or themarket-related value of plan assets are amortized to earnings over the estimated future service period of active planparticipants. The impacts of plan amendments, if any, are amortized over the estimated future service period of planparticipants at the time of the amendment.
Amounts included in accumulated other comprehensive income, net of tax, at December 31, 2016 which have not yetbeen recognized in net periodic benefit cost are as follows (in thousands):
Pension andSERPA Benefits
PostretirementHealthcare Benefits Total
Prior service cost (credit) $ 4,804 $ (7,279) $ (2,475)Net actuarial loss 464,804 46,250 511,054
Total $ 469,608 $ 38,971 $ 508,579
Amounts expected to be recognized in net periodic benefit cost, net of tax, during the year ended December 31, 2017 areas follows (in thousands):
Pension andSERPA Benefits
PostretirementHealthcare Benefits Total
Prior service cost (credit) $ 641 $ (1,367) $ (726)Net actuarial loss 27,699 2,053 29,752
Total $ 28,340 $ 686 $ 29,026
Assumptions:
Weighted-average assumptions used to determine benefit obligations and net periodic benefit cost at December 31 wereas follows:
Pension andSERPA Benefits
PostretirementHealthcare Benefits
2016 2015 2014 2016 2015 2014
Assumptions for benefit obligations:Discount rate 4.30% 4.53% 4.21% 4.03% 4.29% 3.99%Rate of compensation 3.50% 3.50% 4.00% n/a n/a n/a
Assumptions for net periodic benefitcost:
Discount rate 4.53% 4.21% 5.08% 4.29% 3.99% 4.70%Expected return on plan assets 7.50% 7.75% 7.75% 7.50% 7.70% 7.70%
Rate of compensation increase 3.50% 4.00% 4.00% n/a n/a n/a
Pension and SERPA Accumulated Benefit Obligation:
The Company’s pension and SERPA plans have a separately determined accumulated benefit obligation (ABO) and planasset value. The ABO is the actuarial present value of benefits based on service rendered and current and past compensationlevels. This differs from the projected benefit obligation (PBO) in that it includes no assumption about future compensationlevels. The total ABO for all the Company’s pension and SERPA plans combined was $1.90 billion and $1.92 billion as ofDecember 31, 2016 and 2015, respectively.
86

The following table summarizes information related to the Company's qualified pension plan which had a PBO in excessof the fair value of plan assets at December 31 (in millions):
2016 2015
Pension plan with PBOs in excess of fair value of plan assets:PBO $ 1,934.1 $ 1,964.0Fair value of plan assets $ 1,899.9 $ 1,842.0
The fair value of the qualified pension plan assets was greater than the plan's ABO at December 31, 2016 and 2015.
The Company’s SERPA plans, which can only be funded as claims are paid, had projected and accumulated benefitobligations of $52.3 million and $38.4 million, respectively, as of December 31, 2016 and $45.0 million and $35.8 million,respectively, as of December 31, 2015.
Plan Assets:
Pension Plan Assets - The Company’s investment objective is to ensure assets are sufficient to pay benefits whilemitigating the volatility of retirement plan assets or liabilities recorded in the balance sheet. The Company mitigates volatilitythrough asset diversification and partial asset/liability matching. The investment portfolio for the Company's pension planassets contains a diversified blend of equity and fixed-income investments. The Company’s current overall targeted assetallocation as a percentage of total market value was approximately 63% equities and 37% fixed-income and cash. Assets arerebalanced regularly to keep the actual allocation in line with targets. Equity holdings primarily include investments in small-,medium- and large-cap companies in the U.S. (including Company stock), investments in developed and emerging foreignmarkets and other investments such as private equity and real estate. Fixed-income holdings consist of U.S. government andagency securities, state and municipal bonds, corporate bonds from diversified industries and foreign obligations. In addition,cash equivalent balances are maintained at levels adequate to meet near-term plan expenses and benefit payments. Investmentrisk is measured and monitored on an ongoing basis through quarterly investment portfolio reviews.
Postretirement Healthcare Plan Assets - The Company's investment objective is to maximize the return on assets to helppay the benefits by prudently investing in equities, fixed income and alternative assets. The Company's current overall targetedasset allocation as a percentage of total market value was approximately 69% equities and 31% fixed-income and cash. Equityholdings primarily include investments in small-, medium-, and large-cap companies in the U.S., investments in developed andemerging foreign markets and other investments such as private equity and real estate. Fixed-income holdings consist of U.S.government and agency securities, state and municipal bonds, corporate bonds from diversified industries and foreignobligations. In addition, cash equivalent balances are maintained at levels adequate to meet near-term plan expenses and benefitpayments. Investment risk is measured and monitored on an ongoing basis through quarterly investment portfolio reviews.
87
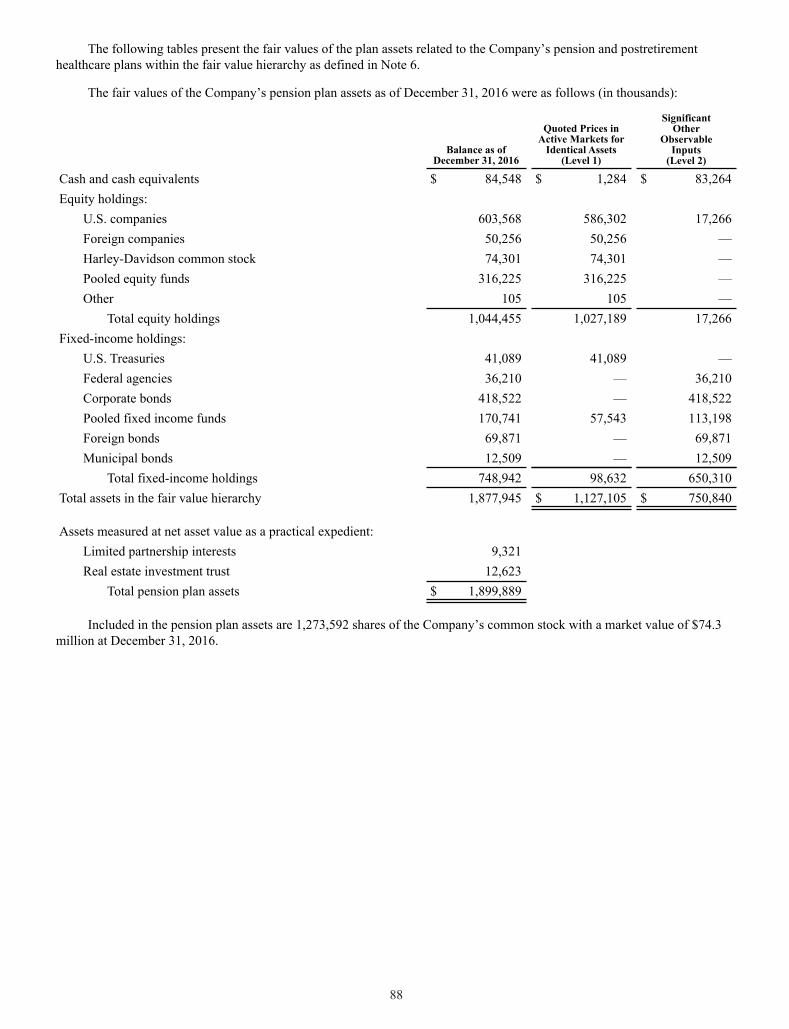
The following tables present the fair values of the plan assets related to the Company’s pension and postretirementhealthcare plans within the fair value hierarchy as defined in Note 6.
The fair values of the Company’s pension plan assets as of December 31, 2016 were as follows (in thousands):
Balance as ofDecember 31, 2016
Quoted Prices inActive Markets for
Identical Assets(Level 1)
SignificantOther
ObservableInputs
(Level 2)
Cash and cash equivalents $ 84,548 $ 1,284 $ 83,264Equity holdings:
U.S. companies 603,568 586,302 17,266Foreign companies 50,256 50,256 —Harley-Davidson common stock 74,301 74,301 —Pooled equity funds 316,225 316,225 —Other 105 105 —
Total equity holdings 1,044,455 1,027,189 17,266Fixed-income holdings:
U.S. Treasuries 41,089 41,089 —Federal agencies 36,210 — 36,210Corporate bonds 418,522 — 418,522Pooled fixed income funds 170,741 57,543 113,198Foreign bonds 69,871 — 69,871Municipal bonds 12,509 — 12,509
Total fixed-income holdings 748,942 98,632 650,310Total assets in the fair value hierarchy 1,877,945 $ 1,127,105 $ 750,840
Assets measured at net asset value as a practical expedient:Limited partnership interests 9,321Real estate investment trust 12,623
Total pension plan assets $ 1,899,889
Included in the pension plan assets are 1,273,592 shares of the Company’s common stock with a market value of $74.3million at December 31, 2016.
88

The fair values of the Company’s postretirement healthcare plan assets as of December 31, 2016 were as follows (inthousands):
Balance as ofDecember 31, 2016
Quoted Prices inActive Markets for
Identical Assets(Level 1)
SignificantOther
ObservableInputs
(Level 2)
Cash and cash equivalents $ 4,442 $ 1,180 $ 3,262Equity holdings:
U.S. companies 84,643 84,643 —Foreign companies 14,190 13,995 195Pooled equity funds 19,132 19,132 —Other 9 9 —
Total equity holdings 117,974 117,779 195Fixed-income holdings:
U.S. Treasuries 12,262 12,262 —Federal agencies 7,364 — 7,364Corporate bonds 11,750 — 11,750Pooled fixed income funds 9,690 — 9,690Foreign bonds 633 — 633Municipal bonds 459 — 459
Total fixed-income holdings 42,158 12,262 29,896Total assets in the fair value hierarchy 164,574 $ 131,221 $ 33,353
Assets measured at net asset value as a practical expedient:Real estate investment trust 5,518
Total postretirement healthcare plan assets $ 170,092
89

The fair values of the Company’s pension plan assets as of December 31, 2015 were as follows (in thousands):
Balance as ofDecember 31, 2015
Quoted Prices inActive Markets for
Identical Assets(Level 1)
SignificantOther
ObservableInputs
(Level 2)
Cash and cash equivalents $ 33,539 $ 1,485 $ 32,054Equity holdings:
U.S. companies 574,826 571,949 2,877Foreign companies 113,803 113,803 —Harley-Davidson common stock 57,808 57,808 —Pooled equity funds 301,824 301,824 —Other 109 109 —
Total equity holdings 1,048,370 1,045,493 2,877Fixed-income holdings:
U.S. Treasuries 42,827 42,827 —Federal agencies 43,695 — 43,695Corporate bonds 388,439 — 388,439Pooled fixed income funds 184,142 49,271 134,871Foreign bonds 64,533 — 64,533Municipal bonds 13,090 — 13,090
Total fixed-income holdings 736,726 92,098 644,628Total assets in the fair value hierarchy 1,818,635 $ 1,139,076 $ 679,559
Assets measured at net asset value as a practical expedient:Limited partnership interests 10,530Real estate investment trust 12,802
Total pension plan assets $ 1,841,967
Included in the pension plan assets are 1,273,592 shares of the Company’s common stock with a market value of $57.8million at December 31, 2015.
90
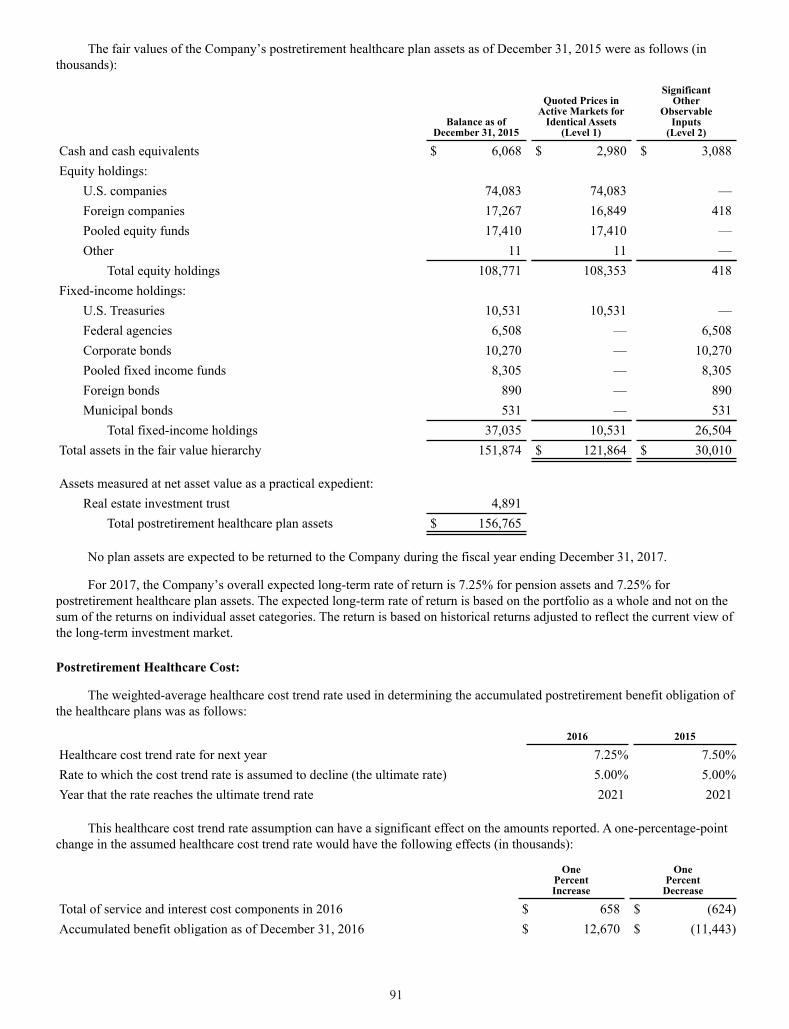
The fair values of the Company’s postretirement healthcare plan assets as of December 31, 2015 were as follows (inthousands):
Balance as ofDecember 31, 2015
Quoted Prices inActive Markets for
Identical Assets(Level 1)
SignificantOther
ObservableInputs
(Level 2)
Cash and cash equivalents $ 6,068 $ 2,980 $ 3,088Equity holdings:
U.S. companies 74,083 74,083 —Foreign companies 17,267 16,849 418Pooled equity funds 17,410 17,410 —Other 11 11 —
Total equity holdings 108,771 108,353 418Fixed-income holdings:
U.S. Treasuries 10,531 10,531 —Federal agencies 6,508 — 6,508Corporate bonds 10,270 — 10,270Pooled fixed income funds 8,305 — 8,305Foreign bonds 890 — 890Municipal bonds 531 — 531
Total fixed-income holdings 37,035 10,531 26,504Total assets in the fair value hierarchy 151,874 $ 121,864 $ 30,010
Assets measured at net asset value as a practical expedient:Real estate investment trust 4,891
Total postretirement healthcare plan assets $ 156,765
No plan assets are expected to be returned to the Company during the fiscal year ending December 31, 2017.
For 2017, the Company’s overall expected long-term rate of return is 7.25% for pension assets and 7.25% forpostretirement healthcare plan assets. The expected long-term rate of return is based on the portfolio as a whole and not on thesum of the returns on individual asset categories. The return is based on historical returns adjusted to reflect the current view ofthe long-term investment market.
Postretirement Healthcare Cost:
The weighted-average healthcare cost trend rate used in determining the accumulated postretirement benefit obligation ofthe healthcare plans was as follows:
2016 2015
Healthcare cost trend rate for next year 7.25% 7.50%Rate to which the cost trend rate is assumed to decline (the ultimate rate) 5.00% 5.00%Year that the rate reaches the ultimate trend rate 2021 2021
This healthcare cost trend rate assumption can have a significant effect on the amounts reported. A one-percentage-pointchange in the assumed healthcare cost trend rate would have the following effects (in thousands):
OnePercentIncrease
OnePercent
Decrease
Total of service and interest cost components in 2016 $ 658 $ (624)Accumulated benefit obligation as of December 31, 2016 $ 12,670 $ (11,443)
91

Future Contributions and Benefit Payments:
In January 2017, the Company voluntarily contributed $25.0 million to further fund its qualified pension plan. Nopension plan contributions are required in 2017. The Company expects it will continue to make on-going payments related tocurrent benefits for SERPA and postretirement healthcare plans in 2017.
The expected benefit payments for the next five years and thereafter were as follows (in thousands):
PensionBenefits
SERPABenefits
PostretirementHealthcare
Benefits
2017 $ 79,907 $ 2,104 $ 30,1302018 $ 81,133 $ 2,240 $ 29,5012019 $ 82,979 $ 2,693 $ 28,5292020 $ 85,528 $ 3,169 $ 27,3702021 $ 88,174 $ 3,513 $ 26,0942022-2026 $ 499,403 $ 25,830 $ 124,713
Defined Contribution Plans:
The Company has various defined contribution benefit plans that in total cover substantially all full-time employees.Employees can make voluntary contributions in accordance with the provisions of their respective plan, which includes a401(k) tax deferral option. The Company expensed $18.2 million, $18.0 million and $18.1 million for Company contributionsduring 2016, 2015 and 2014, respectively.
14. Leases
The Company operates certain administrative, manufacturing, warehouse and testing facilities and equipment under leasearrangements that are accounted for as operating leases. Total rental expense was $14.4 million, $15.0 million and $12.0million for 2016, 2015 and 2014, respectively.
Future minimum operating lease payments at December 31, 2016 were as follows (in thousands):
2017 $ 13,9002018 12,8052019 11,7932020 7,7942021 6,357Thereafter 11,965Total operating lease payments $ 64,614
15. Commitments and Contingencies
The Company is subject to lawsuits and other claims related to environmental, product and other matters. In determiningrequired reserves related to these items, the Company carefully analyzes cases and considers the likelihood of adversejudgments or outcomes, as well as the potential range of possible loss. The required reserves are monitored on an ongoing basisand are updated based on new developments or new information in each matter.
92
Environmental Protection Agency Notice:
In December 2009, the Company received formal, written requests for information from the United States EnvironmentalProtection Agency (EPA) regarding: (i) certificates of conformity for motorcycle emissions and related designations and labels,(ii) aftermarket parts, and (iii) warranty claims on emissions related components. The Company promptly submitted writtenresponses to the EPA’s inquiry and has engaged in discussions with the EPA. Since that time, the EPA delivered variousadditional requests for information to which the Company responded. More recently, in August 2016, the Company entered intoa consent decree with the EPA regarding these issues (the Settlement). In the Settlement the Company agreed to, among otherthings, pay a fine, fund a three-year emissions mitigation project, and not sell tuning products unless they are approved by theEPA or California Air Resources Board. The Company anticipates the EPA will move the court to finalize the Settlement in thecoming months. The Company has a reserve associated with this matter which is included in accrued liabilities in theConsolidated Balance Sheet, and as a result, if it is finalized, the Settlement would not have a material adverse effect on theCompany's financial condition or results of operations. The Settlement is not final until it is approved by the court, and if it isnot approved by the court, the Company cannot reasonably estimate the impact of any remedies the EPA might seek beyond theCompany's current reserve for this matter.
York Environmental Matters:
The Company is involved with government agencies and groups of potentially responsible parties related to a matterinvolving the cleanup of soil and groundwater contamination at its York, Pennsylvania facility. The York facility was formerlyused by the U.S. Navy and AMF prior to the purchase of the York facility by the Company from AMF in 1981. Although theCompany is not certain as to the full extent of the environmental contamination at the York facility, it has been working withthe Pennsylvania Department of Environmental Protection (PADEP) since 1986 in undertaking environmental investigation andremediation activities, including a site-wide remedial investigation/feasibility study (RI/FS).
In January 1995, the Company entered into a settlement agreement (the Agreement) with the Navy, and the partiesamended the Agreement in 2013 to address ordnance and explosive waste. The Agreement calls for the Navy and the Companyto contribute amounts into a trust equal to 53% and 47%, respectively, of costs associated with environmental investigation andremediation activities at the York facility (Response Costs). The trust administers the payment of the Response Costs incurredat the York facility as covered by the Agreement.
The Company has a reserve for its estimate of its share of the future Response Costs at the York facility which is includedin accrued liabilities in the Consolidated Balance Sheets. While much of the work on the RI/FS is complete, it is still underagency review and given the uncertainty that exists concerning the nature and scope of additional environmental investigationand remediation that may ultimately be required under the RI/FS that is finally approved or otherwise at the York facility, theCompany is unable to make a reasonable estimate of those additional costs, if any, that may result.
The estimate of the Company's future Response Costs that will be incurred at the York facility is based on reports ofindependent environmental consultants retained by the Company, the actual costs incurred to date and the estimated costs tocomplete the necessary investigation and remediation activities.
Product Liability Matters:
The Company is involved in product liability suits related to the operation of its business. The Company accrues for claimexposures that are probable of occurrence and can be reasonably estimated. The Company also maintains insurance coveragefor product liability exposures. The Company believes that its accruals and insurance coverage are adequate and that productliability suits will not have a material adverse effect on the Company’s consolidated financial statements.
National Highway Traffic Safety Administration Matters:
In July 2016, the National Highway Traffic Safety Administration (NHTSA) began an investigation into certain of theCompany's model-year 2008-2011 motorcycles equipped with anti-lock braking systems (ABS). NHTSA’s investigation is inresponse to rider complaints related to brake failures. NHTSA noted that Harley-Davidson has a two-year brake fluidreplacement interval that owners either are unaware of or ignore. The Company does not believe that a loss related to thismatter is probable and no reserve has been established. However, it is possible that the outcome of NHTSA’s investigationcould result in future costs to the Company. Given the uncertainty that still exists concerning the resolution of this matter, theCompany cannot reasonably estimate these possible future costs, if any.
93

16. Capital Stock
Common Stock:
The Company is authorized to issue 800,000,000 shares of common stock of $0.01 par value. There were 175.9 millionand 184.7 million common shares outstanding as of December 31, 2016 and 2015, respectively. During 2016, the Companyretired 165.0 million shares of its treasury stock.
During 2016, the Company repurchased 9.9 million shares of its common stock at a weighted-average price of $47. Thisincludes 0.1 million shares of common stock that were repurchased from employees that surrendered stock to satisfywithholding taxes in connection with the vesting of restricted stock awards. The remaining repurchases were made pursuant tothe following authorizations (in millions of shares):
Shares Repurchased Authorization Remainingat December 31, 2016Board of Directors’ Authorization 2016 2015 2014
1997 Authorization — 0.9 3.2 —2007 Authorization — 0.9 5.8 —2014 Authorization — 20.0 — —2015 Authorization 9.0 6.0 — —2016 Authorization 0.7 — — 19.3
Total 9.7 27.8 9.0 19.3
1997 Authorization – The Company had an authorization from its Board of Directors (originally adopted December 1997)to repurchase shares of its outstanding common stock under which the cumulative number of shares repurchased, at the time ofany repurchase, shall not exceed the sum of (1) the number of shares issued in connection with the exercise of stock optionsoccurring on or after January 1, 2004, and (2) 1% of the issued and outstanding common stock of the Company on January 1 ofthe current year, adjusted for any stock split.
2007 Authorization – In December 2007, the Company’s Board of Directors separately authorized the Company to buyback up to 20.0 million shares of its common stock with no dollar limit or expiration date.
2014 Authorization – In February 2014, the Company’s Board of Directors separately authorized the Company to buyback up to 20.0 million shares of its common stock with no dollar limit or expiration date.
2015 Authorization – In June 2015, the Company’s Board of Directors separately authorized the Company to buy back upto 15.0 million shares of its common stock with no dollar limit or expiration date.
2016 Authorization – In February 2016, the Company’s Board of Directors separately authorized the Company to buyback up to 20.0 million shares of its common stock with no dollar limit or expiration date.
Preferred Stock:
The Company is authorized to issue 2,000,000 shares of preferred stock of $1.00 par value, none of which is outstanding.
17. Share-Based Awards
The Company has a share-based compensation plan which was approved by its Shareholders in April 2014 (Plan) underwhich the Board of Directors may grant to employees share-based awards including nonqualified stock options, stockappreciation rights (SARs), shares of restricted stock, restricted stock units (RSUs) and performance restricted stock units(PRSUs). PRSUs include a three-year performance period with vesting based 42.5% on achievement of net income targets,42.5% on achievement of return on invested capital targets and 15.0% on achievement of new rider targets. Shares of restrictedstock and RSUs granted under the Plan vest ratably over a three-year period with the first one-third of the grant vesting oneyear after the date of grant. Dividends are paid on shares of restricted stock, RSUs settled with stock and PRSUs settled withstock. Dividend equivalents are paid on RSUs and PRSUs settled with cash. The options and SARs granted under the Plan havean exercise price equal to the fair market value of the underlying stock at the date of grant and vest ratably over a three-yearperiod with the first one-third of the grant becoming exercisable one year after the date of grant. The options and SARs expire10 years from the date of grant. At December 31, 2016, there were 11.7 million shares of common stock available for futureawards under the Plan.
94

Restricted Stock and Performance Restricted Stock Awards Settled in Stock:
Beginning in 2016, the Company granted certain eligible U.S. employees PRSUs that settle in Company stock. Beginningin 2014, the Company granted certain eligible U.S. employees RSUs that settle in Company stock. Prior to 2014, the Companygranted restricted, nonvested stock. The fair value of RSUs and PRSUs settled in stock and restricted stock is determined basedon the market price of the Company’s shares on the grant date. There were no outstanding restricted stock awards at December31, 2016. The following table summarizes the RSUs and PRSUs settled in stock and restricted stock transactions for the yearended December 31, 2016 (in thousands except for per share amounts):
Shares / Units
Grant DateFair ValuePer Share
Nonvested, beginning of period 850 $ 59Granted 1,054 $ 41Vested (389) $ 59Forfeited (144) $ 49Nonvested, end of period 1,371 $ 46
As of December 31, 2016, there was $23.7 million of unrecognized compensation cost related to RSUs and PRSUssettled in stock that is expected to be recognized over a weighted-average period of 1.9 years.
Restricted Stock Awards Settled in Cash:
Restricted stock units (RSUIs) and performance restricted stock units (PRSUIs) granted to certain eligible internationalemployees vest under the same terms and conditions as RSUs and PRSUs settled in stock and restricted stock; however, theyare settled in cash equal to their settlement date fair value. As a result, RSUIs and PRSUIs are recorded in the Company’sconsolidated balance sheets as a liability until the date of vesting.
The fair value of RSUIs and PRSUIs is determined based on the market price of the Company’s shares on the grant date.The following table summarizes the RSUI and PRSUI transactions for the year ended December 31, 2016 (in thousands exceptfor per share amounts):
Units
Weighted-AverageGrant DateFair ValuePer Share
Nonvested, beginning of period 109 $ 52Granted 94 $ 58Vested (55) $ 52Forfeited (24) $ 56Nonvested, end of period 124 $ 56
Stock Options:
There were no stock options granted in 2016. In 2015 and 2014, the Company estimated the grant date fair value of itsoption awards granted using a lattice-based option valuation model. The Company believes that the lattice-based optionvaluation model provides a more precise estimate of fair value than the Black-Scholes option pricing model. Lattice-basedoption valuation models utilize ranges of assumptions over the expected term of the options. The Company used impliedvolatility to determine the expected volatility of its stock. The Company used historical data to estimate option exercise andemployee termination within the valuation model. The expected term of options granted was derived from the output of theoption valuation model and represents the average period of time that options granted are expected to be outstanding. The risk-free rate for periods within the contractual life of the option is based on the U.S. Treasury yield curve in effect at the time ofgrant.
95

There were no stock options granted in 2016. Assumptions used in calculating the lattice-based fair value of optionsgranted during 2015 and 2014 were as follows:
2015 2014
Expected average term (in years) 6.0 6.1Expected volatility 24% - 30% 25% - 34%Weighted average volatility 28% 32%Expected dividend yield 2.0% 1.8%Risk-free interest rate 0.1% - 2.0% 0.1% - 2.8%
The following table summarizes the stock option transactions for the year ended December 31, 2016 (in thousands exceptfor per share amounts):
OptionsWeighted-
Average Price
Options outstanding, beginning of period 2,503 $ 47Options exercised (468) $ 34Options forfeited (157) $ 58Options outstanding, end of period 1,878 $ 49Exercisable, end of period 1,599 $ 46
The weighted-average fair value of options granted during the years ended December 31, 2015 and 2014 was $13 and$14, respectively.
As of December 31, 2016, there was $1.0 million of unrecognized compensation cost related to stock options that isexpected to be recognized over a weighted-average period of 1.0 year.
The following table summarizes the aggregate intrinsic value related to options outstanding, exercisable and exercised asof and for the years ended December 31 (in thousands):
2016 2015 2014
Exercised $ 9,595 $ 9,890 $ 31,623Outstanding $ 22,383 $ 16,605 $ 61,947Exercisable $ 22,383 $ 16,605 $ 54,071
The Company’s policy is to issue new shares of common stock upon the exercise of employee stock options.
Stock options outstanding at December 31, 2016 were as follows (options in thousands):
Price RangeWeighted-AverageContractual Life Options
Weighted-AverageExercise Price
$10.01 to $20 2.2 199 $ 14$20.01 to $30 3.1 155 $ 24$30.01 to $40 1.1 112 $ 39$40.01 to $50 4.5 272 $ 44$50.01 to $60 4.2 313 $ 52$60.01 to $70 5.1 827 $ 64Options outstanding 4.2 1,878 $ 49Options exercisable 3.5 1,599 $ 46
Stock Appreciation Rights (SARs):
SARs vest under the same terms and conditions as options; however, they are settled in cash equal to their settlement datefair value. As a result, SARs are recorded in the Company’s consolidated balance sheets as a liability until the date of exercise.
96

The fair value of each SAR award is estimated using a lattice-based valuation model. In accordance with ASC Topic 718,“Stock Compensation,” the fair value of each SAR award is recalculated at the end of each reporting period and the liabilityand expense adjusted based on the new fair value and the percent vested.
No SARs were granted in 2016. The assumptions used to determine the fair value of the SAR awards at December 31,2016 and 2015 were as follows:
2016 2015
Expected average term (in years) 5.2 - 5.7 5.3 - 7.4Expected volatility 28% - 31% 28% - 30%Expected dividend yield 2.4% 2.7%Risk-free interest rate 0.5% - 2.6% 0.2% - 2.3%
The following table summarizes the SAR transactions for the year ended December 31, 2016 (in thousands except for pershare amounts):
SARsWeighted-Average
Price
Outstanding, beginning of period 162 $ 33Exercised (84) $ 29Forfeited (3) $ 63Outstanding, end of period 75 $ 37Exercisable, end of period 65 $ 34
The weighted-average fair value of SARs granted during the years ended December 31, 2015 and 2014 was $13 and $14,respectively.
18. Earnings Per Share
The following table sets forth the computation of basic and diluted earnings per share from continuing operations for theyears ended December 31 (in thousands except per share amounts):
2016 2015 2014
Numerator:Income used in computing basic and diluted earnings per share $ 692,164 $ 752,207 $ 844,611Denominator:Denominator for basic earnings per share-weighted-averagecommon shares 179,676 202,681 216,305Effect of dilutive securities – employee stock compensation plan 859 1,005 1,401Denominator for diluted earnings per share- adjusted weighted-average shares outstanding 180,535 203,686 217,706Earnings per common share:
Basic $ 3.85 $ 3.71 $ 3.90Diluted $ 3.83 $ 3.69 $ 3.88
Options to purchase 1.4 million, 1.0 million and 0.5 million weighted-average shares of common stock outstandingduring 2016, 2015 and 2014, respectively, were not included in the Company’s computation of dilutive securities because theexercise price was greater than the market price and therefore the effect would have been anti-dilutive.
The Company has a share-based compensation plan under which employees may be granted share-based awards,including shares of restricted stock and restricted stock units (RSUs). Non-forfeitable dividends are paid on unvested shares ofrestricted stock and non-forfeitable dividend equivalents are paid on unvested RSUs. As such, shares of restricted stock andRSUs are considered participating securities under the two-class method of calculating earnings per share as described in ASCTopic 260, “Earnings per Share.” The two-class method of calculating earnings per share did not have a material impact on theCompany’s earnings per share calculation as of December 31, 2016, 2015 and 2014.
97

19. Reportable Segments and Geographic Information
Reportable Segments:
Harley-Davidson, Inc. is the parent company for the groups of companies doing business as Harley-Davidson MotorCompany (HDMC) and Harley-Davidson Financial Services (HDFS). The Company operates in two segments: theMotorcycles & Related Products (Motorcycles) segment and the Financial Services segment. The Company’s reportablesegments are strategic business units that offer different products and services and are managed separately based on thefundamental differences in their operations.
The Motorcycles segment consists of HDMC which designs, manufactures and sells at wholesale on-road Harley-Davidson motorcycles as well as motorcycle parts, accessories, general merchandise and related services. The Company’sproducts are sold to retail customers through a network of independent dealers. The Company conducts business on a globalbasis, with sales in the United States, Canada, Latin America, Europe/Middle East/Africa (EMEA) and the Asia Pacific region.
The Financial Services reportable segment consists of HDFS which provides wholesale and retail financing and providesinsurance and insurance-related programs primarily to Harley-Davidson dealers and their retail customers. HDFS conductsbusiness principally in the United States and Canada.
Information by segment is set forth below for the years ended December 31 (in thousands):
2016 2015 2014
Motorcycles net revenue $ 5,271,376 $ 5,308,744 $ 5,567,681Gross profit 1,851,666 1,952,460 2,025,080Selling, administrative and engineering expense 1,078,260 1,076,970 1,021,933Operating income from Motorcycles $ 773,406 $ 875,490 $ 1,003,147Financial Services revenue $ 725,082 $ 686,658 $ 660,827Financial Services expense 449,552 406,453 382,991Operating income from Financial Services $ 275,530 $ 280,205 $ 277,836
Financial Services revenue includes $4.4 million, $6.9 million and $8.1 million of interest that HDMC paid to HDFS onwholesale finance receivables in 2016, 2015 and 2014, respectively. The offsetting cost of these interest incentives wasrecorded as a reduction to Motorcycles revenue.
Information by segment is set forth below as of December 31 (in thousands):
MotorcyclesFinancialServices Consolidated
2016Total assets $ 2,490,450 $ 7,399,790 $ 9,890,240Depreciation and amortization $ 202,122 $ 7,433 $ 209,555Capital expenditures $ 245,316 $ 10,947 $ 256,2632015Total assets $ 2,522,249 $ 7,450,728 $ 9,972,977Depreciation and amortization $ 188,926 $ 9,148 $ 198,074Capital expenditures $ 249,772 $ 10,202 $ 259,9742014Total assets $ 2,502,190 $ 7,013,680 $ 9,515,870Depreciation and amortization $ 171,187 $ 8,113 $ 179,300Capital expenditures $ 224,262 $ 8,057 $ 232,319
98

Geographic Information:
Included in the consolidated financial statements are the following amounts relating to geographic locations for the yearsended December 31 (in thousands):
2016 2015 2014
Revenue from Motorcycles(a):United States $ 3,579,129 $ 3,768,069 $ 3,773,087EMEA 798,489 728,198 869,690Japan 200,309 162,675 197,792Canada 212,099 178,042 194,422Australia and New Zealand 181,809 165,854 190,029Other foreign countries 299,541 305,906 342,661
Total revenue from Motorcycles $ 5,271,376 $ 5,308,744 $ 5,567,681Revenue from Financial Services(a):
United States $ 692,784 $ 656,888 $ 627,317Europe 6,528 5,373 5,684Canada 21,626 21,180 23,707Other foreign countries 4,144 3,217 4,119
Total revenue from Financial Services $ 725,082 $ 686,658 $ 660,827Long-lived assets(b):
United States $ 943,479 $ 915,509 $ 865,617International 38,114 26,909 34,328
Total long-lived assets $ 981,593 $ 942,418 $ 899,945
(a) Revenue is attributed to geographic regions based on location of customer.(b) Long-lived assets include all long-term assets except those specifically excluded under ASC Topic 280, “Segment
Reporting,” such as deferred income taxes and finance receivables.
20. Related Party Transactions
A director of the Company is Chairman and Chief Executive Officer and an equity owner of Fred Deeley Imports Ltd.(Deeley Imports), the exclusive distributor of the Company’s motorcycles in Canada until August 2015. On August 4, 2015, theCompany completed its purchase of certain assets and liabilities from Deeley Imports including, among other things, theacquisition of the exclusive right to distribute the Company's motorcycles and other products in Canada. As a result of theacquisition, the Company no longer does business with Deeley Imports. Refer to Note 3 for further details.
The Company recorded Motorcycles and Related Products revenue and Financial Services revenue from Deeley Importsduring 2015 and 2014 of $117.3 million and $194.8 million, respectively. The Company recorded no revenue from DeeleyImports during 2016. The Company had no finance receivables balances due from Deeley Imports at December 31, 2016 and2015.
Upon the termination of the distribution agreement between the Company and Deeley Imports, the Company entered intodealer agreements with approximately 66 dealers in Canada, all of which had preexisting dealer agreements with DeeleyImports. These new Canadian dealer agreements included an agreement with Trev Deeley Motorcycles for the operation of aHarley-Davidson dealership located in Richmond, British Columbia. Trev Deeley Motorcycles is owned by the Darren James2014 Trust, of which a director of the Company is the sole trustee and his son is the beneficiary.
The Company recorded Motorcycles and Related Products revenue and Financial Services revenue from Trev DeeleyMotorcycles during 2016 and 2015 of $5.3 million and $1.4 million, respectively, and had finance receivables balances duefrom Trev Deeley Motorcycles of $0.5 million and $0.3 million at December 31, 2016 and 2015, respectively.
99
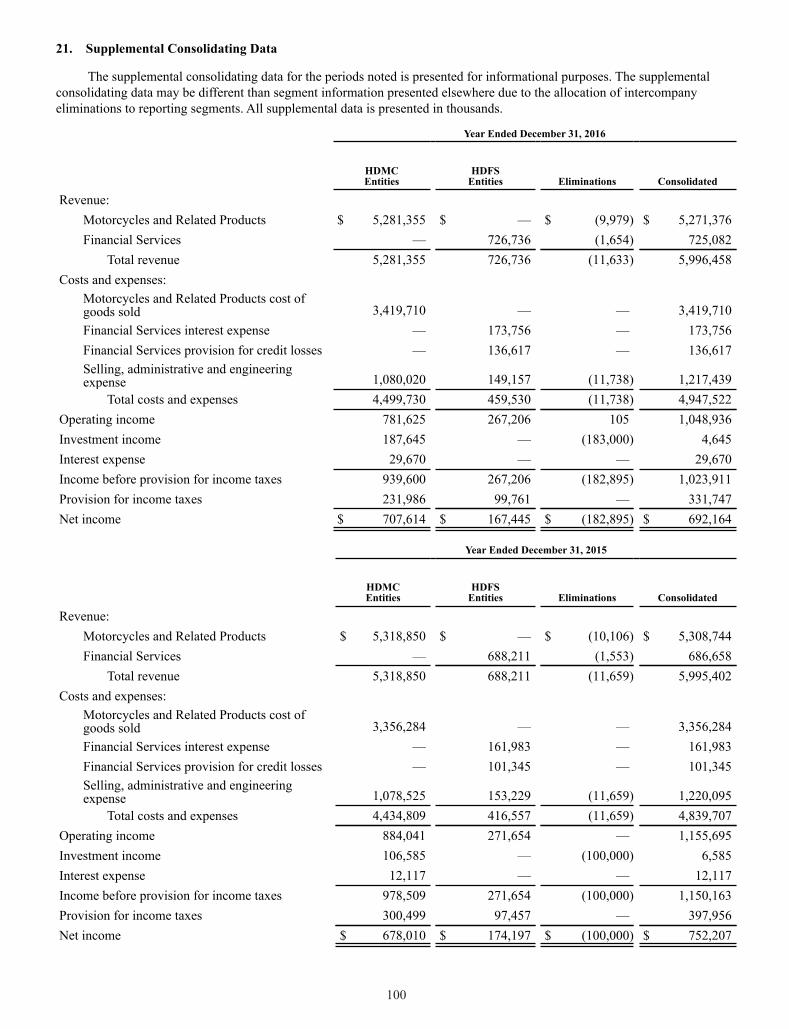
21. Supplemental Consolidating Data
The supplemental consolidating data for the periods noted is presented for informational purposes. The supplementalconsolidating data may be different than segment information presented elsewhere due to the allocation of intercompanyeliminations to reporting segments. All supplemental data is presented in thousands.
Year Ended December 31, 2016
HDMCEntities
HDFSEntities Eliminations Consolidated
Revenue:Motorcycles and Related Products $ 5,281,355 $ — $ (9,979) $ 5,271,376Financial Services — 726,736 (1,654) 725,082
Total revenue 5,281,355 726,736 (11,633) 5,996,458Costs and expenses:
Motorcycles and Related Products cost ofgoods sold 3,419,710 — — 3,419,710Financial Services interest expense — 173,756 — 173,756Financial Services provision for credit losses — 136,617 — 136,617Selling, administrative and engineeringexpense 1,080,020 149,157 (11,738) 1,217,439
Total costs and expenses 4,499,730 459,530 (11,738) 4,947,522Operating income 781,625 267,206 105 1,048,936Investment income 187,645 — (183,000) 4,645Interest expense 29,670 — — 29,670Income before provision for income taxes 939,600 267,206 (182,895) 1,023,911Provision for income taxes 231,986 99,761 — 331,747Net income $ 707,614 $ 167,445 $ (182,895) $ 692,164
Year Ended December 31, 2015
HDMCEntities
HDFSEntities Eliminations Consolidated
Revenue:Motorcycles and Related Products $ 5,318,850 $ — $ (10,106) $ 5,308,744Financial Services — 688,211 (1,553) 686,658
Total revenue 5,318,850 688,211 (11,659) 5,995,402Costs and expenses:
Motorcycles and Related Products cost ofgoods sold 3,356,284 — — 3,356,284Financial Services interest expense — 161,983 — 161,983Financial Services provision for credit losses — 101,345 — 101,345Selling, administrative and engineeringexpense 1,078,525 153,229 (11,659) 1,220,095
Total costs and expenses 4,434,809 416,557 (11,659) 4,839,707Operating income 884,041 271,654 — 1,155,695Investment income 106,585 — (100,000) 6,585Interest expense 12,117 — — 12,117Income before provision for income taxes 978,509 271,654 (100,000) 1,150,163Provision for income taxes 300,499 97,457 — 397,956Net income $ 678,010 $ 174,197 $ (100,000) $ 752,207
100

Year Ended December 31, 2014
HDMCEntities
HDFSEntities Eliminations Consolidated
Revenue:Motorcycles and Related Products $ 5,577,697 $ — $ (10,016) $ 5,567,681Financial Services — 662,345 (1,518) 660,827
Total revenue 5,577,697 662,345 (11,534) 6,228,508Costs and expenses:
Motorcycles and Related Products cost ofgoods sold 3,542,601 — — 3,542,601Financial Services interest expense — 164,476 — 164,476Financial Services provision for credit losses — 80,946 — 80,946Selling, administrative and engineeringexpense 1,023,450 147,586 (11,534) 1,159,502
Total costs and expenses 4,566,051 393,008 (11,534) 4,947,525Operating income 1,011,646 269,337 — 1,280,983Investment income 126,499 — (120,000) 6,499Interest expense 4,162 — — 4,162Income before provision for income taxes 1,133,983 269,337 (120,000) 1,283,320Provision for income taxes 338,453 100,256 — 438,709Net income $ 795,530 $ 169,081 $ (120,000) $ 844,611
101

December 31, 2016
HDMCEntities
HDFSEntities Eliminations Consolidated
ASSETSCurrent assets:
Cash and cash equivalents $ 425,540 $ 334,444 $ — $ 759,984Marketable securities 5,019 500 — 5,519Accounts receivable, net 450,186 — (165,080) 285,106Finance receivables, net — 2,076,261 — 2,076,261Inventories 499,917 — — 499,917Restricted cash — 52,574 — 52,574Other current assets 127,606 46,934 (49) 174,491
Total current assets 1,508,268 2,510,713 (165,129) 3,853,852Finance receivables, net — 4,759,197 — 4,759,197Property, plant and equipment, net 942,634 38,959 — 981,593Goodwill 53,391 — — 53,391Deferred income taxes 103,487 66,152 (1,910) 167,729Other long-term assets 132,835 24,769 (83,126) 74,478
$ 2,740,615 $ 7,399,790 $ (250,165) $ 9,890,240LIABILITIES AND SHAREHOLDERS’ EQUITYCurrent liabilities:
Accounts payable $ 219,353 $ 181,045 $ (165,080) $ 235,318Accrued liabilities 395,907 90,910 (165) 486,652Short-term debt — 1,055,708 — 1,055,708Current portion of long-term debt, net — 1,084,884 — 1,084,884
Total current liabilities 615,260 2,412,547 (165,245) 2,862,562Long-term debt, net 741,306 3,925,669 — 4,666,975Pension liability 84,442 — — 84,442Postretirement healthcare liability 173,267 — — 173,267Other long-term liabilities 150,391 29,697 2,748 182,836Commitments and contingencies (Note 15)Shareholders’ equity 975,949 1,031,877 (87,668) 1,920,158
$ 2,740,615 $ 7,399,790 $ (250,165) $ 9,890,240
102
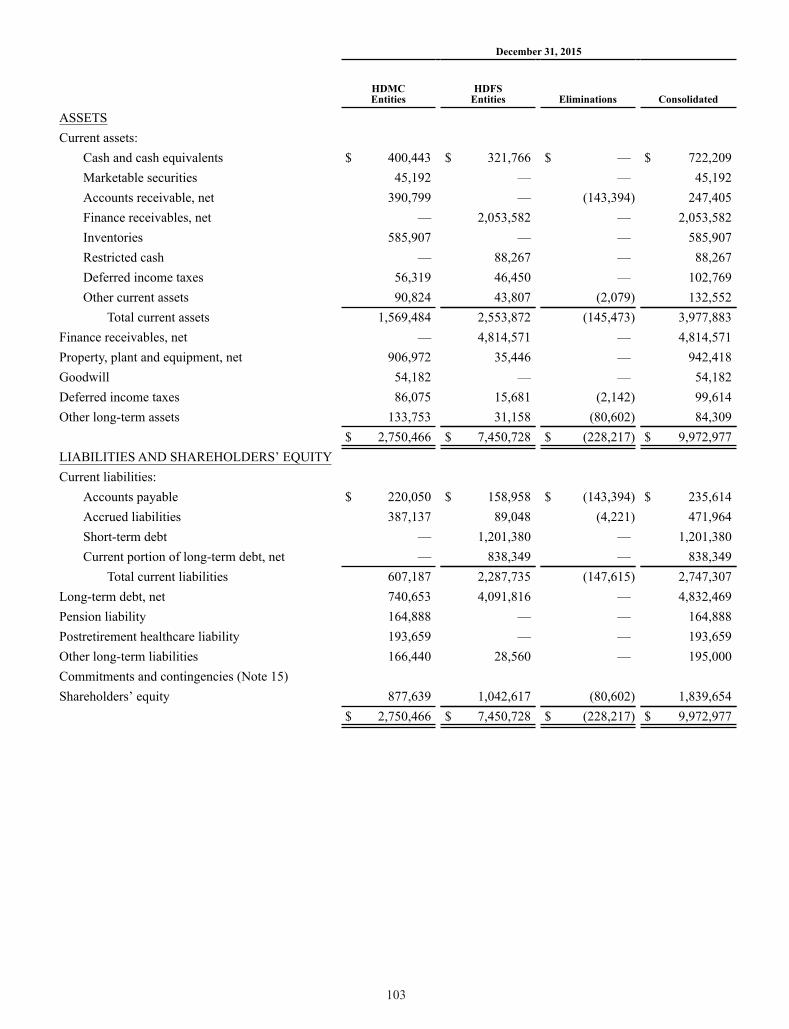
December 31, 2015
HDMCEntities
HDFSEntities Eliminations Consolidated
ASSETSCurrent assets:
Cash and cash equivalents $ 400,443 $ 321,766 $ — $ 722,209Marketable securities 45,192 — — 45,192Accounts receivable, net 390,799 — (143,394) 247,405Finance receivables, net — 2,053,582 — 2,053,582Inventories 585,907 — — 585,907Restricted cash — 88,267 — 88,267Deferred income taxes 56,319 46,450 — 102,769Other current assets 90,824 43,807 (2,079) 132,552
Total current assets 1,569,484 2,553,872 (145,473) 3,977,883Finance receivables, net — 4,814,571 — 4,814,571Property, plant and equipment, net 906,972 35,446 — 942,418Goodwill 54,182 — — 54,182Deferred income taxes 86,075 15,681 (2,142) 99,614Other long-term assets 133,753 31,158 (80,602) 84,309
$ 2,750,466 $ 7,450,728 $ (228,217) $ 9,972,977LIABILITIES AND SHAREHOLDERS’ EQUITYCurrent liabilities:
Accounts payable $ 220,050 $ 158,958 $ (143,394) $ 235,614Accrued liabilities 387,137 89,048 (4,221) 471,964Short-term debt — 1,201,380 — 1,201,380Current portion of long-term debt, net — 838,349 — 838,349
Total current liabilities 607,187 2,287,735 (147,615) 2,747,307Long-term debt, net 740,653 4,091,816 — 4,832,469Pension liability 164,888 — — 164,888Postretirement healthcare liability 193,659 — — 193,659Other long-term liabilities 166,440 28,560 — 195,000Commitments and contingencies (Note 15)Shareholders’ equity 877,639 1,042,617 (80,602) 1,839,654
$ 2,750,466 $ 7,450,728 $ (228,217) $ 9,972,977
103

Year Ended December 31, 2016
HDMCEntities
HDFSEntities Eliminations Consolidated
Cash flows from operating activities:Net income $ 707,614 $ 167,445 $ (182,895) $ 692,164Adjustments to reconcile net income to net cash provided byoperating activities:
Depreciation and amortization of intangibles 202,122 7,433 — 209,555Amortization of deferred loan origination costs — 86,681 — 86,681Amortization of financing origination fees 654 8,598 — 9,252Provision for long-term employee benefits 38,273 — — 38,273Employee benefit plan contributions and payments (55,809) — — (55,809)Stock compensation expense 29,811 2,525 — 32,336Net change in wholesale finance receivables related tosales — — (3,233) (3,233)Provision for credit losses — 136,617 — 136,617Gain on off-balance sheet asset-backed securitization — (9,269) — (9,269)Loss on debt extinguishment — 118 — 118Deferred income taxes 7,772 (7,705) (232) (165)Other, net (7,041) 239 (105) (6,907)Changes in current assets and liabilities:
Accounts receivable, net (67,621) — 21,687 (45,934)Finance receivables—accrued interest and other — (1,489) — (1,489)Inventories 85,072 — — 85,072Accounts payable and accrued liabilities 26,005 25,027 (12,795) 38,237Derivative instruments (3,413) — — (3,413)Other (25,415) (2,332) — (27,747)
Total adjustments 230,410 246,443 5,322 482,175Net cash provided by operating activities 938,024 413,888 (177,573) 1,174,339
Cash flows from investing activities:Capital expenditures (245,316) (10,947) — (256,263)Origination of finance receivables — (7,420,177) 3,755,682 (3,664,495)Collections on finance receivables — 6,936,140 (3,761,109) 3,175,031Proceeds from finance receivables sold — 312,571 — 312,571Sales and redemptions of marketable securities 40,014 — — 40,014Other 411 — — 411
Net cash used by investing activities (204,891) (182,413) (5,427) (392,731)
104
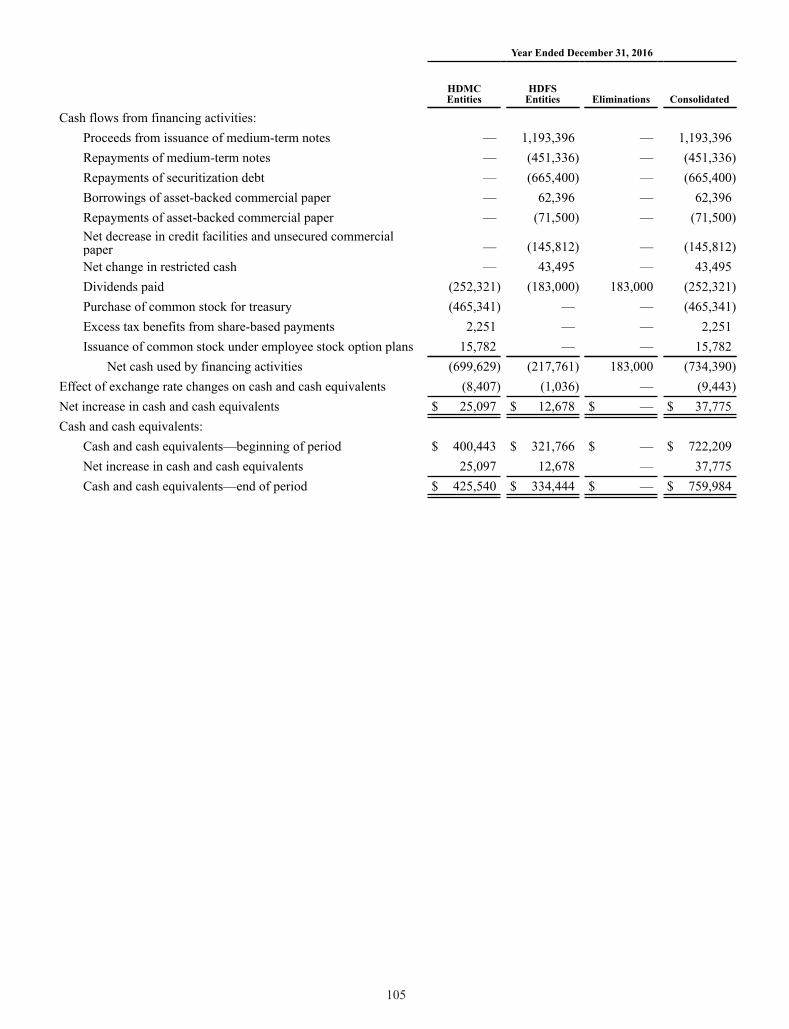
Year Ended December 31, 2016
HDMCEntities
HDFSEntities Eliminations Consolidated
Cash flows from financing activities:Proceeds from issuance of medium-term notes — 1,193,396 — 1,193,396Repayments of medium-term notes — (451,336) — (451,336)Repayments of securitization debt — (665,400) — (665,400)Borrowings of asset-backed commercial paper — 62,396 — 62,396Repayments of asset-backed commercial paper — (71,500) — (71,500)Net decrease in credit facilities and unsecured commercialpaper — (145,812) — (145,812)Net change in restricted cash — 43,495 — 43,495Dividends paid (252,321) (183,000) 183,000 (252,321)Purchase of common stock for treasury (465,341) — — (465,341)Excess tax benefits from share-based payments 2,251 — — 2,251Issuance of common stock under employee stock option plans 15,782 — — 15,782
Net cash used by financing activities (699,629) (217,761) 183,000 (734,390)Effect of exchange rate changes on cash and cash equivalents (8,407) (1,036) — (9,443)Net increase in cash and cash equivalents $ 25,097 $ 12,678 $ — $ 37,775Cash and cash equivalents:
Cash and cash equivalents—beginning of period $ 400,443 $ 321,766 $ — $ 722,209Net increase in cash and cash equivalents 25,097 12,678 — 37,775Cash and cash equivalents—end of period $ 425,540 $ 334,444 $ — $ 759,984
105

Year Ended December 31, 2015
HDMCEntities
HDFSEntities Eliminations Consolidated
Cash flows from operating activities:Net income $ 678,010 $ 174,197 $ (100,000) $ 752,207Adjustments to reconcile net income to net cash provided byoperating activities:
Depreciation and amortization of intangibles 188,926 9,148 — 198,074Amortization of deferred loan origination costs — 93,546 — 93,546Amortization of financing origination fees 267 9,708 — 9,975Provision for long-term employee benefits 60,824 — — 60,824Employee benefit plan contributions and payments (28,490) — — (28,490)Stock compensation expense 26,775 2,658 — 29,433Net change in wholesale finance receivables related tosales — — (113,970) (113,970)Provision for credit losses — 101,345 — 101,345Loss on debt extinguishment — 1,099 — 1,099Deferred income taxes (4,792) (11,692) — (16,484)Other, net 19,625 1,288 — 20,913Changes in current assets and liabilities:
Accounts receivable, net 4,055 — (17,720) (13,665)Finance receivables – accrued interest and other — (3,046) — (3,046)Inventories (155,222) — — (155,222)Accounts payable and accrued liabilities 81,929 18,539 38,355 138,823Derivative instruments (5,615) — — (5,615)Other 33,658 (3,287) — 30,371
Total adjustments 221,940 219,306 (93,335) 347,911Net cash provided by operating activities 899,950 393,503 (193,335) 1,100,118
Cash flows from investing activities:Capital expenditures (249,772) (10,202) — (259,974)Origination of finance receivables — (7,836,279) 4,084,449 (3,751,830)Collections on finance receivables — 7,127,999 (3,991,114) 3,136,885Sales and redemptions of marketable securities 11,507 — — 11,507Acquisition of business (59,910) — — (59,910)Other 7,474 — — 7,474
Net cash used by investing activities (290,701) (718,482) 93,335 (915,848)
106

Year Ended December 31, 2015
HDMCEntities
HDFSEntities Eliminations Consolidated
Cash flows from financing activities:Proceeds from issuance of medium-term notes — 595,386 — 595,386Repayments of medium-term notes — (610,331) — (610,331)Proceeds from issuance of senior unsecured notes 740,385 — — 740,385Intercompany borrowing activity 250,000 (250,000) — —Proceeds from securitization debt — 1,195,668 — 1,195,668Repayments of securitization debt — (1,008,135) — (1,008,135)Borrowings of asset-backed commercial paper — 87,442 — 87,442Repayments of asset-backed commercial paper — (72,727) — (72,727)Net increase in credit facilities and unsecured commercialpaper — 469,473 — 469,473Net change in restricted cash — 11,410 — 11,410Dividends paid (249,262) (100,000) 100,000 (249,262)Purchase of common stock for treasury (1,537,020) — — (1,537,020)Excess tax benefits from share-based payments 3,468 — — 3,468Issuance of common stock under employee stock option plans 20,179 — — 20,179
Net cash (used by) provided by financing activities (772,250) 318,186 100,000 (354,064)Effect of exchange rate changes on cash and cash equivalents (10,451) (4,226) — (14,677)Net decrease in cash and cash equivalents $ (173,452) $ (11,019) $ — $ (184,471)Cash and cash equivalents:
Cash and cash equivalents – beginning of period $ 573,895 $ 332,785 $ — $ 906,680Net decrease in cash and cash equivalents (173,452) (11,019) — (184,471)Cash and cash equivalents – end of period $ 400,443 $ 321,766 $ — $ 722,209
107

Year Ended December 31, 2014
HDMCEntities
HDFSEntities Eliminations Consolidated
Cash flows from operating activities:Net income $ 795,530 $ 169,081 $ (120,000) $ 844,611Adjustments to reconcile net income to net cash provided byoperating activities:
Depreciation and amortization of intangibles 171,187 8,113 — 179,300Amortization of deferred loan origination costs — 94,429 — 94,429Amortization of financing origination fees 59 8,383 — 8,442Provision for long-term employee benefits 33,709 — — 33,709Employee benefit plan contributions and payments (29,686) — — (29,686)Stock compensation expense 35,064 2,865 — 37,929Net change in wholesale finance receivables related tosales — — (75,210) (75,210)Provision for credit losses — 80,946 — 80,946Loss on debt extinguishment — 3,942 — 3,942Deferred income taxes (191) (7,430) — (7,621)Other, net 42,237 (21,764) — 20,473Changes in current assets and liabilities:
Accounts receivable, net (31,740) — 21,931 (9,809)Finance receivables – accrued interest and other — (2,515) — (2,515)Inventories (50,886) — — (50,886)Accounts payable and accrued liabilities 18,255 21,629 (18,575) 21,309Derivative instruments 703 — — 703Other (17,187) 13,798 — (3,389)
Total adjustments 171,524 202,396 (71,854) 302,066Net cash provided by operating activities 967,054 371,477 (191,854) 1,146,677
Cash flows from investing activities:Capital expenditures (224,262) (8,057) — (232,319)Origination of finance receivables — (7,693,884) 4,125,461 (3,568,423)Collections on finance receivables — 7,066,852 (4,053,607) 3,013,245Sales and redemptions of marketable securities 41,010 — — 41,010Other 1,837 — — 1,837
Net cash used by investing activities (181,415) (635,089) 71,854 (744,650)
108

Year Ended December 31, 2014
HDMCEntities
HDFSEntities Eliminations Consolidated
Cash flows from financing activities:Proceeds from issuance of medium-term notes — 991,835 — 991,835Repayments of medium-term notes — (526,431) — (526,431)Repayments of senior unsecured notes (303,000) — — (303,000)Intercompany borrowing activity 200,000 (200,000) — —Proceeds from securitization debt — 847,126 — 847,126Repayments of securitization debt — (834,856) — (834,856)Borrowings of asset-backed commercial paper — 84,907 — 84,907Repayments of asset-backed commercial paper — (77,800) — (77,800)Net increase in credit facilities and unsecured commercialpaper — 63,945 — 63,945Net change in restricted cash — 22,755 — 22,755Dividends paid (238,300) (120,000) 120,000 (238,300)Purchase of common stock for treasury (615,602) — — (615,602)Excess tax benefits from share-based payments 11,540 — — 11,540Issuance of common stock under employee stock option plans 37,785 — — 37,785
Net cash (used by) provided by financing activities (907,577) 251,481 120,000 (536,096)Effect of exchange rate changes on cash and cash equivalents (23,079) (2,784) — (25,863)Net decrease in cash and cash equivalents $ (145,017) $ (14,915) $ — $ (159,932)Cash and cash equivalents:
Cash and cash equivalents – beginning of period $ 718,912 $ 347,700 $ — $ 1,066,612Net decrease in cash and cash equivalents (145,017) (14,915) — (159,932)Cash and cash equivalents – end of period $ 573,895 $ 332,785 $ — $ 906,680
22. Subsequent Events
In January 2017, the Company transferred $333.4 million of U.S. retail motorcycle finance receivables to an SPEwhich, in turn, issued $300.0 million of debt to the U.S. Conduit Facilities.
109

SUPPLEMENTARY DATAQuarterly financial data (unaudited)(In millions, except per share data)
1st Quarter 2nd Quarter 3rd Quarter 4th Quarter
Mar 27,2016
Mar 29,2015
June 26,2016
June 28,2015
Sep 25,2016
Sep 27,2015
Dec 31,2016
Dec 31,2015
Motorcycles:Revenue $1,576.6 $1,510.6 $1,670.1 $1,650.8 $1,091.6 $1,140.3 $ 933.0 $1,007.1Operating income $ 332.5 $ 345.5 $ 322.7 $ 380.6 $ 108.9 $ 143.1 $ 9.3 $ 6.4
Financial Services:Revenue $ 173.4 $ 162.4 $ 191.0 $ 173.6 $ 183.2 $ 177.1 $ 177.6 $ 173.6Operating income $ 56.4 $ 64.7 $ 89.6 $ 81.9 $ 69.4 $ 72.8 $ 60.1 $ 60.9
Consolidated:Income before taxes $ 382.4 $ 411.4 $ 405.9 $ 464.0 $ 173.0 $ 214.2 $ 62.6 $ 60.6Net income $ 250.5 $ 269.9 $ 280.4 $ 299.8 $ 114.1 $ 140.3 $ 47.2 $ 42.2
Earnings per common share:Basic $ 1.37 $ 1.28 $ 1.55 $ 1.44 $ 0.64 $ 0.69 $ 0.27 $ 0.22Diluted $ 1.36 $ 1.27 $ 1.55 $ 1.44 $ 0.64 $ 0.69 $ 0.27 $ 0.22
Item 9. Changes in and Disagreements with Accountants on Accounting and Financial Disclosure
None. Item 9A. Controls and Procedures
Evaluation of Disclosure Controls and Procedures
In accordance with Rule 13a-15(b) of the Securities Exchange Act of 1934 (the Exchange Act), as of the end of the periodcovered by this Annual Report on Form 10-K, the Company’s management evaluated, with the participation of the Company’sPresident and Chief Executive Officer and the Senior Vice President and Chief Financial Officer, the effectiveness of the designand operation of the Company’s disclosure controls and procedures (as defined in Rule 13a-15(e) under the ExchangeAct). Based upon their evaluation of these disclosure controls and procedures, the President and Chief Executive Officer andthe Senior Vice President and Chief Financial Officer have concluded that the disclosure controls and procedures were effectiveas of the end of the period covered by this Annual Report on Form 10-K to ensure that information required to be disclosed bythe Company in the reports it files or submits under the Exchange Act is recorded, processed, summarized and reported, withinthe time period specified in the Securities and Exchange Commission rules and forms, and to ensure that information requiredto be disclosed by the Company in the reports it files or submits under the Exchange Act is accumulated and communicated tothe Company’s management, including its President and Chief Executive Officer and its Senior Vice President and ChiefFinancial Officer, as appropriate, to allow timely decisions regarding disclosure.
Management’s Report on Internal Control over Financial Reporting
The report of management required under this Item 9A is contained in Item 8 of Part II of this Annual Report on Form10-K under the heading “Management’s Report on Internal Control over Financial Reporting.”
Attestation Report of Independent Registered Public Accounting Firm
The attestation report required under this Item 9A is contained in Item 8 of Part II of this Annual Report on Form 10-Kunder the heading “Report of Independent Registered Public Accounting Firm on Internal Control over Financial Reporting.”
Changes in Internal Controls
There were no changes in the Company’s internal control over financial reporting that occurred during the quarter endedDecember 31, 2016 that have materially affected, or are reasonably likely to materially affect, the Company’s internal controlover financial reporting.
110

PART III
Item 10. Directors, Executive Officers and Corporate Governance
The information to be included in the Company’s definitive proxy statement for the 2017 annual meeting of shareholders,which will be filed on or about March 20, 2017 (the Proxy Statement), under the captions “Questions and Answers about theCompany – Who are our Executive Officers for SEC Purposes?,” “Corporate Governance Principles and Board Matters – Auditand Finance Committee,” “Proposal I – Election of Directors,” “Section 16(a) Beneficial Ownership Reporting Compliance,”“Audit and Finance Committee Report,” and “Corporate Governance Principles and Board Matters – Independence ofDirectors” is incorporated by reference herein.
The Company has adopted the Harley-Davidson, Inc. Financial Code of Ethics applicable to the Company’s chiefexecutive officer, the chief financial officer, the principal accounting officer and the controller and other persons performingsimilar finance functions. The Company has posted a copy of the Harley-Davidson, Inc. Financial Code of Ethics on theCompany’s website at http://investor.harley-davidson.com/. The Company intends to satisfy the disclosure requirements underItem 5.05 of the Securities and Exchange Commission’s Current Report on Form 8-K regarding amendments to, or waiversfrom, the Harley-Davidson, Inc. Financial Code of Ethics by posting such information on its website at www.harley-davidson.com. The Company is not including the information contained on or available through its website as a part of, orincorporating such information by reference into, this Annual Report on Form 10-K.
Item 11. Executive Compensation
The information to be included in the Proxy Statement under the captions “Executive Compensation” and “HumanResources Committee Report on Executive Compensation” is incorporated by reference herein.
Item 12. Security Ownership of Certain Beneficial Owners and Management and Related Stockholder Matters
Information to be included in the Proxy Statement under the caption “Common Stock Ownership of Certain BeneficialOwners and Management” is incorporated by reference herein.
The following table provides information about the Company’s equity compensation plans (including individualcompensation arrangements) as of December 31, 2016:
Plan Category
Number of securitiesto be issued upon the
exercise ofoutstanding options
Weighted-averageexerciseprice of
outstandingoptions
Number of securitiesremaining available forfuture issuance underequity compensation
plans (excludingsecurities reflected in
the first column)
Equity compensation plans approved by shareholders:Management employees 1,878,029 $ 48.96 11,687,704
Equity compensation plans not approved byshareholders:
Union employees:Kansas City, MO — $ — 26,718York, PA — $ — 96,770
Non employees:Board of Directors — $ — 68,078
— $ — 191,566Total all plans 1,878,029 11,879,270
Plan documents for each of the Company’s equity compensation plans have been filed with the Securities and ExchangeCommission on a timely basis and are included in the list of exhibits to this annual report on Form 10-K. Equity compensationplans not submitted to shareholders for approval were adopted prior to current regulations requiring such approval and have notbeen materially altered since adoption.
The material features of the union employees’ stock option awards are the same as those of the management employees’stock option awards. Under the Company’s management and union plans, stock options have an exercise price equal to the fair
111

market value of the underlying stock at the date of grant and expire ten years from the date of grant. Stock options vest ratablyover a three-year period with the first one-third of the grant becoming exercisable one year after the date of grant.
The Director Compensation Policy provides non-employee Directors with compensation that includes an annual retaineras well as a grant of share units. The payment of share units is deferred until a director ceases to serve as a director and theshare units are payable at that time in actual shares of common stock. The Director Compensation Policy also provides that anon-employee Director may elect to receive 50% or 100% of the annual retainer to be paid in each calendar year in the form ofcommon stock based upon the fair market value of the common stock at the time of the annual meeting of shareholders. EachDirector must receive a minimum of one-half of his or her annual retainer in common stock until the Director reaches theDirector stock ownership guidelines defined below.
In May 2016, the Board approved “Board of Directors and Senior Executive Stock Ownership Guidelines” (OwnershipGuidelines). The Ownership Guidelines stipulate that all Directors hold five times their annual retainer in shares of CommonStock and Vice Presidents, General Managers or higher (Senior Executives) hold from two times to six times of their basesalary in shares of common stock, or certain rights to acquire common stock, depending on their level. The Directors andSenior Executives have five years from the date they are elected a Director or become a senior executive to accumulate theappropriate number of shares of common stock. Restricted stock, restricted stock units, shares held in 401(k) accounts, sharesissuable under vested unexercised stock options, performance shares and performance share units (at target amount), stockappreciation rights, deferred stock units and shares of common stock held directly count toward satisfying the guidelines forcommon stock ownership.
Item 13. Certain Relationships and Related Transactions, and Director Independence
The information to be included in the Proxy Statement under the caption “Certain Transactions” and “CorporateGovernance Principles and Board Matters – Independence of Directors” is incorporated by reference herein.
Item 14. Principal Accounting Fees and Services
The information to be included in the Proxy Statement under the caption “Ratification of Selection of IndependentRegistered Public Accounting Firm – Fees Paid to Ernst & Young LLP” is incorporated by reference herein.
112

PART IV
Item 15. Exhibits and Financial Statements
(a) The following documents are filed as part of this Form 10-K:
(1) Financial Statements
Consolidated statements of income for each of the three years in the period ended December 31,2016 52
Consolidated statements of comprehensive income for each of the three years in the period endedDecember 31, 2016 53
Consolidated balance sheets at December 31, 2016 and December 31, 2015 54
Consolidated statements of cash flows for each of the three years in the period ended December31, 2016 56
Consolidated statements of shareholders’ equity for each of the three years in the period endedDecember 31, 2016 57
Notes to consolidated financial statements 58
(2) Financial Statement Schedule
Schedule II – Valuation and qualifying accounts 114
(3) Exhibits 117
Reference is made to the separate Index to Exhibits contained on pages 117 through 121 filed herewith.
All other schedules are omitted since the required information is not present or is not present in amounts sufficient torequire submission of the schedules.
113

Schedule II
HARLEY-DAVIDSON, INC.CONSOLIDATED VALUATION AND QUALIFYING ACCOUNTS
Years ended December 31, 2016, 2015 and 2014 (In thousands)
2016 2015 2014
Accounts receivable – allowance for doubtful accountsBalance, beginning of period $ 2,905 $ 3,458 $ 4,960Provision charged to expense (101) 266 (471)Reserve adjustments (63) (276) (394)Write-offs, net of recoveries — (543) (637)Balance, end of period $ 2,741 $ 2,905 $ 3,458
Finance receivables – allowance for credit lossesBalance, beginning of period $ 147,178 $ 127,364 $ 110,693Provision for credit losses 136,617 101,345 80,946Charge-offs, net of recoveries (107,161) (81,531) (64,275)Other(a) (3,291) — —Balance, end of period $ 173,343 $ 147,178 $ 127,364
Inventories – allowance for obsolescence(b)
Balance, beginning of period $ 26,740 $ 17,775 $ 17,463Provision charged to expense 21,137 19,564 19,044Reserve adjustments (88) (1,028) (399)Write-offs, net of recoveries (7,916) (9,571) (18,333)Balance, end of period $ 39,873 $ 26,740 $ 17,775
Deferred tax assets – valuation allowanceBalance, beginning of period $ 20,659 $ 25,462 $ 21,818Adjustments 10,294 (4,803) 3,644Balance, end of period $ 30,953 $ 20,659 $ 25,462
(a) Related to the sale of finance receivables during the second quarter of 2016 with a principal balance of $301.8 million
through an off-balance sheet asset-backed securitization transaction (see Note 11 for additional information).(b) Inventory obsolescence reserves deducted from cost determined on first-in, first-out (FIFO) basis, before deductions for
last-in, first-out (LIFO) valuation reserves.
114

SIGNATURES
Pursuant to the requirements of Section 13 or 15(d) of the Securities Exchange Act of 1934, the registrant has duly causedthis report to be signed on its behalf by the undersigned, thereunto duly authorized, on February 21, 2017.
HARLEY-DAVIDSON, INC.
By: /S/ Matthew S. LevatichMatthew S. LevatichPresident and Chief Executive Officer
115

Pursuant to the requirements of the Securities Exchange Act of 1934, this report has been signed below by the followingpersons on behalf of the registrant and in the capacities indicated on February 21, 2017.
Name Title
/S/ Matthew S. Levatich President and Chief Executive OfficerMatthew S. Levatich (Principal executive officer)
/S/ John A. Olin Senior Vice President and Chief Financial OfficerJohn A. Olin (Principal financial officer)
/S/ Mark R. Kornetzke Chief Accounting OfficerMark R. Kornetzke (Principal accounting officer)
/S/ R. John Anderson DirectorR. John Anderson
/S/ Michael J. Cave Non-Executive ChairmanMichael J. Cave
/S/ Donald A. James DirectorDonald A. James
/S/ Sara L. Levinson DirectorSara L. Levinson
/S/ N. Thomas Linebarger DirectorN. Thomas Linebarger
/S/ George L. Miles, Jr. DirectorGeorge L. Miles, Jr.
/S/ Brian Niccol DirectorBrian Niccol
/S/ James A. Norling DirectorJames A. Norling
/S/ Maryrose Sylvester DirectorMaryrose Sylvester
/S/ Jochen Zeitz DirectorJochen Zeitz
116

INDEX TO EXHIBITS[Items 15(a)(3) and 15(c)]
Exhibit No Description2.1 Asset Purchase Agreement, dated April 30, 2015, among Harley-Davidson Canada LP, Fred Deeley Imports Ltd. and
Harley-Davidson Motor Company, Inc., as amended (incorporated herein by reference to Exhibit 2.1 to the Registrant’sQuarterly Report on Form 10-Q for the quarter ended June 28, 2015 (File No. 1-9183))
3.1 Restated Articles of Incorporation as amended through April 27, 2015 (incorporated herein by reference to Exhibit 3.1 tothe Registrant’s Quarterly Report on Form 10-Q for the quarter ended March 29, 2015 (File No. 1-9183))
3.2 Harley-Davidson, Inc. By-Laws, as amended through April 27, 2015 (incorporated herein by reference by reference toExhibit 3.2 to the Registrant's Quarterly Report on Form 10-Q for the quarter ended March 29, 2015 (File No. 1-9183))
4.1 Indenture to provide for the issuance of indebtedness dated as of November 21, 2003 between Harley-Davidson FundingCorp., Issuer, Harley-Davidson Financial Services, Inc. and Harley-Davidson Credit Corp., Guarantors, to BNY MidwestTrust Company, Trustee (incorporated herein by reference to Exhibit 4.4 to the Registrant’s Annual Report on Form 10-Kfor the year ended December 31, 2005 (File No. 1-9183))
4.2 5-Year Credit Agreement, dated as of April 7, 2014, among the Company, certain subsidiaries of the Company, thefinancial institutions parties thereto and JPMorgan Chase Bank, N.A., as among other things, global administrative agent(incorporated herein by reference to Exhibit 4.1 to the Registrant’s Quarterly Current on Form 10-Q for the quarter endedMarch 30, 2014 (File No. 1-9183))
4.3 Indenture to provide for the issuance of indebtedness dated as of November 21, 2003 between Harley-Davidson Funding Corp., Issuer, Harley-Davidson Financial Services, Inc. and Harley-Davidson Credit Corp.,Guarantors, to Bank of New York Midwest Trust Company, N.A. (successor to BNY Midwest TrustCompany),Trustee (incorporated herein by reference to Exhibit 4.1 to the Registrant’s Current Report on Form8-K dated May 15, 2008 (File No. 1-9183))
4.4 Officers’ Certificate, dated May 22, 2008, pursuant to Sections 102 and 301 of the Indenture, dated November21, 2003, with the forms of 6.80% Medium-Term Notes, Series C due 2018 (incorporated herein by referenceto Exhibit 4.2 to the Registrant’s Current Report on Form 8-K dated May 22, 2008 (File No. 1-9183))
4.5 Indenture, dated as of March 4, 2011, among Harley-Davidson Financial Services, Inc., Issuer, Harley-Davidson CreditCorp., Guarantor, and Bank of New York Mellon Trust Company, N.A., Trustee (incorporated herein by reference toExhibit 4.1 to the Registrant’s Current Report on Form 8-K dated March 1, 2011 (File No. 1-9183))
4.6 Officers’ Certificate, dated January 31, 2012, pursuant to Sections 102 and 301 of the Indenture, dated March 4, 2011, withthe forms of 2.700% Medium-Term Notes due 2017 (incorporated herein by reference to Exhibit 4.2 to the Registrant’sCurrent Report on Form 8-K dated January 26, 2012 (File No. 1-9183))
4.7 Officers' Certificate, dated September 16, 2014, pursuant to Sections 102 and 301 of the Indenture, dated March 4, 2011,with the forms of 2.400% Medium-Term Notes due 2019 (incorporated herein by reference to Exhibit 4.14 to theRegistrant’s Annual Report of Form 10-K for the year ended December 31, 2014 (File No. 1-9183))
4.8 Officers' Certificate, dated November 18, 2014, pursuant to Sections 102 and 301 of the Indenture, dated March 4, 2011,with the forms of 1.550% Medium-Term Notes due 2017 (incorporated herein by reference to Exhibit 4.15 to theRegistrant’s Annual Report of Form 10-K for the year ended December 31, 2014 (File No. 1-9183))
4.9 Officers' Certificate, dated February 26, 2015, pursuant to Sections 102 and 301 of the Indenture, dated March 4, 2011,with the form of 2.150% Medium-Term Notes due 2020 (incorporated herein by reference to Exhibit 4.10 to theRegistrant’s Annual Report of Form 10-K for the year ended December 31, 2015 (File No. 1-9183))
4.10 Indenture, dated July 28, 2015, by and between Harley-Davidson, Inc. and The Bank of New York Mellon Trust Company,N.A., as Trustee. (incorporated herein by reference to Exhibit 4.1 to the Registrant's Current Report on Form 8-K datedJuly 28, 2015 (File No. 1-9183))
4.11 Officers' Certificate, dated July 28, 2015 establishing the form of 3.500% Senior Notes due 2025 and 4.625% Senior Notesdue 2045 (incorporated herein by reference to Exhibit 4.2 to the Registrant's Current Report on From 8-K dates July 28,2015 (File No. 1-9183))
4.12 Officers' Certificate dated January 8, 2016, pursuant to Sections 102 and 301 of the Indenture, dated March 4, 2011, withthe form of 2.250% Medium-Term Notes due 2019 (incorporated herein by reference to Exhibit 4.2 to the Registrant'sCurrent Report on Form 8-K dated January 5, 2016 (File No. 1-9183))
4.13 Officers' certificate dated January 8, 2016, pursuant to Sections 102 and 301 of the Indenture, dated March 4, 2011, withthe form of 2.850% Medium-Term Notes due 2021 (incorporated herein by reference to Exhibit 4.3 to the Registrant'sCurrent Report on Form 8-K dated January 5, 2016 (File No. 1-9183))
Various instruments relating to the Company’s long-term debt described in this report need not be filed herewith pursuant to Item 601(b)(4)(iii)(A) of Regulation S-K. The registrant, by signing this report, agrees to furnish the Securities and Exchange Commission, upon its request,with a copy of any such instrument.
* Represents a management contract or compensatory plan, contract or arrangement in which a director or named executive officer ofthe Company participated.
117

INDEX TO EXHIBITS[Items 15(a)(3) and 15(c)]
Exhibit No Description4.14 Amendment No. 2 to 5-Year Credit Agreement, dated as of April 7, 2014, among the Company, certain subsidiaries of the
Company, the financial institutions parties thereto and JPMorgan Chase Bank, N.A., as, among other things, globaladministrative agent, relating to the 5-Year Credit Agreement, dates as of April 13, 2012, among the Company, certainsubsidiaries of the Company, the financial institutions parties thereto and JPMorgan Chase Bank, N.A., as among otherthings, global administrative agent. (incorporated herein by reference to Exhibit 4.15 to the Registrant’s Annual Report ofForm 10-K for the year ended December 31, 2015 (File No. 1-9183))
4.15 5-Year Credit Agreement, dated as of April 7, 2016 among the Company, certain subsidiaries of the Company, the financialinstitutions parties thereto and JPMorgan Chase Bank, N.A., as among other things, global administrative agent(incorporated herein by reference to Exhibit 4.1 to the Registrant’s Quarterly Report on Form 10-Q for the quarter endedMarch 27, 2016 (File No. 1-9183))
4.16 Amendment No. 1 5-year Credit Agreement, dated as of April 7, 2016, among the Company, certain subsidiaries of theCompany, the financial institutions parties thereto, and JPMorgan Chase Bank, N.A., as, among other things, globaladministrative agent, relating to the 5-year Credit Agreement, dated as of April 7, 2014 among the Company, certainsubsidiaries of the Company, the financial institutions parties thereto and JPMorgan Chase Bank, N.A., as among otherthings, global administrative agent (incorporated herein by reference to Exhibit 4.2 to the Registrant's Quarterly Report onForm 10-Q for the quarter ended March 27, 2016 (File No. 1-9183))
10.1* Harley-Davidson, Inc. 2004 Incentive Stock Plan as amended through April 28, 2007 (incorporated herein by reference toExhibit 10.4 to the Registrant’s Quarterly Report on Form 10-Q for the quarter ended April 1, 2007 (File No. 1-9183))
10.2* Harley-Davidson, Inc. 2009 Incentive Stock Plan (incorporated herein by reference to Appendix A to the Company’sdefinitive proxy statement on Schedule 14A for the Company’s Annual Meeting of Shareholders held on April 25, 2009filed on April 3, 2009 (File No. 1-9183))
10.3* Harley-Davidson, Inc. 2014 Incentive Stock Plan (incorporated herein by reference to Appendix A to the Company’sdefinitive proxy statement on Schedule 14A for the Company’s Annual Meeting of Shareholders held on April 26, 2014filed on March 14, 2014 (File No. 1-9183))
10.4* Amended and Restated Harley-Davidson, Inc. Director Stock Plan as amended effective December 1, 2014 (incorporatedherein by reference to Exhibit 10.6 to the Registrant’s Annual Report on Form 10-K for the year ended December 31, 2014(File No. 1-9183))
10.5* Director Compensation Policy approved April 29, 2016 (incorporated herein by reference from Exhibit 10.1 to theRegistrant’s Quarterly Report on Form 10-Q for the quarter ended June 26, 2016 (File No. 1-9183))
10.6* Deferred Compensation Plan for Nonemployee Directors as amended and restated effective January 1, 2009 (incorporatedherein by reference to Exhibit 10.14 to the Registrant’s Annual Report on Form 10-K for the year ended December 31,2008 (File No. 1-9183))
10.7* Harley-Davidson Management Deferred Compensation Plan as amended and restated effective January 1, 2017(incorporated herein by reference to Exhibit 10.1 to the Registrant’s Quarterly Report on Form 10-Q for the quarter endedSeptember 25, 2016 (File No. 1-9183))
10.8* Harley-Davidson, Inc. Employee Incentive Plan (incorporated herein by reference to the Appendix to the Company’sdefinitive proxy statement on Schedule 14A for the Company’s Annual Meeting of Shareholders held April 25, 2015 (FileNo. 1-9183))
10.9* Harley-Davidson, Inc. Short-Term Incentive Plan for Senior Executives (incorporated herein by reference to Appendix Dto the Company’s definitive proxy statement on Schedule 14A for the Company’s Annual Meeting of Shareholders heldApril 30, 2011 (File No. 1-9183))
10.10* Harley-Davidson Pension Benefit Restoration Plan as amended and restated effective January 1, 2009 (incorporated hereinby reference to Exhibit 10.9 to the Registrant’s Annual Report on Form 10-K for the year ended December 31, 2008 (FileNo. 1-9183))
10.11* Form of Notice of Grant of Stock Options and Option Agreement of Harley-Davidson, Inc. under the Harley-Davidson,Inc. 2009 Incentive Stock Plan (incorporated herein by reference to Exhibit 10.2 to the Registrant’s Quarterly Report onForm 10-Q for the quarter ended March 28, 2010 (File No. 1-9183))
10.12* Form of Notice of Grant of Stock Options and Option Agreement (Transition Agreement) of Harley-Davidson, Inc. underthe Harley-Davidson, Inc. 2009 Incentive Stock Plan (incorporated herein by reference to Exhibit 10.3 to the Registrant’sQuarterly Report on Form 10-Q for the quarter ended March 28, 2010 (File No. 1-9183))
10.13* Form of Notice of Special Grant of Stock Options and Option Agreement (Transition Agreement) of Harley-Davidson, Inc.under the Harley-Davidson, Inc. 2009 Incentive Stock Plan (incorporated herein by reference to Exhibit 10.4 to theRegistrant’s Quarterly Report on Form 10-Q for the quarter ended March 28, 2010 (File No. 1-9183))
* Represents a management contract or compensatory plan, contract or arrangement in which a director or named executive officer ofthe Company participated.
118

INDEX TO EXHIBITS[Items 15(a)(3) and 15(c)]
Exhibit No Description10.14* Form of Notice of Award of Restricted Stock and Restricted Stock Agreement of Harley-Davidson, Inc. under the Harley-
Davidson, Inc. 2009 Incentive Stock Plan (incorporated herein by reference to Exhibit 10.5 to the Registrant’s QuarterlyReport on Form 10-Q for the quarter ended March 28, 2010 (File No. 1-9183))
10.15* Form of Notice of Award of Restricted Stock and Restricted Stock Agreement (Transition Agreement) of Harley-Davidson,Inc. under the Harley-Davidson, Inc. 2009 Incentive Stock Plan (incorporated herein by reference to Exhibit 10.6 to theRegistrant’s Quarterly Report on Form 10-Q for the quarter ended March 28, 2010 (File No. 1-9183))
10.16* Form of Notice of Grant of Stock Appreciation Rights and Stock Appreciation Rights Agreement of Harley-Davidson, Inc.under the Harley-Davidson, Inc. 2009 Incentive Stock Plan (incorporated herein by reference to Exhibit 10.10 to theRegistrant’s Quarterly Report on Form 10-Q for the quarter ended March 28, 2010 (File No. 1-9183))
10.17* Form of Notice of Award of Restricted Stock Units and Restricted Stock Unit Agreement of Harley-Davidson, Inc. underthe Harley-Davidson, Inc. 2009 Incentive Stock Plan (incorporated herein by reference to Exhibit 10.7 to the Registrant’sQuarterly Report on Form 10-Q for the quarter ended March 28, 2010 (File No. 1-9183))
10.18* Form of Notice of Award of Restricted Stock Units and Restricted Stock Unit Agreement (Transition Agreement) ofHarley-Davidson, Inc. under the Harley-Davidson, Inc. 2009 Incentive Stock Plan (incorporated herein by reference toExhibit 10.8 to the Registrant’s Quarterly Report on Form 10-Q for the quarter ended March 28, 2010 (File No. 1-9183))
10.19* Form of Notice of Award of Restricted Stock Units and Restricted Stock Unit Agreement (International) of Harley-Davidson, Inc. under the Harley-Davidson, Inc. 2009 Incentive Stock Plan (incorporated herein by reference to Exhibit10.9 to the Registrant’s Quarterly Report on Form 10-Q for the quarter ended March 28, 2010 (File No. 1-9183))
10.20* Form of Notice of Grant of Stock Options and Option Agreement of Harley-Davidson, Inc. under the Harley-Davidson,Inc. 2009 Incentive Stock Plan to each of Messrs. Hund, Levatich, Olin and Wandell (incorporated herein by reference toExhibit 10.1 to the Registrant’s Current Report on Form 8-K dated May 1, 2009 (File No. 1-9183))
10.21* Form of Notice of Grant of Restricted Stock and Restricted Stock Agreement of Harley-Davidson, Inc. under the Harley-Davidson, Inc. 2009 Incentive Stock Plan to Mr. Hund (incorporated herein by reference to Exhibit 10.2 to the Registrant’sCurrent Report on Form 8-K dated May 1, 2009 (File No. 1-9183))
10.22* Form of Notice of Grant of Stock Options and Option Agreement of Harley-Davidson, Inc. under the Harley-Davidson Inc.1995 Stock Option Plan and the Harley-Davidson, Inc. 2004 Incentive Stock Plan (incorporated herein by reference toExhibit 10.21 to the Registrant’s Annual Report on Form 10-K for the year ended December 31, 2005 (File No. 1-9183))
10.23* Form of Notice of Special Grant of Stock Options and Option Agreement of Harley-Davidson, Inc. under the Harley-Davidson Inc. 1995 Stock Option Plan and the Harley-Davidson, Inc. 2004 Incentive Stock Plan (incorporated herein byreference to Exhibit 10.22 to the Registrant’s Annual Report on Form 10-K for the year ended December 31, 2005 (FileNo. 1-9183))
10.24* Form of Notice of Award of Restricted Stock and Restricted Stock Agreement of Harley-Davidson, Inc. under the Harley-Davidson, Inc. 2004 Incentive Stock Plan (incorporated herein by reference to Exhibit 10.1 to the Registrant’s QuarterlyReport on Form 10-Q for the quarter ended March 29, 2009 (File No. 1-9183))
10.25* Form of Notice of Special Award of Restricted Stock and Restricted Stock Agreement of Harley-Davidson, Inc. under theHarley-Davidson, Inc. 2004 Incentive Stock Plan (incorporated herein by reference to Exhibit 10.6 to the Registrant’sQuarterly Report on Form 10-Q for the quarter ended April 1, 2007 (File No. 1-9183))
10.26* Form of Notice of Award of Restricted Stock Unit and Restricted Stock Unit Agreement of Harley-Davidson, Inc. underthe Harley-Davidson, Inc. 2004 Incentive Stock Plan (incorporated herein by reference to Exhibit 10.7 to the Registrant’sQuarterly Report on Form 10-Q for the quarter ended April 1, 2007 (File No. 1-9183))
10.27* Form of Notice of Grant Award of Stock Options and Stock Option Agreement (Standard) of Harley-Davidson, Inc. underthe Harley-Davidson, Inc. 2014 Incentive Stock Plan (incorporated herein by reference to Exhibit 10.1 to the Registrant’sQuarterly Report on Form 10-Q for the quarter ended March 29, 2015 (File No. 1-9183))
* Represents a management contract or compensatory plan, contract or arrangement in which a director or named executive officer ofthe Company participated.
119

INDEX TO EXHIBITS[Items 15(a)(3) and 15(c)]
Exhibit No Description10.28* Form of Notice of Grant Award of Stock Options and Stock Option Agreement (Transition Agreement) of Harley-
Davidson, Inc. under the Harley-Davidson, Inc. 2014 Incentive Stock Plan (incorporated herein by reference to Exhibit10.2 to the Registrant’s Quarterly Report on Form 10-Q for the quarter ended March 29, 2015 (File No. 1-9183))
10.29* Form of Notice of Grant Award of Restricted Stock Units and Restricted Stock Unit Agreement (Deferred) of Harley-Davidson, Inc. under the Harley-Davidson, Inc. 2014 Incentive Stock Plan (incorporated herein by reference to Exhibit10.3 to the Registrant’s Quarterly Report on Form 10-Q for the quarter ended March 29, 2015 (File No. 1-9183))
10.30* Form of Notice of Grant Award of Restricted Stock Units and Restricted Stock Unit Agreement (International) of Harley-Davidson, Inc. under the Harley-Davidson, Inc. 2014 Incentive Stock Plan (incorporated herein by reference to Exhibit10.4 to the Registrant’s Quarterly Report on Form 10-Q for the quarter ended March 29, 2015 (File No. 1-9183))
10.31* Form of Notice of Grant Award of Restricted Stock Units and Restricted Stock Unit Agreement (Special) of Harley-Davidson, Inc. under the Harley-Davidson, Inc. 2014 Incentive Stock Plan (incorporated herein by reference to Exhibit10.5 to the Registrant’s Quarterly Report on Form 10-Q for the quarter ended March 29, 2015 (File No. 1-9183))
10.32* Form of Notice of Grant Award of Restricted Stock Units and Restricted Stock Unit Agreement (Standard) of Harley-Davidson, Inc. under the Harley-Davidson, Inc. 2014 Incentive Stock Plan (incorporated herein by reference to Exhibit10.6 to the Registrant’s Quarterly Report on Form 10-Q for the quarter ended March 29, 2015 (File No. 1-9183))
10.33* Form of Notice of Grant Award of Restricted Stock Units and Restricted Stock Unit Agreement (Transition Agreement) ofHarley-Davidson, Inc. under the Harley-Davidson, Inc. 2014 Incentive Stock Plan (incorporated herein by reference toExhibit 10.7 to the Registrant’s Quarterly Report on Form 10-Q for the quarter ended March 29, 2015 (File No. 1-9183))
10.34* Form of Notice of Grant Award of Restricted Stock Units and Restricted Stock Unit Agreement (Deferred) of Harley-Davidson, Inc. under the Harley-Davidson, Inc. 2014 Incentive Stock Plan (incorporated herein by reference to Exhibit10.8 to the Registrant’s Quarterly Report on Form 10-Q for the quarter ended March 29, 2015 (File No. 1-9183))
10.35* Form of Notice of Grant Award of Stock Appreciation Rights and Stock Appreciation Rights Agreement of Harley-Davidson, Inc. under the Harley-Davidson, Inc. 2014 Incentive Stock Plan (incorporated herein by reference to Exhibit10.9 to the Registrant’s Quarterly Report on Form 10-Q for the quarter ended March 29, 2015 (File No. 1-9183))
10.36.* Form of Severance Benefits Agreement between the Registrant and each of Messrs. Hund, Jones, Levatich and Olin(incorporated herein by reference to Exhibit 10.9 to the Registrant’s Annual Report on Form 10-K for the year endedDecember 31, 2009 (File No. 1-9183))
10.37* Form of Transition Agreement between the Registrant and each of Messrs. Levatich and Olin (incorporated herein byreference to Exhibit 10.4 to the Registrant’s Annual Report on Form 10-K for the year ended December 31, 2009 (File No.1-9183))
10.38* Transition Agreement between the Registrant and Mr. Hund dated November 30, 2009 (incorporated herein by reference toExhibit 10.5 to the Registrant’s Annual Report on Form 10-K for the year ended December 31, 2009 (File No. 1-9183))
10.39* Form of Aircraft Time Sharing Agreement between the Registrant and each of Messrs. Levatich, Olin, Jones and Hund andMadame Bischmann (incorporated herein by reference to Exhibit 10.1 to the Registrant’s Quarterly Report on Form 10-Qfor the quarter ended September 30, 2012 (File No. 1-9183))
10.40* Form of Non-competition and Non-solicitation Agreement between Harley-Davidson Canada LP, Fred Deeley ImportsLtd. and Harley-Davidson Motor Company, Inc., as amended (incorporated herein by reference to exhibit 2.1 to theRegistrant's Quarterly Report on Form 10-Q for the quarter ended June 28,2015 (File No. 1-9183))
10.41* Form of Notice of Award of Performance Shares and Performance Shares Agreement (Standard) of Harley-Davidson, Inc.under the Harley-Davidson, Inc. 2014 Incentive Stock Plan (incorporated herein by reference to Exhibit 10.43 to theRegistrant’s Annual Report on Form 10-K for the year ended December 31, 2016 (File No. 1-9183))
* Represents a management contract or compensatory plan, contract or arrangement in which a director or named executive officer ofthe Company participated.
120

Various instruments relating to the Company’s long-term debt described in this report need not be filed herewith pursuant to Item 601(b)(4)(iii)(A) of Regulation S-K. The registrant, by signing this report, agrees to furnish the Securities and Exchange Commission, upon itsrequest, with a copy of any such instrument.
INDEX TO EXHIBITS[Items 15(a)(3) and 15(c)]
Exhibit No Description10.42* Form of Notice of Award of Performance Share Units and Performance Share Unit Agreement (Standard International)
of Harley-Davidson, Inc. under the Harley-Davidson, Inc. 2014 Incentive Stock Plan (incorporated herein by reference toExhibit 10.44 to the Registrant’s Annual Report on Form 10-K for the year ended December 31, 2016 (File No. 1-9183))
10.43* Form of Notice of Award of Performance Shares and Performance Shares Agreement (Transition Agreement) of Harley-Davidson, Inc. under the Harley-Davidson, Inc. 2014 Incentive Stock Plan (incorporated herein by reference to Exhibit10.45 to the Registrant’s Annual Report on Form 10-K for the year ended December 31, 2016 (File No. 1-9183))
10.44* Harley-Davidson Retiree Insurance Allowance Plan, as amended and restated effective January 1, 2016
21 List of Subsidiaries23 Consent of Independent Registered Public Accounting Firm
31.1 Chief Executive Officer Certification pursuant to Rule 13a-14(a)31.2 Chief Financial Officer Certification pursuant to Rule 13a-14(a)32 Written Statement of the Chief Executive Officer and the Chief Financial Officer pursuant to 18 U.S.C. §1350101 Financial statements from the annual report on Form 10-K of Harley-Davidson, Inc. for the year ended December 31,
2016, filed on February 21, 2017 formatted in XBRL: (i) the Consolidated Statements of Income; (ii) the ConsolidatedStatements of Comprehensive Income; (iii) the Consolidated Balance Sheets; (iv) the Consolidated Statements of CashFlows; (v) the Consolidated Statements of Shareholders' Equity; and (vi) the Notes to Consolidated Financial Statements.
* Represents a management contract or compensatory plan, contract or arrangement in which a director or named executive officer ofthe Company participated.
121

This page intentionally left blank.

This page intentionally left blank.