UNITED STATES SECURITIES AND EXCHANGE COMMISSION/media/...UNITED STATES SECURITIES AND EXCHANGE...
53
UNITED STATES SECURITIES AND EXCHANGE COMMISSION Washington, D.C. 20549 Form 10-Q (Mark One) QUARTERLY REPORT PURSUANT TO SECTION 13 OR 15(d) OF THE SECURITIES EXCHANGE ACT OF 1934 For the quarterly period ended March 31, 2012 OR TRANSITION REPORT PURSUANT TO SECTION 13 OR 15(d) OF THE SECURITIES EXCHANGE ACT OF 1934 For the transition period from to Commission File Number: 1-5097 JOHNSON CONTROLS, INC. (Exact name of registrant as specified in its charter) Wisconsin 39-0380010 (State or Other Jurisdiction of (I.R.S. Employer Incorporation or Organization) Identification No.) 5757 North Green Bay Avenue Milwaukee, Wisconsin 53209 (Address of principal executive offices) (Zip Code) (414) 524-1200 (Registrant's telephone number, including area code) Not Applicable (Former name, former address and former fiscal year, if changed since last report) Indicate by check mark whether the registrant (1) has filed all reports required to be filed by Section 13 or 15(d) of the Securities Exchange Act of 1934 during the preceding 12 months (or for such shorter period that the registrant was required to file such reports), and (2) has been subject to such filing requirements for the past 90 days. Yes No Indicate by check mark whether the registrant has submitted electronically and posted on its corporate Web site, if any, every Interactive Data File required to be submitted and posted pursuant to Rule 405 of Regulation S-T during the preceding 12 months (or for such shorter period that the registrant was required to submit and post such files). Yes No Indicate by check mark whether the registrant is a large accelerated filer, an accelerated filer, a non-accelerated filer, or a smaller reporting company. See the definitions of “large accelerated filer,” “accelerated filer” and “smaller reporting company” in Rule 12b-2 of the Exchange Act. Large accelerated filer Accelerated filer Non-accelerated filer Smaller reporting company (Do not check if a smaller reporting company) Indicate by check mark whether the registrant is a shell company (as defined in Rule 12b-2 of the Exchange Act). Yes No Indicate the number of shares outstanding of each of the issuer's classes of common stock, as of the latest practicable date. Class Shares Outstanding at March 31, 2012 Common Stock: $0.01 7/18 par value per share 680,200,626
Transcript of UNITED STATES SECURITIES AND EXCHANGE COMMISSION/media/...UNITED STATES SECURITIES AND EXCHANGE...

UNITED STATES SECURITIES AND EXCHANGE COMMISSION Washington, D.C. 20549
Form 10-Q (Mark One)
QUARTERLY REPORT PURSUANT TO SECTION 13 OR 15(d) OF THE
SECURITIES EXCHANGE ACT OF 1934
For the quarterly period ended March 31, 2012
OR
TRANSITION REPORT PURSUANT TO SECTION 13 OR 15(d) OF THE
SECURITIES EXCHANGE ACT OF 1934
For the transition period from to
Commission File Number: 1-5097
JOHNSON CONTROLS, INC. (Exact name of registrant as specified in its charter)
Wisconsin 39-0380010 (State or Other Jurisdiction of (I.R.S. Employer Incorporation or Organization) Identification No.)
5757 North Green Bay Avenue
Milwaukee, Wisconsin 53209 (Address of principal executive offices) (Zip Code)
(414) 524-1200 (Registrant's telephone number, including area code)
Not Applicable
(Former name, former address and former fiscal year, if changed since last report)
Indicate by check mark whether the registrant (1) has filed all reports required to be filed by Section 13 or 15(d) of the
Securities Exchange Act of 1934 during the preceding 12 months (or for such shorter period that the registrant was required to file
such reports), and (2) has been subject to such filing requirements for the past 90 days. Yes No
Indicate by check mark whether the registrant has submitted electronically and posted on its corporate Web site, if any, every
Interactive Data File required to be submitted and posted pursuant to Rule 405 of Regulation S-T during the preceding 12 months
(or for such shorter period that the registrant was required to submit and post such files). Yes No
Indicate by check mark whether the registrant is a large accelerated filer, an accelerated filer, a non-accelerated filer, or a
smaller reporting company. See the definitions of “large accelerated filer,” “accelerated filer” and “smaller reporting company” in
Rule 12b-2 of the Exchange Act.
Large accelerated filer Accelerated filer Non-accelerated filer Smaller reporting company
(Do not check if a smaller reporting company)
Indicate by check mark whether the registrant is a shell company (as defined in Rule 12b-2 of the Exchange Act). Yes No
Indicate the number of shares outstanding of each of the issuer's classes of common stock, as of the latest practicable date.
Class Shares Outstanding at March 31, 2012
Common Stock: $0.01 7/18 par value per share 680,200,626

JOHNSON CONTROLS, INC.
FORM 10-Q
Report Index
2
Part I. Financial Information Page
Item 1. Financial Statements (unaudited)
Condensed Consolidated Statements of Financial Position at
March 31, 2012, September 30, 2011 and March 31, 2011 3
Consolidated Statements of Income for the
Three and Six Month Periods Ended March 31, 2012 and 2011 4
Consolidated Statements of Cash Flows for the
Three and Six Month Periods Ended March 31, 2012 and 2011 5
Notes to Condensed Consolidated Financial Statements 6
Report of Independent Registered Public Accounting Firm 30
Item 2. Management’s Discussion and Analysis of Financial Condition
and Results of Operations 31
Item 3. Quantitative and Qualitative Disclosures About Market Risk 45
Item 4. Controls and Procedures 45
Part II. Other Information
Item 1. Legal Proceedings 45
Item 1A. Risk Factors 46
Item 2. Unregistered Sales of Equity Securities and Use of Proceeds 46
Item 6. Exhibits 47
Signatures 48

3
PART I. FINANCIAL INFORMATION
ITEM 1. FINANCIAL STATEMENTS
Johnson Controls, Inc.
Condensed Consolidated Statements of Financial Position (in millions; unaudited)
March 31, September 30, March 31,
2012 2011 2011
Assets
Cash and cash equivalents $ 240 $ 257 $ 401
Accounts receivable - net 7,402 7,151 6,946
Inventories 2,374 2,316 2,239
Other current assets 2,346 2,291 2,620
Current assets 12,362 12,015 12,206
Property, plant and equipment - net 6,086 5,616 4,761
Goodwill 7,040 7,016 6,807
Other intangible assets - net 966 945 832
Investments in partially-owned affiliates 961 811 864
Other noncurrent assets 3,558 3,273 3,198
Total assets $ 30,973 $ 29,676 $ 28,668
Liabilities and Equity
Short-term debt $ 530 $ 596 $ 106
Current portion of long-term debt 148 17 53
Accounts payable 6,313 6,159 6,082
Accrued compensation and benefits 956 1,315 1,070
Other current liabilities 2,608 2,695 2,861
Current liabilities 10,555 10,782 10,172
Long-term debt 5,645 4,533 4,382
Pension, postretirement health and other benefits 782 1,102 803
Other noncurrent liabilities 1,928 1,819 1,982
Long-term liabilities 8,355 7,454 7,167
Commitments and contingencies (Note 17)
Redeemable noncontrolling interests 318 260 223
Shareholders' equity attributable to Johnson Controls, Inc. 11,595 11,042 10,976
Noncontrolling interests 150 138 130
Total equity 11,745 11,180 11,106
Total liabilities and equity $ 30,973 $ 29,676 $ 28,668
The accompanying notes are an integral part of the financial statements.

4
Johnson Controls, Inc.
Consolidated Statements of Income (in millions, except per share data; unaudited)
Three Months Ended Six Months Ended
March 31, March 31,
2012 2011 2012 2011
Net sales
Products and systems* $ 8,495 $ 8,107 $ 16,829 $ 15,702
Services* 2,070 2,037 4,153 3,979
10,565 10,144 20,982 19,681
Cost of sales
Products and systems* 7,302 6,973 14,464 13,501
Services* 1,714 1,697 3,437 3,292
9,016 8,670 17,901 16,793
Gross profit 1,549 1,474 3,081 2,888
Selling, general and administrative expenses (1,069) (1,014) (2,123) (1,961)
Net financing charges (63) (46) (112) (81)
Equity income 79 61 199 127
Income before income taxes 496 475 1,045 973
Provision for income taxes 94 90 198 185
Net income 402 385 847 788
Income attributable to noncontrolling interests 38 31 73 59
Net income attributable to Johnson Controls, Inc. $ 364 $ 354 $ 774 $ 729
Earnings per share
Basic $ 0.54 $ 0.52 $ 1.14 $ 1.08
Diluted $ 0.53 $ 0.51 $ 1.12 $ 1.06
* Products and systems consist of automotive experience and power solutions products and systems and building
efficiency installed systems. Services are building efficiency technical and global workplace solutions.
The accompanying notes are an integral part of the financial statements.

5
Johnson Controls, Inc.
Consolidated Statements of Cash Flows (in millions; unaudited)
Three Months Ended Six Months Ended
March 31, March 31,
2012 2011 2012 2011
Operating Activities
Net income attributable to Johnson Controls, Inc. $ 364 $ 354 $ 774 $ 729
Income attributable to noncontrolling interests 38 31 73 59
Net income 402 385 847 788
Adjustments to reconcile net income to
cash provided by operating activities:
Depreciation 189 173 371 331
Amortization of intangibles 11 12 25 23
Equity in earnings of partially-owned affiliates,
net of dividends received (59) (51) (161) (73)
Deferred income taxes (34) - 26 -
Impairment charges 14 - 14 -
Gain on divestitures - net (35) - (35) -
Fair value adjustment of equity investment (12) - (12) -
Equity-based compensation 16 14 35 36
Other 23 4 41 -
Changes in assets and liabilities, excluding
acquisitions and divestitures
Receivables (277) (562) (71) (515)
Inventories (74) (200) (69) (299)
Other assets (9) (87) (195) (137)
Accounts payable and accrued liabilities 167 366 (479) 56
Accrued income taxes (79) (18) (191) (81)
Cash provided by operating activities 243 36 146 129
Investing Activities
Capital expenditures (448) (275) (986) (535)
Sale of property, plant and equipment 3 7 6 18
Acquisition of businesses, net of cash acquired (19) (534) (30) (629)
Business divestitures 91 - 91 -
Settlement of cross-currency interest rate swaps (9) - (19) -
Changes in long-term investments 2 (38) (98) (50)
Warrant redemption - - 25 -
Cash used by investing activities (380) (840) (1,011) (1,196)
Financing Activities
Increase (decrease) in short-term debt - net 186 (89) (98) 13
Increase in long-term debt 136 1,732 1,235 1,735
Repayment of long-term debt (9) (667) (16) (759)
Stock repurchases (33) - (33) -
Payment of cash dividends (123) (109) (232) (196)
Proceeds from the exercise of stock options 16 24 21 85
Settlement of interest rate swaps - - - 24
Cash paid to acquire a noncontrolling interest (9) - (19) -
Other (8) (3) (21) (8)
Cash provided by financing activities 156 888 837 894
Effect of exchange rate changes on cash and cash equivalents (20) (4) 11 14
Increase (decrease) in cash and cash equivalents (1) 80 (17) (159)
Cash and cash equivalents at beginning of period 241 321 257 560
Cash and cash equivalents at end of period $ 240 $ 401 $ 240 $ 401
The accompanying notes are an integral part of the financial statements.

Johnson Controls, Inc.
Notes to Condensed Consolidated Financial Statements
March 31, 2012
(unaudited)
6
1. Financial Statements
In the opinion of management, the accompanying unaudited condensed consolidated financial statements contain all
adjustments (which include normal recurring adjustments) necessary to present fairly the financial position, results
of operations and cash flows for the periods presented. Certain information and footnote disclosures normally
included in financial statements prepared in accordance with accounting principles generally accepted in the United
States of America (U.S. GAAP) have been condensed or omitted pursuant to the rules and regulations of the United
States Securities and Exchange Commission (SEC). These condensed consolidated financial statements should be
read in conjunction with the audited financial statements and notes thereto included in the Johnson Controls, Inc.
(the “Company”) Annual Report on Form 10-K for the year ended September 30, 2011. The results of operations for
the three and six month periods ended March 31, 2012 are not necessarily indicative of results for the Company's
2012 fiscal year because of seasonal and other factors.
Certain amounts as of March 31, 2011 have been revised to conform to the current year’s presentation. Recoverable
customer engineering expenditures are included in the changes in other assets line within the operating activities
section of the consolidated statements of cash flows. In prior years, these cash flows were included in the investing
activities section. Also, the long-term portion of pension liabilities is now reclassified into the pension,
postretirement health and other benefits line within the long-term liabilities section of the condensed consolidated
statements of financial position. In prior years, these liabilities were included in the other noncurrent liabilities line.
The consolidated financial statements include the accounts of Johnson Controls, Inc. and its domestic and non-U.S.
subsidiaries that are consolidated in conformity with U.S. GAAP. All significant intercompany transactions have
been eliminated. Investments in partially-owned affiliates are accounted for by the equity method when the
Company’s interest exceeds 20% and the Company does not have a controlling interest.
Under certain criteria as provided for in Financial Accounting Standards Board (FASB) Accounting Standards
Codification (ASC) 810, “Consolidation,” the Company may consolidate a partially-owned affiliate. To determine
whether to consolidate a partially-owned affiliate, the Company first determines if the entity is a variable interest
entity (“VIE”). An entity is considered to be a VIE if it has one of the following characteristics: 1) the entity is thinly
capitalized; 2) residual equity holders do not control the entity; 3) equity holders are shielded from economic losses
or do not participate fully in the entity’s residual economics; or 4) the entity was established with non-substantive
voting. If the entity meets one of these characteristics, the Company then determines if it is the primary beneficiary
of the VIE. The party with the power to direct activities of the VIE that most significantly impact the VIE’s
economic performance and the potential to absorb benefits or losses that could be significant to the VIE is
considered the primary beneficiary and consolidates the VIE. If the entity is not considered a VIE, then the
Company applies the voting interest model to determine whether or not the Company shall consolidate the partially-
owned affiliate.
Consolidated VIEs
Based upon the criteria set forth in ASC 810, the Company has determined that it was the primary beneficiary in
three VIEs for the reporting period ended March 31, 2012 and two VIEs for the reporting periods ended September
30, 2011 and March 31, 2011, as the Company absorbs significant economics of the entities and has the power to
direct the activities that are considered most significant to the entities.
Two of the VIEs manufacture products in North America for the automotive industry. The Company funds the
entities’ short term liquidity needs through revolving credit facilities and has the power to direct the activities that
are considered most significant to the entities through its key customer supply relationships.
During the three month period ended December 31, 2011, a pre-existing VIE accounted for under the equity method
was reorganized into three separate investments as a result of the counterparty exercising its option to put its interest
to the Company. The Company acquired additional interests in two of the reorganized group entities. The
reorganized group entities are considered to be VIEs as the other owner party has been provided decision making
rights but does not have equity at risk. The Company is considered the primary beneficiary of one of the entities due

Johnson Controls, Inc.
Notes to Condensed Consolidated Financial Statements
March 31, 2012
(unaudited)
7
to the Company’s power pertaining to decisions over significant activities of the entity. As such, the VIE has been
consolidated within the Company’s condensed consolidated statement of financial position. The impact of the
consolidation of the entity on the Company’s consolidated statements of income for the three and six month periods
ended March 31, 2012 was not material. The VIE is named as a co-obligor under a third party debt agreement of
$135 million, maturing in fiscal 2019, in which it could become subject to paying more than its allocated share of
the third party debt in the event of bankruptcy of one or more of the other co-obligors. The other co-obligors, all
related parties in which the Company is an equity investor, consist of the remaining group entities involved in the
reorganization. As part of the overall reorganization transaction, the Company has also provided financial support to
the group entities in the form of loans totaling $101 million, which are subordinate to the third party debt agreement.
The Company is a significant customer of certain co-obligors, resulting in a remote possibility of loss. Additionally,
the Company is subject to a floor guaranty expiring in fiscal 2022; in the event that the other owner party no longer
owns any part of the group entities due to sale or transfer, the Company has guaranteed that the proceeds received
from the sale or transfer will not be less than $25 million. The Company has partnered with the group entities to
design and manufacture battery components for the power solutions business.
The carrying amounts and classification of assets (none of which are restricted) and liabilities included in the
Company’s condensed consolidated statements of financial position for the consolidated VIEs are as follows (in
millions):
March 31, September 30, March 31,
2012 2011 2011
Current assets $ 218 $ 207 $ 227
Noncurrent assets 168 55 62
Total assets $ 386 $ 262 $ 289
Current liabilities $ 151 $ 144 $ 175
Noncurrent liabilities 41 - -
Total liabilities $ 192 $ 144 $ 175
Nonconsolidated VIEs
During the three month period ended June 30, 2011, the Company acquired a 40% interest in an equity method
investee. The investee produces and sells lead-acid batteries of which the Company will both purchase and supply
certain batteries to complement each investment partners’ portfolio. Commencing on the third anniversary of the
closing date, the Company has a contractual right to purchase the remaining 60% equity interest in the investee (the
“call option”). If the Company does not exercise the call option on or before the fifth anniversary of the closing date,
for a period of six months thereafter the Company is subject to a contractual obligation at the counterparty’s option
to sell the Company’s equity investment in the investee to the counterparty (the “repurchase option”). The purchase
price is fixed under both the call option and the repurchase option. Based upon the criteria set forth in ASC 810, the
Company has determined that the investee is a VIE as the equity holders, through their equity investments, may not
participate fully in the entity’s residual economics. The Company is not the primary beneficiary as the Company
does not have the power to make key operating decisions considered to be most significant to the VIE. Therefore,
the investee is accounted for under the equity method of accounting as the Company’s interest exceeds 20% and the
Company does not have a controlling interest. The investment balance included within investments in partially-
owned affiliates in the condensed consolidated statements of financial position at March 31, 2012 and September 30,
2011 was $52 million and $49 million, respectively, which represents the Company’s maximum exposure to loss.
Current assets and liabilities related to the VIE are immaterial and represent normal course of business trade
receivables and payables for all presented periods.
As mentioned previously within the “Consolidated VIEs” section above, during the three month period ended
December 31, 2011, a pre-existing VIE was reorganized into three separate investments as a result of the
counterparty exercising its option to put its interest to the Company. The reorganized group entities are considered
to be VIEs as the other owner party has been provided decision making rights but does not have equity at risk. The

Johnson Controls, Inc.
Notes to Condensed Consolidated Financial Statements
March 31, 2012
(unaudited)
8
Company is not considered to be the primary beneficiary of two of the entities as the Company cannot make key
operating decisions considered to be most significant to the VIEs. Therefore, the entities are accounted for under the
equity method of accounting as the Company’s interest exceeds 20% and the Company does not have a controlling
interest. The Company’s maximum exposure to loss, which included the partially-owned affiliate investment
balance and a note receivable, approximated $43 million and $42 million at September 30, 2011 and March 31,
2011, respectively. The Company’s maximum exposure to loss at March 31, 2012 includes the partially-owned
affiliate investment balance of $39 million as well as the subordinated loan from the Company, third party debt
agreement and floor guaranty mentioned previously within the “Consolidated VIEs” section above. Current
liabilities due to the VIEs are not material and represent normal course of business trade payables for all presented
periods.
The Company did not have a significant variable interest in any other unconsolidated VIEs for the presented
reporting periods.
2. New Accounting Standards
In December 2011, the FASB issued Accounting Standards Update (ASU) No. 2011-11, “Balance Sheet (Topic
210): Disclosures about Offsetting Assets and Liabilities.” ASU No. 2011-11 requires additional quantitative and
qualitative disclosures of gross and net information regarding financial instruments and derivative instruments that
are offset or eligible for offset in the consolidated statement of financial position. ASU No. 2011-11 will be effective
for the Company for the quarter ending December 31, 2013. The adoption of this guidance will have no impact on
the Company’s consolidated financial condition and results of operations.
In September 2011, the FASB issued ASU No. 2011-09, “Compensation – Retirement Benefits – Multiemployer
Plans (Subtopic 715-80): Disclosures about an Employer’s Participation in a Multiemployer Plan.” ASU No. 2011-
09 requires additional quantitative and qualitative disclosures about an employer’s participation in multiemployer
pension plans, including disclosure of the name and identifying number of the significant multiemployer plans in
which the employer participates, the level of the employer’s participation in the plans, the financial health of the
plans and the nature of the employer commitments to the plans. ASU No. 2011-09 will be effective for the Company
for the fiscal year ending September 30, 2012. The adoption of this guidance will have no impact on the Company’s
consolidated financial condition and results of operations.
In September 2011, the FASB issued ASU No. 2011-08, “Intangibles – Goodwill and Other (Topic 350): Testing
Goodwill for Impairment.” ASU No. 2011-08 provides companies an option to perform a qualitative assessment to
determine whether further goodwill impairment testing is necessary. If, as a result of the qualitative assessment, it is
determined that it is more likely than not that a reporting unit’s fair value is less than its carrying amount, the two-
step quantitative impairment test is required. Otherwise, no further testing is required. ASU No. 2011-08 will be
effective for the Company for goodwill impairment tests performed in the fiscal year ending September 30, 2013,
with early adoption permitted. The adoption of this guidance will have no impact on the Company’s consolidated
financial condition and results of operations.
In June 2011, the FASB issued ASU No. 2011-05, “Comprehensive Income (Topic 220): Presentation of
Comprehensive Income.” ASU No. 2011-05 eliminates the option to present components of other comprehensive
income as part of the statement of shareholders’ equity. All non-owner changes in shareholders’ equity instead must
be presented either in a single continuous statement of comprehensive income or in two separate but consecutive
statements. ASU No. 2011-05 will be effective for the Company for the quarter ending December 31, 2012. The
adoption of this guidance will have no impact on the Company’s consolidated financial condition and results of
operations.
In May 2011, the FASB issued ASU No. 2011-04, “Fair Value Measurement (Topic 820): Amendments to Achieve
Common Fair Value Measurement and Disclosure Requirements in U.S. GAAP and IFRSs.” ASU No. 2011-04
clarifies and changes the application of various fair value measurement principles and disclosure requirements, and
was effective for the Company beginning in the second quarter of fiscal 2012 (January 1, 2012). The adoption of this
guidance had no impact on the Company’s consolidated financial condition and results of operations. Refer to Note

Johnson Controls, Inc.
Notes to Condensed Consolidated Financial Statements
March 31, 2012
(unaudited)
9
14, “Fair Value Measurements,” of the notes to condensed consolidated financial statements for disclosures
surrounding the Company’s fair value measurements.
3. Acquisitions and Divestitures
In the first six months of fiscal 2012, the Company completed three acquisitions for a combined purchase price, net
of cash acquired, of $38 million, all of which was paid in the six months ended March 31, 2012. The acquisitions in
the aggregate were not material to the Company’s consolidated financial statements. In connection with the
acquisitions, the Company recorded goodwill of $71 million. The purchase price allocation may be subsequently
adjusted to reflect final valuation studies. As a result of two of the acquisitions, which increased the Company’s
ownership from a noncontrolling to controlling interest, the Company recorded a non-cash gain of $12 million, of
which $9 million was recorded within power solutions equity income and $3 million was recorded in automotive
experience Europe equity income, to adjust the Company’s existing equity investments in the partially-owned
affiliates to fair value.
In the first six months of fiscal 2012, the Company adjusted the purchase price allocation of certain fiscal 2011
acquisitions. The adjustments were as a result of a true-up to the purchase price in the amount of $8 million, for
which the cash was received in the first quarter of fiscal 2012. Also, in connection with these acquisitions, the
Company recorded a reduction in goodwill of $1 million in fiscal 2012 related to the purchase price allocations. The
purchase price allocations may be subsequently adjusted to reflect final valuation studies.
In the second quarter of fiscal 2012, the Company completed two divestitures for a combined sales price of $91
million, all of which was received in the three months ended March 31, 2012. The divestitures in the aggregate were
not material to the Company’s consolidated financial statements. In connection with the divestitures, the Company
recorded a gain, net of transaction costs, of $35 million and reduced goodwill by $29 million in the building
efficiency business.
During the second quarter of fiscal 2011, the Company completed its acquisition of the C. Rob. Hammerstein Group
(Hammerstein), a leading global supplier of high-quality metal seat structures, components and mechanisms based
in Solingen, Germany. The total purchase price, net of cash acquired, was approximately $529 million, of which
$521 million was paid during the three months ended March 31, 2011. In connection with the Hammerstein
acquisition, the Company recorded goodwill of $200 million primarily in the automotive experience Europe
segment.
In the first six months of fiscal 2011, the Company completed three additional acquisitions for a combined purchase
price, net of cash acquired, of $80 million, of which $108 million was paid in the six months ended March 31, 2011
prior to purchase price true-ups from the seller. The acquisitions in the aggregate were not material to the
Company’s consolidated financial statements. In connection with the acquisitions, the Company recorded goodwill
of $73 million, of which $14 million was recorded in fiscal 2012.
There were no business divestitures for the six months ended March 31, 2011.
4. Percentage-of-Completion Contracts
The building efficiency business records certain long-term contracts under the percentage-of-completion method of
accounting. Under this method, sales and gross profit are recognized as work is performed based on the relationship
between actual costs incurred and total estimated costs at completion. The Company records costs and earnings in
excess of billings on uncompleted contracts within accounts receivable – net and billings in excess of costs and
earnings on uncompleted contracts within other current liabilities in the condensed consolidated statements of
financial position. Amounts included within accounts receivable – net related to these contracts were $848 million,
$773 million and $738 million at March 31, 2012, September 30, 2011 and March 31, 2011, respectively. Amounts
included within other current liabilities were $736 million, $730 million and $747 million at March 31, 2012,
September 30, 2011 and March 31, 2011, respectively.

Johnson Controls, Inc.
Notes to Condensed Consolidated Financial Statements
March 31, 2012
(unaudited)
10
5. Inventories
Inventories consisted of the following (in millions):
March 31, September 30, March 31,
2012 2011 2011
Raw materials and supplies $ 1,175 $ 1,136 $ 1,100
Work-in-process 457 434 332
Finished goods 863 867 941
FIFO inventories 2,495 2,437 2,373
LIFO reserve (121) (121) (134)
Inventories $ 2,374 $ 2,316 $ 2,239
6. Goodwill and Other Intangible Assets
The changes in the carrying amount of goodwill in each of the Company’s reporting segments for the six month
period ended September 30, 2011 and the six month period ended March 31, 2012 were as follows (in millions):
Currency
March 31, Business Business Translation September 30,
2011 Acquisitions Divestitures and Other 2011
Building efficiency
North America systems $ 519 $ - $ - $ - $ 519
North America service 676 33 - 1 710
Global workplace solutions 184 - - - 184
Asia 385 - - 6 391
Other 1,108 - - (43) 1,065
Automotive experience
North America 1,382 - - (3) 1,379
Europe 1,388 166 - (51) 1,503
Asia 236 16 - 9 261
Power solutions 929 93 - (18) 1,004
Total $ 6,807 $ 308 $ - $ (99) $ 7,016
Currency
September 30, Business Business Translation March 31,
2011 Acquisitions Divestitures and Other 2012
Building efficiency
North America systems $ 519 $ - $ - $ 1 $ 520
North America service 710 - (2) - 708
Global workplace solutions 184 - - 2 186
Asia 391 - - - 391
Other 1,065 - (27) (4) 1,034
Automotive experience
North America 1,379 2 - - 1,381
Europe 1,503 9 - (28) 1,484
Asia 261 2 - (2) 261
Power solutions 1,004 71 - - 1,075
Total $ 7,016 $ 84 $ (29) $ (31) $ 7,040

Johnson Controls, Inc.
Notes to Condensed Consolidated Financial Statements
March 31, 2012
(unaudited)
11
The Company's other intangible assets, primarily from business acquisitions, were valued based on independent
appraisals and consisted of (in millions):
March 31, 2012 September 30, 2011 March 31, 2011
Gross
Carrying
Amount
Accumulated
Amortization Net
Gross
Carrying
Amount
Accumulated
Amortization Net
Gross
Carrying
Amount
Accumulated
Amortization Net
Amortized intangible assets
Patented technology $ 193 $ (107) $ 86 $ 298 $ (209) $ 89 $ 285 $ (208) $ 77
Customer relationships 511 (101) 410 487 (91) 396 446 (79) 367
Miscellaneous 194 (39) 155 184 (38) 146 106 (35) 71
Total amortized
intangible assets 898 (247) 651 969 (338) 631 837 (322) 515
Unamortized intangible assets
Trademarks 315 - 315 314 - 314 317 - 317
Total intangible assets $ 1,213 $ (247) $ 966 $ 1,283 $ (338) $ 945 $ 1,154 $ (322) $ 832
Amortization of other intangible assets for the three month periods ended March 31, 2012 and 2011 was $11 million
and $12 million, respectively. Amortization of other intangible assets for the six month periods ended March 31,
2012 and 2011 was $25 million and $23 million, respectively. Excluding the impact of any future acquisitions, the
Company anticipates amortization for fiscal 2013, 2014, 2015, 2016 and 2017 will be approximately $59 million,
$57 million, $54 million, $48 million and $47 million per year, respectively.
7. Product Warranties
The Company offers warranties to its customers depending upon the specific product and terms of the customer
purchase agreement. A typical warranty program requires that the Company replace defective products within a
specified time period from the date of sale. The Company records an estimate for future warranty-related costs based
on actual historical return rates and other known factors. Based on analysis of return rates and other factors, the
adequacy of the Company’s warranty provisions are adjusted as necessary. The Company monitors its warranty
activity and adjusts its reserve estimates when it is probable that future warranty costs will be different than those
estimates.
The Company’s product warranty liability is recorded in the condensed consolidated statements of financial position
in other current liabilities if the warranty is less than one year and in other noncurrent liabilities if the warranty
extends longer than one year.
The changes in the carrying amount of the Company’s total product warranty liability for the six months ended
March 31, 2012 and 2011 were as follows (in millions):
Six Months Ended
March 31,
2012 2011
Balance at beginning of period $ 301 $ 337
Accruals for warranties issued during the period 97 107
Accruals from acquisitions and divestitures (1) -
Accruals related to pre-existing warranties (including changes in estimates) (17) (6)
Settlements made (in cash or in kind) during the period (84) (110)
Currency translation (1) 1
Balance at end of period $ 295 $ 329

Johnson Controls, Inc.
Notes to Condensed Consolidated Financial Statements
March 31, 2012
(unaudited)
12
8. Income Taxes
The Company’s income tax provision for the three and six months ended March 31, 2012 and 2011 is as follows (in
millions):
Three Months Ended Six Months Ended
March 31, March 31,
2012 2011 2012 2011
Federal, state and foreign income tax
expense at annual effective rate $ 94 $ 90 $ 198 $ 185
Effective Tax Rate
In calculating the provision for income taxes, the Company uses an estimate of the annual effective tax rate based
upon the facts and circumstances known at each interim period. On a quarterly basis, the actual effective tax rate is
adjusted, as appropriate, based upon changed facts and circumstances, if any, as compared to those forecasted at the
beginning of the fiscal year and each interim period thereafter. For the three and six months ended March 31, 2012,
the Company’s estimated annual effective income tax rate from continuing operations is 19%, consistent with the
prior year rate of 19%.
Valuation Allowance
The Company reviews the realizability of its deferred tax assets on a quarterly basis, or whenever events or changes
in circumstances indicate that a review is required. In determining the requirement for a valuation allowance, the
historical and projected financial results of the legal entity or consolidated group recording the net deferred tax asset
are considered, along with any other positive or negative evidence. Since future financial results may differ from
previous estimates, periodic adjustments to the Company's valuation allowances may be necessary.
It is reasonably possible that over the next twelve months, valuation allowances against deferred tax assets in certain
jurisdictions may result in a net adjustment to tax expense of up to $50 million.
Uncertain Tax Positions
At September 30, 2011, the Company had gross tax effected unrecognized tax benefits of $1,357 million of which
$1,164 million, if recognized, would impact the effective tax rate. Total net accrued interest at September 30, 2011
was approximately $77 million (net of tax benefit). The net change in interest and penalties during the six months
ended March 31, 2012 was $9 million, and for the same period in fiscal 2011 was $17 million. The Company
recognizes interest and penalties related to unrecognized tax benefits as a component of income tax expense.

Johnson Controls, Inc.
Notes to Condensed Consolidated Financial Statements
March 31, 2012
(unaudited)
13
The Company is subject to income taxes in the U.S. and numerous foreign jurisdictions. Judgment is required in
determining its worldwide provision for income taxes and recording the related assets and liabilities. In the ordinary
course of the Company’s business, there are many transactions and calculations where the ultimate tax
determination is uncertain. The Company is regularly under audit by tax authorities, including major jurisdictions
noted below:
Tax Statute of
Jurisdiction Limitations
Austria 5 years
Belgium 3 years
Brazil 5 years
Canada 5 years
China 3 to 5 years
Czech Republic 3 years
France 3 years
Germany 4 to 5 years
Italy 4 years
Japan 5 to 7 years
Mexico 5 years
Poland 5 years
Spain 4 years
United Kingdom 4 years
United States - Federal 3 years
United States - State 3 to 5 years
In the U.S., the fiscal years 2007 through 2009 are currently under exam by the Internal Revenue Service (IRS) and
2004 through 2006 are currently under IRS Appeals. Additionally, the Company is currently under exam in the
following major foreign jurisdictions: Tax Jurisdiction Tax Years Covered
Austria 2005 - 2008
Brazil 2004 - 2008
Canada 2007 - 2008
Czech Republic 2007 - 2009
France 2002 - 2010
Germany 2001 - 2010
Italy 2005 - 2009
Mexico 2003 - 2004
Spain 2006 - 2008
It is reasonably possible that certain tax examinations, appellate proceedings and/or tax litigation will conclude
within the next twelve months, the impact of which could be up to a $50 million adjustment to tax expense.
Impacts of Tax Legislation
During the six month period ended March 31, 2012, tax legislation was adopted in Japan which reduces its income
tax rate by 5%, the effect of which is not material to the Company’s consolidated financial statements. Also, tax
legislation was adopted in various jurisdictions to limit the annual utilization of tax losses that are carried forward.

Johnson Controls, Inc.
Notes to Condensed Consolidated Financial Statements
March 31, 2012
(unaudited)
14
These law changes will not have a material impact on the Company’s consolidated financial statements. Other tax
legislation was adopted in various jurisdictions during the six months ended March 31, 2012. These changes will not
have a material impact on the Company’s consolidated financial statements.
9. Retirement Plans
The components of the Company’s net periodic benefit costs associated with its defined benefit pension plans and
other postretirement health and other benefits are shown in the tables below in accordance with ASC 715,
“Compensation – Retirement Benefits” (in millions):
U.S. Pension Plans
Three Months Ended Six Months Ended
March 31, March 31,
2012 2011 2012 2011
Service cost $ 17 $ 17 $ 34 $ 33
Interest cost 37 36 75 72
Expected return on plan assets (56) (52) (112) (104)
Amortization of net actuarial loss 21 14 42 28
Amortization of prior service cost 1 - 1 -
Net periodic benefit cost $ 20 $ 15 $ 40 $ 29
Non-U.S. Pension Plans
Three Months Ended Six Months Ended
March 31, March 31,
2012 2011 2012 2011
Service cost $ 8 $ 8 $ 17 $ 17
Interest cost 18 17 36 34
Expected return on plan assets (18) (20) (37) (38)
Amortization of net actuarial loss 4 2 9 6
Amortization of prior service cost (credit) (1) 1 (1) 1
Curtailment gain - (6) - (19)
Net periodic benefit cost $ 11 $ 2 $ 24 $ 1
Postretirement Health and Other Benefits
Three Months Ended Six Months Ended
March 31, March 31,
2012 2011 2012 2011
Service cost $ 1 $ 1 $ 2 $ 2
Interest cost 4 4 7 7
Expected return on plan assets (3) - (6) -
Amortization of net actuarial loss 1 - 1 1
Amortization of prior service credit (5) (5) (9) (9)
Net periodic benefit cost (credit) $ (2) $ - $ (5) $ 1

Johnson Controls, Inc.
Notes to Condensed Consolidated Financial Statements
March 31, 2012
(unaudited)
15
10. Debt and Financing Arrangements
During the quarter ended March 31, 2012, the Company remarketed $46 million aggregate principal amount of
11.5% subordinated notes due in fiscal 2042, on behalf of holders of Corporate Units and holders of separate notes,
by issuing $46 million aggregate principal amount of 2.355% senior notes due on March 31, 2017.
During the quarter ended December 31, 2011, the Company issued $400 million aggregate principal amount of 2.6%
senior unsecured fixed rate notes due in fiscal 2017, $450 million aggregate principal amount of 3.75% senior
unsecured fixed rate notes due in fiscal 2022 and $250 million aggregate principal amount of 5.25% senior
unsecured fixed rate notes due in fiscal 2042. Aggregate net proceeds of $1.1 billion from the issuances were used
for general corporate purposes, including the retirement of short-term debt and contributions to the Company’s
pension and postretirement health plans.
During the quarter ended December 31, 2011, the Company entered into two committed, one-year revolving credit
facilities totaling $135 million in aggregate. There have been no draws on either facility during fiscal 2012.
During the quarter ended December 31, 2011, the Company entered into a five-year, 75 million euro, floating rate
credit facility scheduled to mature in fiscal 2017. The Company drew on the credit facility during the quarter ended
March 31, 2012. Proceeds from the facility were used for general corporate purposes.
During the quarter ended March 31, 2011, the Company replaced its $2.05 billion committed five-year credit
facility, scheduled to mature in December 2011, with a $2.5 billion committed four-year credit facility scheduled to
mature in February 2015. The facility is used to support the Company’s outstanding commercial paper. There were
no draws on the facility in fiscal 2012 or 2011.
During the quarter ended March 31, 2011, the Company issued $350 million aggregate principal amount of floating
rate senior unsecured notes due in fiscal 2014, $450 million aggregate principal amount of 1.75% senior unsecured
fixed rate notes due in fiscal 2014, $500 million aggregate principal amount of 4.25% senior unsecured fixed rate
notes due in fiscal 2021 and $300 million aggregate principal amount of 5.70% senior unsecured fixed rate notes due
in fiscal 2041. Aggregate net proceeds of $1.6 billion from the issues were used for general corporate purposes
including the retirement of short-term debt.
During the quarter ended March 31, 2011, the Company entered into a six-year, 100 million euro, floating rate loan
scheduled to mature in February 2017. Proceeds from the facility were used for general corporate purposes.
During the quarter ended March 31, 2011, the Company retired $654 million in principal amount, plus accrued
interest, of its 5.25% fixed rate notes that matured on January 15, 2011. The Company used cash to fund the
payment.
During the quarter ended March 31, 2011, the Company retired its $100 million committed revolving facility prior
to its scheduled maturity date of December 2011. There were no draws on the facility.
During the quarter ended December 31, 2010, the Company repaid debt of $82 million which was acquired as part
of an acquisition in the same quarter. The Company used cash to repay the debt.

Johnson Controls, Inc.
Notes to Condensed Consolidated Financial Statements
March 31, 2012
(unaudited)
16
11. Earnings Per Share
The Company presents both basic and diluted earnings per share (EPS) amounts. Basic EPS is calculated by
dividing net income attributable to Johnson Controls, Inc. by the weighted average number of common shares
outstanding during the reporting period. Diluted EPS is calculated by dividing net income attributable to Johnson
Controls, Inc. by the weighted average number of common shares and common equivalent shares outstanding during
the reporting period that are calculated using the treasury stock method for stock options. The treasury stock method
assumes that the Company uses the proceeds from the exercise of awards to repurchase common stock at the
average market price during the period. The assumed proceeds under the treasury stock method include the purchase
price that the grantee will pay in the future, compensation cost for future service that the Company has not yet
recognized and any windfall tax benefits that would be credited to capital in excess of par value when the award
generates a tax deduction. If there would be a shortfall resulting in a charge to capital in excess of par value, such an
amount would be a reduction of the proceeds.
The Company’s outstanding Equity Units due 2042 and 6.5% convertible senior notes due 2012 are reflected in
diluted earnings per share using the “if-converted” method. Under this method, if dilutive, the common stock is
assumed issued as of the beginning of the reporting period and included in calculating diluted earnings per share. In
addition, if dilutive, interest expense, net of tax, related to the outstanding Equity Units and convertible senior notes
is added back to the numerator in calculating diluted earnings per share.
The following table reconciles the numerators and denominators used to calculate basic and diluted earnings per
share (in millions):
Three Months Ended Six Months Ended
March 31, March 31,
2012 2011 2012 2011
Income Available to Common Shareholders
Basic income available to common shareholders $ 364 $ 354 $ 774 $ 729
Interest expense, net of tax - 1 1 2
Diluted income available to common shareholders $ 364 $ 355 $ 775 $ 731
Weighted Average Shares Outstanding
Basic weighted average shares outstanding 680.0 677.3 679.9 676.3
Effect of dilutive securities:
Stock options 6.2 9.2 5.9 8.6
Equity units 3.7 4.5 3.7 4.5
Convertible senior notes - - - -
Diluted weighted average shares outstanding 689.9 691.0 689.5 689.4
Antidilutive Securities
Options to purchase common shares 0.6 - 0.6 -
During the three months ended March 31, 2012 and 2011, the Company declared a dividend of $0.18 and $0.16,
respectively, per common share. During the six months ended March 31, 2012 and 2011, the Company declared two
quarterly dividends totaling $0.36 and $0.32, respectively, per common share. The Company paid all dividends in
the month subsequent to the end of each fiscal quarter.

Johnson Controls, Inc.
Notes to Condensed Consolidated Financial Statements
March 31, 2012
(unaudited)
17
12. Equity and Noncontrolling Interests
The following schedules present changes in consolidated equity attributable to Johnson Controls, Inc. and
noncontrolling interests (in millions):
Three Months Ended March 31, 2012 Three Months Ended March 31, 2011
Equity
Attributable to
Johnson
Controls, Inc.
Equity
Attributable to
Noncontrolling
Interests Total Equity
Equity
Attributable to
Johnson
Controls, Inc.
Equity
Attributable to
Noncontrolling
Interests Total Equity
Beginning balance, December 31 $ 11,137 $ 141 $ 11,278 $ 10,431 $ 117 $ 10,548
Total comprehensive income:
Net income 364 13 377 354 16 370
Foreign currency translation adjustments 175 (2) 173 199 - 199
Realized and unrealized gains (losses)
on derivatives 19 - 19 (3) - (3)
Unrealized gains
on marketable common stock 11 - 11 2 - 2
Employee retirement plans 12 - 12 63 - 63
Other comprehensive income (loss) 217 (2) 215 261 - 261
Comprehensive income 581 11 592 615 16 631
Other changes in equity:
Cash dividends -
common stock (123) - (123) (109) - (109)
Dividends attributable to
noncontrolling interests - (6) (6) - (3) (3)
Redemption value adjustment attributable
to redeemable noncontrolling interests 6 - 6 1 - 1
Repurchases of common stock (33) - (33) - - -
Other, including options exercised 27 4 31 38 - 38
Ending balance, March 31 $ 11,595 $ 150 $ 11,745 $ 10,976 $ 130 $ 11,106

Johnson Controls, Inc.
Notes to Condensed Consolidated Financial Statements
March 31, 2012
(unaudited)
18
Six Months Ended March 31, 2012 Six Months Ended March 31, 2011
Equity
Attributable to
Johnson
Controls, Inc.
Equity
Attributable to
Noncontrolling
Interests Total Equity
Equity
Attributable to
Johnson
Controls, Inc.
Equity
Attributable to
Noncontrolling
Interests Total Equity
Beginning balance, September 30 $ 11,042 $ 138 $ 11,180 $ 10,071 $ 106 $ 10,177
Total comprehensive income:
Net income 774 28 802 729 31 760
Foreign currency translation adjustments (53) (1) (54) 170 1 171
Realized and unrealized gains
on derivatives 29 - 29 2 - 2
Unrealized gains
on marketable common stock 8 - 8 7 - 7
Employee retirement plans 29 - 29 71 - 71
Other comprehensive income (loss) 13 (1) 12 250 1 251
Comprehensive income 787 27 814 979 32 1,011
Other changes in equity:
Cash dividends -
common stock (246) - (246) (217) - (217)
Dividends attributable to
noncontrolling interests - (15) (15) - (8) (8)
Redemption value adjustment attributable
to redeemable noncontrolling interests 1 - 1 5 - 5
Repurchases of common stock (33) - (33) - - -
Other, including options exercised 44 - 44 138 - 138
Ending balance, March 31 $ 11,595 $ 150 $ 11,745 $ 10,976 $ 130 $ 11,106
The Company consolidates certain subsidiaries in which the noncontrolling interest party has within their control the
right to require the Company to redeem all or a portion of its interest in the subsidiary. The redeemable
noncontrolling interests are reported at their estimated redemption value. Any adjustment to the redemption value
impacts retained earnings but does not impact net income. Redeemable noncontrolling interests which are
redeemable only upon future events, the occurrence of which is not currently probable, are recorded at carrying
value.
The following schedules present changes in the redeemable noncontrolling interests (in millions):
Three Months Ended Three Months Ended
March 31, 2012 March 31, 2011
Beginning balance, December 31 $ 282 $ 204
Net income 25 15
Foreign currency translation adjustments 1 5
Dividends (1) -
Redemption value adjustment (6) (1)
Change in noncontrolling interest share 17 -
Ending balance, March 31 $ 318 $ 223

Johnson Controls, Inc.
Notes to Condensed Consolidated Financial Statements
March 31, 2012
(unaudited)
19
Six Months Ended Six Months Ended
March 31, 2012 March 31, 2011
Beginning balance, September 30 $ 260 $ 196
Net income 45 28
Foreign currency translation adjustments - 4
Dividends (9) -
Redemption value adjustment (1) (5)
Change in noncontrolling interest share 23 -
Ending balance, March 31 $ 318 $ 223
13. Derivative Instruments and Hedging Activities
The Company selectively uses derivative instruments to reduce market risk associated with changes in foreign
currency, commodities, stock-based compensation liabilities and interest rates. Under Company policy, the use of
derivatives is restricted to those intended for hedging purposes; the use of any derivative instrument for speculative
purposes is strictly prohibited. A description of each type of derivative utilized by the Company to manage risk is
included in the following paragraphs. In addition, refer to Note 14, “Fair Value Measurements,” of the notes to
condensed consolidated financial statements for information related to the fair value measurements and valuation
methods utilized by the Company for each derivative type.
The Company has global operations and participates in the foreign exchange markets to minimize its risk of loss
from fluctuations in foreign currency exchange rates. The Company primarily uses foreign currency exchange
contracts to hedge certain of its foreign exchange rate exposures. The Company hedges 70% to 90% of the nominal
amount of each of its known foreign exchange transactional exposures.
The Company has entered into cross-currency interest rate swaps to selectively hedge portions of its net investment
in Japan. The currency effects of the cross-currency interest rate swaps are reflected in the accumulated other
comprehensive income (AOCI) account within shareholders’ equity attributable to Johnson Controls, Inc. where
they offset gains and losses recorded on the Company’s net investment in Japan. At March 31, 2012, September 30,
2011 and March 31, 2011, the Company had three cross currency interest rate swaps outstanding totaling 20 billion
yen.
The Company uses commodity contracts in the financial derivatives market in cases where commodity price risk
cannot be naturally offset or hedged through supply base fixed price contracts. Commodity risks are systematically
managed pursuant to policy guidelines. As cash flow hedges, the effective portion of the hedge gains or losses due to
changes in fair value are initially recorded as a component of AOCI and are subsequently reclassified into earnings
when the hedged transactions, typically sales or costs related to sales, occur and affect earnings. Any ineffective
portion of the hedge is reflected in the consolidated statements of income. The maturities of the commodity
contracts coincide with the expected purchase of the commodities. The Company had the following outstanding
commodity hedge contracts that hedge forecasted purchases:
Volume Outstanding as of
Commodity Units March 31, 2012 September 30, 2011 March 31, 2011
Copper Pounds 10,413,000 18,760,000 13,150,000
Lead Metric Tons 23,775 25,600 20,829
Aluminum Metric Tons 2,265 5,398 2,347
Tin Metric Tons - 260 -
The Company selectively uses equity swaps to reduce market risk associated with certain of its stock-based
compensation plans, such as its deferred compensation plans. These equity compensation liabilities increase as the
Company’s stock price increases and decrease as the Company’s stock price decreases. In contrast, the value of the

Johnson Controls, Inc.
Notes to Condensed Consolidated Financial Statements
March 31, 2012
(unaudited)
20
swap agreement moves in the opposite direction of these liabilities, allowing the Company to fix a portion of the
liabilities at a stated amount. The Company had hedged approximately 4.3 million shares of its common stock as of
March 31, 2012, September 30, 2011 and March 31, 2011.
The Company selectively uses interest rate swaps to reduce market risk associated with changes in interest rates for
its fixed-rate bonds. As fair value hedges, the interest rate swaps and related debt balances are valued under a
market approach using publicized swap curves. Changes in the fair value of the swap and hedged portion of the debt
are recorded in the consolidated statements of income. In the second quarter of fiscal 2011, the Company entered
into a fixed to floating interest rate swap totaling $100 million to hedge the coupon of its 5.8% bond maturing
November 15, 2012, two fixed to floating interest rate swaps totaling $300 million to hedge the coupon of its
4.875% bond maturing September 15, 2013 and five fixed to floating interest rate swaps totaling $450 million to
hedge the coupon of its 1.75% bond maturing March 1, 2014. These eight interest rate swaps were outstanding as of
March 31, 2012, September 30, 2011 and March 31, 2011.
In September 2005, the Company entered into three forward treasury lock agreements to reduce the market risk
associated with changes in interest rates associated with the Company’s anticipated fixed-rate note issuance to
finance the acquisition of York International Corp. (cash flow hedge). The three forward treasury lock agreements,
which had a combined notional amount of $1.3 billion, fixed a portion of the future interest cost for 5-year, 10-year
and 30-year notes. The fair value of each treasury lock agreement, or the difference between the treasury lock
reference rate and the fixed rate at time of note issuance, is amortized to interest expense over the life of the
respective note issuance. In January 2006, in connection with the Company’s debt refinancing, the three forward
lock treasury agreements were terminated.
The following table presents the location and fair values of derivative instruments and hedging activities included in
the Company’s condensed consolidated statements of financial position (in millions):
Derivatives and Hedging Activities Designated as
Hedging Instruments under ASC 815
Derivatives and Hedging Activities Not Designated
as Hedging Instruments under ASC 815
March 31, September 30, March 31, March 31, September 30, March 31,
2012 2011 2011 2012 2011 2011
Other current assets
Foreign currency exchange derivatives $ 13 $ 28 $ 14 $ 12 $ 18 $ 1
Commodity derivatives 1 - 14 - - -
Cross-currency interest rate swaps 16 - - - - -
Other noncurrent assets
Interest rate swaps 9 15 4 - - -
Equity swap - - - 138 112 177
Foreign currency exchange derivatives - 11 1 - 16 1
Total assets $ 39 $ 54 $ 33 $ 150 $ 146 $ 179
Other current liabilities
Foreign currency exchange derivatives $ 21 $ 49 $ 10 $ 10 $ 21 $ 2
Cross-currency interest rate swaps - 20 1 - - -
Commodity derivatives 4 32 - - - -
Current portion of long-term debt
Fixed rate debt swapped to floating 100 - - - - -
Long-term debt
Fixed rate debt swapped to floating 759 865 853 - - -
Other noncurrent liabilities
Foreign currency exchange derivatives - 19 1 - 11 1
Interest rate swaps - - 1 - - -
Total liabilities $ 884 $ 985 $ 866 $ 10 $ 32 $ 3

Johnson Controls, Inc.
Notes to Condensed Consolidated Financial Statements
March 31, 2012
(unaudited)
21
The following table presents the location and amount of gains and losses gross of tax on derivative instruments and
related hedge items included in the Company’s consolidated statements of income for the three and six months
ended March 31, 2012 and 2011 and amounts recorded in AOCI net of tax or cumulative translation adjustment
(CTA) net of tax in the condensed consolidated statements of financial position (in millions):
As of Three Months Ended Three Months Ended
March 31, 2012 March 31, 2012 March 31, 2012
Derivatives in ASC 815 Cash Flow
Hedging Relationships
Amount of Gain
(Loss) Recognized in
AOCI on Derivative
(Effective Portion)
Location of Gain (Loss)
Reclassified from AOCI
into Income (Effective
Portion)
Amount of Gain
(Loss) Reclassified
from AOCI into
Income (Effective
Portion)
Location of Gain (Loss)
Recognized in Income on
Derivative (Ineffective
Portion)
Amount of Gain
(Loss) Recognized in
Income on Derivative
(Ineffective Portion)
Foreign currency exchange derivatives $ (4) Cost of sales $ (4) Cost of sales $ -
Commodity derivatives (2) Cost of sales (3) Cost of sales -
Forward treasury locks 8 Net financing charges 1 Net financing charges -
Total $ 2 $ (6) $ -
Six Months Ended Six Months Ended
March 31, 2012 March 31, 2012
Derivatives in ASC 815 Cash Flow
Hedging Relationships
Location of Gain (Loss)
Reclassified from AOCI
into Income (Effective
Portion)
Amount of Gain
(Loss) Reclassified
from AOCI into
Income (Effective
Portion)
Location of Gain (Loss)
Recognized in Income on
Derivative (Ineffective
Portion)
Amount of Gain
(Loss) Recognized in
Income on Derivative
(Ineffective Portion)
Foreign currency exchange derivatives Cost of sales $ (10) Cost of sales $ -
Commodity derivatives Cost of sales (16) Cost of sales -
Forward treasury locks Net financing charges 1 Net financing charges -
Total $ (25) $ -
As of
September 30, 2011
Derivatives in ASC 815 Cash Flow
Hedging Relationships
Amount of Gain
(Loss) Recognized in
AOCI on Derivative
(Effective Portion)
Foreign currency exchange derivatives $ (16)
Commodity derivatives (20)
Forward treasury locks 9
Total $ (27)
As of Three Months Ended Three Months Ended
March 31, 2011 March 31, 2011 March 31, 2011
Derivatives in ASC 815 Cash Flow
Hedging Relationships
Amount of Gain
(Loss) Recognized in
AOCI on Derivative
(Effective Portion)
Location of Gain (Loss)
Reclassified from AOCI
into Income (Effective
Portion)
Amount of Gain
(Loss) Reclassified
from AOCI into
Income (Effective
Portion)
Location of Gain (Loss)
Recognized in Income on
Derivative (Ineffective
Portion)
Amount of Gain
(Loss) Recognized in
Income on Derivative
(Ineffective Portion)
Foreign currency exchange derivatives $ 2 Cost of sales $ 3 Cost of sales $ -
Commodity derivatives 11 Cost of sales 7 Cost of sales -
Forward treasury locks 9 Net financing charges - Net financing charges -
Total $ 22 $ 10 $ -
Six Months Ended Six Months Ended
March 31, 2011 March 31, 2011
Derivatives in ASC 815 Cash Flow
Hedging Relationships
Location of Gain (Loss)
Reclassified from AOCI
into Income (Effective
Portion)
Amount of Gain
(Loss) Reclassified
from AOCI into
Income (Effective
Portion)
Location of Gain (Loss)
Recognized in Income on
Derivative (Ineffective
Portion)
Amount of Gain
(Loss) Recognized in
Income on Derivative
(Ineffective Portion)
Foreign currency exchange derivatives Cost of sales $ 4 Cost of sales $ -
Commodity derivatives Cost of sales 19 Cost of sales -
Forward treasury locks Net financing charges 1 Net financing charges -
Total $ 24 $ -

Johnson Controls, Inc.
Notes to Condensed Consolidated Financial Statements
March 31, 2012
(unaudited)
22
As of As of As of
March 31, 2012 September 30, 2011 March 31, 2011
Hedging Activities in ASC 815 Net
Investment Hedging Relationships
Amount of Gain
(Loss) Recognized in
CTA on Outstanding
Derivatives (Effective
Portion)
Amount of Gain
(Loss) Recognized in
CTA on Outstanding
Derivatives (Effective
Portion)
Amount of Gain
(Loss) Recognized in
CTA on Outstanding
Derivatives (Effective
Portion)
Net investment hedges $ 10 $ (12) $ (1)
Total $ 10 $ (12) $ (1)
For the three and six months ended March 31, 2012 and 2011, no gains or losses were reclassified from CTA into
income for the Company’s outstanding net investment hedges.
Three Months Ended Six Months Ended
March 31, 2012 March 31, 2012
Derivatives in ASC 815 Fair Value Hedging
Relationships
Location of Gain (Loss) Recognized in Income on
Derivative
Amount of Gain (Loss)
Recognized in Income on
Derivative
Amount of Gain (Loss)
Recognized in Income on
Derivative
Interest rate swap Net financing charges $ 2 $ (6)
Fixed rate debt swapped to floating Net financing charges (2) 6
Total $ - $ -
Three Months Ended Six Months Ended
March 31, 2011 March 31, 2011
Derivatives in ASC 815 Fair Value Hedging
Relationships
Location of Gain (Loss) Recognized in Income on
Derivative
Amount of Gain (Loss)
Recognized in Income on
Derivative
Amount of Gain (Loss)
Recognized in Income on
Derivative
Interest rate swap Net financing charges $ 2 $ 2
Fixed rate debt swapped to floating Net financing charges (3) (3)
Total $ (1) $ (1)
Three Months Ended Six Months Ended
March 31, 2012 March 31, 2012
Derivatives Not Designated as Hedging
Instruments under ASC 815
Location of Gain (Loss) Recognized in Income on
Derivative
Amount of Gain (Loss)
Recognized in Income on
Derivative
Amount of Gain (Loss)
Recognized in Income on
Derivative
Foreign currency exchange derivatives Cost of sales $ - $ 23
Foreign currency exchange derivatives Net financing charges (1) (30)
Foreign currency exchange derivatives Provision for income tax (4) -
Equity swap Selling, general and administrative expenses 5 26
Total $ - $ 19
Three Months Ended Six Months Ended
March 31, 2011 March 31, 2011
Derivatives Not Designated as Hedging
Instruments under ASC 815
Location of Gain (Loss) Recognized in Income on
Derivative
Amount of Gain (Loss)
Recognized in Income on
Derivative
Amount of Gain (Loss)
Recognized in Income on
Derivative
Foreign currency exchange derivatives Cost of sales $ 47 $ 10
Foreign currency exchange derivatives Net financing charges (35) (2)
Equity swap Selling, general and administrative expenses 15 42
Total $ 27 $ 50

Johnson Controls, Inc.
Notes to Condensed Consolidated Financial Statements
March 31, 2012
(unaudited)
23
14. Fair Value Measurements
ASC 820, “Fair Value Measurements and Disclosures,” defines fair value as the price that would be received to sell
an asset or paid to transfer a liability in an orderly transaction between market participants at the measurement date.
ASC 820 also establishes a three-level fair value hierarchy that prioritizes information used in developing
assumptions when pricing an asset or liability as follows:
Level 1: Observable inputs such as quoted prices in active markets;
Level 2: Inputs, other than quoted prices in active markets, that are observable either directly or indirectly;
and
Level 3: Unobservable inputs where there is little or no market data, which requires the reporting entity to
develop its own assumptions.
ASC 820 requires the use of observable market data, when available, in making fair value measurements. When
inputs used to measure fair value fall within different levels of the hierarchy, the level within which the fair value
measurement is categorized is based on the lowest level input that is significant to the fair value measurement.
Recurring Fair Value Measurements
The following tables present the Company’s fair value hierarchy for those assets and liabilities measured at fair
value as of March 31, 2012, September 30, 2011 and March 31, 2011 (in millions):
Fair Value Measurements Using:
Total as of
Quoted Prices
in Active
Markets
Significant
Other
Observable
Inputs
Significant
Unobservable
Inputs
March 31, 2012 (Level 1) (Level 2) (Level 3)
Other current assets
Foreign currency exchange derivatives $ 25 $ 25 $ - $ -
Commodity derivatives 1 - 1 -
Cross-currency interest rate swaps 16 - 16 -
Other noncurrent assets
Interest rate swaps 9 - 9 -
Investments in marketable common stock 37 37 - -
Equity swap 138 138 - -
Total assets $ 226 $ 200 $ 26 $ -
Other current liabilities
Foreign currency exchange derivatives $ 31 $ 31 $ - $ -
Commodity derivatives 4 - 4 -
Current portion of long-term debt
Fixed rate debt swapped to floating 100 - 100 -
Long-term debt
Fixed rate debt swapped to floating 759 - 759 -
Total liabilities $ 894 $ 31 $ 863 $ -

Johnson Controls, Inc.
Notes to Condensed Consolidated Financial Statements
March 31, 2012
(unaudited)
24
Fair Value Measurements Using:
Total as of
Quoted Prices
in Active
Markets
Significant
Other
Observable
Inputs
Significant
Unobservable
Inputs
September 30, 2011 (Level 1) (Level 2) (Level 3)
Other current assets
Foreign currency exchange derivatives $ 46 $ 46 $ - $ -
Other noncurrent assets
Interest rate swaps 15 - 15 -
Investments in marketable common stock 34 34 - -
Equity swap 112 112 - -
Foreign currency exchange derivatives 27 27 - -
Total assets $ 234 $ 219 $ 15 $ -
Other current liabilities
Foreign currency exchange derivatives $ 70 $ 70 $ - $ -
Cross-currency interest rate swaps 20 - 20 -
Commodity derivatives 32 - 32 -
Long-term debt
Fixed rate swapped to floating 865 - 865 -
Other noncurrent liabilities
Foreign currency exchange derivatives 30 30 - -
Total liabilities $ 1,017 $ 100 $ 917 $ -

Johnson Controls, Inc.
Notes to Condensed Consolidated Financial Statements
March 31, 2012
(unaudited)
25
Fair Value Measurements Using:
Total as of
Quoted Prices
in Active
Markets
Significant
Other
Observable
Inputs
Significant
Unobservable
Inputs
March 31, 2011 (Level 1) (Level 2) (Level 3)
Other current assets
Foreign currency exchange derivatives $ 15 $ 15 $ - $ -
Commodity derivatives 14 - 14 -
Other noncurrent assets
Interest rate swaps 4 - 4 -
Investments in marketable common stock 38 38 - -
Equity swap 177 177 - -
Foreign currency exchange derivatives 2 2 - -
Total assets $ 250 $ 232 $ 18 $ -
Other current liabilities
Foreign currency exchange derivatives 12 12 - -
Cross-currency interest rate swaps 1 - 1 -
Long-term debt
Fixed rate debt swapped to floating 853 - 853 -
Other noncurrent liabilities
Interest rate swaps 1 - 1 -
Foreign currency exchange derivatives 2 2 - -
Total liabilities $ 869 $ 14 $ 855 $ -
Valuation Methods
Foreign currency exchange derivatives – The Company selectively hedges anticipated transactions that are subject to
foreign exchange rate risk primarily using foreign currency exchange hedge contracts. The foreign currency
exchange derivatives are valued under a market approach using publicized spot and forward prices. As cash flow
hedges under ASC 815, the effective portion of the hedge gains or losses due to changes in fair value are initially
recorded as a component of accumulated other comprehensive income and are subsequently reclassified into
earnings when the hedged transactions occur and affect earnings. Any ineffective portion of the hedge is reflected in
the consolidated statements of income. These contracts were highly effective in hedging the variability in future cash
flows attributable to changes in currency exchange rates at March 31, 2012, September 30, 2011 and March 31,
2011. The fair value of foreign currency exchange derivatives that are designated as fair value hedges under ASC
815, as well as those not designated as hedging instruments under ASC 815 are recorded in the consolidated
statements of income.
Commodity derivatives – The Company selectively hedges anticipated transactions that are subject to commodity
price risk, primarily using commodity hedge contracts, to minimize overall price risk associated with the Company’s
purchases of lead, copper, tin and aluminum. The commodity derivatives are valued under a market approach using
publicized prices, where available, or dealer quotes. As cash flow hedges, the effective portion of the hedge gains or
losses due to changes in fair value are initially recorded as a component of accumulated other comprehensive
income and are subsequently reclassified into earnings when the hedged transactions, typically sales or cost related
to sales, occur and affect earnings. Any ineffective portion of the hedge is reflected in the consolidated statements of
income. These contracts were highly effective in hedging the variability in future cash flows attributable to
commodity price changes at March 31, 2012, September 30, 2011 and March 31, 2011.
Interest rate swaps and related debt – The Company selectively uses interest rate swaps to reduce market risk
associated with changes in interest rates for its fixed-rate bonds. As fair value hedges, the interest rate swaps and
Johnson Controls, Inc.
Notes to Condensed Consolidated Financial Statements
March 31, 2012
(unaudited)
26
related debt balances are valued under a market approach using publicized swap curves. Changes in the fair value of
the swap and hedged portion of the debt are recorded in the consolidated statements of income. In the second quarter
of fiscal 2011, the Company entered into a fixed to floating interest rate swap totaling $100 million to hedge the
coupon of its 5.80% bond maturing November 15, 2012, two fixed to floating interest rate swaps totaling $300
million to hedge the coupon of its 4.875% bond maturing September 15, 2013 and five fixed to floating interest rate
swaps totaling $450 million to hedge the coupon of its 1.75% bond maturing March 1, 2014. These eight interest
rates swaps were outstanding as of March 31, 2012, September 30, 2011 and March 31, 2011.
Investments in marketable common stock – The Company invests in certain marketable common stock, which is
valued under a market approach using publicized share prices. As of March 31, 2012, September 30, 2011 and
March 31, 2011, the Company recorded unrealized gains of $14 million, $9 million and $12 million, respectively, in
accumulated other comprehensive income. The Company also recorded unrealized losses of $3 million in
accumulated other comprehensive income on these investments as of September 30, 2011 and no unrealized losses
as of March 31, 2012 and 2011. For the quarter ended March 31, 2012, the Company recorded an impairment charge
related to an investment in marketable common stock due to the investee’s bankruptcy announcement in March
2012. As a result, the Company recorded a $14 million impairment charge within selling, general, and
administrative expenses in the power solutions segment. The impairment reduced the investment to zero and was
measured under a market approach using the publicized share price. The inputs utilized in the analysis are classified
as Level 1 inputs within the fair value hierarchy as defined in ASC 820.
Equity swaps – The Company selectively uses equity swaps to reduce market risk associated with certain of its
stock-based compensation plans, such as its deferred compensation plans. The equity swaps are valued under a
market approach as the fair value of the swaps is equal to the Company’s stock price at the reporting period date.
Changes in fair value on the equity swaps are reflected in the consolidated statements of income within selling,
general and administrative expenses.
Cross-currency interest rate swaps – The Company selectively uses cross-currency interest rate swaps to hedge the
foreign currency rate risk associated with certain of its investments in Japan. The cross-currency interest rate swaps
are valued using observable market data. Changes in the market value of the swaps are reflected in the foreign
currency translation adjustments component of accumulated other comprehensive income where they offset gains
and losses recorded on the Company’s net investment in Japan. At March 31, 2012, September 30, 2011 and March
31, 2011, the Company had three cross currency interest rate swaps outstanding, totaling 20 billion yen.
The fair values of cash and cash equivalents, accounts receivable, short-term debt and accounts payable approximate
their carrying values. The fair value of long-term debt, which was $6.2 billion, $4.9 billion and $4.7 billion at March
31, 2012, September 30, 2011 and March 31, 2011, respectively, was determined using market quotes classified as
Level 1 inputs within the ASC 820 fair value hierarchy.
15. Impairment of Long-Lived Assets
The Company reviews long-lived assets for impairment whenever events or changes in circumstances indicate that
the asset’s carrying amount may not be recoverable. The Company conducts its long-lived asset impairment
analyses in accordance with ASC 360-10-15, “Impairment or Disposal of Long-Lived Assets.” ASC 360-10-15
requires the Company to group assets and liabilities at the lowest level for which identifiable cash flows are largely
independent of the cash flows of other assets and liabilities and evaluate the asset group against the sum of the
undiscounted future cash flows. If the undiscounted cash flows do not indicate the carrying amount of the asset
group is recoverable, an impairment charge is measured as the amount by which the carrying amount of the asset
group exceeds its fair value based on discounted cash flow analysis or appraisals.
At March 31, 2012, the Company recorded an impairment charge related to an equity investment. Refer to Note 14,
“Fair Value Measurements,” of the notes to condensed consolidated financial statements for additional information.
The Company concluded it did not have any other triggering events requiring assessment of impairment of its long-
lived assets at March 31, 2012 and 2011.

Johnson Controls, Inc.
Notes to Condensed Consolidated Financial Statements
March 31, 2012
(unaudited)
27
16. Segment Information
ASC 280, “Segment Reporting,” establishes the standards for reporting information about segments in financial
statements. In applying the criteria set forth in ASC 280, the Company has determined that it has nine reportable
segments for financial reporting purposes. The Company’s nine reportable segments are presented in the context of
its three primary businesses – building efficiency, automotive experience and power solutions.
Building Efficiency
Building efficiency designs, produces, markets and installs heating, ventilating and air conditioning (HVAC) and
control systems that monitor, automate and integrate critical building segment equipment and conditions including
HVAC, fire-safety and security in commercial buildings and in various industrial applications.
North America systems designs, produces, markets and installs mechanical equipment that provides heating
and cooling in North American non-residential buildings and industrial applications as well as control
systems that integrate the operation of this equipment with other critical building systems.
North America service provides technical services including inspection, scheduled maintenance, repair and
replacement of mechanical and control systems in North America, as well as the retrofit and service
components of performance contracts and other solutions.
Global workplace solutions provides on-site staff for complete real estate services, facility operation and
management to improve the comfort, productivity, energy efficiency and cost effectiveness of building
systems around the globe.
Asia provides HVAC and refrigeration systems and technical services to the Asian marketplace.
Other provides HVAC and refrigeration systems and technical services to markets in Europe, the Middle East
and Latin America. Other also designs and produces heating and air conditioning solutions for residential and
light commercial applications and markets products to the replacement and new construction markets.
Automotive Experience
Automotive experience designs and manufactures interior systems and products for passenger cars and light trucks,
including vans, pick-up trucks and sport utility/crossover vehicles in North America, Europe and Asia. Automotive
experience systems and products include complete seating systems and components; cockpit systems, including
instrument panels and clusters, information displays and body controllers; overhead systems, including headliners
and electronic convenience features; floor consoles; and door systems.
Power Solutions
Power solutions services both automotive original equipment manufacturers and the battery aftermarket by
providing advanced battery technology, coupled with systems engineering, marketing and service expertise.

Johnson Controls, Inc.
Notes to Condensed Consolidated Financial Statements
March 31, 2012
(unaudited)
28
Management evaluates the performance of the segments based primarily on segment income, which represents
income from continuing operations before income taxes and noncontrolling interests excluding net financing
charges. General corporate and other overhead expenses are allocated to business segments in determining segment
income. Financial information relating to the Company’s reportable segments is as follows (in millions):
Net Sales
Three Months Ended Six Months Ended
March 31, March 31,
2012 2011 2012 2011
Building efficiency
North America systems $ 580 $ 546 $ 1,132 $ 1,078
North America service 504 525 1,018 1,038
Global workplace solutions 1,076 1,017 2,162 2,007
Asia 458 417 931 836
Other 938 1,010 1,855 1,953
3,556 3,515 7,098 6,912
Automotive experience
North America 2,247 2,011 4,234 3,745
Europe 2,724 2,626 5,325 4,893
Asia 625 587 1,298 1,171
5,596 5,224 10,857 9,809
Power solutions 1,413 1,405 3,027 2,960
Total net sales $ 10,565 $ 10,144 $ 20,982 $ 19,681
Segment Income
Three Months Ended Six Months Ended
March 31, March 31,
2012 2011 2012 2011
Building efficiency
North America systems $ 59 $ 54 $ 109 $ 103
North America service 12 16 27 34
Global workplace solutions 3 1 10 10
Asia 51 42 112 109
Other 26 19 26 15
151 132 284 271
Automotive experience
North America 116 145 186 261
Europe 30 16 51 16
Asia 81 50 184 111
227 211 421 388
Power solutions 181 178 452 395
Total segment income $ 559 $ 521 $ 1,157 $ 1,054
Net financing charges (63) (46) (112) (81)
Income before income taxes $ 496 $ 475 $ 1,045 $ 973

Johnson Controls, Inc.
Notes to Condensed Consolidated Financial Statements
March 31, 2012
(unaudited)
29
17. Commitments and Contingencies
The Company accrues for potential environmental liabilities in a manner consistent with accounting principles
generally accepted in the United States; that is, when it is probable a liability has been incurred and the amount of
the liability is reasonably estimable. Reserves for environmental liabilities totaled $26 million, $30 million and $45
million at March 31, 2012, September 30, 2011 and March 31, 2011, respectively. The Company reviews the status
of its environmental sites on a quarterly basis and adjusts its reserves accordingly. Such potential liabilities accrued
by the Company do not take into consideration possible recoveries of future insurance proceeds. They do, however,
take into account the likely share other parties will bear at remediation sites. It is difficult to estimate the Company's
ultimate level of liability at many remediation sites due to the large number of other parties that may be involved,
the complexity of determining the relative liability among those parties, the uncertainty as to the nature and scope of
the investigations and remediation to be conducted, the uncertainty in the application of law and risk assessment, the
various choices and costs associated with diverse technologies that may be used in corrective actions at the sites, and
the often quite lengthy periods over which eventual remediation may occur. Nevertheless, the Company does not
currently believe that any claims, penalties or costs in connection with known environmental matters will have a
material adverse effect on the Company's financial position, results of operations or cash flows. In addition, the
Company has identified asset retirement obligations for environmental matters that are expected to be addressed at
the retirement, disposal, removal or abandonment of existing owned facilities, primarily in the power solutions
business. At March 31, 2012, September 30, 2011 and March 31, 2011, the Company recorded conditional asset
retirement obligations of $84 million, $91 million and $90 million, respectively.
The Company is involved in a number of product liability and various other casualty lawsuits incident to the
operation of its businesses. Insurance coverages are maintained and estimated costs are recorded for claims and suits
of this nature. It is management's opinion that none of these will have a material adverse effect on the Company's
financial position, results of operations or cash flows. Costs related to such matters were not material to the periods
presented.

30
Report of Independent Registered Public Accounting Firm
To the Board of Directors and Shareholders
of Johnson Controls, Inc.
We have reviewed the accompanying condensed consolidated statements of financial position of Johnson Controls,
Inc. and its subsidiaries (the “Company”) as of March 31, 2012 and 2011, and the related consolidated statements of
income and the consolidated statements of cash flows for the three-month and six-month periods ended March 31,
2012 and 2011. These interim financial statements are the responsibility of the Company's management.
We conducted our review in accordance with the standards of the Public Company Accounting Oversight Board
(United States). A review of interim financial information consists principally of applying analytical procedures and
making inquiries of persons responsible for financial and accounting matters. It is substantially less in scope than an
audit conducted in accordance with the standards of the Public Company Accounting Oversight Board (United
States), the objective of which is the expression of an opinion regarding the financial statements taken as a whole.
Accordingly, we do not express such an opinion.
Based on our review, we are not aware of any material modifications that should be made to the accompanying
condensed consolidated interim financial statements for them to be in conformity with accounting principles
generally accepted in the United States of America.
We previously audited, in accordance with the standards of the Public Company Accounting Oversight Board
(United States), the consolidated statement of financial position as of September 30, 2011, and the related
consolidated statements of income, shareholders’ equity, and cash flows for the year then ended (not presented
herein), and in our report dated November 22, 2011 we expressed an unqualified opinion on those consolidated
financial statements. In our opinion, the information set forth in the accompanying condensed consolidated
statement of financial position as of September 30, 2011 is fairly stated in all material respects in relation to the
consolidated statement of financial position from which it has been derived.
/s/ PricewaterhouseCoopers LLP
Milwaukee, Wisconsin
May 3, 2012
PricewaterhouseCoopers LLP, 100 East Wisconsin Avenue, Milwaukee, WI 53202 T: (414) 212- 1600, F: (414) 212- 1880, www.pwc.com/us

31
ITEM 2. MANAGEMENT'S DISCUSSION AND ANALYSIS OF FINANCIAL CONDITION AND
RESULTS OF OPERATIONS
Cautionary Statements for Forward-Looking Information
Unless otherwise indicated, references to “Johnson Controls,” the “Company,” “we,” “our” and “us” in this
Quarterly Report on Form 10-Q refer to Johnson Controls, Inc. and its consolidated subsidiaries.
Certain statements in this report, other than purely historical information, including estimates, projections,
statements relating to our business plans, objectives and expected operating results, and the assumptions upon which
those statements are based, are “forward-looking statements” within the meaning of the Private Securities Litigation
Reform Act of 1995, Section 27A of the Securities Act of 1933 and Section 21E of the Securities Exchange Act of
1934. These forward-looking statements generally are identified by the words “believe,” “project,” “expect,”
“anticipate,” “estimate,” “forecast,” “outlook,” “intend,” “strategy,” “plan,” “may,” “should,” “will,” “would,” “will
be,” “will continue,” “will likely result,” “guidance” or the negative thereof or variations thereon or similar
terminology generally intended to identify forward-looking statements. Forward-looking statements are based on
current expectations and assumptions that are subject to risks and uncertainties which may cause actual results to
differ materially from the forward-looking statements. A detailed discussion of risks and uncertainties that could
cause actual results and events to differ materially from such forward-looking statements is included in the section
entitled “Risk Factors” of our Annual Report on Form 10-K for the year ended September 30, 2011, as updated in
Part II, Item 1A of our Quarterly Report on Form 10-Q for the quarter ended December 31, 2011. We undertake no
obligation to update or revise publicly any forward-looking statements, whether as a result of new information,
future events or otherwise.
Overview
Johnson Controls is a global diversified technology and industrial leader serving customers in more than 150
countries. The Company creates quality products, services and solutions to optimize energy and operational
efficiencies of buildings; lead-acid automotive batteries and advanced batteries for hybrid and electric vehicles; and
interior systems for automobiles.
Johnson Controls was originally incorporated in the state of Wisconsin in 1885 as Johnson Electric Service
Company to manufacture, install and service automatic temperature regulation systems for buildings. The Company
was renamed to Johnson Controls, Inc. in 1974. In 1978, we acquired Globe-Union, Inc., a Wisconsin-based
manufacturer of automotive batteries for both the replacement and original equipment markets. We entered the
automotive seating industry in 1985 with the acquisition of Michigan-based Hoover Universal, Inc. In 2005, we
acquired York International, a global supplier of heating, ventilating, air-conditioning, and refrigeration equipment
and services.
Our building efficiency business is a global market leader in designing, producing, marketing and installing
integrated heating, ventilating and air conditioning (HVAC) systems, building management systems, controls,
security and mechanical equipment. In addition, the building efficiency business provides technical services, energy
management consulting and operations of entire real estate portfolios for the non-residential buildings market. We
also provide residential air conditioning and heating systems and industrial refrigeration products.
Our automotive experience business is one of the world’s largest automotive suppliers, providing innovative interior
systems through our design and engineering expertise. Our technologies extend into virtually every area of the
interior including seating and overhead systems, door systems, floor consoles, instrument panels, cockpits and
integrated electronics. Customers include most of the world’s major automakers.
Our power solutions business is a leading global supplier of lead-acid automotive batteries for virtually every type of
passenger car, light truck and utility vehicle. We serve both automotive original equipment manufacturers (OEMs)
and the general vehicle battery aftermarket. We supply batteries to power Start-Stop vehicles, as well as lithium-ion
battery technologies to power certain hybrid and electric vehicles.

32
The following information should be read in conjunction with the September 30, 2011 consolidated financial
statements and notes thereto, along with management’s discussion and analysis of financial condition and results of
operations included in the Company’s 2011 Annual Report on Form 10-K. References in the following discussion
and analysis to “Three Months” refer to the three months ended March 31, 2012 compared to the three months
ended March 31, 2011, while references to “Year-to-Date” refer to the six months ended March 31, 2012 compared
to the six months ended March 31, 2011.
Outlook
On April 20, 2012, the Company stated that it expects its fiscal 2012 third quarter earnings per diluted share to
increase approximately 20% from the prior year third quarter and its fiscal 2012 fourth quarter earnings per diluted
share to increase approximately 25% from the prior year fourth quarter, thereby resulting in full year earnings per
diluted share within the previously provided full year guidance of $2.70 - $2.85 per diluted share.
Liquidity and Capital Resources
The Company believes its capital resources and liquidity position at March 31, 2012 are adequate to meet projected
needs. The Company believes requirements for working capital, capital expenditures, dividends, minimum pension
contributions, debt maturities and any potential acquisitions in fiscal 2012 will continue to be funded from
operations, supplemented by short- and long-term borrowings, if required. The Company currently manages its short-
term debt position in the U.S. and euro commercial paper markets and bank loan markets. The Company continues to
adjust its commercial paper maturities and issuance levels given market reactions to industry events and changes in
the Company’s credit rating. In the event the Company is unable to issue commercial paper, it would have the ability
to draw on its $2.5 billion revolving credit facility, which matures in February 2015. There were no draws on the
revolving credit facility as of March 31, 2012. As such, the Company believes it has sufficient financial resources to
fund operations and meet its obligations for the foreseeable future.
The Company’s debt financial covenants require a minimum consolidated shareholders’ equity attributable to
Johnson Controls, Inc. of at least $3.5 billion at all times and allow a maximum aggregated amount of 10% of
consolidated shareholders’ equity attributable to Johnson Controls, Inc. for liens and pledges. For purposes of
calculating the Company’s covenants, consolidated shareholders’ equity attributable to Johnson Controls, Inc. is
calculated without giving effect to (i) the application of Accounting Standards Codification (ASC) 715-60, “Defined
Benefit Plans - Other Postretirement,” or (ii) the cumulative foreign currency translation adjustment. As of March
31, 2012, consolidated shareholders’ equity attributable to Johnson Controls, Inc. as defined per the Company’s debt
financial covenants was $11.1 billion and there were no outstanding amounts for liens and pledges. The Company
expects to remain in compliance with all covenants and other requirements set forth in its credit agreements and
indentures for the foreseeable future. None of the Company’s significant debt agreements limit access to stated
borrowing levels or require accelerated repayment in the event of a decrease in the Company’s credit rating.
The key financial assumptions used in calculating the pension liability are determined annually, or whenever plan
assets and liabilities are re-measured as required under accounting principles generally accepted in the U.S.,
including the expected rate of return on our plan assets. In fiscal 2012, the Company believes the long-term rate of
return will approximate 8.50%, 5.25% and 6.30% for U.S. pension, non-U.S. pension, and postretirement health and
other benefit plans, respectively. Any differences between actual results and the expected long-term asset returns
will be reflected in other comprehensive income and amortized to expense in future years. During the first six
months of fiscal 2012, the Company has made approximately $304 million and $60 million in total defined benefit
pension and postretirement health contributions, respectively. In total, the Company expects to contribute
approximately $350 million and $60 million in cash to its defined benefit pension and postretirement health plans,
respectively, in fiscal 2012.
Segment Analysis
Management evaluates the performance of its business units based primarily on segment income, which is defined as
income from continuing operations before income taxes and noncontrolling interests excluding net financing
charges.

33
Summary
Three Months Ended Six Months Ended
March 31, March 31,
(in millions) 2012 2011 Change 2012 2011 Change
Net sales $ 10,565 $ 10,144 4% $ 20,982 $ 19,681 7%
Segment income 559 521 7% 1,157 1,054 10%
Three Months:
The $421 million increase in consolidated net sales was primarily due to higher sales in the automotive
experience business ($481 million) as a result of increased industry production levels by our major OEM
customers and incremental sales due to prior year business acquisitions; higher sales in the building
efficiency business ($70 million) as a result of increased sales volumes primarily in the global workplace
solutions, North America systems and Asia segments; and higher sales in the power solutions business ($36
million) as a result of favorable price/product mix and increased sales volumes; partially offset by the
unfavorable impact of foreign currency translation ($166 million).
The $38 million increase in segment income was primarily due to higher volumes in the automotive
experience, building efficiency and power solutions businesses; favorable pricing and product mix
including lead and other purchasing costs in the power solutions segment; lower purchasing costs in the
automotive experience business; a gain on business divestiture net of transaction costs in the building
efficiency other segment; prior year costs related to business acquisitions in the automotive experience
Europe segment; prior year negative impact of the earthquake in Japan and related events; and incremental
operating income of prior year acquisitions in the automotive experience business; partially offset by higher
overall selling, general and administrative expenses including a prior year legal settlement award; net
unfavorable commercial settlements and pricing in the automotive experience business; higher operating
costs in the automotive experience and power solutions businesses; restructuring costs in the building
efficiency and automotive experience businesses; an impairment of an equity investment in the power
solutions business; and the unfavorable impact of foreign currency translation ($4 million).
Year-to-Date:
The $1.3 billion increase in consolidated net sales was primarily due to higher sales in the automotive
experience business ($1.2 billion) as a result of increased industry production levels by our major OEM
customers and incremental sales due to prior year business acquisitions; higher sales in the building
efficiency business ($215 million) as a result of increased sales volumes primarily in the global workplace
solutions, Asia and North America systems segments; and higher sales in the power solutions business
($112 million) as a result of the favorable price/product mix and increased sales volumes; partially offset
by the unfavorable impact of foreign currency translation ($216 million).
The $103 million increase in segment income was primarily due to higher volumes in the automotive
experience, building efficiency and power solutions businesses; favorable pricing and product mix
including lead and other purchasing costs in the power solutions business; lower purchasing costs in the
automotive experience business; a gain on business divestiture net of transaction costs in the building
efficiency other segment; prior year costs related to business acquisitions in the automotive experience
Europe segment; a gain on redemption of a warrant for an existing partially-owned affiliate in the power
solutions business; prior year negative impact of the earthquake in Japan and related events; incremental
operating income of prior year acquisitions in the automotive experience business; and higher equity
income including an equity interest gain in the automotive experience Asia segment; partially offset by
higher overall selling, general and administrative expenses including a prior year legal settlement award;
net unfavorable commercial settlements and pricing in the automotive experience business; higher
operating costs in the automotive experience and power solutions businesses; restructuring costs in the
building efficiency and automotive experience businesses; an impairment of an equity investment in the
power solutions business; and the unfavorable impact of foreign currency translation ($4 million).
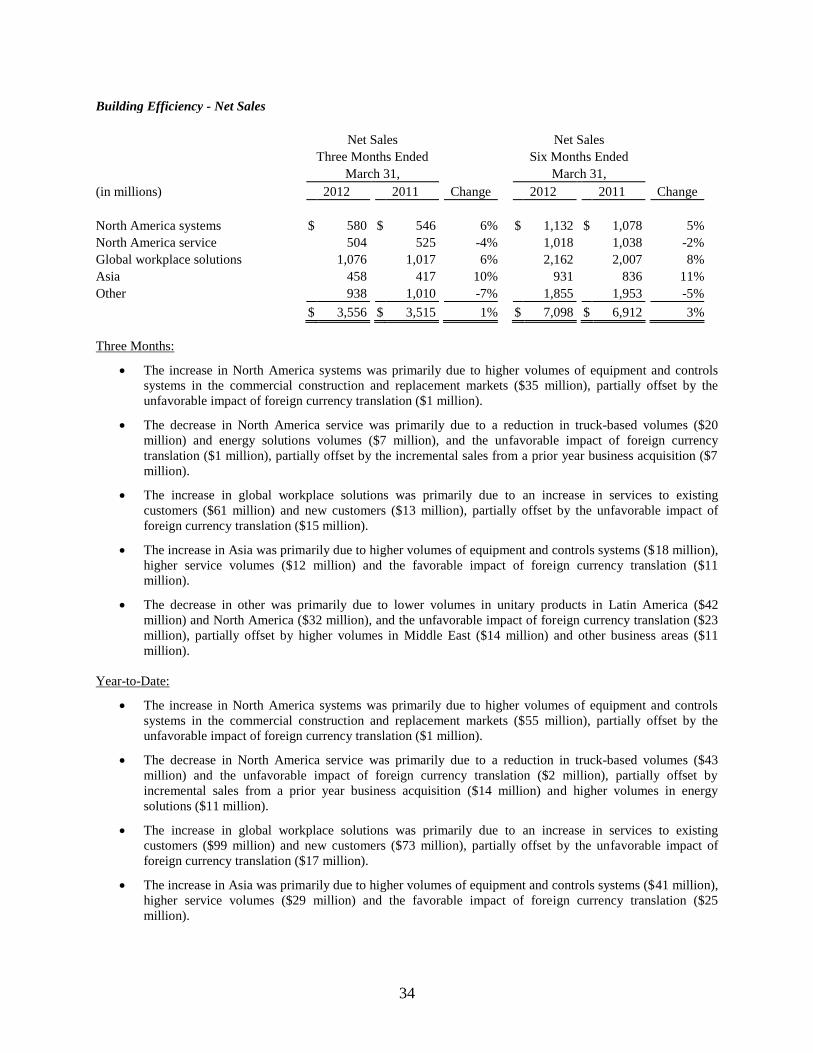
34
Building Efficiency - Net Sales
Net Sales Net Sales
Three Months Ended Six Months Ended
March 31, March 31,
(in millions) 2012 2011 Change 2012 2011 Change
North America systems $ 580 $ 546 6% $ 1,132 $ 1,078 5%
North America service 504 525 -4% 1,018 1,038 -2%
Global workplace solutions 1,076 1,017 6% 2,162 2,007 8%
Asia 458 417 10% 931 836 11%
Other 938 1,010 -7% 1,855 1,953 -5%
$ 3,556 $ 3,515 1% $ 7,098 $ 6,912 3%
Three Months:
The increase in North America systems was primarily due to higher volumes of equipment and controls
systems in the commercial construction and replacement markets ($35 million), partially offset by the
unfavorable impact of foreign currency translation ($1 million).
The decrease in North America service was primarily due to a reduction in truck-based volumes ($20
million) and energy solutions volumes ($7 million), and the unfavorable impact of foreign currency
translation ($1 million), partially offset by the incremental sales from a prior year business acquisition ($7
million).
The increase in global workplace solutions was primarily due to an increase in services to existing
customers ($61 million) and new customers ($13 million), partially offset by the unfavorable impact of
foreign currency translation ($15 million).
The increase in Asia was primarily due to higher volumes of equipment and controls systems ($18 million),
higher service volumes ($12 million) and the favorable impact of foreign currency translation ($11
million).
The decrease in other was primarily due to lower volumes in unitary products in Latin America ($42
million) and North America ($32 million), and the unfavorable impact of foreign currency translation ($23
million), partially offset by higher volumes in Middle East ($14 million) and other business areas ($11
million).
Year-to-Date:
The increase in North America systems was primarily due to higher volumes of equipment and controls
systems in the commercial construction and replacement markets ($55 million), partially offset by the
unfavorable impact of foreign currency translation ($1 million).
The decrease in North America service was primarily due to a reduction in truck-based volumes ($43
million) and the unfavorable impact of foreign currency translation ($2 million), partially offset by
incremental sales from a prior year business acquisition ($14 million) and higher volumes in energy
solutions ($11 million).
The increase in global workplace solutions was primarily due to an increase in services to existing
customers ($99 million) and new customers ($73 million), partially offset by the unfavorable impact of
foreign currency translation ($17 million).
The increase in Asia was primarily due to higher volumes of equipment and controls systems ($41 million),
higher service volumes ($29 million) and the favorable impact of foreign currency translation ($25
million).

35
The decrease in other was primarily due to lower volumes in unitary products in Latin America ($70
million) and North America ($66 million), and the unfavorable impact of foreign currency translation ($34
million), partially offset by higher volumes in Middle East ($42 million) and other business areas ($30
million).
Building Efficiency - Segment Income
Segment Income Segment Income
Three Months Ended Six Months Ended
March 31, March 31,
(in millions) 2012 2011 Change 2012 2011 Change
North America systems $ 59 $ 54 9% $ 109 $ 103 6%
North America service 12 16 -25% 27 34 -21%
Global workplace solutions 3 1 * 10 10 0%
Asia 51 42 21% 112 109 3%
Other 26 19 37% 26 15 73%
$ 151 $ 132 14% $ 284 $ 271 5%
* Measure not meaningful
Three Months:
The increase in North America systems was primarily due to higher volumes ($10 million) partially offset
by unfavorable margin rates ($4 million) and restructuring costs ($1 million).
The decrease in North America service was primarily due to restructuring costs ($5 million), a loss on
business divestiture ($3 million), lower volumes ($3 million) and unfavorable margin rates ($2 million),
partially offset by lower selling, general and administrative costs ($9 million).
The increase in global workplace solutions was primarily due to higher volumes ($4 million) partially
offset by higher selling, general and administrative expenses ($1 million) and restructuring costs ($1
million).
The increase in Asia was primarily due to higher volumes ($8 million) and the favorable impact of foreign
currency translation ($2 million), partially offset by unfavorable margin rates ($1 million).
The increase in other was primarily due to a gain on business divestiture net of transaction costs ($38
million) and higher equity income ($3 million), partially offset by unfavorable margin rates ($11 million),
lower volumes ($10 million), higher selling, general and administrative expenses ($8 million), restructuring
costs ($4 million) and the unfavorable impact of foreign currency translation ($1 million).
Year-to-Date:
The increase in North America systems was primarily due to higher volumes ($15 million) partially offset
by unfavorable margin rates ($8 million) and restructuring costs ($1 million).
The decrease in North America service was primarily due to restructuring costs ($5 million), a loss on
business divestiture ($3 million) and lower volumes ($3 million), partially offset by favorable margin rates
($4 million).
Global workplace solutions was flat primarily due to higher volumes ($9 million) offset by unfavorable
margin rates ($5 million), higher selling, general and administrative expenses ($3 million) and restructuring
costs ($1 million).
The increase in Asia was primarily due to higher volumes ($17 million) and the favorable impact of foreign
currency translation ($4 million), partially offset by higher selling, general and administrative expenses
($17 million) and unfavorable margin rates ($1 million).

36
The increase in other was primarily due to a gain on business divestiture net of transaction costs ($38
million) and higher equity income ($7 million), partially offset by unfavorable margin rates ($16 million),
lower volumes ($13 million), restructuring costs ($4 million) and the unfavorable impact of foreign
currency translation ($1 million).
Automotive Experience - Net Sales
Net Sales Net Sales
Three Months Ended Six Months Ended
March 31, March 31,
(in millions) 2012 2011 Change 2012 2011 Change
North America $ 2,247 $ 2,011 12% $ 4,234 $ 3,745 13%
Europe 2,724 2,626 4% 5,325 4,893 9%
Asia 625 587 6% 1,298 1,171 11%
$ 5,596 $ 5,224 7% $ 10,857 $ 9,809 11%
Three Months:
The increase in North America was primarily due to higher volumes to the Company’s major OEM
customers ($217 million) and incremental sales due to prior year business acquisitions ($38 million),
partially offset by net unfavorable pricing and commercial settlements ($19 million).
The increase in Europe was primarily due to incremental sales due to prior year business acquisitions ($183
million) and higher volumes ($70 million), partially offset by the unfavorable impact of foreign currency
translation ($121 million), and net unfavorable pricing and commercial settlements ($34 million).
The increase in Asia was primarily due to the prior year negative impact of the Japan earthquake and
related events ($48 million), incremental sales due to prior year business acquisitions ($27 million) and the
favorable impact of foreign currency translation ($12 million), partially offset by lower volumes in China
($35 million), net unfavorable pricing ($8 million), and the negative impact of the flooding in Thailand and
related events ($6 million).
Year-to-Date:
The increase in North America was primarily due to higher volumes to the Company’s major OEM
customers ($423 million) and incremental sales due to prior year business acquisitions ($109 million),
partially offset by net unfavorable pricing and commercial items ($43 million).
The increase in Europe was primarily due to incremental sales due to prior year business acquisitions ($466
million) and higher volumes ($170 million), partially offset by the unfavorable impact of foreign currency
translation ($170 million), and net unfavorable pricing and commercial settlements ($34 million).
The increase in Asia was primarily due to incremental sales due to prior year business acquisitions ($62
million), the prior year negative impact of the Japan earthquake and related events ($48 million), the
favorable impact of foreign currency translation ($28 million) and higher volumes ($27 million), partially
offset by the negative impact of the flooding in Thailand and related events ($25 million), and net
unfavorable pricing ($13 million).
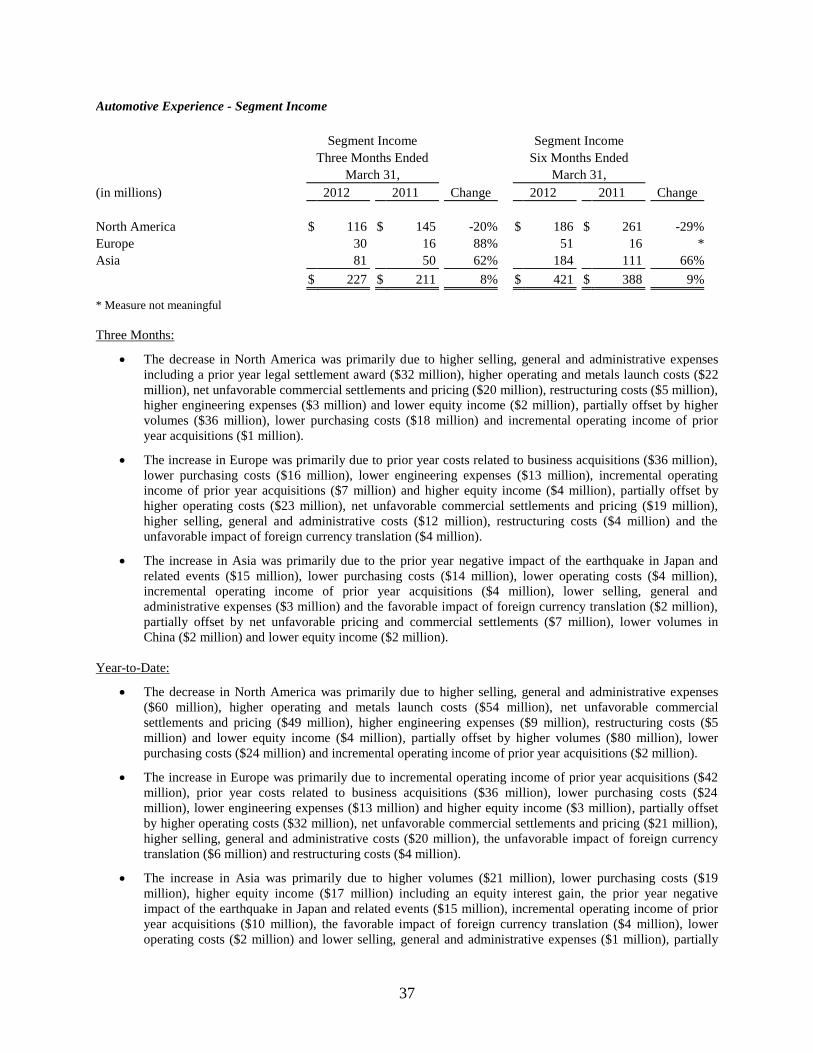
37
Automotive Experience - Segment Income
Segment Income Segment Income
Three Months Ended Six Months Ended
March 31, March 31,
(in millions) 2012 2011 Change 2012 2011 Change
North America $ 116 $ 145 -20% $ 186 $ 261 -29%
Europe 30 16 88% 51 16 *
Asia 81 50 62% 184 111 66%
$ 227 $ 211 8% $ 421 $ 388 9%
* Measure not meaningful
Three Months:
The decrease in North America was primarily due to higher selling, general and administrative expenses
including a prior year legal settlement award ($32 million), higher operating and metals launch costs ($22
million), net unfavorable commercial settlements and pricing ($20 million), restructuring costs ($5 million),
higher engineering expenses ($3 million) and lower equity income ($2 million), partially offset by higher
volumes ($36 million), lower purchasing costs ($18 million) and incremental operating income of prior
year acquisitions ($1 million).
The increase in Europe was primarily due to prior year costs related to business acquisitions ($36 million),
lower purchasing costs ($16 million), lower engineering expenses ($13 million), incremental operating
income of prior year acquisitions ($7 million) and higher equity income ($4 million), partially offset by
higher operating costs ($23 million), net unfavorable commercial settlements and pricing ($19 million),
higher selling, general and administrative costs ($12 million), restructuring costs ($4 million) and the
unfavorable impact of foreign currency translation ($4 million).
The increase in Asia was primarily due to the prior year negative impact of the earthquake in Japan and
related events ($15 million), lower purchasing costs ($14 million), lower operating costs ($4 million),
incremental operating income of prior year acquisitions ($4 million), lower selling, general and
administrative expenses ($3 million) and the favorable impact of foreign currency translation ($2 million),
partially offset by net unfavorable pricing and commercial settlements ($7 million), lower volumes in
China ($2 million) and lower equity income ($2 million).
Year-to-Date:
The decrease in North America was primarily due to higher selling, general and administrative expenses
($60 million), higher operating and metals launch costs ($54 million), net unfavorable commercial
settlements and pricing ($49 million), higher engineering expenses ($9 million), restructuring costs ($5
million) and lower equity income ($4 million), partially offset by higher volumes ($80 million), lower
purchasing costs ($24 million) and incremental operating income of prior year acquisitions ($2 million).
The increase in Europe was primarily due to incremental operating income of prior year acquisitions ($42
million), prior year costs related to business acquisitions ($36 million), lower purchasing costs ($24
million), lower engineering expenses ($13 million) and higher equity income ($3 million), partially offset
by higher operating costs ($32 million), net unfavorable commercial settlements and pricing ($21 million),
higher selling, general and administrative costs ($20 million), the unfavorable impact of foreign currency
translation ($6 million) and restructuring costs ($4 million).
The increase in Asia was primarily due to higher volumes ($21 million), lower purchasing costs ($19
million), higher equity income ($17 million) including an equity interest gain, the prior year negative
impact of the earthquake in Japan and related events ($15 million), incremental operating income of prior
year acquisitions ($10 million), the favorable impact of foreign currency translation ($4 million), lower
operating costs ($2 million) and lower selling, general and administrative expenses ($1 million), partially

38
offset by net unfavorable commercial settlements and pricing ($10 million), the negative impact of the
flooding in Thailand and related events ($5 million) and higher engineering expenses ($1 million).
Power Solutions
Three Months Ended Six Months Ended
March 31, March 31,
(in millions) 2012 2011 Change 2012 2011 Change
Net sales $ 1,413 $ 1,405 1% $ 3,027 $ 2,960 2%
Segment income 181 178 2% 452 395 14%
Three Months:
Net sales increased primarily due to favorable price/product mix ($45 million), higher sales volumes ($27
million) and incremental sales due to business acquisitions ($6 million), partially offset by the impact of
lower lead costs on pricing ($42 million) and the unfavorable impact of foreign currency translation ($28
million).
Segment income increased primarily due to favorable pricing and product mix including lead and other
purchasing costs ($54 million), a gain on acquisition of a partially-owned affiliate ($9 million), higher sales
volumes ($5 million) and the favorable impact of business acquisitions ($5 million), partially offset by
higher operating and transportation costs ($33 million), higher selling, general and administrative expenses
($17 million), an impairment of an equity investment ($14 million), lower equity income ($3 million) and
the unfavorable impact of foreign currency translation ($3 million). Year-to-Date:
Net sales increased primarily due to favorable price/product mix ($95 million), incremental sales due to
business acquisitions ($21 million) and higher sales volumes ($16 million), partially offset by the
unfavorable impact of foreign currency translation ($45 million) and the impact of lower lead costs on
pricing ($20 million).
Segment income increased primarily due to favorable pricing and product mix including lead and other
purchasing costs ($111 million), a gain on redemption of a warrant for an existing partially-owned affiliate
($25 million), business interruption insurance recovery net of related costs and lost profit on sales due to a
continued plant shutdown in Asia ($13 million), a gain on acquisition of a partially-owned affiliate ($9
million) and higher sales volumes ($5 million), partially offset by higher operating and transportation costs
($39 million), higher selling, general and administrative costs ($36 million), an impairment of an equity
investment ($14 million), the unfavorable impact of business acquisitions ($9 million), the unfavorable
impact of foreign currency translation ($5 million) and lower equity income ($3 million).
Net Financing Charges
Three Months Ended Six Months Ended
March 31, March 31,
(in millions) 2012 2011 Change 2012 2011 Change
Net financing charges $ 63 $ 46 37% $ 112 $ 81 38%
The increase in net financing charges for the three and six month periods ended March 31, 2012 was primarily
due to higher debt levels in the current periods.
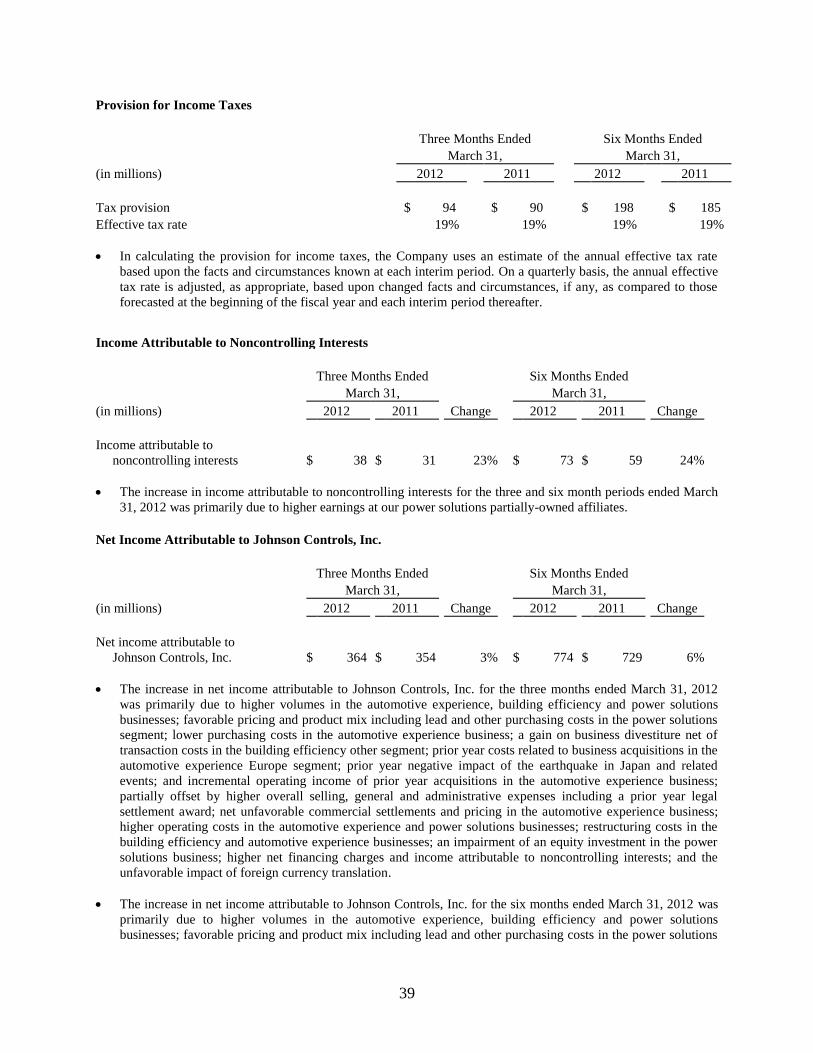
39
Provision for Income Taxes
Three Months Ended Six Months Ended
March 31, March 31,
(in millions) 2012 2011 2012 2011
Tax provision $ 94 $ 90 $ 198 $ 185
Effective tax rate 19% 19% 19% 19%
In calculating the provision for income taxes, the Company uses an estimate of the annual effective tax rate
based upon the facts and circumstances known at each interim period. On a quarterly basis, the annual effective
tax rate is adjusted, as appropriate, based upon changed facts and circumstances, if any, as compared to those
forecasted at the beginning of the fiscal year and each interim period thereafter.
Income Attributable to Noncontrolling Interests
Three Months Ended Six Months Ended
March 31, March 31,
(in millions) 2012 2011 Change 2012 2011 Change
Income attributable to
noncontrolling interests $ 38 $ 31 23% $ 73 $ 59 24%
The increase in income attributable to noncontrolling interests for the three and six month periods ended March
31, 2012 was primarily due to higher earnings at our power solutions partially-owned affiliates.
Net Income Attributable to Johnson Controls, Inc.
Three Months Ended Six Months Ended
March 31, March 31,
(in millions) 2012 2011 Change 2012 2011 Change
Net income attributable to
Johnson Controls, Inc. $ 364 $ 354 3% $ 774 $ 729 6%
The increase in net income attributable to Johnson Controls, Inc. for the three months ended March 31, 2012
was primarily due to higher volumes in the automotive experience, building efficiency and power solutions
businesses; favorable pricing and product mix including lead and other purchasing costs in the power solutions
segment; lower purchasing costs in the automotive experience business; a gain on business divestiture net of
transaction costs in the building efficiency other segment; prior year costs related to business acquisitions in the
automotive experience Europe segment; prior year negative impact of the earthquake in Japan and related
events; and incremental operating income of prior year acquisitions in the automotive experience business;
partially offset by higher overall selling, general and administrative expenses including a prior year legal
settlement award; net unfavorable commercial settlements and pricing in the automotive experience business;
higher operating costs in the automotive experience and power solutions businesses; restructuring costs in the
building efficiency and automotive experience businesses; an impairment of an equity investment in the power
solutions business; higher net financing charges and income attributable to noncontrolling interests; and the
unfavorable impact of foreign currency translation.
The increase in net income attributable to Johnson Controls, Inc. for the six months ended March 31, 2012 was
primarily due to higher volumes in the automotive experience, building efficiency and power solutions
businesses; favorable pricing and product mix including lead and other purchasing costs in the power solutions

40
business; lower purchasing costs in the automotive experience business; a gain on business divestiture net of
transaction costs in the building efficiency other segment; prior year costs related to business acquisitions in the
automotive experience Europe segment; a gain on redemption of a warrant for an existing partially-owned
affiliate in the power solutions business; prior year negative impact of the earthquake in Japan and related
events; incremental operating income of prior year acquisitions in the automotive experience business; and
higher equity income including an equity interest gain in the automotive experience Asia segment; partially
offset by higher overall selling, general and administrative expenses including a prior year legal settlement
award; net unfavorable commercial settlements and pricing in the automotive experience business; higher
operating costs in the automotive experience and power solutions businesses; restructuring costs in the building
efficiency and automotive experience businesses; an impairment of an equity investment in the power solutions
business; higher net financing charges, income attributable to noncontrolling interests and provision for income
taxes; and the unfavorable impact of foreign currency translation.
Backlog
Building efficiency’s backlog relates to its control systems and service activity. At March 31, 2012, the unearned
backlog was $5.3 billion, or a 3% increase compared to March 31, 2011. The Asia and North America systems
backlog increased compared to prior year levels, while there was a decline in other and North America service.
Financial Condition
Working Capital
March 31, September 30, March 31,
(in millions) 2012 2011 Change 2011 Change
Working capital $ 2,245 $ 1,589 41% $ 1,792 25%
Accounts receivable 7,402 7,151 4% 6,946 7%
Inventories 2,374 2,316 3% 2,239 6%
Accounts payable 6,313 6,159 3% 6,082 4%
The Company defines working capital as current assets less current liabilities, excluding cash, short-term debt,
and the current portion of long-term debt. Management believes that this measure of working capital, which
excludes financing-related items, provides a more useful measurement of the Company’s operating
performance.
The increase in working capital as compared to September 30, 2011 and March 31, 2011 was primarily due to
higher accounts receivable based on timing of customer receipts and sales volumes, and higher inventory levels
to support higher backlog levels, partially offset by higher accounts payable due to increased purchasing
activity.
The Company’s days sales in accounts receivable for the three months ended March 31, 2012 were 55,
compared to 52 and 54 for the comparable periods ended September 30, 2011 and March 31, 2011, respectively.
The increase in accounts receivable compared to September 30, 2011 was primarily due to the timing of
customer receipts. The increase in accounts receivable compared to March 31, 2011 was primarily due to higher
sales volumes in the current quarter compared to the comparable prior quarter. There has been no significant
adverse change in the level of overdue receivables or changes in revenue recognition methods.
The Company’s inventory turns for the three months ended March 31, 2012 were lower than the comparable
periods ended September 30, 2011 and March 31, 2011 primarily due to higher inventory production to meet
higher backlog levels and inventory shipped to Asia to meet customer demand during a continued power
solutions plant shutdown in Asia.
Days in accounts payable at March 31, 2012 were 72 days, an increase from 71 days at September 30, 2011 and
68 days at March 31, 2011. The increase was primarily due to the timing of supplier payments.

41
Cash Flows
Three Months Ended Six Months Ended
March 31, March 31,
(in millions) 2012 2011 2012 2011
Cash provided by operating activities $ 243 $ 36 $ 146 $ 129
Cash used by investing activities (380) (840) (1,011) (1,196)
Cash provided by financing activities 156 888 837 894
Capital expenditures (448) (275) (986) (535)
The increase in cash provided by operating activities for the three and six months ended March 31, 2012 was
primarily due to favorable working capital changes in accounts receivable and inventories, and higher net
income, partially offset by unfavorable working capital changes in accounts payable and accrued liabilities. For
the six months ended March 31, 2012, the unfavorable working capital change in accounts payable and accrued
liabilities was primarily due to higher pension and postretirement contributions.
The decrease in cash used by investing activities for the three and six months ended March 31, 2012 was
primarily due to lower cash paid for acquisitions of businesses and current year divestitures, partially offset by
higher capital expenditures.
The decrease in cash provided by financing activities for the three months ended March 31, 2012 was primarily
due to a prior year $1.6 billion bond issuance partially offset by lower repayments of debt in the current period.
The decrease in cash provided by financing activities for the six months ended March 31, 2012 was primarily
due to a prior year $1.6 billion bond issuance partially offset by a $1.1 billion bond issuance and lower
repayments of debt in the current six month period. Refer to Note 10, “Debt and Financing Arrangements,” of
the notes to condensed consolidated financial statements for further discussion.
The increase in capital expenditures for the three and six months ended March 31, 2012 primarily relates to
capacity increases and vertical integration efforts in the power solutions business, increased investments to
support customer growth and enhance the Company’s strategic footprint primarily in Southeast Asia, and
information technology infrastructure investments.
Deferred Taxes
The Company reviews the realizability of its deferred tax assets on a quarterly basis, or whenever events or changes
in circumstances indicate that a review is required. In determining the requirement for a valuation allowance, the
historical and projected financial results of the legal entity or consolidated group recording the net deferred tax asset
are considered, along with any other positive or negative evidence. Since future financial results may differ from
previous estimates, periodic adjustments to the Company's valuation allowances may be necessary.
The Company has certain subsidiaries, mainly located in France and Spain, which have generated operating and/or
capital losses and, in certain circumstances, have limited loss carry forward periods. In accordance with ASC 740,
“Income Taxes,” the Company is required to record a valuation allowance when it is more likely than not the
Company will not utilize deductible amounts or net operating losses for each legal entity or consolidated group
based on the tax rules in the applicable jurisdiction, evaluating both positive and negative historical evidences as
well as expected future events and tax planning strategies.
It is reasonably possible that over the next twelve months, valuation allowances against deferred tax assets in certain
jurisdictions may result in a net adjustment to tax expense of up to $50 million.
Long-Lived Assets
The Company reviews long-lived assets for impairment whenever events or changes in circumstances indicate that
the asset’s carrying amount may not be recoverable. The Company conducts its long-lived asset impairment
analyses in accordance with ASC 360-10-15, “Impairment or Disposal of Long-Lived Assets.” ASC 360-10-15
requires the Company to group assets and liabilities at the lowest level for which identifiable cash flows are largely

42
independent of the cash flows of other assets and liabilities and evaluate the asset group against the sum of the
undiscounted future cash flows. If the undiscounted cash flows do not indicate the carrying amount of the asset
group is recoverable, an impairment charge is measured as the amount by which the carrying amount of the asset
group exceeds its fair value based on discounted cash flow analysis or appraisals.
At March 31, 2012, the Company recorded an impairment charge related to one of its equity investments. Refer to
Note 14, “Fair Value Measurements,” of the notes to condensed consolidated financial statements for additional
information. The Company concluded it did not have any other triggering events requiring assessment of
impairment of its long-lived assets at March 31, 2012 and 2011.
Capitalization
March 31, September 30, March 31,
(in millions) 2012 2011 Change 2011 Change
Short-term debt $ 530 $ 596 $ 106
Current portion of long-term debt 148 17 53
Long-term debt 5,645 4,533 4,382
Total debt 6,323 5,146 23% 4,541 39%
Shareholders' equity
attributable to Johnson Controls, Inc. 11,595 11,042 5% 10,976 6%
Total capitalization $ 17,918 $ 16,188 11% $ 15,517 15%
Total debt as a % of
total capitalization 35% 32% 29%
The Company believes the percentage of total debt to total capitalization is useful to understanding the
Company’s financial condition as it provides a review of the extent to which the Company relies on external
debt financing for its funding and is a measure of risk to its shareholders.
At March 31, 2012, September 30, 2011 and March 31, 2011, the Company had committed bilateral euro
denominated revolving credit facilities totaling 223 million euro, 223 million euro and 300 million euro,
respectively. Additionally, at March 31, 2012 and September 30, 2011, the Company had committed bilateral
U.S. dollar denominated revolving credit facilities totaling $185 million and $50 million, respectively, and had
no committed revolving credit facilities as of March 31, 2011. There were no draws on any of the revolving
facilities for the respective periods. As of March 31, 2012, 123 million euro and $50 million is scheduled to
expire in fiscal 2012, $135 million is scheduled to expire in fiscal 2013 and 100 million euro is scheduled to
expire in fiscal 2014.
In November 2010, the Company repaid debt of $82 million which was acquired as part of an acquisition in the
first quarter of fiscal 2011. The Company used cash to repay the debt.
In January 2011, the Company retired $654 million in principal amount, plus accrued interest, of its 5.25%
fixed rate notes that matured on January 15, 2011. The Company used cash to fund the payment.
In February 2011, the Company issued $350 million aggregate principal amount of floating rate senior
unsecured notes due in fiscal 2014, $450 million aggregate principal amount of 1.75% senior unsecured fixed
rate notes due in fiscal 2014, $500 million aggregate principal amount of 4.25% senior unsecured fixed rate
notes due in fiscal 2021 and $300 million aggregate principal amount of 5.7% senior unsecured fixed rate notes
due in fiscal 2041. Aggregate net proceeds of $1.6 billion from the issues were used for general corporate
purposes including the retirement of short-term debt.
In February 2011, the Company entered into a six-year, 100 million euro, floating rate loan scheduled to mature
in February 2017. Proceeds from the facility were used for general corporate purposes.
In February 2011, the Company replaced its $2.05 billion committed five-year credit facility, scheduled to
mature in December 2011, with a $2.5 billion committed four-year credit facility scheduled to mature in

43
February 2015. The facility is used to support the Company’s outstanding commercial paper. There were no
draws on the facility in fiscal 2012 or 2011.
In April 2011, a total of 157,820 Equity Units, which had a purchase contract settlement date of March 31, 2012
were early exercised. As a result, the Company issued 766,673 shares of Johnson Controls, Inc. common stock
and approximately $8 million of 11.5% notes due 2042.
In November 2011, the Company issued $400 million aggregate principal amount of 2.6% senior unsecured
fixed rate notes due in fiscal 2017, $450 million aggregate principal amount of 3.75% senior unsecured fixed
rate notes due in fiscal 2022 and $250 million aggregate principal amount of 5.25% senior unsecured fixed rate
notes due in fiscal 2042. Aggregate net proceeds of $1.1 billion from the issues were used for general corporate
purposes, including the retirement of short-term debt and contributions to the Company’s pension and
postretirement health plans.
In December 2011, the Company entered into a five-year, 75 million euro, floating rate credit facility scheduled
to mature in February 2017. The Company drew on the credit facility during the quarter ended March 31, 2012.
Proceeds from the facility were used for general corporate purposes.
In March 2012, the Company remarketed $46 million aggregate principal amount of 11.5% subordinated notes
due in fiscal 2042, on behalf of holders of Corporate Units and holders of separate notes, by issuing $46 million
aggregate principal amount of 2.355% senior notes due on March 31, 2017.
The Company also selectively makes use of short-term credit lines. The Company estimates that, as of March
31, 2012, it could borrow up to $1.8 billion at its current debt ratings on committed credit lines.
The Company believes its capital resources and liquidity position at March 31, 2012 are adequate to meet
projected needs. The Company believes requirements for working capital, capital expenditures, dividends,
minimum pension contributions, debt maturities, and any potential acquisitions in fiscal 2012 will continue to
be funded from operations, supplemented by short- and long-term borrowings, if required. The Company
currently manages its short-term debt position in the U.S. and euro commercial paper markets and bank loan
markets. The Company continues to adjust its commercial paper maturities and issuance levels given market
reactions to industry events and changes in the Company’s credit rating. In the event the Company is unable to
issue commercial paper, it would have the ability to draw on its $2.5 billion revolving credit facility, which
matures in February 2015. There were no draws on the revolving credit facility as of March 31, 2012. As such,
the Company believes it has sufficient financial resources to fund operations and meet its obligations for the
foreseeable future.
The Company earns a significant amount of its operating income outside the U.S., which is deemed to be
permanently reinvested in foreign jurisdictions. The Company currently does not intend nor foresee a need to
repatriate these funds. The Company expects existing domestic cash and liquidity to continue to be sufficient to
fund our domestic operating activities and cash commitments for investing and financing activities for at least
the next twelve months and thereafter for the foreseeable future. In addition, the Company expects existing
foreign cash, cash equivalents, short term investments and cash flows from operations to continue to be
sufficient to fund our foreign operating activities and cash commitments for investing activities, such as
material capital expenditures, for at least the next twelve months and thereafter for the foreseeable future.
Should the Company require more capital in the U.S. than is generated by our operations domestically, we
could elect to raise capital in the U.S. through debt or equity issuances. This alternative could result in increased
interest expense or other dilution of our earnings. The Company has borrowed funds domestically and continues
to have the ability to borrow funds domestically at reasonable interest rates.
The Company’s debt financial covenants require a minimum consolidated shareholders’ equity attributable to
Johnson Controls, Inc. of at least $3.5 billion at all times and allow a maximum aggregated amount of 10% of
consolidated shareholders’ equity attributable to Johnson Controls, Inc. for liens and pledges. For purposes of
calculating the Company’s covenants, consolidated shareholders’ equity attributable to Johnson Controls, Inc. is
calculated without giving effect to (i) the application of ASC 715-60, “Defined Benefit Plans- Other
Postretirement,” or (ii) the cumulative foreign currency translation adjustment. As of March 31, 2012,
consolidated shareholders’ equity attributable to Johnson Controls, Inc. as defined per the Company’s debt
financial covenants was $11.1 billion and there were no outstanding amounts for liens and pledges. The
Company expects to remain in compliance with all covenants and other requirements set forth in its credit

44
agreements and indentures for the foreseeable future. None of the Company’s significant debt agreements limit
access to stated borrowing levels or require accelerated repayment in the event of a decrease in the Company’s
credit rating.
New Accounting Standards
In December 2011, the FASB issued Accounting Standards Update (ASU) No. 2011-11, “Balance Sheet (Topic
210): Disclosures about Offsetting Assets and Liabilities.” ASU No. 2011-11 requires additional quantitative and
qualitative disclosures of gross and net information regarding financial instruments and derivative instruments that
are offset or eligible for offset in the consolidated statement of financial position. ASU No. 2011-11 will be effective
for the Company for the quarter ending December 31, 2013. The adoption of this guidance will have no impact on
the Company’s consolidated financial condition and results of operations.
In September 2011, the FASB issued ASU No. 2011-09, “Compensation – Retirement Benefits – Multiemployer
Plans (Subtopic 715-80): Disclosures about an Employer’s Participation in a Multiemployer Plan.” ASU No. 2011-
09 requires additional quantitative and qualitative disclosures about an employer’s participation in multiemployer
pension plans, including disclosure of the name and identifying number of the significant multiemployer plans in
which the employer participates, the level of the employer’s participation in the plans, the financial health of the
plans and the nature of the employer commitments to the plans. ASU No. 2011-09 will be effective for the Company
for the fiscal year ending September 30, 2012. The adoption of this guidance will have no impact on the Company’s
consolidated financial condition and results of operations.
In September 2011, the FASB issued ASU No. 2011-08, “Intangibles – Goodwill and Other (Topic 350): Testing
Goodwill for Impairment.” ASU No. 2011-08 provides companies an option to perform a qualitative assessment to
determine whether further goodwill impairment testing is necessary. If, as a result of the qualitative assessment, it is
determined that it is more likely than not that a reporting unit’s fair value is less than its carrying amount, the two-
step quantitative impairment test is required. Otherwise, no further testing is required. ASU No. 2011-08 will be
effective for the Company for goodwill impairment tests performed in the fiscal year ending September 30, 2013,
with early adoption permitted. The adoption of this guidance will have no impact on the Company’s consolidated
financial condition and results of operations.
In June 2011, the FASB issued ASU No. 2011-05, “Comprehensive Income (Topic 220): Presentation of
Comprehensive Income.” ASU No. 2011-05 eliminates the option to present components of other comprehensive
income as part of the statement of shareholders’ equity. All non-owner changes in shareholders’ equity instead must
be presented either in a single continuous statement of comprehensive income or in two separate but consecutive
statements. ASU No. 2011-05 will be effective for the Company for the quarter ending December 31, 2012. The
adoption of this guidance will have no impact on the Company’s consolidated financial condition and results of
operations.
In May 2011, the FASB issued ASU No. 2011-04, “Fair Value Measurement (Topic 820): Amendments to Achieve
Common Fair Value Measurement and Disclosure Requirements in U.S. GAAP and IFRSs.” ASU No. 2011-04
clarifies and changes the application of various fair value measurement principles and disclosure requirements, and
was effective for the Company beginning in the second quarter of fiscal 2012 (January 1, 2012). The adoption of this
guidance had no impact on the Company’s consolidated financial condition and results of operations. Refer to Note
14, “Fair Value Measurements,” of the notes to condensed consolidated financial statements for disclosures
surrounding the Company’s fair value measurements.
Other Financial Information
The interim financial information included in this Quarterly Report on Form 10-Q has not been audited by
PricewaterhouseCoopers LLP (PwC). PwC has, however applied limited review procedures in accordance with
professional standards for reviews of interim financial information. Accordingly, you should restrict your reliance
on their reports on such information. PwC is not subject to the liability provisions of Section 11 of the Securities Act
of 1933 for their reports on the interim financial information because such reports do not constitute “reports” or
“parts” of the registration statements prepared or certified by PwC within the meaning of Sections 7 and 11 of the
Securities Act of 1933.

45
ITEM 3. QUANTITATIVE AND QUALITATIVE DISCLOSURES ABOUT MARKET RISK
As of March 31, 2012, the Company had not experienced any adverse changes in market risk exposures that
materially affected the quantitative and qualitative disclosures presented in the Company's Annual Report on Form
10-K for the year ended September 30, 2011.
ITEM 4. CONTROLS AND PROCEDURES
Evaluation of Disclosure Controls and Procedures
Under the supervision and with the participation of our management, including our principal executive officer and
principal financial officer, we conducted an evaluation of our disclosure controls and procedures, as such term is
defined under Rule 13a-15(e) promulgated under the Securities Exchange Act of 1934, as amended (Exchange Act).
Based upon their evaluation of these disclosure controls and procedures, the principal executive officer and principal
financial officer concluded that the disclosure controls and procedures were effective as of March 31, 2012 to ensure
that information required to be disclosed by the Company in the reports it files or submits under the Exchange Act is
recorded, processed, summarized and reported, within the time period specified in the SEC’s rules and forms, and to
ensure that information required to be disclosed by the Company in the reports it files or submits under the
Exchange Act is accumulated and communicated to the Company’s management, including its principal executive
and principal financial officers, as appropriate, to allow timely decisions regarding disclosure.
Changes in Internal Control Over Financial Reporting
Except as noted below, there have been no significant changes in the Company’s internal control over financial
reporting during the three months ended March 31, 2012 that have materially affected, or are reasonably likely to
materially affect, the Company’s internal control over financial reporting.
The Company is undertaking the implementation of new enterprise resource planning (“ERP”) systems in certain
businesses, which will occur over a period of several years. As the phased roll-out of the new ERP systems occurs,
the Company may experience changes in internal control over financial reporting. No significant changes were made
to the Company’s current internal control over financial reporting as a result of the implementation of the new ERP
systems during the three months ended March 31, 2012.
PART II. OTHER INFORMATION
ITEM 1. LEGAL PROCEEDINGS
As noted in Item 1 to the Company’s Annual Report on Form 10-K for the year ended September 30, 2011,
liabilities potentially arise globally under various environmental laws and worker safety laws for activities that are
not in compliance with such laws and for the cleanup of sites where Company-related substances have been released
into the environment.
Currently, the Company is responding to allegations that it is responsible for performing environmental remediation,
or for the repayment of costs spent by governmental entities or others performing remediation, at approximately 42
sites in the United States. Many of these sites are landfills used by the Company in the past for the disposal of waste
materials; others are secondary lead smelters and lead recycling sites where the Company returned lead-containing
materials for recycling; a few involve the cleanup of Company manufacturing facilities; and the remaining fall into
miscellaneous categories. The Company may face similar claims of liability at additional sites in the future. Where
potential liabilities are alleged, the Company pursues a course of action intended to mitigate them.
The Company accrues for potential environmental liabilities in a manner consistent with accounting principles
generally accepted in the United States; that is, when it is probable a liability has been incurred and the amount of
the liability is reasonably estimable. Reserves for environmental liabilities totaled $26 million, $30 million and $45
million at March 31, 2012, September 30, 2011 and March 31, 2011, respectively. The Company reviews the status
of its environmental sites on a quarterly basis and adjusts its reserves accordingly. Such potential liabilities accrued

46
by the Company do not take into consideration possible recoveries of future insurance proceeds. They do, however,
take into account the likely share other parties will bear at remediation sites. It is difficult to estimate the Company's
ultimate level of liability at many remediation sites due to the large number of other parties that may be involved,
the complexity of determining the relative liability among those parties, the uncertainty as to the nature and scope of
the investigations and remediation to be conducted, the uncertainty in the application of law and risk assessment, the
various choices and costs associated with diverse technologies that may be used in corrective actions at the sites, and
the often quite lengthy periods over which eventual remediation may occur. Nevertheless, the Company does not
currently believe that any claims, penalties or costs in connection with known environmental matters will have a
material adverse effect on the Company's financial position, results of operations or cash flows. In addition, the
Company has identified asset retirement obligations for environmental matters that are expected to be addressed at
the retirement, disposal, removal or abandonment of existing owned facilities, primarily in the power solutions
business. At March 31, 2012, September 30, 2011 and March 31, 2011, the Company recorded conditional asset
retirement obligations of $84 million, $91 million and $90 million, respectively.
The Company is involved in a number of product liability and various other casualty lawsuits incident to the
operation of its businesses. Insurance coverages are maintained and estimated costs are recorded for claims and suits
of this nature. It is management's opinion that none of these will have a material adverse effect on the Company's
financial position, results of operations or cash flows. Costs related to such matters were not material to the periods
presented.
ITEM 1A. RISK FACTORS
There have been no material changes to the disclosure regarding risk factors presented in Item 1A to the Company’s
Annual Report on Form 10-K for the year ended September 30, 2011, as updated in Part II, Item 1A of the
Company’s Quarterly Report on Form 10-Q for the quarter ended December 31, 2011.
ITEM 2. UNREGISTERED SALES OF EQUITY SECURITIES AND USE OF PROCEEDS
In September 2006, the Company’s Board of Directors authorized a stock repurchase program to acquire up to $200
million of the Company’s outstanding common stock. Stock repurchases under this program may be made through
open market, privately negotiated transactions or otherwise at times and in such amounts as Company management
deems appropriate. The stock repurchase program does not have an expiration date and may be amended or
terminated by the Board of Directors at any time without prior notice.
The Company entered into an Equity Swap Agreement, dated March 13, 2009, with Citibank, N.A. (Citibank). The
Company selectively uses equity swaps to reduce market risk associated with its stock-based compensation plans,
such as its deferred compensation plans. These equity compensation liabilities increase as the Company’s stock
price increases and decrease as the Company’s stock price decreases. In contrast, the value of the Equity Swap
Agreement moves in the opposite direction of these liabilities, allowing the Company to fix a portion of the
liabilities at a stated amount.
In connection with the Equity Swap Agreement, Citibank may purchase unlimited shares of the Company’s stock in
the market or in privately negotiated transactions. The Company disclaims that Citibank is an “affiliated purchaser”
of the Company as such term is defined in Rule 10b-18(a)(3) under the Securities Exchange Act or that Citibank is
purchasing any shares for the Company. The Equity Swap Agreement has no stated expiration date. The net effect of
the change in fair value of the Equity Swap Agreement and the change in equity compensation liabilities was not
material to the Company’s earnings for the three months ended March 31, 2012.

47
The following table presents information regarding the repurchase of the Company’s common stock by the
Company as part of the publicly announced program and purchases of the Company’s common stock by Citibank in
connection with the Equity Swap Agreement during the three months ended March 31, 2012.
Approximate Dollar
Total Number of Value of Shares that
Shares Purchased as May Yet be
Total Number of Average Price Part of the Publicly Purchased under the
Period Shares Purchased Paid per Share Announced Program Programs
1/1/12 - 1/31/12
Purchases by Company (1) - - - $ 102,394,713
2/1/12 - 2/29/12
Purchases by Company (1) 605,900 $ 33.28 605,900 $ 82,228,915
3/1/12 - 3/31/12
Purchases by Company (1) 399,595 $ 31.87 399,595 $ 69,494,586
1/1/12 - 1/31/12
Purchases by Citibank - - - NA
2/1/12 - 2/29/12
Purchases by Citibank - - - NA
3/1/12 - 3/31/12
Purchases by Citibank - - - NA
(1) Repurchases of the Company's common stock by the Company may be intended to partially offset dilution related to
our stock option and restricted stock equity compensation plans.
ITEM 6. EXHIBITS
Reference is made to the separate exhibit index contained on page 49 filed herewith.

48
SIGNATURES
Pursuant to the requirements of the Securities Exchange Act of 1934, the registrant has duly caused this report to be
signed on its behalf by the undersigned thereunto duly authorized.
JOHNSON CONTROLS, INC.
Date: May 3, 2012 By: /s/ R. Bruce McDonald
R. Bruce McDonald
Executive Vice President and
Chief Financial Officer

49
JOHNSON CONTROLS, INC.
Form 10-Q
INDEX TO EXHIBITS
Exhibit No. Description
15 Letter of PricewaterhouseCoopers LLP, Independent Registered Public Accounting Firm, dated
May 3, 2012, relating to Financial Information.
31.1 Certification by the Chief Executive Officer pursuant to Section 302 of the Sarbanes-Oxley Act of
2002.
31.2 Certification by the Chief Financial Officer pursuant to Section 302 of the Sarbanes-Oxley Act of
2002.
32 Certification of Periodic Financial Report by the Chief Executive Officer and Chief Financial
Officer pursuant to Section 906 of the Sarbanes-Oxley Act of 2002.
101 The following materials from Johnson Controls, Inc.’s Quarterly Report on Form 10-Q for the
quarter ended March 31, 2012, formatted in XBRL (Extensible Business Reporting Language): (i)
the Condensed Consolidated Statements of Financial Position, (ii) the Consolidated Statements of
Income, (iii) the Consolidated Statements of Cash Flows, and (iv) Notes to Condensed
Consolidated Financial Statements, filed herewith.

Exhibit 15
May 3, 2012
Securities and Exchange Commission 100 F Street, N.E. Washington, DC 20549 Re: Johnson Controls, Inc. Registration Statement Nos. 33-57685, 33-64703, 333-13525, 333-59594, 333-111192, 333-130714, 333-155802, 333-157502, 333-178148 and 333-179613 on Form S-3 and 33-30309, 33-31271, 33-58092, 33-58094, 333-10707, 333-66073, 333-41564, 333-141578, 333-117898 and 333-173326 on Form S-8. Commissioners: We are aware that our report dated May 3, 2012 on our review of interim financial information of Johnson Controls, Inc. (the "Company") as of and for the three-month and six-month periods ended March 31, 2012 and 2011 and included in the Company's quarterly report on Form 10-Q for the quarter ended March 31, 2012 is incorporated by reference in the above referenced Registration Statements. Very truly yours, /s/ PricewaterhouseCoopers LLP Milwaukee, Wisconsin

Exhibit 31.1
CERTIFICATIONS
I, Stephen A. Roell, Chairman and Chief Executive Officer, of Johnson Controls, Inc., certify that:
1. I have reviewed this quarterly report on Form 10-Q of Johnson Controls, Inc.;
2. Based on my knowledge, this report does not contain any untrue statement of a material fact or omit to state a
material fact necessary to make the statements made, in light of the circumstances under which such statements
were made, not misleading with respect to the period covered by this report;
3. Based on my knowledge, the financial statements, and other financial information included in this report, fairly
present in all material respects the financial condition, results of operations and cash flows of the registrant as
of, and for, the periods presented in this report;
4. The registrant’s other certifying officer and I are responsible for establishing and maintaining disclosure
controls and procedures (as defined in Exchange Act Rules 13a-15(e) and 15d-15(e)) and internal control over
financial reporting (as defined in Exchange Act Rules 13a-15(f) and 15d-15(f)) for the registrant and have:
a. Designed such disclosure controls and procedures, or caused such disclosure controls and procedures
to be designed under our supervision, to ensure that material information relating to the registrant,
including its consolidated subsidiaries, is made known to us by others within those entities, particularly
during the period in which this report is being prepared;
b. Designed such internal control over financial reporting, or caused such internal control over financial
reporting to be designed under our supervision, to provide reasonable assurance regarding the
reliability of financial reporting and the preparation of financial statements for external purposes in
accordance with generally accepted accounting principles;
c. Evaluated the effectiveness of the registrant’s disclosure controls and procedures and presented in this
report our conclusions about the effectiveness of the disclosure controls and procedures, as of the end
of the period covered by this report based on such evaluation; and
d. Disclosed in this report any change in the registrant’s internal control over financial reporting that
occurred during the registrant’s most recent fiscal quarter (the registrant’s fourth fiscal quarter in the
case of an annual report) that has materially affected, or is reasonably likely to materially affect, the
registrant’s internal control over financial reporting; and
5. The registrant’s other certifying officer and I have disclosed, based on our most recent evaluation of internal
control over financial reporting, to the registrant’s auditors and the audit committee of registrant’s board of
directors (or persons performing the equivalent functions):
a. All significant deficiencies and material weaknesses in the design or operation of internal control over
financial reporting which are reasonably likely to adversely affect the registrant’s ability to record,
process, summarize and report financial information; and
b. Any fraud, whether or not material, that involves management or other employees who have a
significant role in the registrant’s internal control over financial reporting.
Date: May 3, 2012
/s/ Stephen A. Roell
Stephen A. Roell
Chairman and Chief Executive Officer

Exhibit 31.2
CERTIFICATIONS
I, R. Bruce McDonald, Executive Vice President and Chief Financial Officer of Johnson Controls, Inc., certify that:
1. I have reviewed this quarterly report on Form 10-Q of Johnson Controls, Inc.;
2. Based on my knowledge, this report does not contain any untrue statement of a material fact or omit to state a
material fact necessary to make the statements made, in light of the circumstances under which such statements
were made, not misleading with respect to the period covered by this report;
3. Based on my knowledge, the financial statements, and other financial information included in this report, fairly
present in all material respects the financial condition, results of operations and cash flows of the registrant as
of, and for, the periods presented in this report;
4. The registrant’s other certifying officer and I are responsible for establishing and maintaining disclosure
controls and procedures (as defined in Exchange Act Rules 13a-15(e) and 15d-15(e)) and internal control over
financial reporting (as defined in Exchange Act Rules 13a-15(f) and 15d-15(f)) for the registrant and have:
a. Designed such disclosure controls and procedures, or caused such disclosure controls and procedures
to be designed under our supervision, to ensure that material information relating to the registrant,
including its consolidated subsidiaries, is made known to us by others within those entities, particularly
during the period in which this report is being prepared;
b. Designed such internal control over financial reporting, or caused such internal control over financial
reporting to be designed under our supervision, to provide reasonable assurance regarding the
reliability of financial reporting and the preparation of financial statements for external purposes in
accordance with generally accepted accounting principles;
c. Evaluated the effectiveness of the registrant’s disclosure controls and procedures and presented in this
report our conclusions about the effectiveness of the disclosure controls and procedures, as of the end
of the period covered by this report based on such evaluation; and
d. Disclosed in this report any change in the registrant’s internal control over financial reporting that
occurred during the registrant’s most recent fiscal quarter (the registrant’s fourth fiscal quarter in the
case of an annual report) that has materially affected, or is reasonably likely to materially affect, the
registrant’s internal control over financial reporting; and
5. The registrant’s other certifying officer and I have disclosed, based on our most recent evaluation of internal
control over financial reporting, to the registrant’s auditors and the audit committee of registrant’s board of
directors (or persons performing the equivalent functions):
a. All significant deficiencies and material weaknesses in the design or operation of internal control over
financial reporting which are reasonably likely to adversely affect the registrant’s ability to record,
process, summarize and report financial information; and
b. Any fraud, whether or not material, that involves management or other employees who have a
significant role in the registrant’s internal control over financial reporting.
Date: May 3, 2012
/s/ R. Bruce McDonald
R. Bruce McDonald
Executive Vice President and
Chief Financial Officer

Exhibit 32
CERTIFICATION OF PERIODIC FINANCIAL REPORTS
We, Stephen A. Roell, Chairman and Chief Executive Officer, and R. Bruce McDonald, Executive Vice President
and Chief Financial Officer, of Johnson Controls, Inc., certify, pursuant to Section 906 of the Sarbanes-Oxley Act of
2002, that:
1. the Quarterly Report on Form 10-Q for the quarter ended March 31, 2012 (Periodic Report) to which this
statement is an exhibit fully complies with the requirements of Section 13(a) or 15(d) of the Securities
Exchange Act of 1934 (15 U.S.C. 78m or 78o(d)) and
2. information contained in the Periodic Report fairly presents, in all material respects, the financial condition and
results of operations of Johnson Controls, Inc.
Date: May 3, 2012
/s/ Stephen A. Roell
Stephen A. Roell
Chairman and Chief Executive Officer
/s/ R. Bruce McDonald
R. Bruce McDonald
Executive Vice President and
Chief Financial Officer