UNITED STATES OF GEOLOGICAL SURVEY - Alaska...
57
UNITED STATES DEPARTMENT OF THE INTERIOR GEOLOGICAL SURVEY 1985 Field Studies, Beaufort and Chukchi Seas, Conducted from the NOAA Ship Discoverer Joyce M. Miley, Peter W. Barnes Editors Open-File Report 86-202 This report is preliminary and has not been reviewed for conformity with U.S. Geolog- ical Survey editorial standards and stratigraphic nomenclature. Any use of trade names is for descriptive purposes only and does not imply endorsement by the USGS. Menlo Park, California
Transcript of UNITED STATES OF GEOLOGICAL SURVEY - Alaska...

UNITED STATES DEPARTMENT OF THE INTERIOR
GEOLOGICAL SURVEY
1985 Field Studies, Beaufort and Chukchi Seas,
Conducted from the NOAA Ship Discoverer
Joyce M. Miley, Peter W. Barnes Editors
Open-File Report 86-202
This report is preliminary and has not been reviewed for conformity with U.S. Geolog- ical Survey editorial standards and stratigraphic nomenclature. Any use of trade names is for descriptive purposes only and does not imply endorsement by the USGS.
Menlo Park, California

MARINE GEOLOGICAL STUDIES IN THE BEAUFORT AND CHUKCHI SEAS
INTRODUCTION. METHODS. AND EQUIPMENT Peter W . Barnes; Joyce M . Miley. and R . Lawrence Phillips
.............................................................................................................. Introduction ................................................................................ Weather and Ice Limitations
Methods & Equipment .......................................................................................... Geophysical Sampling Tools ..............................................................................
..................................................................................... Seafloor Sampling Tools Data ..........................................................................................................................
................................................................................................................ Tracklines ............................................................................................................... Vi bracores
Gravity Cores .......................................................................................................... Box Cores ................................................................................................................ Pipe Dredges ........................................................................................................... TV & Camera Stations ...................................................................................... Biology .....................................................................................................................
OBSERVATIONS AND PRELIMINARY INTERPRETATIONS
SEDXMENTOLOGY AND STRATIGRAPHY IN THE BEAUFORT SEA ........ Peter W . Barnes ................................................................................................
GEOPHYSICAL DATA FROM THE UPPER CONTINENTAL SLOPE IN THE BEAUFORT SEA ....... James Robb .........................................................
BEAUFORT SEA ICE GOUGE STUDIES .......... Douglas M . Rearic ...................... Introduction ............................................................................................................
........................................................................................................... Observations ............................................................................................................ Conclusions
BATHYMETRY IN THE WSTERN BEAUFORT SEA .......... Steven D . Clark
Results .................................................................................................................... GEOTECHNICAL SAMPLING .................... Robert E . Kayen ............................... SEDIMENTOLOGY & STRATIGRAPHY IN THE CHUKCHI SEA .......... R .
............................................................................................... Lawrence Phillips ................................................................................................ Subsurface Geology
Holocene-Quaternary Shelf Stratigraphy.. Outer Shelf .......................................... Inner Shelf ............................................................................................................... Surficial Sediments .................................................................................................

........... .......... PEBBLE LITHOLOGY IN THE CHUKCHI SEA Pedm C. Ramirez 54 Discussion ............................................................................................................... 5 6
......................................................................................... REFERENCES CWED 57
MARINE GEOLOGICAL STUDIES IN THE BEAUFORT AND CHUKCHI SEAS
INTRODUCTION, METHODS, AND EQUIPMENT Peter W. Barnes, Joyce M. Miley, and R. hwrence Phillips
Introduction
Scientific studies were conducted in the Beaufort and Chukchi Seas from 5 Sep- tember to 6 October, 1985. The broad objectives of the cruise was to provide the Ocean Assessments Division, Alaska Office, Outer Continental Shelf Environmental Assessment Program with: 1) comprehensive data and information on the Alaskan Outer Continental Shelf; 2) a better definition and refinement of ecological processes and the probable impact of oil exploration and production; and 3) a data base for ecosystem models. The objective of the Geological Survey in this continuing program is to adequately describe the geologic environment of the Chukchi and Beaufort Seas (Figs. la & lb) and to make recommendations about drilling operations in lease sale areas.
The specific objectives of the 1985 cruise were to ascertain the sedimentary and geotechnical character of ice and current impacted sediments on the mid to outer con- tinental shelf. Data were gathered from over 1400 nautical miles of tracklines (Fig. la and larger detailed trackline maps, Plates 1-5) and 72 sampling stations (Fig. lb and Plates 1-5) to supplement our knowledge of ice gouging, current scour and slope sta- bility processes at high latitudes.
Operations were performed from the NOAA ship Discoverer, under the command of Captain Sigmund Petersen. Captain Petersen's officers and crew provided naviga- tion, winch operation, rigging, equipment repair, maintenance, and fabrication in addi- tion to an exceptionally congenial and productive working atmosphere.
The scientific staff was directed by Larry Phillips and Peter Barnes and consisted of colleagues from the U.S. Geological Survey Office of Marine Geology in Menlo Park, California and Woods Hole, Massachusetts (Table 1).
This study was funded in part by the hnerals Management Service through interagency agreement with the National Oceanic and Atmospheric Administration, as part of the Outer Continental Shelf Evironmental Assessment Program.

Figure l a - Trackline coverage of the Bcaufort-Chukchi Seas from the NOAA Ship Discoverer, 1985.
Figure l b - Station locations Beaufort-Chukchi Seas from NOAA Ship Discoverer, 1985.

Table 1 : SCIENTIFIC PERSONNEL
NAME TITLE Peter Barnes Geologist Lamy Phillips Geologist Jim Robb Lany Kooker Jon Erickson Jeff Stampfer Steve Clark . Mitch Colgan Sarah Griscom Rob Kayen Joyce Miley Jared Morrow Doug Rearic George Redden Peter Rarnirez Tom Reiss
Geologist '
Electronics Technician Lead Marine Technician Marine Technician Physical Science Technician Bio-Geologist Geologic Field Assistant Engineering Geologist Geologist Geologic Field Assistant Geologist Geochemist Geologist Physical Science Technician
Weather and Ice Limitations
Ice was present in much of the intended working area from the start to the end of the cruise (Figs. 2a-e), initially restricting operations to the western Beaufort Sea and finally terminating all work north and east of Barrow on 16 September. Ice persisted Northeast of Peard Bay in the Chukchi Sea and precluded exploration of this area. Ice free conditions near Wrangle Island allowed us to work further north than in previous years and provided an important addition to our data set. Operations were hindered by high winds and rough seas less than 5% of the time due to the presence of ice and the general stability of the Discoverer as a working platform.

Figure 2a - Plot of sea ice edge in the Beaufort-Chukchi Seas, from August 29 to September 6, 1985. Data Source: Alaskan North Slope Ice Analysis Navy - NOAA Joint Ice Center. Sea ice edge is defined by the line separating sea ice free and 0/10 ice coverage areas from areas with greater than Of 10 ice coverage.


Metho
Geophys~ca~ ziarnpnng Tools
Trackline surveys (Plates 1-5) during the 1985 arctic cruise employed side-scan sonar, 3.5kHz sub-bottom profiler, high resolution seismic system and 3.5 kHz bathy- metry.
Klein Associates 50 kHz, 100 kHz, and 500 kHz side-scan sonar systems were used during the cruise. The fish were towed at 10 to 50 meters above the bottom, depending on instrument scale and water depth. Most data were gathered using the 500 kHz fish on 100 meter scan width, with the fish towed 8-12 meters off the seafloor. The tow depth limit with the side-scan fish and sub-bottom profiler combination was found to be about 50 meters at 4.5 knots with a 300 m cable. The side-scan provided seabed sonar data recorded with a Klein wet-paper recorder (Model 53 IT), using SO, 100 and 200 meter scales and paper speeds of 50 and 60 lines per centimeter. The side-scan also contained a 3.5 kHz sub-bottom profiler which provided detailed sea- floor relief and shallow sub-bottom stratigraphy. Subsurface reflections to depths of 15 meters were achieved under optimum conditions. Data from the 3.5 kHz profiler were recorded on a dry paper EPC recorder (Model 1600s) recording at 165 lines per inch at sweep rates of 0.10 and 0.05 seconds.
An Ocean Research and Engineering (ORE) Geopulse boomer plate (Model 5813A) driven by an ORE Model 5420A power supply provided a high resolution seismic source for information on the shallow sub-bottom strata. The ORE Geopulse supply was configured for 175 joules power output at 4 pulses per second (pps) firing rate. The 6 db noise spectrum produced extends from 500 Hz to approximately 10 kHz. Due to premature energy storage capacitor failure, the Geopulse driving unit was replaced with an EG&G 234 Uniboom energy source. The EG&G source was configured to a power output level of only 100 joules at 4 pps. The lower energy of the EG&G power supply resulted in a slight reduction in maximum penetration of sub-bottom strata.
The high resolution seismic signal was picked up with a single channel, 30 ele- ment, parallel wired, Benthos Hydrophone with a 5 meter active section. The received signals were recorded on an EPC Model 3200s dry paper recorder using a 0.25 second sweep and fire through a double set of Khronhite filters and a TSS amplifier-signal conditioning system. Sub-bottom penetrations in excess of 50 meters were achieved under optimum conditions.
Side-scan sonar, 3.5 kHz sub-bottom profiler and boomer data were also recorded on a Hewlett-Packard Model 3968A 8 track instrumentation recorder for later process- ing. Recording rates were 3 314 inches per second for acceptable side-scan playback and 1 7/8 inches per second when only seismic data were desired.

Bathymetry was recorded from a 3.5 kHz transducer mounted in the ships hull. The transducer was driven by a Raytheon PTR 105C 2KW transceiver whose return signals were recorded on a Raytheon LSR 1807M 4 bit digital linescan recorder at 0.10 second sweep with 0.25 second fh.
Seafloor Sampling Tools
Seafloor sampling was carried out using an Alpine Vibracore, a Naval Electronics Lab (Reinek type) box corer, gravity corer and pipe dredge. Observations were also obtained from a combination TV and 35 mm camera sled.
The major sampling tool was an Alpine Vibracorer, which consists of a 6 m steel barrel containing a 8.8 cm liner, core cutter and catcher. The vibracorer is driven by a 250 cubic feet per minute (cfrn) compressor at 120 psi. About halfway through the cruise the 250 cfm compressor was replaced by one of 185 cfm which was found to be adequate although the core barrel did not penetrate as rapidly.
Vibracore penetration was measured from a potentiometer which could be read to the nearest 0.1 foot. We often obtained longer cores than would be suggested by the penetration records, both from the recording device and from measuring the mud line on the side of the vibracore barrel. We have no good explanation for this phenomenon, as the cores are expected to be shorter than the recorded penetration due to sediment compaction. Several theories have been considered to explain the recovery of excess core. One idea is faulty potentiometer equipment but this is probably not the cause because the recorded observations correspond to the penetration measured by the level of mud on the outside of the core barrel. Excess core over penetration can also be achieved by sinking the corer frame into the sediments, thus achieving a sample without the potentiometer showing any penetration. The generally competent sedi- ments and recoveries of up to 150 crn in excess core do not favor this interpretation. A simple suggestion is the upward vibrations of the core barrel allowed excess material to flow under the core nose and be driven into the coreliner on subsequent downward motions of the core barrel. This interpretation is favored as the long vibra- tion times, 15-20 minutes, would favor and enhance inclusion of additional core hole materials.
A thermoprobe was attached to the side of the corer at several sampling locations (Table 2). This device consisted of three precision thermistors housed within quarter inch steel tubing. To reduce the thermal effects of the core penetration and to allow for rapid thermal equilibrium the thermistor was held 4 cm away from the core barrel with steel stand-offs. Each steel stand-off was at least 10 cm away from a thermistor. The themistors were spaced one meter apart with the fkst one 34 cm from the nose of the corer. Unfortunately, the resistance records indicate that the vibracore released a significant quantity of heat of friction to the sediments from the barrel and perhaps from the quarter inch steel tubing. The effects of this heating were most pronounced in the thermistor nearest the nose of the corer. The thermistor resistances were read with

P Kiethley 173A 4.5 digit multimeter and were recorded on an Anadex 650 printer at 320 ms intervals.
Table 2: Thermoprobe Sample Sites
SAMPLE CORE CORE LOCATION NUMBER LENGTH (cm)
12 12-16VS 113 12 12- 17VS 361 12 12- 18VS 318 58 58-76VS 303 61 61-81VS 365
The box corer samples a 31x22~60 cm segment of the seafloor. Full penetration to 60 cm depths were common in soft muds on the outer shelf, while boxes less than half full were recovered in sandy and erosional inshore environments.
The gravity corer was used to sample the sediments on the upper continental slope at depths to deep to vibracore. The gravity corer consists of a 1000 kg weight atop a 3 meter lined barrel with core cutter and catcher. Cores of 2 meters were routinely recovered.
The 40-cm diameter pipe dredge was used to collect bottom samples in areas of abundant gravels and biota.
A Hydroproducts TV was used in conjunction with an Benthos 35 mm still cam- era to observe and photograph the seafloor. The records were saved on Kodak Tri-X film and VHS video tapes.
Navigation control for tracklines and sample sites consist of satellite navigation from a Magnavox 1105 single channel transit SATIOMEGA receiver coupled with a Amatec doppler sonar and Sperry Mark 14 gyro compass for dead reckoning input. The fhal navigation plots were smoothed (Plates 1-5) and are believed to be generally accurate within a quarter of a mile for trackline locations and within a tenth of a mile for sampling stations. Loran C and radar were not useful due to the poor reception of the former and the lack of radar targets along the low coastline of the Beaufort and Chukchi Seas.
Biological subsamples were obtained from box cores and dredges collected in the Chukchi sea. Micropaleontology samples were collected from the upper 2 cm of box cores and preserved in a solution of ethanol, sea water, sodium borate, and rose Bengal powder for later identification of living fauna. Macrofauna were identified in the field and separated into individual containers with buffered forrnalin when appropriate.

Data
The type, locanon and extent of data obtained during this cruise are given in Figs. 3-7 and Tables 3-8, A total of more than 2600 km of geophysical trackline data were obtained (Fig. la and Plates 1-S), and 72 stations (Fig. lb and Plates 1-5) were occu- pied. Specific samples were collected for geotechnical and engineering studies along with interstitial gas, biological and foram samples.
The data is in the form of 22 rolls of 3.5 kHz bathymetry, 56 rolls of side-scan sonar sonographs, 31 rolls of high-resolution seismic records, 43 rolls of subbottom profile records, 92 magnetic tapes, and the ship's log. The ship's log contains impor- tant information on systems in use on each line, system settings (scale, filters, etc.), navigational data used in plotting the lines and information on unique observations or system difficulties. Microfilm of all paper geophysical field data are available from the National Geophysical and Solar Terrestial Data Center, NOAA, Boulder, Colorado. Original geophysical records, cores, film, and other samples are at the U.S. Geological Survey, Deer Creek Facility, 3475 beer Creek Road, Palo Alto, California 94304.
The data presented here are currently being studied by the authors as part of a long-term study. The authors may be contacted for a bibliography of publications based on the above data and data from previous years.

Table 3: 1985 Trackline & Geophysical Records
(all distances are in kilometers)
LINE #
Tran 0 Tran 1 Tran 2 01 02 03 04 05 06 07 08 09 10 11 12 13 14 15 16 17 18 19 20 21 22 23 24 25 26 27 28 29 30 3 1 32 33 34 35
DISTANCE (km) 51.9 27.6 46.7 14.3 55.7 33.3 22.6 15.7 43.5 12.0 21.7 4.3
35.7 18.5 3 1.5 15.0 18.1 7.4
77.2 6.3
52.8 77.4 5 1.7 36.5 77.6 63.5 7.8 6.7 9.4
47.6 8.0
10.0 71.9 14.4 54.1 44.3 43.2 78.0
3.5kHz BATHY
51.9 27.6 46.7 14.3 55.7 33.3 22.6 15.7 43.5 12.0 21.7 4.3
35.4 18.5 31.5 13.7 0 7.4
77.2 6.3
52.8 0
35.9 29.3 77.6 63.5 7.8 6.7 9.4
47.6 8.0
10.0 70.4 14.4 54.1 44.3 43.2 78.0
SIDE SCAN SONAR
0 0 0 0 0 0 0 0
43.5 8.5
21.7 4.3 0
18.5 30.4 0 0 0
61.5 6.3
43.3 0
50.6 9.4
74.6 63.5 7.8 6.7 0
36.1 8.0
10.0 69.5 14.4 44.8 44.3 43.2 74.5
SUB-BOTTOM ORE UNIBOOM
0 0 0 0 0
20.0 0 0 0 0 0 0
16.1 17.8 29.1 15.0 0 7.4
61.1 0
31.1 77.4 51.7 29.3 76.9 63.2 7.8 6.7 9.4
45.4 0 0
36.7 14.4 53.7 44.3 43.2 76.9

(all distances are in kilometers)
LTNE DISTANCE 3.5kHz SIDE STJB-BOTTOM ORE # (km) BATKY SCANSONAR PROFILER UNrBOOM
36 38.2 38.2 37.8 36.1 37.0 37 44.1 44.1 44.1 43.0 44.1 3 8 65.7 65.7 65.7 65.7 63.2 39 22.0 22.0 21.5 20.7 20.2 40 49.3 49.3 36.1 35.2 49.3 4 1 5.9 5.9 5.9 5.9 5.9 42 7.8 7.8 7.8 7.8 0 43 22.8 22.8 22.8 22.8 22.8 44 19.3 19.3 10.9 19.3 19.3 45 31.5 31.5 20.9 20.9 31.5 46 66.7 66.7 64.4 66.7 65.7 47 25.4 25.4 25.4 25.4 25.4 48 29.8 29.8 29.8 29.8 29.8 49 13.0 13.0 13.0 13.0 13.0 50 81.1 81.1 80.4 81.1 75.9 5 1 99.3 99.3 98.3 98.3 99.3 52 67.8 67.6 67.6 66.9 67.8 53 55.9 55.9 55.9 55.9 55.9 54 64.1 63.2 63.2 63.5 64.1 55 27.4 27.4 26.3 26.3 27.4 56 36.5 36.5 36.5 36.5 35.7 57 27.4 27.4 27.4 27.4 27.4 5 8 43.7 43.7 42.0 42.0 43.7 59 58.7 58.7 58.7 57.8 57.0 60 83.2 83.2 82.2 83.2 81.7 6 1 20.2 20.2 20.2 20.2 18.9 62 54.1 54.1 54.1 54.1 52.6 63 74.3 74.3 73.7 73.7 74.3 64 24.8 24.8 24.8 24.6 0
TOTAL 2470.6 2070.0 1882.4 206 1.3

Table 4: Vibracores
STATION NUMBER 07- 1 1VS 08- 12VS 09- 13VS 10- 14VS 12- 1 6VS 12- 17VS 12- 18VS 24-35VS 34-46VS 43-57vs 48-66VS 49-67VS 50-68VS 5 1-69VS 53-70VS 54-71VS 55-72VS 55-73VS 56-74vs 57-75vs 58-76VS 61-8lVS 62-82VS 63-83VS 64-84VS 65-85VS 66-86VS 67-87VS 69-91VS 70-92VS 71-93VS
JULIAN DATE
WATER LONGITUDE DEPTH (m) 153 45.3 46 154 59.9 18 154 50.1 46 154 59.9 28 155 15.2 22 155 15.2 22 155 15.2 22 161 29.6 41 161 56.8 26 162 26.5 46 164 42.7 29 164 54.7 42 165 06.0 43 165 38.0 41 165 54.8 47 166 15.0 46 165 55.1 45 165 55.1 45 165.57.6 44 167 51.9 49 167 36.2 49 1 w 00.7 37 163 35.2 31 163 39.1 26 165 24.9 47 1 H 45.4 45 1M 29.5 44 164 17.7 42 165 39.5 44 165 21.6 42 164 55.2 40
CORE LENGTH (cm)
510 350 141 - 38 1 113 361 3 18 122 230 198 169 150 205 242 605 545 48
282 595 154 303 365 410 260 266 541 44 1 456 232 270
0

Figure 3 - Vibracore locations Beaufort-Chukchi Seas, 1985.
- . Figure 4 - Gravity Core locations Beaufort-Chukchi Seas,1985.

Table 5: Gravity Cores
STATION NUMBER 01-01GE 01-02GS 02-03GE 02-04GS 03-05GE 04-06GE 04-07GS 05-OWE 06-09GE 06-1OGS 11-15GE 13-19GS 13-20GE 14-21GS 15-22GS 16-23GE 16-24GS 16-25GE 17-26GE 17-27GS 18-28GE 18-29GS 22-33GS 26-36GS 27-37GS 42-55GS
JULIAN DATE LONGITUDE
154 02.2 154 01.5 154 00.2 154 00.9 154 05.4 154 10.1 154 09.7 154 14.8 154 17.9 154 16.5 155 13.2 156 34.4 156 34.6 156 30.6 156 22.8 156 18.4 156 19.5 156 19.7 156 04.3 156 04.3 156 00.7 156 00.0 159 58.7 165 13.4 165 17.7 162 06.4
WATER CORE DEPTH (m) LENGTH (cm)
309 252

Table 6: Box Cores
STATION JULIAN WATER NUMBER 41-52BS 41-53BS 41-54BS 43-56BS 44-58BS 44-59BS 44-60BS 46-61BS 46-62BS 46-63BS 47-64BS 47-65BS 60-77BS 60-78BS 60-79VS 60-80BS 68-88BS 68-89BS 68-90BS
STATION NUMBER 19-30DS 20-3 IDS 21-32DS 23-34DS 25-35DS 32-44DS 3345DS 35-47DS 3648DS 37-49DS 39-5ODS 40-5 1 DS
DATE 269 269 269 270 270 27 1 271 27 1 27 1 271 272 272 276 276 276 276 278 278 278
Table 7: Pipe Dredges
JULIAN DATE
259 259 259 260 261 263 263 268 268 268 269 269
DEPTH (m) 49
WATER LATITUDE LONGITUDE DEPTH (m)
71 54.5 156 23.8 62
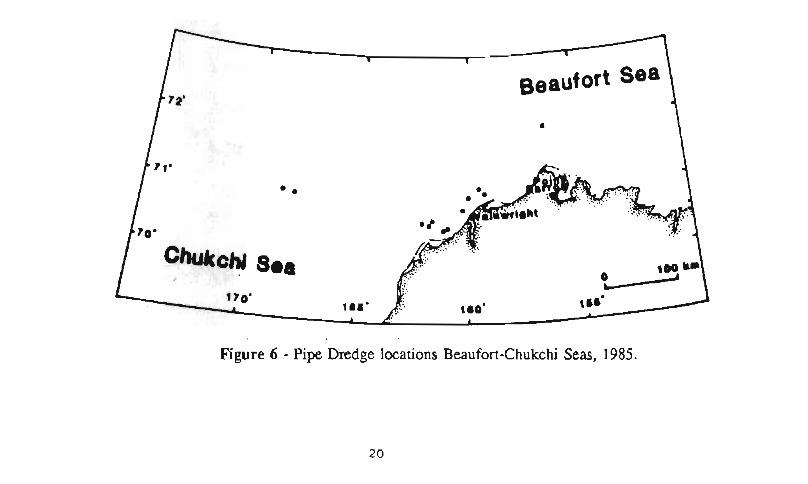
Figure 6 - Pipe Dredge locations Beaufort-Chukchi Seas, 1985.

Table 8: TV & Camera Stations
STATION NUMBEI
mIAN ATE LATITUDE
70 36.5 71 17.5 71 36.1 71 38.6 70 30.5 70 35.6 70 38.3 70 29.8 70 34.5 70 46.4 70 54.1 71 26.2 71 02.1 71 06.2 70 35.4 70 38.7 70 36.6 70 37.6 70 06.7 69 07.5
WATER LONGITUDE DEPTH (m)
Figure 7 - TV and Camera locations Beaufort-Chukchi Seas, 1985.

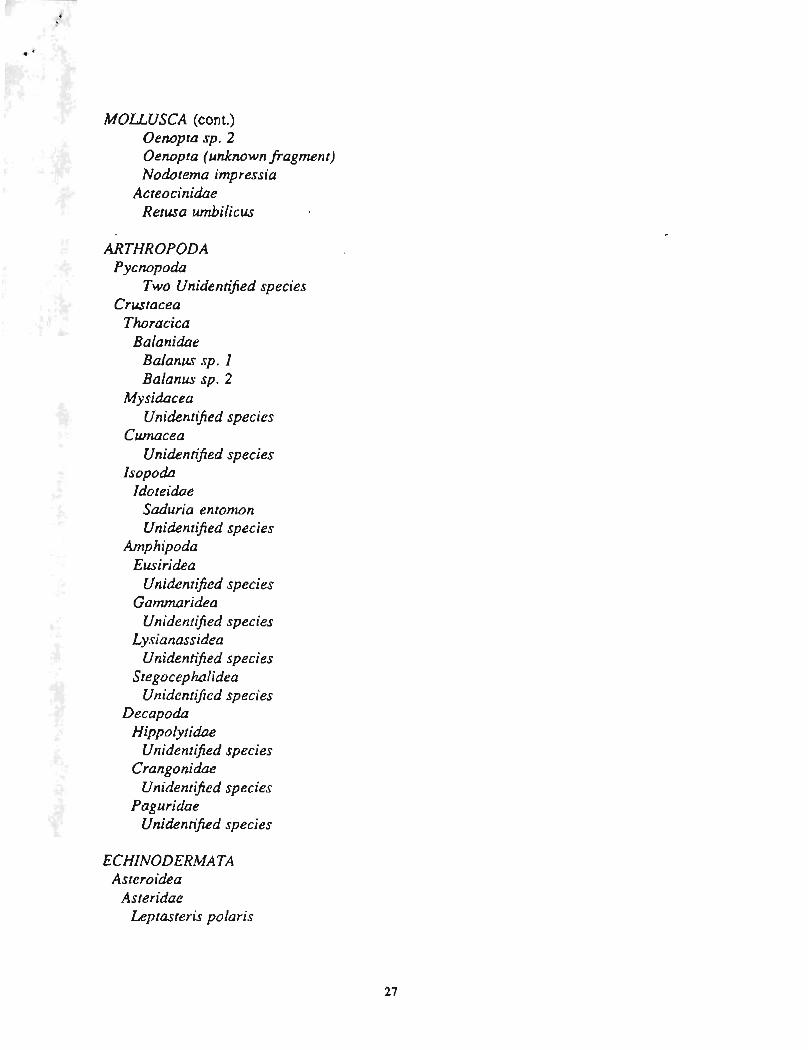
Biology
Biological specimens collected fmm box cores and pipe dredges (Figs. 5 8r 6, and Tables 6 & 7) in the Chukchi Sea have been identified by Mitchell W. Colgan and are presently being curated at the U.S. Geological Survey, Deer Creek Facility, 3475 Deer Creek Road, Palo Alto, California Plans are to submit these specimen to repositories iri the future. A List of the collected specimens is given in Table 9.
Table 9: Tentative List of Invertbrate Collected From The Chukchi Sea
Five unidentified species
COELENTERATE Anthozoa
Nephtheidae Eunephthya rubiform
Actinaria Pachycerriantus frmbriatur Stomp hia coccinea sp. 1 sp. 2
Scyp hozoa Cyanea capillatra Aurelia sp. 1
Hydroidia Sertulariidae
Sertularia terera Calycellidea
Calyelella sp. I
CTENAPHORA Unidentified species
BRYOZOAN Cheilostomata
Scrupariidae Eucretea loriata
Flustridae Carbasea carabasea Terminoflustra membranacro-truncata

BRYOZOAN (cont.) Hinksinidae
Caularamphus cymbacfbmis Alderinidae
Callopora aurita Callopora craticula
- Bidekapia spitsbergensis Tegella mugnipota
Scrupocellariidae Tricellaria erectu
Bicellariellidae Dendrobeania murrayanna
Ckilostorrmta arcuphora Hippothoidae
Hippothoa expansa Stomachetasellidae
Stomacktosella sinouse Ragionula rasacea
Pachyegis Pachyegis priceps
Smittinidea Porella compressa Porella concinna Rharnphstomella ovata
Holoporella Costazia ventricosa
Myriozoidea Myriozoum subgracile
Cyclostomata Alyonidiidea
Alyconidium disciforme Alyconidium pedunculaturn Alyconidium vermiculare
Flustrellidea Flustrella corniculata Flustrella gigantea
Vesticulariidea Bowerbankia gracilis
BRACHIOPODA Hemithryris psittacea Terebratilina unguiculina

ANNILIDA Polychueta - Sedentriate
Chaetopteridae Unidentijed species
Maldanidae Unidentified species .
_ Arnphicenidue Pectinaria sp. 1
Sabellidae Unidentijed species
Nerillidae UnidentGed species
Terebellidae Unidentijed species
Diop hilidae Unidentified species
Serulidae Spiorbis sp. 1
Polychaeta - Ewaniata Polynoidea
Eunoe sp. 1 Unidentified species
Nereidae Nereis sp. 1 Unidentified species
Nepthyidae Nephtyts sp. 1 Unidentified species
SIPUNULZDA Goljngidea
Golfrngia margartacea
MOUUSCA Polyplacophora
Symmetrogephrus vestitus Trachydermon albusi sp. I
Bivalvia Nuculidae
Nucula bellotii Nuculanidae
Nuculana pernula Portundia interedea Yoldia hyperborea

MOLLUSCA (cont.) Yoldia scissurata
Mytilidae Musculus niger
Pectinidue Chlamys pseudislandica .
- Chlamys sp. 1 Thy asiridae
Thyasiria equalis Carditidae ,
Cyclocardia cassidens Cyclocardia crebricosta
Astartidae Astarte borealis Astarte montigui
Cardiidae Clinocardiurn ciliatzun Serripes groenlandicus
Tellinidae Macoma calcarea Macoma moesta Macoma sp. 1
Veneridae Liocyma fIuctuosa
My idae Mya psuesdoarenuris Mya truncata
Hiatellidae Panomya arctica Hiatella arctica
Pandoridae Pandora glacialis
Lyonsiidae Lyonsia arenosa
Periplomaidea Periploma aleurica
Thraciidae Thracia adamsi Thracia sp. 1
Gastropods Lepetidae
Lepeta sp. 1 Lepeta sp. 2
Trochidae Margaites costalis

MOLLUSCA (cont.) Margarites sp. 1 Solariella varicosa Solariella obscura Solariella sp. I
Epitoniidae - Epitonium greenlandican
Turritellidae Tachyrhynchus erosus Tachyrhynchus retiatis
Crepidulidae Crepidla grandis
Trichotropidae Trichotropis bicarinata Trichotropis croyeri
Nuticidae Natica clausa
Velutinidae Velutina sp. 1
Muricidue Boreotrophon clathratur Boreotrophon truncatus Boreotrophon sp. 1 Boreotrophon (unknown fragment)
Buccinidae Buccinum glaciale Buccinum polare Buccinum plectrum Buccinum s p . 1 Buccinum sp. 2 Buccinum (unknown fragment)
Neptunidae Mohnia siphonoids Neptunia heroes Neptunia middendiddiana Neptunia (unknown fragment) Plicifurus kroyeri
Cancellariidae Admete sp. 1 Admete sp. 2
Turridae Oenopta bicarinata Oenopta harpa Oenopta paccus Oenopta sp. I
MOUUSCA (cont.) Oenopta sp. 2 Oerwpta (unknown fragment) Nodotema impressia
Acteocinidae Retusa umbilicus
ARTHROPQDA Pycnopoda
Two Unidentified species Crustacea
Thracica Balanidae
Balanus sp. 1 Balanus sp. 2
Mysidacea Unidentified species
Cumucea Unidentified species
Isopoda Idoteidae
Saduria entown Unidentified species
Amp hipoda Eusiridea
Unidentified species Gammaridea
Unidentifred species Lysianassidea
Unidentijied species Stegocephalidea
UnidentiJied species Decapoda
Hippolytidae Unidentified species
Crangonidae Unidentified species
Paguridae Unidentifred species
ECHINODERMATA Asteroidea
Asteridae Leptasteris polaris

ECHINOD ERMATA (cont ) UnidentifEed species
Echinoidea Echiarachiniidea
Echinarachnius puma Strongylocentrotidea
- Strongylocenrrotus droebachiensis Ophiuroidea
Ophiactidea Ophuira sarsi Sregoop hiuru m&sa
Holoathuroidea Cucumariidea
Cucumaria calcigera Cucumaria sp. 1 Chiridota sp. 1
Synaptidae Myriutrochur rinki
Psolidea Psolus japonicus
CHORATA Ascidiacea
Ascidiidae Unidentified species
Rhodosomatidea Chelyosoma rnacleayanum
Styelidea Styela sp. 1 Dendrodoa sp. 1
Pyurideu Bortenia echinata Boltenia ovifera
Molgulidae Molgula sp. 1

OBSERVATIONS AND PRELIMINARY INTERPRETATIONS
SEDIMENTOLOGY AND STRATIGRAPHY IN THE BEAUFORT SEA
by Peter W. Barnes - Throughout the central shelf of the western Beaufort Sea a shallow reflector is
observed on the 3.5 kHz sub-bottom profile records at depths of 2 to 7 meters below mudline. This reflector is often weak and discontinuous, and occasionally has a meter or more of relief. Based on the few cores that penetrated this reflector we interpret this horizon as the base of the ice gouged zone in the Beaufort Sea.
The majority of ow cores bottomed in overconsolidated material, therefore, we interpret the shelf surface as erosional. The thickness of normally consolidated surficial material represents present day ice gouge reworking of shelf sediment. The thickness of this layer is also a reflection of the maximum depths to which modern ice gouging occurs. However, the depth of reworking by ice gouging is difficult to determine due to the near-surface presence of consolidated materials and the general lack of clear horizontal contacts in the cores to mark the boundary between ice reworking and older undisturbed materials. Assuming the shelf to be erosional, the cores indicate that ice gouging does not extend below about 3 meters.
Observations of surficial sediment cover in the Beaufort Sea were obtained to the depth of 5 meters from vibracores and gravity cores (Figs. 3 & 4). Generally the cores reveal a thin surficial layer underlain by overconsolidated materials that in some cases should be considered a mudstone. In all cores silts and clays dominate the textural makeup of the sediments. A surficial layer composed of bioturbated yellow grey ooze is common, and attained thicknesses of up to 30 centimeters. On the central and inner part of the Beaufort Sea shelf this ooze is typically underlain by massive consolidated or overconsolidated muds and sandy muds with dropstones. Bioturbation and mottling are common. Shell material is rare and sands are conspicuous by their limited occurrence. All cores indicate marine deposition.
Gravity cores from the upper slope have a stratigraphy strikingly similar to the shelf cores in that bioturbated massive muds, which may be overconsolidated, occur at depth in all the cores. The upper slope cores (Plate 1, Tables 4 & 5 cores 1-29) were taken in the slump terrane described by Grantz and Dinter (1983) and the general mas- sive and ill defined stratigraphy of the cores suggests these deposits may have been involved in mass movement (see discussion of slope geophysical data and geotechnical observations). One of these cores had visible gas bubbles.
Temperature records were obtained at five core sites (Table 2). These indicate sediment temperatures of 0.2" Celsius and greater. Final temperatures will need to be extrapolated from the time response of the thermistors as vibrating appears to heat the

probes significantly and even holding times of more than 15 min. did not allow ther- mal equilibrium to be reached near the tip. If the heating affect of the tip is ignored, the thermal profiles show temperatures decreasing with depth. Temperatures observed at two sites in the Chukchi Sea were a degree or more warmer than those in the Beaufort and remained above lo Celsius.

GEOPHYSICAL DATA FROM THE UPPER CONTINENTAL SLOPE IN THE BEAUFORT SEA
by James Robb
Grantz and others (19832, and Dinter (1982) identified shelf-edge faulting and complex megaslumps along the Continental Slope of the Beaufort Sea. Based on their initial work, profiling of shelf-edge features and coring for geotechnical samples was undertaken in an area northeast of Barrow, Alaska, to investigate possible problems of slope stability near 72ON, 154OW, (Fig. 8). Profiles of slope areas were also acquired along the sides of Barrow Canyon and in an area about 15 miles to the southeast of the sampled area (Fig. 8).
In the study area NE of Barrow, pig. 8), 3.5 kHz bathymetry profiles of the upper continental slope show complex submarine topography. On four closely spaced lines that run approximately parallel to slope contours (Fig. 8) flat-bottomed depressions, which measure less than 500 m to greater than 1 km across, (Fig. 9), cannot be corre- lated from line to line. Consequently, the bottom does not appear to have downslope- trending valleys. Reflections from subbottom strata are truncated at the walls of some of the depressions, so they would appear to have an erosional origin (Fig. 9). From another perspective, a profile that crosses the contours of the upper slope (line 3, Fig. 10) shows narrow, steep-walled depressions, several meters deep, spaced about 100 m to 200 m apart. These could be the surface expression of fractures striking along slope. Some of the intervening blocks on this line show apparent tilting, both inshore and offshore (Fig. 10). Sidescan sonar images along line 16 (Fig. 11) show some indistinct linear features oriented approximately parallel to slope contours, spaced several hundred meters to greater than 1 km apart, which may also be fractures.
The 3.5 kHz bathymetry profiles show many side echoes (e. g., the dark, down- ward sloping, apparently subbottom reflections on the right of Fig. 9). The patterns of these side echoes could also be created by scarps or fractures oriented parallel to the slope, slightly off the line of the profile, but further, they are an indication of the small size and complexity of surface features within the relatively small area ensonified by the hull-mounted 3.5 kHz bathyrnetry transducer.
The depth of the subsurFace penetration shown by the 3.5 kHz bathymetry data suggests that the surface sediments are fine grained (Fig. 9). ORE boomer profiles show surface sediments up to 10 m thick that are acoustically more transparent than underlying layers (line 3, Fig. 12).
More closely spaced data will be needed to delineate the submarine topography properly, but the data at hand are consistent with complex fracturing and mass wast- ing associated with the heads of slumps or down-to-basin faults.
ORE Boomer profiles along the sides of Barrow Canyon and in the easternmost

slope area show good penetration and resolution of shallow seismic sequences. At least three seismic sequences and separate episodes of apparent folding, separated by erosional intervals, can be differentiated (Fig. 13). The apparent folding may represent sedimentary bedforms (Eittriem et at., 1982), or may have resulted from creep.
Distinct faults showing offset subbottom strata were not observed on the Barrow Canyon profiles. However, two faults under the continental shelf are recorded by ORE boomer data along line 23, in the northeastern part of the study area, in water depths near 50 m (Figs. 14, and 15). They do not cut the present bottom surface, and one (Fig. 14) is plainly overlain by about 8 rn of sediment. The other fault can be traced to within 4 m of the surface. The shelf surface is disturbed by ice gouging, however, so lack of surface expression might not indicate significant age.


I I
Figure 9 - 3.5 kHz record of a flat-bottomed depression (location A on Figure 8) as it appears while traveling parallel to slope contours.


BEAUFORT SEA ICE GOUGE STUDIES
by Douglas M. Rearic
Introduction
_ For ice gouge studies approximately 300 km of side scan sonar records from the central and outer shelf of the Western Beaufort Sea are analyzed. Ice gouge density is subjectively estimated as high, medium, low and no gouging (Fig. 16). These estimates are based on previous extensive studies conducted to the east of the study area (Barnes et al., 1984). High density gouging is defined as areas where the seafloor is saturated with gouges. Areas were ice gouging is pervasive, generally with at least 50 95 of the seafioor gouged, are areas of medium gouging. Areas where less than 10 gouges per kilometer are observed are considered areas of low density gouging.
The morphology of the ice gouges is estimated as a percentage of the total gouge population and described using the following criteria. Fresh gouges are gouges which have blocky lateral ridges, a clear definition of gouge shape and orientation and, often, striations in the gouge troughs (Fig. 17a). These gouges are considered to be of recent origin. Reworked gouges are gouges that are rounded and smoothed by currents, bio- logical activity, and lateral ridge slumping (Fig. 17b). These gouges may have been formed the previous winter but in many cases have persisted for more than one winter. Infilled gouges are gouges which have no discernible vertical relief on 3.5 kHz bathy- metry records and appear as very light lineations on the sonographs. These may be either older gouges which have undergone many seasons of reworking or recent gouges formed in areas where hydraulic processes, such as waves and currents, rework bottom features at a very high rate. Infdled gouges may exist only as a textural difference between fine grained infill material and coarser surrounding seafloor sedi- ment. For this morphology type the sonographs may, therefore, record only a difference in acoustic reflectivity of the bottom sediment.
Ice gouge orientations, estimated for each gouge density zone, are plotted on Fig. 16. Gouge orientations are recorded between 0 and 180 degrees true in this study, similar to those of Barnes et al. (1984), and do not infer a direction of ice movement. Gouge terminations (Barnes et al., 1984) are an indicator of ice movement direction and as such are recorded between 0 and 360 degrees true (Fig. 16).
Observations
Ice gouge character in the western most Beaufort Sea is similar to gouge character found to the east of this study area (Barnes et al., 1984). Ice gouging occurs to water depths in excess of 60 meters and orientations are parallel to subparallel to the bathy- metry contours (Fig. 16). On the central and outer shelf, low density gouging occurs primarily between the 60 and 70 m contours, but extends into 40 m water depths in

the eastern portions of the study area. A lobe of medium density gouging outlines the 40 and 50 m isobaths and conforms to a gently sloping platform found in these depths. Most gouges in this medium density zone exhibit a reworked morphology (Fig. 17b). Inshore of 40 m, high density gouging is found to the inner limit of our trackline cov- erage, about 18 m. This zone essentially conforms to the water depths established for the stamukhi zone, a major area of grounded ice ridges every winter (Reimnitz et al., 1978). Many of the gouges in the high density zone are formed during multiple events (Barnes et al., 1984) and gouge orientations are extremely variable. Gouge ter- minations suggest that ice motion is to the west in an onshore to alongshore direction.
About 83% of the gouges observed on the sonographs were of a reworked mor- phology type. Most of the remaining gouges appear as infilled gouges, In almost every case where fresh gouges were observed the gouge density was estimated as high, and the fresh gouges constituted only 1 to 2 percent of the total. Areas containing a high percentage of infilled gouges (>25%) had low gouge density.
Several areas of special interest have been found in the study area. In the far eastern portion of the study area, a zone of no gouging lies much closer to the coast than observed elsewhere (Barnes et al., 1984). The lack of gouging may be associated with a topographic depression bounded by the 50 and 60 rn contours (Fig. 16). A sill a few meters deep could prevent ice keels deeper than the surrounding sediments from gouging within the depression. Further analysis of the bathymetry data from this area will be needed to determine the exact cause of this none gouged area.
The deepest gouges yet observed on the Alaskan Beaufort Sea shelf are found northeast of Dease Inlet in the zone of medium gouge density between the 40 and 50 m contours. To date the deepest gouges observed on the shelf have incised at least 4 m into the bottom (Barnes et al., 1984). The sonographs and 3.5 kHz bathymetry records from the above area (Fig. 16) indicate that gouges in excess of 6 meters deep exist on the shelf today. Whether these deep gouges result from differing sea bed sediments or from more intense ice dynamics is unknown.
Inshore of the 40 m bathymetric contour is a zone of medium density gouging sur- rounded by an area of high density gouging. Previously mapped bathymetry (NOS chart no. 16004) has indicated this is an area of numerous shoals which may shadow this pocket of lower gouge density. However, preliminary analysis of the bathymetry data from this area suggests that the shoals do not exist in this area today (see Clark, this report). Again, the bathyrnetry data will need further analysis before any conclu- sion can be reached.
In the northwest portion of the study area, there is a ridge west of the B m w Sea Valley (Fig. 16). On top of this ridge, in water depths exceeding 60 m, many deep water gouges are found. To date the deepest water depths in which modern gouges have been observed has been 64 m (Reimnitz et al., 1984). On this ridge, in what appears to be coarse grained sediments, gouges occur to depths of 69 m (Fig. 18). This

suggests that modern ice keels may attain drafts of 70 rn or more. The zone of low density gouging on this ridge is bounded on the northwest by a 5 m high bench which faces to the northwest (Fig. 19). The origin of this bench is unknown.
Conclusions
- Preliminary analysis of side scan sonar records suggests that ice gouging north and immediately east of Point Barrow is similar to that found in other portions of the Alaskan Beaufort Sea. The highest density of gouging is found between 18 to 40 m water depths (the stamukhi zone) and gouge orientations are essentially parallel to sub- parallel to the isobaths. Gouge terminations suggest that ice motion during gouge for- mation is from east to west. Other conclusions suggested during this study are:
1) Gouges greater than 6 m deep occur on the shelf of the Alaskan Beaufort Sea today. This is about 2 m deeper than any previously observed gouges.
2) Ice gouging is occurring today to water depths of 69 m suggesting that modern ice keels may attain depths of 70 m or greater.

155 ' l l t
Figure 16 - Ice gouge density, orientation and termination map. Bathymetry has been contoured from 3.5 kHz records obtained during 1985 cruise. (see Clark, this report),

Figure 17 - Sonograph of ice gouge morphology types. a) Fresh gouge with blocky ridges, and stria- tions in gouge trough. b) Reworked gouge showing smoothed and rounded features.

ure Se
18 - :a Val
idg e between Bar-
Figur West crest.
Valley and In the ridge

BATHYMETRY IN THE WESTERN BEAUFORT SEA
by Steven D, Clark
As an aid to studies of active shelf processes such as ice gouging, it is important to have reasonably accurate bathymetric information in the areas being studied. On the 1985 Discoverer cruise bathymetric data was gathered over more than 800 kmof tracklines in the western Beaufort sea, north and east of Point Barrow, Alaska, from about 10 km to more than 50 km offshore. Depths encountered range from 15 to 260 m, but most depths are between 20 and 40 m.
An overlay drawn from NOAA provisional nautical chart #16004, "Point Barrow to Herschel Island", (North American 1927 Datum; 8th ed. 2/27/82; approximate scale: 1 to 700,000 with sounding data from many sources and dates), was used as a basemap for plotting the 20, 30, 40 m isobaths. Depths were initially plotted at 2 meter depth intervals over areas of little vertical relief. The 20, 30, 40 m iso- bath were drawn twice; once based on the published chart soundings and again based on the sounding data obtained during the 1985 Discoverer cruise.
Results
Bathymetric maps were generated from the 3.5 kHz bathymetry data and the bathymetry from chart #16004 converted from fathoms to meters. Comparison of these maps, (Fig. 20) shows that the published chart depths are generally shallower than the current bathymetry by 10 meters or more. As a result, present bathymetric contours are moved shoreward of their previously charted positions. In addition, several of the shoals shown on chart #I6004 were traversed by tracklines and these charted shoals were undetected. We conclude that either charting and navigation errors are significant in the older charts or that this segment of the shelf is rapidly eroding, or a combination of these.

Cruira Dapthr
.. _......
Figure 20 - Comparison of 20, 30, and 40 meter contour intends generated from NOS chart 16004 and 1985 cruise bathymetry showing a shoreward movement of contours from the previously charted positions. (See Figure la for trackline coverage),

GEOTECHNICAL SAMPLING
by Robert E. Kayen
Geotechnical samples were obtained to develop a better understanding of the varied near surface geological- environments present on the Arctic Ocean shelf. These include 1) freeze-thaw consolidation of sediment, 2) ice gouges, 3) permafrost,-4) slope failures, 5) current induced erosional bedfonns, and 6) overconsolidated crusts underlain by weak sediment. Many of these features pose severe geological con- straints which hinder or prevent offshore development in the Arctic Ocean.
Onboard water content, bulk density, and grain specific gravity samples were removed from gravity cores and vibracores. Sediment plugs, 20-45 cc in volume, were taken from the ends of cores designated for engineering study (Table lo), and at 20 centimeter intervals -from split stratigraphic core sections (Table 11). If the sediment matrix was fine grained and cohesive the undrained shear strength was measured at the sampling locations with either a hand held 'Torvane', or a motorized Wykhem- Farrance vane shear machine. Resistance to penetration was measured with a hand held penetrometer.
Geotechnical cores were prepared for shipment in a manner intended to preserve the sediments stress state and water content. Cores were cut into 1.0 meter lengths, then capped, taped, wrapped in cheesecloth, and sealed in Microflex wax. To reduce organic decay, core sections were refrigerated at 4" Celsius.
sedimer low re:
Surficial ~t cored from the outer Beaufort shelf, North of Point Barrow, generally had sistance to shear with an average shear strength of 8 P a . Gas charging increased noticeably down the length of 22 cores (Tables 10 & 11) and may contribute to their low strength. Moderate-to-highly overconsolidated silty muds over- lain by 10-100 cm of soft surface mud were recovered at four stations (7, 8, 9, and 12) in the ice gouge zone near Dease Inlet. Sands and muds cored from the Chukchi Sea (Figs. 3 & 4) were consistently overconsolidated. Vane shear measurements were not taken for most Chukchi Sea cores due to their coarse grain size and lack of cohesion.

Table 10: Engineering Cores
CORE CORE GAS CHARGING NUMBER LENGTH (cm) PRESENT 01-01GE 262 Yes

Table 11: Geotechnical Sampled Cores
NUMBER 01-02GS
CORE LENGTH (cm)
289
GAS CHARGING PRESENT

SEDII )LOGY & STRATIGRAPHY IN THE CHURCH1 SEA
by R. Lawrence Phillips
Subsurface Geology
- High-resolution seismic profiling shows that much of the Chukchi Sea shelf con- tains a thin horizontal bedded sedimentary sequence, Holocene-Quaternary age, overly- ing gently to steeply folded bedrock. Bedrock may outcrop on the seafloor surface where the sediment cover is thin. Cutting into bedrock to at least 64 m are a series of filled channels which mnd to the northwest across the shelf. The channels occupy the region now dominated by a bathymetric low located between Hanna Shoal to the north and Hearld Shoal to the south. The channel system starts at approximately 71°N and lMOW trending to the northwest to at least 72"N and the Convention Line.
Holocene-Quaternary Shelf Stratigraphy-Outer Shelf
Vibracores of shelf sediment define the sedimentary processes and depositional history of the upper part of the shelf. The shelf stratigraphy can be divided into at least 3 basic sedimentary units; 1) an upper modern mud-sand, 2) a marine sand- pebbly mudstone, and 3) a volcanic ash deposit.
Upper mud-sand unit - The upper depositional unit represents a fining-upward sedimentary sequence. It generally grades upward from a gravel-shell lag to sand to intensely bioturbated mud. The top 10 to 20 cm of the section consists of very soft "flawing" mud. The sequence varies from 51 cm to 290 cm in thickness and is found in all outer shelf cores except core 48-66vs which occupies a bathymetric high and is apparently undergoing erosion. This unit also thickens to the northwest. A sharp lithologic-textural break and degree of induration separates the upper depositional sequence from the underlying strata.
Marine sand-pebbly mudstone - "Hard", overconsolidated pebbly mudstone or siltstone represents the dominant sediment type underlying the upper sedimentary sequence. Overconsolidated mud or a marine sand (contains fossils) may also underly the upper depositional unit. The pebbly mudstone contains rounded quartz clasts, up to 5 cm in diameter, scattered throughout a mud matrix. This unit varies in thickness from 99 cm to over 190 cm, where penetration was terminated in some cores. A sharp to bioturbated and gradational contact separates the pebbly mudstone from the underly- ing sequence.
Volcanic ash deposit - The stratigraphic lowest unit cored, found in at least 5 cores, consists of a white to gray, well-sorted laminated to massive very fine-grained vitreous ash. The deposit is over 355 cm thick and the corer did not penetrate through it. The sequence represents a wide-spread blanket deposit as it is found over a dis- tance of 160 km in a north-south direction and 100 km in an east-west direction.

The tentative depositional events identified within the cores from the basal sequence to the top of the section suggests an initial aeolian transport of volcanic ash and depositi~n within a marine environment. After the ash deposition marine deposi- tion of sediment continued along with ice rafting of pebbles and cobbles. An apparent erosional contact marks the top of the pebbly mudstone. The upper-most depositional sequence may represent the Holocene transgressive event. A marine environment characterizes the fining upward sequence suggesting deepening water due to the marhe imnsgression.
Inner Shelf
Vibracores within the inner shelf region refiect deposition of sediment by the northward flowing Alaska Coastal Current. The cores contain well-sorted medium- to fine-grained sand. The sand may overly laminated organic-rich peat or pebbly mud- stone. The outer shelf mud-fine sand changes laterally to the east to sand across the shelf as the depth shallows and the influence of the coastal currents remove the finer sediment fraction,
Surficial Sediments
Side-scanning sonar records indicate sediment textures in some cases as well as identifying bedfoms and benthic mammal feeding areas on the sea floor. Camera and TV observations define both texture and biological communities. Box coring defines the physical and biological processes preserved in the sediment as well as identifies in situ benthic communities. Using these techniques, the general surface sediment pat- terns as well as bottom current trends can be identified in the Chukchi Sea. On the inner shelf, sand and gravel dominate surface sediments. Sand underlying the Alaska Coastal Current may contain northward migrating ripples or sand waves up to one meter in height or may be bioturbated or covered with echinoids. TV observations, however, show that the bedfoms were not actively migrating during the observation period, perhaps suggesting that storm-generated currents may play the dominate role in sediment transport. The suficial sediment texture changes across the shelf from sand to muddy sand to mud on the outer shelf.
Widespread gravel sheets with bedforms aligned north-south (suggesting east-west currents form the bedfom), are associated with mud on the outer shelf south of 71°N. Gravel occurs mainly as erosional surficial lags on bathymetric highs. However, core 48-66VS consisted of 169 cm of well sorted, well-rounded gravel. This core may have penetrated a fluvial channel deposit, as suggested by the filled channels seen in the area on the seismic records. Tentative observations however suggests that most of the gravel deposits on the sea floor represent only surficial lag deposits winnowed by storm currents. The periodicity of the storm events that can move gravel at 45 m is unknown.

lBLE LITHOLOGY IN THE CHUKCHI SEA
by Pedro C. Ramirez
Gravels retneved from three pipe dredge sites (20, 21, 23; Table 7) located on the shelf in the northeastern Chukchi Sea were macroscopically examined for lithologic and textural characterization. Each complete dredge sample was fust analyzed for t&- turd variations. Dredge samples were then washed clean and the coarsest fraction, gen- erally greater than 2.5cm., was separated and classified according to lithologies.
A cursory textural analysis (Table 12) reveals that the gravels, as a whole, are poorly sorted with clasts ranging from less than 2 cm to greater than 18 cm in size. Sand and shell fragments are common constituents. *
Table 12: Gravel Size Analysis
STATION SIZE AVERAGE NUMBER RANGE(cm) SIZE(cm) 20 2.0- 18 4-6 21 2.5-19 4-6 23 1.7- 6 2-3
Both angular and well-rounded clasts are encountered in each dredge sample, although the majority of gravels are sub-rounded to rounded. Clast angularity is apparently a function of composition. Dolomite dominates the subangular to sub- rounded fraction while harder, sedimentary (elastics and fine grained siliceous rocks), metamorphic, igneous, and volcanic rocks prevail in the sub-rounded to rounded category. Exceptions are noted, as some sub-rounded to rounded dolomite and angular sedimentary clasts are found. Surface textures, such as striations and polished surfaces in a few scattered pebbles suggest that at one time ice was a probable transport mechanism.
The composition of nearly 50% of each dredge sample is dominated by coarse to cryptocrystalline dolomite clasts (Table 13). Typically, the dolomite is a d~rty gray color with iron oxide or manganese oxide staining. Next in abundance are mature to immature, red to grey-black sandstones and siltstones, which are followed in abun- dance by gabbroic to dioritic igneous rocks, quartzites, basaltic to andesitic volcanics, fine-grained siliceous rocks, red granites and coal.

.*
Table 13: Pebble Lithologies
- Lithology
Dolomite
Clastics
Igneous
Red Granite
Volcanics
Fine Grained SiO, Rocks
Quartz
Coal
Pelloidal Sandstone
Mudstone
Totals
Station 23 # of
Pebbles
Station 21 Percent # of
Pebbles
Station 20
18 43.9%
6 14.6%
- -
1 2.4%
1 2.4%
4 9.8%
4 9.8%
3 7.3%
-
4 9.8%
4 1 100.0%
Percent # of Pebbles
50 55.0%
28 30.8%
3 3.3%
- -
3 3.3%
1 1.1%
2 2.2%
- -
- -
4 4.4%
9 1 100.1%
Percent
63 44.7%
29 20.6%
20 14.2%
5 3.6%
3 2.1%
8 5.7%
11 7.8%
1 0.7%
1 0.7%
- -
141 100.1%

By examining Table 13 one can see that stations 20 and 23 are more nearly alike lithologically with the exception of smaller proportions of volcanic, siliceous, and quartzitic rocks and greater amount of igneous clasts at station 20. Station 21 does not contain red granites or coal like station 20 or 23. Because station 21 is situated inter- mediate to station 20 and 23 on the shelf and because stations 20 and 23 are lithologi- cally similar, one would also expect station 23 gravels to contain similar proportion of lithologies. This is not the case and may be due to an insufficient sample size.
Discu- -'---
The preponderance of dolomite at each dredge site indicates that the source area was dominated by dolomite. The angularity of the clasts suggests limited transport or transport by ice rafting. Dolomite may have been transported onto the shelf from an area proximal to the Alaskan margin by advancing ice sheets or directly eroded from the shelf bedrock.
Zneous, : area.
- - -
11 volcanic, sedimentary and metamorphic pebbles were also exposed in the sourcf The well rounded nature of these clasts denotes reworking and transport of the pebbles onto the shelf by currents. Numerous filled channels are observed in the sub-bottom records from the shelf. Incision of these channels into the shelf at a lower stand of sea level may have resulted in the transport and deposition of the rounded igneous, sedimentary, volcanic, and metamorphic pebbles.
More lithologic and textural data is needed in order to use lithologies and textures as "geologic tracers" for source areas and to speculate on transport mechanisms and directions.

SRENC
- --- TED
Barnes, r.w., ~earic , D.M., and Reimnitz, Erk, 1984, Ice gouging characteristics and Rwesses: in P.W. Barnes, D.M. Schell, and Reimnitz, Erk, eds., The Alaskan Beaufort Sea: Ecosystems and Environments, Academic Press, Inc., New York, p. 185-212.
Dinter, D.A., 1982, Holocene Marine Sediments on the Middle and Outer Continental Shelf of the Beaufort Sea North of Alaska, USGS Map 1-1 182-I3
Eitereim, S., Grantz, A., and Greenberg, J., 1982, Active geologic processes in Barrow Canyon, Northeast Chukchi Sea: Marine Geology, v. 50, p. 61-76.
Grantz, A., Dinter, D.A., and Biswas N.N., 1983, Map, Cross Sections, and Chart Showing Late Quaternary Faults, Folds, and Earthquake Epicenters on the Alaskan Beaufort Shelf, USGS Map 1-1 182-C
Reirnnitz, E., Barnes, P.W., and Phillips, R.L., 1984, Geological Evidence for 60 meter deep Pressure-Ridge Keels in the Arctic Ocean, International Assoc. of Hydraul. Res. Symp. on Ice August 27-31, 1984, Hamburg, Germany Proceedings, Vol. II p. 189-206
Reimnitz, E. and Maurer, D.K., 1978, Stamukhi Shoals of the Arctic - Some Observa- tions from the Beaufort Sea, USGS OFR 78-666