UNITED STATES DEPARTMENT OF THE INTERIOR FRISK: …
71
UNITED STATES DEPARTMENT OF THE INTERIOR GEOLOGICAL SURVEY FRISK: Computer Program For Seismic Risk Analysis Using Faults as Earthquake Sources By Robin K. McGuire Open-File Report 78-1007 1978
Transcript of UNITED STATES DEPARTMENT OF THE INTERIOR FRISK: …

UNITED STATES DEPARTMENT OF THE INTERIOR
GEOLOGICAL SURVEY
FRISK: Computer Program For
Seismic Risk Analysis Using
Faults as Earthquake Sources
By
Robin K. McGuire
Open-File Report 78-1007 1978

FRISK: COMPUTER PROGRAM FOR SEISMIC RISK ANALYSIS
USING FAULTS AS EARTHQUAKE SOURCES
CONTENTS
Page
A "L _. j_ _,_ -_ -^ 4_ __ __________________________________________________ __ ________ -- __ _ ________ __ _ ___ OADS urac L j
Int roduc t ion*"""""""""""""""""""" «. -.-.-.-.-. -._ _-. ^
Theoretical Background 7
Program Operation and Options 16
Required Input~~~""~" 26
Guidelines for Program Use 40
Example Problems*" i+j
Appendix A, Example Problem Input and Output 51
Appendix B, Program Flow Chart 55
Appendix C, Program Listing 62

ABSTRACT
This computer program makes probabilistic seismic hazard calculations at
sites affected by earthquakes occurring on faults which are defined by the
user as a series of line segments. The length of rupture of the fault as a
function of earthquake magnitude is accounted for, and ground motion estimates
at the site are made using the magnitude of the earthquake and the closest
distance from the site to the rupture zone. Uncertainty in the earthquake
magnitude, in the rupture given magnitude, in the location of the rupture zone
on the fault, in the maximum possible magnitude of earthquakes, and in the
ground motion at the site given the earthquake, its size, rupture length, and
location, are accounted for explicitly. FRISK (Fault RISK) was written to
take advantage of repeated calculations, so that seismic hazard analyses for
several ground motion parameters (for instance, peak ground acceleration,
velocity, and displacement), and for several sites, are most efficiently made
with one execution of the program rather than with repeated executions.

The program uses a step-truncated exponential distribution for
earthquake magnitude, a lognormal distribution for rupture length given
magnitude, a uniform distribution for rupture location on faults, and a
lognormal distribution of site amplitude given magnitude of the earthquake and
distance from the rupture zone to the site. The program has been structured
so that other functions may easily be substituted if this is appropriate for a
particular problem; for example a wide range of deterministic or probabilistic
geophysical models for estimating ground motion may be incorporated, and the
program will yield probabilistic estimates of seismic hazard.

INTRODUCTION
Since the advent of seismic risk analysis methods a decade ago, much
work has been done both in applying these methods to engineering problems and
in revising these methods to reflect more refined information and theories
about seismicity, wave propogation, and the features of seismic ground motion
which are critical to engineering structures. One important advance was
recognition that the length of fault rupture during an earthquake is an
important consideration in probabilistic calculations of seismic hazard.
The computer program described in this document calculates seismic
hazard for problems in which the length of fault rupture during an earthquake
must be accounted for. Important uncertainties are included in the
calculations: uncertainties in the magnitudes of future earthquakes, in the
rupture length given magnitude, in the maximum possible magnitude on a fault,
and in the seismic ground motion at the site of interest given the earthquake,
its rupture length, and its location on the fault.

The program currently uses typical analytical functions to describe
seismicity and ground motion propagation from source to site. Coding for the
program and the documentation included herein have been written in a manner
which will allow easy incorporation of new analytical or empirical functions
when these become available, without major reprogramming. The program, as
currently written, is not meant to be the final word in seismic risk analysis;
it is a tool which can be revised and refined to reflect advances in the state
of the art.
In any major programming effort such as this one, there are bound to be
errors in coding and in documentation. The experience of users, and the
notification of any discovered errors, will be gratefully received by the
author. A form is provided at the back of this document to include users'
names on a mailing list for notification of changes in the program which
correct errors or increase its versatility.

THEORETICAL BACKGROUND
Methods of probabilistic seismic hazard analysis have been developed and
documented over the past decade (for instance, see Cornell, 1968, 1971;
McGuire, 1974, 1976; Der Kiureghian and Ang, 1975, 1977). A brief description
of the method used by program FRISK is given, along with the explicit and
implicit assumptions. The assumptions which can easily be changed, and the
re-programming necessary to effect these changes, are also described.
Throughout this documentation, the term "fault" refers to a defined zone
in the earth's crust which may be the source of future earthquakes; the term
"rupture" refers to the section of a fault which breaks during a specific
earthquake. Faults are defined by a series of connected line segments, and
earthquakes occur at random locations on these faults. The locations, sizes,
and other parameters of successive earthquakes are mutually independent.

The program calculates the probability that a specific ground motion
amplitude will be exceeded at the site by a numerical evaluation of the "Total
Probability Theorem." (The term "amplitude" here means any quantitative
ground motion measure which can be described within the assumptions of the
methodology, for instance peak ground acceleration or velocity, spectral
velocity, and so on. Modified Mecalli intensity may also be used with certain
variations to the input as discussed below. Specifically, the probability that
amplitude is exceeded given one event (of random size, rupture length, and
location) on a fault, is
P[amplitude z exceeded]
P[amplitude z exceeded m,l r (m),x]
fM(m) fL (l r ) fx (x) dm dl r dx (1)
where M is magnitude, L r is length of rupture, and X indicates rupture
location on the fault. Given the location and length of rupture, the closest
distance from the rupture to the site is calculated, and the probability in
the integrand is evaluated. Integration over M, Lr , and X gives the total
probability that amplitude z will be exceeded due to a single event of random
M, L r and X. To calculate the expected number of exceedances, this
probability is multiplied by the mean activity rate for the time of interest.
The total expected number of exceedances is calculated as the

sum of expected numbers from each fault, and the risk at the site for
amplitude z (that is, the probability that z is exceeded) under the Poisson
assumption is determined by
Risk (amplitude z) = 1 - exp (-total expected number of
exceedences of amplitude z) (2)
Ground motion amplitudes associated with specified levels of risk are
determined by interpolation using the calculated risks which are next higher
and next lower, and using the associated amplitudes. This interpolation is
made logarithmically for both amplitudes and risks, because risks usually
decrease almost linearly with amplitude when plotted on full logarithmic
paper.
The specific functions used in the program for the magnitude, rupture
length, and location distributions, and for the distribution of ground motion
amplitude given earthquake magnitude and closest distance from the site to the
rupture, are discussed below. These distributions may easily be changed if
other functions are more appropriate for a specific case.

The magnitude distribution for earthquakes on each fault is modeled by a
truncated exponential distribution that is:
fM (m)=k 0 exp (- 0 (m-ro 0 ) ) mQ<_ M<Mj (3)
where f^ is the magnitude density function, m is the magnitude of the earth
quake, mQ and MJ are lower and upper bounds, 0 is the slope parameter (equal
to In 10 times the Richter b value), and k is equal to (l-exp(-(M^-mo ) )) .
The upper bound magnitude M^ may be given a deterministic value or a discrete
distribution (that is, a set of values with associated probabilities). A
magnitude distribution other than the truncated exponential is easily
incorporated in the program; since integration over magnitude is done
numerically in the program, it is necessary only to calculate with the desired
distribution the probability that earthquakes occur with sizes in a defined
magnitude range. The location in the program for making this change is
indicated with comment cards.
10

The rupture length of an earthquake is uncertain; the distribution of
rupture length is taken to be lognormal, with parameters a function of the
magnitude of the event. The mean value of the logarithm of rupture length 1
is assumed to be a linear function of magnitude:
mean log^l^-H^m (4)
where a-^and bj^ are constants. This mean value, and the standard deviation
(J iog i , are sufficient to define the rupture length distribution for
magnitude m. As is the case with the magnitude distribution, alternate
distributions may be used for rupture length. The appropriate place to make
changes to incorporate a different rupture length distribuiton is indicated
with comment cards in the program.
11

The location of the rupture length is assumed to be equally likely any
place on the fault. Computationally, the energy center is defined as the
point on the rupture equidistant from the two end points, and its location is
assumed to be uniformly distributed any place on the fault except within l r/2
of the ends. This last restriction ensures that the earthquake cannot rupture
past the end of the fault. It is possible to introduce alternate assumptions
on rupture location but it may be easier and more appropriate to divide a
single fault into several faults with different activity rates. Note,
however, that one long fault cannot be represented exactly as several faults
laid end-to-end, because earthquakes are not allowed to rupture past the end
of any fault.
A myriad of assumptions are possible regarding the temporal process
governing earthquake occurrences, with the program as currently written. The
form of the input and output is the same, but their interpretations are
different. For example, if it is assumed that earthquakes occur as a Poisson
process, mean activity rates for each fault are input, and the program outputs
both the expected number of times that amplitude levels of interest will be
exceeded (consistent with the time period used for activity rates) and the
risk associated with these amplitude levels (that is, the probability that
they will be exceeded).
12

Alternately, if any of a wide range of recurrence processes is assumed, the
mean rate of occurrence is again input, and the program again computes the
expected number of times selected amplitude levels will be exceeded. In this
case the total expected number is an estimate of the risk, but is a
conservative and generally accurate estimate (as explained below). Finally,
in the most general application, if one chooses not to assume any temporal
process at all, one inputs (in place of the activity rate for each fault), the
probability that an event occurs on that fault during the time of interest.
If this number is low (as is generally the case), the probability of multiple
events is negligible, and the "Expected Numbers" output by the program are in
fact probabilities that the selected amplitudes will be exceeded by
earthquakes on a single fault; the "Total Expected Numbers" are conservative
and generally accurate estimates of the risk for the amplitudes of concern,
for earthquakes on all faults. This last statement follows from the fact
that, if p. is the probability that an earthquake occurs on fault i and
causes some amplitude level at the site to be exceeded, then
2>i
13

The expression on the right is an exact calculation of risk from all
faults; the summation of probabilities on the left is an accurate estimate of
the risk if the total risk is less than about 0.3. This is usually the case
for seismic hazard problems; that is, the amplitudes of interest generally
have an associated risk less than 0.3 for the time period of interest.
The ground motion amplitude measure Z is assumed to be lognormally
distributed; parameters of the distribution are a function of source size and
distance. The expected value of the logarithm of Z is given by
E(ln Z)=c 1 +c 2M+c 3 In (R + r Q ) (6)
where Z is the amplitude of interest (peak ground acceleration, spectral
velocity, etc.), M is magnitude, R is distance from the site to the closest
point of rupture, and c, c^ Co, and r are constants. Uncertainty in In Z is
assumed to be normally distributed, with standard deviation O -, 7.
As alternatives to this attenuation function, it is possible to
introduce a variety of models to estimate ground motion at the site. At the
appropriate place in the program (during integration of equation 1 above), the
location of the rupture on the fault is given with respect to the site. A
ground motion model which accounts for (for instance) azimuthal and focusing
effects as well as source size and distance could easily be introduced. Even
a deterministic ground motion function could be introduced; the program would
yield probabilistic estimates of ground motion through integraton over
uncertainties in magnitude, rupture length, and location.
14
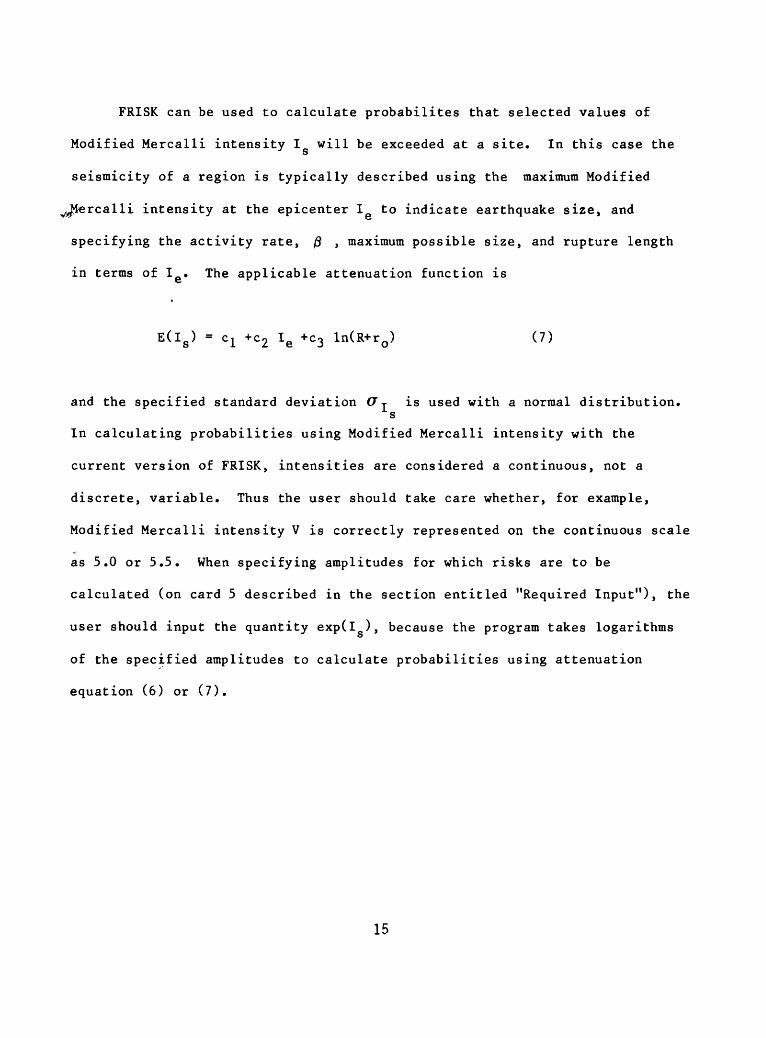
FRISK can be used to calculate probabilites that selected values of
Modified Mercalli intensity I will be exceeded at a site. In this case the
seismicity of a region is typically described using the maximum Modified
ercalli intensity at the epicenter I to indicate earthquake size, and
specifying the activity rate, 0 , maximum possible size, and rupture length
in terms of I e » The applicable attenuation function is
E(I S ) - c x +c2 I e +c3 ln(R+r0 ) (7)
and the specified standard deviation O-r is used with a normal distribution.s
In calculating probabilities using Modified Mercalli intensity with the
current version of FRISK, intensities are considered a continuous, not a
discrete, variable. Thus the user should take care whether, for example,
Modified Mercalli intensity V is correctly represented on the continuous scale
as 5.0 or 5.5. When specifying amplitudes for which risks are to be
calculated (on card 5 described in the section entitled "Required Input"), the
user should input the quantity exp(l ), because the program takes logarithms5
of the specified amplitudes to calculate probabilities using attenuation
equation (6) or (7).
15

PROGRAM OPERATION AND OPTIONS
The program calculates risk according to equation 1 with a series of
nested "DO" loops. Operation of the program is shown in figure 1 in an
overall sense. The loop on "Problems" allows calculation of risk for several
ground motion parameters simultaneously (for instance, peak ground
acceleration and displacement). The loop on sites is inside the loops on
fault, magnitude, rupture length, and energy center location, so that
calculations required to locate a certain rupture on the fault and determine
the associated probabilities are made only once for all sites. A result of
this efficiency in operation is that calculated risks for each site must be
stored (in array "RISK" which has four dimensions) until all calculations are
finished.
16

( START J
READ GENERAL DATA 7LOOP ON FAULT
READ FAULT DATA 7LOOP ON MAGNITUDE
CALCULATE PROBABILITY OF THIS MAGNITUDE
LOOP ON RUPTURE LENGTH
CALCULATE PROBABILITY OF THIS RUPTURE LENGTH
LOOP ON ENERGY CENTER LOCATION
LOOP ON SITES
LOOP ON PROBLEMS
LOOP ON INTENSITIES
LOCATE RUPTURE ON FAULT
CALCULATE CLOSEST DISTANCE FROM SITE TO RUPTURE
OUTPUT RESULTS 7
f STOP)
Figure 1. Macro flowchart of program.
17

Changes to incorporate a more sophisticated ground motion model than
that currently adopted in the program (which uses only magnitude and closest
distance to rupture as the controlling variables), are easily accomplished.
Within the loop on sites, the location of the rupture on the fault is defined
as a series of line segments (the number of which is contained in variable
NSRL) with end point coordinates contained in arrays RLX and RLY, from
elements 1 through NSRL+1. The site under consideration is located at
SITEX(2,JK) and SITEY(2,JK). A visual example is given in figure 2. Site and
rupture locations are given in a Cartesian coordinate system; this is the
user's system if Cartesian locations were input, and it is a system with
origin at the average latitude and longitude of all sites if latitudes and
longitudes were used to identify site and fault locations by the user. With
the location of the rupture thus defined, virtually any mathematical ground
motion model for strike-slip or other faulting can be used to estimate ground
motion at the site. Once this model is implemented, the program will
integrate over rupture location, rupture length, and magnitude to yield a
probabilistic estimate of the ground motion measure of interest.
18

FAULT
RLX(5),RLY(5)-
RLX(4),RLY(4)-+{
RLX(2),RLY(2)-+{
RLX(l) f RLY(l)
RUPTURE
SITE LOCATION:SITEX(2 fJK) fSITEY(2,JK)
NRSL =
/ORIGIN
LOCATED AT AVERAGE LATITUDE AND LONGITUDE OF SITES IF LATITUDE AND LONGITUDE ARE INPUT.
Figure 2. Typical site and rupture location showing meaning of program variables.
19

If the risk from a normal or reverse fault were to be calculated, this
could be accomplished by changing the program to allow specification of the
dip angle (and directon of dip) of the fault. Using the fault line segments
to represent the surface expression of faulting, the closest distance to the
rupture surface, or any other geometrical variables, could then be computed
and used to estimate ground motion at the site; the program would, as usual,
integrate over earthquake size and location to calculate seismic hazard.
For a given magnitude the program integrates over possible rupture
lengths using equation (3) to determine the mean logarithm of rupture length
and assuming a lognormal distribution with standard deviation specified by the
user. Computationally, integration is done over the logarithm of rupture
length; in general the integration is from the mean value minus two standard
deviations, to the mean value plus two standard deviations of log^Q lr » When
the latter value exceeds the total length of the fault, a truncated lognormal
distribution is used, and integration is done from the lower value up to the
total fault length. When the mean value minus two standard deviations exceeds
the fault length, a warning message is printed and all earthquakes of that
magnitude are assumed to rupture the entire fault with probability unity.
20

As noted in the input documentation, as many as five attenuation
equations can be input, and risks can be calculated simultaneously for as many
as five ground motion measures. These features can be used in several ways.
For instance, two attenuation equations (possibly representing peak ground
acceleration and peak ground velocity) can be specified, and the program will
compute risks for specific values of acceleration and velocity. Alternately,
two or more attenuation equations can be input, one for a set of faults and
the others for the remaining faults, and risks will be calculated for one
ground motion variable using the appropriate attenuation equation for each
fault. Combinations of the above applications are also possible. A third use
is to specify one attenuation equation and several "problems;" this allows
calculation of risk for many amplitude levels. The maximum number of
amplitude levels per problem is ten, which results from the standard width of
a line printer page.
21

The program allows input of the maximum possible magnitude M^ for each
fault as a variable with an associated discrete distribution, rather than as a
point estimate. Thus the user can account for statistical or professional
uncertainty in this variable. (See, for example, McGuire, 1977.) The risk
calculated by the program is virtually the same as the weighted risk which
would be calculated at a site from a series of faults all identical except for
Mi, with the risk from each fault weighted by the probability associated with
its M^ . (To be theoretically correct, the second approach should be followed.
The method used here, replacing a point estimate of M, , by a Bayesian or
predictive distribution, gives accurate estimates for risks less than about
0.1, when the calculation of risk can be made by multiplying the probability
of exceedance from one event by the mean activity rate. The advantage in
using a Bayesian distribution for M, is efficiency; integration over magnitude
is done only once.)
22

When a distribution for Mi is specified, the density function and
complementary cumulative function for magnitude are:
fM(m) =/3 exp (-/
GM(m) = l-[l-exp(-/Hm-m0 ))] I pjkj (9)
where p. is the probability associated with maximum magnitude M^ when m is
between m and M^ (p- is zero otherwise), k- is (l-exp(- ^ (M^-~mQ ))) , and
other variables are as previously defined. The density function and
complementary cumulative function are plotted on figures 3 and 4 for the case
where mQ=5.0, ^ =2.0, and M^ is assigned values of 7.0 and 8.0 with equal
weights (probability 0.5) . This "step-truncated exponential distribution" is
compared to the "truncated exponential distribution" obtained if either
magnitude 7.0 or 8.0 is selected as a deterministic upper bound.
23

o
1
TM-
Z 0.1o
LL.
COZUJ0 0.01
0.001
-
1
V
\\ STEP-TRUNCATED \ EXPONENTIAL \ DISTRIBUTION:\ m, -7.0 WITH PROBABILITY 1/2\ m^S.O WITH PROBABILITY 1/2\
TRUNCATED \\ TRUNCATED EXPONENTIAL \ \ EXPONENTIAL
DISTRIBUTION: \ Y0^^1101^ 1
5678
MAGNITUDE m
Figure 3. Density functions for truncated and step-truncated exponential distributions.
24

Ir
<zK O
UJ u5 z
0.1
0.01
0.001
STEP-TRUNCATED EXPONENTIAL DISTRIBUTION:
m^7.0 WITH PROBABILITY 1/2 m^S.O WITH PROBABILITY 1/2
TRUNCATED EXPONENTIAL
DISTRIBUTION: m,= 7.0
TRUNCATED EXPONENTIAL
DISTRIBUTION: m^S.O
8
MAGNITUDE m
Figure 4. Complementary cumulative functions for truncated and step-truncated exponential distributions.
25
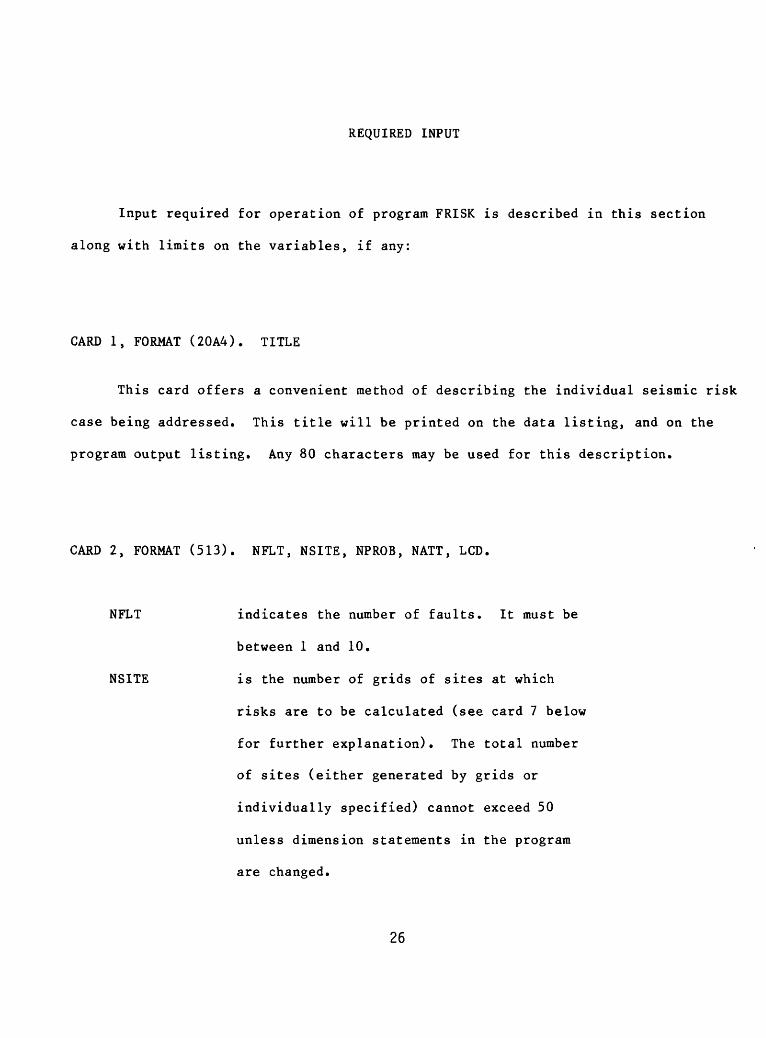
REQUIRED INPUT
Input required for operation of program FRISK is described in this section
along with limits on the variables, if any:
CARD 1, FORMAT (20A4). TITLE
This card offers a convenient method of describing the individual seismic risk
case being addressed. This title will be printed on the data listing, and on the
program output listing. Any 80 characters may be used for this description.
CARD 2, FORMAT (513). NFLT, NSITE, NPROB, NATT, LCD.
NFLT indicates the number of faults. It must be
between 1 and 10.
NSITE is the number of grids of sites at which
risks are to be calculated (see card 7 below
for further explanation). The total number
of sites (either generated by grids or
individually specified) cannot exceed 50
unless dimension statements in the program
are changed.
26

NPROB is the number of ground motion variables for
which risks are to be calculated at each site.
For example, risks may be calculated for
ground acceleration, velocity, and displacement
simultaneously with one execution of this program.
This variable must be between 1 and 5.
NATT is the number of attenuation functions
used in the study. Ordinarily NATT will
be greater than or equal to NPROB.
In any case, NATT must be between
1 and 5.
LCD indicates whether site and fault
coordinates will be input in longitude-
latitude (LCD=1) or in an x-y cartesian
system (LCD=2). If a longitude-
latitude system is used, the program
calculates site and fault locations in
a cartesian system with the average
latitude and longitude of the sites as
the origin, assuming a locally flat earth.
Units used for the generated cartesian
system are kilometers, so if LCD=1, the
attenuation functions, rupture length-
magnitude relations, and source depths,
must use kilometers as the distance
measure.
27

There must be NATT of the following cards:
CARD 3, FORMAT (5F6.3). Cl, C2, C3, RZERO, SIGA.
These variables are parameters in the attenuation function:
ln(z)=Cl + C2*M + C3*ln (//?+ h2 + RZERO)
where z is the ground motion amplitude of interest, M is
magnitude, A is epicentral distance, and h is
source depth. SIGA is the standard deviation of
this estimation (that is, the standard deviation of ln(z) ).
If no dispersion is desired, set SIGA to a small number (for
example, 0.01) rather than exactly zero.
Cards 4 and 5 form a set; there must be NPROB of these sets:
CARD 4, FORMAT (4A4). DESC.
This card offers the user an opportunity to distinguish
among various attenuation equations by labeling them with a
16 character description such as "acceleration" or
"velocity." A blank card is required if the user does not
wish to use this device.
28

CARD 5, FORMAT (13, 3X,10F6.3). NLEI, ATl(l), ATl(2),..ATI(NLEI).
NLEI
ATI(I),...
ATI(NLEI)
indicates the number of ground motion
amplitudes (for example, acceleration
values) to be studied in this problem.
This variable must be between 1 and 10.
are amplitudes for which expected numbers
and risks are calculated at each site.
Input values should be, for example,
accelerations or velocities, not the
logarithms of these quantities. They
must be specified in increasing order.
If Modified Mercalli intensities are
used, the values of ATI must be exponents
of intensities, as discussed elsewhere
in this documentation.
29

CARD 6, FORMAT (13, 3X, 10F6.3). NRSKD, RISKD(l),...RISKD(NRSKD)
NRSKD indicates the number of risks for which the
corresponding amplitudes are desired, and
RISKD(l),...
RISKD(NRSKD) are the risks. These may be specified in
any order. The program calculates amplitudes
for each value of RISKD by interpolation
from the risks calculated for the input
values of ATI; interpolation is done on a
logarithmic scale for both risk and intensity,
No extrapolation is made for risks outside
the range of risks calculated for the
amplitudes in ATI. Therefore, if asterisks
are obtained for an input value of
RISKD(i), the program must be re-run with
a wider range of values specified for
array ATI (card 5), to obtain the amplitudes
corresponding to that RISKD(i).
30

There must be NSITE of the following cards:
CARD 7, FORMAT (2F6.3,213,2F6.3). SX,SY,NX,NY,DX,DY.
SX,SY are the X and Y coordinates for the
site location. They must be in longitude/
latitude or Cartesian form according to
the value input for variable LCD on
card 2.
NX,NY indicate the grid size (number of grid
points) in the X (longitude) and Y
(latitude) directions, for the site
grid. If a grid of sites is not desired,
NX and NY should be 0 or 1; in this case
risk calculations will be made at only a
single site located at SX, SY.
DX,DY indicate the spacing between grid points in
the X and Y directions. If no grid is
desired, values for these variables may be
left blank.
Figure 5 gives a visual explanation of how these variables are used. The total
number of sites (that is, number of grid points if a grid is used) cannot exceed 50
without changing dimension statements in the program. Note that in the Western
hemisphere longitudes increase to the west, so a specified grid will be generated to
the north and west from a site located at SX, SY north of the equator.
31

INDIVIDUAL SITE:
(SX,SY)
SITE WITH GENERATED GRID:
INCREASING LATITUDE
INCREASING LONGITUDE
Figure 5. Examples of site data input on card 7
32

Cards 8 through 12 form a set; there must be NFLT of these sets.
CARD 8, FORMAT (1213). NFP, NRL, IACD(1)...lACD(NPROB).
NFP is the number of points which define this
fault as a series of straight line segments.
NFP must be between 2 and 20.
NRL is the number of steps to be used in the
numerical integration over rupture length.
The program integrates from the mean minus
2 standard deviations to the mean plus 2
standard deviations of log 10 (rupture
length) dividing this interval into NRL
steps. If no dispersion in the rupture
length-magnitude relation is desired (that
is, SIGL is set to a small number on card 11),
NRL should be specified as 1. Otherwise, a
larger value (typically 4) must be used.
Execution time is proportional to the value
input for NRL.
33

IACD(D...
lACD(NPROB) indicate, for this fault, which of the
attenuation functions is to be used in
calculating risks for each of the problems
examined in this execution of the program.
Typically, if ground acceleration and
velocity are to be examined, IACD(1) will
indicate an acceleration attenuation
function and IACD(2) a velocity
attenuation function. Alternately, two
or more acceleration attenuation functions
may be specified with card 3; then IACD(1)
indicates which of these functions apply to
this fault.
34

CARD 9, FORMAT (7F6.3). AMMIN, AMSTEP, RATE, BETA, ECIN, DEPTH, COEF.
AMMIN
AMSTEP
RATE
BETA
ECIN
is the minimum magnitude to be used in
calculations for this fault.
is the step size used in numerical
integration over magnitude. Execution
time is inversely proportional to the value
input for AMSTEP. A value between 0.1 and
0.5 should be adequate for most problems.
is the mean number of events per year
occurring on this fault, between AMMIN and
the maximum magnitude.
is the parameter of the exponential magnitude
distribution; it is In (10) times the "Richter b"
value of the log number versus magnitude relation.
is the distance between successive locations of
the earthquake rupture zone, as the rupture zone
is moved (computationally) along the fault to
account for all possible locations. Execution
time of the program is inversely proportional
to the value input for ECIN. A value between
1 and 10 kilometers should be adequate for most
problems.
35

DEPTH is the depth of the source. Closest distance
to the rupture is calculated using this depth,
so if surface rupture is anticipated, a value
of zero for depth may be appropriate. On the
other hand, if the primary source of seismic
energy is thought to be at some depth, a value
greater than zero is appropriate even if surface
rupture is expected.
COEF is a weighting coefficient for this fault. Its
typical value is unity; however, a value between
zero and one may be used to indicate subjective
probability on the existence of this fault. (As
in the case of probabilities associated with
maximum magnitudes discussed above, multiplying
expected numbers by the value of COEF results
in accurate calculations of risks only when the
risks are less than about 0.1. This includes
the vast majority of situations for which seismic
risk analyses are performed.)
36

CARD 10, FORMAT (13,3X,10F6 .3). NMAX,AMMAX(l),PMAX(1),...AMMAXCNMAX), PMAX(NMAX).
This card allows a discrete distribution on maximum magnitude to
be specified for this fault.
NMAX is the number of maximum magnitudes used to
specify this distribution. NMAX must be between
1 and 5.
AMMAX(l) is the lowest magnitude which is considered
possible for the maximum magnitude on this
fault, and
PMAX(l) is the associated probability.
AMMAX(NMAX) is the highest magnitude which is considered possible
for the maximum magnitude on this fault, and*>
PMAX(NMAX) is its probability.
Values for array AMMAX for elements between 1 and NMAX indicate
other possible maximum magnitudes, in increasing order, and elements of array PMAX
between 1 and NMAX contain the associated probabilities. The sum of probabilities in
array PMAX must be unity.
When choosing values for array AMMAX and for variables AMMIN and AMSTEP on
card 8, the magnitude step size AMSTEP should be evenly divisible into the magnitude
ranges AMMAXC1)-AMMIN,AMMAX(2)-AMMIN,... AMMAX(NMAX)-AMMIN. Otherwise, small errors
will be made by the program in calculating risks.
37

CARD 11, FORMAT (3F6.3). AL,BL,SIGL.
These variables are parameters in the
log rupture versus magnitude relation:
mean , T = AL + BL*M
where L is rupture length (in units
consistent with the distance used in the
attenuation functions and with the X-Y
locations of fault points), and M is
magnitude. SIGL indicates the standard
deviation of the uncertainty in this
relationship (that is, SIGL is the
standard deviation of log^Q (Lr ). If
no uncertainty is desired, specify a
small value (0.01) for SIGL, rather than
exactly zero, or set NRL=1 on card 8.
If SIGL is specified to be less than 0.02,
NRL will be set to 1 automatically by the
program.
38

There must be NFP of the following cards:
CARD 12, FORMAT (2F6.3). FX,FY.
FX and FY are locations of the points which define the
straight line segments comprising the fault.
Two successive points cannot be coincident.
39

GUIDELINES FOR PROGRAM USE
Experience with running FRISK to determine seismic risk for a wide
variety of problems has lead to several guidelines which users should
consider, to avoid unnecessarily long computer runs and inaccurate assessments
of seismic hazard. These guidelines apply to typical problems in seismic
hazard analysis, and may have to be altered in special cases.
FRISK was designed to be efficient for hazard calculations which model
the seismic energy source as a rupture length; as a result, this program is
inefficient (but accurate) when used to model point energy sources (that is,
sources with rupture lengths of zero). If the source of energy release during
an earthquake is modeled as a point rather than as a rupture zone, the user
should probably use a program other than FRISK to calculate seismic hazard.
Several programs are available (for instance, McGuire, 1976) which make hazard
calculations for point sources more efficiently, because (a) numerical
integration on magnitude is done inside, rather than outside, numerical
integration on location, and (b) if certain typical conditions on the
magnitude distribution and attenuation function are met, integration on
magnitude can be done analytically for point sources rather than numerically.
40

Much development work has been done to determine the "best" values for
variables NRL, AMSTEP, and ECIN, which control the numerical integrations (see
the section on "Required Input"). "Best" in this context means values of the
variables which allow accurate calculations with maximum efficiency (lowest
computer run time). Suggested values are NRL=4, AMSTEP=0.5, and ECIN=10. A
typical seismic hazard problem is shown in figure 6, and the acceleration with
0.01 annual risk at each site was determined using the above suggested values
for NRL, AMSTEP, and ECIN. These accelerations are shown in figure 7.
Differences in accelerations obtained using other values for NRL, AMSTEP, and
ECIN are shown in figure 8. Larger values of ECIN may be used, with little
decrease in accuracy; however, it is suggested that the ratio of fault length
to ECIN should exceed 20. Similarly, the ratio of the magnitude range to
AMSTEP should be five or larger.
41
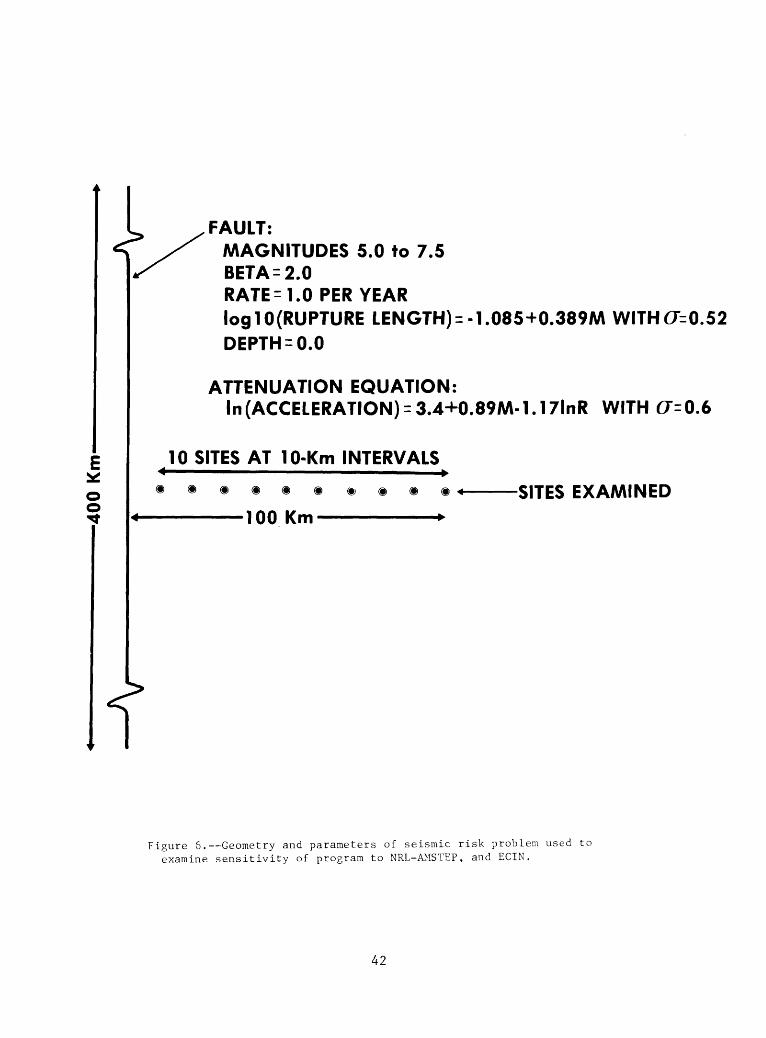
FAULT:MAGNITUDES 5.0 to 7.5 BETA = 2.0RATE =1.0 PER YEARloglO(RUPTURE LENGTH)=-1.085+0.389M WITH (7=0.52 DEPTH = 0.0
ATTENUATION EQUATION: ln(ACCELERATION) = 3.4+0.89M-1.17lnR WITH (7=0.6
10 SITES AT 10-Km INTERVALS
®®®®®»®s® < SITES EXAMINED
100 Km
Figure &. Geometry and parameters of seismic risk problem used to examine sensitivity of program to NRL-AMSTEP, and ECIN.
42

O z << Z «
UJ
^iJ
U
J
UJ _.
§
NO
TA
TIO
N C
OD
E:
NR
L A
MS
TE
P
EC
IN
2,.5,1
0
90
100
DIS
TA
NC
E F
RO
M F
AU
LT
, K
M
Figu
re 8. Changes in 10
0-ye
ar accelerations
usin
g alternate values
for
NRL, AM
STEP,
and
ECIN.

</> o o < U u
1000 900
800
700
600
500
400
300
200
100
1020
30
4050
6070
8090
10
0
DISTANCE FROM FAULT, KM
Figure 7. Acceleration with 0.01 probability of
being exceeded at
sites 10 to 100 km from fault, using NRL=A, AMSTEP=0.5, and
ECIN=10.

On the U.S. Geological Survey's Honeywell Multics computer,
execution time of the program can be estimated with the following equation:
Execution Time (C.P.U. seconds)
= /Fault length\ /Mag. Range\ ,,, 0.7 0.5 0.9 1 ( . \ ECIN ) \ AMSTEP ) (NRL) (NPROB > <NLEI ) (NSITE) -^ (10)
Equation 10 assumes that all problems have the same value input for variable
NLEI. For more than one fault, the right side of equation 10 should be summed
for all faults to estimate execution time. From the form of this equation, it
is evident that changes in run time are proportional to changes in values of
variables NRL, AMSTEP, and ECIN. Thus these variables should be changed only
with extreme caution. Changing each by a factor of 10 could increase
execution time by a factor of one thousand! For other computers the constant
1/500 in equation 10 will change, but the influences of the variables will
not. Execution time increases less than proportionately to NPROB, NLEI, and
NSITE, because integrations over magnitude, location, and length of rupture
are done only once for all problems, amplitudes, and sites. Faults specified
by a large number of line segments require somewhat more execution time than
faults of the same length which are straight.
Use of brand names in this report is for descriptive purposes only and
does not constitute endorsement by the U.S. Geological Survey.
45

A note of caution should be expressed with regard to including
uncertainty in the magnitude-rupture-length equation. While such uncertainty
may be inherent in available data, including it in seismic hazard analyses
can, in certain instances, result in excessive conservatism. If the variable
of interest is peak ground acceleration, a longer-than-expected rupture length
for a given magnitude earthquake may correspond to a smaller-than-expected
average stress drop over the fault. If this low average stress drop could be
expected to generate lower-than-average peak accelerations at a site, not
accounting for these lower accelerations in the attenuation equation would
result in conservative estimates of the risk, at acceleration levels which are
generally of interest. Thus it may be more accurate to ignore the uncertainty
in rupture length given magnitude, and do the hazard analysis as if the
magnitude-rupture length relationship were a deterministic one.
FRISK was written to take advantage of repeated calculations. Thus, to
solve seismic hazard problems, it is most efficently used when calculations
are made during one execution for multiple sites and for all problems and
ground ncnon ampiLc^afj of lacerej: ^p ejL.<~^-^>-~- .1 - - = If ra: on, velocity,
displacement, spectral velocity, and so on), rather than making repeated
executions.
46

EXAMPLE PROBLEM
An example problem is described in this section, to illustrate the use
of various features of program FRISK. Input and output are listed in Appendix
A below.
The geometry of the faults and the site are shown in figure 9, along
with the values of parameters used to define seismicity on the faults. For
both faults the rupture length-magnitude relation used is
1 _ T ±»WJ -r \J»JO? Cl (11)log1Q Lr
with a standard deviation of 0.52.
Four attenuation equations are epecified and are used to calculate
probabilities for three problems: two for acceleraton and one for velocity.
In the first problem (labeled "McGuire 78 Accel") the first attenuation
equation (which is for ground acceleration) is used for both faults. In the
second problem (labeled "Donovan 73 Accel") the second attenuation equation is
used. Thus the only difference between the two problems is the attenuation
equation. In the third problem, which calculates risks associated with ground
velocities, the third attenuation equation is used for fault 1 and the fourth
equation for fault 2, to model different velocities that these faults are
thought to produce.
47

FAULT 2FAULT PARAMETERS:
BETA
RATE
MIN. MAG.
MAX. MAG. /PROB.
DEPTH
FAULT 1
1.8
0.1
5.0
7.57.67 6.0/.5
10.
FAULT 2
2.1
0.2
5.0
8.0/.33 6.57.5
0.0
SITE OF INTEREST
0 10 20 30 Km
ORIGIN OF COORDINATES
Figure 9. Faults and site in example problem,
48

For both faults, step-truncated exponential distributions (figures 3 and
4) are used to describe the distribution of magnitudes, with steps at
magnitudes 7.5 and 8 for fault 1 and at 6.0 and 6.5 for fault 2. The minimum
magnitude for both faults is magnitude 5.
Output from the program is shown in Appendix A. Risks are calculated
for the specified levels of amplitude (acceleration in the first two problems,
and velocity in the third). Additionally, amplitude levels are estimated for
annual risks of 0.01, 0.002, and 0.001 by interpolation, as described in the
section on "Theoretical Background."
Execution time for this problem was 12.5 seconds on a Honeywell Multics
computer.
49

REFERENCES
Cornell, C. A. (1968), "Engineering Seismic Risk Analysis," Bulletin Seismological
Society of America, v. 58, no. 5, pp 1583-1606, October.
_______(1971), "Probabilistic Analysis of Damage to Structures under Seismic
Loads," Chapter 27 in Dynamic Waves in Civil Engineering, edited by
D. A. Howells, I. P. Haigh, and C. Taylor, Wiley Interscience.
Der Kiureghian, Armen, and Ang, A. H-S. (1975), "A Line Source Model for Seismic
Risk Analysis," University of Illinois Technological Report, UILU-ENG-75-2023,
Ureana, 134 pp, October.
______(1917), "A Fault-Rupture Model for Seismic Risk Analysis," Bulletin
Seismological Society of America, v. 67, no. 4, pp 1173-1194, August.
McGuire, R. K. (1974), "Seismic Structural Response Risk Analysis, Incorporating
Peak Response Regressions on Earthquake Magnitude and Distance," Massachusetts
Institute of Technology, Department of Civil Engineering Report, R74-51,
Cambridge, 371 pp, August.
_________(1976). "Fortran Computer Program for Seismic Risk Analysis," U.S.
Geological Survey Open-File Report 76-67, 90 pp.
_________(1977). "Effects of Uncertainty in Seismicity on Estimates of Seismic
Hazard for the East Coast of the United States," Bulletin Seismological
Society of America, v. 67, no. 3, pp 827-848, June.
50

APPENDIX A, EXAMPLE PROBLEM INPUT AND OUTPUT
51

example Problem for open-Hie report 2 1 3 a ? 5.P5 .961 -1.77 25. .o3o6.Q6
-2.55- 1 .' 4 1
^cGu i re10
Donovan10
vel oc i t y10.350.
5 i*5.
2-1.0*5 0
15.30.20.25.17.
3 M5.0
2-1.085 0
33.50.50.
0.5 -1.17 -1.21 -78 ace50.
1.32.7291.01el100.
25. .70/0. .657
10. ,6M^
150. POO. 300.73 accel50.(co^b5.
0.01 0100.1 2
.57.5.389MO .80.
IMS.150.200.1 20.256.0.38980.
160.200.
loo.. )10.
.002
3.1
.67
.S2
a0.20.5
0.52
150. POO. 300.
15. 20. 25.0.001
1 .6 10. in.e- . o .^3
2.1 S . ().o6.5 0.5
MOO. 500. 600. 800. 1000.
MuO. 500. 600. 800. 1000.
3^. MO. 50. 60. 80.
1.0
1 .0
52

title: example problem for open-file report
nf 1
12 1 2 3 4
n s
i t e
1
cl 5.850
6.980
-2.550
-1.410
nprob
natt
led
3 c2 0.9&1
O.bOO
1.170
1.210
4 2
c3-1.770
-1.320
-0.729
-1.010
rzero
25.000
25.000
0.000
10.000
siqa
0.63o
0.707
0.6b7
0.649
problem data:
McGuire 78 accel amplitudes:
10
50.000
100.000
150,000
200.000
300.000
400.000
500.000
600.000
800.000 1000.000
Oonovan 73 accel amplitudes:
10
50.000
100.000
150.000
200.000
300.000
400.000
500.000
600.000
600.000 1000.000
velocity (comb.) amplitudes:
10
5.000
10.000
15.000
20.000
25.000
30.000
40.000
50.000
60.000
80.000
risks spec i
t\ed:
3 u.ulOU
0.0020
0.0010
site coordi nates:
1 50.000
100.000
fault
i nformat i
on:
fault
1
nfp
nrl
attenuation codes:
5 M
123
a-rmin
amstep
rote
beta
ec i
n
deptn
coef
b.OOO
O.bOO
0.100
1.600 10.000
10.000
1.000
n ti a x
am max
p m a x
2 7.50
0.67
6.00
0.33
a 1
b 1
s i g 1
-1.085
0.389
0.520
fault segment coordinates
1 15.000
40.000
2 30.000
80.000
3 20.000
145.000
4 25.000
150.000
5 17.000
200.000

fault 2
n f p
or 1
at t
enuat
3 4
12
ammin
amsteP
rate
5.000
0.350
0.200
nmax ammax
pmax
2 6.00
0.50
6.50
0.50
al
bl
-1.085
0.489
ion
codes:
4
beta
ecin
2.100
5.000
s i g
1 0.520
depth
coef
0.000
1.000
fault
segment coordinates
1 33.000
60.000
2 SO.000
160.000
3 50.000
200.000
site
1 coordinates:
50
McGuire
7ri
accel
amp.:
1 og
( amp |
i t uue )
:fault
! e (no/y
r )
fault
2 e
( no/yr)
tota
l e (no/yr )
tota
l ri
sk
spec
i f
i ed
risks:
estimated log
amp.
:estimated amplitude:
Donovan 73
accel
rtmp.:
log
( i»m
p 1
i t ui
le)
:fa
ult
1 e (n
o/yr
)fault
2 e
( no/y r )
tota
l e (no/y
r )
total
risk
specified risks:
estimated log
omp.
:
estimated amplitude:
velocity (comb.) amp.:
1 0>
J( amp 1
i t ud
e) :
fault
1 e
( no/yr )
f au
1 t 2
e (no/yr)
tota
l e (no/yr)
tota
l risk
spec
i f
i ed
r i sk
s:estimated
1 o<3
am
p.
:estimated amplitude:
.000
100.000
50.00
3.91
0.476e-01
00.104e+00
00.
152e+00 0
0. 141e + 00
0
0.010000
5.078
357.127
50.00
3.91
0.6<S7e-01
0U.13He+00
00.205etOO
00.185etOO
0
0.01 0000
6.072
433.337
5 . 0
01 .61
0.372e-01
00.88/e-Ol
00.126C+00
00. 1
ltie + 00
0
0.010000
3.363
28.872
100.00
4.M
,23u
«.'-
01
0.bOle-01
0. d
3 0 e - 0 I
0,797e-0l
0
0.002000
6.496
662.
169
100.00
4.61
.iMe-01
0. 8'
JBe-
Ol
0.I2let00
0.1146+00
0
0.002000
6.625
/54.026
10.0
02.
30
. 1 o2o-0l
0. 4
3««>
-Ol
0.60Ue-01
0,582e-0l
0
o.oo
?:oo
4.047
57.24U
150.00
5.01
. I2ve-01
0.37le-0l
0,50le-01
0.488e-01
0
0.001000
6.725
832.609
150.00
5.01
,2lUe-Ot
0. 5
4 9 p - 0 1
0,/58e-01
0,730e-0l
u
0.001000
6.U27
922.428
15.00
2.71
.90/e-02
0.245e-01
0,33oe-0l
0,330e-01
0
0.001000
4.303
73.910
200.00
5.30
.814o-02
.239e-0l
,32le-0l
.316e-01
200.00
5.30
.128e-01
,3o8e-0l
.49/e-Ol
,484e-01
20.00
3.00
,582e-02
. 1 4
ti e - 0 1
,206e-01
,204e-Cl
300.00
5.70
0.393e-02
0. 110e-01
0 . 149e-01
0.1«6e-01
300.00
5.70
0.549e-02
0.18le-01
0.2366-01
0.233e-01
25.00
3.2<
i0.405e-02
0.946e-02
O.l35e-0l
0.134e-01
400.00
5.99
.0.223e-02
0.5S5e-02
0.778e-02
0.775e-02
400.00
5.99
0.269e-02
0.966e-02
0.124e-01
O.l23e-01
30.00
3 . '
» 00.298e-02
0.63le-02
0.929e-02
0.925e-02
500.00
6.21
O.l39e-02
0.303e-02
0.443e-02
0.442e-02
500.00
6.21
0.145e-02
0.551e-02
0.696e-02
0.693e-02
40.00
3.69
O.l78e-02
0.310e-02
0.488e-02
0.487e-02
600.00
6.40
0.927e-03
O.l7oe-02
0.269e-02
0.268e-02
600.00
6.40
0.837e-03
0.330e-02
0.4l4e-02
0.4l3e-02
50.00
3.91
O.lloe-02
0. 168
e-02
0.284e-02
0.283e-02
800.00
6.68
0.463e-03
0.676^-03
0.11
4e-02
0.114e-02
800.00
6.68
0.325e-03
O.l33e-02
0.166e-02
0.16oe-02
60.00
4.09
O..603e-03
0.97ie-03
0.177e-02
0.177e-02
1000.00
6.91
0.257e-03
0.295e-03
0.553e-03
0.552e-03
1000.00
6.91
0 146e-03
0.606e-03
0.75le-03
0.75le-03
80.00
4.38
0. 428e-03
u.377e-03
0.805e-03
O.eObe-03

APPENDIX B, PROGRAM FLOW CHART
55

( START J
INITIALIZE VARIABLES
READ LIMITS, ATTENUATION
INTENSITY DATA
CONVERTINTENSITY
ARRAY TO ALOGOF ITSELF
READ DESIRED RISKS
INITIALIZE RISK ARRAY TO ZERO
READSITE
^INFORMATION)
EXPAND SITESTO GRIDS, IFSPECIFIED
56

LOOP ON NUMBER OF FAULTS
CONVERT LATITUDE,LONGITUDE,
COORDINATES TOCARTESIAN SYSTEM
READ FAULT
INFORMATION
CALCULATE NUMBER OF MAGNITUDE
INTERVALS
i r
READ FAULT COORDINATES
CONVERTLATITUDE/LONGITUDE
COORDINATESTO CARTESIANCOORDINATE
SYSTEM
CALCULATEINFORMATION
PERTINENT TOFAULT SEGMENTCALCULATIONS
LOOP ON NUMBER OF MAGNITUDES
CALCULATE PRESENT
MAGNITUDE "AMAG"
57

LOOP ON NUMBEROF RUPTURE LENGTHS
CALCULATE UPPER AND LOWER LIMITS
ON THISMAGNITUDE RANGE "AKAGP," "AMAGM"
1DETERMINE IN
WHICH MAXIMUMMAGNITUDE RANGE
"AMAG" ISLOCATED
CALCULATEPROBABILITY,
"PMAG" ASSOCIATEDWITH THISMAGNITUDE
RANGE
CALL NDTR
DETERMINE NORMALIZING
CONSTANT"ANORM" FOR
RUPTURE LENGTHDISTRIBUTION
CALCULATELENGTH OFRUPTURE
WRITEERROR
MESSAGE
RUPTURE LENGTH>FAULT
LENGTH9
58

LOOP ON NUMBER OF ENERGY CENTERS
CALL NDTR
RUPTURE LENGTH = FAULT LENGTH PROBABILITY OFTHIS RUPTURE
LENGTH (PRL)=1.0
CALCULATE PROBABILITY
OF THIS RUPTURE LENGTH
ZERO OUT RUPTURE LENGTH
ARRAYS ("RLX," "RLY")
CALCULATE NUMBER OF ENERGY CENTERS ALONG FAULT AND DISTANCE BETWEEN ENERGY CENTERS
LOCATE FAULTSEGMENT ON
WHICH ENERGY CENTER LIES
CALCULATE X+Y COORDINATES FOR ENERGY CENTER
59

LOOP ON NUMBER OF SITES
LOOP ON NUMBER OF PROBLEMS
LOOP ON NUMBER OF SEGMENTS IN RUPTURE LENGTH
CALCULATE X+Y COORDINATES FOR BOTH END POINTS OF
RUPTURE LENGTH
DETERMINE CLOSEST DISTANCE
FROM SITE TO RUPTURE LENGTH
CALCULATE EXPECTED
INTENSITY FOR THIS MAGNITUDE AND CLOSEST
DISTANCE
LOOP ON INTENSITY
CALCULATE RISK FOR THIS MAGNITUDE,
RUPTURE LENGTH, LOCATION OF RUPTURE, AND SITE LOCATION
60

SHIFT POSITIONOF RUPTURELENGTH DOWN
FAULT
LOOP ON NUMBER OF SITESLOOP ON NUMBER OF PROBLEMS
CALCULATE EXPECTED NUMBER, TOTAL EXPECTED NUMBER, TOTAL
RISK
LOOP ON NUMBER OF DESIRED RISKS
OUTPUT EXPECTED NUMBER AND RISK
CALCULATE EXPECTED AMPLITUDE FROM
RISKS
/3UTPUT ESTIMATED AMPLITUDES
^ r
( STOP J
61

APPENDIX C. PROGRAM LISTING
62

1 C program "frisk" for fault risk analysis2 c nesigned by r.k. me guire3 c coded by v.l. opfer4 C u.s.g.s. december* 19/7 golden Colorado5 dimension s i t ex ( 2 , 50 ) , s i t ey ( 2 ,50 ) , f x ( 2 , 20 ) , f y ( 2, 20)6 dimension x f ( 2 ) , r i sk ( 1 0 , 5r 50 , 1 2 ) , t i ( 5, t 0 ) , t i f ( 1 0 ) , r i skd( 1 0)7 dimension f s 1 (20 ) , f sa(<?0) » f sb(20) , i nd(20) »nt i (b» 10)8 dimension cuml(20),alp(20),clp(20),r1x(2u),rly(20),x3(P),y3(2)9 dimension aesc(b,4), c l(b),c2(5),c3(5),siaa(5),iacd(5)/nlei(5)
10 dimension rzero(5)ftitle(20)/a.7iTax(5)»onax(5)11 c * * t h e above array sizes were chosen to mininizc excess storage, if12 c larger arrays are needed, the subscripts are organised as follows!13 C r i s k ( n 1 e i t nprob i ns i t e t n f 1 t ) a t i (nprob/ n 1 e i )14 c s i t ex ( 1 cd» ns i te) s i t ey ( 1 cd» ns i t e) fx(1cd,nfp) fy(1cd»nfp)15 c t i (nprob/ n 1 ei ) desc (nprobf 1~4 ) *******************************16 c ************************************************************17 c if you have problems fitting this program on your computer*18 c change dimension in array "risk" to suit your needs (e.g. if19 c you are analyzing only 1 site* change the 3rd dimension from20 c SO to 1)21 c ***********************************************************22 c the limitations on fs1ffsa,fsb/ and other arrays dimensioned23 C to 20 are the number of fault segment coordinates used to24 c describe the fault.25 c "rd" is input device number "wr" is output device number26 c "data" is output number for data echo output27 nrd=22fl nwr=329 n d a t a = 330 i si t e = 031 c = 0. 01/4532925232 r=6371,033 c r = c *P3« cuml(l)=035 read(nrd,10)(tit1e(i),i--U20)36 c title is the actual title given to the output file37 10 format (20a4)38 wri te(ndata» 1 2 ) ( t i 1 1 e ( i ) , i = 1 / 20)39 12 format (//lx, "title: %20a«)40 ifCwr.eq.dat a )go to 15
42 15 read(nrd,20)nflt,nsite,nprob/natt/lcd43 c nflt=number of faults to be studied. ns i t e=number of sites44 c nprob=number of problems natt^numbor of attenuation functions45 c lcd=l means data is in lat/ long form. lcd :=2 indicates x y input.46 20 format (?0i3)47 write(ndata»30)nfltrnsite»nprobfnattflcd48 30 formotC/ 11 nflt nsite nprob natt 1 cd*1 , /i 3/5x, i 2/ 3 (6x , i 2) )49 writ e(ndata* 'JO)50 do 50 i=l,natt51 read(nrd,3b)cl(i)fc2(i)»c3(i)frzero(i)/siga(i)52 35 forrr.at(10ffr.3)53 40 format ( /6x , " c 1" , 8x , "c2" , 6x , "c3" , 5x , " rzero siga")54 50 wri t e(ndota» bO) i ,cl ( i ) rc2( i ) /c3( i ) , rzero( i ) /sigaC i )55 60 format (Ix, i2,5f 10.3, 2x)56 wr>te(ndata/70)57 70 forrnatC/" problem data:")58 do 100 i=l, nprob -59 read(r»rd> 1 0 ) (desc ( i , j 1 ) , \ I = \ t 4 )60 writ
63

61 80 formot(/Ix,4 a 4, " amplitudes:")62 c Jesc is the description of the attenuation function63 c example: velocity^ or acceleration64 read(nrd,8b)nlei(i)/(at i(i , j)/j = l t nlei(i))65 c nlei is number of intensities to be studied^ ati contains66 c the intensities.67 85 format (i3,!4x, 10f6.3)6H write(ndato,90)n]ei(i),(ati(i,j),j=l,n1ei(i))69 90 fornat C3x, i4, 4x, 10f9.3)70 «o 100 j 1 = 1 ,nlei(i)71 100 ti(i,jl)=alog(ati(ifjl))72 c read in desired risks:73 read(nrd,r>5)nrskdf(risKd(ik)/ik=lfnr74 vjrite(ndata/105)nrskd,(ris<d(ik),ik =75 105 formatC/" risKs specified:"/,1x,i3,3x,Bf10.4)76 do 110 i1=1,nsite77 uo 110 i 2=1 , nprob78 oo 110 13=1,nf1ttl79 do 110 i4=l,nlei(i2)80 110 Hsk(i<4,i3,i2,il)=Q.O81 c read in site file82 wri te(ndata/ 120)83 120 formatC/" site coordinates:")H 4 do 1 75 i = 1 ,nsite85 read(nrdfl60)sx,sy/nxfnyfdxfdy86 i f(nx.eq.0)nx=l87 if(ny.eci.0)ny = l88 do laO j=l,ny89 oo 140 k=l,n x90 i si te=i si te + 191 sitey(1cd,isite)=sy+dy*(j-1)92 sitex(1cd/isite)=sx+dx*(k-1)93 140 write(ndata,150)isite,sitex(1cdfisite)/sitey(lcdfisite)94 150 format(Ix,i2,3x,2f10.3)95 160 fomat ( 2 f 6. 2, 2i 3, 2f 6.2)96 175 conti nue97 i f (lcd.ne. 1 )<jo to 20098 c calculate site coordinates in cartesian form99 do 180 i2=l,i si te
100 avx=avx+sitex(lfi2)101 130 avy-avy*sitey(l,i2)102 t = i si te103 avx=nvx/t104 avy=uvy/t105 zz^cos (svy^c)*cr106 do 190 i2=l,isite107 sitcx(2,i2)=(s'tex(l,i2)-avx)*zz108 190 sitey(2»i2)=(sjtey(l»i2)-avy)*cr109 200 write(noata»210)110 210 fornat(// w fault information:")111 c "do 900 H is the loop in faults112 do 900 j f = l,nfIt113 write(ndata/220)jf114 220 format(/1x,77("-")//" fault M /i2)115 read116 writ117 240 format I/" nfp nrl attenuation codes: w , /1x/i 2, i 1, 4x,10i3)118 do ?50 kk=l,nprob119 if(ioco(kk).gt.riatt)write(nd.3ta^260)iacd(kk)120 250 if(ijcd(kk).gt.natt)iacd(kk)=0
64

121 260 formatC//" ***inva1id attenuation code"/i2/122 1 " will default to zero and continue***"//)123 readCnrd/35)amnin/an"step/rote/beta/ecin/'Jepth/coef124 writeCndata/270)ommin/amstep/rate/beta/ecin/depth/coef125 270 fornatC/" ammin amstep rate beta ecin aepth%126 1 " coef//lx/f5.3,2f8,3,2f 7.3, f8.3/f7.3)127 readCnrd,85)nirax,CamniaxCi)fpmax£i),i=l,nfnax)128 writeCndata/2^0)nmax,(ammoxCi),pmaxCi)/i=l,nmax)129 290 for^atC/" nmax ammax p/n 3 x "/, 1 x , i 2, 2x , 2 C1 x , f 5.2) /, 9C5x / ?(1 x / f 5.2) ,130 1 /))131 read(nrd,3b)a1,b1,sig1132 writeCndata/300)al , b],sigl133 300 formatC/" al",9x/"bl sigI" , /Ix,f7 . 3,2f10.3)134 ifCsiql.le.0.02)nrl=l135 ifCsig1.1e.0.02)writeCndata/280)136 280 formatC/" small uncertainty in rupture length, nrl set = 1")137 nmaq = (afiinax(nnax)-anrnin + 0.01)/amstep138 c srl indicates limits on integration over uocertainy in loglO139 c (rupture length)/ in standard deviations.140 srl=2.0141 anrl=nrl142 delrl=2.*srl/anr1143 c read in fault secernent coordinates144 writeCndata,310)145 310 formate/" fault segment coordinates")146 do 320 i=l,nfp147 readCnrd,3b)fx(1 c d,i)/fy(led,i)148 wri teCndata,150)i,fx(lcd,i),fy(lcd,i)149 i f(lcd.ne.1)go to 320150 c calculate fault point coordinates in cartesian form151 fx(2/i )=Cavx-fx(l,i))*zz Ib2 fyC2/i)=(avy-fyCl/i))*cr153 320 continue154 350 do 360 i=2/nfp155 xdelta=fxC2/i)-fxC2/i-1)156 ydelta=fy(2/i)-fyC2/i-1)157 c calculate distance between Points/ slope of line equation 158' fs1Ci) = Cxde1ta*xdelta + ydelta*yde1t a)**.5159 ifCaosCxdelta).1t.0.0001)go to 355160 c fsa is the slope of the segment line equation161 c fsb is the x y intercept of the segment line equation,162 fsaCi)=ydelta/xdelta163 fsb(i)=fyC2,i-l)-fsaCi)*fxC2/i-l)164 355 ind(i)=l165 i fCaosCxdelta).1t.0.0001)ind(i)=2166 i fCabsCydelta).lt.0.0001)ind(i)=0167 c ind=0 indicates 0 slope,168 c ind=l indicates normal slope169 c ind = 2 indicates infinite slope170 cuml (i)=cuml(i-l)ifsl (i )171 360 cont i nue172 c calculate segment distance as percentage of entire fault length^173 c and cum distance percent174 do 370 i=2,nfo175 alo(i)=fsl(i)/cumlCnfp)*100.0176 370 clpC i )=Curnl Ci )/cum 1C nf o) * 1 00 . 0177 c "do HOG" is nunerical integration over magnitude178 do 800 ?i- = l,nmag179 a=im180
65

181182 a.-rtm = arr. ag**aost<?P/2,183 do 3^0 i=l,nmax184 m r a n g=i185 c mrang indicates magnitude range with respect to max, magnitudes,186 360 i f (a,"tag. 1 e.o"imax (i ) )go to 390187 390 ak=0.0188 do ^00 i=<nrang/nnax189 4fO ak=ak+pmox(i}/(l,»exp(-beta*(anmax(i)-ammin)))190 c pmag is probability of magnitude between a<r\o and amm,191 c Insert on alternative function if the step-truncated192 c exponential is not desired,193 pmag=ak*(exp(~beta*(amm-anmin))~exp(~beta*(amp-ammin)))194 al1=aloglO(cuml(nfp))195 aa=(al1-al-bl*amag)/sigl196 call ndtr(aa,fO,d)197 if(fO.eq.1.0)anorm=0.0198 i f(fO.eq. 1 .0)qo to 410199 anor«i=l ./( l.-fO)200 c "do 700" is numerical integration over length of ruoture201 410 do 700 irl-1/nrl202 orl=-srltirl*delrl-delrl /2.203 ar Ip-cir 1-fdol r l/2,204 arJm-arl-delrl/2.
206 if(pi .1e.cuml (nfp)Joo to 430207 if ( ir1 ,gt,1)go to 800208 prl=l,0
210 ^20 format(" *>caution** mean-2 siyna rupture length ( M /f7.3/") is 1211 1 " greater than fault",i2," length ( " , f7.3, " ) . for nagnitudeS"212 1 ,f5.3)213 rI=cum1 (n fp)214 go to 440215 430 call ndtrCarlm,f1/d)216 call ndtr(ar)p,f2/d)217 i f(i rl,oq.1)f1 = 1.0218 if(irl.eq.nrl)f2=fO219 c prl is probability of rupture length between220 c 10.**(al*~bl*aniag + arlm) and221 c 10.**(al+61*amag+arlp).222 c Insert an alternative function if the lognormal is not desired.223 nr1=(fl-f2)*anorm224 c ^ero out rupture length arrays:225 440 no 4bO kj=l,20226 rlx(kj)=0227 450 rJy(kj)=0228 c calculate number of energy centers along fault and the distance229 c between energy centers230 in=(cuml(nfn)-rl)/ecin+1.999231 if(in.eq.l)in=2232 c stsz is energy center step size in percent233 stsz=(10u.0-((rl)/cuml(nfp))*100.fl)/(in-i)234 c xf(l) is the location in percentage along the fault where the235 c rupture length begins/ and xf(2) is the end point/ also in %236 xf(1)=0.0237 xf(2)=(r1/cumlCnfp))*lOO.O238 kseq=l239 c kseg is fault segment on which energy center is located,240 c "do 600" is numerical integration over rupture location
66

241 cio 600 i k = l * in242 c ecp is the enerqy center location as a percent along the fault length243 ecp=(xf (2)-xf (l))/2.+xf (1)244 c locate seqment on which energy center is located245 do 460 kt=kseq,nfp-1246 ksegl=kt+l247 460 if(PCP.le.clp(ksegl))go to 4/0 246 470 *seg=kt249 b = c1p(useql )-ecp250 a=alp(ksegl)-b251 c calculate energy center x and y coordinates252 ecx=(b*fx(«>/kseg)+a*fx(2,ksegl))/(3 + b)253 ecy=(b*fy(2,kseg)+o*fy(2,ksegl))/(a+b)254 do 4/5 m=l,2255 oo 4/5 n=l,nfp-l256 i f (xf (m) .gt.clp(nM))go to 475257 b = clp(n-U)-xf (m)258 a=alp(n+l)-b259 c nsl is seqment on which beginning of rupture length lies2bO c ns2 is segment on which end of rupture length lies.26 1 if(m.eq.l)nsl=n262 if(m.eq.2)ns2=n263 c calculate x one y coordinates for both end points of rupture length264 x3(m)=(b*fx(2»n)*a*fx(2/n+l))/(a+b)265 y3CnO=(b*fy(2rn)*a*fy(2,n+l))/(a+b)266 475 cont i nue267 c nsrl is number of segments in rupture length268 nsrl=ns2-ns 1 + 1269 rlx(I)=x3(l)270 rlxCnsrltl)=xM2)271 rly(l)=y3(l)?72 rlyCnsrl+I)=y3(2)273 if (nsr1.eq.1)go to 490274 ji=0275 do 4bO j=2,nsrl-l276 ji=ji*l277 rlx(j)=fx(2»nsl*j1) 278'480 rly(j)=fy(2rnsl+ji)
280 c coding between asteriks calculates closest distance to this281 c rupture for site jk282 c there are nsrl line segments in this rupture length, points283 c defining rupture are contained in arrays rlx(i) and rly(i) from284 c elements 1 to nsrl + 1,285 c probability of this tfiagnitude is pmag206 c probability of this rupture length is prl287 c probability of this location of rupture length is I/in288 c site coordinates (x,y) are in arrays sitex(2*jk) and sitey(2/jk)289 c sitex(lrjk) and sitey( 1 r } k)contain 1 atitudef1ongitude coordinates*290 c i f used.291 c energy center is located at ecx^ecy292 490 do 570 jk=l,isi te293 c d = 9 9 9 9 9 ,294 do 5bO k=i,nsrl295 kl=ktl296 c calculate distance from site to both end points of rupture297 c length segment and distance from site to pcroendicular dropped298 c on sequent length299 sl=((p1x(k)-sitex(2,jk))**2+£p|y(k)-sitey(2»jk))**2)**.5300 s2=((plx(kl)-sitex(2,JK))**2-Kply(kl)-sitey(2»jk))**2)**.5
67

301 a=fsa(kl)302 if(ind(kl).eq.2)yo to 500303 if(ind(kl).ne.0)go to 510304 xp=sitex(2,jk)305 yp=rly(k) '306 go to 520307 c xp and yp are the x & y intercepts of the peroendicular from the308 c site to the rupture length,309 500 yp=sitey(2,jk)310 xp = rlx(k)311 yo to 520312 510 xo=(sftey(2/jk)+(sitcx(2/jk)/a)-fsb(kl))/(a+(l/a))313 yp=((sitex(2,jk)-xp)/a)+sitey(2*jk)314 520 perpl=(((sitex(2,jk)-xo)**2+(sitey(2/jk)-yp)**2))**.5315 c determine closest distance and store it316 c cd is the closest distance from the site to the rupture length.317 cd = arri n 1 ( si , s2,cd)318 i f (ind(k 1) .oq.2)qo to 530319 if(xp.c)e.rlx(k).«jnd.xp.le.rlx(kl))c«-i = aminl(perpJ/cd)320 if(xp.ge.rlx(kl).and.xp,le.r1x(k))cd=aminl(perpl/cd)321 qo to 550322 530 if(yp.oe. r1y(k).and.yp.1e.r1y(kl))cd = aminl(perpl,cd)323 if(yp.ge.rly(kl3.and,yp.le.rly(k))cd=aminl(perp1/cd)324 550 continue325 c****************************************************************326 c "eti" is expected intensity for this magnitude and closest distance327 do 560 jj=l/nprob328 i f (i «icd( j j ) .eq.O )go to 560329 eti-cl(ioe<i(jj))+c2(iacd(jj))*ama'3*-c3(iacd(jj))*alog((cd*cd330 1 tc)CDth*dupthj**.b + rzero(iacd(jj)))331 do 560 i =1 ,n)ei(j j )332 w=(ti(jj/i)-eti)/siqa(iacd(jj))333 ca)1 ndt r(w,g/d)334 a i n =i n335 risk(ifjj/jffjk)-risk(i/jj/jf,jk)+coef*rate*g*pmag*prl/ai«336 560 cont i nue337 5/0 cont i nue338 xf(l)=xf(l)+stsz339 x f(2)=xfC2)tstsz340 600 continue341 700 continue342 800 continue343 900 continue344 do 1000 i=l,isite345 write(nwr/910)i/sitex(Icdfi)fSitey(lcd,i)346 910 format(//,115("-"),//" site",i2," coordinates: ",2f9.3)347 do 1000 j=l/nprob348 919 format(" 1oq (a^p1itude):"/7x,10f10.2)349 write(nwr,920)(desc(j,jI)/j1=1,4),(ati(j ,}2), J2=lfnlei(j))350 write(nw r /919)(ti(j,j2),j2=l,nlei(j))351 920 for,Tiat(/,lx,'Ja4,lx,"arop.:",lx, IOU0.2)352 do 940 k=l,nflt353 do 930 l=l,nlei(j)354 930 riskd , j/nflt + 1,i)=risk(l/ } t nf1ttl,i)+risk(l , j,k,i)355 9^0 write(nwr*950)k»(riskCmrj*k*i)rm=l,n)ej(j))356 950 formatC' fault", i2," e ( no/y r ) " , 5x , 1 Oe 1 0 . 3)357 write(nwr,96U)(risk(m,j,nf1tMfi)/Tn=l/nlei(j))358 960 format(" total e(n o /yr)",5x,1O c 10.3)359 do 9/0 ml=l,nlei(j)360 if(risk(fr<l/j,nfU-H,i).lt.0.0001)risk(ml,j,nfU+2/i) =
68

361 1 ri sk(mi,j,nf1 tf 1,i)362 i f(ri skUl, j ,nf 1 t-M / i ). 1 t .0.0001 ) no to 970363 risk(ml,j,nnt+2,i) = (l-exp(-risk(rM,j,nf!ttl,t)))364 970 cont inue365 wpite(nwr,975)(pisk(m/j,nf)t+2,i),m=l,n)ei(j))366 975 format( n total risk",11x,1Oe10.3)367 if (r i skd( 1) .eq.O.OJcjo to 1000368 (Jo 965 kk = l,npskd369 do 960 1 I=1,n1ei(j)-l370 if(risk(11 + 1 /j , nf1t+2/i).en.0.0)qo to 981371 980 i f (pi skd(kk) .U .piskdl , j ,nf1 tt2, i ) .and.piskd(kk).372 1 gt.risk(11+1,j,nf1tf 2, i))qo to 982373 981 ti f(kk)=lUOOOOO.O374 go to 985375 982 tif( kk) = (alog(>iskdJ,j, n f1t+2,i)/Piskd(kk)))/376 1 (aioy(piskd1,j,nf1t+2,i)/pisk(lltl,j,nf1t+2,i)))377 tif(kk)=ti(j,nmif(kk)*(ti(j,!H-l)-ti(j,ll))378 985 continue379 «/pite(nwp»986)(piskd(ik),ik = l,npskd)380 write(nwrf987)(tif(ij),ij=l,nrskd)381 986 formatC/" specified risks:",bx,10f10.6)382 987 formatC" estimated 1oq amp. :" ,\ x,10(1x , f9.3))383 ao 999 i1=1,nrskd384 if (ti f(i1).cq.1000000.0)go to 999385 ti f(i1)=exp(t i f(i1))386 999 continue387 wri te(nwr,998)(tif(im),im = l/npskd)388 998 fopmatC" estifnoted amo 1 i t ude : " , 1 x , 1 0.( 1 x , f 9. 3)/)389 1000 continue390 stop391 end
69

1 subroutine ndtr(x,p,d)2 c x is no* of standardized normal deviates*3 c pis comp* cumulative value (output).4 c d is density value (output)5 if (x) 1,2,36 1 ax=-x7 go to 38 2 ax=x9 3 if (ax-6.0) 5,4,4
10 4 p=l.11 d=0.12 go to 613 5 t=l./(1.0+.2316419*ax)14 d=0.3989423*exp(-x*x/2*0)15 p = 1.0 - d*t*((((l,330274*t - 1.821256)*t + 1.78l478)*t -16 1 0.3565638)*t t 0.3193815)17 6 i f (x) 8,7,718 7 p=1.0-p19 8 return20 end
70

Send to: R. K. McGuireOffice of Earthquake Studies U.S. Geological Survey Mail Stop 966, Box 25046 Denver Federal Center Denver, Colorado 80401 U.S.A.
Please include my name on the mailing list for corrections/ improvements to computer program FRISK.
71