UNITED ST A TES DEPARTMENT OF THE INTERIOR … · had a different shaped trapezoidal weir notch....
63
UNITED ST A TES DEPARTMENT OF THE INTERIOR BUREAU OF RECLAMATION HYDRAULIC MODEL CALIBRATION AND COMPUTER ANALYSIS OF TRAPEZOIDAL TIMBER CONTROL CHECK WEIRS - FARWELL MAIN CANAL, NEBRASKA - OCCS PROGRAM Report No. HYD-583 HYDRAULICS BRANCH DIVISION OF RESEARCH OFFICE OF CHIEF ENGINEER DENVER, COLORADO AUGUST 1968
Transcript of UNITED ST A TES DEPARTMENT OF THE INTERIOR … · had a different shaped trapezoidal weir notch....

UNITED ST A TES DEPARTMENT OF THE INTERIOR
BUREAU OF RECLAMATION
HYDRAULIC MODEL CALIBRATION AND COMPUTER ANALYSIS OF TRAPEZOIDAL TIMBER
CONTROL CHECK WEIRS - FARWELL MAIN CANAL, NEBRASKA - OCCS PROGRAM
Report No. HYD-583
HYDRAULICS BRANCH DIVISION OF RESEARCH
OFFICE OF CHIEF ENGINEER DENVER, COLORADO
AUGUST 1968

The information contained in this report may not be used in any publication, advertising. or other promotion in such a manner as to constitute an endorsement by the United States Government or the Bureau of Reclamation, either explicit or implicit, of any material, product, device, or process that may be referred to in the report.
Where approximate or nominal English units are used to express a value or range of values, the converted metric units in parentheses are also approximate or nominal. Where precise English units are used, the converted metric units are expressed as equally significant values. A table of conversion factors--BRITISH TO METRIC UNITS OF MEASUREMENT- -is provided at the end of this report.

Report No. Hyd-583
HYDRAULIC MODEL CALIBRATION AND COMPUTER ANALYSIS OF TRAPEZOIDAL TIMBER
CONTROL CHECK WEIRS - FARWELL MAIN CANAL, NEBRASKA - OCCS PROGRAM
by E. R. Zeigler
August 1968
HYDRAULICS BRANCH DIVISION OF RESEARCH
UNITED STATES DEPARTMENT OF THE INTERIOR • BUREAU OF RECLAMATION
Office of Chief Engineer . Denver, Colorado

ACKNOWLEDGMENT
This study was conducted under the supery1s1on of Mr. E. J. Carlson, Hydraulic Engineer. · Dr. H. T. Falvey is Head of the Hydraulics Research Section and Mr. H. M. Martini~ Chief of the Hydraulics Branch.
Sam Peng
Sticky Note
None set by Sam Peng
Sam Peng
Sticky Note
MigrationNone set by Sam Peng
Sam Peng
Sticky Note
Unmarked set by Sam Peng

CONTENTS
Abstract . . . . . . . . . . . . . . . . . . . . . . . . . . . . . . . . . . . . . . . . . . s 1lJDJDa. ry . . . . . . . . . . . . . . . . . . . . . . . . . . • . . • . . • . . . • . . . . . • Applications . " ................................... . Introduction ••••••••••••••••••••..•••••••••.•••••• The Investigation . . . . . . . . . . . . . . . . . . . . . . . . . . . . . . . . .
Description of the Timber Control check Installations •••••••••.••••.••••••••.••••••••
The Model •••••••••••••••••••••••••••••••.••••••• Model Tests ••••••••••••••••••••••••••••••••••••
Discussion and Results of the Investigation •••••••
Free Flow Tests •••••••••••••••••••••••••••••••• Submerged Flow Tests ••••••••••••••••••••••••••• Description and Use of the Weir Discharge
Graphs and Discharge Tables ••••••••••••••••••
Table
1 Weir and Canal Dimensions . . . . . . . . . . . . . . . . . . . Figure
1 2 3
4
5 6 7
8
9
10
11
Location Map •••••••••••••••••••••••••••••••• Photographs - Timber Control Checks ••••••••• Drawing - Timber Control Check at
Station 1335+67 ••••••••••••••••••••••••••• Drawing - Timber Control Checks at
Stations 1430+08 and 1459+90 •••••••••••••• Drawing - Measuring Wells ••••••••••••••••••• Drawing and Photographs of the Model •••••••• Photograph - Model and Prototype Weirs at
Station 1335+67 ••••••••••••••••••••••••••.• Photograph - Model and Prototype Weirs at
Station 14-30+08 ••••••••••••••••••••••••••• Photograph - Model and Prototype Weirs at
Station 1459+90 ••••••••••••••••••••••••••• Photograph - Topography in the Model and
Prototype ........................•........ Graph - Discharge Curves for Free Flow ••••••
iii 1 1 2 2
2 3 4
5
5 6
9
11
13 14
15
17 19 20
21
22
23
24 25
Sam Peng
Sticky Note
None set by Sam Peng
Sam Peng
Sticky Note
MigrationNone set by Sam Peng
Sam Peng
Sticky Note
Unmarked set by Sam Peng

Figure
12
13
14
15
16
17
CONTENTS - Continued
Graph - Discharge Ratio - Submergence Ratio - Station 1335+67 •••••••••••••••••••
Graph - Discharge Ratio - Submergence Ratio - Station 1430+08 •••••••••••••••••••
Graph - Discharge Ratio - Submergence Ratio - Station 1459+90 •••••••••••••••••••
Graph - Submerged Flow Discharge Curves for Station 1335+67 •••••••••••••••••••••••
Graph - Submerged Flow Discharge curves for Station 1430+08 •••••••••••••••••••••••
Graph - Submerged Flow Discharge Curves for Station 1459+90 •••••••••••••••••••••••
Appendix
A Method of Least Squares to Determine
B
C
D .E F
Coefficients in the Weir Free Flow Discharge Equation ••••••••••••••••••••••
Method of Least Squares to Determine Coefficients in the Discharge Ratio -Submergence Ratio Equation ••••••••••••••
Figure a. - Residuals of Data Points •••••• Figure b. - Newton's Method of
ApproxiIIIB. tion ••••••••••••••••••••••••••• Weir Discharge Table - Station ·1335+67 •••• Weir Discharge Table - Station 1430+08 •••• Weir Discharge Table - Station 1459+90 ••••
ii
27
28
29
31
33
35
37
41 47
47 49 55 61

ABSTRACT
Three differently shaped trap~zoidal weirs were calibrated in the hydraulic laboratory for free flow and submerged flow canal discharge measurements in field canals of 50- and 90-cfs designed capacity. The 3 weirs were calibrated in the same test facility using model scales of 1:5, 1:2.67, and 1:2.33. In each case the canal bottom upstream from the weir was flush with the weir invert and the downstream canal bottom had a 1.5- to 3-ft vertical drop at the weir. An electronic digital computer was used to make a least squares fit of the calibration data to a curve. Second degree polynomial equations we~e-derived describing free flow conditions and general conical equations describing submerged flow conditions. The computer was used to obtain weir discharge tables and information for weir discharge graphs for submerged conditions. Discharge tables and graphs for each weir and drawings and photographs of model and prototype weir structures are included in the report.
DESCRIPTORS--/ open channel flow/ turbulent flow/ *sharp crested weirs/ subcritical flow/ hydraulic models/ model tests/ *discharge measurement/ *submerged weirs/ curve fitting/ calibrations/ ~heck structures/ weirs IDENTIFIERS--/ *trapezoidal weirs/ least squares method
iii
Sam Peng
Sticky Note
None set by Sam Peng
Sam Peng
Sticky Note
MigrationNone set by Sam Peng
Sam Peng
Sticky Note
Unmarked set by Sam Peng
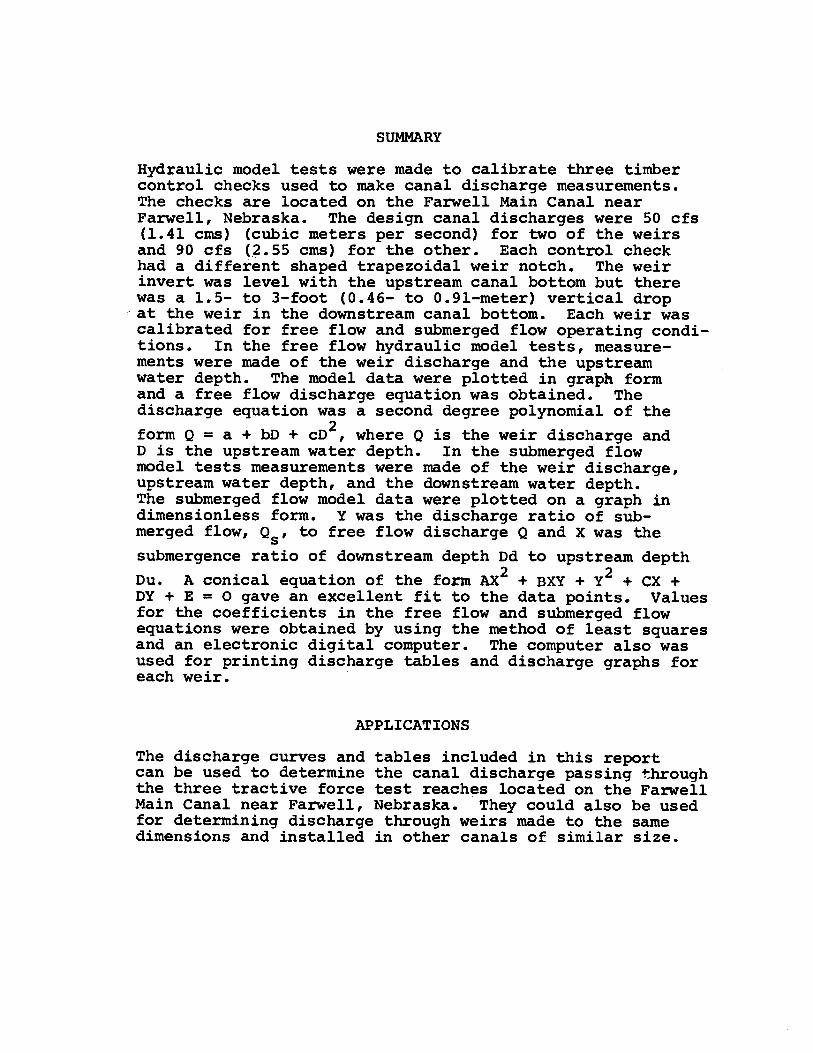
SUMMARY
Hydraulic model tests were made to calibrate three timber control checks used to make canal discharge measurements. The checks are located on the Farwell Main Canal near Farwell, Nebraska. The design canal discharges were 50 cfs (1.41 ems) (cubic meters per second) for two of the weirs and 90 cfs (~.55 ems) for the other. Each control check had a different shaped trapezoidal weir notch. The weir invert was level with the upstream canal bottom· but there was a 1.5- to 3-foot (0.46- to 0.91-meter) vertical drop
,· at the weir in the downstream canal bottom. Each weir was calibrated for free flow and submerged flow operating conditions. In the free flow hydraulic model tests, measurements were made of the weir discharge and the upstream water depth. The model data were plotted in graph form and a free flow discharge equation was obtained. The discharge equation was a second degree polynomial of the form Q =a+ bD + co2, where Q is the weir discharge and Dis the upstream water depth. In the submerged flow model tests measurements were made of the weir discharge, upstream water depth, and the downstream water depth. The submerged flow model data were plotted on a graph in dimensionless form. Y was the discharge ratio of submerged flow, Qs, to free flow discharge Q and X was the submergence ratio of downstream depth Dd to upstream depth Du. A conical equation of the form AX2 + BXY + Y2 +ex+ DY+ E = o gave an excellent fit to the data points. Values for the coefficients in the free flow and submerged .flow equations were obtained by using the method of least squares and an electronic digital computer. The computer also was used for printing discharge tables and discharge graphs for each weir.
APPLICATIONS
The discharge curves and tables included in this report can be used to determine the canal discharge passing through the three tractive force test reaches located on the Farwell Main Canal near Farwell, Nebraska. They could also be used for determining discharge through weirs made to the same dimensions and installed in other canals of similar size.
Sam Peng
Sticky Note
None set by Sam Peng
Sam Peng
Sticky Note
MigrationNone set by Sam Peng
Sam Peng
Sticky Note
Unmarked set by Sam Peng
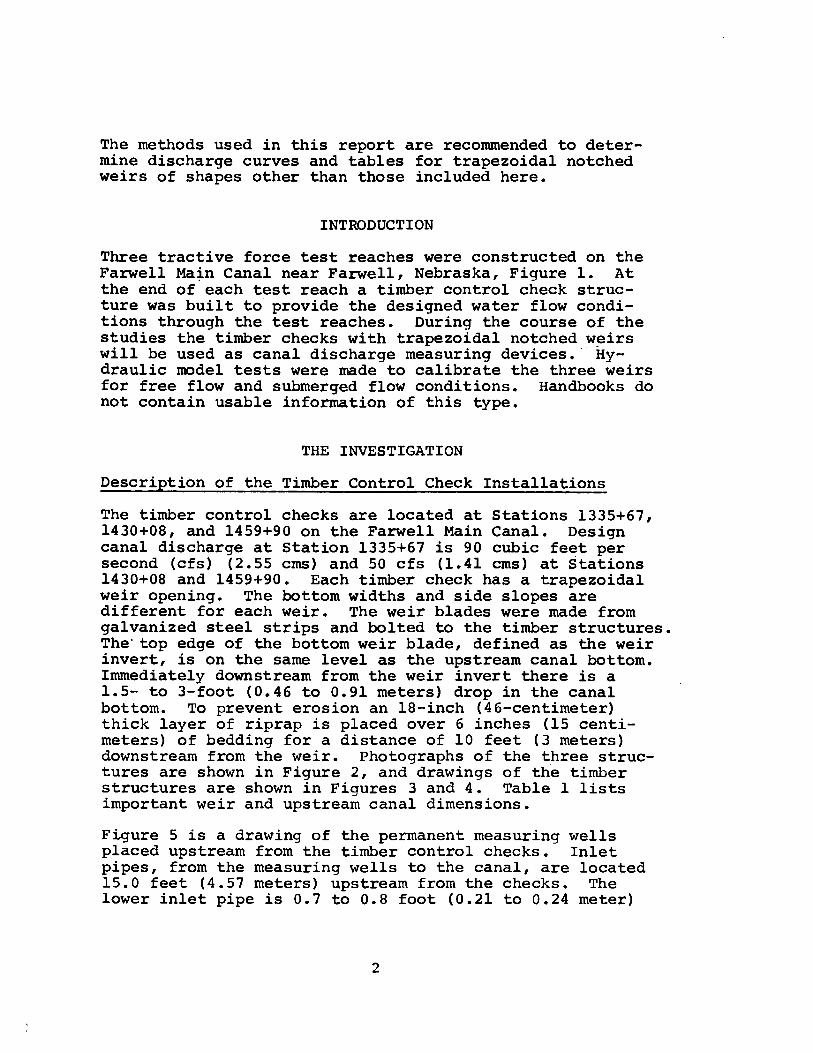
The methods used in this report are reconunended to determine discharge curves and tables for trapezoidal notched weirs of shapes other than those included here.
INTRODUCTION
Three tractive force test reaches were constructed on the Farwell Main Canal near Farwell, Nebraska, Figure 1. At the end of each test reach a timber control check structure was built to provide the designed water flow conditions through the test reaches. During the course of the studies the timber checks with trapezoidal notched w~irs will be used as canal discharge measuring devices.- Hydraulic model tests were made to calibrate the three weirs for free flow and submerged flow conditions. Handbooks do not contain usable information of this type.
THE INVESTIGATION
Description of the Timber Control Check Installations
The timber control checks are located at Stations 1335+67, 1430+08, and 1459+90 on the Farwell Main Canal. Design canal discharge at Station 1335+67 is 90 cubic fe~t_ per second (cfs) (2.55 ems) and 50 cfs (1.41 ems) at Stations 1430+08 and 1459+90. Each timber check has a trapezoidal weir opening. The bottom widths and side slopes are different for each weir. The weir blades were made from galvanized steel strips and bolted to the timber structures. The· top edge of the bottom weir blade, defined as the weir invert, is on the same level as the upstream canal bottom. Inunediately downstream from the weir invert there is a 1.5- to 3-foot (0.46 to 0.91 meters) drop in the canal bottom. To prevent erosion an 18-inch (46-centimeter) thick layer of riprap is placed over 6 inches (15 centimeters) of bedding for a distance of 10 feet (3 meters) downstream from the weir. Photographs of the three structures are shown in Figure 2, and drawings of th·e timber structures are shown in Figures 3 and 4. Table l lists important weir and upstream canal dimensions.
Figure 5 is a drawing of the permanent measuring wells placed upstream from the timber control checks. Inlet pipes, from the measuring wells to the canal, are located 15.0 feet (4.57 meters) upstream from the checks. The lower inlet pipe is 0.7 to 0.8 foot (0.21 to 0.24 meter)
2
Sam Peng
Sticky Note
None set by Sam Peng
Sam Peng
Sticky Note
MigrationNone set by Sam Peng
Sam Peng
Sticky Note
Unmarked set by Sam Peng

above the invert. A water stage recorder, covered by a permanent shelter, is mounted over each well to measure and record the upstream water depth above the weir invert. A staff gage, marked in hundredths of a foot, is installed near the inlet pipes. The zero elevation of the staff gage was set at the same elevation as the weir invert. During canal operation the water stage recorder is periodically checked and the water stage recorder reading is referenced to the staff gage.
Temporary water stage recorders were installed for measuring the downstream water depth above the weir inverts during ~ubmerged flow operation. Fifty-five-gallon steel drums with 1-inch (2.5-centimeter) holes in the sides were placed in the canal downstream from the timber checks for use as stilling wells. The water stage recorders were mounted on the steel drums to record the water level inside the drums. Figure 8 shows one of the temporary water stage recorder installations.
The Model
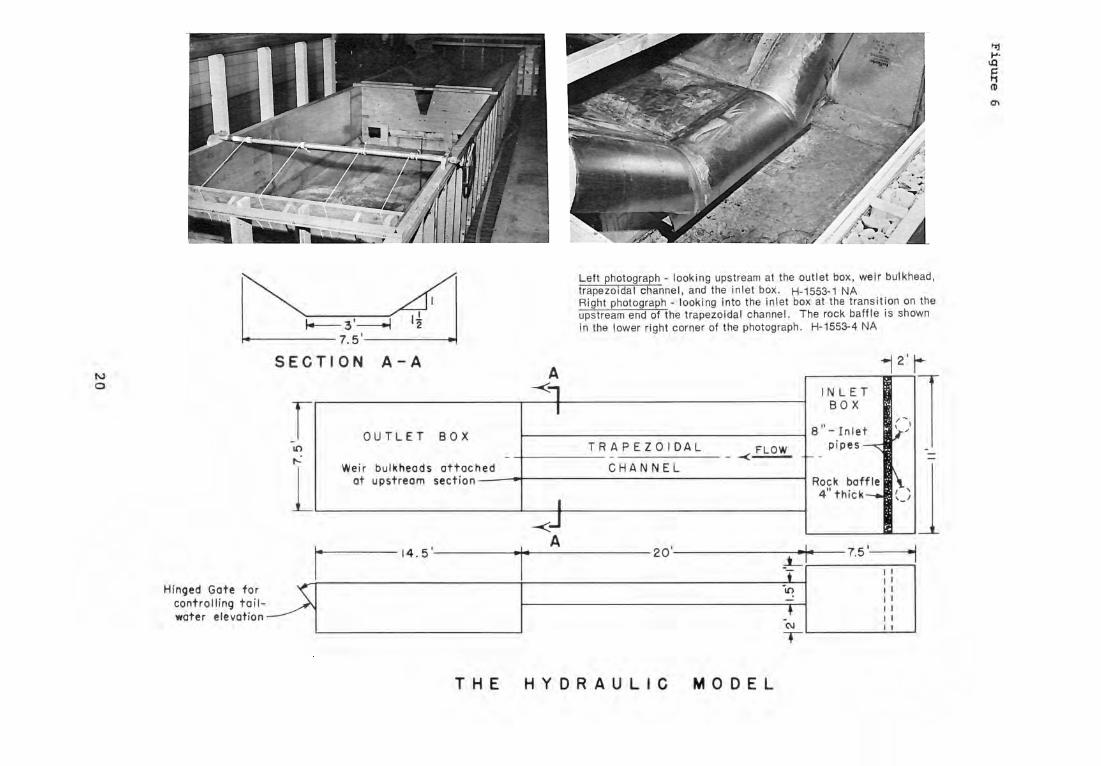
Drawings and photographs of the hydraulic model are shown in Figure 6. The main parts of the model were a head box, trapezoidal channel, and an outlet box. The model was constructed of wood. The interior of the head box, trapezoidal channel, and outlet box were lined with galvanized sheet metal, and the sheet metal joints were soldered to make the model watertight.
Two vertical pumps connected to two 8-inch (20-centimeter) pipelines supplied water to the head box. Each pipeline had a calibrated, portable venturi orifice meter for measuring water inflow into the model. A 0.3-foot (9-centimeter) thick rock baffle containing 3/4-inch to 1-1/2-inch (1.9- to 3.8-cm) gravel was installed in the head box and downstream from the inlet pipes. The baffle reduced the turbulence from the inlet pipes and provided relatively calm and uniform inflow into the trapezoidal channel.
The upstream edge of the trapezoidal channel had a rounded transition to improve the entrance flow condition, Figure 6. The transition was a 90° arc with a 1-foot (30-centimeter) radius. The trapezoidal model channel was 3 feet (91 centimeters) wide, 1-1/2 feet (46 centimeters) deep, 20 feet (6.1 meters) long, and had 1 vertical to 1-1/2 horizontal side slopes.
3
Sam Peng
Sticky Note
None set by Sam Peng
Sam Peng
Sticky Note
MigrationNone set by Sam Peng
Sam Peng
Sticky Note
Unmarked set by Sam Peng

Model weirs were attached to the upstream bulkhead of the outlet box. The model weirs were constructed of plywood and the weir blades were made from 0.11-inch (0.28-centimeter) thick metal strips. When installing the weirs in the model, the top of the bottom weir blade was placed flush with the trapezoidal channel bottom. Tailwater elevations in the outlet box (submergence of the weir) were controlled with an adjustable hinged gate located at the downstream end of the outlet box.
Figures 7, 8, and 9 show photographs of comparable discharges in the three model and prototype weirs.
Model Tests
Three different sizes of trapezoidal weirs were tested in the hydraulic model. The same model was used so it was n~cessary to test each weir using a different model scale. The mo4el scales were as follows:
Weir at Station 1335+67 - Scale 1:5 Weir at Station 1430+08 - Scale 1:2.67 Weir at Station 1459+90 - Scale 1:2.33.
Topography simulating the prototype was constructed in the outlet box for the weir at Station 1459+90. The topography extended 24 feet (7.3 meters), prototype distance, downstream from the weir. Riprap was placed for a distance of 10 feet (3 meters). An additional 14 feet (4.26 meters) of canal extended downstream, Figure 10. Hydraulic model tests were made with and without topography in the model. A comparison of these test results showed that the topography was not needed to obtain satisfactory hydraulic data. No topography was constructed for the weirs at Stations 1335+67 and 1430+08. The water flowed directly from the weirs into the outlet box.
Free flow and submerged tests were made on each of the three weirs. In the free flow tests the weir nappe was aerated -the weir nappe, or jet of water flowing from the weir opening, was completely surrounded by the atmosphere. In the submerged flow tests the tailwater elevation was above the bottom of the weir invert - part of the nappe above the weir invert was submerged.
4
Sam Peng
Sticky Note
None set by Sam Peng
Sam Peng
Sticky Note
MigrationNone set by Sam Peng
Sam Peng
Sticky Note
Unmarked set by Sam Peng
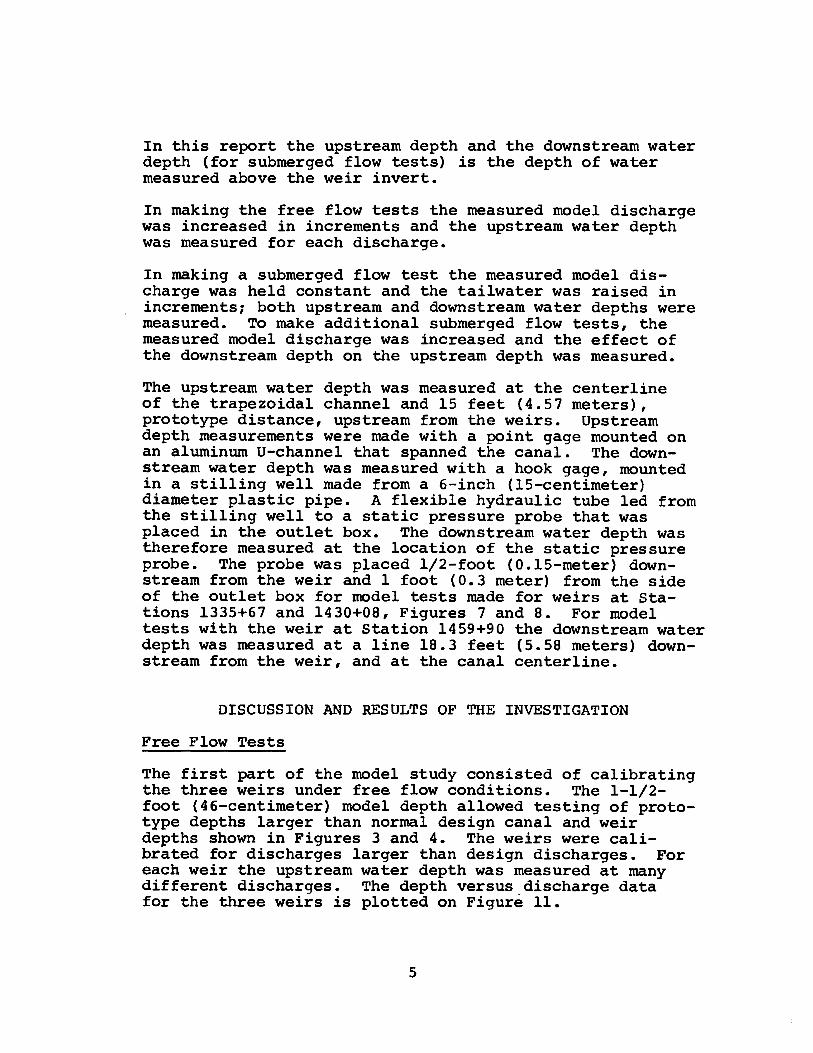
In this report the upstream depth and the downstream water depth (for submerged flow tests) is the depth of water measured above the weir invert.
In making the free flow tests the measured model discharge was increased in increments and the upstream water depth was measured for each discharge.
In making a submerged flow test the measured model discharge was held constant and the tailwater was raised in increments: both upstream and downstream water depths were measured. To make additional submerged flow tests, the measured model discharge was increased and the effect of the downstream depth on the upstream depth was measured.
The upstream water depth was measured at the centerline of the trapezoidal channel and 15 feet (4.57 meters), prototype distance, upstream from the weirs. Upstream depth measurements were made with a point gage mounted on an aluminum u-channel that spanned the canal. The downstream water depth was measured with a hook gage, mounted in a stilling well made from a 6-inch (15-centimeter) diameter plastic pipe. A flexible hydraulic tube led from the stilling well to a static pressure probe that was placed in the outlet box. The downstream water depth was therefore measured at the location of the static pressure probe. The probe was placed 1/2-foot (0.15-meter) downstream from the weir and 1 foot (0.3 meter) from the side of the outlet box for model tests made for weirs at Stations 1335+67 and 1430+08, Figures 7 and 8. For model tests with the weir at Station 1459+90 the downstream water depth was measured at a line 18.3 feet (5.58 meters) downstream from the weir, and at the canal centerline.
DISCUSSION AND RESULTS OF THE INVESTIGATION
Free Flow Tests
The first part of the model study consisted of calibrating the three weirs under free flow conditions. The 1-1/2-foot (46-centimeter) model depth allowed testing of prototype depths larger than normal design canal and weir depths shown in Figures 3 and 4. The weirs were calibrated for discharges larger than design discharges. For each weir the upstream water depth was measured at many different discharges. The depth versus_discharge data for the three weirs is plotted on Figure 11.
5
Sam Peng
Sticky Note
None set by Sam Peng
Sam Peng
Sticky Note
MigrationNone set by Sam Peng
Sam Peng
Sticky Note
Unmarked set by Sam Peng
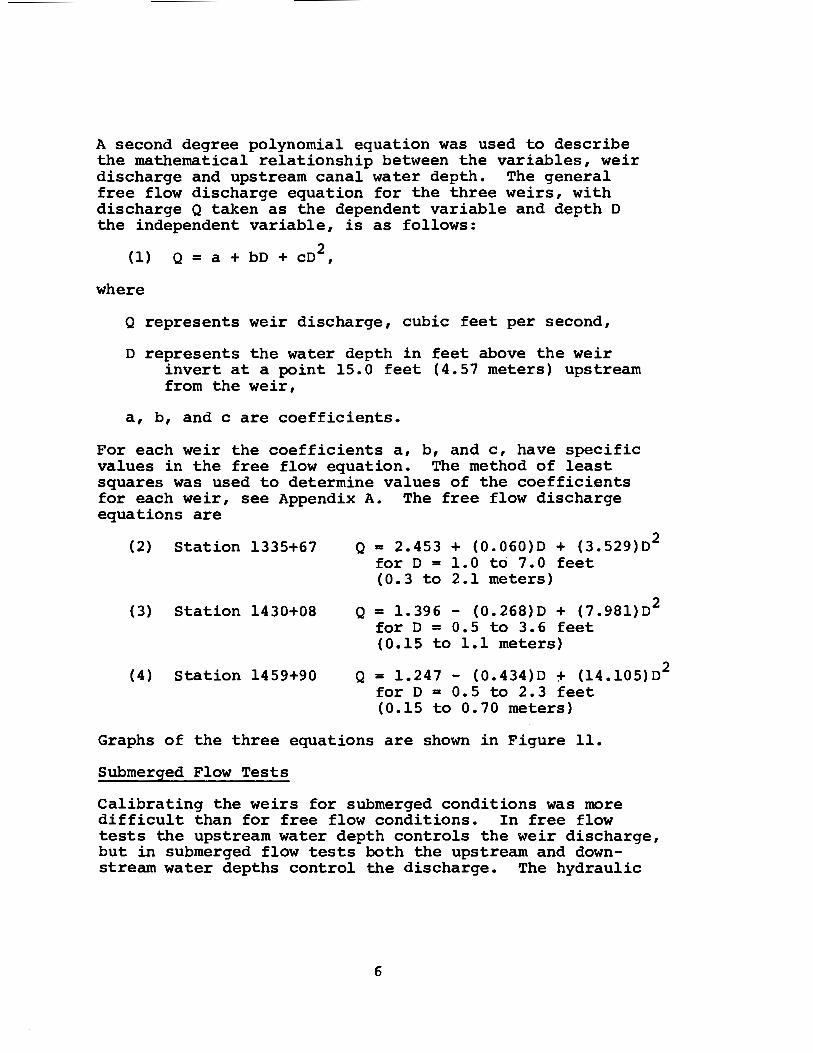
A second degree polynomial equation was used to describe the mathematical relationship between the variables, weir discharge and upstream canal water depth. The general free flow discharge equation for the three weirs, with discharge Q taken as the dependent variable and depth D the independent variable, is as follows:
(1) Q =a+ bD + co2,
where
Q represents weir discharge, cubic feet per second,
D represents the water depth in feet above the weir invert at a point 15.0 feet (4.57 meters) upstream from the weir,
a, b, and care coefficients.
For each weir the coefficients a, b, and c, have specific values in the free flow equation. The method of least squares was used to determine values of the coefficients for each weir, see Appendix A. The free flow discharge equations are
(2) Station 1335+67
(3) Station 1430+08
(4) Station 1459+90
Q = 2.453 + (0.060)O + (3.529)D2 for D = 1.0 to 7.0 feet (0.3 to 2.1 meters)
Q = 1.396 - (0.268)O + (7.98l)D2 for D = 0.5 to 3.6 feet (0.15 to 1.1 meters)
Q = 1.247 - (0.434)O + (14.105)D2 for D = 0.5 to 2.3 feet (0.15 to 0.70 meters)
Graphs of the three equations are shown in Figure 11.
Submerged Flow Tests
Calibrating the weirs for submerged conditions was more difficult than for free flow conditions. In free flow tests the upstream water depth controls the weir discharge, but in submerged flow tests both the upstream and downstream water depths control the discharge. The hydraulic
6
Sam Peng
Sticky Note
None set by Sam Peng
Sam Peng
Sticky Note
MigrationNone set by Sam Peng
Sam Peng
Sticky Note
Unmarked set by Sam Peng

model data for the submerged trapezoidal weir tests were plotted in the form, Discharge Ratio versus Submergence Ratio, where the
and
Submergence ratio= Dd/Du
Discharge ratio= Qs/Q
Dd = downstream water depth above the weir invert,
Du= upstream water depth above the weir invert,
Qs = weir discharge for the given upstream and downstream water depths (submerged discharge),
Q = free flow weir discharge for the given upstream water depth (unsubmerged or free flow discharge).
Data taken from the hydraulic model submerged weir tests included upstream water depth (Du), downstream water depth (Dd), and the model discharge or submerged discharge (Qs). The free discharge (Q) was computed using the upstream depth (Du) in the free flow discharge equation. Both the discharge ratio and submergence ratio were then computed and the data points plotted. Figure 12 is a graph of the data points for the weir at Station 1335+67, Figure 13 -Station 1430+08, and Figure 14 - Station 1459+90. In each figure the discharge ratio is the ordinate and the submergence ratio is the abscissa.
The alinement of the data points on the three graphs indicates the relationship of the discharge ratio to the submergence ratio. However, a mathematical formula describing the discharge ratio in terms of the submergence ratio was needed. By inspection, an ellipse was found to fit the shape of the curve formed by the plotted data points on the graphs. The major axis of the ellipse was rotated 45° to the X axis of the graph. However, the elliptical curve did not fit the entire central portion of the plotted points. But the general equation of the curve was used in making a least squares fit for the data points.
The general equation of an ellipse with a rotated axis is
(5) ax2 .+ bxy + cy2 + dx + ey + f = 0,
7
Sam Peng
Sticky Note
None set by Sam Peng
Sam Peng
Sticky Note
MigrationNone set by Sam Peng
Sam Peng
Sticky Note
Unmarked set by Sam Peng

where x and y are variables. The coefficients a, b, ~, d, e, and f have specific values for any given ellipse. By dividing every term in the above equation by c, renaming the coefficients by using upper case letters and rearranging the terms, the equation takes the form
(6) Ax2 + Bxy + y2 +ex+ Dy+ E = 0
or
(7) y2 + (Bx+ D)y + (Ax2 +ex+ E) = 0.
If the value of xis known then the equation is a quadratic equa~ion in y. Positive values only for the discriminant are used because we are interested in the plot in the first quadrant, and
(8) -(Bx+ D) + J(Bx + D) 2 - 4(Ax2 +ex+ E) y = 2
To use this equation for the case of submerged flow we will let
y = discharge ratio,
x = submergence ratio,
for O < x < 0.98. For x = 1.0 there would be zero head across-the-weir.
The method of least squares described in Appendix B was used to find the specific values of the coefficients A, B, e, D, and E for each discharge ratio - submergence ratio formula. The values of the coefficients are listed in the following table:
Weir at Station
1335+67 1430+08 1459+90
A
1.063 1.031 1.021
B
-1.652 -1.755 -1.918
e
1.685 1.739 1.778
D
1.806 1.828 1.837
E
-2.802 -2.797 -2.788
The graphs of the discharge ratio - submergence ratio formula for the weirs are shown on Figures 12, 13, and 14.
8
Sam Peng
Sticky Note
None set by Sam Peng
Sam Peng
Sticky Note
MigrationNone set by Sam Peng
Sam Peng
Sticky Note
Unmarked set by Sam Peng

Descri tion and Use Disc arge Tables
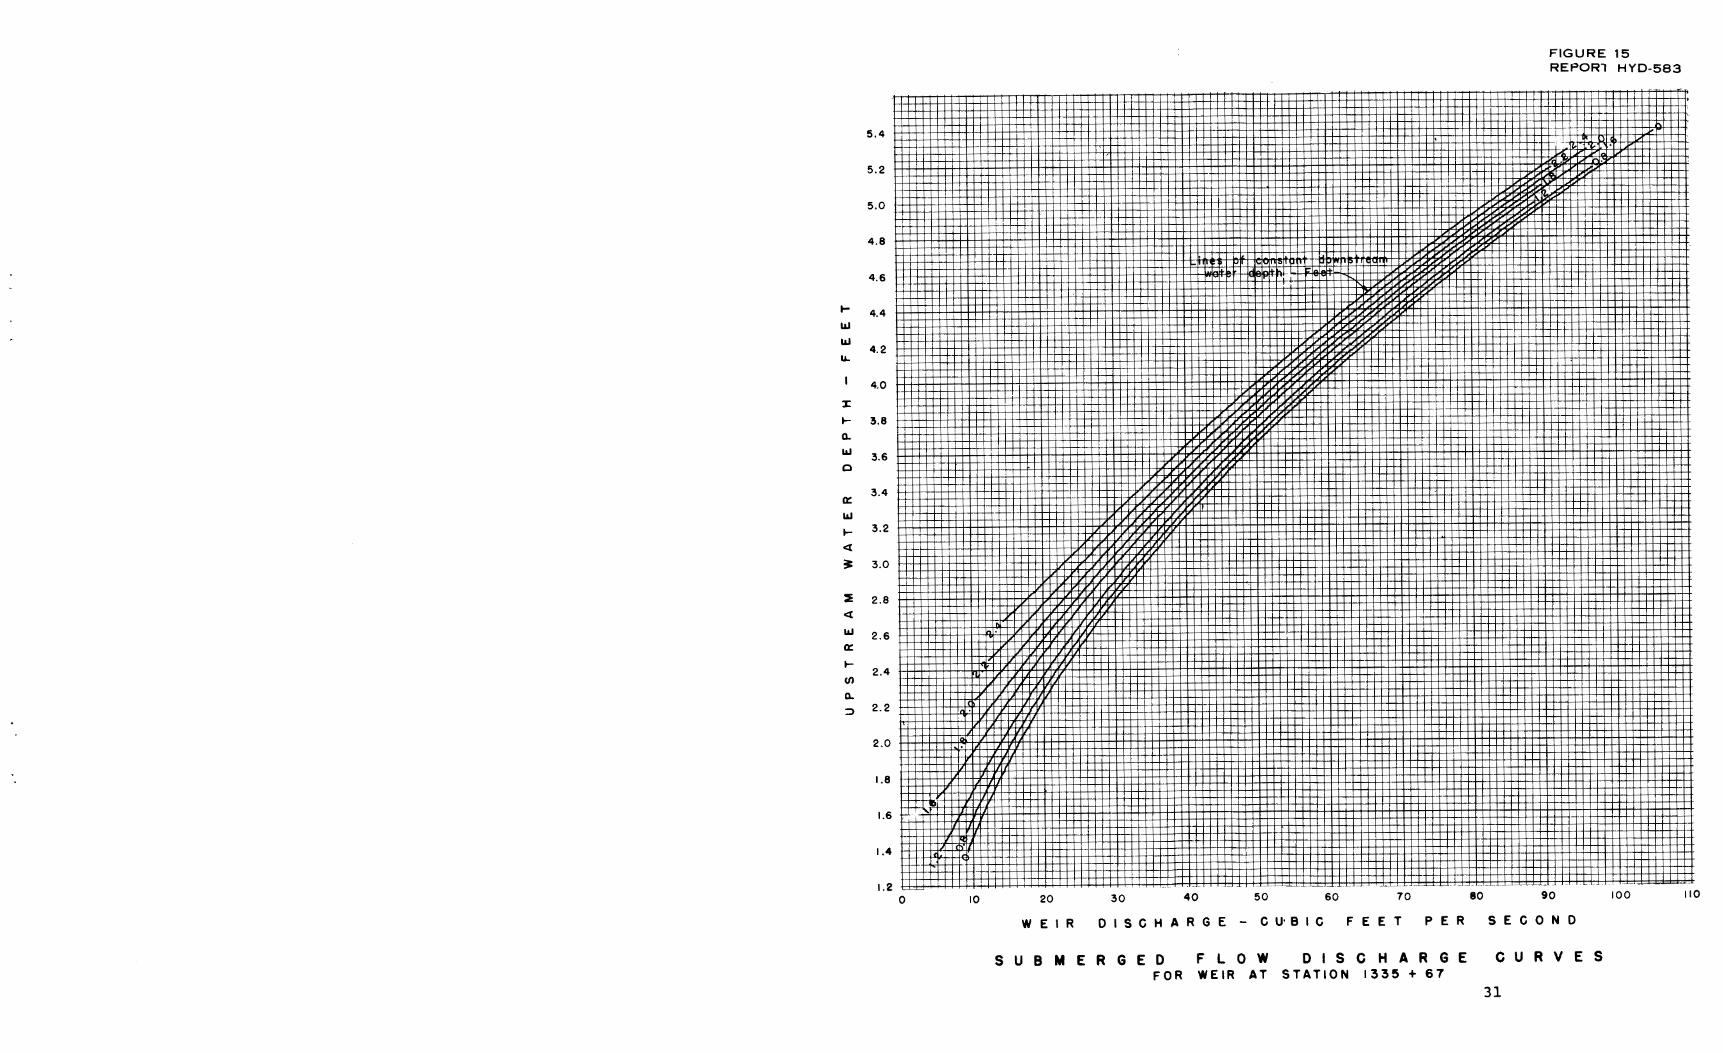
Figures 15, 16, and 17 are graphs of the weir discharge for submerged flow conditions, Figure 15 - Station 1335+67, Figure 16 - Station 1430+08, and Figure 17 - Station 1459+90. The graph ordinate is the upstream water depth above the weir invert, the abscissa is the weir discharge, and lines representing constant downstream water depths are drawn on the graph.
An X-Y plotter which operates from punched cards was used to draw the curves of Figures 15, 16, and 17. Information in the form of approximately 1,000 data cards per graph was supplied to the plotter. A program was written for an electronic digital computer to compute and punch the information on the data cards. The discharge ratio -submergence ratio formula and free flow equation were used in making data card computations for the discharge graphs in Figures 15, 16, and 17.
To find the weir discharge both the upstream and downstream water depths above the weir invert must be known. For an example illustrating the use of the graph consider an upstream water depth of 2.12 feet (0.65 meter), a downstream water depth of 1.53 feet (0.47 meter), and use Figure 17. Find the 2.12-foot (0.65-meter) upstream depth value on the Upstream Depth scale at the left edge of the graph. Follow the 2.12-foot upstream depth line horizontally right to the appropriate line of downstream water depth. In this example one has to interpolate between the 1.5-and 1.6-foot constant downstream depth lines to find the 1.53-foot (0.47-meter) downstream water depth. At the point where the 1.53-foot (0.47-meter) downstream depth crosses the 2.12-foot (0.65-meter) horizontal upstream depth line follow the discharge line vertically downwards to the Weir Discharge scale at the bottom of the graph. The weir discharge is 49.8 cfs (1.41 ems).
A program was written for an electronic digital computer to calculate and print the weir discharges for the range of upstream and downstream water depths. The discharge ratio - submergence ratio formula and free flow equation we~e used in making the weir discharge calculations. Weir discharge tables are in Appendixes: Station 1335+67 -Appendix D, Station 1430+08 - Appendix E, and Station
9
Sam Peng
Sticky Note
None set by Sam Peng
Sam Peng
Sticky Note
MigrationNone set by Sam Peng
Sam Peng
Sticky Note
Unmarked set by Sam Peng

1459+90 - Appendix F. The vertical column at the left edge of each table is the upstream water depths, Du. The top horizontal row of the table is the downstream water depths, Dd, and the columns of numbers below the downstream water depths are the weir discharges for the given upstream and downstream water depths.
An example is given for using the weir discharge tables. Use the table in Appendix F, upstream water depth (Du) of 2.32' feet (0.71 meter), and downstream water depth (Dd) of 1.9 feet (0.58 meter). Select the page of the table that has the range of upstream and downstream water depths that include Du= 2.32 feet and Dd = 1.9 feet. In the column marked Du find the 2.32 water depth. The row of numbers horizontally to the right of 2.32 are weir discharges for Du= 2.32 feet and for the downstream water depths listed at the top of the table. For Dd = 1.9 feet (0.58 meter) the weir discharge is 52.0 cfs (1.47 ems).
10
Sam Peng
Sticky Note
None set by Sam Peng
Sam Peng
Sticky Note
MigrationNone set by Sam Peng
Sam Peng
Sticky Note
Unmarked set by Sam Peng

.... ....
WEIR AT STATION
1335+67
1430 + 08
1459+ 90
T A B L E
WEIR AND CANAL DIMENSIONS
T
CANAL BOTTOM WEIR BOTTOM WEIR DEPTH WEIR SIDE CANAL DESIGN WIDTH FEET WIDTH FEET FE·ET SLOPES DISCHARGE
( b) (W) (d) (S) C fs
15 1.417 5.58 0.292 90
8 2.167 3.33 0.771 50
7 3.146 3.08 1.333 50
Sam Peng
Sticky Note
None set by Sam Peng
Sam Peng
Sticky Note
MigrationNone set by Sam Peng
Sam Peng
Sticky Note
Unmarked set by Sam Peng

.... w
,.H., 1('
SHERMAN DAM AND RESERVOIR
[:]Ashton
I ,,--...__ I
I NEBRASKA \
, •Scottsbluff )Sherman Dam\
L.7 •North Plat~ •St. Paul Omaha•\ •Grand
Island * \
LINGO~~ I
L_~McCook
TRACTIVE FORCE TEST REACHES
Paul
FARWELL LOWER MAIN CANAL
---FARWELL UPPER SOUTH CANAL
LOCATION MAP
:I -< C en a, (A)
Sam Peng
Sticky Note
None set by Sam Peng
Sam Peng
Sticky Note
MigrationNone set by Sam Peng
Sam Peng
Sticky Note
Unmarked set by Sam Peng

Figure 2
Station 1335+67 Photo P707-729-2748
Station 1430+08 Photo P707-729-2724
Station 1459+90 Photo P707-729-2704 Timber Control Checks - Upstream Views
14

...
I anchor ~B
r"' G ,-- --Jt'Clcar
r.=:;:-:::;±=::;:=l:!::::r----,· --r
' I ' /
' ' ., ~ I
'I'
--r-t" H,sh ,h,ngfh,7 LA1ir,, / galv. sfu I sfrn11d.
I
FIGURE 3 REPORT HYD-583
I
8"x s·, //';i" r;;.Jv. sf,,,,_/ I p/af-a. dr,llad F,r /
'-·:::.~.-8,z;nd sh:al slr,nd fhr,u9h a!J• c,nd :::<1:c<1rt w1f/, t· ½ • gal'I. wir-11 ""P" cl,pj 11,5 sh&A!n,
A
I I '·Concr,z; re an, hp r block
' ' <\J,
' ' ' I
' ' '-------+-------,, - i.L
------3'·6" i._ G
SECT/ON F·F
DE.TAILS
I I ! .....
OP
/'bolt.· •
SECTION G-~
d: I ~3"":4 : ~ : __ J. _ _l~.1. "'
%";,,6"(ialr. f.'· ~-'t,--*tnachtn, b.it / '. -_ -,· ~-!N,f;, h,x /1<1!,-- ,/ '. '
Cuf w,ul,ur~,---::. - • 1
_. 'I"
SE CTI ON A-A l...JI .J.o.....J......L.-J-l--ls-L_,_LJ_.....J,o':--'--'--+-+-'15 SCALE OF FEET
SECTION H-H
I
Cflno.l birnl,,-i- - '"-f-~-c:::::::-.:;::=~,:;;:::·~.i_ ,.,_ -;..Jl,-:-j\)J-,,,.-,... -1_}-1--________ --=_ =..., ~//i/;l-__ --__f-\"'----1
SECTION
I I
~ W¢,r bfad~.su defails
-r4· ' \I \I
Cll ,Cf\ '0 ~
SECTION C-C
Drill /"d,a.lto/,z; f -fhrou9h bv/H,.,J s' a,nJ pku,k..--, ;
11.lt'Ga.!r furnbuc~le, \ ' hook a,nd e fl···· '
/ -,,, ... -- - - -_: IMMW%1==-
J' ~ 12.· ($,,.ly. h,,..,, fuc JJ;; haalc, and tZ t,/C-,· ·-'
-•2xs• Supporf colvmn.
DETAILS OF WEJR BLADE
I. ill, ,,,9
' ., -,--T, I • I
I ·°' :/--- --B·J\s·xf· Galf. .sf,,,.,/ pl•f~ \": 1, dnilflri fr)Y I' bolfs. '/ ' E , ,
~/ '\;;.---!" Oia.. drop f,r-gad ga/11. , f ,f'; "'fl" Polls, !B ton:1 w,H. ' , i I s711ora nufs.
-1
I
I ,I ~ 9' _ - 4'x12: Pla.nk
I _______ L
SCALE OF FE.ET
SECTION £'-E
SECTION D·D
NOTES
All hmbu to /u. f-re11hr.d. Concnde deSt:Jn bas"d on a compr.,s.nvrz sfr"n!lf-h
of 9000 lbs. per S1. tn.
UNI TEO STATl!S DEPARTMENT OF THE INTER;DR
l!JUREAU OF' RECLIU,4ATION
MISSOURI RIVER BASIN PROJECT Ml 00/.E ~aup DIV/SION·F"ARWf.~L UNIT• Nt.BRAS KA
FARWELL MAIN CANAL ST'ATION /./335+67
TIMBER CONTROL CHECK DRAWN.~ ~.If!.~~---. _ ..... SUBMITTED . .Ji-TRACED_,;;. ___ _ _ .••. -.RECOMMENDED •••
cH•cut,/?J!..-:: . .
15

I
I I
)o / ~ti,. J430+oo--
B
,-Top of bank
3"~12 P/dnk---
':r,11wsc~,soJ
A
, • ;:,SJJrnmrztriul about t I! ""'Tarw-f -'fr~V/'--"'l'p=,a.~/---~-
J I
PLA~ - STA+ON 1430+00 !..c ----- 10.0 -----~
I I
~ - - -Ramp dowl7 1-o normal bank. ,,' f\&j(/hf Cl.S d1r!1.cf1Zd,
' of ba.nk
FLOW> ~ymma/-ncal abou~l--,---c, _____ _ [ Fqrwe/1 Ma,n CanaJ - -
E
~ ' I
PLAN -STATION 1460+00
.--Po.I-
j I 1' I
I I ' ~1 I
- -- 10.0· ------s-i 3·112· Plank-, r:, ,1 .L /
Top of bank-. ,..i.'xs" SvpPorf co/un,n .,--n.amp oo11n TlJ norna
D
t
{,11111,,,,1?
4L ) I ~ I
---::::-~'---:::~~~'
-------------=--~---r--1n11, :=Bl;;i~q---4-....tC,._ .. ___ b=
4
=n~K.:_h~r.:l:'!J~ll~ftas~id~,r~1t:;c~h=d,~-______ sc ALE. 0 F FEE. T 1,i.,· 8 lo,k,nq - -To oF bank.
~..;:_;:N,tgff_.50)/t. -<:;,-Oriqina.l 9roun.l surfic• te--N.W.S. (Q,50) ~
~ T ~~~.-·--S=.000338
SECTION A-A __ r;, 6 X 6 Pos ,._ ___________ ----2~ -O ----- --- - - - -- - - - _,,_ • • I , , .. r- 1'- Ca.n,:i/ 8'-o' Lon ---- _,J t I} • , • .,
;J --}-<-:J- (t.2X8 5uppcrfcolumnJ ,·W,r.,rbiddc IZ~ ;r~ --'·------ , SuO,l..;IA. : -~ ----7c6" ::_~ I • / I I
~- :------1-B~ --r>i 1
AD.tlt--f--777'ws--\
' I I
Can«/ bani:,_)- - -
[),wnsfr11.a.m Ct:Ma.l bank------
I
;.,c_ - ---- -1(0" -----,4
S E:CTION B-8
l • -~ ~
i I
U /9/3.(X)--'
'f SCALE OF FEET
-s: 000!138
SECTION D-D
I I
I :
~--- ----- ,r-s·-- ---- ---~ ' I
SECTl ON E-E
' -- -Downsfruun Cana/ b,.,,,
FIGURE 4 REPORT HYD-583
tfa'
! t Ca,,~1J. I ,' ,, . I
,, ~
DETAIL A
·-- 3"K 12· Walk plud.
NOTE.
All t,mb•r to b11. treated.
UNITED STATES DEPARTMENT DF THE tNTERIDR
BUREAU OF RECLAMATION
MISSOURI RI VER BASIN PROJECT
I
' /
MIDDLE LOllP DI V/St0N-FARW£LL UN/T-N£8RASK,A,
FARWELL MAIN CANAL STATION! /430, 08 ANO STATION ( 1459 + 90 i
TIMBER CONTROL CHECKS
DRAWN _ _ \.Y_I,. P.
TRACED
CHECKED/_):_'/f._-:: _
17

If sladard sfru,!J !I.. galv. sha l ptp a.--·
C
cl
- - - --55 Ga l. staa I dram. ~-::---, asp4,II cool, J.
,'. Gttlv. -ho . lock r,ul onl robb,r or kif- W4s lru, aa<i, s;da. , TO f,rfl/ wa.lar r,ghl Connadioo.
DETAIL A
CANAL STA / 335"t8!f
l 429 f 85 1459+85
H«x . lad, nu + - - - +
l?ubb,r o r f.i/ w,,_.J,., -- - •
I/' 0/L ~ ~~~ I-_~---, --p,~ !
PLAN --- -----d ~oa;:i:.:,l':r · - ---------- b'f of~us.-; ---- --- ------ ,,,.
~ ----- -T6·x 6" llo.6 CJJ-W< fc1t-d w,.-:'l+
1\ f• bric , ,n canl,r of .sla.b. :, I :, I ' I
\ "'I Hoot>_, / : , ., / --1--EI. A
f It Q;.. , p, Pt.J - - -
. . .
7 l -- -i-~-- ---55GaJ. drum wit/, 1,,p remov«J1 , · \ .... ~ Co<>hd and lined w,fh a,pJ,/1, )_ t-- · .i:.i NOTE: S 1-rinfurc a.I ·
st ... J935t85 ra1111r,z, s 2 drums wa/dcq k3er~u aad 1n +crmad,aft. drum hud, rarnou.d.
SECTION A-A
SCALE. OF FEET
SECTION C- C
I I J I I r f l y I
SCALE. OF JNCHE.5 'f
: I I
i) • I ~ t I ---t~~==~=~ .....t- _j_
SECTION B-8
J
B El. A d L I L, 19 -3 .. 1953.23 4 '-IIJ " 11'-o·· I 9'· 6" !2 '- 3 " 1922. 94 2-81;. ' 7 ! 6 • I 6·-o·· 11-0· - 19 15.61 2 '- IJ" 6 '- 9 " I 5 _<-3•
NOTE.
Con ,r ~I-L das19 n ba.s"d on a Comff-.SS/v<, s/-ra.nyH, o f 3000 /J,J per •j, /'I ,
UNfTEO STATES DEPAffTMENT OF THE INTEff l Olt ::tJ .,,
Mlsst~R~A~1~;E~~~7:/'t;oc.1ccr ITI G) MIDDL.£ LO<JP D IVISION- FIIRWE-l-~ <JNIT-N£BRA.S K A '1J
FARW£ i_L MAJN_cp,NAL !o C STATIONS 1.335 ,!52• l'129W1.3 , AHO l</59 "'75' 1
~ ::OJTI TIMBER CONTROL CHEC K S -,
MEASURING WELLS :I: (11
MAWN--"!·!-J! ••. ___________ SU8/IIITTEO-jt._]~~- --- --- ---- -<
TlfACEO.... --··------- - -- - --- -RECOMMENOE0 •• . 3.7~---- ---- ---- CJ CHECKcoLl'..?I...~. __ . APPROV _ _ __ __ Q. £ __ ·--~-_____ --~--·. CJ1
• C: t&tr O~S1<.1hl\lG E.N tll!!f! l'T
OE.Nl/11..R, COL.DltADO AWVJT ~ / 961 707-D -4 B 3 ex, _ _ __________________________________________ __. ___________ .._ ______ _.(I)
Sam Peng
Sticky Note
None set by Sam Peng
Sam Peng
Sticky Note
MigrationNone set by Sam Peng
Sam Peng
Sticky Note
Unmarked set by Sam Peng
I\J 0
1~~3·~~1 ~7.5'~
SECTION A-A
r OUTLET BOX IO ,...:
l Weir bulkheads attached
at upstream section
A -<7
I
-
I
-<J
Left photograph - looking upstream at the outlet box, weir bulkhead, trapezoidal channel, and the inlet box . H-1553-1 NA Right photograph - looking into the inlet box at the transition on the upstream end of the trapezoidal channel. The rock baffle is shown in the lower right corner of the photograph . H-1553-4 NA
INLET BOX
,-s " -Inlet ' } "
TRAPEZOIDAL --<~
pipes-----.:;: - - -CHANNEL
}, Rock baffle 4"thick- ,_,
A -,·----14,5'-------------- 20 '
!I 7.5' ,
I I
I I I
Hinged Gate tor -1 controlling tail-water elevation
'--------------...J
11 I I I I I I I I
T
THE HYDRA U LIC MO D E L
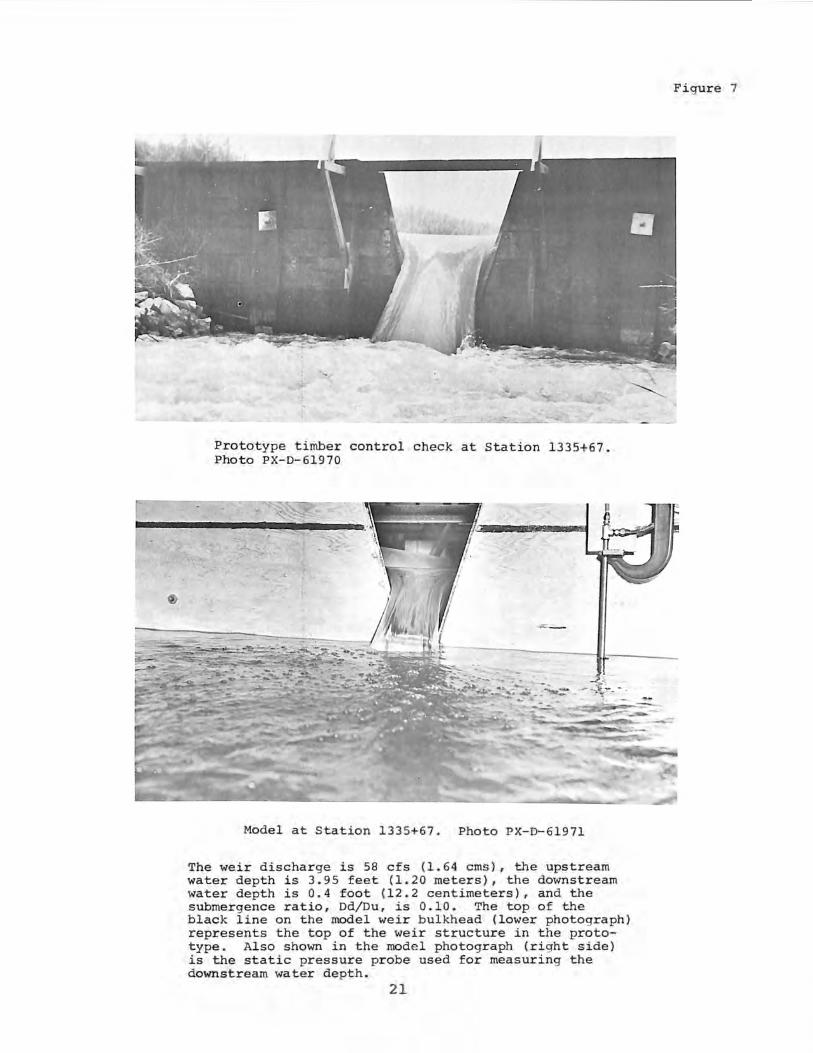
Prototype timber control check at Station 1335+67. Photo PX-D-61970
Model at Station 1335+67. Photo PX-D-61971
The weir discharge is 58 cfs (1.64 ems), the upstream water depth is 3.95 feet (1.20 meters), the downstream water depth is 0.4 foot (12.2 centimeters), and the submergence ratio, Dd/Du, is 0.10. The top of the black line on the model weir bulkhead (lower photograph) represents the top of the weir structure in the prototype. Also shown in the model photograph (right side) is the static pressure probe used for measuring the downstream water depth.
21
Figure 7

Figure 8
Prototype timber control check at Station 1430+08. Note the temporary water stage recorder and stilling well for recording the downstream water surface elevation. Photo PX-D-61972
Model at Station 1430+08. Photo PX-D-61973
The weir discharge is 25 c fs (0.71 ems ), upstream water depth is 1.86 feet (0.57 meter), downstream water depth is 1.05 feet (0.32 meter), and the submergence ratio, Dd/Du, is 0.56.
22

Prototype timber control check at Station 1459+90. Photo PX-D-61974
Model at Station 1459+90. Photo PX-D-61975
The weir discharge is 25 cfs (0.71 ems), upstream water depth is 1.35 feet (0.41 meter), downstream water depth is 0.45 foot (0.14 meter), and the submergence ratio , Dd/Du , is 0.33.
23
Figure 9

Figure 10
Prototype timber control check at Station 1459+90. Photo P707-729-2708
-Model at Station 1459+90. Photo PX-D-61976
Topography was installed in the model outlet box downstream from the weir. The mortar area is the 10-foot (3.04-meter) length of riprap placed downstream from the prototype weir. The 14-foot (4.27-meter) additional length of the downstream canal is built of plywood. The horizontal black line drawn on the upper part of the model weir bulkhead represents the top of the prototype weir.
24
-

4,0
3.8
3.6
3.4
3.2
3.0
2.8
2.6
2.4
2.2
2.0
1.8
1.6
1.4
1.2
1.0
0.8
0.6
0.4
0.2
10 20 30 40 50 60 70 80 90 100 11 0 120 130
25
FIGURE 11 REPORT HYD-583
140
6.4
6.2
6.0
5.8
5.6
5.4
5.2
5.0
4.8
4.6
4.4
4.2
4.0 150

·-I
1.0
0 .9
0 .8
ol0 0.7
0
I-<(
0.6
a:
u.l
(!) 0 . 5
a: <(
:I:
<.) 0 .4
(/l
0
>, 0.3
0 . 2
0 . 1
0 0
'
2
0 .1 0 .2 0 .3 0 .4 0.5
x • SUBMERGENGE
I
-I
.
0 .6
R AT I 0
0 .7
Dd o;
FIGURE 12 REPORT HYD-583
I
0.8 0 .9
DISCHARGE R A TI 0 SU B · M ERG ENCE R A T I 0
FOR WEIR AT STATION 1335 + 67
27
'
I
1.0
Sam Peng
Sticky Note
None set by Sam Peng
Sam Peng
Sticky Note
MigrationNone set by Sam Peng
Sam Peng
Sticky Note
Unmarked set by Sam Peng

O•lo 0
I
<[
Ir
w (!)
Ir
<[
::c 0
<f)
a
FIGURE 13 REPORT HYD-583
1.0
0 .9
0.8
0 .7
-H-
I
ir I± h-,r-
1-r-+ µ_
0 .6
+-t:· J=t:;::t ;:.~ I-+--•--~ 7
1--H-++++-t-+-t-+-t-++-H-t-+-t-·t-l-t-++++-t-+-+-+-t-T+-t-t-t-+-t-t-t--t~++-t-t--t-++·t-;-t-t-+-t-t--H-'t-t-t+·+-t~ -:..n--1...::;--++++-t-+-+-+-t-'\..-Hlrr-+-+-t-+-t-i-t+-+-t-+-t-i
0.5 I-
0.4
0 .3
0 . 2 H-+--t+++H-++ +t-HH-+++H -t-H-t+-t--!-H-H ·t-Ht.,°1:,r_,,_c:;._-~°1:,r_,,_c:;._t.,t,1::,.rt,
0 . 1
0 ~ ++-H-t-++t-HH-t-++t-HH-+++-t-H-++++-t-H-++++-H-+++t-Hc++++t+t-++++-t+t++++-t+t++t-Hc++++H-t-++++-t+t-++++-H-+++t-HH-+ti 0 0 .1 0 .2 0 .3 0 .4 0.5 0 .6 0 .7 0 .8 0 .9 1.0
x = SUBMERGENCE R AT I 0
DISCHARGE R A TI 0 S U B M E R G E N C E R A T I 0 FOR WEIR AT STATION 1430 + OB
28
Sam Peng
Sticky Note
None set by Sam Peng
Sam Peng
Sticky Note
MigrationNone set by Sam Peng
Sam Peng
Sticky Note
Unmarked set by Sam Peng

o1o 0
I-<(
a:
w (!)
a: <(
:I:
(.)
U)
0
II
>,
1.0
0 .9
0 .8
0 .7
0 .6
0.5
0.4
0.3
0.2
0 . 1
0 1 0 0 .1 0. 2 0 .3 0 .4 0 . 5
x = SUBMERGENCE
0 . 6 0.7
RAT I 0
FJGURE 14 REPORT HYD-583
~~
0 .8 0.9
DISCHARGE R A T I 0 SUBMERGENCE R A T I 0 FOR WEIR AT STATION 1459 + 90
29
1.0
Sam Peng
Sticky Note
None set by Sam Peng
Sam Peng
Sticky Note
MigrationNone set by Sam Peng
Sam Peng
Sticky Note
Unmarked set by Sam Peng
5.4
5.2
5,0
4.8
4.6
... 4.4 w w
4.2 "'-
4.0
:c I- 3.8 Q.
LtJ 3.6 0
a: 3.4
LtJ
I- 3.2
<t
31: 3.0
::I 2.8 <t
LtJ 2.6 a: I-
2.4 (/)
Q.
::::, 2.2
2.0
1.8
1.6
1.4
1.2 0 10 30 40 50 60 70 80 90
FIGURE 15 REPORl H Y0-583
100 110 20
WE IR DISCHARGE - CU·BIC FEET PER SECOND
SUBMERGED FLOW DISCHARGE FOR WEIR AT STATION 1335 + 67
C U R V E S
31

3.0
2.9
2.8
2.7
2.6
2.5
2.4 I-
I.I.I 2.3 I.I.I
I.I. 2.2
::c 2.1
I-
CL 2.0 I.I.I
0 1.9
a: LI.I
1.8
I-c:t I. 7
;a: 1.6
~
4 1.5 w a: 1.4 I-
(/1 1.3
CL
:::, 1.2
I.I ·
1.0
0.9
0.8
0.7
0.6 0 5 10 15 20 25
WE IR DISCHARGE
30
CUBIC
35
FE E T
40
P E R
SUBMERGED F L O W DISCHARGE
FOR WEIR AT STATION 1430+08
45
SECOND
FIGURE 16 REPORT HYD-583
50 55 60
CURVES
33

2.6
2.5
2.4
2.3
2.2
I- 2.1 LI.I
LI.I 2.0 u..
1.9
::c I- 1.8 a.. LI.I I. 7 0
1.6 a:: LI.I
I- 1.5
cs: ,: 1.4
2: 1.3
cs: LI.I 1.2 a:: I-
I. I (/)
a.. ::::> 1.0
0.9
0.8
0.7
0.6
0.5 0 5 10 15 20 25
WE IR D $CHARGE
30
CU BI C
35
FE E T
40
P E R
SUBMERGED F L O W DISCHARGE FOR WEIR AT STATION 1459 + 90
45
SECOND
50
CURVES
35
FIGURE 17 REPORT HY0-583
55 60

APPENDIX A
Method of Least Squares to Determine Coefficients in the Weir Free Flow Discharge Equation
Measurements were made of the weir discharge (Q) and the upstream water depth (D). The data points (discharge versus water depth) were plotted on the graph in Figure 11. The method of least squares was used to determine values of the coefficients a, b, and c for the second degree polynomial equation
Q =a+ bD + cD2 •
By using the least squares method an equation was obtained which "fits" the data points. Some of the data measurement errors are reduced, or "averaged out."
First consider the data points shown on Figure a, Appendix c. There are n number of data points (01 ,D1), (02 ,D2), ••• , (On,Dn). The solid black points are the actual measured values of O and D. The curved line represents the desired equation
O =a+ bD + cD2 •
For point number 1 the value D1 is substituted into the
above equation and the value Oi is obtained. The value Oi is on the desired curve. The residual of point number
1 is defined as the difference between the value Oi and the actual measured value o1 , which is the vertical distance, from the plotted point to the curve. For any point (Qi,Di) the residual (ri) is
2 r. = (Q. - Q!) = (Q. - a - bD. - cD.). 1 1 1 1 1 1
The method of least squares determines values for the coefficients a, b, and c so that the sum of the squares of the residuals is a minimum, for all the data points from i = 1 to i = n
37
Sam Peng
Sticky Note
None set by Sam Peng
Sam Peng
Sticky Note
MigrationNone set by Sam Peng
Sam Peng
Sticky Note
Unmarked set by Sam Peng

n n
Icri) 2 = I (Q. - Q!) 2 = minimum value. i i i=l i=l
Let the function G be defined as
n
G=\ (Q. -Q~)2. L i i i=l
The values o1 , o1, and Di are known values; therefore, the variables of the function Gare the coefficients a, b, and c. If the function is denoted by G(a, b, c), then
n n [ ]2 G(a,b,c) = \ (Qi. - Qi!) 2 = \ Q - a - bD - cD2 • L L i i i i=l i=l
To obtain the minimum value of the function G(a, b, c), partial derivatives are taken of G(a, b, c), and the derivatives set equal to zero. The derivatives are
oG oa = E [2(Qi - a - bD. i 2 = o, - cD.) (-1)) i
oG - [ bDi 2 o, db - E 2(Qi - a - - cD.) (-D.)] = i i
oG 2 2 dC = E [2 (Q. - a - bD. - CD.) (-D. )) = o, i i i i where i = 1 and n having been dropped from the summation sign (E) for convenience. The following three equations are obtained by dividing by 2, multiplying and rearranging terms, and placing the summation sign in each term within the square brackets.
2 an + bl: Di + cl: Di = E Qi
2 3 a E Di. + b E D . + c E D . = i i
al: D~ + b ED~ + c E D~ = i i i
38
Sam Peng
Sticky Note
None set by Sam Peng
Sam Peng
Sticky Note
MigrationNone set by Sam Peng
Sam Peng
Sticky Note
Unmarked set by Sam Peng

The system of three simultaneous linear equations (in the coefficients) are solved to find the values of a, b, and c.
A computer program was written and an electronic digital computer used to solve for the values a, b, and c for each of the three weirs. The three free flow discharge equations are shown in Figure 11.
39
Sam Peng
Sticky Note
None set by Sam Peng
Sam Peng
Sticky Note
MigrationNone set by Sam Peng
Sam Peng
Sticky Note
Unmarked set by Sam Peng

APPENDIX B
Method of Leas1t Squares to Determine eoeff icients in the Discharge Ratio - Submergence Ratio Equation
Data points of the discharge ratio (y) versus the submergence ratio (x) were plotted on graphs in Figures 12, 13, and 14. By inspection a conic equation of an ellipse was found to define the curve formed by the plotted data points. Approximate values for the coefficients A, B, e, D, and E of the conic equation were determined, but the resulting equation when plotted did not pass through the entire group of plotted data points. Therefore, the least squares method with the aid of Newton's approximation method was used to find values of the coefficients A, B, e, D, and E, in the conic equation
Ax2 + Bxy + y2 +ex+ Dy+ E = o, or the discharge ratio - submergence ratio formula
-(Bx+ D) + J(Bx + D) 2 - 4(Ax2 +ex+ E) y =
for O < x < 0.98.
Let the function G(A,B,e,D,E) be defined as
n 2 n y!) 2 G(A,B,e,D,E) = I (r.) = I (y. -
1 1 1
i=l i=l
G(A,B,e,D,E) =
[ -(Bxi J..,(Bx. + D) 2 -n
{ Yi
+ D) + 4(Ax~ + ex. I 1 1
i=l
For convenience of notation let
+ E) ]}2
(ST) -(Bxi + D) + J(Bxi + D) 2 - 4(Axi + Cxi
2
41
Sam Peng
Sticky Note
None set by Sam Peng
Sam Peng
Sticky Note
MigrationNone set by Sam Peng
Sam Peng
Sticky Note
Unmarked set by Sam Peng

(RAD) = [(Bx. + D) 2 - 4 (Ax~ + ex. + E)] , i i i and drop i = 1 and n from the summation sign (I:).
In applying the least squares method to obtain the minimum value of the function G(A,B,C,D,E), partial derivatives are taken of G"(A,B,C,D,E). The derivatives are then set equal to zero to form the system of five equations, which are solved simultaneously to find the values of A,B,C,D, and E. The five equations are
(1) ft= I: 2(ST) (RAD)-112 2 (xi) = o,
(2) I = E (ST) [ 1 - (Bxi + D) (RAD)-l/2] (xi) = o,
( 3) oG E 2(ST) (RAD)-l/2 (x.) = O, oc = i
(4) oG E (ST) [1 - (Bx. + D) (RAD) -l/2 ] o, oD = = i
(5) oG E 2(ST) (RAD)-l/2 o. oE = =
The system of five simultaneous equations are not linear for the coefficients A, B, c, D, and E. Therefore, Newton's method of approximations was used to help solve for the values of A, B, c, D, and E, that satisfied the system of the five equations.
Figure b, Appendix C gives a description of Newton's approximation method. The purpose is to find the root value xr (with desired accuracy) for the equation f(x) = O. An approximate root value (x1) is substituted in the equation
42
-f(x1 )
f' (x ) ' 1
Sam Peng
Sticky Note
None set by Sam Peng
Sam Peng
Sticky Note
MigrationNone set by Sam Peng
Sam Peng
Sticky Note
Unmarked set by Sam Peng
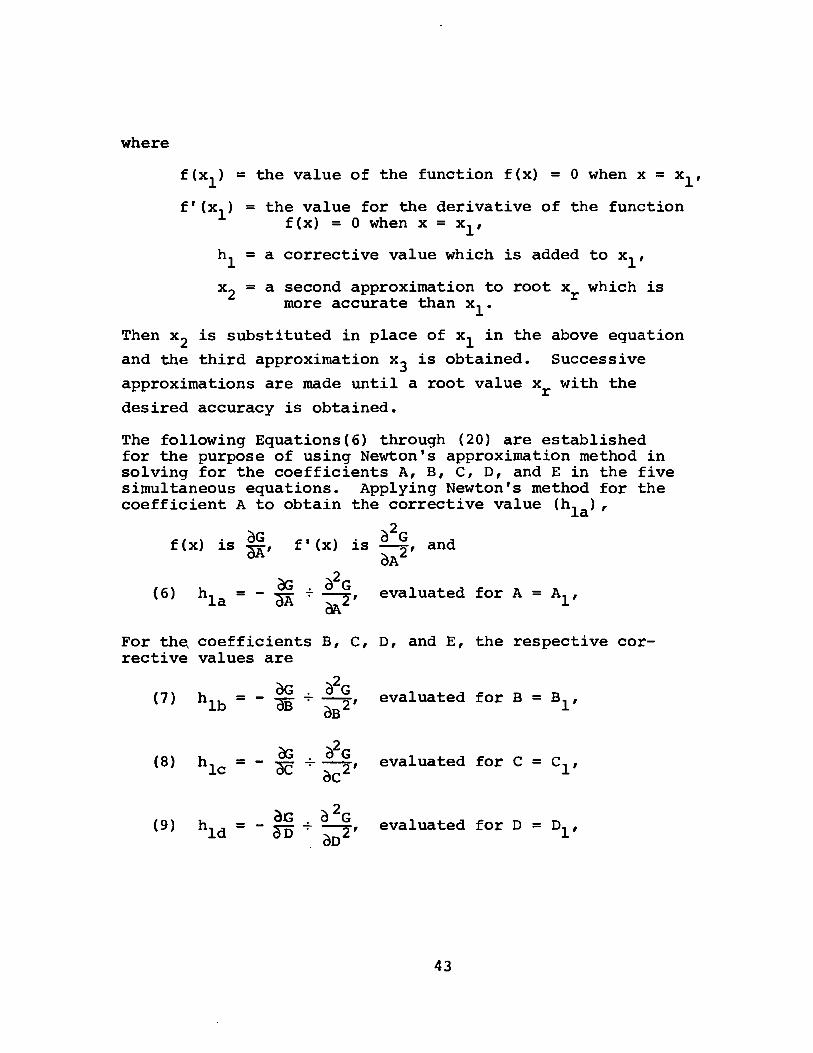
where
f(x1) = the value of the function f(x) = 0 when x = x1 ,
f'(x1) = the value for the derivative of the function f(x) = O when x = x1 ,
h1 = a corrective value which is added to x1 ,
x2 = a second approximation to root xr which is more accurate than x1 •
Then x2 is substituted in place of x1 in the above equation and the third approximation x 3 is obtained. Successive
approximations are made until a root value xr with the desired accuracy is obtained.
The following Equations(6) through (20) are established for the purpose of using Newton's approximation method in solving for the coefficients A, B, c, D, and E in the five simultaneous equations. Applying Newton's method for the coefficient A to obtain the corrective value (h1a),
f (x) is f, c?G f'(x) is ---"i'' and oA (6) ~ . o2G
hla = - ~A - -Ofl • ol\2' evaluated for A= A1 ,
For th~ coefficients B, C, D, and E, the respective corrective values are
oG . o2G hlb = - oB ~ --2 , evaluated for B = B1 , oB (7)
(8) hlc ~ o2G = -oe" ..!..-,
· oc2 evaluated for C = c1 ,
(9) hld ac o 2G = - oD + ::::-i",
. oD evaluated for D = o1 ,
43
Sam Peng
Sticky Note
None set by Sam Peng
Sam Peng
Sticky Note
MigrationNone set by Sam Peng
Sam Peng
Sticky Note
Unmarked set by Sam Peng

(10) evaluated for E = E1 •
The second partial derivatives are taken of the function G(A,B,C,D,E) and are used for obtaining the corrective values (h) for each coefficient
(11)
(12)
(13)' c?G oc2 = I (2xi) 2 [ (2ST) (RAD)-3/ 2 + (RAD)-l]
(14) ~2G - I tST) [caxi + D) 2 (RAD)- 3/ 2 _ (RAD)-1/2 ] 002 -
+ ( ½) [1 - (BXi + D) (RAD) -l/2 ] 2}
2 [ (ST) (RAD)-3/ 2 + (RAD)-l] (15) ~~ = l (2)
The second approximation of the coefficients A1 , B1 , c1 , o1 , and E1 are
44
Sam Peng
Sticky Note
None set by Sam Peng
Sam Peng
Sticky Note
MigrationNone set by Sam Peng
Sam Peng
Sticky Note
Unmarked set by Sam Peng
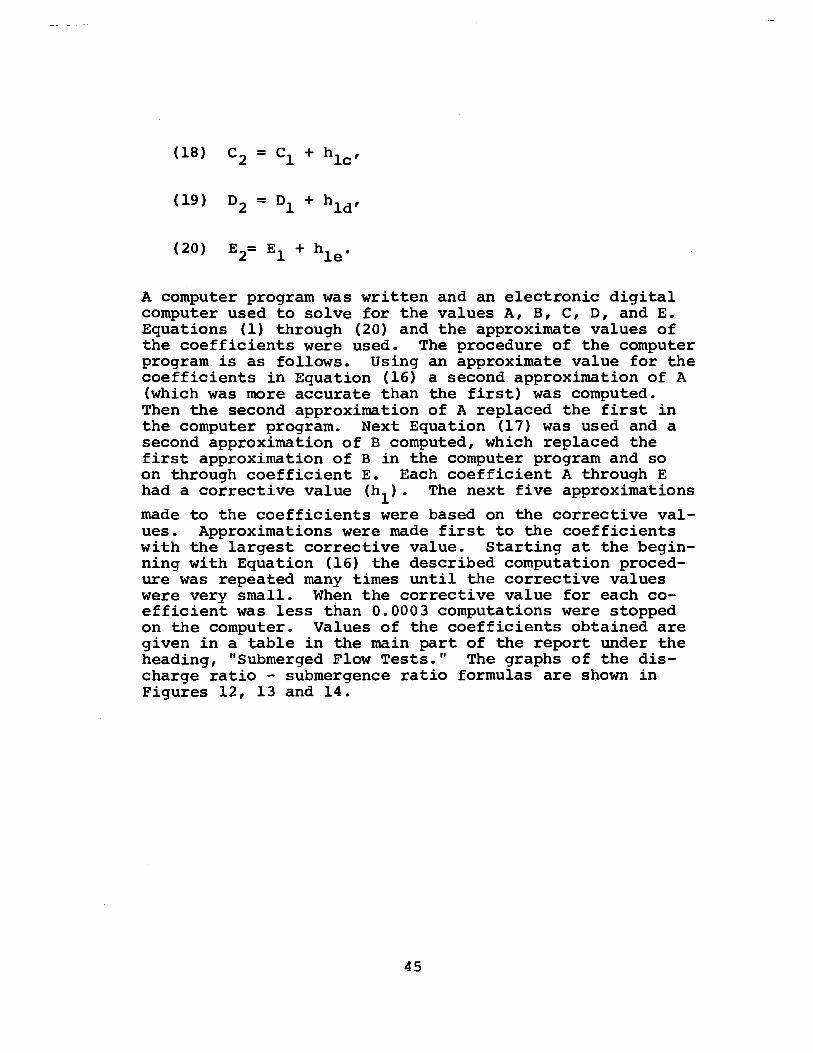
A computer program was written and an electronic digital computer used to solve for the values A, B, c, D, and E. Equations (1) through (20) and the approximate values of the coefficients were used. The procedure of the computer program is as follows. Using an approximate value for the coefficients in Equation (16) a second approximation of A (which was more accurate than the first) was computed. Then the second approximation of A replaced the first in the computer program. Next Equation (17) was used and a second approximation of B computed, which replaced the first approximation of Bin the computer program and so on through coefficient E. Each coefficient A through E had a corrective value (h1). The next five approxima·tions made to the coefficients were based on the corrective values. Approximations were made first to the coefficients with the largest corrective value. Starting at the beginning with Equation (16) the described computation procedure was repeated many times until the corrective values were very small. Wh~n the corrective value for each coefficient was less than 0.0003 computations were stopped on the computer. Values of the coefficients obtained are given in a table in the main part of the report under the heading, "Submerged Flow Tests." The graphs of the discharge ratio - submergence ratio formulas are sbown in Figures 12, 13 and 14.
45
Sam Peng
Sticky Note
None set by Sam Peng
Sam Peng
Sticky Note
MigrationNone set by Sam Peng
Sam Peng
Sticky Note
Unmarked set by Sam Peng

APPENDIX C
0 ~---------------------~o
y
A
FIGURE A
Residual of Data Points
[x 1, f (X1 )]--..
(Xr,O)
FIGURE B
Slope of the line is f 1(xi)
Newton's Method of Approximation
47
Sam Peng
Sticky Note
None set by Sam Peng
Sam Peng
Sticky Note
MigrationNone set by Sam Peng
Sam Peng
Sticky Note
Unmarked set by Sam Peng

APPENDIX D.
Discharge in cfs for weir at Station 1335+67
Upstream water depth (Du). 1.40 - 2.22 Feet
Downstream water depth (Dd) 0.0 - 2.4 Feet
v~. l.417~ i.
Dd - Downstream Water Dep-cn Du o.o .20 .40 • 6( • 8l 1.oc 1.20 1.40 1.60 1.80 2.00 2.20
1.40 9.5 9.4 9.2 8.8 8.2 7.2 5.6 o. o. o. o. o. 1.42 9.7 9.6 9.4 9.0 8.4 7.4 5.9 o. o. o. o. o. 1.44 9.9 9.8 9.6 9.2 8.6 7.7 6.2 o. o. o. o. o. 1.46 10.l 10.0 9.8 9.4 8.8 7.9 6.5 o. o. o. o. o. 1.48 10.3 10.2 o.o.o 9.6 9.0 8.2 6.7 o. o. o. o. o. 1.50 10.5 10.4 0.0.2 9.8 9.3 8.4 7.0 o. o. o. o. o. 1.52 10.7 10.6 tL0.4 10.1 9.5 8.6 7.3 o. o. o. o. o. 1.54 10.9 10.8 10.6 10.3 9.7 8.9 7.6 o. o. o. o. o. 1.56 11.1 11.1 i0.9 10.5 10.0 9.1 7.9 5.7 o. o. o. o. 1.58 11.4 11.3 0.1.1 10.7 10.2 9.4 8.1 6.1 o. o. o. o. 1.60 11.6 11.5 tLl.3 11.0 10.4 9.6 8.4 6.5 o. o. o. o. 1.62 11.8 11.7 0.1.5 11.2 10.7 9.9 8.7 6.8 o. o. o. o. 1.64 12.0 12.0 11.8 11.4 10.9 10.1 9.0 7.2 o. o. o. o.
· 1.66 12.3 12.2 12.0 11.7 11.2 10.4 9.2 7.5 o. o. o. o. 1.68 12.5 12.4 12.2 11.9 11.4 10.6 9.5 7.8 o. o. o. o. 1.70 12.8 12.7 12.5 12.2 11.6 10.9 9.8 8.2 o. o. o. o. 1.72 13.0 12.9 [1.2.7 12.4 11.9 11.2 10.1 8.5 o. o. o. o. 1.74 13.2 13.2 J.3.0 12.7 12.2 11.4 10.4 8.8 o. o. o. o. 1.76 13.5 13.4 13.2 12.9 12.4 11.7 10.6 9.1 o. o. o. o. 1. 78 13.7 13.7 13.5 13.2 12.7 12.0 10.9 9.4 7-.1 o. o. o. 1.80 14.0 13.9 13.7 13.4 12.9 12.2 11.2 9.7 7.5 o. o. o. 1.82 14.3 14.2 14.0 13.7 13.2 12.5 11.5 10.l 7.9 o. o. o. 1.84 14.5 14.4 14.3 13.9 13.5 12.8 11.8 10.4 8.2 o. o. o. 1.86 14.8 14.7 14.5 14.2 13.7 13.0 12.1 10.7 8.6 o. o. o. 1.88 15.0 15.0 14.8 14.5 14.0 13.3 12.4 11.0 9.0 o. o. o. 1.90 15.3 15.2 15.0 14.7 14.3 13.6 12.7 11.3 9.4 o. o. o. 1.92 15.6 15.5 15.3 15.0 14.5 13.9 12.9 11.6 9.7 o. o. o. 1.94 15.9 15.8 15.6 15.3 14.8 14.2 13.2 12.0 10.1 o. o. o. 1.96 16.l 16.0 15.9 15.6 15.1 14.4 13.5 12.3 10.5 o. o. o. 1.98 16.4 16.3 16.2 15.8 15.4 14.7 13.8 12.6 10.8 o. o. o. 2.00 16.7 16.6 16.4 16.1 15.7 15.0 14.1 12.9 11.2 o. o. o. 2.02 17.0 16.9 16.7 16.4 16.0 15.3 14.4 13.2 11.5 9.0 o. o. 2.04 17.3 17.2 17.0 16.7 16.3 15.6 14.7 13.6 11.9 9.4 o. o. 2.06 17.6 17.5 17.3 17.0 16.6 15.9 15.1 13.9 12.2 9.8 o. o. 2.08 17.8 17.8 17.6 17.3 16.8 16.2 15.4 14.2 12.6 10.3 o. o. 2.10 18.l 18.l 17.9 17.6 17.1 16.5 15.7 14.5 13.0 10.7 o. o. 2.12 18~4 18.4 18.2 17.9 17.5 16.8 16.0 14.9 13.3 11.1 o. o. 2.14 18.7 18.7 18.5 18.2 17.8 17.1 16.3 15.2 13.7 11.5 o. o. 2.16 19.0 19.0 18.8 18.5 18.1 17.5 16.6 15.5 14.0 11.9 o. o. 2.18 19.4 19.3 19.1 18.8 18.4 17.8 17.0 15.9 14.4 12.3 o. o. 2.20 19.7 19.6 19.4 19.1 18.7 18.l 17.3 16.2 14.7 12.7 o. o. 2.22 20.0 19.9 19.7 19.4 19.0 18.4 17.6 16.5 15.1 13.l o. o.
49
2.40
o. o. o. o. o. o. o. o. o. o. o. o. o. o. o. o. o. o. o. o. o. o. o. o. o. o. o. o. o. o. o. o. o. o. o. o. o. o. o. o. o. o.
Sam Peng
Sticky Note
None set by Sam Peng
Sam Peng
Sticky Note
MigrationNone set by Sam Peng
Sam Peng
Sticky Note
Unmarked set by Sam Peng

APPENDIX D. - Continued
Discharge in cfs for weir at Station 1335+67
Upstream water depth (Du) 2.24 - 3.06 Feet
Downstream water depth (Dd) 0.0 - 2.4 Feet
v~. l.417~ i.-
DC1 - Downstream Water DepUl Du. o.o • 2( .40 .6( • Sc l.OC 1.2( 1.40 l..6O l.tsO 2. Oc 2.2c i.40
2.24 20.3 20.2 2O.O i9.8 19.3 18.7 17.9 16.9 15.4 13.5 10.7 o. o. 2.26 20.6 20.5 20.4 2O.l 19.6 19 .1 18.3 i7.2 15.8 13.9 11.1 o. o. 2.28 20.9 20.8 20.7 20.4 2O.O 19.4 18.6 17.6 16.2 114.3 11.6 o. o. 2.30 21.3 21.2 21.0 20.7 20.3 19.7 18.9 17.9 16.5 114.7 12.1 o. o. 2.32 21.6 21.5 21.3 21.O 20.6 2O.O 19.3 18.2 16.9 115.l 12.5 o. o. 2.34 21.9 21.8 21.7 21.4 21.0 20.4 19.6 18.6 17.3 115.5 13.O o. o. 2.36 122. 2 22.2 22.O 21.7 21.3 20.7 2O.O 18.9 17.6 115.9 13.4 o. o. 2.38 22.6 22.5 22.3 22.O 21.6 21.1 20.3 19. 3 18.O 116. 3 13.9 o. o. 2.40 22.9 22.8 22.7 22.4 22.O 21.4 20.6 19.7 18.4 116. 7 14.3 o. o. 2.42 23.3 23.2 23.O 22.7 22.3 21.8 21.0 2O.O 18.7 117.1 14.8 o. o. 2.44 23.6 23.5 23.4 23.1 22.7 22.1 21.4 20.4 19 .1 117 .5 15.2 o. o. 2.46 24.O 23.9 23.7 23.4 23.O 22.5 21.7 20.7 19.5 17.8 15.7 12.5 o. 2.48 24.3 24.2 24.1 23.8 23.4 22.8 22.1 21.l 19.9 118 .2 16.l 13.O o. 2.50 24.1 24.6 24.4 24.1 23.7 23.2 22.4 21.5 20.2 18.6 16.5 13.6 o. 2.52 25.O 24.9 24.8 24.5 24.1 23.5 22.8 21.8 20.6 119. 0 17.O 14.1 o. 2.54 25.4 25.3 25.1 24.8 24.4 23.9 23.2 22.2 21.O 119.4 17.4 14.6 o. 2.56 25.7 25.6 25.5 25.2 24.8 24.2 23.5 22.6 21.4 119 ~ 8 17.8 15.1 8. 2.58 26.1 26.O 25.8 25.6 25.2 24.6 23.9 23.O 21.8 20.2 18.3 15.6 o. 2.60 26.5 26.4 26.2 25.9 25.5 25.O 24.3 23.3 22.2 20.7 18.7 16.O o. 2.62 26.8 26.7 26.6 26.3 25.9 25.4 24.6 23.7 22.6 21.1 19.l 16.5 o. 2.64 27.2 27.1 27.O 26.7 26.3 25.7 25.O 24.1 22.9 21.5 19.6 17.O o. 2.66 27.6 27.5 27.3 27.1 26.7 26.l 25.4 24.5 23.3 21.9 20.0 17.5 o. 2.68 28.O 27.9 27.7 27.4 27.O 26.5 25.8 24.9 23.7 22.3 20.4 18.O 14.5 2.70 28.3 28.2 28.1 27.8 27.4 26.9 26.2 25.3 24.1 22.7 20.9 18.5 15.1 2. 72 28.7 28.6 28.5 28.2 27.8 27.3 26.6 25.7 24.5 23.1 21.3 18.9 15.7 2.74 29.1 29.O 28.9 28.6 28.2 27.7 27.O 26.1 25.O 23.5 21.7 19.4 16.2 2.76 29.5 29.4 29.2 29.O 28.6 28.O 27.4 26.5 25.4 124 .o 22.2 19.9 16.8 2.78 29.9 29.8 29.6 29.4 29.O 28.4 27.8 26.9 25.8 124. 4 22.6 20.3 17.3 2.80 30.3 30.2 3O.O 29.8 29.4 28.8 28.2 27.3 26.2 24.8 23.1 20.8 17.8 2.82 30.7 30.6 30.4 30.2 29.8 29.2 28.6 27.7 26.6 25.2 23.5 21.3 18.4 2.84 31.1 31.O 30.8 30.6 30.2 29.6 29.O 28.l 27.O 25.7 23.9 21.8 18.9 2.86 31.5 31.4 31.2 31.O 30.6 3O.l 29.4 28.5 27.4 26.1 24.4 22.2 19.4 2.88 31.9 31.8 31.6 31.4 31.0 30.5 29.8 28.9 27.8 26.5 24.8 22.7 19.9 2.90 32.3 32.2 32.O 31.8 31.4 30.9 30.2 29.3 28.3 26.9 25.3 23.2 20.5 2.92 32.7 32.6 32.5 32.2 31.8 31.3 30.6 29.8 28.7 ~7.4 25.7 23.7 21.O 2.94 33.1 33.O 32.9 32.6 32.2 31.7 31.0 30.2 29.1 ~7.8 26.2 24.1 21.5 2.96 33.6 33.4 33.3 33.O 32.6 32.1 31.5 30.6 29.6 ~8.3 26.6 24.6 22.O 2.98 34.O 33.9 33.7 33.4 33.1 32.5 31.9 31.O 30.0 ~8.7 27.1 25.1 22.5 3.00 34.4 34.3 ~4.1 33.9 33.5 33.O 32.3 31.5 30.4 · ~9.1 27.6 25.6 23.O 3.02 34.8 34.7 34.6 34.3 33.9 33.4 32.7 31.9 30.9 ~9.6 28.O 26.O 23.6 3.04 35.2 35.1 ~5.o 34.7 34.3 33.8 33.2 32.3 31.3 3O.O 28.5 26.5 24.1 3 •. 06 35.7 35.6 35.4 35.2 34.8 34.3 33.6 32.8 31.8 30.5 28.9 27.O 24.6
50
Sam Peng
Sticky Note
None set by Sam Peng
Sam Peng
Sticky Note
MigrationNone set by Sam Peng
Sam Peng
Sticky Note
Unmarked set by Sam Peng

APPENDIX D. - Continued
Discharge in cfs for weir at Station 1335+67
Upstream water depth (Du) 3.08 - 3.90 Feet
Downstream water depth (Dd) o.o - 2.4 Feet
v~. 1.417:.1 i..
Dd - Downstream Water Depth Du o.o • :ll • 4( • 6( • 8( 1.00 1.20 1.40 l.60 l.80 2 .oc 2.20 2.40
3.08 36.1 36.0 35.9 35.6 35.2 34.7 34.0 [33.2 32.2 30.9 i9.4 27.5 25.1 3.10 36.6 36.4 36.3 36.0 35.6 35.1 34.5 ~3.7 32.6 31.4 29.9 28.0 25.6 3.12 37.0 36.9 36.7 36.5 36.1 35.6 34.9 34.1 33.1 31.9 30.3 28.5 26.l 3.14 37.4 37.3 37.2 36.9 36.5 36.0 35.4 34.6 33.6 32.3 30.8 29.0 26.6 3.16 37.9 37.8 37.6 37.4 37.0 36.5 35.8 35.0 34.0 32.8 31.3 29.4 27.2 3.18 38.3 38.2 38.l 37.8 37.4 36.9 36.3 ~5.5 34. 5 33.2 31.8 29.9 27.7 3.20 38.8 38.7 38.5 38.3 37.9 37.4 36.7 ~5.9 34.9 33.7 32.2 30.4 28.2 3.22 39.2 39.l 39.0 38.7 38.3 37.8 37.2 [36.4 35.4 34.2 32.7 30.9 28.7 3.24 39.7 39.6 39.4 39.2 38.8 38.3 37.6 36.8 35.9 34.7 33.2 31.4 29.2 3.26 40.2 40.0 39.9 39.6 39.2 38.7 38.1 37.3 36.3 35.1 33.7 31.9 29.7 3.28 40.6 40.5 40.3 140.l 39.7 39.2 38.6 ~7.8 36.8 35.6 34.2 32.4 30.3 3.30 41.1 41.0 40.8 40.6 40.2 39.7 39.0 38.2 37.3 36.1 34.7 32.9 30.8 3.32 41.6 41.4 41.3 41.0 40.6 40.1 39.5 [38.7 37.8 36.6 35.1 33.4 31.3 3.34 42.0 41.9 41.8 41.5 41.1 40.6 40.0 39. 2 38.2 37.1 35.6 33.9 31.8 3.36 42.5 42.4 42.2 42.0 41.6 41.1 40.5 39.7 38.7 37.5 36.1 34.4 32.4 3.38 43.0 42.9 42.7 42.4 42.l 41.6 40.9 140.2 39.2 38.0 36.6 34.9 32·.9 3.40 43.5 43.3 43.2 42.9 42.5 42.1 41.4 140.6 39. 7 38.5 37.1 35.4 33.4 3.42 ~3.9 43-.8 43 .• 7 43.4 43.0 42.5 41.9 141.1 40.2 39.0 37.6 36.0 33.9 3.44 44.,4 44;·3 44.1 43.9 43.5 43.0 42.4 141.6 4.0. 7 39.5 38.1 36.5 34.5 3.46 4'4,.9' 44.8 44.-.6 44.4 44.0 43.5 42.9 142.l 41.2 40.0 38.6 37.0 35.0 ·3.48' 4~.4 ,-g; 3 145...,1 44 .. 9 44.5 44.0 43.4 142.6 4.1. 7 40.5 39.2 37.5 35.5
· 3.50 4·s:. 9 4's.·e 4.5._6 4.5.( 45.0 44.5 43.9- 143.1 42.2 41.0 39.7 38.0 36.1 3.52 4'6 .• 4 46.J 46 .. l 45.9 4;5.5 45.0 44.4 1,43.6 42.7 41.5 40.2 38.6 36.6 3.54 46.9 46.8 46.6 46.4 46.0 45.5 44.9 144.1 43.2 42.0 40.7 39.l 37.1 3.56 47.4 47.3 47.1 46.9 46.5 46.0 45.4 144.6 43.7 42.6 41.2 39.6 37.7 3.58 47.9 47.8 47.6 47.4 47.0 46.5 45.9 1,45.1 44.2 43.1 41.7 40.l 38.2 3.60 48.4 48.3 48.1 147.9 47.5 47.0 46.4 145.6 44.7 43.6 42.3 40.7 38.8 3.62 48.9 48.8 48.6 48.4 48.0 47.5 46.9 146.2 45.2 4.4 .1 42.8 41.2 39.3 3.64 49.4 49.3 49.l 48.9 48.5 48.0 47.4 146.7 45.7 44.6 43.3 41.7 39.9 3.66 49.9 49.8 49.7 49.4 49.0 48.6 47.9 147.2 46.3 45.2 43.8 42.3 40.4 3.68 50.5 50.3 50.2 49.9 49.6 49.1 48.5 147.7 46.8 45.7 44.4 42.8 41.0 3.70 51.0 50.9 50.7 50.4 50.1 49.6 49.0 148.2 47.3 46.2 44.9 43.4 41.5 3.72 51.5 51.4 51.2 51.0 50.6 50.l 49.5 148.8 47.9 46.8 45.5 43.9 42.1 3.74 52.0 51.9 51.8 51.5 51.1 50.7 50.0 149.3 4Q.4 47.3 46.0 44.5 42.6 3.76 52.6 52.4 52.3 52.0 51.7 51.2 50.6 149.8 48.9 47.8 46.5 45.0 43.2 3.78 53.l 53.0 52.8 52.6 52.2 51.7. 51.1 50.4 49.5 48.4 47.1 45.6 43.8 3.80 53.6 53.5 53.4 53.1 52.7 52.3 51.7 50.9 50.0 48.9 47.6 46.1 44.3 3.82 54.2 54.1 53.9 53.6 53.3 52.8 52.2 51.4 50.5 49.5 48.2 46.7 44.9 3.84 54.7 54.6 54.4 54.2 53.8 53.3 52.7 52.0 51.1 50.0 48.7 47.2 45.5 3.86 55.3 55.1 55.0 54.7 54.4 53.9 53.3 52.5 51.6 50.6 49.3 47.8 46.l 3.88 55.8 55.7 55.5 55.3 54.9 54.4 53.8 53.l 52.2 51.1 49.9 48.4 46.6 3.90 56.4 56.2 56.l 55.8 55.5 55.0 54.4 53.6 52.7 51.7 50.4 48.9 47.2
51
Sam Peng
Sticky Note
None set by Sam Peng
Sam Peng
Sticky Note
MigrationNone set by Sam Peng
Sam Peng
Sticky Note
Unmarked set by Sam Peng
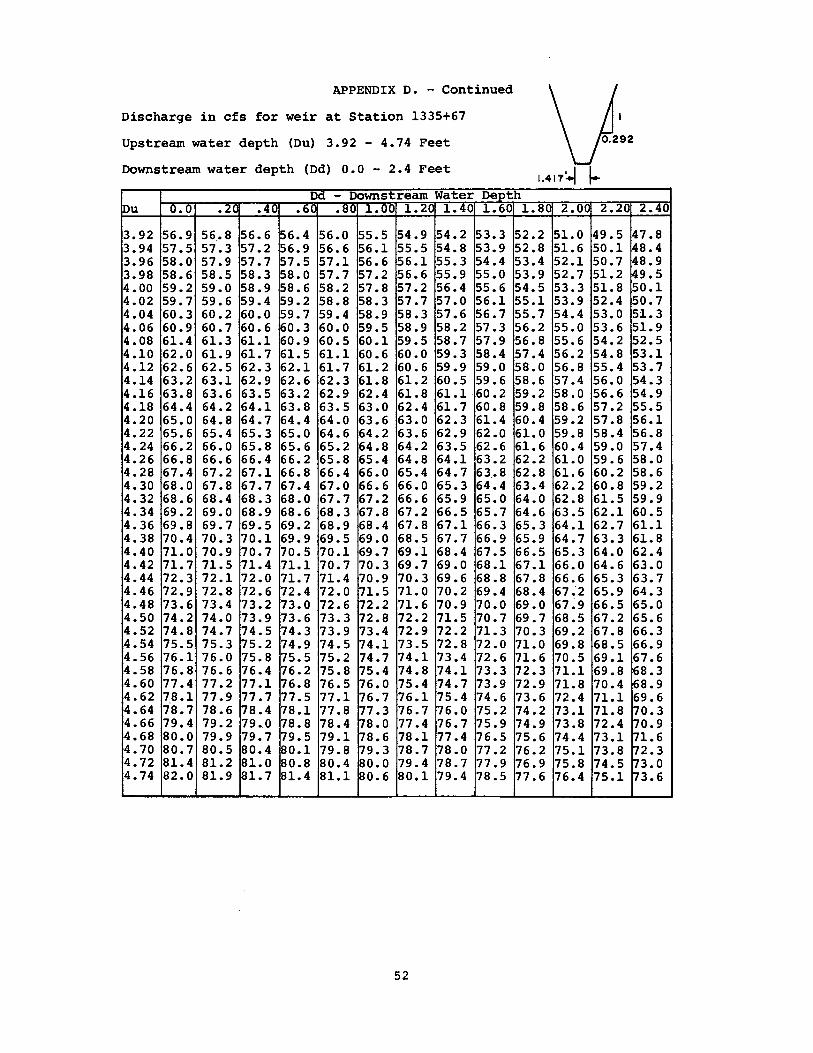
APPENDIX D. - Continued
Discharge in cfs for weir at Station 1335+67
Upstream water depth (Du) 3.92 - 4.74 Feet
Downstream water depth (Dd) o.o - 2.4 Feet
v~. 1.417:.1 1--
D~ - Downstream Water Depth Du o.o • 2( .40 • 6( .80 1.00 1.2( 1.40 J..6O 1.80 2.Oc: 2.20 2.40
3.92 56.9 56_. 8 56.6 56.4 56.O 55.5 54.9 54.2 53.3 52.2 51.O 49.5 47.8 3.94 57.5 57.3 57.2 56.9 56.6 56.l 55.5 54.8 53.9 52.8 51.6 5O.l 48.4 3.96 58.O 57.9 57.7 57.5 57.1 56.6 56.l 55.3 54.4 53.4 52.1 50.7 48.9 3.98 58.6 58.5 58.3 58.O 57.7 57.2 56.6 55.9 55.O 53.9 52.7 51.2 49.5 4.00 59.2 59.O 58.9 58.6 58.2 57.8 57.2 56.4 55.6 54.5 53.3 51.8 5O.l 4.02 59. 7 59.6 59.4 59.2 58.8 58.3 57.7 57.O 56.1 55.1 53.9 52.4 50.7 4.04 60.3 60.2 6O.O 59.7 59. 4 58.9 58.3 57.6 56.7 55.7 54.4 53.O 51.3 4.06 60.9 60.7 60.6 ~0.3 6O.O 59.5 58.9 58.2 57.3 56.2 55.O 53.6 51.9 4.08 61.4 61.3 61.1 60.9 60.5 6O.l 59.5 58.7 57.9 56.8 55.6 54.2 52.5 4.10 62.O 61.9 61.7 61.5 61.l 60.6 6O.O 59.3 58.4 57.4 56.2 54.8 53.1 4.12 62.6 62.5 62.3 62.1 -61. 7 61.2 60.6 59.9 59.O 58.O 56.8 55.4 53.7 4.14 63.2 63.l 62.9 62.6 62.3 61.8 61.2 60.5 59.6 58.6 57.4 56.O 54.3 4.16 63.8 63.6 63.5 63.2 62.9 62.4 61.8 61.1 -60 .2 59.2 58.O 56.6 54.9 4.18 64.4 64.2 64.1 63.8 63.5 63.O 62.4 61.7 60.8 59.8 58.6 57.2 55.5 4.20 65.O 64.8 64.7 64.4 64.O 63.6 63.O 62.3 61.4 60.4 59.2 57.8 56.1 4.22 65.6 65.4 65.3 65.O 64.6 64.2 63.6 62.9 62.O 61.O 59.8 58.4 56.8 4.24 66.2 66.O 65.8 65.6 65.2 64.8 64.2 63.5 62.6 61.6 60.4 59.O 57.4 4.26 66.8 66.6 66.4 66.2 65.8 65.4 64.8 64 .1 63.2 62.2 61.O 59. 6 58.O 4.28 67.4 67.2 67.1 66.8 66.4 66.O 65.4 64.7 63_.8 62.8 61.6 60.2 58.6 4.30 68.O 67.8 67.7 67.4 67.O 66.6 66.O 65.3 64.4 63.4 62.2 60.8 59.2 4.32 68.6 68.4 68.3 68.O 67.7 67.2 66.6 65.9 65.O 64.O 62.8 61.5 59.9 4.34 69.2 69.O 68.9 68.6 68.3 67.8 67.2 66.5 65.7 64.6 63.5 62.1 60.5 4.36 69.8 69.7 69.5 69.2 68.9 68.4 67.8 67.1 66.3 65.3 64.1 62.7 61.1 4.38 70.4 70.3 70.1 69.9 69.5 69.O 68.5 67.7 66.9 65.9 64.7 63.3 61.8 4.40 71.0 70.9 70.7 170. 5 7O.l 69. 7 69 .1 68.4 67.5 66.5 65.3 64.O 62.4 4.42 71.7 71.5 71.4 71.1 70.7 70.3 69.7 69.O 68.1 67.1 66.O 64.6 63.O 4.44 72.3 72.1 72.O 71.7 71.4 70.9 70.3 69.6 68.8 67.8 66.6 65.3 63.7 4.46 72.9 72.8 72.6 72.4 72.O 71.5 71.0 70.2 69.4 68.4 67.2 65.9 64.3 4.48 73.6 73.4 73.2 73.O 72.6 72.2 71.6 70.9 7O.O 69 .o 67~9 66.5 65.O 4.50 74.2 74.O 73.9 173.6 73.3 72.8 72.2 71.5 70.7 69. 7 68.5 67.2 65.6 4.52 74.8 74.7 74.5 74.3 73.9 73.4 72.9 72.2 71.3 70.3 69.2 67.8 66.3 4.54 75.5 75.3 75.2 74.9 74.5 74.1 73.5 72.8 72.O 71.O 69. 8 68.5 66.9 4.56 76.1 76.O 75.8 75.5 75.2 74.7 74.1 73.4 72.6 71.6 70.5 69.1 67.6 4.58 76.8 76.6 76.4 76.2 75.8 75.4 74.8 74.1 73.3 72.3 71.1 69.8 68.3 4.60 77.4 77.2 77.1 76.8 76.5 76.O 75.4 74.7 73.9 72.9 71.8 70.4 68.9 4.62 78.1 77.9 77. 7 77.5 77.1 76.7 76.l 75.4 74.6 73.6 72.4 71.1 69.6 4.64 i0.1 78.6 78.4 78.1 77.8 77.3 76.7 76.O 75.2 74.2 73.1 71.8 70.3 4.66 79.4 79.2 79.O 78.8 78.4 78.O 77.4 76.7 75.9 74.9 73.8 72.4 70.9 4.68 8O.O 79.9 79.7 79.5 79.l 78.6 78.l 77.4 76.5 75.6 74.4 73.1 71.6 4.70 80.7 80.5 80.4 8O.l 79.8 79.3 78.7 78.O 77.2 76.2 75.1 73.8 72.3 4. 72 81.4 81.2 81.O 80.8 80.4 8O.O 79.4 78.7 77.9 76.9 75.8 74.5 73.O 4.74 82.O 81.9 81. 7 81.4 81.1 80.6 8O.l 79.4 78.5 177.6 76.4 75.1 73.6
52
Sam Peng
Sticky Note
None set by Sam Peng
Sam Peng
Sticky Note
MigrationNone set by Sam Peng
Sam Peng
Sticky Note
Unmarked set by Sam Peng

APPENDIX D. - Continued
Discharge in cfs for weir at Station 1335+67
Upstream water depth (Du) 4.76 - 5.44 Feet
Downstream water depth (Dd) o.o - 2.4 Feet
v, .. l.417~ j.
Da - Downstream Water Depth Du o.o .20 .40 .60 .80 1.00 .1.20 1.40 l.6O l.80 2.00 2.2(
4.76 82.7 82.5 82.4 82.1 81.8 81.3 80.7 8O.O 79.2 78.2 77.1 75.8 4.78 83.4 83.2 83.O B2.8 82.4 82.O 81.4 80.7 79.9 78.9 77 .8 76.5 4.80 84.O 83.9 83.7 83.5 83.1 B2.7 82.1 81.4 80.·6 79.6 78.5 77.2 4.82 84.7 84.6 84.4 84.1 83.8 83.3 82.8 82.1 81.2 80.3 79.2 77 .9 4.84 85.4 85.2 85.1 84.8 84.5 84.O 83.4 82.8 81.9 81.0 79.9 78.6 4.86 86.1 85.9 85.8 85.5 85.2 84.7 84.1 83.4 82.6 81.7 80.5 79.3 4.88 86.8 86.6 86.5 86.2 85.9 85.4 84.8 84.1 83.3 82.4 81.2 8O.O 4.90 87.5 87.3 87.1 86.9 86.5 186.1 85.5 84.8 84.O 83.O 81.9 80.6 4.92 88.2 88.O 87.8 87.6 87.2 186.8 86.2 85.5 84.7 83.7 82.6 81.4 4.94 88.9 88.7 88.5 88.3 87.9 187.5 86.9 86.2 85.4 84.4 83.3 82.1 4.96 89.6 89.4 89.2 89.O 88.6 88.2 87.6 86.9 86.1 85.1 84.O 82.8 4.98 90.3 9O.l 89.9 89.7 89.3 88.9 88.3 87.6 86.8 85.9 84.7 83.5 5.00 91.0 90.8 90.6 90.4 9O.O 189.6 89.O 88.3 87.5 86.6 85.5 84.2 5.02 91.7 91.5 91.4 91.l 90.7 90.3 89.7 89.O 88.2 87.3 86.2 84.9 5.04 92.4 92.2 92.1 91.8 91.5 91.O 90.4 89.7 88.9 88.O 86.9 85.6 5.06 93.1 92.9 92.8 92.5 92.2 91.7 91.1 90.5 89.6 88.7 87.6 86.3 5.08 93.8 93.7 93.5 93.2 92.9 92.4 91.9 91.2 90.4 89.4 88.3 87.1 5.10 94.5 94.4 94.2 94.O 93.6 93.1 92.6 91.9 91.l 9O.l 89.O 87.8 5.12 95.3 95.1 94.9 94.7 94.3 93.9 93.3 92.6 91.8 90.9 89.8 88.5 5.14 96.O 95.8 95.7 95.4 95.O 94.6 94.O 93.3 92.5 91.6 90.5 89.2 5.16 96.7 96.5 96.4 96.l 95.8 95.3 94.8 94.1 93.3 92.3 91.2 9O.O 5.18 97.5 97.3 97.1 96.9 96.5 96.1 95.5 94.8 94.O 93.1 92.O 90.7 5.20 98.2 98.O 97.8 97.6 97.2 96.8 96.2 95.5 94.7 93.8 92.7 91.5 5.22 98.9 98.7 98.6 98.3 98.O 97.5 97.O 96.3 95.5 94.5 93.4 92.2 5.24 99.7 99.5 99.3 99.l 98.7 98.3 97.7 97.O 96.2 95.3 94.2 92.9 5.26 o. o. o. 99.8 99.5 99.O 98.4 97.8 97.O 96.O 94.9 93.7 5.28 o. o. o. o. o. 99.7 99.2 98.5 97.7 96.8 95.7 94.4 5.30 o. o. o. o. o. o. o. 99.3 98.5 97.5 96.4 95.2 5.32 o. o. o. o. o. o. o. o. 99.2 98.3 97.2 96.O 5.34 o. o. o. o. o. o. o. o. o. 99.O 97.9 96.7 5.36 o. o. o. o. . o. o. o. o. o • 99.8 98.7 97.5 5.38 o. o. o. o. o. o. o. o. o. o. 99.5 98.2 5.40 o. o. o. o. o. o. o. o. o. o. o. 99.O 5.42 o. o. o. o. o. o. o. o. o. o. o. 99.8 5.44 o. o. o. o. o. o. o. o. o. o. o. o. 5.46 o. o. o. o. o. o. o. o. o. o. o. o. 5.48 o. o. o. o. o. o. o. o. o. o. o. o. 5.50 o. o. o. o. o. o. o. o. o. o. o. o. 5.52 o. o. o. o. o. o. o. o. o. o. o. o. 5.54 o. o. o. o. o. o. o. o. o. o. o. o. 5.56 o. o. o. o. o. o. o. o. o. o. o. o. 5.58 o. o. o. o. o. o. o. o. o. o. o. o.
53
2.40
74.3 75.O 75.7 76.4 77.1 77.8 78.5 79.2 79.9 80.6 81.3 82.O . 82.7 83.5 84.2 84.9 85.6 86.4 87.1 87.8 88.6 89.3 9O.O 90.8 91.5 92.3 93.O 93.8 94.6 95.3 96.1 96.8 97.6 98.4 99.2 o. o. o. o. o. o. o.
Sam Peng
Sticky Note
None set by Sam Peng
Sam Peng
Sticky Note
MigrationNone set by Sam Peng
Sam Peng
Sticky Note
Unmarked set by Sam Peng

APPENDIX E.
Discharge in cfs for weir at Station 1430+08
Upstream water depth (Du) 0.50 - 1.48 Feet
Downstream water depth (Dd) 0.0 - 1.2 Feet
Del - Downstream Water Du o. .10 .20 .30 .40 .50 .60 .70
.so 3.3 3.2 3.1 2.8 2.2 o. o. o.
.52 3.4 3.3 3.2 2.9 2.4 o. o. o.
.54 3.6 3.5 3.4 3.1 2.7 o. o. o.
.56 3.7 3.7 3.6 3.3 2.9 2.0 o. o.
.58 3.9 3.9 3.7 3.5 3.1 2.3 o. o. • 60 4.1 4.0 3.9 3.7 3.3 2.6 o. o. • 62 4.3 4.2 4.1 3.9 3.5 2.9 o. o • • 64 -4.5 4.4 4.3 4.1 3.8 3.1 o. o • • 66 4.7 4.6 4.5 4.3 4.0 3.4 o. o. • 68 4.9 4.8 4.7 4.5 4.2 3.7 2.7 o. • 70 5.1 5.0 4.9 4.8 4.4 3.9 3.1 o. • 72-- 5.3 5.3 5.2 5.0 4.7 4.2 3.4 o. .74 5.6 5.5 5.4 5.2 4.9 4.4 3.7 o. .76 5.8 5.7 5.6 5.5 5.2 4.7 4.0 o. • 78 6.0 6.0 5.9 5.7 5.4 5.0 4.3 3.2 • 80 6.3 6.2 6.1 5.9 5.7 5.3 4.6 3.6 .82 6·. 5 6.5 6.4 6.2 5.9 5.5 4.9 3.9 .84 6.8 6.7 6.6 6.5 6.2 5.8 5.2 4.3 • 86 7.1 7.0· 6.9 6.7 6. 5- . 6.1 5.5 4.7 .88 7.3 7.3 7.2 7.0 6.8 6.4 5.8 5.0 • g-o . 7.6 7.5 7. 4 7.3 1.0 6-. 7 6.1 5.4 • 92 7.9 7.'8 7.7 7.6 7.3 7.0 6.5 5.7 • 94 8.2 8.1 8.0 7.9 7.6 7.3 6.8 6.1 • 96 8.5 8.4 8.3 8.2 7.9 7.6 7.1 6.4 • 98 8.8 8.7 8.6 8.5 8.2 7.9 7.4 6.7
1.00 9.1 9.0 8.9 8.8 8.5 8.2 7.7 7.1 1.02 9.4 9.3 9.2 9.1 8.9 8 .• 5 8~1 7.5 1.04 9.7 9.6 9.6 9.4 9.2 8.9 8.4 7.8 1.06 10.l 10.0 9.9 9.7 9.5 9.2 8.8 8.2 1.08 10.4 10.3 10.2 10.l 9.9 9.5 9.1 8.5 1.10 10.8 10.6 10.6 10.4 10.2 9.9 9.5 8.9 1.12 11.1 11.0 10.9 10.8 10.6 10.2 9.8 9.3 1.14 11.5 11.3 11.3 11.1 10.9 10.6 10.2 9.7 1.16 11.8 11.7 11.6 11.5 11·.3 11.0 10.6 10.0 1.18 12.2 12.1 12.0 ~1.9 11.6 11.3 10.9 10.4 1.20 12.6 12.4 12.4 12.2 12.0 11.7 11.3 10.8 1.22 12_.9 12.8 12.7 12.6 12.4 12.1 11.7 11.2 1.24 13.3 13.2 13.l 13.0 12.8 12.5 12.1 11.6 1.26 13.7 13.6 13.5 13.4 13.2 12.9 12.5 12.0 1.28 14.1 14.0 13.9 13.8 13.6 13.3 12.9 12.4 1.30 14.5 14.4 14.3 14.2 14.0 13.7 13.3 12.8 1.32 14.9 14.8 14.7 14.6 14.4 14.1 13.7 13.3 1.34 15.4 15.2 15.1 15.0 14.8 14.5 14.2 13.7 1.36 15.8 15.6 15.6 15.4 15.2 15.0 14.6 14.1 1.38 16.2 16.l 16.0 15.9 15.7 15.4 15.0 14.6 1.40 16.7 16.5 16.4 16.3 16.1 15.8 15.5 15.0 1.42 17.1 16.9 16.9 16.7 16.5 16.3 15.9 15.5 1.44 17.6 17.4 17.3 17.2 17.0 16.7 16.4 15.9 1.46 18.0 17.8 17.8 17.6 17.5 17.2 16.8 16.4 1.48 18.5 18.3 18.2 18.l 17.9 17.7 17.3 16.9
55
.!2.1&1!--Denth
.BC .90 1.00 1.10 J..;,rn
o. o. o. o. o. o. o. o. o. o. o. o. o. o. o. o. o. o. o. o. o. o. o. o. o. o • o. o. o. o. o. o. o. o. 'o. o. o. o. o. o. o . o. o. o. o. o • o. o. o. o. o. o • o. o. o. o. o. o. o. o. o. o. o. o. o. o. o. o. o. o. o. o • o. o. o. o. o. o . o. o. o. o. o. o. o. o. o. o. o. o .• o. o . o. o. o. o. o. o. o. o. 4.1 o. o. o • o. 4.6 o • o. o. o. 5.0 o. o. o • o. 5.4 o • o. o. o. 5.8 o. o. o . o. 6.2 o. o. o. o. 6.6 5.2 o. o. o. 7.0 5.7 o. o. o. 7.3 6.1 o. o. o. 7.7 6.6 o. o. o. 8.1 7.0 o. o. o. 8.5 7.5 5.9 o. o. 8.9 7.9 6.4 o. o. 9.3 8.3 7.0 o. o. 9.7 8.8 7.5 o. o.
10.1 9.2 8.0 o. o. 10.5 9.7 8.4 o. o. 11.0 10.l 8.9 7.3 o. 11.4 10.5 9.4 7.8 o. 11.8 11.0 9.9 8.4 o. 12.2 11.4 10.4 8.9 o. 12.7 11.9 10.8 9.5 o. 13.l 12.3 11.3 10.0 8.1 13.5 12.8 11.8 10.5 8.7 14.0 13.2 12.3 11.0 9.3 14.4 13.7 12.8 11.6 9.9 14 .9 14.2 13.3 12.1 10.5 15.4 14.7 13.8 12.6 11.1 15.8 15.l 14.3 13.1 11.7 16.3 15.6 14.8 13.7 12.3
Sam Peng
Sticky Note
None set by Sam Peng
Sam Peng
Sticky Note
MigrationNone set by Sam Peng
Sam Peng
Sticky Note
Unmarked set by Sam Peng

APPENDIX E. - Continued
Discharge in cfs for weir at Station 1430+08
Upstream water depth (Du) 1.50 - 2.48 Feet
Downstream water depth (Dd) o.o - 1.2 Feet
uo - Downstream Water Deoth Du o. .J.C • 20 • 3( .4C .-s-c .6C • 7C .Bl • !J(
1.50 19.0 18.8 18.7 18.6 118.4 118.1 17.8 17.3 16.8 16.1 1.52 19.4 19.2 19.2 19.0 18.9 18.6 18.3 17.8 17.3 16.6 1.54 19.9 19.7 19.7 19.5 19.3 19.1 18.7 18.3 17.8 17.1 1.56 20.4 20.2 20.1 20.0 19.8 19.6 19.2 18.8 18.3 17.6 1.58 20.9 20.7 20.6 20.5 20.3 20.1 19.7 19.3 18.8 18.1 1.60 21.4 21.2 21.1 21.0 20.8 20.6 20.2 19.8 19.3 18.7 1.62 21.9 21.7 21.6 21.5 21.3 21.1 20.7 20.3 1!1.8 19.2 1.64 22.4 22.2 22.1 22.0 21.8 21.6 21.3 20.8 20.3 19.7 1.66 22.9 22.7 22.7 22.5 22.4 22.1 21.8 21.4 20.9 20.2 1.68 23.5 23.3 23.2 23.1 22.9 22.6 22.3 21.9 21.4 20.8 1.70 24.0 23.8 23.7 23.6 23.4 23.2 22.8 22.4 21.9 21.3 1. 72 24.5 24.3 24.3 24.1 23.9 23.7 23.4 23.0 22.5 21.9 1.74 25.1 24.9 24.8 24.7 24.5 24.2 23.9 23.5 23.0 22.4 1.76 25.6 25.4 25.3 25.2 25.0 24.8 24.5 24.1 23.6 23.0 1.78 26.2 26.0 25.9 25.8 25.6 25.4 25.0 24.6 24.2 23.6 1.80 26.8 26.5 26.5 26.3 26.2 25.9 25.6 25.2 24.7 24.1 1.82 27.3 27.1 27.0 26.9 26.7 26.5 26.2 25.8 25.3 24.7 1.84 27.9 27.7 27.6 27.5 27.3 27.1 26.7 26.4 25.9 25.3 1.86 28.5 28.3 28.2 28.1 27.9 27.6 27.3 26.9 26.5 25.9 1.88 29.1 28.8 28.8 28.6 28.5 28.2 27.9 27.5 27.1 26.5 1.90 29.7 29.4 29.4 29.2 29.1 28.8 28.5 28.1 21.7 27.1 1.92 30.3 30.0 30.0 29.8 29.7 29.4 29.1 28.7 28.3 27.7 1.94 30.9 30.6 30.6 30.4 30.3 30.0 29.7 29.3 28.9 28.3 1.96 31.5 31.3 31.2 31.1 30.9 30.6 30.3 30.0 29.5 28.9 1.98 32.2 31.9 31.8 31.7 31.5 31.3 31.0 30.6 30.1 29.6 2.00 32.8 32.5 32.4 32.3 32.l 31.9 31.6 31.2 30.8 30.2 2.02 33.4 33.1 33.1 32.9 32.8 32.5 32.2 31.8 31.4 3Q.8 2.04 34.1 33.8 33.7 33.6 33.~ 33.2 32.9 32.5 32.0 31.5 2.06 34.7 34.4 34.3 34.2 34.0 33.8 33.5 33.1 32.7 32.1 2.08 35.4 35.1 35.0 34.9 34.7 34.5 34.2 33.8 33.3 32.8 2.10 36.0 35.7 35.6 35.5 35.4 35.1 34.8 34.5 34.0 33.5 2.12 36.7 36.4 36.3 36.2 36.0 35.8 35.5 35.1 34.7 34.1 2.14 37.4 37.0 37.0 36.9 36.7 36.5 36.2 35.8 35.3 34.8 2.16 38.1 37.7 37.7 37.5. 37.4 37.1 36.8 36.5 36:o 35.5 2.18 38.7 38.4 38.3 38.2 38.0 37.8 37.5 37.2 36.7 36.2 2.20 39.4 39.l 39.0 38.9 38.7 38.5 38.2 37.8 37.4 36.9 2.22 40.l 39.8 39.7 39.6 39.4 39.2 38.9 38.5 38.1 37.6 2.24 40.8 40.5 40.4 40.3 40.1 39.9 39.6 39.2 38.8 38.3 2.26 41.6 41.2 41.1 41.0 40.8 40.6 40.3 40.0 39.5 39.0 2.28 42.3 41.~ 41.8 41.7 41.6 41.3 41.0 40.7 40.2 39.7 ·2.30 43.0 42.6 42.6 42.4 42.3 42.0 41.8 41.4 41.0 40.5 2.32 43.7 43.4 43.3 143.2 143.0 42.8 42.5 42.1 41.7 41.2 2.34 44.5 44.1 44.0 43.9 43.7 43.5 43.2 42.9 42.4 41.9 2.36 45.2 44.8 44.8 44.6 144.5 44.2 44.0 43.6 43.2 42.7 2.38 46.0 45.6 45.5 145.4 45.2 45.0 44.7 44.3 43.9 43.4 2.40 46.7 46.3 46.3 46.1 146.0 45.7 45.5 45.1 44.7 44.2 2.42 47.5 47.1 47.0 46.9 46.7 46.5 46.2 45.9 45.4 44.9 2.44 ·49_3 47.8 147.8 147. 7 147.5 47.3 47.0 46.6 46.2 45.7 2.46 49.0 48.6 48.5 148.4 148.3 ~8.0 147.7 47.4 47.0 46.5 2.48 49.8 49.4 149.3 49.2 149.0 48.8 48.5 48.2 47.8 47.3
56
.!2.1s1!.
J. o Ul J. • .LC .L. 2(
15.3 14.2 12.8 15.8 14.7 13.4 16.3 15.3 14.0 16.8 15.8 14.5 17.3 16.4 15.l 17.9 16.9 15.7 18.4 17.4 16.3 18.9 18.0 16.8 19.5 18.6 17.4 20.0 19.1 18.0 20.6 19.7 18.6 21.1 20.3 19.2 21.7 20.8 19.8 22.3 21.4 20.4 22.9 22.0 21.0 23.4 22.6 21.6 24.0 23.2 22.2 24.6 23.8 22.8 25.2· 24.4 23.4 25.8 25.0 24.0 26.4 25.6 24.7 27.0 26.2 25.3 27.7 26.9 25.!) 28.3 27.5 26.6 28.9 28.1 27.2 29.6 28.8 27.9 30.2 29.4 28.5 30.9 30.1 29.2 31.5 30.8 29.9 32.2 31.4 30.6 32.8 32.1 31.2 33.5 32.8 31.9 34.2 33.5 32.6 34.9 34.2 ' 33.3 35.6 34.8 34.0 36.3 35.6 34.7 37.0 36.3 35.4 37.7 37.0 36.2 38.4 37.7 36.9 39.1 38.4 37.6 39.9 39.2 38.3 40.6 39.9 39.1 41.3 40.6 39.8 42.1 41.4 40.6 42.8 42.1 41.4 43.6 42.9 42.1 44.4 43.7 42.9 45.1 44.5 43.7 45.9 45.2 44.5 46.7 46.0 45.3
Sam Peng
Sticky Note
None set by Sam Peng
Sam Peng
Sticky Note
MigrationNone set by Sam Peng
Sam Peng
Sticky Note
Unmarked set by Sam Peng
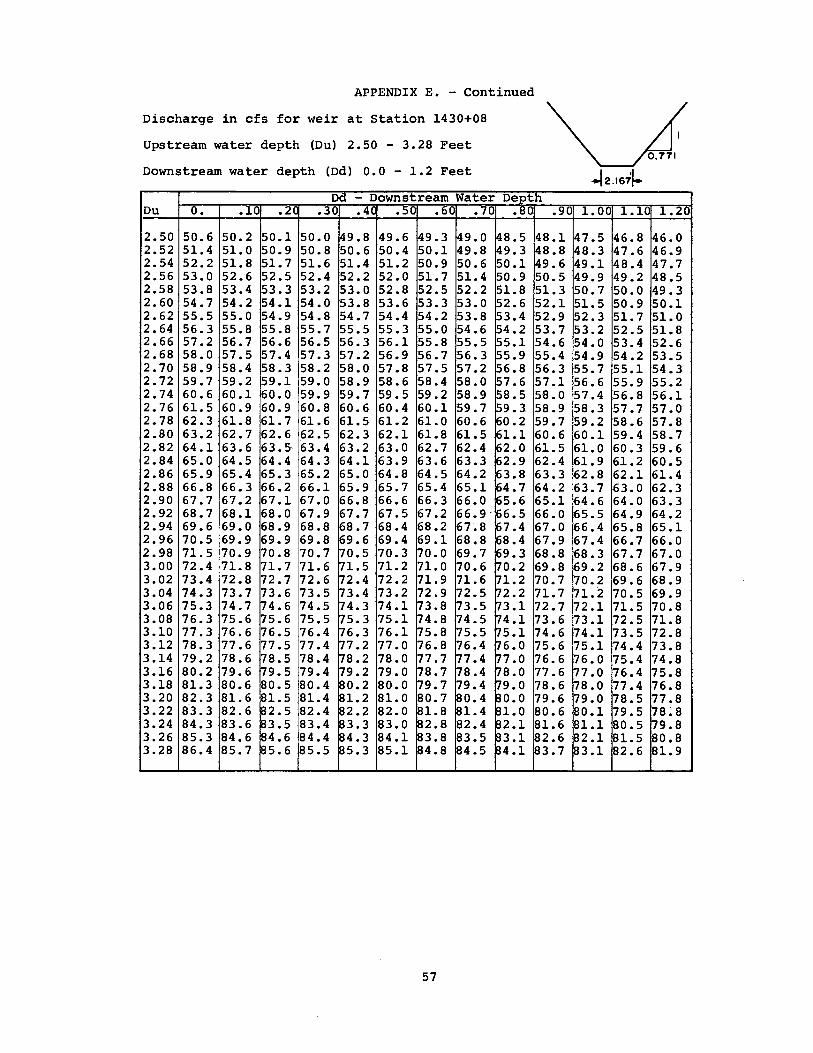
APPENDIX E. - Continued
Discharge in cfs for weir at Station 1430+08
Upstream water depth (Du) 2.50 - 3.28 Feet
Downstream water depth (Dd) 0.0 - 1.2 Feet .!2.1671--- Downstream Water De
Du o. . 0 .2 .4 .so .60
2.50 50.6 50.2 5O.l 5O.O 9.8 49 .• 6 49.3 9.0 8.5 48.l 7.5 46.8 46.0 2.52 51.4 51.0 50.9 50.8 50.6 50.4 50.1 9.8 9.3 8.8 48.3 47.6 46.9 2.54 52.2 51.8 51.7 51.6 51.4 51.2 50.9 50.6 5O.l 49.6 49.1 48.4 47.7 2.56 53.O 52.6 52.5 52.4 52.2 52.O 51.7 51.4 50.9 50.5 49.9 49.2 48.5 2.58 53.8 53.4 53.3 53.2 53.O 52.8 52.5 52.2 51.8 51.3 50.7 5O.O 49.3 2.60 54.7 54.2 54.1 54 .o 53.8 53.6 53.3 53.O 2.6 52.1 51.5 50.9 5O.l 2.62 55.5 55.O 54.9 54 .8 54.7 54.4 54.2 53.8 3.4 52.9 52.3 51.7 51.0 2.64 56.3 55.8 55.8 55.7 55.5 55.3 55.O 54.6 4.2 53.7 53.2 52.5 51.8 2.66 57.2 56.7 56.6 56.5 56.3 56.l 55.8 55.5 5.1 54.6 54.O 53.4 52.6 2.68 58.O 57.5 57.4 57.3 57.2 56.9 56.7 56.3 5.9 55.4 54.9 54.2 53.5 2.70 58.9 58.4 58.3 58.2 58.O 57.8 57.5 57.2 6.8 56.3 55.7 55.1 54.3 2. 72 59.7 59.2 59.l 59.O 58.9 58.6 58.4 58.O 7.6 57.1 56.6 55.9 55.2 2.74 60.6 6O.l 6O.O 59.9 59.7 59.5 59.2 58.9 8.5 58.O 57.4 56.8 56 •. l 2.76 61.5 60.9 60.9 60.8 60.6 60.4 6O.l 59.7 9.3 58.9 58.3 57.7 57.O 2.78 62.3 61.8 61.7 61.6 61.5 61.2 61.0 60.6 0.2 59.7 59.2 58.6 57.8 2.80 63.2 62.7 62.6 _62 .s 62.3 62.1 61.8 61.5 1.1 60.6 60.1 59.4 58.7 2.82 64.1 63.6 63. 5- 63.4 63.2 63.O 62.7 62.4 2.0 61.5 61.O 60.3 59.6 2.84 65.O 64.5 64.4 64.3 64.1 63.9 63.6 63.3 2.9 62.4 61.9 61.2 60.5 2.86 65.9 65.4 65.3 65.2 65.O 64.8 64.5 64.2 3.8 63.3 62.8 62.1 61.4 2.88 66.8 66.3 66.2 66.1 65.9 65.7 65.4 65.1 4.7 64.2 63.7 63.O 62.3 2.90 67.7 67.2 67.1 67.O 66.8 66.6 66.3 66.O 5.6 65.1 64.6 64.O 63.3 2.92 68.7 68.l 68.O 67.9 67.7 67.5 67.2 66.9· 66.5 66.O 65.5 64.9 64.2 2.94 69.6 69.O 68.9 68.8 68.7 68.4 68.2 67.8 7.4 67.O 66.4 65.8 65.1 2.96 70.5 69.9 69.9 69.8 69.6 69.4 69.1 68.8 68.4 67.9 67.4 66.7 66.O 2.98 71.5 70.9 70.8 70.7 0.5 70.3 o.o 69.7 9.3 68.8 68.3 67.7 67.O 3.00 72.4 71.8 71.7 71.6 1.5 71.2 1.0 70.6 0.2 69.8 69.2 68.6 67.9 3.02 73.4 72.8 72. 7 72.6 2.4 72.2 1.9 71.6 1.2 70.7 0.2 69.6 68.9 3.04 74.3 73.7 73.6 73.5 3.4 73.2 72.9 2.5 2.2 71.7 1.2 70.5 69.9 3.06 75.3 74.7 4.6 74.5 4.3 74.1 3.8 3.5 3.1 2.7 2.1 71.5 70.8 3.08 76.3 75.6 5.6 75.5 5.3 75.1 4.8 4.5 4.1 3.6 3.1 72.5 71.8 3.10 77 .3 76.6 76.5 76.4 6.3 76.1 5.8 5.5 5.1 74.6 4.1 73.5 72.8 3.12 78.3 77.6 77.5 77.4 7.2 77.O 6.8 6.4 6.0 75.6 75.1 74.4 73.8 3.14 79.2 78.6 8.5 78.4 8.2 78.O 7.7 7.4 7.0 76.6 6.0 75.4 74.8 3.16 80.2 79.6 9.5 79.4 9.2 79.O 8.7 8.4 8.0 77 .6 7.0 76.4 75.8 3.18 81.3 80.6 80.5 80.4 0.2 8O.O 9.7 9.4 9.0 78.6 8.0 77 .4 76.8 3.20 82.3 81.6 1.5 81.4 1.2 81.0 0.7 0.4 o.o 79.6 9.0 78.5 77.8 3.22 0·3 .3 82.6 2.5 82.4 2.2 82.O 1.8 1.4 1.0 80.6 0.1 79.5 0:0 3.24 84.3 83.6 3.5 83.4 3.3 83.O 2.8 82.4 2.1 81.6 81.1 80.5 9.8 3.26 85.3 84.6 4.6 84.4 4.3 84.1 3.8 83.5 3.1 2.6 2.1 1.5 80.8 3.28 86.4 85.7 5.6 85.5 5.3 85.1 4.8 4.5 4.1 3.7 3.1 82.6 81.9
57
Sam Peng
Sticky Note
None set by Sam Peng
Sam Peng
Sticky Note
MigrationNone set by Sam Peng
Sam Peng
Sticky Note
Unmarked set by Sam Peng

APPENDIX E. - Continued
Discharge in cfs for weir at Station 1430+08
Upstream water depth (Du) 1.40 - 2.38 Feet
Downstream water depth (Dd) 1.3 - 2.5 Feet
Del - Downstream Water Depth Du 1.30 l.4( l.5C l.60 1.70 1.80 l..90 2.00 2 • .LO
1.40 o. o. o. o. o. o. o. o. o. 1.42 o. o. o. o. o. o. o. o. o. 1.44 o. o. o. o. o. o. o. o. o. 1.46 9.7 o. o. o. o. o. o. o. o. 1.48 10.3 o. o. o. o. o. o. o. o. 1.50 11.0 o. o. o. o. o. o. o. o. 1.52 11.6 o. o. o. o. o. o. o. o. 1.54 12.3 o. o. o. o. o. o. o. o. 1.56 12.9 10.7 o. o. o. o. o. o. o. 1.58 13.5 11.4 o. o. o. o. o. o. o. 1.60 14.2 12.l o. o. o. o. o. o. o. 1.62 14.8 12.8 o. o. o. o. o. o. o. 1.64 15.4 13.5 o. o. o. o. o. o. o. 1.66 16.0 14 .2 o. o. o. o. o. o. o. 1.68 16.6 14.9 12.5 o. o. o. o. o. o. 1.70 17.2 15.5 13.3 o. o. o. o. o. o. 1.72 17.9 16.2 14.0 o. o. o. o. o. o. 1.74 18.5 16.9 14.8 o. o. o. o. o. o. 1.76 19.1 17.5 15.5 o. o. o. o. o. o. 1.78 19.7 18.2 16.2 13.6 o. o. o. o. o. 1.80 20.3 18.8 16.9 14.5 o. o. o. o. o. 1.82 21.0 19.5 17.7 15.3 o. o. o. o. o. 1.84 21.6 20.2 18.4 16.1 o. o. o. o. o. 1.86 22.2 20.8 19.1 16.9 o. o. o. o. o. 1.88 22.9 21.5 19.8 17.6 o. o. o. o. o. 1.90 23.5 22.2 20.5 18.4 15.7 o. o. o. o. 1.92 24.2 22.8 21.2 19.2 16.6 o. o. o. o. 1.94 24.8 23.5 21.9 19.9 17.4 o. o. o. o. 1.96 25.5 24.2 22.6 20.7 18.3 o. o. o. o. 1.98 26.1 24.9 23.3 21.5 19.1 o. o. o. o. 2.00 26.8 25.5 24.0 22.2 19.9 o. o. o. o. 2.02 27.5 26.2 24.8 23.0 20.7 17.9 o. o. o. 2.04 28.2 26.9 25.5 23.7 21.6 18.8 o. o. o. 2.06 28.8 27.6 26.2 24.5 22.4 19. 7 o. o. o. 2.08 29.5 28.3 26.9 25.2 23.2 20.6 o. o. o. 2.10 30.2 29.0 27.6 26.0 24.0 21.5 o. o. o. 2.12 30.9 29.7 28.4 26.7 24.~ 22.4 19.3 o. o. 2.14 31.6 30.5 29.1 27.5 25.6 23.2 20.3 o. o. 2.16 32.3 31.2 29.8 28.3 26.4 24.1 21.2 o. o. 2.18 33.0 31.9 30.6 29.0 27.2 24.9 22.2 o. o. 2.20 33.7 32.6 31.3 29.8 28.0 25.8 23.1 o. o. 2.22 34.5 33.4 32.1 30.6 28.8 26.6 24.0 o. o. 2.24 35.2 34.1 32.8 31.3 29.6 27.5 24.9 21.7 o. 2.26 35.9 34.8 33.6 32.1 30.4 28.3 25.9 22.8 o. 2.28 36.7 35.6 34.3 32.9 31.2 29.2 26.8 23.8 o. 2.30 37.4 36.3 35.1 33.7 32.0 30.0 27.7 24.8 o. 2.32 38.2 37.1 35.9 34.5 32.8 30.9 28.6 25.7 o. 2.34 38.9 37.9 36.6 35.2 33.6 31.7 29.4 26.7 23.3 2.36 39.7 38.6 37.4 36.0 34.4 32.6 30.3 27.7 24.3 2.38 40.5 39.4 38.2 36.8 35.3 33.4 31.2 28.6 25.4
58
.!2.1611--
;,i: • .i:O 2.30 2.40 2. 50
o. o. o. o. o •. o. o. o. o. o. o. o. o. o. o·. o. o. o. 0- o. o. o. o. o. o. o. o. o. o. o. o. o. o. o. o. o. o. o. o. 0 •· o. o. o. ~o. o. o. o. o. o. o. o. o. o. o. o. o. o. o. o. o. o. o. o. o. o. o. o. o. o. o. 0 •. o. o. o. o. o. o. o. o. o. o. o. o_. o. o. o. o. o. o. o. o. o. o. o. o. o. o. o. o. o. o. o. o. o. o. o. o. o. o. o. o. o. o. o. o. o. o. o. o. o. o. o. o. o. o. o. o. o. o. o. o. o. o. o. o. o. o. o. o. o. o. o. o. o. o. o. o. o. o. o. o. o. o. o. o. o. o. o. o. o. o. o. o. o. o. o. o. o. o. o. o. o. o. o. o. o. o. o. o. o. o. o. o. o. o. o. o. o. o. o. o. o. o. o. o. o. o. o. o. o.
Sam Peng
Sticky Note
None set by Sam Peng
Sam Peng
Sticky Note
MigrationNone set by Sam Peng
Sam Peng
Sticky Note
Unmarked set by Sam Peng

APPENDIX E. - Continued
Discharge in cfs for weir at Station 1430+08
Upstream water depth (Du) 2.40 - 3.28 Feet
Downstream water depth (Dd) 1.3 - 2.5 Feet
Dct - Downstream Water Depth Du 1.30 1.40 1.50 1.6( l.7C 1.80 l.9U 2.00 2.J.O 2.20
2.40 41.2 40.2 39.0 37.6 36.l 34.3 32.1 29.6 26.5 o. 2.42 42.0 41.0 39.8 38.5 36.9 35.1 33.0 30.5 27.5 o. 2.44 42.8 41.8 40.6 39.3 37.7 36.0 33.9 31.5 28.5 o. 2.46 43.6 42.6 41.4 40.l 38.6 36.8 34.8 32.4 29.5 26.0 2.48 44.4 43.4 42.2 40.9 39.4 37.7 35.7 33.3 30.5 27.1 2.50 45.2 44.2 43.0 41.7 40.3 38.6 36.6 34.3 31.5 28.2 2.52 46.0 45.0 43.9 42.6 41.1 39.4 37.5 35.2 32.5 29.3 2.54 46.8 45.8 44.7 43.4 42.0 40.3 38.4 36.2 33.5 30.4 2.56 47.6 46.6 45.5 44.3 42.8 41.2 39.3 37.1 34.5 31.4 2.58 48.4 47.5 46.4 45.1 43.7 42.1 40.2 38.0 35.5 32.5 2.60 49.3 48.3 47.2 46.0 44.5 42.9 41.1 39.0 36.5 33.5 2.62 50.1 49.1 48.1 46.8 45.4 43.8 42.0 39.9 37.5 34 .·6 2.64 51.0 50.0 48.9 47.7 46.3 44.7 42.9 40.9 38.5 35.6 2.66 51.8 50.8 49.8 48.6 47.2 45.6 43.8 41.8 39.4 36.7 2.68 52.7 51.7 50.6 49.4 48.1 46. 5- 44.8 42.7 40.4 37.7 2.70 53.5 52.6 51.5 50.3 49.0 47.4 45.7 43.7 41.4 38.7 2. 72 54.4 53.4 52.4 51.2 49.9 48.3 46.6 44.6 42.4 39.8 2.74 55.3 54.3 53.3 52.1 50.8 49.2 47.5 45.6 43.4 40.8 2.76 56.1 55.2 54.2 53.0 51.7 50.2 48.5 46.6 44.4 41.8 2.78 57.0 56.1 55.1 53.9 52.6 51.l 49.4 47.5 45.4 42.9 2.80 57.9 57.0 56.0 54.8 53.5 52.0 50.4 48.5 46.4 43.9 2.82 58.8 57.9 56.9 55.7 54.4 53.0 51.3 49.5 47.3 H.9 2.84 59.7 58.8 57.8 56.6 55.3 53.9 52.3 50.4 48.3 46.0 2.86 60.6 59.7 58.7 57.6 56.3 54.8 53.2 51.4 49.3 47.0 2.88 61.5 60.6 59.6 58.5 57.2 55.8 54.2 52.4 50.3 48.0 2.90 62.5 61.6 60.6 59.4 58.2 56.7 55.2 53.4 51.4 49.1 2.92 63.4 62.5 61.5 60.4 59.1 57.7 56.l 54.4 52.4 50.1 2.94 64.3 63.4 62.4 61.3 60.l 58.7 57.1 55.3 53.4 51.1 2.96 65.3 64.4 63.4 62.3 61.0 59.6 58.1 56.3 54.4 52.2 2.98 66.2 65.3 64.3 63.2 62.0 60.6 59 .1 57.3 55.4 53.2 3.00 67.2 66.3 65.3 64.2 63.0 61.6 60 .1 58.4 56.4 ,54. 3 3.02 68.1 67.2 66.3 65.2 63.9 62.6 61.1 59.4 57.5 55.3 3.04 69 .1 68.2 67.2 66.1 64.9 63.6 62.1 60.4 58.5 56.4 3.06 70.1 69.2 68.2 67.1 65.9 64.6 63.1 61.4 59.5 57.4 3.08 71.0 70.2 69.2 68.l 66.9 65.6 64.1 62.4 60.6 58.5 3.10 72.0 71.1 70.2 69.1 67.9 66.6 65.1 63.5 61.6 59.6 3.12 73.0 72.1 71.2 70.1 68.9 67.6 66.1 64.5 62.7 60.6 3.14 74.0 73.1 72.2 71.1 69.9 68.6 67.2 65.5 63.7 61.7 3.16 75.0 74.1 73.2 72.1 70.9 69.6 68.2 66.6 64.8 62.8 3.18 76.0 75.1 74.2 73.l 72.0 70.7 69. 2 67.6 65.8 63.9 3.20 77.0 76.2 75.2 74.2 73.0 71.7 70.3 68.7 66.9 65.0 3.22 78.0 77.2 76.2 75.2 74.0 72. 7 71.3 69.7 68.0 66.0 3.24 79.1 78.2 77. 3 76.2 75.1 73.8 72.4 70.8 69.l 67.1 3.26 80.l 79.3 78.3 77.3 76.1 74.8 73.4 71.9 70.l 68.2 3.28 81.1 80.3 79.4 78.3 77.2 75.9 74.5 73.0 71.2 69.3
59
...i 2.1671--
2. 30 2.40 :.! .50
o. o. o. o. o. o. o. o. o. o. o. o. o. o. o. o. o. o. o. o. o. o. o. o.
27.6 o. o. 28.8 o. o. 30.0 o. o. 31.1 o. o. 32.3 o. o. 33.4 o. o. 34.5 30.6 o. 35.6 31.8 o. 36.7 33.0 o. 37.8 34.2 o. 38.9 35.4 o. 40.0 36.5 32.4 41.1 37.7 33.7 42.1 38.9 34.9 43.2 40.0 36.2 44.3 41.2 37.4 45.4 42.3 38.6 46.5 43.4 39.9 47.5 44.6 41.1 48.6 45.7 42.3 49.7 46.8 43.5 50.8 47.9 44.7 51.8 49.1 45.8 52.9 50.2 47.0 54.0 51.3 48.2 55.1 52.4 49.4 56.2 53.5 50.5 57.3 54.7 51.7 58.4 55.8 52.9 59.5 56.9 54.0 60.6 58.1 55.2 61. 7 59.2 56.4 62.8 60.3 57.6 63.9 61.5 58.7 65.0 62.6 59.9 66.1 63.7 61.l 67.2 64.9 62.2
Sam Peng
Sticky Note
None set by Sam Peng
Sam Peng
Sticky Note
MigrationNone set by Sam Peng
Sam Peng
Sticky Note
Unmarked set by Sam Peng

APPENDIX F.
Discharge in cfs for weir at Station 1459+90
Upstream water depth (Du) 0.50 - 1.48 Feet
Downstream water depth (Dd) 0.0 - 1.2 Feet
Dd - Downstream Water Du o. • .LO • 2( • 3( .4( • 5( • 6( • 7l
• 50 4.6 4.5 4.3 4.0 3.2 o • o. o. .52 4.8 4.8 4.6 4.3 3.6 o. o. -0. .54 5.1 5.0 4.9 4.6 3.9 o. o. o. .56 5.4 5.3 5.2 4.9 4.3 3.1 o. o. .58 5.7 5.6 5.5 5.2 4.7 3.6 o. o. .60 6.1 6.0 5.8 5.6 5.0 4.0 o. o. .62 6.4 6.3 6.2 5.9 5.4 4.5 o. o. .64 6.7 6.6 6.5 6.3 5.8 4.9 o. o. .66 7.1 7.0 6.9 6.6 6.2 5.3 o. o. .68 7.5 7.4 7.3 7.0 6.5 5.8 4.4 o. .70 7.9 7.7 7.6 7.4 7.0 6.2 4.9 o. • 72 8.2 8.1 8.0 7.8 7.4 6.7 5.5 o. .74 8.6 8.5 8.4 8.2 7.8 7.1 6.0 o. .76 9.1 8.9 8.8 8.6 8.2 7.6 6.5 o. • 78 9.5 9.4 9.3 9.0 8.6 a.a 7.0 5.2 .80 9.9 9.8 9.7 9.5 9.1 8.5 7.5 5.9 .82 10.4 10.2 10.l 9.9 9.6 9.0 8.1 6.6 .84 10.8 10.7 10.6 10.4 10.0 9.5 8.6 7.2 .86 11.3 11.2 11.1 10.9 10.5 9.9 9.1 7.8 • 88 11.8 11.6 11.5 11.3 11.0 10.4 9.6 8.4 .90 12.3 12.1 12.0 11.8 11.5 11.0 10.2 9.0 .92 12.8 12.6 12.5 12.3 12.0 11.5 10.7 9.6 .94 13.3 13.1 13.0 12.9 12.5 12.0 11.3 10.2 .96 13.8 13.7 13.6 13.4 13.1 12.6 11.8 10.8 • 98 14.4 14.2 14.1 13.9 13.6 13.1 12.4 11.4
1.00 14.9 14.7 14.6 14.5 14.1 13.7 13.0 12.0 1.02 15.5 15.3 15.2 15.0 14.7 14 .2 ll.6 12.6 1.04 16.1 15.9 15.8 15.6 15.3 14.8 14.2 13.2 1.06 16.6 16.4 16.4 16.2 15.9 15.4 14.8 13.9 1.08 17.2 17.0 16.9 16.8 16.5 16.0 15.4 14.5 1.10 17.8 17.6 17.5 17.4 17.1 16.6 16.0 15.1 1.12 18.5 18.2 18.2 18.0 17.7 17.3 16.6 15.8 1.14 19.1 18.9 18.8 18.6 1-8. 3 17.9 17.3 16.4 1.16 19.7 19.5 19.4 19.2 19.0 18.5 17.9 17.1 1.18 20.4 20.l 20.l 19.9 19.6 19.2 18.6 17.8 1.20 21.0 20.8 20.7 20.5 20.3 19.9 19.3 18.5 1.22 21.7 21.4 21.4 21.2 20.9 20.5 20.0 19.2 1.24 22.4 22.1 22.1 21.9 21.6 21.2 20.7 19.9 1.26 23.1 22.8 22.7 22.6 22.3 21.9 21.4 20.6 1.28 23.8 23.5 23.4 23.3 23.0 22.6 22.1 21.3 1.30 24.5 24.2 24.2 24.0 23.7 23.3 22.8 22.1 1.32 25.3 24.9 24.9 24.7 24.5 24.1 23.5 22.8 1.34 26.0 25.7 25.6 25.5 25.2 24.8 24.3 23.6 1.36 26.7 26.4 26.4 26.2 26.0 25.6 25.0 24.3 1.38 27.5 27.2 27.1 27.0 26.7 26.3 25.8 25.1 1.40 28.3 27.9 27.9 27.7 27.5 27.1 26.6 25.9 1.42 29.1 28.7 28.7 28.5 28.3 27.9 27.4 26.7 1.44 29.9 29.5 29.5 29.3 29.1 28.7 28.2 27.5 1.46 30.7 30.3 30.3 30.l 29.9 29.5 29.0 28.3 1.48 31.5 31.1 31.1 30.9 30.7 30.3 29.8 29.2
61
...j 3.146'1--
Depth • 8( .9u l.Ol .L. ll 1.20
o. o. o. o. o. o. o. o. o. o. o. o. o. o. o. o. o. o. o. o. o. o. o. o. o. o. o. o. o. o. o. o. o. o. o. o. o. o. o. o. o. o. o. o. o. o. o. o. o. o. o. o. o. o. o. o. o. o. o. o. o. o. o. o. o. o. o. o. o. o. o. o. o. o. o. o. o. o. o. o. o. o. o. o. o. o. o. o. o. o. o. o. o. o. o. o. o. o. o • o. 7.0 o. o. o. o. 7.7 o. o. o. o. 8.5 o. o. o. o. 9.2 o. o. o. o. 9.9 o. o • o. o.
10.5 o. o. o. o. 11.2 9.0 o. o. o. 11.9 9.8 o. o. o. 12.6 10.6 o. o. o. 13.2 11.4 o. o. o. 13.9 12.2 o. o. o. 14.6 12.9 10.4 o. o. 15.3 13.7 11.3 o. o. 16.0 14.5 12.2 o. o. 16.7 15.2 13.l o. o. 17.4 16.0 13.9 o. o. 18.1 16.7 14.8 o. o. 18.9 17.5 15.6 12.9 o. 19.6 18.3 16.5 13.9 o. 20.4 19.l 17.3 14.8 o. 21.l 19.9 18.2 15.8 o. 21.9 20.6 19.0 16.7 o. 22.7 21.4 19.8 17.7 14.5 23.4 22.2 20.7 18.6 15.6 24.2 23.l 21.5 19.5 16.7 25.0 23.9 22.4 20.4 17.7 25.8 24. 7 23.3 21.4 18.8 26.7 25.6 24.1 22.3 19.8 27.5 26.4 25.0 23.2 20.8 28.3 27.3 25.9 24.1 21.8
Sam Peng
Sticky Note
None set by Sam Peng
Sam Peng
Sticky Note
MigrationNone set by Sam Peng
Sam Peng
Sticky Note
Unmarked set by Sam Peng

APPENDIX F. - Continued
Discharge in cfs for weir at Station 1459+90
· Upstream water depth (Du) 1. 50 - 2. 48 Feet
Downstream water depth (Dd) 0.0 - 1.2 Feet
D<1 - Downstream Water Depth Du o. .lC • 21J .30 • 41J • 51J .b0 • 7l .IH • !I (
l.50 32.3 31.·9 31.9 31.8· 31.5 31.l 30.7 30.0 29.2 28.l 1.52 33.2 32.8 32.7 32.6 32.3 32.0 31.5 30.9 30.0 29.0 1.54 34.0 33.6 33.6 33.4 33.2 32.8 32.4 ~1.7 30.9 29.9 1.56 34.9 34.5 34.4 34.3 34 .1 33.7 33.2 32.6 31.8 30.8 1.58 35.8 35.3 35.3 35.2 34.9 34.6 34.1 33.5 32.7 31.7 1.60 36.7 36.2 36.2 36.0 35.8 35.5 35.0 34.4 33.6 32.6 1.62 37.6 37.1 37.1 36.9 36.7 36.4 35.9 35.3 3~.5 33.5 1.64 38.5 38.0 38.0 37.8 37.6 37.3 36.8 36.2 35.4 34.5 l.66 39.4 38.9 38.9 38.7 38. 5 38.2 37.7 37.1 36.4 35.4 l.68 40.3 39.8 39.8 39.7 39.4 39.l 38.7 38.1 37.3 36.4 1.70 41.3 40.8 40.7 40.6 40.4 40.0 39.6 39.0 38.3 37.3 l.72 42.2 41.7 41.7 41.6 41.3 41.0 40.5 40.0 39.2 38.3 1.74 43.2 42.7 42.6 42.5 42.3 42.0 41.5 f40.9 40.2 39.3 1.76 44.2 43.6 43.6 43.5 43.3 42.9 42.5 ~1.9 41.2 40.3 1.78 45.2 44.6 44.6 44.5 44.2 43.9 43.5 ~2.9 42.2 41.3 1.80 46.2 45.6 45.6 45.5 45.2 44.9 44.5 ~3.9 43.2 42.3 l.82 47.2 46.6 46.6 46.5 46.2 45.9 45.5 44.9 44.2 43.3 1.84 48.2 47.6 47.6 47.5 47.3 46.9 46.5 45.9 45.2 44.4 1.86 49.2 48.6 48.6 48.5 48.3 48.0 47.5 47.0 46.3 45.4 1.88 50.3 49.7 49.6 49.5 49.3 49.0 48.6 48.0 47.3 46.5 1.90 51.3 50.7 50.7 50.6 50.4 50.1 49.6 49.1 48.4 47.5 1.92 52.4 51.8 51.8 51.6 51.4 51.1 50.7 50.l 49.5 48.6 1.94 53.5 52.9 52.8 52.7 52.5 52.2 51.8 51.2 50.5 49.7 1.96 54.6 53.9 53.9 53.8 53.6 53.3 52.9 52.3 51.6 50.8 1.98 55.7 55.0 55.0 54.9 54.7 54.4 54.0 53.4 52.7 51.9 2.00 56.8 56.1 56.l 56.0 55.8 55.5 55.1 54.5 53.9 53.0 2.02 57.9 57.2 57.2 57.1 56.9 56.6 56.2 55.6 55.0 54.2 2.04 59.1 58.4 58.3 58.2 58.0 57.7 57.3 56.8 56.1 55.3 2.06 60.2 59.5 59.5 59.4 59.2 58.9 58.5 57.9 57.3 56.5 2.08 61.4 60.6 60.6 60.5 60.3 60.0 59.6 59.1 58.4 57.6 2.10 62.5 61.8 61.8 61.7 61.5 61.2 60.8 60.2 59.6 58.8 2.12 63.7 63.0 62.9 62.8 62.6 62.3 61.9 61.4 60.8 60.0 2.14 64.9 64.1 64.1 64.0 63.8 63.5 63.1 62.6 62.0 61.2 2.16 66.1 65.3 65.3 65.2 65.0 64.7 64.3 63.8 63.2 62.4 2.18 67.3 66.5 66.5 66.l 66.2 65.9 65.5 65.0 64.4 63.6 2.20 68.6 67.7 67.7 67.6 67.4 67.1 66.8 66.2 65.6 64.8 2.22 69.8 69.0 68.9 68.8 68.7 68.4 68.0 67.5 66.8 66.l 2.24 71.0 70.2 70.2 70.l 69.9 69.6 69.2 68.7 68.l 67.3 2.26 72.3 71.4 71.4 71.3 71.1 70.9 70.5 70.0 69.4 68.6 2.28 73.6 72.7 72. 7 72.6 72.4 72.1 71.7 71.2 70.6 69.9 2.30 74.9 74.0 74.0 73.9 73.7 73.4 73.0 72.5 71.9 71.2 2.32 76,2 75.2 75.2 75.1 75.0 74.7 74.3 73.8 73.2 72.4 2.34 77.5 76.5 76.5 76.4 76.2 76.0 75.6 75.1 74.5 73.8 2.36 78.8 77.8 77.8 77. 7 77.6 77.3 76.9 76.4 75.8 75.l 2.38 80.1 79.1 79.1 79.0 78.9 78.6 78.2 77.7 77.1 76.4 2.40 81.5 80.5 80.5 80.4 80.2 79.9 79.5 79.l 78.5 77. 7 2.42 82.8 81.8 81.8 81.7 81.5 81.3 80.9 80.4 79.8 79.1 2.44 84.2 83.2 83.1 83.1 82.9 82.6 82.2 81.8 81.2 80.4 2.46 85.5 84.5 84.5 84.4 84.2 84.0 83.6 83.l 82.5 81.8 2.48 86.9 85.9 85.9 85.8 85.6 85.3 85.0 84.5 83.9 83.2
62
--1 !.146'1--
J.. oc J. • .ll l.21;
26.8 25.1 22.8 27.7 26.0 23.8 28.6 27.0 24.8 29.5 27.9 25.8 30.4 28.9 26.8 31.4 29.8 27.9 32.3 30.8 28.9 33.3 31.8 29.9 34.2 32.7 30.9 35.2 33.7 31.9 36.2 34.7 33.0 37.2 35.7 34.0 38.2 36.8 35.1 39.2 37.8 36.l 40.2 38.8 37.2 41.2 39.9 38.2 42.2 40.9 39.3 43.3 42.0 40.4 44.3 43.1 41.5 45.4 44.1 42.6 46.5 45.2 43.7 47.6 46.3 44.8 48.7 47.4 46.0 49.8 48.6 47.1 50.9 49.7 48.3 52.0 50.8 49.4 53.2 52.0 50.6 54.3 53.2 51.8 55.5 54.3. 52.9 56.7 55.5 54.1 57.8 56.7 55.3 59.0 57.9 56.6 60.2 59.1 57.8 61.5 60.3 59.0 62.7 61.6 60.3 63.9 62.8 61.5 65.2 64.1 62 .8 66.4 65.3 64.1 67.7 66.6 65.3 69.0 67.9 66.6 70.3 69.2 67.9 71.6 70.5 69.3 72.9 71.8 70.6 74.2 73.l 71.9 75.5 74.5 73.3 76.9 75.8 74.6 78.2 77.2 76.0 79.6 78.6 77.4 81.0 79.9 78.8 82.3 81.3 80.2
Sam Peng
Sticky Note
None set by Sam Peng
Sam Peng
Sticky Note
MigrationNone set by Sam Peng
Sam Peng
Sticky Note
Unmarked set by Sam Peng

APPENDIX F. - Continued
Discharge in cfs for weir at Station 1459+90
Upstream water depth (Du) 1. 40 - 1..89 Feet
Downstream water depth (Dd) 1.3 - 1.9 Feet
Do - Downstream water Deptn Du J..30 l..35 J..40 ]. • 4 !j J..!>O l..55 l..60 J.. 65 J..70
1.40 o. o. o. o. o. o. o. o. o. 1.41 o. o. o. o. o. o. o. o. o. 1.42 o. o. o. o. o. o. o. o. o. 1.43 o. o. o. o. o. o. o. o. o. 1.44 o. o. o. o. o. o. o. o. o. 1.45 [16. 8 o. o. o. o. o. o. o. o. 1.46 17.4 o. o. o. o. o. o. o. o. 1.47 18.0 o. o. o. o. o. o. o. o. 1.48 18.6 o. o. o. o. o. o. o. o. 1.49 19.2 o. o. o. o. o. o. o. o. 1.50 19.8 o. o. o. o. o. o. o. o. 1.51 20.3 18.3 o. o. o. o. o. o. o. 1.52 20.9 19.0 o. o. o. o. o. o. o. 1.53 21.5 19.6 o. o. o. o. o. o. o. 1.54 22.0 20.2 o. o. o. o. o. o. o. 1.55 22.6 20.8 o. o. o. o. o. o. o. 1.56 23.1 21.4 19.3 o. o. o. o. o. o. 1.57 23.7 22.0 20.0 o. o. o. o. o. o. 1.58 24.2 22.6 20.6 o. o. o. o. o. o. 1.59 24.8 23.2 21.2 o. o. o. o. o. o. 1.60 25.3 23.7 21.9 o. o. o. o. o. o. 1.61 25.9 24.3 22.5 o. o. o. o. o. o. 1.62 26.4 24.9 23.1 21.0 o. o. o. o. o. 1.63 27.0 25.5 23.7 21.6 o. o. o. o. o. 1.64 27.5 26.0 24.3 22.3 o. o. o. o. o. 1.65 28.0 26.6 24.9 23.0 o. o. o. o. o. 1.66 28.6 27.2 25.5 23.6 o. o. o. o. o. 1.67 29.1 27.7 26.1 24.2 22.0 o. o. o. o. 1.68 29.7 28.3 26.7 24.9 22.7 o. o. o. o. 1.69 30.2 28.9 27.3 25.5 23.4 o. o. o. o. -1.70 30.8 29.4 27.9 26.1 24.1 o. o. o. o. 1.71 31.3 30.0 28.5 26.8 24.7 o. o. o. o. 1.72 31.8 30.6 29.l 27.4 25.4 o. o. o. o. 1.73 32.4 31.1 29.7 28.0 26.1 23.8 o. o. o. 1.74 32.9 31.7 30.3 28.6 26.7 24.5 o. o. o. 1.75 33.5 32.2 30.8 29.2 27.4 25.2 o. o. o. 1.76 J4.0 32.8 31.4 29.9 28.0 25.9 o. o. o. 1.77 34.6 33.4 32.0 30.5 28.7 26.6 o. o. o. 1.78 35.1 33.9 32.6 31.l 29.3 27.3 24.8 o. o. 1.79 35.7 34.5 33.2 31.7 30.0 28.0 25.6 o. o. 1.80 36.3 35.1 33.8 32.3 30.6 28.6 26.3 o. o. 1.81 36.8 35.6 34.4 32.9 31.2 29.3 27.1 o. o. 1.82 37.4 36.2 34.9 33.5 31.9 30.0 27.8 o. o. 1.83 37.9 36.8 35.5 34.1 32.5 30.6 28.5 o. o. 1.84 38.5 37.4 36.l 34.7 33.1 31.3 29.2 26.7 o. 1.85 39.0 37.9 36.7 35.3 33.7 32.0 29.9 27.5 o. 1.86 39.6 38.5 37.3 35.9 34.4 32.6 30.6 28.3 o. 1.87 40.2 39.l 37.9 36.5 35.0 33.3 31.3 29. 0 o. 1.88 40.7 39.7 38.5 37.1 35.6 33.9 32.0 29.8 o. 1.89 41.3 40.2 39.l 37.7 36.3 34.6 32.7 30.5 27.9
63
..j 3.146 1!--
J..75 J..HU l..85 J..90
o. o. o. o. o. o. 0~ o. o. o. o. o. o. o. o. o. o. o. o. o. o. o. o. o. o. o. o. o. o. o. o. ·o. o. o. o. o. o. o. o. o. o. o. o. o. o. o. o. o. o. o. o. o. o. o. o. o .• o. o. o. o. o. o. o. o. o. o. o. o. o. o. o. o. o. o. o. o. o. o. o. o. o. o. o. o. o. o. o. o. o. o. o. o. o. o. o. o. o. o. o. o. o. o. o. o. o. o. o. o. o. o. o. o. o. o. o. o. o. o. o. o. o. o. o. o. o. o. o. o. o. o. o. o. o. o. o. o. o. o. o. o. o. o. 0 •. o. o. o. o. o. o. o. o. o. o. o. o. o. o. o. o. o. o. o. o. o. o. o. o. o. o. o. o. o. o. o. o. o. o. o. o. o. o. o. o. o. o. o. o. o. o. o. 0 •. __ ,o. o. o. o. o. o. o. o. o.
Sam Peng
Sticky Note
None set by Sam Peng
Sam Peng
Sticky Note
MigrationNone set by Sam Peng
Sam Peng
Sticky Note
Unmarked set by Sam Peng

APPENDIX F. - Continued
Discharge in cfs for weir at Station 1459+90
Upstream water depth (Du) 1.90 - 2.39 Feet
Downstream water depth (Dd) 1.3 - 1.9 Feet
Dd - Downstream Water Depth Du l.30 1.35 l.40 l.45 l.50 l.55 1.6( l.6! l. /IJ l.75
1.90 41.9 40.8 139.6 138.3 36.9 35.2 33.4 31.2 28.7 o. 1.91 42.5 141.4 140.2 138.9 37.5 35.9 ;34.1 31.9 29.5 o. 1.92 43.0 42.0 140.8 139.6 38.1 36.5 34.7 32.7 30 .• 3 o. 1.93 43.6 42.6 141.4 140. 2 38.8 37.2 ;35.4 33.4 31.0 o. 1.94 44.2 43.2 142.0 140.8 39.4 37.8 36.l 34.1 31.8 o. 1.95 44.8 43.7 142.6 141.4 140. 0 38.5 36.8 34.8 32.5 29.9 1.96 45.3 44.3 143.2 142.0 40.6 39.l 37.4 35.5 33.3 30.7 1.97 45.9 44.9 143. 8 142.6 141.3 39.8 138.1 36.2 34.0 31.5 1.98 46.5 45.5 144.4 143.2 41.9 40.4 38.8 36.9 34.8 32.3 1.99 47.1 46.1 145. o 143.8 42.5 41.1 39. 4 37.6 35.5 33.1 2.00 47.7 46.7 145. 6 144.5 43.2 41.7 140.1 38.3 36.2 33.9 2.01 48.3 47.3 146. 3 145.1 43.8 42.4 140.8 39.0 37.0 34.7 2.02 48.9 47.9 146. 9 145.7 44.4 43.0 141.4 39.7 37.7 35.4 2.03 49.5 48.5 147.5 146.3 45.1 43.7 142.1 40.4 38.4 36.2 2.04 50.1 49.l 148.l 146.9 45.7 44.3 142.8 41.1 39.l 37.0 2.05 50.7 49.7 48.7 147.6 46.3 45.0 143.4 41.8 39.9 37.7 2.06 51.3 50.3 149. 3 148.2 47.0 45.6 44.1 4.2.4 40.6 38.5 2~07 51.9 51.0 149. 9 148.8 47.6 46.3 144.8 43.l 41.3 39.2 2.08 52.5 51.6 50.6 149.5 48.2 46.9 145.4 43.8 42.0 40.0 2.09 53.1 52.2 51.2 50.1 48.9 47.6 146.1 44.5 42.7 40.7 2.10 53.7 52.8 51.8 50.7 49.5 48.2 46.8 45.2 43.4 41.4 2.11 54.3 53.4 52.4 51.4 50.2 48.9 47.5 45.9 44.1 42.2 2.12 55.0 54.1 53.1 52.0 so.a 49.5 48.l 46.6 44.8 42.9 2.13 55.6 54.7 53.7 52.6 51.5 50.2 148.8 47.3 45.6 43.7 2.14 56.2 55.3 54.3 53.3 52.1 50.9 149.5 47.9 46.3 44.4 2.15 56.8 55.9 55.0 53.9 52.8 51.5 50.l 48.6 47.0 45.1 2.16 57.4 56.6 55.6 54.6 53.4 52.2 50.8 49.3 47.7 45.9 2.17 58.l 57.2 56.2 55.2 54.1 52.8 51.5 so.o 48.4 46.6 2.18 58.7 57.8 56.9 55.9 54.7 53.5 52.2 50.7 49.1 47.3 2.19 59.3 58.5 57.5 56.5 55.4 54.2 52.9 51.4 49.8 48.0 2.20 60.0 59.1 58.2 57.2 56.1 54.8 53.5 52.1 50.5 48.8 2.21 60.6 59.8 58.8 57.8 56.7 55.5 54.2 52.8 51.2 49.5 2.22 61.3 60.4 59.5 58.5 57.4 56.2 54.9 53.5 51.9 50.2 2.23 61.9 61.0 60.1 59.l 58.0 56.9 55.6 54.2 52.7 51.0 2.24 62.5 61.7 60.8 59.8 58.7 57.5 56.3 54.9 53.4 51. 7 2.25 63.2 62.4 61.4 60.5 59.4 58.2 57.0 55.6 54.1 52.4 2.26 63.8 63.0 62.1 61.1 60.l 58.9 57.6 56.3 54.8 53.2 2.27 64 .5· 63.7 62.8 61.8 60.7 59.6 58.3 57.0 55.5 53.9 2.28 65.2 64.3 63.4 62.5 61.4 60.3 59.0 57.7 56.2 54.6 2.29 65.8 65.0 64.1 63.l 62.1 60.9 59.7 58.4 56.9 55.3 2.30 66.5 65.6 64.·8 63.8 62.8 61.6 60.4 59 .1 57.7 56.l 2.31 67.1 66.3 65.4 64.5 63.4 62.3 61.1 59.8 58.4 56.8 2.32 67.8 67.0 66.1 65.2 64.1 63.0 61.8 60.5 59.1 57.6 2.33 68.5 67.7 66.8 65.8 64.8 63.7 62.5 61.2 59.8 58.3 2.34 69.l 68.3 67.5 66.5 65.5 64.4 63.2 61.9 60.5 59.0 2.35 69.8 69.0 68.1 67.2 66.2 65.1 63.9 62.6 61.3 59.8 2.36 70.5 69.7 68.8 67.9 66.9 65.8 64.6 63.4 62.0 60.5 2.37 71.2 70.4 69.5 68.6 67.6 66.5 65.3 64.1 62.7 61.2 2.38 71.8 71.1 70.2 69.3 68.3 67.2 66.l 64.8 63.4 62.0 2.39 72. 5 71.7 70.9 70.0 69.0 67.9 66.8 65.5 64.2 62.7
64
--13.146 1!.
1.80 .L.HS l.90
o. o. o. o. o. o. o. o. o. o. o. o. o. o. o. o. o. o. o. o. o. o. o. o. o. o. o. o. o. .0. o. o. o.
32.0 o. o. 32.8 o. o. 33.6 o. o. 34.4 o. o. 35.2 o. o. 36.0 33.2 o. 36.8 34.1 o. 37.6 34.9 o. 38.4 35.8 o. 39.2 36.6 o. 40.0 37.5 o. 40.8 38.3 35.4 41.5 39.1 36.3 42.3 39.9 37.2 43.1 40.7 38.0 43.8 41.5 38.9 44.6 42.3 39.7 45.3 43.1 40.6 46.1 43.9 41.4 46.8 44.7 42.2 47.6· 45.5 43.1 48.4 46.3 43.9 49.1 47.0 44.7 49.9 47.8 45.5 50.6 48.6 46.3 51.4 49.4 47.1 52.1 50.1 48.0 52.9 50.9 48.8 53.6 51.7 49.6 54.4 52.5 50.4 55.1 53.2 51.2 55.9 54.0 52.0 56.6 54.8 52.8 57.4 55.5 53.6 58.1 56.3 54.3 58.9 57.1 55.1 59.6 57.9 55.9 60.4 58.6 56.7 61.1 59.4 57.5
GPO 848•090
Sam Peng
Sticky Note
None set by Sam Peng
Sam Peng
Sticky Note
MigrationNone set by Sam Peng
Sam Peng
Sticky Note
Unmarked set by Sam Peng

7-1750 (2-67) Bureau of ReclamaUon
CONVERSION FACTORS--BRITIBH TO METRIC UNITS OF MEASUREMENT
The following conversion factors adopted by the Bureau of Reclamation are those published by the American Society for Testing and Materia.1.s (ASTM Metric Practice Guide, January 1964) except that additional factors (*) commonly used in the Bureau have been added. Further discussion of definitions of quantities and units is given on pages 10-11 of the ASTM Metric Practice Guide.
The metric units and conversion factors adopted by the ASTM are based on the "International System of Units" (qesignated SI for Siisteme International d1Unites), fixed by the International Committee for Weights and Measures; this system is also known as the Giorgi or MKSA (meter-kilogram (mass)-second-ampere) system. This system has been adopted by the International Organization for Standardization 1n IBO Recommendation R-31.
The metric technical unit of force is the kilogram-force; this is the force which when applied to a body having a mass of 1 kg, gives it an acceleration of 9. 80665 m/sec/sec, the standard acceleration of free fall toward the earth's center for sea level at 45 deg latitude. The metric unit of force in SI units is the newton (N), which is defined as that force which, when applied to a body having a mass of 1 kg, gives it an acceleration of 1 m/sec/sec. These units must be distinguished from the (inconstant) local weight of a body having a mass of 1 kg; that is, the weight of a body is that force with which a body is attracted to the earth and is equal to the mass of a body multiplied by the acceleration due to gravity. However, because it is general practice to use "pound" rather than the technically correct term "pound-force," the term "kilogram" (or derived mass unit) has been used in this guide instead of "kilogramforce" in expressing the conversion factors for forces. The newton unit of force will find increasing use, and is essential in SI units.
Mil. Inches
Feet.
Multiply
Yards •••• Miles (statute).
Square inches. Square feet • •
Square yards Acres ••
Square miles
Cubic inches Cubic feet. Cubic yards.
Fluid ounces (U.S.)
Liquid pints CU. S.)
Quarts (U. s. ) . Gallons CU. s. ):
Gallons (U. K.)
Cubic feet. Cubic yards. Acre-feet.
Table I
QUANTITIES AND UNITS OF SPACE
By
LENGTH
25. 4 (exacUy). . 25. 4 (exacUy) ..
2. 54 (exacUy)* •. 30. 48 (exacUy) • •
O. 3048 (exacUy)*. • . 0. 0003048 (exacily)* • O. 9144 (exacUy) •
1,609.344 (exacily)* • 1. 609344 (exacUy)
AREA
6. 4516 (exacUy) . 929.03* .•••••
0.092803 •• o. 836127 .. 0.40469* ••
4,046. 9* •.•• o. 0040469* • 2.58999 ••
VOLUME
16.3871 . 0.0283168. o. 764555 •
CAPACITY
29.5737. 29.5729 • 0.473179 • 0.473166.
946.358* •• 0.946331*.
3,785.43* • 3. 78543 •• 3. 78533 ••• o. 00378543*. 4.54609 4.54596
28.3160 • . 764.55* • 1,233.5*, .1, 233, 500* •
To obtain
Micron Millimeters Centimeters Centimeters Meters Kilometers Meters Meters Kilometers
Square centimeters Square centimeters Square meters Square meters Hectares Square meters Square kilometers Square kilometers
Cubic centimeters Cubic meters Cubic meters
Cubic centimeters Millillters Cubic decimeters Liters Cubic centimeters Liters Cubic centimeters Cubic decimeters Liters Cubic meters Cubic decimeters Liters Liters Liters Cubic meters Liters
Sam Peng
Sticky Note
None set by Sam Peng
Sam Peng
Sticky Note
MigrationNone set by Sam Peng
Sam Peng
Sticky Note
Unmarked set by Sam Peng

MulUply
Grains (1/7, 000 lb) • • . Troy ounces (480 grains). Ounces (avdp). . • • Pounds (avdp). • • . Short tons (2, 000 lb).
Long tons (21 240 lb):
Pounds per square Inch
Pounds per square foot
Ounces per cubic Inch . . . Pounds per cubic foot . . .
Tons Uong) per cubic Yar'd :
Ounces per gallon (U. S, ) Ounces per gallon lu. K. ) Pounds per gallon U. S, ) Pounds per gallon CU. K. )
Inch-pounds
Foot-pounds
Foot-pounds per° Inch Ounce-Inches. . . .
Feet per second.
Feet per year. : Miles per hour •
Feet per second2 •
Cubic feet per second (second-feet) •••••••••••
Cubic feet per minute • • • Gallons (U, 81 ) per minute •
Pounds.
By
MASS
64. 79891 (emcUy) 31.1036 •••..•. 28. 3495 ..•....
O. 46369237 (emcUy). 907.186 ••...
• 0. 907186 .••. . 1,016.06 ••••..
FORCE/AREA
0.070307. 0.689476. 4. 88243 .
47.8803. ,
MASS/VOLUME (DENSITY)
1. 72999 . 16. 0186 . o. 0160186 1. 32894
MASS/CAPACITY
7. 4893. 6. 2362.
119. 829 . 99. 779 .
BENDING MOMENT OR TORQUE
VELOCITY
30, 48 (emctly). • • O. 3048 (emctly)* . 0. 966873 X 10-6* , 1. 609344 (exacUy). 0. 44704 (emctlyt.
ACCELERATION*
0.3048* ••
FLOW
0.028317* 0.4719 • 0.06309 .
FORCE*
0. 463692* ••. tmrx 10-6•
Table II
QUANTITIES AND UNITS OF MECHANICS
Milligrams Grams Grams Kilograms Kilograms Metric tons Kilograms
To obtain
Kilograms per square cenUmeter Newtons per square cenUmeter Kilograms per square meter Newtons per square meter
Grams per cubic cenUmeter Kilograms per cubic meter Grams per cubic cenUmeter Grams per cubic cenUmeter
Grams per liter Grams per liter Grams per liter Grams per liter
Meter-kilograms Centlmeter-dynes Meter-kilograms Centlmeter-dynes Centimeter-kilograms per centimeter Gram-cenUmeters
CenUmeters per second Meters per second Centimeters per second Kilometers per hour Meters per second
Meters per second2
Cubic meters per second Liters per second Liters per second
Kilograms Newtons Dynes
MulUply
British thermal units (Btu).
Btu per pound. Foot-pounds
Horsepower . . . . . . Btu per hour . . • . • , Foot~pounds per second •
Btu In. /hr ft2 deg F (k, thermal conducUv!ty)
2 •••
:~~l~e de/ fc, ·\her·~· conductanceY . . , . . , .
Deg F hr ft2/Btu CR,' the;mal• resistance) . • • • • . • • •
Btu/lb deg F Cc, heat capacity) • Bt11/lb deg F • . • • • • . Ft2/hr (thermal d!ffuslvlty)
Grains/hr ft2 (water vapor transmission) • • • • • •
Perms (permeance) • • • • Perm-Inches (permeability)
MulUply
Cubic feet per square foot per day (seepage) . . . . . . •
Pound-seconds per square foot (viscosity) • • . • . • • • • .
Square feet per second (viscosity). Fahrenheit degrees (change)* ... Volts per mil ......•.•. Lumens per square foot (foot-
candles) ••.•••.••.• Ohm-circular mils per foot Mllllcurles per cubic foot . Mlll!amps per square foot . Gallons per square· yard . Pounds per Inch.
By
WORK AND ENERGY*
, o. 252* • 1,066.06 .•.•
2. 326 (emcUy) 1. 35582* •••
POWER
745. 700 ••• 0. 293071. • 1. 35682 ••
HEAT TRANSFER
1. 442 • 0.1240. 1. 4880*
0.668 4. 882
1. 761 4.1868 1.000• 0. 2681 . 0.09290•.
WATER VAPOR TRANSMISSION
16. 7 0.669 1.67
Table III
OTHER QUANTITIES AND UNITS
By
304. 0• ...
4. 8824• .• 0. 092903* .. 6/9 emcUy. 0.03937 .•
10. 764 .•. 0. 001662 • 36. 3147• . 10. 7639• • 4. 627219* 0.17868•.
To obtain
Kilogram calories Joules Joules per gram Joules
Watts Watts Watts
Milliwatts/cm deg C Kg cal/hr m deg C Kg cal m/hr mZ deg C
M!ll!watts/cm2 deg C Kg cal/hr m2 deg C
Deg C cm2/mllllwatt J/g deg C Cal/gram deg C Cm2/sec ' M2Jhr
Grams/24 hr m2 Metric perms Metric perm-centimeters
To obtain
Liters per square meter per day
Kilogram second per square meter Square meters per second Celsius or Kelvin degrees (change)* Kilovolts per millimeter
Lumens per square meter Ohm-square millimeters per meter M!ll!curles per cubic meter M!ll!amps per square meter Liters per square meter Kilograms per centimeter
GPO 835-159
Sam Peng
Sticky Note
None set by Sam Peng
Sam Peng
Sticky Note
MigrationNone set by Sam Peng
Sam Peng
Sticky Note
Unmarked set by Sam Peng

ABSTRACT
Three differently shaped trapezoidal weirs were cal.ibrated in the hydraulic laboratory for free flow and submerged flow. canal. discharge measurements in field canals of 50:- and 90-cfs designed capacity. The 3 weirs were calibrated in the same test facility using model scales of 1:5, 1:2.67, and 1:2.33. In each case the canal bottom upstream from the weir was flush with the weir invert and the downstream canal bottom had a 1.5- to 3-f't vertical drop at the weir. An electronic digital computer was used to make a least squares fit of the calibration data to a curve. Second degree polynomial equations were derived describing free flow conditions and general conical equations describing submerged flow conditions. The computer was used to obtain weir discharge tables and information f.or weir discharge graphs for submerged conditions. Discharge tables and graphs for each weir and drawings and photographs of model and prototype weir structures are included in the report.
ABSTRACT
Three differently shaped trapezoidal weirs were calibrated in the hydraulic laboratory for free flow and submerged flow. canal. discharge measurements in field canals of 50:- and 90-cfs designed capacity. The 3 weirs were calibrated in the same test facility using model scales of 1:5, 1:2.67, and 1:2.33. In each case the canal. bottom upstream from the weir was flush with the weir invert and the downstream canal bottom had a 1.5- to 3-f't vertical drop at the weir. An electronic digital computer was used to make a least squares fit of the calibration data to a curve. Second degree polynomial. equations were derived describing free flow conditions and general. conical equations describing submerged flow conditions. The computer was used to obtain weir discharge tables and information fpr weir discharge graphs for submerged conditions. Discharge tables and graphs for each weir and drawings and photographs of model and prototype weir structures are included in the report.
ABSTRACT
Three differently shaped trapezoidal. weirs were calibrated in the hydraulic laboratory for free flow and submerged flow canal. discharge measurements in field canals of 50- and 90-cfs designed capacity. The 3 weirs were calibrated in the same test facility using model sca;Les of 1:5, 1:2.67, and 1:2.33. In each case the canal bottom upstream from the weir was flush with the weir invert and the downstream canal bottom had a 1.5- to 3-f't vertical drop at the weir. An electronic digital computer was used to make a least squares fit of the calibration data to a curve. Second degree polynanial equations were derived describing free flow conditions and general. conical equations describing submerged flow conditions. The computer was used to obtain weir discharge tables and information for weir discharge graphs for submerged conditions. Discharge tables and graphs for each weir and drawings and photographs of model and prototype weir structures are included in the report.
ABSTRACT
Three differently shaped trapezoidal. weirs were calibrated in the hydraulic laboratory for free flow and submerged flow canal discharge measurements in field canals of 50:.. and 90-cfs designed capacity. The 3 weirs were calibrated in the same test facility using model scales of 1:5, 1:2.67, and 1:2.33. In each case the canal bottom upstream from the weir was flush with the weir invert and the downstream canal bottom had a 1.5- to 3-f't vertical drop at the weir. An electronic digital computer was used to mske a least squares fit of the calibration data to a curve. Second degree polynanial equations were derived describing free flow conditions and general. conical equations describing submerged flow conditions. The computer was used to obtain weir discharge tables and information for weir discharge graphs for submerged conditions. Discharge tables and graphs for each weir and drawings and photographs of model and prototype weir structures are included in the report.
Sam Peng
Sticky Note
None set by Sam Peng
Sam Peng
Sticky Note
MigrationNone set by Sam Peng
Sam Peng
Sticky Note
Unmarked set by Sam Peng

Hyd-583 Zeigler, ER HYDRAULIC MODEL CALIBRATION AND COMPUTER ANALYSIS OF TRAPEZOIDAL TIMBER CONTROL CHECK WEIRS--FARWELL MAIN CANAL, NEBRASKA--OCCS PROGRAM. Bur Reclam Lab Rep Hyd-583, Hydraul Br, Aug 1968. Bureau of Reclamation, Denver, 10 p, 17 fig, 6 tab, 5 appendl
DESCRIPTORS--/ open channel flow/ turbulent flow/ *sharp crested weirs/ subcritical flow/ hydraulic models/ model tests/ *discharge measurement/ *submerged weirs/ curve fitting/ calibrations/ check structures/ weirs IDENTIFIERS--/ *trapezoidal weirs/ least squares method
Sam Peng
Sticky Note
None set by Sam Peng
Sam Peng
Sticky Note
MigrationNone set by Sam Peng
Sam Peng
Sticky Note
Unmarked set by Sam Peng